144&176 John St. and 200 John St. & 588 Charlotte St. Hotel and Residential Subdivision Development
|
|
|
- Edmund Hamilton
- 5 years ago
- Views:
Transcription
1 Solmar Development Corp. 144&176 John St. and 2 John St. & 588 Charlotte St. Hotel and Residential Subdivision Development TRANSPORTATION IMPACT STUDY November 217


2 LEA Consulting Ltd. Consulting Engineers & Planners 625 Cochrane Drive, 9 th Floor, Markham, ON, L3R 9R9 CANADA Tel: Fax: November 7, 217 Our Ref.: Mr. Maurizio Rogato Solmar Development Corp. 122 Romina Drive Concord, Ontario L4K 4Z7 Dear Mr. Rogato Re: Transportation Impact Study for the Hotel and Residential Subdivision Development at 144/176 John St. and 2 John St. & 588 Charlotte St., Niagara-on-the-Lake. LEA Consulting Ltd. is pleased to present the findings of our Transportation Impact Study for the proposed hotel and residential subdivision at 144/176 John St. and 2 John St. & 588 Charlotte St. in the Town of Niagara-on-the-Lake. Should you have any questions regarding this Transportation Impact Study, please feel free to contact Chris Sidlar at or Kelsey Waugh at ext Yours very truly, LEA Consulting Ltd. Chris Sidlar, M.Sc.Pl., MCIP, RPP Manager, Transportation Planning Kelsey Waugh, B.A.Sc Transportation Analyst : cs/kw Encl.: 144/176 John St. and 2 John St. & 588 Charlotte St. Transportation Impact Study
3 144/176 John St, and 2 John St/588 Charlotte Ave, Niagara-On-The-Lake i Traffic Impact Study TABLE OF CONTENTS 1. INTRODUCTION Study Area EXISTING ROAD NETWORK Existing Transit Network Traffic Data Collection Peak Hour Factors EXISTING TRAFFIC CONDITIONS Unsignalized Capacity Analyses FUTURE BACKGROUND TRAFFIC Background Developments Intersection Capacity Analysis Roundabout Capacity Analysis at John Street E and Queen s Parade/Niagara Parkway TRIP GENERATION AND DISTRIBUTION Trip Generation Trip Distribution and Trip Assignment FUTURE TOTAL TRAFFIC CONDITIONS Unsignalized Capacity Analysis Future Total Traffic Roundabout Capacity Analysis at John Street East and Queen s Parade/Niagara Parkway PARKING AND LOADING REQUIREMENTS Vehicular Parking Requirements ACCESS CONFIGURATION CONCLUSIONS LIST OF APPENDICES Appendix A: Terms of Reference Appendix B: Survey Counts John Street E and Queen s Parade/Niagara Parkway Appendix C: Existing Traffic Conditions Appendix D: Site Trip Distributions and Assignments for Background Developments Appendix E: Future Background Traffic Conditions Appendix F: Junctions 8 Reports Appendix G: Site Trip Distributions and Assignments for Subject Site Trips Appendix H: Future Total Traffic Conditions November 217 LEA Consulting Ltd.
4 144/176 John St, and 2 John St/588 Charlotte Ave, Niagara-On-The-Lake ii Traffic Impact Study LIST OF FIGURES Page Figure 1: Site Location 144/176 John St, and 2 John St/588 Charlotte Ave Figure 2: Proposed Site Plan 144/176 John Street Development - Hotel... 2 Figure 3: Residential Concept Plan 2 John St/588 Charlotte Street - Residential Subdivision... 3 Figure 4: Existing Unsignalized Intersections... 5 Figure 5: Existing Transit Network... 6 Figure 6: Existing Traffic - Weekday AM Peak Hour Figure 7: Existing Traffic - Weekday PM Peak Hour Figure 8: Existing Traffic - Saturday Peak Hour Figure 9: Future Background Traffic - Weekday AM Peak Hour Figure 1: Future Background Traffic - Weekday PM Peak Hour Figure 11: Future Background Traffic Saturday PM Peak Hour Figure 12: Future Total Site Traffic - Weekday AM Peak Hour Figure 13: Future Total Site Traffic - Weekday PM Peak Hour Figure 14: Future Total Site Traffic Saturday Peak Hour Figure 15: Site Access Configuration... 3 LIST OF TABLES Page Table 1: Service Frequency of Existing Transit Service... 6 Table 2: Existing Traffic Volumes for Weekday and Saturday Counts... 7 Table 3: Unsignalized Levels of Service Existing Traffic Weekday AM Peak Hour... 8 Table 4: Unsignalized Levels of Service Existing Traffic Weekday PM Peak Hour... 9 Table 5: Unsignalized Levels of Service Existing Traffic Saturday Peak Hour... 1 Table 6: List of Background Developments Table 7: Unsignalized Levels of Service Future Background Traffic Weekday AM Peak Hour Table 8: Unsignalized Levels of Service Future Background Traffic Weekday PM Peak Hour Table 9: Unsignalized Levels of Service Future Background Traffic Saturday Peak Hour... 2 Table 1: Roundabout Levels of Service Future Background Traffic (Modified) Saturday Peak Hour 21 Table 11: Trip Generation Summary Table 12: Unsignalized Levels of Service Future Total Traffic Weekday AM Peak Hour Table 13: Unsignalized Levels of Service Future Total Traffic Weekday PM Peak Hour Table 14: Unsignalized Levels of Service Future Total Traffic Saturday Peak Hour Table 15: Roundabout Levels of Service Future Total Traffic (Modified) Saturday Peak Hour Table 16: Zoning By-Law Parking Standards... 3 November 217 LEA Consulting Ltd.
 was retained by Two Sisters Resort Corporation, to prepare a traffic impact study for the proposed Hotel development at 144 & 176 John Street East, along with an anticipated residential")
5 144/176 John St, and 2 John St/588 Charlotte Ave, Niagara-On-The-Lake 1 Traffic Impact Study 1. INTRODUCTION LEA Consulting Ltd. (LEA) was retained by Two Sisters Resort Corporation, to prepare a traffic impact study for the proposed Hotel development at 144 & 176 John Street East, along with an anticipated residential development to be located at 2 John St/588 Charlotte Ave, Niagara-On-The-Lake. Although the two proposed projects are separate developments, the traffic impact associated with the proposals will be reviewed in a single, comprehensive traffic impact study. Figure 1 below illustrates the site locations. For the purposes of this report John Street East and Paffard Street will be referred to as eastwest roads. Subsequently all other intersecting roads will be referred to as north-south roads. Figure 1: Site Location 144/176 John St, and 2 John St/588 Charlotte Ave. The proposed hotel development located at 144 &176 John St will consist of a six-storey hotel with 145 units, and the anticipated residential development at 2 John St & 588 Charlotte Street will consist of a Plan of Subdivision on lands designated for residential uses (within the Built Boundary) consisting of a mix of single detached, semi-detached and townhouse dwelling units. Figure 2 and Figure 3 on the following page illustrate the proposed hotel site plan and Residential Concept Plan. The proposed hotel includes approximately 365 parking spaces underground and approximately 5 surface parking spaces. The number of parking spaces to be provided in the Plan of Subdivision will be in accordance with Section 6.39 of Zoning By-law At the time of this study submission, the Residential Concept Plan is in draft form and the final site statistics may differ from those assumed in this study. Upon finalization and submission of the Residential Concept Plan, LEA will review the need for a Traffic Addendum Update to this Traffic Impact Study to accompany this Traffic Impact Study. November 217 LEA Consulting Ltd.
6 144/176 John St, and 2 John St/588 Charlotte Ave, Niagara-On-The-Lake 2 Traffic Impact Study Figure 2: Proposed Site Plan 144/176 John Street Development - Hotel November 217 LEA Consulting Ltd.

7 144/176 John St, and 2 John St/588 Charlotte Ave, Niagara-On-The-Lake 3 Traffic Impact Study Figure 3: Residential Concept Plan 2 John St/588 Charlotte Street - Residential Subdivision November 217 LEA Consulting Ltd.
8 144/176 John St, and 2 John St/588 Charlotte Ave, Niagara-On-The-Lake 4 Traffic Impact Study 1.1 STUDY AREA The study area for the proposed development is as illustrated in Figure 1 and extends along John Street East from Charlotte Street to Queen s Parade/Niagara Parkway. The study area was determined in consultation with Town Staff considering the expected trip generation and distribution of the proposed development as well as the turning restrictions in the area. 2. EXISTING ROAD NETWORK The study area for this traffic impact is bounded by King Street to the west and Niagara Parkway to the east, the following existing intersections have been included in this study: Charlotte Street and John Street East Charlotte Street and Paffard Street Charlotte Street and Niagara Street John Street East and Queens Parade/Niagara Parkway John Street East and Two Sisters Vineyards Entrance John Street East and Peller Estates Winery and Restaurant Entrance John Street West/John Street East and King Street Charlotte Street is a northeast-southwest two-lane road with an urbanized cross-section west of the subject lands, with an assumed speed limit of 5 km/h as there are no posted speed limit sign. It begins south of John Street East and terminates at Niagara Street to the south. For the purposes of this report, Charlotte Street will be referred to as a north-south road. Niagara Street is a north-south two-lane road with a rural cross-section located southwest of the subject lands. It transitions from Rye Street at the north to Niagara Street to the south, beginning at Paffard Street and terminating at East and West Line. The posted speed limit is 5 km/h within the study area. John Street East is a northwest-southeast two-lane road with a rural cross-section north of the subject lands. It transitions from John Street West at King Street, northwest of the subject lands and transitions to Ricardo Street at Queens Parade/Niagara Parkway, southeast of the subject lands. Within the study area, John Street East has a posted speed limit of 5 km/h. For the purposes of this report, John Street East will be referred to as an east-west road. King Street is a two-lane north-south roadway with a rural cross-section north of John Street West and an urban cross-section south of John Street West. The speed limit is not posted within the study area; therefore, it is assumed to be 5 km/h. Queens Parade/Niagara Parkway is a north-south two-lane road with a rural cross-section east of the subject lands. It transitions from Picton Street at the northwest and terminates in Niagara Falls to the south. Within the study area, Queens Parade/Niagara Parkway has a posted speed limit of 6 km/h. Niagara Parkway is under the jurisdiction of the Niagara Parks Commission. Paffard Street/Weatherstone Court is a northwest-southeast two-lane road with an urbanized crosssection west of the subject lands. It begins east of Kings Street and terminates at Charlotte Street. The speed limit is assumed to be 5 km/h as there are no posted speed limit sign. For the purposes of this report, Paffard Street will be referred to as a west-east road. November 217 LEA Consulting Ltd.
9 144/176 John St, and 2 John St/588 Charlotte Ave, Niagara-On-The-Lake 5 Traffic Impact Study Two Sisters Vineyards Entrance two-lane driveway that begins at John Street East and terminates at the winery approximately 3m to the south. Within the study area, the driveway does not have a posted limit but it is assumed to be 4 km/h. Peller Estates Winery and Restaurant Entrance is a two-lane driveway that begins at John Street East and terminates at the winery and restaurant approximately 4m to the south. Within the study area, the driveway does not have a posted limit but it is assumed to be 4 km/h. Figure 4 illustrates a diagram of the existing lane configurations within the study area. Figure 4: Existing Unsignalized Intersections November 217 LEA Consulting Ltd.


10 144/176 John St, and 2 John St/588 Charlotte Ave, Niagara-On-The-Lake 6 Traffic Impact Study 2.1 EXISTING TRANSIT NETWORK The subject site currently has access to transit services that include Niagara-on-the-Lake Transit. The subject site is approximately 5m from the nearest bus stop at John Street West and King Street. Figure 5 illustrates all existing transit services in the area. Proposed Site Figure 5: Existing Transit Network Frequency of Transit Service AM Peak Hour PM Peak Hour Heritage-Old Town Route 3 minutes 3 minutes Old-Town Glendale Route 6 minutes 6 minutes Table 1: Service Frequency of Existing Transit Service Community Transport Group (CTG) is the provider of Niagara-on-the-Lake-Transit. Buses operate Monday through Saturday from 7:42 a.m. to 6:47 p.m. During the winter (off-season), there is only one bus travelling between Niagara-on-the-Lake Community Centre & Public Library through the old town to Virgil and then onto the Outlet Collection Centre of Niagara and Niagara College stops. November 217 LEA Consulting Ltd.
11 144/176 John St, and 2 John St/588 Charlotte Ave, Niagara-On-The-Lake 7 Traffic Impact Study 2.2 TRAFFIC DATA COLLECTION In order to capture the peak traffic periods in the study area, existing traffic volumes were obtained and collected by LEA between the hours of 7: a.m. and 9: a.m. and 4: p.m. and 6: p.m. for the weekday counts and between the hours of 11: a.m. and 1: p.m. and 4: p.m. and 6: p.m. for the Saturday counts. Table 2 summarizes the sources and dates of the data utilized in this traffic study. Intersection Date of Survey Source Charlotte Street and John Street East John Street East and Queens Parade/Niagara Parkway Charlotte Street and Paffard Street John Street East and Two Sisters Vineyards Entrance John Street East and Peller Estates Winery and Restaurant Entrance Charlotte Street and Niagara Street John Street West/East and King Street Tuesday, August 22, 217 Saturday, September 16, 217 Tuesday, September 19, 217 Saturday, September 16, 217 Tuesday, August 22, 217 Saturday, September 16, 217 Tuesday, August 22, 217 Saturday, September 16, 217 Tuesday, August 22, 217 Saturday, September 16, 217 Tuesday, September 19, 217 Saturday, September 16, 217 Tuesday, September 19, 217 Saturday, September 16, 217 Table 2: Existing Traffic Volumes for Weekday and Saturday Counts LEA Consulting Ltd. LEA Consulting Ltd. LEA Consulting Ltd. LEA Consulting Ltd. LEA Consulting Ltd. LEA Consulting Ltd. LEA Consulting Ltd. LEA Consulting Ltd. LEA Consulting Ltd. LEA Consulting Ltd. LEA Consulting Ltd. LEA Consulting Ltd. LEA Consulting Ltd. LEA Consulting Ltd. In review of the survey counts on September 19, 217 and August 22, 217 for the intersection at John Street East and Queens Parade/Niagara Parkway, LEA had determined that there were no significant differences between the surveyed intersections with the counts within 7%. At the time of the late summer (September) survey, the climate was clear and sunny while festivals and other events were scheduled without disruption. Therefore, a seasonal adjustment is not incorporated in the analyses for this report. Appendix B includes the survey counts on September 19, 217 and August 22, 217 for the intersection at John Street East and Queens Parade/Niagara Parkway. 2.3 PEAK HOUR FACTORS As per the Guidelines for Transportation Impact Studies Niagara Region, a peak hour factor (PHF) of.92 was assumed for all movements on all approaches. November 217 LEA Consulting Ltd.
12 144/176 John St, and 2 John St/588 Charlotte Ave, Niagara-On-The-Lake 8 Traffic Impact Study 3. EXISTING TRAFFIC CONDITIONS The existing balanced traffic volumes for the weekday a.m., p.m. and Saturday peak hours are shown in Figure 6, Figure 7 and Figure 8, respectively. The existing traffic volumes were balanced to the highest and most recent intersection volumes observed. 3.1 UNSIGNALIZED CAPACITY ANALYSES Intersection capacity analyses for this report were conducted using Synchro version 9. (Build 9), which incorporates the Highway Capacity Manual 2 methodology. The analyses were undertaken in accordance with the Guidelines for Transportation Impact Studies Niagara Region. Table 3, Table 4 and Table 5 summarize the results of existing traffic analysis in the weekday a.m., p.m. and Saturday peak hour, with detailed outputs found in Appendix C. Weekday AM Peak Hour Intersection John Street E & Queens Parade/Niagara Parkway John Street E & Two Sisters Vineyards Entrance John Street E & Peller Estates Winery and Restaurant Entrance John Street E & Charlotte Street Charlotte Street & Paffard Street/Weatherstone Court John Street E & Site Access #1 John Street E & King Street Charlotte Street & Niagara Street Movement of Interest Movement Flow Capacity Queue (m) V/C Delay (s) LOS Rate (vph) 95th EBLTR A.7 WBLTR B 1.3 NBLTR A.3 SBLTR A. WBTR A. NBLR A. WBLT A. NBLR A. EBLTR A. WBLTR A.1 NBLTR A 1.8 SBLTR A.1 EBLTR A. WBLTR A.1 NBLTR A.1 SBLTR A.1 NBLR 17.. A. EBLTR A - WBLTR A - NBLTR A - SBLTR A - EBTL A - WBTR A - SBLR A - John Street E & Site Access #3 NBLR 17.. A. Charlotte Street & Site Access #4 WBLR 17.. A. Table 3: Unsignalized Levels of Service Existing Traffic Weekday AM Peak Hour The analysis indicates that all the unsignalized intersections in the study area are operating at good overall levels of service. November 217 LEA Consulting Ltd.
13 144/176 John St, and 2 John St/588 Charlotte Ave, Niagara-On-The-Lake 9 Traffic Impact Study Weekday PM Peak Hour Intersection John Street E & Queens Parade/Niagara Parkway John Street E & Two Sisters Vineyards Entrance John Street E & Peller Estates Winery and Restaurant Entrance John Street E & Charlotte Street Charlotte Street & Paffard Street/Weatherstone Court Movement of Interest Movement Flow Capacity Delay Queue (m) V/C LOS Rate (vph) (s) 95th EBLTR B 3.3 WBLTR C 4.4 NBLTR A.8 SBLTR A.2 WBTR A.2 NBLR A.9 WBLT A.2 NBLR A 1. EBLTR A. WBLTR A.2 NBLTR A 1.5 SBLTR A.2 EBLTR A.3 WBLTR A.1 NBLTR A.1 John Street E & Site Access #1 NBLR 17.. A. EBLTR A - John Street E & King Street WBLTR A - NBLTR A - SBLTR A - EBTL A - Charlotte Street & Niagara Street WBTR A - SBLR A - John Street E & Site Access #3 NBLR 17.. A. Charlotte Street & Site Access #4 WBLR 17.. A. Table 4: Unsignalized Levels of Service Existing Traffic Weekday PM Peak Hour During the weekday p.m. peak hour, the analysis indicates all the intersections are operating at good overall levels of service. November 217 LEA Consulting Ltd.
14 144/176 John St, and 2 John St/588 Charlotte Ave, Niagara-On-The-Lake 1 Traffic Impact Study Saturday Peak Hour Intersection John Street E & Queens Parade/Niagara Parkway John Street E & Two Sisters Vineyards Entrance John Street E & Peller Estates Winery and Restaurant Entrance John Street E & Charlotte Street Charlotte Street & Paffard Street/Weatherstone Court John Street E & Site Access #1 John Street E & King Street Charlotte Street & Niagara Street Movement of Interest Movement Flow Capacity Queue (m) V/C Delay (s) LOS Rate (vph) 95th EBLTR D 27.8 WBLTR F 66.6 NBLTR A 1.7 SBLTR A.3 WBTR A.8 NBLR B 3.2 WBLT A.4 NBLR B 5.7 EBLTR A.1 WBLTR A.2 NBLTR B 2.9 SBLTR A.4 EBLTR A.4 WBLTR 17.. A. NBLTR A.2 NBLR 17.. A. EBLTR A - WBLTR A - NBLTR A - SBLTR B - EBTL A - WBTR A - SBLR A - John Street E & Site Access #3 NBLR 17.. A. Charlotte Street & Site Access #4 WBLR 17.. A. Table 5: Unsignalized Levels of Service Existing Traffic Saturday Peak Hour During the Saturday peak hour, the analysis indicates that the majority of the intersections are operating at good overall levels of service, with the exception of the westbound movements at John Street East and Queen Parade/Niagara Parkway. There is a high volume of westbound left turns at this intersection which were observed during the Saturday peak period to be experiencing delay times of almost four minutes or more to complete the movement. The high volumes of north and southbound traffic as well as the eastbound left turns are all conflicting movements with the westbound left turns. November 217 LEA Consulting Ltd.
15 144/176 John Street and 2 John Street/588 Charlotte Avenue, Niagara-on-the-Lake 11 Traffic Impact Study King St Charlotte St Queen's Parade John St E` Site Access 1 Site Access 2 Site Access 3 SUBJECT SITE Paffard St Weatherstone Crt IN: 85 OUT: Two Sisters Vineyards Peller Estates Winery Site Access Niagara Pkwy 2 Niagara St 44 Proposed Development at 144/176 John St, and 2 John St/588 Charlotte Ave EXISTING TRAFFIC Figure 5 Weekday AM Peak Hour F:\18145\Traffic\[Turn Diagram_v5.xlsx]Balance (Revised) 12:12 27-Sep-17 Column 8 Figure 6: Existing Traffic - Weekday AM Peak Hour October 217 LEA Consulting Ltd.
16 144/176 John Street and 2 John Street/588 Charlotte Avenue, Niagara-on-the-Lake 12 Traffic Impact Study King St Charlotte St Queen's Parade John St E` Site Access 1 Site Access 2 SUBJECT SITE Site Access Paffard St Weatherstone Crt IN: 85 OUT: Two Sisters Vineyards Peller Estates Winery Site Access Niagara Pkwy Niagara St 81 Proposed Development at 144/176 John St, and 2 John St/588 Charlotte Ave EXISTING TRAFFIC Figure 6 Weekday PM Peak Hour F:\18145\Traffic\[Turn Diagram_v9 CS and KW.xlsx]Balance (Revised) 15: 4-Oct-17 Column 9 Figure 7: Existing Traffic - Weekday PM Peak Hour October 217 LEA Consulting Ltd.
17 144/176 John Street and 2 John Street/588 Charlotte Avenue, Niagara-on-the-Lake 13 Traffic Impact Study King St Charlotte St Queen's Parade John St E` Site Access 1 Site Access 2 Site Access 3 SUBJECT SITE Paffard St Weatherstone Crt IN: 85 OUT: Two Sisters Vineyards Peller Estates Winery Site Access Niagara Pkwy 2 Niagara St 99 Proposed Development at 144/176 John St, and 2 John St/588 Charlotte Ave EXISTING TRAFFIC Figure 7 Saturday PM Peak Hour F:\18145\Traffic\[Turn Diagram_v5.xlsx]Table 12:19 27-Sep-17 Column 1 Figure 8: Existing Traffic - Saturday Peak Hour October 217 LEA Consulting Ltd.
18 144/176 John Street and 2 John Street/588 Charlotte Avenue, Niagara-on-the-Lake 14 Traffic Impact Study 4. FUTURE BACKGROUND TRAFFIC This traffic impact study considers a 5-year horizon. As determined through consultation with the Town, the traffic study applies a 2% growth rate for future corridor traffic growth. Future background traffic includes the traffic added to the network from other future developments within and surrounding the study. The existing traffic volumes plus the addition of future background corridor growth and background developments is illustrated in Figure 9, Figure 1 and Figure BACKGROUND DEVELOPMENTS The Town indicated that three background developments within the vicinity of the subject site must be included in the analysis. Details are summarized in Table 6. The volumes associated with the developments were obtained from the transportation study prepared for the Pillar and Post Inn Expansion, which are provided in Appendix D. As the study only provided a Saturday analysis, the trip assignments and land use trip ITE Trip Generation Manual 9 th Edition generation rates were applied to obtain weekday a.m. and p.m. traffic volumes for the developments. Additional details on trip generation rates is described in Section 5.1. Development Location Type of Development Averton Square Windsor Townhomes Pillar and Post Inn Expansion 12 John St W 128, 134 and 174 Anne St 48 John St W Table 6: List of Background Developments 2 single-family detaches units and 94 apartment units 58 townhouse units 114 Hotel Rooms & 9,48 ft 2 Conference Centre Application Status Site Plan Approved Draft Plan Approved Site Plan Approved Source Pillar and Post Transportation Impact Study (3 June 216) Solmar Development Corp & SGL Planning and Design Inc Pillar and Post Transportation Impact Study (3 June 216) October 217 LEA Consulting Ltd.
19 144/176 John Street and 2 John Street/588 Charlotte Avenue, Niagara-on-the-Lake 15 Traffic Impact Study King St Charlotte St Queen's Parade John St E` Site Access 1 Site Access 2 SUBJECT SITE Site Access Paffard St Weatherstone Crt IN: 85 OUT: Two Sisters Vineyards Peller Estates Winery Site Access Niagara Pkwy 2 Niagara St 49 Proposed Development at 144/176 John St, and 2 John St/588 Charlotte Ave FUTURE BACKGROUND TRAFFIC VOLUME Figure 8 Weekday AM Peak Hour F:\18145\Traffic\[Turn Diagram_v11 KM Client comments.xlsx]balance (Revised) 15:3 3-Nov-17 Column 59 Figure 9: Future Background Traffic - Weekday AM Peak Hour October 217 LEA Consulting Ltd.
20 144/176 John Street and 2 John Street/588 Charlotte Avenue, Niagara-on-the-Lake 16 Traffic Impact Study King St Charlotte St Queen's Parade John St E` Site Access 1 Site Access 2 SUBJECT SITE Site Access Paffard St Weatherstone Crt IN: 85 OUT: Two Sisters Vineyards Peller Estates Winery Site Access Niagara Pkwy Niagara St 89 Proposed Development at 144/176 John St, and 2 John St/588 Charlotte Ave FUTURE BACKGROUND TRAFFIC VOLUME Figure 9 Weekday PM Peak Hour F:\18145\Traffic\[Turn Diagram_v11 KM Client comments.xlsx]balance (Revised) 15:4 3-Nov-17 Column 6 Figure 1: Future Background Traffic - Weekday PM Peak Hour October 217 LEA Consulting Ltd.
21 144/176 John Street and 2 John Street/588 Charlotte Avenue, Niagara-on-the-Lake 17 Traffic Impact Study King St Charlotte St Queen's Parade John St E` Site Access 1 Site Access 2 SUBJECT SITE Site Access Paffard St Weatherstone Crt IN: 85 OUT: Two Sisters Vineyards Peller Estates Winery Site Access Niagara Pkwy 2 Niagara St 19 Proposed Development at 144/176 John St, and 2 John St/588 Charlotte Ave Figure 1 Saturday PM Peak Hour F:\18145\Traffic\[Turn Diagram_v11 KM Client comments.xlsx]balance (Revised) 15:21 3-Nov-17 Column 61 Figure 11: Future Background Traffic Saturday PM Peak Hour October 217 LEA Consulting Ltd.
22 144/176 John Street and 2 John Street/588 Charlotte Avenue, Niagara-on-the-Lake 18 Traffic Impact Study 4.2 INTERSECTION CAPACITY ANALYSIS Intersection capacity analyses were performed for the background traffic growth to 222. Table 7, Table 8 and Table 9 summarizes the analysis results for the future background traffic in weekday a.m., p.m. and Saturday peak periods, with detailed outputs found in Appendix E. Weekday AM Peak Hour Intersection John Street E & Queens Parade/Niagara Parkway John Street E & Two Sisters Vinyards Entrance John Street E & Peller Estates Winery and Restaurant Entrance John Street E & Charlotte Street Charlotte Street & Paffard Street/Weatherstone Court John Street E & Site Access #1 John Street E & King Street Charlotte Street & Niagara Street Movement of Interest Movement Flow Capacity Queue (m) V/C Delay (s) LOS Rate (vph) 95th EBLTR A.9 WBLTR B 1.5 NBLTR A.6 SBLTR A. WBTR A. NBLR A. WBLT A. NBLR A. EBLTR A. WBLTR A.1 NBLTR A 1.8 SBLTR A.1 EBLTR A. WBLTR A.1 NBLTR A.1 SBLTR A.1 NBLR 17.. A. EBLTR A - WBLTR A - NBLTR A - SBLTR A - EBTL A - WBTR A - SBLR A - John Street E & Site Access #3 NBLR 17.. A. Charlotte Street & Site Access #4 WBLR A 2.1 Table 7: Unsignalized Levels of Service Future Background Traffic Weekday AM Peak Hour Under the future background traffic conditions, the capacity analysis indicates all the unsignalized intersections in the study area will operate at good overall levels of service in the weekday a.m. peak period. October 217 LEA Consulting Ltd.
23 144/176 John Street and 2 John Street/588 Charlotte Avenue, Niagara-on-the-Lake 19 Traffic Impact Study Weekday PM Peak Hour Intersection John Street E & Queens Parade/Niagara Parkway John Street E & Two Sisters Vinyards Entrance John Street E & Peller Estates Winery and Restaurant Entrance John Street E & Charlotte Street Charlotte Street & Paffard Street/Weatherstone Court John Street E & Site Access #1 John Street E & King Street Charlotte Street & Niagara Street Movement of Interest Movement Flow Capacity Queue (m) V/C Delay (s) LOS Rate (vph) 95th EBLTR B 4.3 WBLTR C 6.2 NBLTR A 1.8 SBLTR A.2 WBTR A.2 NBLR A 1.1 WBLT A.2 NBLR A 1.1 EBLTR A. WBLTR A.2 NBLTR B 1.7 SBLTR A.2 EBLTR A.3 WBLTR A.1 NBLTR A.1 NBLR 17.. A. EBLTR A - WBLTR A - NBLTR A - SBLTR A - EBTL A - WBTR A - SBLR A - John Street E & Site Access #3 NBLR 17.. A. Charlotte Street & Site Access #4 WBLR A 1.3 Table 8: Unsignalized Levels of Service Future Background Traffic Weekday PM Peak Hour Under the future background traffic conditions, the capacity analysis indicates all the unsignalized intersections in the study area will operate at good overall levels of service in the weekday p.m. peak period. October 217 LEA Consulting Ltd.
24 144/176 John Street and 2 John Street/588 Charlotte Avenue, Niagara-on-the-Lake 2 Traffic Impact Study Saturday Peak Hour Intersection John Street E & Queens Parade/Niagara Parkway John Street E & Two Sisters Vinyards Entrance John Street E & Peller Estates Winery and Restaurant Entrance John Street E & Charlotte Street Charlotte Street & Paffard Street/Weatherstone Court John Street E & Site Access #1 John Street E & King Street Charlotte Street & Niagara Street Movement of Interest Movement Flow Capacity Queue (m) V/C Delay (s) LOS Rate (vph) 95th EBLTR E 33.1 WBLTR F 84.9 NBLTR A 3.9 SBLTR A.3 WBTR A.8 NBLR B 3.5 WBLT A.5 NBLR B 5.4 EBLTR A.1 WBLTR A.2 NBLTR B 3.5 SBLTR B.4 EBLTR A.4 WBLTR 17.. A. NBLTR A.2 NBLR 17.. A. EBLTR B - WBLTR B - NBLTR B - SBLTR B - EBTL A - WBTR A - SBLR A - John Street E & Site Access #3 NBLR 17.. A. Charlotte Street & Site Access #4 WBLR A 2.2 Table 9: Unsignalized Levels of Service Future Background Traffic Saturday Peak Hour Under the future background traffic conditions, the capacity analysis indicates that the majority of the unsignalized intersections in the study area will operate at good overall levels of service in the Saturday peak period, with the exception of the westbound movements at the intersection of John Street East and Queens Parade/Niagara Parkway during Saturday peak hours. The westbound movements, as in the existing Saturday peak hour, are expected to operate over capacity as a result of the increase in northbound left volumes associated with the background development traffic further west on John St. The existing volumes Saturday count for the intersection was completed on August 22, 217 and September 16, 217. Both days are summer Saturdays, which include festivals and other Regional events such as the marina boat launch at the Niagara-on-the-Lake Sailing Club. Traffic is tourism-oriented and seasonal in Niagara-on-the-Lake, and it is therefore expected that this traffic congestion on Saturdays at the John Street East & Queens Parade/Niagara Parkway intersection will occur outside of the winter months. There was no increase in westbound left traffic between the existing and future conditions, yet the increase in conflicting movements from background traffic increased the delay for the movement from four minutes to over 6 minutes for the westbound left, which is considered unacceptable. The westbound October 217 LEA Consulting Ltd.
25 144/176 John Street and 2 John Street/588 Charlotte Avenue, Niagara-on-the-Lake 21 Traffic Impact Study left traffic, which travels from downtown along Ricardo St for 1.8km without intersecting any other intersections provides one of the few routes between Niagara on the Lake and Niagara Falls. The significant delay for a left turn at a two-way stop controlled intersection may lead to drivers utilizing alternate routes through Downtown Niagara-on-the-Lake, which during Saturdays has significant pedestrian and traffic congestion, or cause drivers to make risky maneuvers to complete a left turn. To mitigate these concerns, a permanent roundabout for the intersection was assessed and is described in the following Section ROUNDABOUT CAPACITY ANALYSIS AT JOHN STREET E AND QUEEN S PARADE/NIAGARA PARKWAY Intersection capacity analysis for the roundabout of John Street East and Queen s Parade/Niagara Parkway were performed using Junctions 8 for the background traffic growth to 222. Table 1 summarizes the analysis results for the future background traffic in weekday a.m., p.m. and Saturday peak periods, with detailed outputs found in Appendix F. Weekday AM Peak Hour Movement of Interest Roundabout Queue (m) Movement V/C Delay (s) LOS 95th EBLTR A 1. John Street E & Queens WBLTR A 1. Parade/Niagara Parkway NBLTR A 1. SBLTR A 1. Weekday PM Peak Hour Movement of Interest Roundabout Queue (m) Movement V/C Delay (s) LOS 95th EBLTR A 1. John Street E & Queens WBLTR A 1. Parade/Niagara Parkway NBLTR A 1. SBLTR A 1.2 Saturday Peak Hour Movement of Interest Roundabout Queue (m) Movement V/C Delay (s) LOS 95th EBLTR A 1. John Street E & Queens WBLTR A.24 Parade/Niagara Parkway NBLTR A 2.4 SBLTR B 2. Table 1: Roundabout Levels of Service Future Background Traffic (Modified) Saturday Peak Hour Under the future background traffic conditions for all peak hours, the capacity analysis for a proposed roundabout indicates all turn movements will operate at good overall level of service. The expected delays and queues for all movements in all peak hours show reduced delay and queues of one vehicle at most. Given the overall improvements in all scenarios, installing a roundabout at the intersection of John Street and Niagara Parkway is expected to provide a safer and less congested intersection for existing and future traffic volumes and is recommended to be installed. October 217 LEA Consulting Ltd.
26 144/176 John Street and 2 John Street/588 Charlotte Avenue, Niagara-on-the-Lake 22 Traffic Impact Study 5. TRIP GENERATION AND DISTRIBUTION 5.1 TRIP GENERATION The proposed development consists of a six-storey hotel with 145 rooms, and a residential conceptual plan of subdivision with 169 units. Table 11 summarizes the trip generation volumes for the proposed development during weekday a.m. and p.m. peak hours and Saturday a.m. and p.m. peak hours for full build-out. Weekday AM Peak Hour Units In Out Total Hotel 145 Trip Rate / Unit Trips Generated Singles and Semis 144 Trip Rate / Unit Trips Generated Townhouses 25 Trip Rate / Unit Trips Generated Total Proposed Development Trip Generation Weekday AM Peak Hour Weekday PM Peak Hour Units In Out Total Hotel 145 Trip Rate / Unit Trips Generated Singles and Semis 144 Trip Rate / Unit Townhouses 25 Trips Generated Trip Rate / Unit Trips Generated Total Proposed Development Trip Generation Weekday PM Peak Hour Saturday Peak Hour Units In Out Total Hotel 145 Singles and Semis 144 Townhouses 25 Trip Rate / Unit Trips Generated Trip Rate / Unit Trips Generated Trip Rate / Unit Trips Generated Total Proposed Development Trip Generation Saturday Peak Hour Table 11: Trip Generation Summary 5.2 TRIP DISTRIBUTION AND TRIP ASSIGNMENT The trip distribution for the proposed hotel development was derived from existing traffic volumes, as there are multiple hotels located along John Street East and it is expected that distribution for the proposed hotel would have similar characteristics as the volumes generated by these hotels. The trip distribution for the residential development was derived from TTS 211 data for the weekday a.m. and p.m. peak periods and the Saturday peak period. The site trip distribution and assignment figures can be found in Appendix G. Figure 12, Figure 13 and Figure 14 illustrate the projected site traffic volumes and their traffic assignments for the completion of the development, year 222. October 217 LEA Consulting Ltd.
27 144/176 John Street and 2 John Street/588 Charlotte Avenue, Niagara-on-the-Lake 23 Traffic Impact Study King St Charlotte St Queen's Parade John St E` Site Access 1 Site Access 2 SUBJECT SITE Site Access Paffard St Weatherstone Crt IN: OUT: 127 Two Sisters Vineyards Peller Estates Winery Site Access Niagara Pkwy 2 Niagara St 49 Proposed Development at 144/176 John St, and 2 John St/588 Charlotte Ave FUTURE TOTAL VOLUME Figure 11 Weekday AM Peak Hour F:\18145\Traffic\[Turn Diagram_v11 KM Client comments.xlsx]balance (Revised) 15:51 3-Nov-17 Column 9 Figure 12: Future Total Site Traffic - Weekday AM Peak Hour October 217 LEA Consulting Ltd.
28 144/176 John Street and 2 John Street/588 Charlotte Avenue, Niagara-on-the-Lake 24 Traffic Impact Study King St Charlotte St Queen's Parade John St E` Site Access 1 Site Access 2 SUBJECT SITE Site Access Paffard St Weatherstone Crt IN: OUT: 95 Two Sisters Vineyards Peller Estates Winery Site Access Niagara Pkwy Niagara St 89 Proposed Development at 144/176 John St, and 2 John St/588 Charlotte Ave FUTURE TOTAL VOLUME Figure 12 Weekday PM Peak Hour F:\18145\Traffic\[Turn Diagram_v11 KM Client comments.xlsx]balance (Revised) 16:41 3-Nov-17 Column 91 Figure 13: Future Total Site Traffic - Weekday PM Peak Hour October 217 LEA Consulting Ltd.
29 144/176 John Street and 2 John Street/588 Charlotte Avenue, Niagara-on-the-Lake 25 Traffic Impact Study King St Charlotte St Queen's Parade John St E` Site Access 1 Site Access 2 SUBJECT SITE Site Access Paffard St Weatherstone Crt IN: OUT: 171 Two Sisters Vineyards Peller Estates Winery Site Access Niagara Pkwy 2 Niagara St 19 Proposed Development at 144/176 John St, and 2 John St/588 Charlotte Ave FUTURE TOTAL VOLUME (Saturday) Figure 13 Saturday Peak Hour F:\18145\Traffic\[Turn Diagram_v11 KM Client comments.xlsx]balance (Revised) 16:47 3-Nov-17 Column 92 Figure 14: Future Total Site Traffic Saturday Peak Hour October 217 LEA Consulting Ltd.
30 144/176 John Street and 2 John Street/588 Charlotte Avenue, Niagara-on-the-Lake 26 Traffic Impact Study 6. FUTURE TOTAL TRAFFIC CONDITIONS Future total traffic analyses were performed for the 222 planning horizon. The intersection capacity analyses were performed for the future total traffic conditions using future total traffic volumes, existing signal timings and existing lane configurations. 6.1 UNSIGNALIZED CAPACITY ANALYSIS Table 12, Table 13, and Table 14 summarize the intersection capacity analysis results for critical movements during the weekday a.m., p.m. and Saturday peak hours, respectively. Detailed outputs can be found in Appendix H. For the purposes of this future total traffic conditions analysis, the intersection level of service table for John Street East and Queen s Parade/Niagara Parkway is provided in Section 6.2 under the recommended roundabout scenario. Weekday AM Peak Hour Intersection John Street E & Two Sisters Vinyards Entrance John Street E & Peller Estates Winery and Restaurant Entrance John Street E & Charlotte Street Charlotte Street & Paffard Street/Weatherstone Court Movement of Interest Movement Flow Capacity Delay Queue (m) V/C LOS Rate (vph) (s) 95th WBTR A. NBLR A. WBLT A. NBLR A. EBLTR A. WBLTR A.2 NBLTR A 2.8 SBLTR A.1 EBLTR A. WBLTR A.1 NBLTR A.1 SBLTR A.1 John Street E & Site Access #2 NBLR A.1 WBTL A.2 John Street E & Site Access #1 NBLR A.7 EBLTR A - WBLTR A - John Street E & King Street NBLTR A - SBLTR A - Charlotte Street & Niagara Street John Street E & Site Access #3 EBTL A - WBTR A - SBLR A - WBTL A.2 NBLR A 1.2 Charlotte Street & Site Access WB A 2.1 #4 Table 12: Unsignalized Levels of Service Future Total Traffic Weekday AM Peak Hour During the weekday a.m. peak hour, the capacity analysis indicates the unsignalized intersections within the study area will continue to operate at good overall levels of service. November 217 LEA Consulting Ltd.
31 144/176 John Street and 2 John Street/588 Charlotte Avenue, Niagara-on-the-Lake 27 Traffic Impact Study Weekday PM Peak Hour Movement of Interest Intersection Flow Capacity Delay Queue (m) Movement V/C LOS Rate (vph) (s) 95th John Street E & Two Sisters WBTR A.2 Vinyards Entrance NBLR A 1.2 John Street E & Peller Estates WBLT A.2 Winery and Restaurant Entrance NBLR A 1.2 EBLTR A. John Street E & Charlotte Street WBLTR A.3 NBLTR B 3.3 SBLTR A.2 EBLTR A.3 Charlotte Street & Paffard WBLTR A.1 Street/Weatherstone Court NBLTR A.1 John Street E & Site Access #2 NBLR A.1 John Street E & Site Access #1 WBTL A.2 NBLR A 1. EBLTR A - John Street E & King Street WBLTR A - NBLTR A - SBLTR A - EBTL A - Charlotte Street & Niagara Street WBTR A - SBLR A - John Street E & Site Access #3 WBTL A 1. NBLR A.6 Charlotte Street & Site Access #4 WBLR A 1.3 Table 13: Unsignalized Levels of Service Future Total Traffic Weekday PM Peak Hour During the weekday p.m. peak hour future total traffic conditions, the intersection capacity analysis indicates that majority of the unsignalized intersections within the study area are expected to operate at good overall levels of service. November 217 LEA Consulting Ltd.
32 144/176 John Street and 2 John Street/588 Charlotte Avenue, Niagara-on-the-Lake 28 Traffic Impact Study Saturday Peak Hour Intersection John Street E & Two Sisters Vinyards Entrance John Street E & Peller Estates Winery and Restaurant Entrance John Street E & Charlotte Street Charlotte Street & Paffard Street/Weatherstone Court Movement of Interest Movement Flow Capacity Delay Queue (m) V/C LOS Rate (vph) (s) 95th WBTR A.9 NBLR B 4. WBLT A.5 NBLR B 6.3 EBLTR A.1 WBLTR A.3 NBLTR C 9. SBLTR B.5 EBLTR A.4 WBLTR 17.. A. NBLTR A.2 John Street E & Site Access #2 NBLR A.1 John Street E & Site Access WBTL A.2 #1 NBLR B 1.6 EBLTR B - John Street E & King Street WBLTR C - NBLTR B - SBLTR C - EBTL A - Charlotte Street & Niagara WBTR A - Street SBLR A - John Street E & Site Access WBTL A.8 #3 NBLR A 1.1 Charlotte Street & Site Access #4 WBLR A 2.2 Table 14: Unsignalized Levels of Service Future Total Traffic Saturday Peak Hour During the Saturday peak hour future total traffic conditions, the intersection capacity analysis indicates that most of the unsignalized intersections within the study area are expected to operate at good overall levels of service. 6.2 FUTURE TOTAL TRAFFIC ROUNDABOUT CAPACITY ANALYSIS AT JOHN STREET EAST AND QUEEN S PARADE/NIAGARA PARKWAY Intersection capacity analysis at the intersection of John Street East and Queen s Parade/Niagara Parkway were performed using Junctions 8 for the future total traffic condition. Table 15 summarizes the analysis results for the future background traffic for the Saturday peak period. November 217 LEA Consulting Ltd.
33 144/176 John Street and 2 John Street/588 Charlotte Avenue, Niagara-on-the-Lake 29 Traffic Impact Study Weekday AM Peak Hour Intersection John Street E & Queens Parade/Niagara Parkway Weekday PM Peak Hour Intersection John Street E & Queens Parade/Niagara Parkway Saturday Peak Hour Intersection Movement of Interest Movement V/C Delay (s) LOS Queue (m) 95 th EBLTR A 1. WBLTR A 1. NBLTR A 1. SBLTR A 1. Movement of Interest Movement V/C Delay (s) LOS Queue (m) 95 th EBLTR A 1. WBLTR A 1. NBLTR A 1. SBLTR A 1.2 Movement of Interest Movement V/C Delay (s) LOS Queue (m) EBLTR A 1.2 John Street E & Queens WBLTR A 1. Parade/Niagara Parkway NBLTR B 3. SBLTR B 3.6 Table 15: Roundabout Levels of Service Future Total Traffic (Modified) Saturday Peak Hour Under the future total traffic conditions for the all peak hours, the capacity analysis for the roundabout at John Street East and Queen s Parade/Niagara Parkway indicates all turn movements will operate at good overall level of service, with delays of thirteen seconds or less. 95 th November 217 LEA Consulting Ltd.
.")


34 144/176 John Street and 2 John Street/588 Charlotte Avenue, Niagara-on-the-Lake 3 Traffic Impact Study 7. PARKING AND LOADING REQUIREMENTS 7.1 VEHICULAR PARKING REQUIREMENTS The proposed development is subjected to Zoning By-law (No ). Based on the zoning by-law parking standards, the proposed development is required to provide 368 residential parking spaces and 46 visitor parking spaces. Table 16 outlines the parking rates as indicated by Zoning By-law Type of Use Total Number of Niagara-on-the-Lake By-law Minimum Units or Rooms Parking Rates Parking Supply Hotel spaces / room 145 Residential Subdivision Townhouse spaces / unit 38 Residential Subdivision Singles/Semis spaces / unit 288 Total Table 16: Zoning By-Law Parking Standards Zoning by-law requires a minimum of 471 spaces for the proposed development. The hotel site plan includes a total of approximately 365 parking spaces underground and approximately 5 existing or proposed parking spaces to be provided on surface, which exceeds the hotel requirements. The residential development, which is proposed to consist of 25 townhouse units, 44 Semi units and 1 single detached homes, will provide at the by-law rate. Therefore, the site meets or exceeds the minimum requirement for parking according to by-law ACCESS CONFIGURATION There are four proposed accesses for the subject site, three off John Street and the other off Charlotte Street, as shown in Figure 15. #1 #2 #3 #4 Figure 15: Site Access Configuration The hotel development can be accessed from all three accesses. It is expected that the main access and egress for the hotel will be Site Access #1 will be provided exclusively for hotel guests and employees. November 217 LEA Consulting Ltd.
35 144/176 John Street and 2 John Street/588 Charlotte Avenue, Niagara-on-the-Lake 31 Traffic Impact Study Site Access #2 will be a one-way entrance for the hotel and another access located further east on John St, Site Access #3 will provide access and egress. Site Access #3 will also provide as a secondary access for the residential subdivision. The main access for the residential subdivision from Street B (Site Access #4) will be located off of Charlotte Street, connecting approximately 3m south of Weatherstone Court and 15m south of Paffard Street. Although this creates an offset intersection with Paffard Street, the left turning movements for both intersections will not conflict and does therefore not present concerns. The existing multi-use path located on the south side of the development can be realigned from the existing diagonal crossing through Charlotte Street and Paffard Street. The multi-use path will cross the new Street B 3m southeast of Charlotte Street and will cross Charlotte Street at a right angle at the south leg of Paffard Street. The capacity analysis for proposed accesses in both the future background and future total scenarios indicate that all accesses are expected to operate with minimal delay and congestion. The number and location of the accesses are considered appropriate to distribute the impacts of the increase in traffic volumes on the surrounding network. November 217 LEA Consulting Ltd.
36 144/176 John Street and 2 John Street/588 Charlotte Avenue, Niagara-on-the-Lake 32 Traffic Impact Study 9. CONCLUSIONS The proposed development will consist of 145 hotel units and a concept plan for 169 residential units or houses. Near the northeast limit of the property, Access #3 will provide two-way for the hotel and egress for residential subdivision. Two other driveways will provide access to the hotel, a one-way Main entrance (Site Access #2) and a two-way access (Site Access #1). The residential subdivision will have an additional access (Site Access #4) off Charlotte Street. Under existing and future traffic conditions most unsignalized intersections within the study area were found to be operating at good overall levels of service during both the weekday a.m. and p.m. peak hours. However, users attempting to complete the eastbound and westbound turn movements at John Street East and Queens Parade/Niagara Parkway will experience significant delay under the future background traffic conditions. The study has found that the proposed, combined development is expected to generate 28 twoway trips during the weekday a.m. peak hour, 234 two-way trips during the weekday p.m. peak hour and 291 two-way trips during the Saturday peak hour. The capacity analysis, for the future total volumes. show similar results to the future background volumes. The delays that are anticipated at the at the John Street East & Queen s Parade/Niagara Parkway intersection for the Future Background and Future Total counts have warranted for a permanent roundabout. Analysis of the proposed roundabout indicates that the turn movements at the intersection will be operating at a good overall level of service, with the east and westbound volumes showing significant improvements over the two-way stop controlled intersection. Based on the existing site plan, the development is proposed to have a parking supply of 365 underground parking spaces and 5 visitor parking spaces for the hotel development. Applying the Section 6.39 standard rate of Zoning By-law , this results in a parking supply of 145 parking spaces required for the hotel and 326 parking spaces for the residential subdivision. The residential concept plan will provide parking at the By-law rate. The accesses are located off John Street East and Charlotte Street. The main access to the hotel will be from an exclusive access off John Street East and the residential subdivision will have a main access off Charlotte Street and a secondary access off John Street East. November 217 LEA Consulting Ltd.
37 APPENDIX A Terms of Reference
38 LEA Consulting Ltd. Consulting Engineers & Planners 9th Floor, 625 Cochrane Drive, Markham, ON, L3R 9R9 CANADA Tel: Fax: August 217 Our Ref.: 2691/144 and 2 John Street Mr. Raymond Tung Urban Design Specialist Town Niagara-on-the-Lake 1593 Four Mile Creek Road Virgil, ON LS 1T rtung@notl.org VIA Dear Mr. Raymond: Re: Terms of Reference Transportation Impact Study Proposed Niagara Hotel and Residential Subdivision Development 144/176 John Street, and 2 John Street/588 Charlotte Avenue, Niagara-on-the-Lake This letter outlines our proposed Terms of Reference for a Transportation Impact Study prepared as part of redevelopment protects located at 144/176 John Street, and 2 John Street/588 Charlotte Avenue in Niagara-on-the-Lake. 144/176 John Street, and 2 John Street/588 Charlotte are proposed to be developed in combination with each other, as such the traffic impact associated with each will be reviewed in a single traffic impact study. Figure 1 illustrates the subject sites. 144/176 John Street, at the southeast corner of Charlotte Street and John Street East is currently occupied by existing Devonian house and existing Randwood house. The redevelopment site plan proposes a sixstorey hotel that accommodates the hotel s height and increased density, from 16 rooms to 136 rooms. 2 John Street/588 Charlotte Street, at the southeast side of Paffard Street and Charlotte Street is also currently occupied by a single house. The redevelopment site plan proposes a residential plan of subdivision with approximately units. The Transportation Impact Study for the redevelopments will conform to the City of Niagara Traffic Impact Study Guidelines. We wish to confirm the following assumptions for the study noted above. 144 and 2 John Street Terms of Reference


39 16 August 217 Our Ref: 144 and 2 John Street Page 2 Subject Sites Study Area & Traffic Data Figure 1: Context Map The unsignalized intersections that are proposed to be included in this traffic study include: Charlotte Street and John Street East John Street and Queens Parade/Niagara Parkway Charlotte Street and Paffard Street John Street and Two Sisters Vinyards Entrance John Street and Peller Estates Winery and Restaurant Entrance; and John Street and Niagara Parkway. City of Niagara turning movement counts available for the above noted intersections (and captured within the past 2 years) will be utilized for the study if available. LEA will also obtain additional field data as required.
40 16 August 217 Our Ref: 144 and 2 John Street Page 3 Traffic Assessment and Study Horizon Year The study will focus on the weekday a.m. and p.m. peak hour traffic operations. Synchro version 9. will be used to assess intersection operations during the peak hours. A five-year horizon will be assessed in this Transportation Impact Study. Background Traffic General Corridor Growth Rate In the absence of historical data, traffic forecast models or other traffic studies in the surrounding area the TIS Guidelines suggest an annual growth rate of two percent. The two percent growth rate will be applied to traffic along Charlotte Street, John Street East, Queens Parade/Niagara Parkway, and Paffard Street. Please confirm this annual growth rate or provide an appropriate growth rate for our analysis. Road Network Improvements - LEA will note any road network improvements (e.g. road widening) identified within the study area and account for any traffic diversions associated with these improvements within our analysis. This will require discussion and coordination with City Staff. Background Development Traffic Please provide a list of development to be taken into consideration for the background traffic analysis for the five horizon years, as well as any traffic studies prepared for those background developments. Trip Generation, Distribution, and Assignment To estimate vehicle trip generation for the proposed development, LEA will apply the appropriate 9 th Edition ITE Manual trip generation rates. Future Traffic Scenarios Future background and future total analysis for the aforementioned intersections within the study area will be conducted over the five above-noted horizon years. Site Access and Circulation The Transportation Impact Study will also recommend any road network improvements and/or signal timing modifications required to accommodate the traffic generated by the proposed redevelopment, including the access arrangement and the on-site circulation. Parking and Loading LEA also will provide a functional review of the parking and loading operations (i.e. turn path analysis) proposed for the subject site. More details on the proposed parking and loading arrangements will be made available as the site plan concept develops. Should you have any concerns with the above assumptions, please contact me at (95) 47-15, Ext. 282 or by at csidlar@lea.ca.
41 16 August 217 Our Ref: 144 and 2 John Street Page 4 Yours very truly, LEA Consulting Ltd. Christopher Sidlar, M.Sc.Pl., MCIP, RPP Transportation Planner ;dc
42 APPENDIX B August and September Survey Counts for the intersection at John Street E and Queen s Parade/Niagara Parkway
43 LEA CONSULTING LTD 625 Cochrane Drive 9th Floor Markham, Ontario, L3R 9R9 Project No.: Location: Niagara Pkwy & John St E Weather: Cloudy AM, Light Showers PM Surveyor(s): Michael Loo File Name : Niagara&John-AM Site Code : Start Date : 22/8/217 Page No : 1 Groups Printed- Cars - Trucks - Buses Queen's Parade Southbound Ricardo Street Westbound Niagara Parkway Northbound John Street East Eastbound Start Time Left Thru Right Peds App. Total Left Thru Right Peds App. Total Left Thru Right Peds App. Total Left Thru Right Peds App. Total Int. Total 7: AM :15 AM :3 AM :45 AM Total : AM :15 AM :3 AM :45 AM Total Grand Total Apprch % Total % Cars % Cars Trucks % Trucks Buses % Buses Queen's Parade Out In Total Right Thru Left Peds John Street East Out In Total Left Thru Right Peds North 22/8/217 7: AM 22/8/217 8:45 AM Cars Trucks Buses Right Thru Left Peds Out In Total Ricardo Street Left Thru Right Peds Out In Total Niagara Parkway
44 LEA CONSULTING LTD 625 Cochrane Drive 9th Floor Markham, Ontario, L3R 9R9 Project No.: Location: Niagara Pkwy & John St E Weather: Cloudy AM, Light Showers PM Surveyor(s): Michael Loo File Name : Niagara&John-AM Site Code : Start Date : 22/8/217 Page No : 2 Queen's Parade Southbound Ricardo Street Westbound Niagara Parkway Northbound John Street East Eastbound Start Time Left Thru Right Peds App. Total Left Thru Right Peds App. Total Left Thru Right Peds App. Total Left Thru Right Peds App. Total Int. Total Peak Hour Analysis From 7: AM to 8:45 AM - Peak 1 of 1 Peak Hour for Entire Intersection Begins at 8: AM 8: AM :15 AM :3 AM :45 AM Total Volume % App. Total PHF Cars % Cars Trucks % Trucks Buses % Buses Queen's Parade Out In Total Right Thru Left Peds Peak Hour Data John Street East Out In Total Left 5 5 Thru Right Peds 3 3 North Peak Hour Begins at 8: AM Cars Trucks Buses Right Thru Left Peds Out In Total Ricardo Street Left Thru Right Peds Out In Total Niagara Parkway
45 LEA CONSULTING LTD 625 Cochrane Drive 9th Floor Markham, Ontario, L3R 9R9 Project No.: Location: Niagara Pkwy & John St E Weather: Cloudy AM, Light Showers PM Surveyor(s): Michael Loo File Name : Niagara&John-PM Site Code : Start Date : 22/8/217 Page No : 1 Groups Printed- Cars - Trucks - Buses Queen's Parade Southbound Ricardo Street Westbound Niagara Parkway Northbound John Street East Eastbound Start Time Left Thru Right Peds App. Total Left Thru Right Peds App. Total Left Thru Right Peds App. Total Left Thru Right Peds App. Total Int. Total 4: PM :15 PM :3 PM :45 PM Total : PM :15 PM :3 PM :45 PM Total Grand Total Apprch % Total % Cars % Cars Trucks % Trucks Buses % Buses Queen's Parade Out In Total Right Thru Left Peds John Street East Out In Total Left Thru Right Peds 3 3 North 22/8/217 4: PM 22/8/217 5:45 PM Cars Trucks Buses Right Thru Left Peds Out In Total Ricardo Street Left Thru Right Peds Out In Total Niagara Parkway
46 LEA CONSULTING LTD 625 Cochrane Drive 9th Floor Markham, Ontario, L3R 9R9 Project No.: Location: Niagara Pkwy & John St E Weather: Cloudy AM, Light Showers PM Surveyor(s): Michael Loo File Name : Niagara&John-PM Site Code : Start Date : 22/8/217 Page No : 2 Queen's Parade Southbound Ricardo Street Westbound Niagara Parkway Northbound John Street East Eastbound Start Time Left Thru Right Peds App. Total Left Thru Right Peds App. Total Left Thru Right Peds App. Total Left Thru Right Peds App. Total Int. Total Peak Hour Analysis From 4: PM to 5:45 PM - Peak 1 of 1 Peak Hour for Entire Intersection Begins at 4: PM 4: PM :15 PM :3 PM :45 PM Total Volume % App. Total PHF Cars % Cars Trucks % Trucks Buses % Buses Queen's Parade Out In Total Right Thru Left Peds Peak Hour Data John Street East Out In Total Left Thru Right Peds North Peak Hour Begins at 4: PM Cars Trucks Buses Right Thru Left Peds Out In Total Ricardo Street Left Thru Right Peds Out In Total Niagara Parkway
47 LEA CONSULTING LTD 625 Cochrane Drive 9th Floor Markham, Ontario, L3R 9R9 Project No.: Location: Weather: Surveyor(s): File Name : NiagaraPkwy&John-Midday Site Code : Start Date : 16/9/217 Page No : 1 Groups Printed- Cars - Trucks - Buses Queen's Parade Southbound Ricardo Street Westbound Niagara Parkway Northbound John Street East Eastbound Start Time Left Thru Right Peds App. Total Left Thru Right Peds App. Total Left Thru Right Peds App. Total Left Thru Right Peds App. Total Int. Total 11: AM :15 AM :3 AM :45 AM Total : PM :15 PM :3 PM :45 PM Total Grand Total Apprch % Total % Cars % Cars Trucks % Trucks Buses % Buses Queen's Parade Out In Total Right Thru Left Peds John Street East Out In Total Left Thru Right 12 Peds North 16/9/217 11: AM 16/9/217 12:45 PM Cars Trucks Buses Right Thru Left Peds Out In Total Ricardo Street Left Thru Right Peds Out In Total Niagara Parkway
48 LEA CONSULTING LTD 625 Cochrane Drive 9th Floor Markham, Ontario, L3R 9R9 Project No.: Location: Weather: Surveyor(s): File Name : NiagaraPkwy&John-Midday Site Code : Start Date : 16/9/217 Page No : 2 Queen's Parade Southbound Ricardo Street Westbound Niagara Parkway Northbound John Street East Eastbound Start Time Left Thru Right Peds App. Total Left Thru Right Peds App. Total Left Thru Right Peds App. Total Left Thru Right Peds App. Total Int. Total Peak Hour Analysis From 11: AM to 12:45 PM - Peak 1 of 1 Peak Hour for Entire Intersection Begins at 12: PM 12: PM :15 PM :3 PM :45 PM Total Volume % App. Total PHF Cars % Cars Trucks % Trucks Buses % Buses Queen's Parade Out In Total Right Thru Left Peds Peak Hour Data John Street East Out In Total Left Thru Right 63 Peds North Peak Hour Begins at 12: PM Cars Trucks Buses Right Thru Left Peds Out In Total Ricardo Street Left 7 7 Thru Right Peds Out In Total Niagara Parkway
49 LEA CONSULTING LTD 625 Cochrane Drive 9th Floor Markham, Ontario, L3R 9R9 Project No.: Location: Weather: Surveyor(s): File Name : NiagaraPkwy&John-PM Site Code : Start Date : 16/9/217 Page No : 1 Groups Printed- Cars - Trucks - Buses Queen's Parade Southbound Ricardo Street Westbound Niagara Parkway Northbound John Street East Eastbound Start Time Left Thru Right Peds App. Total Left Thru Right Peds App. Total Left Thru Right Peds App. Total Left Thru Right Peds App. Total Int. Total 4: PM :15 PM :3 PM :45 PM Total : PM :15 PM :3 PM :45 PM Total Grand Total Apprch % Total % Cars % Cars Trucks % Trucks Buses % Buses Queen's Parade Out In Total Right Thru Left Peds John Street East Out In Total Left Thru Right 88 Peds North 16/9/217 4: PM 16/9/217 5:45 PM Cars Trucks Buses Right Thru Left Peds Out In Total Ricardo Street Left Thru Right Peds Out In Total Niagara Parkway
50 LEA CONSULTING LTD 625 Cochrane Drive 9th Floor Markham, Ontario, L3R 9R9 Project No.: Location: Weather: Surveyor(s): File Name : NiagaraPkwy&John-PM Site Code : Start Date : 16/9/217 Page No : 2 Queen's Parade Southbound Ricardo Street Westbound Niagara Parkway Northbound John Street East Eastbound Start Time Left Thru Right Peds App. Total Left Thru Right Peds App. Total Left Thru Right Peds App. Total Left Thru Right Peds App. Total Int. Total Peak Hour Analysis From 4: PM to 5:45 PM - Peak 1 of 1 Peak Hour for Entire Intersection Begins at 4: PM 4: PM :15 PM :3 PM :45 PM Total Volume % App. Total PHF Cars % Cars Trucks % Trucks Buses % Buses Queen's Parade Out In Total Right Thru Left Peds Peak Hour Data John Street East Out In Total Left Thru Right 49 Peds North Peak Hour Begins at 4: PM Cars Trucks Buses Right Thru Left Peds Out In Total Ricardo Street Left Thru Right Peds Out In Total Niagara Parkway
51 LEA CONSULTING LTD 625 Cochrane Drive 9th Floor Markham, Ontario, L3R 9R9 Project No.: Location: Niagara Pkwy & John St E Weather: Sunny Surveyor(s): Ashok Panda File Name : NiagaraPkwy&John-AM Site Code : Start Date : 19/9/217 Page No : 1 Groups Printed- Cars - Trucks - Buses Queen's Parade Southbound Ricardo Street Westbound Niagara Parkway Northbound john Street East Eastbound Start Time Left Thru Right Peds App. Total Left Thru Right Peds App. Total Left Thru Right Peds App. Total Left Thru Right Peds App. Total Int. Total 7: AM :15 AM :3 AM :45 AM Total : AM :15 AM :3 AM :45 AM Total Grand Total Apprch % Total % Cars % Cars Trucks % Trucks Buses % Buses Queen's Parade Out In Total Right Thru Left Peds john Street East Out In Total Left Thru Right Peds 9 9 North 19/9/217 7: AM 19/9/217 8:45 AM Cars Trucks Buses Right Thru Left Peds Out In Total Ricardo Street Left Thru Right Peds Out In Total Niagara Parkway
52 LEA CONSULTING LTD 625 Cochrane Drive 9th Floor Markham, Ontario, L3R 9R9 Project No.: Location: Niagara Pkwy & John St E Weather: Sunny Surveyor(s): Ashok Panda File Name : NiagaraPkwy&John-AM Site Code : Start Date : 19/9/217 Page No : 2 Queen's Parade Southbound Ricardo Street Westbound Niagara Parkway Northbound john Street East Eastbound Start Time Left Thru Right Peds App. Total Left Thru Right Peds App. Total Left Thru Right Peds App. Total Left Thru Right Peds App. Total Int. Total Peak Hour Analysis From 7: AM to 8:45 AM - Peak 1 of 1 Peak Hour for Entire Intersection Begins at 8: AM 8: AM :15 AM :3 AM :45 AM Total Volume % App. Total PHF Cars % Cars Trucks % Trucks Buses % Buses Queen's Parade Out In Total Right Thru Left Peds Peak Hour Data Total john Street East Out In Left 6 6 Thru Right Peds 8 8 North Peak Hour Begins at 8: AM Cars Trucks Buses Right Thru Left Peds Out In Total Ricardo Street Left Thru Right Peds Out In Total Niagara Parkway
53 LEA CONSULTING LTD 625 Cochrane Drive 9th Floor Markham, Ontario, L3R 9R9 Project No.: Location: Niagara Pkwy & John St E Weather: Sunny Surveyor(s): Ashok Panda File Name : NiagaraPkwy&John-PM Site Code : Start Date : 19/9/217 Page No : 1 Groups Printed- Cars - Trucks - Buses Queen's Parade Southbound Ricardo Street Westbound Niagara Parkway Northbound john Street East Eastbound Start Time Left Thru Right Peds App. Total Left Thru Right Peds App. Total Left Thru Right Peds App. Total Left Thru Right Peds App. Total Int. Total 4: PM :15 PM :3 PM :45 PM Total : PM :15 PM :3 PM :45 PM Total Grand Total Apprch % Total % Cars % Cars Trucks % Trucks Buses % Buses Queen's Parade Out In Total Right Thru Left Peds john Street East Out In Total Left 7 7 Thru Right Peds 5 5 North 19/9/217 4: PM 19/9/217 5:45 PM Cars Trucks Buses Right Thru Left Peds Out In Total Ricardo Street Left Thru Right Peds Out In Total Niagara Parkway
54 LEA CONSULTING LTD 625 Cochrane Drive 9th Floor Markham, Ontario, L3R 9R9 Project No.: Location: Niagara Pkwy & John St E Weather: Sunny Surveyor(s): Ashok Panda File Name : NiagaraPkwy&John-PM Site Code : Start Date : 19/9/217 Page No : 2 Queen's Parade Southbound Ricardo Street Westbound Niagara Parkway Northbound john Street East Eastbound Start Time Left Thru Right Peds App. Total Left Thru Right Peds App. Total Left Thru Right Peds App. Total Left Thru Right Peds App. Total Int. Total Peak Hour Analysis From 4: PM to 5:45 PM - Peak 1 of 1 Peak Hour for Entire Intersection Begins at 4:15 PM 4:15 PM :3 PM :45 PM : PM Total Volume % App. Total PHF Cars % Cars Trucks % Trucks Buses % Buses Queen's Parade Out In Total Right Thru 5 5 Left Peds Peak Hour Data john Street East Out In Total Left 4 4 Thru Right Peds 4 4 North Peak Hour Begins at 4:15 PM Cars Trucks Buses Right Thru Left Peds Out In Total Ricardo Street Left Thru Right Peds Out In Total Niagara Parkway
55 APPENDIX C Existing Traffic Conditions
56 HCM Unsignalized Intersection Capacity Analysis Existing Traffic Conditions 3: Niagara Parkway/Queens Parade & John St E Weekday AM Peak Hour Movement EBL EBT EBR WBL WBT WBR NBL NBT NBR SBL SBT Traffic Volume (veh/h) Future Volume (Veh/h) Sign Control Stop Stop Free Grade % % % Peak Hour Factor Hourly flow rate (vph) Median type None vc, conflicting volume vcu, unblocked vol tc, single (s) tc, 2 stage (s) tf (s) p queue free % cm capacity (veh/h) vc2, stage 2 conf vol None % Free.92 SBR Direction, Lane # EB 1 WB 1 NB 1 SB 1 Volume Total Volume Left Volume Right csh Volume to Capacity Queue Length 95th (m) Control Delay (s) Lane LOS A B A A Approach Delay (s) Approach LOS A B Average Delay 2.4 Intersection Capacity Utilization 27.7% ICU Level of Service A F:\18145\Traffic\Synchro\EXAM.syn Synchro 9 Report 1/3/217 Page 1 HCM Unsignalized Intersection Capacity Analysis Existing Traffic Conditions 6: Two Sisters Vineyard & John St E Weekday AM Peak Hour Movement EBT EBR WBL WBT NBL NBR Traffic Volume (veh/h) Future Volume (Veh/h) Sign Control Free Free Stop Grade % % % Peak Hour Factor Hourly flow rate (vph) Median type None None vc, conflicting volume vc2, stage 2 conf vol vcu, unblocked vol tc, single (s) tc, 2 stage (s) tf (s) p queue free % cm capacity (veh/h) Direction, Lane # EB 1 WB 1 NB 1 Volume Total Volume Left 2 1 Volume Right csh Volume to Capacity.2.. Queue Length 95th (m)... Control Delay (s) Lane LOS A A Approach Delay (s) Approach LOS A Average Delay.4 Intersection Capacity Utilization 13.3% ICU Level of Service A F:\18145\Traffic\Synchro\EXAM.syn Synchro 9 Report 1/3/217 Page 2
57 HCM Unsignalized Intersection Capacity Analysis Existing Traffic Conditions 8: Peller Estates Winery & John St E Weekday AM Peak Hour Movement EBT EBR WBL WBT NBL NBR Traffic Volume (veh/h) Future Volume (Veh/h) Sign Control Free Free Stop Grade % % % Peak Hour Factor Hourly flow rate (vph) Median type None None vc, conflicting volume vc2, stage 2 conf vol vcu, unblocked vol tc, single (s) tc, 2 stage (s) tf (s) p queue free % cm capacity (veh/h) Direction, Lane # EB 1 WB 1 NB 1 Volume Total Volume Left 2 1 Volume Right 3 csh Volume to Capacity.2.. Queue Length 95th (m)... Control Delay (s) Lane LOS A A Approach Delay (s) Approach LOS A Average Delay.4 Intersection Capacity Utilization 13.3% ICU Level of Service A F:\18145\Traffic\Synchro\EXAM.syn Synchro 9 Report 1/3/217 Page 3 HCM Unsignalized Intersection Capacity Analysis Existing Traffic Conditions 11: Charlotte St & John St E Weekday AM Peak Hour Movement EBL EBT EBR WBL WBT WBR NBL NBT NBR SBL SBT SBR Traffic Volume (veh/h) Future Volume (Veh/h) Sign Control Free Free Stop Stop Grade % % % % Peak Hour Factor Hourly flow rate (vph) Median type None None vc, conflicting volume vc2, stage 2 conf vol vcu, unblocked vol tc, single (s) tc, 2 stage (s) tf (s) p queue free % cm capacity (veh/h) Direction, Lane # EB 1 WB 1 NB 1 SB 1 Volume Total Volume Left Volume Right csh Volume to Capacity...7. Queue Length 95th (m) Control Delay (s) Lane LOS A A A A Approach Delay (s) Approach LOS A A Average Delay 5. Intersection Capacity Utilization 2.1% ICU Level of Service A F:\18145\Traffic\Synchro\EXAM.syn Synchro 9 Report 1/3/217 Page 4
58 HCM Unsignalized Intersection Capacity Analysis Existing Traffic Conditions 13: Charlotte St & Paffard St/Weatherstone Crt Weekday AM Peak Hour Movement EBL EBT EBR WBL WBT WBR NBL NBT NBR SBL SBT Traffic Volume (veh/h) Future Volume (Veh/h) Sign Control Stop Stop Free Grade % % % Peak Hour Factor Hourly flow rate (vph) Median type None vc, conflicting volume vcu, unblocked vol tc, single (s) tc, 2 stage (s) tf (s) p queue free % cm capacity (veh/h) vc2, stage 2 conf vol None % Free.92 SBR Direction, Lane # EB 1 WB 1 NB 1 SB 1 Volume Total Volume Left Volume Right 1 csh Volume to Capacity...1. Queue Length 95th (m) Control Delay (s) Lane LOS A A A A Approach Delay (s) Approach LOS A A Average Delay 1.4 Intersection Capacity Utilization 14.4% ICU Level of Service A F:\18145\Traffic\Synchro\EXAM.syn Synchro 9 Report 1/3/217 Page 5 HCM Unsignalized Intersection Capacity Analysis Existing Traffic Conditions 16: Site Access 2 & John St E Weekday AM Peak Hour Movement EBT EBR WBL WBT NBL NBR Traffic Volume (veh/h) Future Volume (Veh/h) Sign Control Free Free Stop Grade % % % Peak Hour Factor Hourly flow rate (vph) Median type None None vc, conflicting volume vc2, stage 2 conf vol vcu, unblocked vol tc, single (s) tc, 2 stage (s) tf (s) p queue free % cm capacity (veh/h) Direction, Lane # EB 1 WB 1 Volume Total Volume Left Volume Right csh Volume to Capacity.2. Queue Length 95th (m).. Control Delay (s).. Lane LOS Approach Delay (s).. Approach LOS Average Delay. Intersection Capacity Utilization 13.3% ICU Level of Service A F:\18145\Traffic\Synchro\EXAM.syn Synchro 9 Report 1/3/217 Page 6
59 HCM Unsignalized Intersection Capacity Analysis Existing Traffic Conditions 18: Site Access 1 & John St E Weekday AM Peak Hour Movement EBT EBR WBL WBT NBL NBR Traffic Volume (veh/h) Future Volume (Veh/h) Sign Control Free Free Stop Grade % % % Peak Hour Factor Hourly flow rate (vph) Median type None None vc, conflicting volume vc2, stage 2 conf vol vcu, unblocked vol tc, single (s) tc, 2 stage (s) tf (s) p queue free % cm capacity (veh/h) Direction, Lane # EB 1 WB 1 NB 1 Volume Total Volume Left Volume Right csh Volume to Capacity.2.. Queue Length 95th (m)... Control Delay (s)... Lane LOS A Approach Delay (s)... Approach LOS A Average Delay. Intersection Capacity Utilization 6.7% ICU Level of Service A F:\18145\Traffic\Synchro\EXAM.syn Synchro 9 Report 1/3/217 Page 7 HCM Unsignalized Intersection Capacity Analysis Existing Traffic Conditions 23: King St & John St E Weekday AM Peak Hour Movement EBL EBT EBR WBL WBT WBR NBL NBT NBR SBL SBT SBR Sign Control Stop Stop Stop Stop Traffic Volume (vph) Future Volume (vph) Peak Hour Factor Hourly flow rate (vph) Direction, Lane # EB 1 WB 1 NB 1 SB 1 Volume Total (vph) Volume Left (vph) Volume Right (vph) Hadj (s) Departure Headway (s) Degree Utilization, x Capacity (veh/h) Control Delay (s) Approach Delay (s) Approach LOS A A A A Delay 7.5 Level of Service A Intersection Capacity Utilization 18.% ICU Level of Service A F:\18145\Traffic\Synchro\EXAM.syn Synchro 9 Report 1/3/217 Page 8
60 HCM Unsignalized Intersection Capacity Analysis Existing Traffic Conditions 27: Niagara St & Charlotte St Weekday AM Peak Hour Movement EBL EBT WBT WBR SBL SBR Sign Control Stop Stop Stop Traffic Volume (vph) Future Volume (vph) Peak Hour Factor Hourly flow rate (vph) Direction, Lane # EB 1 WB 1 SB 1 Volume Total (vph) Volume Left (vph) 2 24 Volume Right (vph) 82 Hadj (s) Departure Headway (s) Degree Utilization, x Capacity (veh/h) Control Delay (s) Approach Delay (s) Approach LOS A A A Delay 7.3 Level of Service A Intersection Capacity Utilization 16.7% ICU Level of Service A F:\18145\Traffic\Synchro\EXAM.syn Synchro 9 Report 1/3/217 Page 9 HCM Unsignalized Intersection Capacity Analysis Existing Traffic Conditions 3: Site Access 3 & John St E Weekday AM Peak Hour Movement EBT EBR WBL WBT NBL NBR Traffic Volume (veh/h) Future Volume (Veh/h) Sign Control Free Free Stop Grade % % % Peak Hour Factor Hourly flow rate (vph) Median type None None vc, conflicting volume vc2, stage 2 conf vol vcu, unblocked vol tc, single (s) tc, 2 stage (s) tf (s) p queue free % cm capacity (veh/h) Direction, Lane # EB 1 WB 1 NB 1 Volume Total Volume Left Volume Right csh Volume to Capacity.2.. Queue Length 95th (m)... Control Delay (s)... Lane LOS A Approach Delay (s)... Approach LOS A Average Delay. Intersection Capacity Utilization 13.3% ICU Level of Service A F:\18145\Traffic\Synchro\EXAM.syn Synchro 9 Report 1/3/217 Page 1
61 HCM Unsignalized Intersection Capacity Analysis Existing Traffic Conditions 32: Charlotte St & Site Access 4 Weekday AM Peak Hour Movement WBL WBR NBT SBL SBT Traffic Volume (veh/h) Future Volume (Veh/h) Sign Control Stop Free Grade % % Peak Hour Factor Hourly flow rate (vph) Median type None vc, conflicting volume vcu, unblocked vol tc, single (s) tc, 2 stage (s) tf (s) p queue free % cm capacity (veh/h) vc2, stage 2 conf vol None % Free.92 NBR Direction, Lane # WB 1 NB 1 SB 1 Volume Total Volume Left Volume Right csh Volume to Capacity..5.1 Queue Length 95th (m)... Control Delay (s)... Lane LOS A Approach Delay (s)... Approach LOS A Average Delay. Intersection Capacity Utilization 7.4% ICU Level of Service A F:\18145\Traffic\Synchro\EXAM.syn Synchro 9 Report 1/3/217 Page 11 HCM Unsignalized Intersection Capacity Analysis Existing Traffic Conditions 3: Niagara Parkway/Queens Parade & John St E Weekday PM Peak Hour Movement EBL EBT EBR WBL WBT WBR NBL NBT NBR SBL SBT Traffic Volume (veh/h) Future Volume (Veh/h) Sign Control Stop Stop Free Grade % % % Peak Hour Factor Hourly flow rate (vph) Median type None vc, conflicting volume vcu, unblocked vol tc, single (s) tc, 2 stage (s) tf (s) p queue free % cm capacity (veh/h) vc2, stage 2 conf vol None % Free SBR Direction, Lane # EB 1 WB 1 NB 1 SB 1 Volume Total Volume Left Volume Right csh Volume to Capacity Queue Length 95th (m) Control Delay (s) Lane LOS B C A A Approach Delay (s) Approach LOS B C Average Delay 3.6 Intersection Capacity Utilization 45.1% ICU Level of Service A F:\18145\Traffic\Synchro\EXPM.syn Synchro 9 Report 1/4/217 Page 1
62 HCM Unsignalized Intersection Capacity Analysis Existing Traffic Conditions 6: Two Sisters Vineyard & John St E Weekday PM Peak Hour Movement EBT WBL WBT NBL NBR Traffic Volume (veh/h) Future Volume (Veh/h) Sign Control Free Free Grade % % Peak Hour Factor Hourly flow rate (vph) Median type None vc, conflicting volume vcu, unblocked vol tc, single (s) tc, 2 stage (s) tf (s) p queue free % cm capacity (veh/h) vc2, stage 2 conf vol None % Stop EBR Direction, Lane # EB 1 WB 1 NB 1 Volume Total Volume Left Volume Right 18 2 csh Volume to Capacity Queue Length 95th (m)..2.9 Control Delay (s) Lane LOS A A Approach Delay (s) Approach LOS A Average Delay 2.5 Intersection Capacity Utilization 2.% ICU Level of Service A F:\18145\Traffic\Synchro\EXPM.syn Synchro 9 Report 1/4/217 Page 2 HCM Unsignalized Intersection Capacity Analysis Existing Traffic Conditions 8: Peller Estates Winery & John St E Weekday PM Peak Hour Movement EBT WBL WBT NBL NBR Traffic Volume (veh/h) Future Volume (Veh/h) Sign Control Free Free Grade % % Peak Hour Factor Hourly flow rate (vph) Median type None vc, conflicting volume vcu, unblocked vol tc, single (s) tc, 2 stage (s) tf (s) p queue free % cm capacity (veh/h) vc2, stage 2 conf vol None % Stop EBR Direction, Lane # EB 1 WB 1 NB 1 Volume Total Volume Left Volume Right csh Volume to Capacity Queue Length 95th (m) Control Delay (s) Lane LOS A A Approach Delay (s) Approach LOS A Average Delay 2.7 Intersection Capacity Utilization 2.% ICU Level of Service A F:\18145\Traffic\Synchro\EXPM.syn Synchro 9 Report 1/4/217 Page 3
63 HCM Unsignalized Intersection Capacity Analysis Existing Traffic Conditions 11: Charlotte St & John St E Weekday PM Peak Hour Movement EBL EBT EBR WBL WBT WBR NBL NBT NBR SBL SBT SBR Traffic Volume (veh/h) Future Volume (Veh/h) Sign Control Free Free Stop Stop Grade % % % % Peak Hour Factor Hourly flow rate (vph) Median type None None vc, conflicting volume vc2, stage 2 conf vol vcu, unblocked vol tc, single (s) tc, 2 stage (s) tf (s) p queue free % cm capacity (veh/h) Direction, Lane # EB 1 WB 1 NB 1 SB 1 Volume Total Volume Left Volume Right csh Volume to Capacity Queue Length 95th (m) Control Delay (s) Lane LOS A A A A Approach Delay (s) Approach LOS A A Average Delay 2.7 Intersection Capacity Utilization 24.8% ICU Level of Service A F:\18145\Traffic\Synchro\EXPM.syn Synchro 9 Report 1/4/217 Page 4 HCM Unsignalized Intersection Capacity Analysis Existing Traffic Conditions 13: Charlotte St & Paffard St/Weatherstone Crt Weekday PM Peak Hour Movement EBL EBT EBR WBL WBT WBR NBL NBT NBR SBL SBT Traffic Volume (veh/h) Future Volume (Veh/h) Sign Control Stop Stop Free Grade % % % Peak Hour Factor Hourly flow rate (vph) Median type None vc, conflicting volume vcu, unblocked vol tc, single (s) tc, 2 stage (s) tf (s) p queue free % cm capacity (veh/h) vc2, stage 2 conf vol None % Free.92 SBR Direction, Lane # EB 1 WB 1 NB 1 SB 1 Volume Total Volume Left Volume Right csh Volume to Capacity.1... Queue Length 95th (m) Control Delay (s) Lane LOS A A A Approach Delay (s) Approach LOS A A Average Delay 1.4 Intersection Capacity Utilization 17.2% ICU Level of Service A F:\18145\Traffic\Synchro\EXPM.syn Synchro 9 Report 1/4/217 Page 5
64 HCM Unsignalized Intersection Capacity Analysis Existing Traffic Conditions 16: Site Access 2 & John St E Weekday PM Peak Hour Movement EBT EBR WBL WBT NBL NBR Traffic Volume (veh/h) Future Volume (Veh/h) Sign Control Free Free Stop Grade % % % Peak Hour Factor Hourly flow rate (vph) Median type None None vc, conflicting volume vc2, stage 2 conf vol vcu, unblocked vol tc, single (s) tc, 2 stage (s) tf (s) p queue free % cm capacity (veh/h) Direction, Lane # EB 1 WB 1 Volume Total Volume Left Volume Right csh Volume to Capacity.4. Queue Length 95th (m).. Control Delay (s).. Lane LOS Approach Delay (s).. Approach LOS Average Delay. Intersection Capacity Utilization 13.4% ICU Level of Service A F:\18145\Traffic\Synchro\EXPM.syn Synchro 9 Report 1/4/217 Page 6 HCM Unsignalized Intersection Capacity Analysis Existing Traffic Conditions 18: Site Access 1 & John St E Weekday PM Peak Hour Movement EBT EBR WBL WBT NBL NBR Traffic Volume (veh/h) Future Volume (Veh/h) Sign Control Free Free Stop Grade % % % Peak Hour Factor Hourly flow rate (vph) Median type None None vc, conflicting volume vc2, stage 2 conf vol vcu, unblocked vol tc, single (s) tc, 2 stage (s) tf (s) p queue free % cm capacity (veh/h) Direction, Lane # EB 1 WB 1 NB 1 Volume Total Volume Left Volume Right csh Volume to Capacity.4.. Queue Length 95th (m)... Control Delay (s)... Lane LOS A Approach Delay (s)... Approach LOS A Average Delay. Intersection Capacity Utilization 6.8% ICU Level of Service A F:\18145\Traffic\Synchro\EXPM.syn Synchro 9 Report 1/4/217 Page 7
65 HCM Unsignalized Intersection Capacity Analysis Existing Traffic Conditions 23: King St & John St E Weekday PM Peak Hour Movement EBL EBT EBR WBL WBT WBR NBL NBT NBR SBL SBT SBR Sign Control Stop Stop Stop Stop Traffic Volume (vph) Future Volume (vph) Peak Hour Factor Hourly flow rate (vph) Direction, Lane # EB 1 WB 1 NB 1 SB 1 Volume Total (vph) Volume Left (vph) Volume Right (vph) Hadj (s) Departure Headway (s) Degree Utilization, x Capacity (veh/h) Control Delay (s) Approach Delay (s) Approach LOS A A A A Delay 8.3 Level of Service A Intersection Capacity Utilization 29.2% ICU Level of Service A F:\18145\Traffic\Synchro\EXPM.syn Synchro 9 Report 1/4/217 Page 8 HCM Unsignalized Intersection Capacity Analysis Existing Traffic Conditions 27: Niagara St & Charlotte St Weekday PM Peak Hour Movement EBL EBT WBT WBR SBL SBR Sign Control Stop Stop Stop Traffic Volume (vph) Future Volume (vph) Peak Hour Factor Hourly flow rate (vph) Direction, Lane # EB 1 WB 1 SB 1 Volume Total (vph) Volume Left (vph) 75 Volume Right (vph) 51 3 Hadj (s) Departure Headway (s) Degree Utilization, x Capacity (veh/h) Control Delay (s) Approach Delay (s) Approach LOS A A A Delay 7.7 Level of Service A Intersection Capacity Utilization 16.6% ICU Level of Service A F:\18145\Traffic\Synchro\EXPM.syn Synchro 9 Report 1/4/217 Page 9
66 HCM Unsignalized Intersection Capacity Analysis Existing Traffic Conditions 3: Site Access 3 & John St E Weekday PM Peak Hour Movement EBT EBR WBL WBT NBL NBR Traffic Volume (veh/h) Future Volume (Veh/h) Sign Control Free Free Stop Grade % % % Peak Hour Factor Hourly flow rate (vph) Median type None None vc, conflicting volume vc2, stage 2 conf vol vcu, unblocked vol tc, single (s) tc, 2 stage (s) tf (s) p queue free % cm capacity (veh/h) Direction, Lane # EB 1 WB 1 NB 1 Volume Total Volume Left Volume Right csh Volume to Capacity.4.. Queue Length 95th (m)... Control Delay (s)... Lane LOS A Approach Delay (s)... Approach LOS A Average Delay. Intersection Capacity Utilization 13.4% ICU Level of Service A F:\18145\Traffic\Synchro\EXPM.syn Synchro 9 Report 1/4/217 Page 1 HCM Unsignalized Intersection Capacity Analysis Existing Traffic Conditions 32: Charlotte St & Site Access 4 Weekday PM Peak Hour Movement WBL WBR NBT SBL SBT Traffic Volume (veh/h) Future Volume (Veh/h) Sign Control Stop Free Grade % % Peak Hour Factor Hourly flow rate (vph) Median type None vc, conflicting volume vcu, unblocked vol tc, single (s) tc, 2 stage (s) tf (s) p queue free % cm capacity (veh/h) vc2, stage 2 conf vol None % Free.92 NBR Direction, Lane # WB 1 NB 1 SB 1 Volume Total Volume Left Volume Right csh Volume to Capacity..3.5 Queue Length 95th (m)... Control Delay (s)... Lane LOS A Approach Delay (s)... Approach LOS A Average Delay. Intersection Capacity Utilization 7.1% ICU Level of Service A F:\18145\Traffic\Synchro\EXPM.syn Synchro 9 Report 1/4/217 Page 11
67 HCM Unsignalized Intersection Capacity Analysis Existing Traffic Conditions 3: Niagara Parkway/Queens Parade & John St E Saturday Peak Hour Movement EBL EBT EBR WBL WBT WBR NBL NBT NBR SBL SBT Traffic Volume (veh/h) Future Volume (Veh/h) Sign Control Stop Stop Free Grade % % % Peak Hour Factor Hourly flow rate (vph) Median type None vc, conflicting volume vcu, unblocked vol tc, single (s) tc, 2 stage (s) tf (s) p queue free % cm capacity (veh/h) vc2, stage 2 conf vol None % Free SBR Direction, Lane # EB 1 WB 1 NB 1 SB 1 Volume Total Volume Left Volume Right csh Volume to Capacity Queue Length 95th (m) Control Delay (s) Lane LOS C F A A Approach Delay (s) Approach LOS C F Average Delay 15.5 Intersection Capacity Utilization 74.7% ICU Level of Service D F:\18145\Traffic\Synchro\EXSAT.syn Synchro 9 Report 9/28/217 Page 1 HCM Unsignalized Intersection Capacity Analysis Existing Traffic Conditions 6: Two Sisters Vineyard & John St E Saturday Peak Hour Movement EBT WBL WBT NBL NBR Traffic Volume (veh/h) Future Volume (Veh/h) Sign Control Free Free Grade % % Peak Hour Factor Hourly flow rate (vph) Median type None vc, conflicting volume vcu, unblocked vol tc, single (s) tc, 2 stage (s) tf (s) p queue free % cm capacity (veh/h) vc2, stage 2 conf vol None % Stop EBR Direction, Lane # EB 1 WB 1 NB 1 Volume Total Volume Left Volume Right csh Volume to Capacity Queue Length 95th (m) Control Delay (s) Lane LOS A A Approach Delay (s) Approach LOS A Average Delay 3.7 Intersection Capacity Utilization 26.4% ICU Level of Service A F:\18145\Traffic\Synchro\EXSAT.syn Synchro 9 Report 9/28/217 Page 2
68 HCM Unsignalized Intersection Capacity Analysis Existing Traffic Conditions 8: Peller Estates Winery & John St E Saturday Peak Hour Movement EBT WBL WBT NBL NBR Traffic Volume (veh/h) Future Volume (Veh/h) Sign Control Free Free Grade % % Peak Hour Factor Hourly flow rate (vph) Median type None vc, conflicting volume vcu, unblocked vol tc, single (s) tc, 2 stage (s) tf (s) p queue free % cm capacity (veh/h) vc2, stage 2 conf vol None % Stop EBR Direction, Lane # EB 1 WB 1 NB 1 Volume Total Volume Left 27 7 Volume Right csh Volume to Capacity Queue Length 95th (m) Control Delay (s) Lane LOS A B Approach Delay (s) Approach LOS B Average Delay 3.9 Intersection Capacity Utilization 31.% ICU Level of Service A F:\18145\Traffic\Synchro\EXSAT.syn Synchro 9 Report 9/28/217 Page 3 HCM Unsignalized Intersection Capacity Analysis Existing Traffic Conditions 11: Charlotte St & John St E Saturday Peak Hour Movement EBL EBT EBR WBL WBT NBL NBT NBR SBL SBT SBR Traffic Volume (veh/h) Future Volume (Veh/h) Sign Control Free Free Stop Grade % % % Peak Hour Factor Hourly flow rate (vph) Median type None vc, conflicting volume vcu, unblocked vol tc, single (s) tc, 2 stage (s) tf (s) p queue free % cm capacity (veh/h) vc2, stage 2 conf vol None % Stop WBR Direction, Lane # EB 1 WB 1 NB 1 SB 1 Volume Total Volume Left Volume Right csh Volume to Capacity Queue Length 95th (m) Control Delay (s) Lane LOS A A B A Approach Delay (s) Approach LOS B A Average Delay 2.9 Intersection Capacity Utilization 29.8% ICU Level of Service A F:\18145\Traffic\Synchro\EXSAT.syn Synchro 9 Report 9/28/217 Page 4
69 HCM Unsignalized Intersection Capacity Analysis Existing Traffic Conditions 13: Charlotte St & Paffard St/Weatherstone Crt Saturday Peak Hour Movement EBL EBT EBR WBL WBT WBR NBL NBT NBR SBL SBT Traffic Volume (veh/h) Future Volume (Veh/h) Sign Control Stop Stop Free Grade % % % Peak Hour Factor Hourly flow rate (vph) Median type None vc, conflicting volume vcu, unblocked vol tc, single (s) tc, 2 stage (s) tf (s) p queue free % cm capacity (veh/h) vc2, stage 2 conf vol None % Free.92 SBR Direction, Lane # EB 1 WB 1 NB 1 SB 1 Volume Total Volume Left 1 15 Volume Right 15 3 csh Volume to Capacity Queue Length 95th (m) Control Delay (s) Lane LOS A A A Approach Delay (s) Approach LOS A A Average Delay 1.6 Intersection Capacity Utilization 2.9% ICU Level of Service A F:\18145\Traffic\Synchro\EXSAT.syn Synchro 9 Report 9/28/217 Page 5 HCM Unsignalized Intersection Capacity Analysis Existing Traffic Conditions 16: Site Access 2 & John St E Saturday Peak Hour Movement EBT WBL WBT NBL NBR Traffic Volume (veh/h) Future Volume (Veh/h) Sign Control Free Free Grade % % Peak Hour Factor Hourly flow rate (vph) Median type None vc, conflicting volume vcu, unblocked vol tc, single (s) tc, 2 stage (s) tf (s) p queue free % cm capacity (veh/h) vc2, stage 2 conf vol None % Stop EBR Direction, Lane # EB 1 WB 1 Volume Total Volume Left Volume Right csh Volume to Capacity.8. Queue Length 95th (m).. Control Delay (s).. Lane LOS Approach Delay (s).. Approach LOS Average Delay. Intersection Capacity Utilization 16.6% ICU Level of Service A F:\18145\Traffic\Synchro\EXSAT.syn Synchro 9 Report 9/28/217 Page 6
70 HCM Unsignalized Intersection Capacity Analysis Existing Traffic Conditions 18: Site Access 1 & John St E Saturday Peak Hour Movement EBT WBL WBT NBL NBR Traffic Volume (veh/h) Future Volume (Veh/h) Sign Control Free Free Grade % % Peak Hour Factor Hourly flow rate (vph) Median type None vc, conflicting volume vcu, unblocked vol tc, single (s) tc, 2 stage (s) tf (s) p queue free % cm capacity (veh/h) vc2, stage 2 conf vol None % Stop EBR Direction, Lane # EB 1 WB 1 NB 1 Volume Total Volume Left Volume Right csh Volume to Capacity.8.. Queue Length 95th (m)... Control Delay (s)... Lane LOS A Approach Delay (s)... Approach LOS A Average Delay. Intersection Capacity Utilization 1.% ICU Level of Service A F:\18145\Traffic\Synchro\EXSAT.syn Synchro 9 Report 9/28/217 Page 7 HCM Unsignalized Intersection Capacity Analysis Existing Traffic Conditions 23: King St & John St E Saturday Peak Hour Movement EBL EBT EBR WBL WBT WBR NBL NBT NBR SBL SBT SBR Sign Control Stop Stop Stop Stop Traffic Volume (vph) Future Volume (vph) Peak Hour Factor Hourly flow rate (vph) A A A NB EB Delay 9.7 Level of Service A Intersection Capacity Utilization 38.2% ICU Level of Service A F:\18145\Traffic\Synchro\EXSAT.syn Synchro 9 Report 9/28/217 Page 8
71 HCM Unsignalized Intersection Capacity Analysis Existing Traffic Conditions 27: Niagara St & Charlotte St Saturday Peak Hour Movement EBL EBT WBT WBR SBL SBR Sign Control Stop Stop Stop Traffic Volume (vph) Future Volume (vph) Peak Hour Factor Hourly flow rate (vph) Direction, Lane # EB 1 WB 1 SB 1 Volume Total (vph) Volume Left (vph) 2 63 Volume Right (vph) 84 2 Hadj (s) Departure Headway (s) Degree Utilization, x Capacity (veh/h) Control Delay (s) Approach Delay (s) Approach LOS A A A Delay 8.1 Level of Service A Intersection Capacity Utilization 2.4% ICU Level of Service A F:\18145\Traffic\Synchro\EXSAT.syn Synchro 9 Report 9/28/217 Page 9 HCM Unsignalized Intersection Capacity Analysis Existing Traffic Conditions 3: Site Access 3 & John St E Saturday Peak Hour Movement EBT WBL WBT NBL NBR Traffic Volume (veh/h) Future Volume (Veh/h) Sign Control Free Free Grade % % Peak Hour Factor Hourly flow rate (vph) Median type None vc, conflicting volume vcu, unblocked vol tc, single (s) tc, 2 stage (s) tf (s) p queue free % cm capacity (veh/h) vc2, stage 2 conf vol None % Stop EBR Direction, Lane # EB 1 WB 1 NB 1 Volume Total Volume Left Volume Right csh Volume to Capacity.8.. Queue Length 95th (m)... Control Delay (s)... Lane LOS A Approach Delay (s)... Approach LOS A Average Delay. Intersection Capacity Utilization 16.6% ICU Level of Service A F:\18145\Traffic\Synchro\EXSAT.syn Synchro 9 Report 9/28/217 Page 1
72 HCM Unsignalized Intersection Capacity Analysis Existing Traffic Conditions 32: Charlotte St & Site Access 4 Saturday Peak Hour Movement WBL WBR NBT SBL SBT Traffic Volume (veh/h) 79 6 Future Volume (Veh/h) 79 6 Sign Control Stop Free Grade % % Peak Hour Factor Hourly flow rate (vph) Median type None vc, conflicting volume vcu, unblocked vol tc, single (s) tc, 2 stage (s) tf (s) p queue free % cm capacity (veh/h) vc2, stage 2 conf vol None % Free.92 NBR Direction, Lane # WB 1 NB 1 SB 1 Volume Total Volume Left Volume Right csh Volume to Capacity..5.4 Queue Length 95th (m)... Control Delay (s)... Lane LOS A Approach Delay (s)... Approach LOS A Average Delay. Intersection Capacity Utilization 7.5% ICU Level of Service A F:\18145\Traffic\Synchro\EXSAT.syn Synchro 9 Report 9/28/217 Page 11
73 APPENDIX D Pillar and Post TIS (3 June 216)

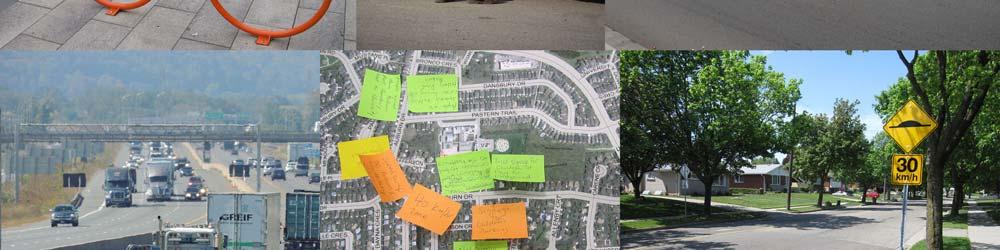
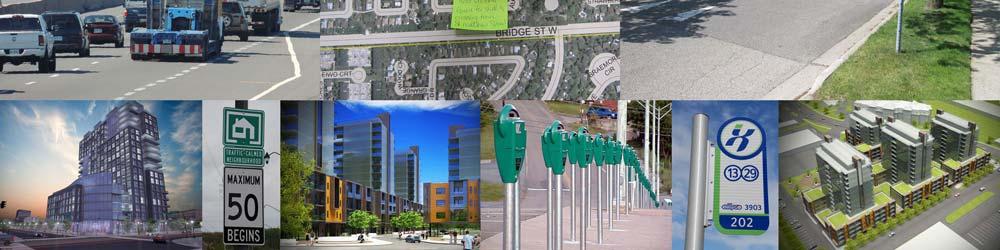

74 Pillar and Post, Niagara-on-the- Lake Traffic Impact Study Update Paradigm Transportation Solutions Limited June 216
75 Pillar and Post, Niagara-on-the-Lake Traffic Impact Study Update 1519 June Development Concept The existing Pillar and Post Inn includes a 122 room hotel, restaurant, spa, and meeting/event facilities located within one building structure on the north side of John Street West, west of King Street. A total of 79 parking spaces are provided on the existing Inn property, inclusive of 5 disabled parking spaces and 11 valet parking spaces. An additional 58 demarcated parking spaces are located in a parking lot on the subject lands. All of the existing land uses, except a 929 square metre (1, square foot) portion of the warehouse, will be removed in order to permit the redevelopment to go forward on this parcel. The redevelopment is proposed to include an 836 square metre (9, square foot) multipurpose building (The Garden Pavilion), two outdoor event spaces (north and south tents), gardens, a 929 square metre (1, square foot) two-storey administration building, and a two-level parking garage. The maximum occupancy for each event space within the redevelopment will be as follows: The Garden Pavilion: 2 persons; North event tent: 2 persons; and South event tent: 2 persons. Vehicular access to the redevelopment will be limited to parking garage access only via one all-turns connection to John Street West via the existing Regent Street right-of-way for the upper garage level and one all-turns private driveway connection to Anne Street for the lower garage level. An additional driveway connection to Anne Street will provide access to the nine parking stalls/service area adjacent to the multipurpose building. The overall site plan has been designed to meet the objective of the Town to create a pedestrian-oriented Town and more specifically, a pedestriancentric environment on John Street West between King Street and Regent Street. This is proposed via relocating parking away from the main travel portions of the roadways and into a parking structure, the use of various surface treatments, the installation of sidewalks along the limits of the site and provision of curb letdowns at the intersections of King Street and John Street West and John Street West and Regent Street. The existing transit stop located on the southwest corner of King Street and John Street West will be retained. The final location will be determined during final site plan design. The proposed site plan is shown in Figure Proposed Parking Provisions The existing 58 demarcated parking stalls located on the south side of John Street will be removed in order to permit the redevelopment to proceed. In Paradigm Transportation Solutions Limited Page 15
76 Pillar and Post, Niagara-on-the-Lake Traffic Impact Study Update 1519 June 216 order to accommodate the parking needs of the site, a two-level parking garage with a total of 243 stalls is proposed on the southwest portion of the redeveloped property. The upper level will have 125 stalls, including three disabled stalls. Access to the upper level is proposed via the existing Regent Street right-of-way south of John Street. The upper level stalls will primarily serve hotel patrons and event attendees at all times. The lower level will have 118 stalls, including five disabled stalls. Direct access to the lower level will be provided via a private driveway connection to Anne Street. The lower level stalls will primarily serve the employee and valet parking requirements during the week and the valet and event attendees/hotel patron parking requirements on the weekend when event activity is highest and employee parking requirements are at their lowest. Nine additional spaces are provided adjacent to the multipurpose building for use by service vehicles. 3.2 Existing and Future Site Activity This section outlines the existing event activity and future event activity and provides a comparison in order to determine the amount of additional traffic, if any, that will be generated by the site upon completion of the redevelopment Existing Event Activity During the summer season, the following typically occurs each Saturday: Two weddings are held in the Rose Garden; however, this could be as high as four on the busiest weekends; Each wedding is approximately 3 minutes in length and can occur during the following times: 12: PM to 1: PM; 1: PM to 2: PM; 2: PM to 3: PM; or 3: PM to 4: PM. These times are outside the peak hour of the adjacent streets (typically 4:15 PM to 5:15 PM); therefore, they contribute minimal traffic to the network during the peak hour of the adjacent street traffic. Attendance is usually between 75 and 15 persons per wedding; Some weddings have only the ceremony at the Inn while others have both the ceremony and reception at the Inn; Figure 3.1: Proposed Site Plan Paradigm Transportation Solutions Limited Page 16
77 Pillar and Post, Niagara-on-the-Lake Traffic Impact Study Update 1519 June 216 Wedding receptions typically occur begin around 6: PM and conclude at 11: PM; Approximately 3 percent of the wedding guests stay onsite at the hotel; An additional 25 percent of wedding guests stay at one of the other sister Vintage hotels within Niagara-on-the-Lake. Shuttle service is provided between the properties or some guests may walk between properties; and Event arrival and departure times are staggered which minimizes the potential for the wedding and reception spaces to be fully occupied at the same time Future Event Activity Based on site capacity and future market conditions, the following is expected to occur on a typical Saturday during the summer: The existing hotel activity is expected to remain static; The wedding ceremonies currently held in the Rose Garden will be relocated to the gardens on the south side of John Street West; The times available for the wedding ceremonies are not expected to change and will still occur between noon and 4: PM; A maximum of three receptions can be accommodated on-site at any given time (within the multi-purpose building and the two tents). The maximum attendance will be 2 persons per event space, or 6 total persons. The receptions will typically take place on Saturday evenings between 6: PM and 11: PM; Approximately 3 percent of the wedding guests will continue to stay onsite at the hotel; and An additional 25 percent of wedding guests will continue to stay one of the other sister hotels within Niagara-on-the-Lake with shuttle service provided between the properties. It is expected that for weddings that also have their reception at the Inn, guests will either remain onsite between the ceremony and reception or will use the provided shuttle service to return to their hotel or explore the Town in between the ceremony and reception Existing Staff Activity Currently about 38 number of staff working the afternoon shift on Saturday. These staff typically arrive about 3: PM and depart between 9: PM and 11: PM; therefore, they generate little to no traffic during the peak hour. The Administration building currently has about 8 staff members working Monday through Friday from about 9 AM to 5 PM. Four administration/ Paradigm Transportation Solutions Limited Page 17
78 Pillar and Post, Niagara-on-the-Lake Traffic Impact Study Update 1519 June 216 reservation staff work the afternoon shift on Saturdays from 3: PM to 11: PM; therefore, they typically generate no traffic during the peak hour Future Staff Activity The number of Saturday afternoon shift in-house staff is expected to increase by approximately 23, for a total of 61 staff, upon completion of the redevelopment. These staff members will typically arrive at approximately 3: PM and will depart at about 11: PM. The number of administration staff is expected to increase by about 2 persons, to 1, upon completion of the redevelopment. These additional staff members will predominantly work Monday through Friday from about 9: AM to 5: PM. One or two additional staff may work on a Saturday depending on event planning demands Existing Valet Parking Activity The peak times for valet parking demand are the 11: AM check-out time and the 3: PM check-in time. The number of guests using the valet parking service varies each weekend but is typically between 1 and 2 over the course of a typical Saturday Future Valet Parking Activity Since the number of rooms available at the Inn will not change with the redevelopment, the number of valet parking trips is not expected to change Existing Warehouse/Delivery Activity At present, trips to and from the warehouse are made on an as-needed basis and tend to be limited during events. Conservative estimates indicate that about five trips are made between the existing site and the warehouse on a typical Saturday during the peak hours of the study area intersections (3:45 PM to 5:15 PM). During a typical week, the Inn receives approximately five deliveries/ pickups for food, beverage, linen and garbage collection. Saturday deliveries/pickups do occasionally occur and are typically in the order of no more than two over the course of the day Future Warehouse Activity Since the warehouse trips are made on an as-needed basis, it is difficult to determine how many trips will be made on Saturday upon completion of the redevelopment. However, it is safe to assume that the number should remain static during the peak hours of the study area intersections. The number of Saturday deliveries/pickups to the Inn is expected to remain unchanged upon completion of the redevelopment. Paradigm Transportation Solutions Limited Page 18
79 Pillar and Post, Niagara-on-the-Lake Traffic Impact Study Update 1519 June Development Trip Generation In order to provide conservative estimates of the trips generated by the site upon completion of the redevelopment, the following was assumed: The three event spaces would be fully occupied at 2 persons each; The start of all three events would coincide with the peak hour of the study area intersections; One hundred percent of the event attendees would drive to the venue; Auto occupancy would be two persons per vehicle (for event attendees); 9 percent of the event trips would arrive during the peak hour and 1 percent would depart during the peak hour; A total of 2 inbound valet trips would be made during the peak hour; A total of 2 staff trips, 1 inbound and 1 outbound, were assumed to occur during the peak hour. (Although evening staff begin their shift at approximately 3: PM and should already be onsite, the additional trips were assigned to account for extra staff that may be required during periods of peak activity); and A total of 1 warehouse trips, five inbound and five outbound, would be made during the peak hour. The resulting trip generation is shown in Table 3.1 below and indicates that a total of 35 trips could be generated by the site during the Saturday peak hour in 223. TABLE 3.1: ESTIMATED SITE TRIP GENERATION Pillar and Post Inn In Out Total Saturday Peak Hour Event Space Valet 2 2 Staff Warehouse TOTAL Paradigm Transportation Solutions Limited Page 19
80 Pillar and Post, Niagara-on-the-Lake Traffic Impact Study Update 1519 June Development Trip Distribution and Assignment The trips were assigned to the roadway network based on the existing distribution of traffic within the study area as calculated using the existing Saturday peak hour volumes shown in Figure 2.4. The trip distribution is summarized in Table 3.2. TABLE 3.2: TRIP DISTRIBUTION The trip assignment was further refined based on the availability of parking at the site as follows: Route Direction Saturday Peak Hour Inbound Outbound John Street West 15% 13% East 21% 23% Regent Street North 3% 4% King Street North 39% 32% South 15% 22% Anne Street West 7% 6% Total 1% 1% 125 spaces on the upper level of the parking garage, accessed via the Regent Street right-of-way; 88 spaces on the lower level of the parking garage, accessed via Anne Street; 2 valet spaces on the lower level of the parking garage, accessed via Anne Street. All trips would be made between the valet spaces on the existing site and the parking garage via the King Street and John Street West and King Street and Anne Street intersections; 1 staff spaces on the lower level of the parking garage, accessed via Anne Street; All warehousing trips would utilize the Anne Street parking garage access. All trips would be made between the spaces on the parking lot on the west side of the existing site and the parking garage via the John Street West and Regent Street, King Street and John Street West and King Street and Anne Street intersections; 25 spaces on the west side of the existing Pillar and Post; and 38 spaces (not including disabled and valet spaces) on east side of the existing Pillar and Post. Note that this assignment assumed that the parking garage and lots had zero occupancy at the start of the peak hour. While this is highly unlikely, this approach to trip assignment was taken in order to provide a worst-case analyses of the site s impact to the surrounding roadway network. Paradigm Transportation Solutions Limited Page 2
81 Pillar and Post, Niagara-on-the-Lake Traffic Impact Study Update 1519 June 216 The resulting site generated trip assignment is shown in Figure 3.2. Detailed site trip assignments for each respective trip type is provided in Appendix C. Paradigm Transportation Solutions Limited Page 21
82 Pillar and Post, Niagara-on-the-Lake Traffic Impact Study Update 1519 June 216 Figure 3.2: Saturday Peak Hour Site-Generated Trip Assignment Paradigm Transportation Solutions Limited Page 22
83 Pillar and Post, Niagara-on-the-Lake Traffic Impact Study Update 1519 June Assessment of Future Traffic Conditions This section provides information regarding the background and future total traffic volumes and resulting analyses for the 223 horizon. The future traffic volumes in the vicinity of the development will likely consist of increased non-site traffic volumes (background traffic) and the traffic generated by the proposed development Background Traffic Growth General Background Traffic In order to derive the 223 background traffic volumes, a growth rate of 1. percent per annum compounded for eight years, for a total growth of 8.3 percent, was applied to the existing traffic volumes on John Street West, Anne Street and Regent Street. A growth rate of 1.2 percent per annum compounded for eight years, for a total growth of 1 percent, was applied to the existing traffic volumes on King Street. Note that these growth rate were provided by the Town during the pre-study consultation. The resulting 223 AM and PM peak our general background traffic volumes are shown in Figure 4.1. It should be noted that in order to remain conservative in the estimates of traffic that may be generated by the redevelopment, the existing trips generated by the site were not netted out before applying the general background traffic growth. This results in double-counting of trips with an origin or destination from/to this site; however, it helps to ensure that the worst-case scenario is analyzed Other Area Developments During the pre-study consultation with the Town, it was noted that there are two residential developments within the study area that are currently approved. The Town has asked for traffic from these developments to be included in the 223 background traffic forecasts over and above the general background traffic growth. The locations of the residential developments are shown in Figure 4.2 and information regarding each is as follows: Averton Square The Averton Square development is located at 12 John Street West. It is bounded by John Street West, Anne Street, Gate Street and Victoria Street. The development will include 2 single-family detached units and 94 apartment units. Paradigm Transportation Solutions Limited Page 23
84 Pillar and Post, Niagara-on-the-Lake Traffic Impact Study Update 1519 June 216 Figure 4.1: Volumes 223 Saturday Peak Hour General Background Traffic Paradigm Transportation Solutions Limited Page 24

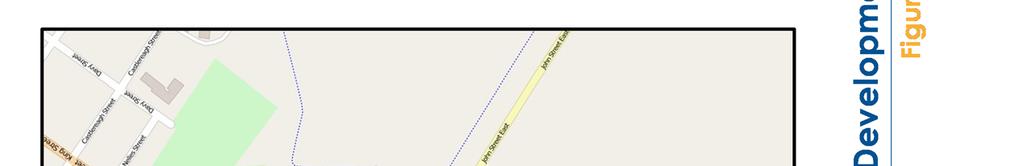
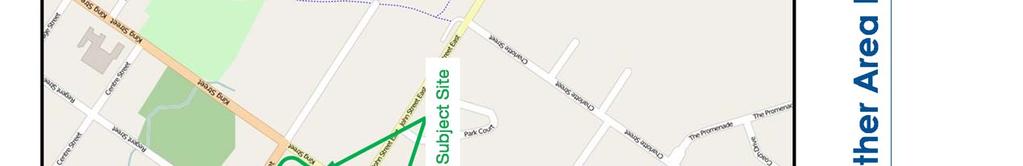

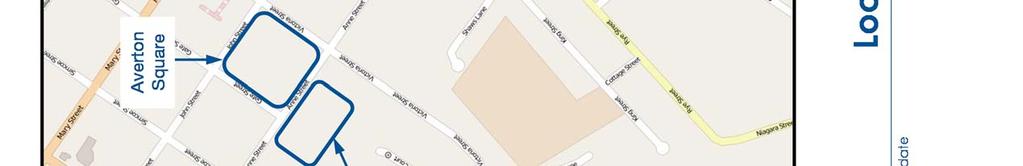
85 Pillar and Post, Niagara-on-the-Lake Traffic Impact Study Update 1519 June 216 Figure 4.2: Location of Other Area Developments Paradigm Transportation Solutions Limited Page 25
86 Pillar and Post, Niagara-on-the-Lake Traffic Impact Study Update 1519 June 216 Status: This development currently has Registered Subdivision and Site Plan Approval. Windsor Apartments The Windsor Apartments are located at 128, 134 and 174 Anne Street. The entrance will be located on Anne Street. The development will include 12 apartment units. Status: This development currently has Site Plan Approval. The trips generated by these developments for the Saturday peak hour were estimated using ITE LUC 21 Single Family Detached, LUC 22 Apartments, and LUC 23 Residential Townhouse / Condominium. The trips were assigned to the roadway network based on the same distribution and assumptions as the site-generated trips. The resulting other area Saturday peak hour development assignment of trips is provided in Figure 4.3. The area development traffic was added to the general background traffic to produce the resulting 223 Saturday peak hour total background traffic forecasts shown in Figure 4.4. Paradigm Transportation Solutions Limited Page 26
87 Pillar and Post, Niagara-on-the-Lake Traffic Impact Study Update 1519 June 216 Figure 4.3: Other Area Development Trip Assignment Paradigm Transportation Solutions Limited Page 27
88 Pillar and Post, Niagara-on-the-Lake Traffic Impact Study Update 1519 June 216 Figure 4.4: 223 Saturday Peak Hour Total Background Traffic Volumes Paradigm Transportation Solutions Limited Page 28
89 Pillar and Post, Niagara-on-the-Lake Traffic Impact Study Update 1519 June Background Traffic Operations Synchro 9 level of service analyses were conducted for the study area intersections using the 223 background traffic volumes illustrated in Figure 4.4. The 223 background traffic intersection operations are summarized in Table 4.1 indicating the Saturday peak hour levels of service (LOS), volume to capacity ratios (v/c) and 95 th percentile back of queue estimates (where appropriate). The following is noted from the analysis: The intersection of King Street and John Street West will continue to operate with acceptable levels of service on all approaches during the Saturday peak hour upon reaching the 223 background traffic volumes; and The intersection of John Street West and Regent Street will continue to operate with acceptable levels of service on all approaches during the Saturday peak hour upon reaching the 223 background traffic volumes; The intersection of King Street and Anne Street will continue to operate with acceptable levels of service on all approaches during the Saturday peak hour upon reaching the 223 background traffic volumes; and The intersection of Anne Street and Regent Street will continue to operate with acceptable levels of service on all approaches during the Saturday peak hour upon reaching the 223 background traffic volumes. Detailed Synchro reports are provided in Appendix D. Paradigm Transportation Solutions Limited Page 29
90 Pillar and Post, Niagara-on-the-Lake Traffic Impact Study Update 1519 June 216 TABLE 4.1: 223 BACKGROUND PEAK HOUR TRAFFIC OPERATIONS Analysis Period Intersection Control Type MOE Left Direction / Movement / Approach Eastbound Westbound Northbound Southbound Through Right Approach Left Through Right Approach Left Through Right Approach Left Through Right Approach Overall Saturday Peak Hour King Street & John Street West John Street West & Regent Street King Street & Anne Street Anne Street & Regent Street AWSC TWSC OWSC OWSC LOS < A > A < A > A < A > A < B > B A Delay < 9 > 9 < 9 > 9 < 9 > 9 < 11 > 11 1 V/C <.17 > <.23 > <.18 > <.42 >.42 Queue < 16.2 > < 16.2 > < 14.5 > < 25.5 > LOS < A > A < A > A < A > A < A > A A Delay < 1 > 1 < > < 1 > 1 < 1 > 1 1 V/C <.1 > <. > <. > <.3 >.3 Queue <. > <. > < 2.7 > < 14. > LOS < A A < A A A > A A Delay < 1 1 < 3 3 > 3 V/C <.7 <.3.1 >.1 Queue < 14.8 < 8.6 > LOS A > A < A A < A A A Delay > < < 9 9 V/C.3 > <. <..3 Queue. > <. < 2.8 Signal - Traffic Control Signals MOE - Measure of Effectiveness # - Queue exceeds capacity OWSC - One-Way Stop Control LOS - Level of Service < - Shared Left-Turn Lane TWSC - Two-Way Stop Control V/C - Volume to Capacity Ratio > - Shared Right-Turn Lane AWSC - All-Way Stop Control Queue - 95th Percentile Queue Length (m) Future Total Traffic Operations The site-generated traffic (Figure 3.2) was added to the 223 background traffic (Figure 4.4) to produce the 223 future total traffic volumes shown in Figure 4.5. Synchro 9 level of service analyses were conducted for the study area intersections using the 223 future total traffic volumes illustrated in Figure 4.5. Stop sign control was assumed for the site driveway connections to John Street West and Anne Street. The 223 future total traffic intersection operations are summarized in Table 4.2 indicating the Saturday peak hour existing levels of service (LOS), volume to capacity ratios (v/c) and 95 th percentile back of queue estimates (where appropriate). The following is noted from the analysis: The intersection of King Street and John Street West will continue to operate with acceptable levels of service during the Saturday peak hour upon reaching the 223 future total traffic volumes; The intersection of John Street West and Regent Street will continue to operate with acceptable levels of service on all approaches during the Saturday peak hour upon reaching the 223 future total traffic volumes; The intersection of King Street and Anne Street will continue to operate with acceptable levels of service on all approaches during the Saturday peak hour upon reaching the 223 future total traffic volumes; Paradigm Transportation Solutions Limited Page 3
91 Pillar and Post, Niagara-on-the-Lake Traffic Impact Study Update 1519 June 216 Figure 4.5: 223 Saturday Peak Hour Future Total Traffic Volumes Paradigm Transportation Solutions Limited Page 31
92 Pillar and Post, Niagara-on-the-Lake Traffic Impact Study Update 1519 June 216 The intersection of Anne Street and Regent Street will continue to operate with acceptable levels of service on all approaches during the Saturday peak hour upon reaching the 223 future total traffic volumes; The parking garage driveway connection to Anne Street will operate with acceptable levels of service on all approaches during the Saturday peak hour upon reaching the 223 future total traffic volumes; A stop sign will provide adequate traffic control for the parking garage driveway connection to Anne Street; and The inclusion of the site-generated trips increases the overall delay at the study area intersections four seconds or less during the Saturday peak hour. Detailed Synchro reports are provided in Appendix E. Paradigm Transportation Solutions Limited Page 32
93 Pillar and Post, Niagara-on-the-Lake Traffic Impact Study Update 1519 June 216 TABLE 4.2: 223 FUTURE TOTAL PEAK HOUR TRAFFIC OPERATIONS Analysis Period Intersection Control Type MOE Left Direction / Movement / Approach Eastbound Westbound Northbound Southbound Through Right Approach Left Through Right Approach Left Through Right Approach Left Through Right Approach Overall Saturday Peak Hour King Street & John Street West John Street West & Regent Street King Street & Anne Street Anne Street & Regent Street Anne Street & Parking Garage AWSC TWSC OWSC OWSC OWSC LOS < B > B < B > B < B > B < C > C A Delay < 11 > 11 < 12 > 12 < 11 > 11 < 18 > V/C <.27 > <.37 > <.3 > <.65 >.65 Queue < 17. < 2.4 > < 18.2 > < 33.9 > LOS < A > A < A > A < B > B < B > B A Delay < 1 > 1 < 4 > 4 < 11 > 11 < 13 > 13 4 V/C <.1 > <.8 > <.3 > <.7 >.8 Queue < 4.4 > < 14.8 > < 11.6 > < 13.2 > LOS < B B < A A A > A A Delay < < 3 3 > 3 V/C <.13 <.5.16 >.16 Queue < 13.7 < > LOS A > A < A A < B B A Delay > < < 1 1 V/C.5 > <. <..5 Queue. > <. < 3. LOS A > A < A A < A A A Delay 2 > 2 < < V/C.1 > <.12 <.4.12 Queue 5.4 > <. < 14.4 Signal - Traffic Control Signals MOE - Measure of Effectiveness # - Queue exceeds capacity OWSC - One-Way Stop Control LOS - Level of Service < - Shared Left-Turn Lane TWSC - Two-Way Stop Control V/C - Volume to Capacity Ratio > - Shared Right-Turn Lane AWSC - All-Way Stop Control Queue - 95th Percentile Queue Length (m) Paradigm Transportation Solutions Limited Page 33
94 APPENDIX E Future Background Traffic Conditions
95 APPENDIX E Future Background Traffic Conditions HCM Unsignalized Intersection Capacity Analysis Future Background Traffic Conditions 3: Niagara Parkway/Queens Parade & John St E Weekday AM Peak Hour Movement EBL EBT EBR WBL WBT WBR NBL NBT NBR SBL SBT Traffic Volume (veh/h) Future Volume (Veh/h) Sign Control Stop Stop Free Grade % % % Peak Hour Factor Hourly flow rate (vph) Median type None vc, conflicting volume vcu, unblocked vol tc, single (s) tc, 2 stage (s) tf (s) p queue free % cm capacity (veh/h) vc2, stage 2 conf vol None % Free.92 SBR Direction, Lane # EB 1 WB 1 NB 1 SB 1 Volume Total Volume Left Volume Right csh Volume to Capacity Queue Length 95th (m) Control Delay (s) Lane LOS A B A A Approach Delay (s) Approach LOS A B Average Delay 2.9 Intersection Capacity Utilization 31.% ICU Level of Service A F:\18145\Traffic\Synchro\FBAM.syn Synchro 9 Report 11/3/217 Page 1
96 HCM Unsignalized Intersection Capacity Analysis Future Background Traffic Conditions 6: Two Sisters Vineyard & John St E Weekday AM Peak Hour Movement EBT EBR WBL WBT NBL NBR Traffic Volume (veh/h) Future Volume (Veh/h) Sign Control Free Free Stop Grade % % % Peak Hour Factor Hourly flow rate (vph) Median type None None vc, conflicting volume vc2, stage 2 conf vol vcu, unblocked vol tc, single (s) tc, 2 stage (s) tf (s) p queue free % cm capacity (veh/h) Direction, Lane # EB 1 WB 1 NB 1 Volume Total Volume Left 2 1 Volume Right csh Volume to Capacity.2.. Queue Length 95th (m)... Control Delay (s) Lane LOS A A Approach Delay (s) Approach LOS A Average Delay.3 Intersection Capacity Utilization 14.% ICU Level of Service A F:\18145\Traffic\Synchro\FBAM.syn Synchro 9 Report 11/3/217 Page 2 HCM Unsignalized Intersection Capacity Analysis Future Background Traffic Conditions 8: Peller Estates Winery & John St E Weekday AM Peak Hour Movement EBT EBR WBL WBT NBL NBR Traffic Volume (veh/h) Future Volume (Veh/h) Sign Control Free Free Stop Grade % % % Peak Hour Factor Hourly flow rate (vph) Median type None None vc, conflicting volume vc2, stage 2 conf vol vcu, unblocked vol tc, single (s) tc, 2 stage (s) tf (s) p queue free % cm capacity (veh/h) Direction, Lane # EB 1 WB 1 NB 1 Volume Total Volume Left 2 1 Volume Right 3 csh Volume to Capacity.2.. Queue Length 95th (m)... Control Delay (s) Lane LOS A A Approach Delay (s) Approach LOS A Average Delay.3 Intersection Capacity Utilization 14.1% ICU Level of Service A F:\18145\Traffic\Synchro\FBAM.syn Synchro 9 Report 11/3/217 Page 3
97 HCM Unsignalized Intersection Capacity Analysis Future Background Traffic Conditions 11: Charlotte St & John St E Weekday AM Peak Hour Movement EBL EBT EBR WBL WBT WBR NBL NBT NBR SBL SBT SBR Traffic Volume (veh/h) Future Volume (Veh/h) Sign Control Free Free Stop Stop Grade % % % % Peak Hour Factor Hourly flow rate (vph) Median type None None vc, conflicting volume vc2, stage 2 conf vol vcu, unblocked vol tc, single (s) tc, 2 stage (s) tf (s) p queue free % cm capacity (veh/h) Direction, Lane # EB 1 WB 1 NB 1 SB 1 Volume Total Volume Left Volume Right csh Volume to Capacity...7. Queue Length 95th (m) Control Delay (s) Lane LOS A A A A Approach Delay (s) Approach LOS A A Average Delay 4.3 Intersection Capacity Utilization 21.2% ICU Level of Service A F:\18145\Traffic\Synchro\FBAM.syn Synchro 9 Report 11/3/217 Page 4 HCM Unsignalized Intersection Capacity Analysis Future Background Traffic Conditions 13: Charlotte St & Paffard St/Weatherstone Crt Weekday AM Peak Hour Movement EBL EBT EBR WBL WBT WBR NBL NBT NBR SBL SBT Traffic Volume (veh/h) Future Volume (Veh/h) Sign Control Stop Stop Free Grade % % % Peak Hour Factor Hourly flow rate (vph) Median type None vc, conflicting volume vcu, unblocked vol tc, single (s) tc, 2 stage (s) tf (s) p queue free % cm capacity (veh/h) vc2, stage 2 conf vol None % Free.92 SBR Direction, Lane # EB 1 WB 1 NB 1 SB 1 Volume Total Volume Left Volume Right 1 csh Volume to Capacity...1. Queue Length 95th (m) Control Delay (s) Lane LOS A A A A Approach Delay (s) Approach LOS A A Average Delay 1.3 Intersection Capacity Utilization 14.7% ICU Level of Service A F:\18145\Traffic\Synchro\FBAM.syn Synchro 9 Report 11/3/217 Page 5
98 HCM Unsignalized Intersection Capacity Analysis Future Background Traffic Conditions 16: Site Access 2 & John St E Weekday AM Peak Hour Movement EBT EBR WBL WBT NBL NBR Traffic Volume (veh/h) Future Volume (Veh/h) Sign Control Free Free Stop Grade % % % Peak Hour Factor Hourly flow rate (vph) Median type None None vc, conflicting volume vc2, stage 2 conf vol vcu, unblocked vol tc, single (s) tc, 2 stage (s) tf (s) p queue free % cm capacity (veh/h) Direction, Lane # EB 1 WB 1 Volume Total Volume Left Volume Right csh Volume to Capacity.2. Queue Length 95th (m).. Control Delay (s).. Lane LOS Approach Delay (s).. Approach LOS Average Delay. Intersection Capacity Utilization 13.3% ICU Level of Service A F:\18145\Traffic\Synchro\FBAM.syn Synchro 9 Report 11/3/217 Page 6 HCM Unsignalized Intersection Capacity Analysis Future Background Traffic Conditions 18: Site Access 1 & John St E Weekday AM Peak Hour Movement EBT EBR WBL WBT NBL NBR Traffic Volume (veh/h) Future Volume (Veh/h) Sign Control Free Free Stop Grade % % % Peak Hour Factor Hourly flow rate (vph) Median type None None vc, conflicting volume vc2, stage 2 conf vol vcu, unblocked vol tc, single (s) tc, 2 stage (s) tf (s) p queue free % cm capacity (veh/h) Direction, Lane # EB 1 WB 1 NB 1 Volume Total Volume Left Volume Right csh Volume to Capacity.2.. Queue Length 95th (m)... Control Delay (s)... Lane LOS A Approach Delay (s)... Approach LOS A Average Delay. Intersection Capacity Utilization 6.7% ICU Level of Service A F:\18145\Traffic\Synchro\FBAM.syn Synchro 9 Report 11/3/217 Page 7
99 HCM Unsignalized Intersection Capacity Analysis Future Background Traffic Conditions 23: King St & John St E Weekday AM Peak Hour Movement EBL EBT EBR WBL WBT WBR NBL NBT NBR SBL SBT SBR Sign Control Stop Stop Stop Stop Traffic Volume (vph) Future Volume (vph) Peak Hour Factor Hourly flow rate (vph) Direction, Lane # EB 1 WB 1 NB 1 SB 1 Volume Total (vph) Volume Left (vph) Volume Right (vph) Hadj (s) Departure Headway (s) Degree Utilization, x Capacity (veh/h) Control Delay (s) Approach Delay (s) Approach LOS A A A A Delay 7.6 Level of Service A Intersection Capacity Utilization 19.1% ICU Level of Service A F:\18145\Traffic\Synchro\FBAM.syn Synchro 9 Report 11/3/217 Page 8 HCM Unsignalized Intersection Capacity Analysis Future Background Traffic Conditions 27: Charlotte Street at Niagara St Weekday AM Peak Hour Movement EBL EBT WBT WBR SBL SBR Sign Control Stop Stop Stop Traffic Volume (vph) Future Volume (vph) Peak Hour Factor Hourly flow rate (vph) Direction, Lane # EB 1 WB 1 SB 1 Volume Total (vph) Volume Left (vph) 2 24 Volume Right (vph) 82 Hadj (s) Departure Headway (s) Degree Utilization, x Capacity (veh/h) Control Delay (s) Approach Delay (s) Approach LOS A A A Delay 7.3 Level of Service A Intersection Capacity Utilization 16.9% ICU Level of Service A F:\18145\Traffic\Synchro\FBAM.syn Synchro 9 Report 11/3/217 Page 9
100 HCM Unsignalized Intersection Capacity Analysis Future Background Traffic Conditions 3: Site Access 3 & John St E Weekday AM Peak Hour Movement EBT EBR WBL WBT NBL NBR Traffic Volume (veh/h) Future Volume (Veh/h) Sign Control Free Free Stop Grade % % % Peak Hour Factor Hourly flow rate (vph) Median type None None vc, conflicting volume vc2, stage 2 conf vol vcu, unblocked vol tc, single (s) tc, 2 stage (s) tf (s) p queue free % cm capacity (veh/h) Direction, Lane # EB 1 WB 1 NB 1 Volume Total Volume Left Volume Right csh Volume to Capacity.2.. Queue Length 95th (m)... Control Delay (s)... Lane LOS A Approach Delay (s)... Approach LOS A Average Delay. Intersection Capacity Utilization 13.3% ICU Level of Service A F:\18145\Traffic\Synchro\FBAM.syn Synchro 9 Report 11/3/217 Page 1 HCM Unsignalized Intersection Capacity Analysis Future Background Traffic Conditions 32: Charlotte St & Site Access 4 Weekday AM Peak Hour Movement WBL WBR NBT SBL SBT Traffic Volume (veh/h) 85 Future Volume (Veh/h) 85 Sign Control Stop Free Grade % % Peak Hour Factor Hourly flow rate (vph) 92 Median type None vc, conflicting volume vcu, unblocked vol tc, single (s) tc, 2 stage (s) tf (s) p queue free % cm capacity (veh/h) vc2, stage 2 conf vol None % Free.92 NBR Direction, Lane # WB 1 NB 1 SB 1 Volume Total 92 Volume Left Volume Right 92 csh Volume to Capacity.8.. Queue Length 95th (m) Control Delay (s) Lane LOS A Approach Delay (s) Approach LOS A Average Delay 8.6 Intersection Capacity Utilization 8.6% ICU Level of Service A F:\18145\Traffic\Synchro\FBAM.syn Synchro 9 Report 11/3/217 Page 11
101 HCM Unsignalized Intersection Capacity Analysis Future Background Traffic Conditions 3: Niagara Parkway/Queens Parade & John St E Weekday PM Peak Hour Movement EBL EBT EBR WBL WBT WBR NBL NBT NBR SBL SBT Traffic Volume (veh/h) Future Volume (Veh/h) Sign Control Stop Stop Free Grade % % % Peak Hour Factor Hourly flow rate (vph) Median type None vc, conflicting volume vcu, unblocked vol tc, single (s) tc, 2 stage (s) tf (s) p queue free % cm capacity (veh/h) vc2, stage 2 conf vol None % Free SBR Direction, Lane # EB 1 WB 1 NB 1 SB 1 Volume Total Volume Left Volume Right csh Volume to Capacity Queue Length 95th (m) Control Delay (s) Lane LOS B C A A Approach Delay (s) Approach LOS B C Average Delay 4.4 Intersection Capacity Utilization 5.6% ICU Level of Service A F:\18145\Traffic\Synchro\FBPM.syn Synchro 9 Report 11/3/217 Page 1 HCM Unsignalized Intersection Capacity Analysis Future Background Traffic Conditions 6: Two Sisters Vineyard & John St E Weekday PM Peak Hour Movement EBT WBL WBT NBL NBR Traffic Volume (veh/h) Future Volume (Veh/h) Sign Control Free Free Grade % % Peak Hour Factor Hourly flow rate (vph) Median type None vc, conflicting volume vcu, unblocked vol tc, single (s) tc, 2 stage (s) tf (s) p queue free % cm capacity (veh/h) vc2, stage 2 conf vol None % Stop EBR Direction, Lane # EB 1 WB 1 NB 1 Volume Total Volume Left 13 2 Volume Right 18 2 csh Volume to Capacity Queue Length 95th (m) Control Delay (s) Lane LOS A A Approach Delay (s) Approach LOS A Average Delay 2. Intersection Capacity Utilization 22.8% ICU Level of Service A F:\18145\Traffic\Synchro\FBPM.syn Synchro 9 Report 11/3/217 Page 2
102 HCM Unsignalized Intersection Capacity Analysis Future Background Traffic Conditions 8: Peller Estates Winery & John St E Weekday PM Peak Hour Movement EBT WBL WBT NBL NBR Traffic Volume (veh/h) Future Volume (Veh/h) Sign Control Free Free Grade % % Peak Hour Factor Hourly flow rate (vph) Median type None vc, conflicting volume vcu, unblocked vol tc, single (s) tc, 2 stage (s) tf (s) p queue free % cm capacity (veh/h) vc2, stage 2 conf vol None % Stop EBR Direction, Lane # EB 1 WB 1 NB 1 Volume Total Volume Left Volume Right csh Volume to Capacity Queue Length 95th (m) Control Delay (s) Lane LOS A A Approach Delay (s) Approach LOS A Average Delay 2. Intersection Capacity Utilization 22.8% ICU Level of Service A F:\18145\Traffic\Synchro\FBPM.syn Synchro 9 Report 11/3/217 Page 3 HCM Unsignalized Intersection Capacity Analysis Future Background Traffic Conditions 11: Charlotte St & John St E Weekday PM Peak Hour Movement EBL EBT EBR WBL WBT NBL NBT NBR SBL SBT SBR Traffic Volume (veh/h) Future Volume (Veh/h) Sign Control Free Free Stop Grade % % % Peak Hour Factor Hourly flow rate (vph) Median type None vc, conflicting volume vcu, unblocked vol tc, single (s) tc, 2 stage (s) tf (s) p queue free % cm capacity (veh/h) vc2, stage 2 conf vol None % Stop WBR Direction, Lane # EB 1 WB 1 NB 1 SB 1 Volume Total Volume Left Volume Right csh Volume to Capacity Queue Length 95th (m) Control Delay (s) Lane LOS A A B A Approach Delay (s) Approach LOS B A Average Delay 2.2 Intersection Capacity Utilization 27.5% ICU Level of Service A F:\18145\Traffic\Synchro\FBPM.syn Synchro 9 Report 11/3/217 Page 4
103 HCM Unsignalized Intersection Capacity Analysis Future Background Traffic Conditions 13: Charlotte St & Paffard St/Weatherstone Crt Weekday PM Peak Hour Movement EBL EBT EBR WBL WBT WBR NBL NBT NBR SBL SBT Traffic Volume (veh/h) Future Volume (Veh/h) Sign Control Stop Stop Free Grade % % % Peak Hour Factor Hourly flow rate (vph) Median type None vc, conflicting volume vcu, unblocked vol tc, single (s) tc, 2 stage (s) tf (s) p queue free % cm capacity (veh/h) vc2, stage 2 conf vol None % Free.92 SBR Direction, Lane # EB 1 WB 1 NB 1 SB 1 Volume Total Volume Left Volume Right csh Volume to Capacity.1... Queue Length 95th (m) Control Delay (s) Lane LOS A A A Approach Delay (s) Approach LOS A A Average Delay 1.4 Intersection Capacity Utilization 17.4% ICU Level of Service A F:\18145\Traffic\Synchro\FBPM.syn Synchro 9 Report 11/3/217 Page 5 HCM Unsignalized Intersection Capacity Analysis Future Background Traffic Conditions 16: Site Access 2 & John St E Weekday PM Peak Hour Movement EBT EBR WBL WBT NBL NBR Traffic Volume (veh/h) Future Volume (Veh/h) Sign Control Free Free Stop Grade % % % Peak Hour Factor Hourly flow rate (vph) Median type None None vc, conflicting volume vc2, stage 2 conf vol vcu, unblocked vol tc, single (s) tc, 2 stage (s) tf (s) p queue free % cm capacity (veh/h) Direction, Lane # EB 1 WB 1 Volume Total Volume Left Volume Right csh Volume to Capacity.4. Queue Length 95th (m).. Control Delay (s).. Lane LOS Approach Delay (s).. Approach LOS Average Delay. Intersection Capacity Utilization 16.5% ICU Level of Service A F:\18145\Traffic\Synchro\FBPM.syn Synchro 9 Report 11/3/217 Page 6
104 HCM Unsignalized Intersection Capacity Analysis Future Background Traffic Conditions 18: Site Access 1 & John St E Weekday PM Peak Hour Movement EBT EBR WBL WBT NBL NBR Traffic Volume (veh/h) Future Volume (Veh/h) Sign Control Free Free Stop Grade % % % Peak Hour Factor Hourly flow rate (vph) Median type None None vc, conflicting volume vc2, stage 2 conf vol vcu, unblocked vol tc, single (s) tc, 2 stage (s) tf (s) p queue free % cm capacity (veh/h) Direction, Lane # EB 1 WB 1 NB 1 Volume Total Volume Left Volume Right csh Volume to Capacity.4.. Queue Length 95th (m)... Control Delay (s)... Lane LOS A Approach Delay (s)... Approach LOS A Average Delay. Intersection Capacity Utilization 9.8% ICU Level of Service A F:\18145\Traffic\Synchro\FBPM.syn Synchro 9 Report 11/3/217 Page 7 HCM Unsignalized Intersection Capacity Analysis Future Background Traffic Conditions 23: King St & John St E Weekday PM Peak Hour Movement EBL EBT EBR WBL WBT WBR NBL NBT NBR SBL SBT SBR Sign Control Stop Stop Stop Stop Traffic Volume (vph) Future Volume (vph) Peak Hour Factor Hourly flow rate (vph) Direction, Lane # EB 1 WB 1 NB 1 SB 1 Volume Total (vph) Volume Left (vph) Volume Right (vph) Hadj (s) Departure Headway (s) Degree Utilization, x Capacity (veh/h) Control Delay (s) Approach Delay (s) Approach LOS A A A A Delay 8.7 Level of Service A Intersection Capacity Utilization 32.3% ICU Level of Service A F:\18145\Traffic\Synchro\FBPM.syn Synchro 9 Report 11/3/217 Page 8
105 HCM Unsignalized Intersection Capacity Analysis Future Background Traffic Conditions 27: Niagara St & Charlotte St Weekday PM Peak Hour Movement EBL EBT WBT WBR SBL SBR Sign Control Stop Stop Stop Traffic Volume (vph) Future Volume (vph) Peak Hour Factor Hourly flow rate (vph) Direction, Lane # EB 1 WB 1 SB 1 Volume Total (vph) Volume Left (vph) 75 Volume Right (vph) 51 3 Hadj (s) Departure Headway (s) Degree Utilization, x Capacity (veh/h) Control Delay (s) Approach Delay (s) Approach LOS A A A Delay 7.8 Level of Service A Intersection Capacity Utilization 16.9% ICU Level of Service A F:\18145\Traffic\Synchro\FBPM.syn Synchro 9 Report 11/3/217 Page 9 HCM Unsignalized Intersection Capacity Analysis Future Background Traffic Conditions 3: Site Access 3 & John St E Weekday PM Peak Hour Movement EBT EBR WBL WBT NBL NBR Traffic Volume (veh/h) Future Volume (Veh/h) Sign Control Free Free Stop Grade % % % Peak Hour Factor Hourly flow rate (vph) Median type None None vc, conflicting volume vc2, stage 2 conf vol vcu, unblocked vol tc, single (s) tc, 2 stage (s) tf (s) p queue free % cm capacity (veh/h) Direction, Lane # EB 1 WB 1 NB 1 Volume Total Volume Left Volume Right csh Volume to Capacity.4.. Queue Length 95th (m)... Control Delay (s)... Lane LOS A Approach Delay (s)... Approach LOS A Average Delay. Intersection Capacity Utilization 16.5% ICU Level of Service A F:\18145\Traffic\Synchro\FBPM.syn Synchro 9 Report 11/3/217 Page 1
106 HCM Unsignalized Intersection Capacity Analysis Future Background Traffic Conditions 32: Charlotte St & Site Access 4 Weekday PM Peak Hour Movement WBL WBR NBT SBL SBT Traffic Volume (veh/h) 52 Future Volume (Veh/h) 52 Sign Control Stop Free Grade % % Peak Hour Factor Hourly flow rate (vph) 57 Median type None vc, conflicting volume vcu, unblocked vol tc, single (s) tc, 2 stage (s) tf (s) p queue free % cm capacity (veh/h) vc2, stage 2 conf vol None % Free.92 NBR Direction, Lane # WB 1 NB 1 SB 1 Volume Total 57 Volume Left Volume Right 57 csh Volume to Capacity.5.. Queue Length 95th (m) Control Delay (s) Lane LOS A Approach Delay (s) Approach LOS A Average Delay 8.5 Intersection Capacity Utilization 6.7% ICU Level of Service A F:\18145\Traffic\Synchro\FBPM.syn Synchro 9 Report 11/3/217 Page 11 HCM Unsignalized Intersection Capacity Analysis Future Background Traffic Conditions 3: Niagara Parkway/Queens Parade & John St E Saturday Peak Hour Movement EBL EBT EBR WBL WBT WBR NBL NBT NBR SBL SBT Traffic Volume (veh/h) Future Volume (Veh/h) Sign Control Stop Stop Free Grade % % % Peak Hour Factor Hourly flow rate (vph) Median type None vc, conflicting volume vcu, unblocked vol tc, single (s) tc, 2 stage (s) tf (s) p queue free % cm capacity (veh/h) vc2, stage 2 conf vol None % Free SBR Direction, Lane # EB 1 WB 1 NB 1 SB 1 Volume Total Volume Left Volume Right csh Volume to Capacity Queue Length 95th (m) Control Delay (s) Lane LOS E F A A Approach Delay (s) Approach LOS E F Average Delay 47.1 Intersection Capacity Utilization 86.1% ICU Level of Service E F:\18145\Traffic\Synchro\FBSAT.syn Synchro 9 Report 11/3/217 Page 1
107 HCM Unsignalized Intersection Capacity Analysis Future Background Traffic Conditions 6: Two Sisters Vineyard & John St E Saturday Peak Hour Movement EBT WBL WBT NBL NBR Traffic Volume (veh/h) Future Volume (Veh/h) Sign Control Free Free Grade % % Peak Hour Factor Hourly flow rate (vph) Median type None vc, conflicting volume vcu, unblocked vol tc, single (s) tc, 2 stage (s) tf (s) p queue free % cm capacity (veh/h) vc2, stage 2 conf vol None % Stop EBR Direction, Lane # EB 1 WB 1 NB 1 Volume Total Volume Left Volume Right csh Volume to Capacity Queue Length 95th (m) Control Delay (s) Lane LOS A B Approach Delay (s) Approach LOS B Average Delay 2.9 Intersection Capacity Utilization 36.% ICU Level of Service A F:\18145\Traffic\Synchro\FBSAT.syn Synchro 9 Report 11/3/217 Page 2 HCM Unsignalized Intersection Capacity Analysis Future Background Traffic Conditions 8: Peller Estates Winery & John St E Saturday Peak Hour Movement EBT WBL WBT NBL NBR Traffic Volume (veh/h) Future Volume (Veh/h) Sign Control Free Free Grade % % Peak Hour Factor Hourly flow rate (vph) Median type None vc, conflicting volume vcu, unblocked vol tc, single (s) tc, 2 stage (s) tf (s) p queue free % cm capacity (veh/h) vc2, stage 2 conf vol None % Stop EBR Direction, Lane # EB 1 WB 1 NB 1 Volume Total Volume Left 27 7 Volume Right csh Volume to Capacity Queue Length 95th (m) Control Delay (s) Lane LOS A B Approach Delay (s) Approach LOS B Average Delay 3.2 Intersection Capacity Utilization 37.5% ICU Level of Service A F:\18145\Traffic\Synchro\FBSAT.syn Synchro 9 Report 11/3/217 Page 3
108 HCM Unsignalized Intersection Capacity Analysis Future Background Traffic Conditions 11: Charlotte St & John St E Saturday Peak Hour Movement EBL EBT EBR WBL WBT NBL NBT NBR SBL SBT SBR Traffic Volume (veh/h) Future Volume (Veh/h) Sign Control Free Free Stop Grade % % % Peak Hour Factor Hourly flow rate (vph) Median type None vc, conflicting volume vcu, unblocked vol tc, single (s) tc, 2 stage (s) tf (s) p queue free % cm capacity (veh/h) vc2, stage 2 conf vol None % Stop WBR Direction, Lane # EB 1 WB 1 NB 1 SB 1 Volume Total Volume Left Volume Right csh Volume to Capacity Queue Length 95th (m) Control Delay (s) Lane LOS A A B B Approach Delay (s) Approach LOS B B Average Delay 2.4 Intersection Capacity Utilization 35.% ICU Level of Service A F:\18145\Traffic\Synchro\FBSAT.syn Synchro 9 Report 11/3/217 Page 4 HCM Unsignalized Intersection Capacity Analysis Future Background Traffic Conditions 13: Charlotte St & Paffard St/Weatherstone Crt Saturday Peak Hour Movement EBL EBT EBR WBL WBT WBR NBL NBT NBR SBL SBT Traffic Volume (veh/h) Future Volume (Veh/h) Sign Control Stop Stop Free Grade % % % Peak Hour Factor Hourly flow rate (vph) Median type None vc, conflicting volume vcu, unblocked vol tc, single (s) tc, 2 stage (s) tf (s) p queue free % cm capacity (veh/h) vc2, stage 2 conf vol None % Free.92 SBR Direction, Lane # EB 1 WB 1 NB 1 SB 1 Volume Total Volume Left 1 15 Volume Right 15 3 csh Volume to Capacity Queue Length 95th (m) Control Delay (s) Lane LOS A A A Approach Delay (s) Approach LOS A A Average Delay 1.6 Intersection Capacity Utilization 21.2% ICU Level of Service A F:\18145\Traffic\Synchro\FBSAT.syn Synchro 9 Report 11/3/217 Page 5
109 HCM Unsignalized Intersection Capacity Analysis Future Background Traffic Conditions 16: Site Access 2 & John St E Saturday Peak Hour Movement EBT WBL WBT NBL NBR Traffic Volume (veh/h) Future Volume (Veh/h) Sign Control Free Free Grade % % Peak Hour Factor Hourly flow rate (vph) Median type None vc, conflicting volume vcu, unblocked vol tc, single (s) tc, 2 stage (s) tf (s) p queue free % cm capacity (veh/h) vc2, stage 2 conf vol None % Stop EBR Direction, Lane # EB 1 WB 1 Volume Total Volume Left Volume Right csh Volume to Capacity.1. Queue Length 95th (m).. Control Delay (s).. Lane LOS Approach Delay (s).. Approach LOS Average Delay. Intersection Capacity Utilization 21.5% ICU Level of Service A F:\18145\Traffic\Synchro\FBSAT.syn Synchro 9 Report 11/3/217 Page 6 HCM Unsignalized Intersection Capacity Analysis Future Background Traffic Conditions 18: Site Access 1 & John St E Saturday Peak Hour Movement EBT WBL WBT NBL NBR Traffic Volume (veh/h) Future Volume (Veh/h) Sign Control Free Free Grade % % Peak Hour Factor Hourly flow rate (vph) Median type None vc, conflicting volume vcu, unblocked vol tc, single (s) tc, 2 stage (s) tf (s) p queue free % cm capacity (veh/h) vc2, stage 2 conf vol None % Stop EBR Direction, Lane # EB 1 WB 1 NB 1 Volume Total Volume Left Volume Right csh Volume to Capacity.1.. Queue Length 95th (m)... Control Delay (s)... Lane LOS A Approach Delay (s)... Approach LOS A Average Delay. Intersection Capacity Utilization 14.8% ICU Level of Service A F:\18145\Traffic\Synchro\FBSAT.syn Synchro 9 Report 11/3/217 Page 7
110 HCM Unsignalized Intersection Capacity Analysis Future Background Traffic Conditions 23: King St & John St E Saturday Peak Hour Movement EBL EBT EBR WBL WBT WBR NBL NBT NBR SBL SBT SBR Sign Control Stop Stop Stop Stop Traffic Volume (vph) Future Volume (vph) Peak Hour Factor Hourly flow rate (vph) Direction, Lane # EB 1 WB 1 NB 1 SB 1 Volume Total (vph) Volume Left (vph) Volume Right (vph) Hadj (s) Departure Headway (s) Degree Utilization, x Capacity (veh/h) Control Delay (s) Approach Delay (s) Approach LOS B B B B Delay 11.9 Level of Service B Intersection Capacity Utilization 46.6% ICU Level of Service A F:\18145\Traffic\Synchro\FBSAT.syn Synchro 9 Report 11/3/217 Page 8 HCM Unsignalized Intersection Capacity Analysis Future Background Traffic Conditions 27: Niagara St & Charlotte St Saturday Peak Hour Movement EBL EBT WBT WBR SBL SBR Sign Control Stop Stop Stop Traffic Volume (vph) Future Volume (vph) Peak Hour Factor Hourly flow rate (vph) Direction, Lane # EB 1 WB 1 SB 1 Volume Total (vph) Volume Left (vph) 2 63 Volume Right (vph) 84 2 Hadj (s) Departure Headway (s) Degree Utilization, x Capacity (veh/h) Control Delay (s) Approach Delay (s) Approach LOS A A A Delay 8.2 Level of Service A Intersection Capacity Utilization 21.% ICU Level of Service A F:\18145\Traffic\Synchro\FBSAT.syn Synchro 9 Report 11/3/217 Page 9
111 HCM Unsignalized Intersection Capacity Analysis Future Background Traffic Conditions 3: Site Access 3 & John St E Saturday Peak Hour Movement EBT WBL WBT NBL NBR Traffic Volume (veh/h) Future Volume (Veh/h) Sign Control Free Free Grade % % Peak Hour Factor Hourly flow rate (vph) Median type None vc, conflicting volume vcu, unblocked vol tc, single (s) tc, 2 stage (s) tf (s) p queue free % cm capacity (veh/h) vc2, stage 2 conf vol None % Stop EBR Direction, Lane # EB 1 WB 1 NB 1 Volume Total Volume Left Volume Right csh Volume to Capacity.1.. Queue Length 95th (m)... Control Delay (s)... Lane LOS A Approach Delay (s)... Approach LOS A Average Delay. Intersection Capacity Utilization 21.5% ICU Level of Service A F:\18145\Traffic\Synchro\FBSAT.syn Synchro 9 Report 11/3/217 Page 1 HCM Unsignalized Intersection Capacity Analysis Future Background Traffic Conditions 32: Charlotte St & Site Access 4 Saturday Peak Hour Movement WBL WBR NBT SBL SBT Traffic Volume (veh/h) 87 Future Volume (Veh/h) 87 Sign Control Stop Free Grade % % Peak Hour Factor Hourly flow rate (vph) 95 Median type None vc, conflicting volume vcu, unblocked vol tc, single (s) tc, 2 stage (s) tf (s) p queue free % cm capacity (veh/h) vc2, stage 2 conf vol None % Free.92 NBR Direction, Lane # WB 1 NB 1 SB 1 Volume Total 95 Volume Left Volume Right 95 csh Volume to Capacity.9.. Queue Length 95th (m) Control Delay (s) Lane LOS A Approach Delay (s) Approach LOS A Average Delay 8.6 Intersection Capacity Utilization 8.7% ICU Level of Service A F:\18145\Traffic\Synchro\FBSAT.syn Synchro 9 Report 11/3/217 Page 11
112 APPENDIX F Junctions 8 Reports

113 217, Future Background AM» Roundabout details» Results Summary of intersection performance 1 The intersection diagram reflects the last run of ARCADY. 217, FB AM Data Errors and Warnings No errors or warnings Analysis Set Details 2
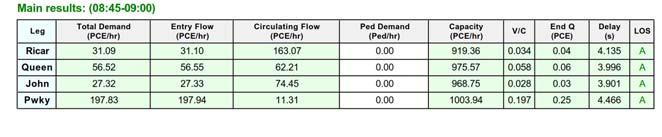
114 3 4
115 217, Future Background PM» Roundabout details» Results Summary of intersection performance 1 The intersection diagram reflects the last run of ARCADY. 217, FB PM Data Errors and Warnings No errors or warnings Analysis Set Details 2
116 3 4
117 217, Future Background Saturday PM» Roundabout details» Results Summary of intersection performance 1 The intersection diagram reflects the last run of ARCADY. 217, FB SAT PM Data Errors and Warnings No errors or warnings Analysis Set Details 2
118 3 4
119 217, Future Total AM» Roundabout details» Results Summary of intersection performance 1 The intersection diagram reflects the last run of ARCADY. 217, FT AM Data Errors and Warnings No errors or warnings Analysis Set Details 2
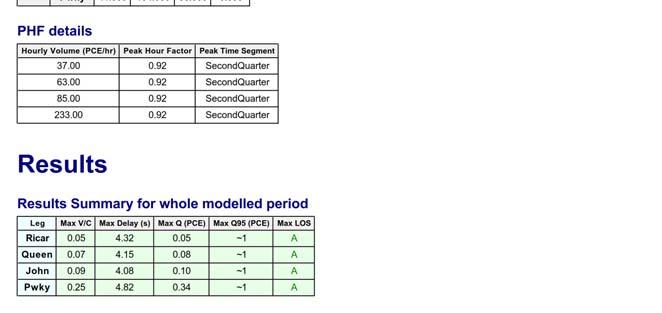
120 3 4
121 217, Future Total PM» Roundabout details» Results Summary of intersection performance 1 The intersection diagram reflects the last run of ARCADY. 217, FT PM Data Errors and Warnings No errors or warnings Analysis Set Details 2
122 3 4

123 217, Future Total Saturday PM» Roundabout details» Results Summary of intersection performance 1 The intersection diagram reflects the last run of ARCADY. 217, FT SAT PM Data Errors and Warnings No errors or warnings Analysis Set Details 2
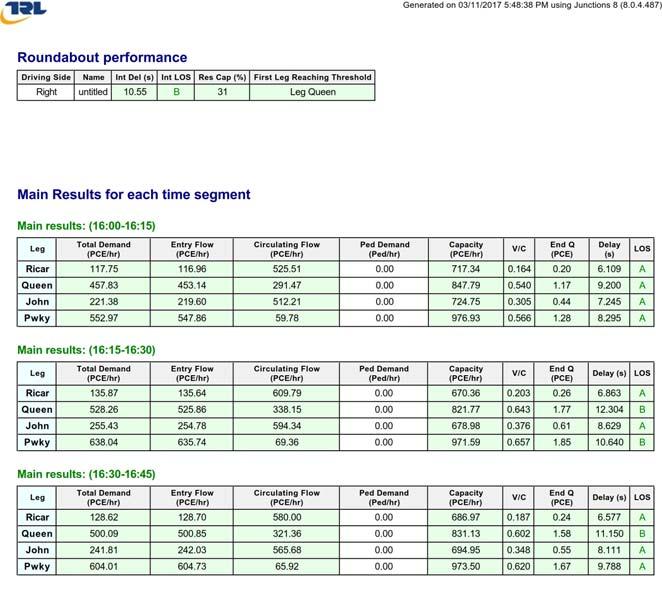
124 3 4
West Hills Shopping Centre Lowe s Expansion Traffic Impact Study
 West Hills Shopping Centre Lowe s Expansion Traffic Impact Study Prepared for: Armel Corporation January 2015 Paradigm Transportation Solutions Ltd. 22 King Street South, Suite 300 Waterloo ON N2J 1N8
TRANSPORTATION IMPACT STUDY ALCONA SOUTH SECONDARY PLAN SLEEPING LION DEVELOPMENT TOWN OF INNISFIL
 TRANSPORTATION IMPACT STUDY ALCONA SOUTH SECONDARY PLAN SLEEPING LION DEVELOPMENT TOWN OF INNISFIL Prepared For: 1602850 Ontario Ltd. 2800 Highway 7 Vaughan, Ontario L4K 1W8 Prepared By: URS Canada Inc.
RICHMOND OAKS HEALTH CENTRE 6265 PERTH STREET OTTAWA, ONTARIO TRANSPORTATION BRIEF. Prepared for: Guycoki (Eastern) Limited.
 Limited.") RICHMOND OAKS HEALTH CENTRE 6265 PERTH STREET OTTAWA, ONTARIO TRANSPORTATION BRIEF Prepared for: Guycoki (Eastern) Limited June 16, 2016 116-638 Brief_1.doc D. J. Halpenny & Associates Ltd. Consulting
RICHMOND OAKS HEALTH CENTRE 6265 PERTH STREET OTTAWA, ONTARIO TRANSPORTATION BRIEF Prepared for: Guycoki (Eastern) Limited June 16, 2016 116-638 Brief_1.doc D. J. Halpenny & Associates Ltd. Consulting
TRAFFIC IMPACT ANALYSIS
 TRAFFIC IMPACT ANALYSIS Emerald Isle Commercial Development Prepared by SEPI Engineering & Construction Prepared for Ark Consulting Group, PLLC March 2016 I. Executive Summary A. Site Location The Emerald
Clean Harbors Canada, Inc.
 Clean Harbors Canada, Inc. Proposed Lambton Landfill Expansion Environmental Assessment Terms of Reference Transportation Assessment St. Clair Township, Ontario September 2009 itrans Consulting Inc. 260
105 Toronto Street South, Markdale Transportation Impact Study. Paradigm Transportation Solutions Limited
 105 Toronto Street South, Markdale Transportation Impact Study Paradigm Transportation Solutions Limited December 2016 Project Summary Project Number 162060 December 2016 Client Zelinka Priamo Ltd 318
MIXED-USE DEVELOPMENT TOWN OF ERIN, ONTARIO
 Solmar Development Corp. TRFFIC IMPCT STUDY FOR: MIXED-USE DEVELOPMENT TOWN OF ERIN, ONTRIO 9/00 October, 0 LE Consulting Ltd. Consulting Engineers & Planners Suite 900, 65 Cochrane Drive, Markham, ON,
Traffic Impact Study Proposed Residential Development (Watson Parkway North - Starwood Drive Node, City of Guelph)
") Traffic Impact Study Proposed Residential Development (Watson Parkway North - Starwood Drive Node, City of Guelph) Prepared By: 332 Lorne Avenue East Stratford ON N5A 6S4 Prepared for: Paul Kemper, President
Traffic Impact Study Proposed Residential Development (Watson Parkway North - Starwood Drive Node, City of Guelph) Prepared By: 332 Lorne Avenue East Stratford ON N5A 6S4 Prepared for: Paul Kemper, President
BARRHAVEN FELLOWSHIP CRC 3058 JOCKVALE ROAD OTTAWA, ONTARIO TRANSPORTATION BRIEF. Prepared for:
 BARRHAVEN FELLOWSHIP CRC 3058 JOCKVALE ROAD OTTAWA, ONTARIO TRANSPORTATION BRIEF Prepared for: Barrhaven Fellowship CRC 3058 Jockvale Road Ottawa, ON K2J 2W7 December 7, 2016 116-649 Report_1.doc D. J.
DEVELOPMENT PROPERTY 1627 MAXIME STREET CITY OF OTTAWA TRANSPORTATION OVERVIEW. Prepared for: Subhas Bhargava. July 9, Overview_1.
 DEVELOPMENT PROPERTY 1627 MAXIME STREET CITY OF OTTAWA TRANSPORTATION OVERVIEW Prepared for: Subhas Bhargava July 9, 2015 115-620 Overview_1.doc D. J. Halpenny & Associates Ltd. Consulting Transportation
Prepared For: Toronto Transit Commission 1138 Bathurst Street Toronto, Ontario M5R 3H2. Prepared By:
 TRAFFIC IMPACT STUDY FOR THE TTC MCNICOLL BUS GARAGE CITY OF TORONTO Prepared For: Toronto Transit Commission 1138 Bathurst Street Toronto, Ontario M5R 3H2 Prepared By: Canada Inc. 4th Floor, 3 Leek Crescent
TRAFFIC IMPACT STUDY DERRY GREEN CORPORATE BUSINESS PARK MILTON SECONDARY PLAN MODIFICATION
 TRAFFIC IMPACT STUDY DERRY GREEN CORPORATE BUSINESS PARK MILTON SECONDARY PLAN MODIFICATION TRAFFIC IMPACT STUDY DERRY GREEN CORPORATE BUSINESS PARK MILTON SECONDARY PLAN MODIFICATION DECEMBER 24 UPDATED
EXECUTIVE SUMMARY. The following is an outline of the traffic analysis performed by Hales Engineering for the traffic conditions of this project.
 EXECUTIVE SUMMARY This study addresses the traffic impacts associated with the proposed Shopko redevelopment located in Sugarhouse, Utah. The Shopko redevelopment project is located between 1300 East and
King Soopers #116 Thornton, Colorado
 Traffic Impact Study King Soopers #116 Thornton, Colorado Prepared for: Galloway & Company, Inc. T R A F F I C I M P A C T S T U D Y King Soopers #116 Thornton, Colorado Prepared for Galloway & Company
Re: Addendum No. 4 Transportation Overview 146 Mountshannon Drive Ottawa, Ontario
 April 18 th, 2017 Mr. Kevin Yemm Vice President, Land Development Richraft Group of Companies 2280 St. Laurent Boulevard, Suite 201 Ottawa, Ontario (Tel: 613.739.7111 / e-mail: keviny@richcraft.com) Re:
November 1, Mr. Jafar Tabrizi President, Tabrizi Rugs 180 Bedford Highway. Traffic Impact Statement BH-1 and BH-2, Southgate Drive, Bedford, NS
 161-12598 Mr. Jafar Tabrizi President, Tabrizi Rugs 180 Bedford Highway Bedford, NS B4A 1C1 [Via Email: tabrizi@tabrizi.com] RE: Traffic Impact Statement Dear Mr. Tabrizi: Plans are being prepared for
MILLERSVILLE PARK TRAFFIC IMPACT ANALYSIS ANNE ARUNDEL COUNTY, MARYLAND
 MILLERSVILLE PARK TRAFFIC IMPACT ANALYSIS ANNE ARUNDEL COUNTY, MARYLAND Prepared for: Department of Public Works Anne Arundel County Prepared by: URS Corporation 4 North Park Drive, Suite 3 Hunt Valley,
MERIVALE PRIORITY SQUARE 2852 MERIVALE ROAD CITY OF OTTAWA TRANSPORTATION BRIEF. Prepared for: ONT Inc. 25 Winding Way Nepean, Ontario K2C 3H1
 MERIVALE PRIORITY SQUARE 2852 MERIVALE ROAD CITY OF OTTAWA TRANSPORTATION BRIEF Prepared for: 2190986ONT Inc. 25 Winding Way Nepean, Ontario K2C 3H1 October 6, 2010 110-502 Report_1.doc D. J. Halpenny
Re: Residential Development - Ogilvie/Cummings Transportation Overview
 1223 Michael Street, Suite 100, Ottawa, ON K1J 7T2 Tel: 613.738.4160 Fax: 613.739.7105 www.delcan.com March 28, 2012 OUR REF: TO3088TOY Barry J. Hobin & Architects 63 Pamilla Street Ottawa, ON K1S 3K7
Re: Cyrville Road Car Dealership
 1223 Michael Street, Suite 100, Ottawa, ON K1J 7T2 Tel: 613.738.4160 Fax: 613.739.7105 www.delcan.com February 25, 2013 OUR REF: TO3098TOE Mark Motors of Ottawa 611 Montreal Road Ottawa, ON K1K 0T8 Attention:
886 March Road McDonald's Transportation Study
 McDonald's Restaurants of Canada Limited March 2013 886 March Road McDonald's Transportation Study Submitted by: HDR Corporation 100 York Boulevard, Suite 300 Richmond Hill, ON L4B 1J8 (905) 882-4100 www.hdrinc.com
2.0 Development Driveways. Movin Out June 2017
 Movin Out June 2017 1.0 Introduction The proposed Movin Out development is a mixed use development in the northeast quadrant of the intersection of West Broadway and Fayette Avenue in the City of Madison.
Trafalgar Road & Lower Base Line Transportation Study Ontario Inc.
 Trafalgar Road & Lower Base Line Transportation Study 1255723 Ontario Inc. Trafalgar Road & Lower Base Line Transportation Study 1255723 Ontario Inc. 1465 Pickering Parkway Suite 200 Pickering ON L1V 7G7
Proposed Inn at Bellefield Traffic Impact Assessment
 Proposed Inn at Bellefield Traffic Impact Assessment Town of Hyde Park Dutchess County, New York Prepared for: T-Rex Hyde Park Owner LLC 500 Mamroneck Avenue, Suite 300 Harrison, NY 10528 June 21, 2017
Lacey Gateway Residential Phase 1
 Lacey Gateway Residential Phase Transportation Impact Study April 23, 203 Prepared for: Gateway 850 LLC 5 Lake Bellevue Drive Suite 02 Bellevue, WA 98005 Prepared by: TENW Transportation Engineering West
RE: A Traffic Impact Statement for a proposed development on Quinpool Road
 James J. Copeland, P.Eng. GRIFFIN transportation group inc. 30 Bonny View Drive Fall River, NS B2T 1R2 May 31, 2018 Ellen O Hara, P.Eng. Project Engineer DesignPoint Engineering & Surveying Ltd. 200 Waterfront
Downtown One Way Street Conversion Technical Feasibility Report
 Downtown One Way Street Conversion Technical Feasibility Report As part of the City s Transportation Master Plan, this report reviews the technical feasibility of the proposed conversion of the current
RE: 67/71 Marquette Avenue Redevelopment Transportation Overview
 1223 Michael Street, Suite 100, Ottawa, Ontario K1J 7T2 Tel: 613.738.4160 Fax: 613.739.7105 www.delcan.com April 23, 2014 OUR REF: TO3157TOA00 BY EMAIL: mark.larose@urbanrisedevelopment.com Urban Rise
Escondido Marriott Hotel and Mixed-Use Condominium Project TRAFFIC IMPACT ANALYSIS REPORT
 Escondido Marriott Hotel and Mixed-Use Condominium Project TRAFFIC IMPACT ANALYSIS REPORT Prepared for Phelps Program Management 420 Sixth Avenue, Greeley, CO 80632 Prepared by 5050 Avenida Encinas, Suite
V. DEVELOPMENT OF CONCEPTS
 Martin Luther King, Jr. Drive Extension FINAL Feasibility Study Page 9 V. DEVELOPMENT OF CONCEPTS Throughout the study process several alternative alignments were developed and eliminated. Initial discussion
TRAFFIC IMPACT STUDY FOR ST. JOSEPH'S ELEMENTARY SCHOOL ADDITION
 CATHOLIC DISTRICT SCHOOL BOARD OF EASTERN ONTARIO P.O. 61992 TRAFFIC IMPACT STUDY FOR ST. JOSEPH'S ELEMENTARY SCHOOL ADDITION SEPTEMBER 5, 218 TRAFFIC IMPACT STUDY FOR ST. JOSEPH'S ELEMENTARY SCHOOL ADDITION
2405 Mer Bleue Orleans, (Ottawa), ON Community Transportation Study Mattamy Homes. Prepared By: Stantec Consulting Ltd. Version 2
, ON Community Transportation Study Mattamy Homes. Prepared By: Stantec Consulting Ltd. Version 2") 2405 Mer Bleue Orleans, (Ottawa), ON Community Transportation Study Mattamy Homes Prepared By: Stantec Consulting Ltd. Version 2 April 2014 Stantec Consulting Ltd. 400-1331 Clyde Avenue, Ottawa ON K2C
2405 Mer Bleue Orleans, (Ottawa), ON Community Transportation Study Mattamy Homes Prepared By: Stantec Consulting Ltd. Version 2 April 2014 Stantec Consulting Ltd. 400-1331 Clyde Avenue, Ottawa ON K2C
Table 1 - Land Use Comparisons - Proposed King s Wharf Development. Retail (SF) Office (SF) 354 6,000 10, Land Uses 1
 Office (SF) 354 6,000 10, Land Uses 1") Ref. No. 171-6694 Phase 2 November 23, 217 Mr. David Quilichini, Vice President Fares & Co. Developments Inc. 31 Place Keelson Sales Centre DARTMOUTH NS B2Y C1 Sent Via Email to David@faresinc.com RE:
Ref. No. 171-6694 Phase 2 November 23, 217 Mr. David Quilichini, Vice President Fares & Co. Developments Inc. 31 Place Keelson Sales Centre DARTMOUTH NS B2Y C1 Sent Via Email to David@faresinc.com RE:
King Street & Wyman Road Transportation Impact Study & Transportation Demand Management. Paradigm Transportation Solutions Limited
 King Street & Wyman Road Transportation Impact Study & Transportation Demand Management Paradigm Transportation Solutions Limited April 28 Project Summary Project Number 822 April 28 Client RISE Commercial
PROJECT: Wilkinson Road Corridor Improvement Traffic Management Planning Project SUBJECT: Traffic Analysis
 TECHNICAL MEMORANDUM DATE: September 10, 2014 PROJECT 5861.03 NO: PROJECT: Wilkinson Road Corridor Improvement Traffic Management Planning Project SUBJECT: Traffic Analysis TO: Steve Holroyd - District
Table of Contents INTRODUCTION... 3 PROJECT STUDY AREA Figure 1 Vicinity Map Study Area... 4 EXISTING CONDITIONS... 5 TRAFFIC OPERATIONS...
 Crosshaven Drive Corridor Study City of Vestavia Hills, Alabama Table of Contents INTRODUCTION... 3 PROJECT STUDY AREA... 3 Figure 1 Vicinity Map Study Area... 4 EXISTING CONDITIONS... 5 TRAFFIC OPERATIONS...
TRAFFIC IMPACT STUDY VICDOM BROCK ROAD PIT EXPANSION
 TRAFFIC IMPACT STUDY VICDOM BROCK ROAD PIT EXPANSION TOWNSHIP OF UXBRIDGE P/N 05-1993 June 2011 Revised -August 2011 Prepared by: Skelton, Brumwell & Associates Inc. 93 Bell Farm Road, Suite 107 Barrie,
HUMC/Mountainside Hospital Redevelopment Plan
 Traffic and Parking Analysis HUMC/Mountainside Hospital Redevelopment Plan in Glen Ridge Borough and Montclair Township PREPARED FOR H2M 119 Cherry Hill Road, Suite 110 Parsippany, NJ 07054 862.207.5900
LAWRENCE TRANSIT CENTER LOCATION ANALYSIS 9 TH STREET & ROCKLEDGE ROAD / 21 ST STREET & IOWA STREET LAWRENCE, KANSAS
 LAWRENCE TRANSIT CENTER LOCATION ANALYSIS 9 TH STREET & ROCKLEDGE ROAD / 21 ST STREET & IOWA STREET LAWRENCE, KANSAS TRAFFIC IMPACT STUDY FEBRUARY 214 OA Project No. 213-542 TABLE OF CONTENTS 1. INTRODUCTION...
Vanier Parkway and Presland Road Residential Development Transportation Impact Study
 Vanier Parkway and Presland Road Residential Development Transportation Impact Study Final Report (Revised) March 2011 Submitted to: Groupe Lépine Ottawa Project No. 09-1613 Submitted by: Groupe Lépine
HIGHWAY 28 FUNCTIONAL DESIGN
 HIGHWAY 28 FUNCTIONAL DESIGN PUBLIC OPEN HOUSE #1 WEDNESDAY, MARCH 12, 2014 Stantec Presenters: Brad Vander Heyden, Project Engineer Neal Cormack, Project Manager Dave Parker, Project Engineer Beth Thola,
Lakeside Terrace Development
 Lakeside Terrace Development City of Barrie, County of Simcoe Traffic Brief for: Type of Document: Final Report Project Number: JDE 1617 Date Submitted: April 29 th, 216 4/29/16 John Northcote, P.Eng.
Section 5.0 Traffic Information
 Section 5.0 Traffic Information 10.0 TRANSPORTATION MDM Transportation Consultants, Inc. (MDM) has prepared an evaluation of transportation impacts for the proposed evaluation for the expansion of the
MEMO. McCORMICK RANKIN CORPORATION. File FROM: Keyur Shah DATE: February 1, 2010 COPIES: OUR FILE: SUBJECT: TO:
 McCORMICK RANKIN CORPORATION 2655 North Sheridan Way Mississauga, Ontario, L5K 2P8 Tel: (905)823-8500 Fax: (905) 823-8503 E-mail: mrc@mrc.ca Website: www.mrc.ca MEMO TO: File FROM: Keyur Shah DATE: February
TRAFFIC SIGNAL DESIGN REPORT KING OF PRUSSIA ROAD & RAIDER ROAD RADNOR TOWNSHIP PENNSYLVANIA
 TRAFFIC SIGNAL DESIGN REPORT KING OF PRUSSIA ROAD & RAIDER ROAD RADNOR TOWNSHIP PENNSYLVANIA PREPARED FOR: UNIVERSITY OF PENNSYLVANIA HEALTH SYSTEM 34 CIVIC CENTER BOULEVARD PHILADELPHIA, PA 1987 (61)
MINERVA PARK SITE TRAFFIC IMPACT STUDY M/I HOMES. September 2, 2015
 5500 New Albany Road Columbus, Ohio 43054 Phone: 614.775.4500 Fax: 614.775.4800 Toll Free: 1-888-775-EMHT emht.com 2015-1008 MINERVA PARK SITE TRAFFIC IMPACT STUDY M/I HOMES September 2, 2015 Engineers
INDUSTRIAL DEVELOPMENT
 INDUSTRIAL DEVELOPMENT Traffic Impact Study Plainfield, Illinois August 2018 Prepared for: Seefried Industrial Properties, Inc. TABLE OF CONTENTS Executive Summary 2 Introduction 3 Existing Conditions
TRAFFIC IMPACT ANALYSIS RIZZO CONFERENCE CENTER EXPANSION FINAL REPORT
 TRAFFIC IMPACT ANALYSIS RIZZO CONFERENCE CENTER EXPANSION Chapel Hill, North Carolina FINAL REPORT Prepared for: The Town of Chapel Hill, NC Prepared by: Architects-Engineers-Planners, Inc. December 2010
Date: February 7, 2017 John Doyle, Z-Best Products Robert Del Rio. T.E. Z-Best Traffic Operations and Site Access Analysis
 Memorandum Date: February 7, 07 To: From: Subject: John Doyle, Z-Best Products Robert Del Rio. T.E. Z-Best Traffic Operations and Site Access Analysis Introduction Hexagon Transportation Consultants, Inc.
Oakbrook Village Plaza City of Laguna Hills
 Oakbrook Village Plaza City of Laguna Hills Traffic Impact Analysis Prepared by: HDR Engineering 3230 El Camino Real, Suite 200 Irvine, CA 92602 October 2012 Revision 3 D-1 Oakbrook Village Plaza Laguna
TRAFFIC IMPACT STUDY 3171 LAKESHORE ROAD WEST RESIDENTIAL DEVELOPMENT TOWN OF OAKVILLE, REGIONAL MUNICIPALITY OF HALTON
 TRAFFIC IMPACT STUDY 3171 LAKESHORE ROAD WEST RESIDENTIAL DEVELOPMENT TOWN OF OAKVILLE, REGIONAL MUNICIPALITY OF HALTON PREPARED FOR: VOGUE WYCLIFFE (OAKVILLE) LIMITED PREPARED BY: C.F. CROZIER & ASSOCIATES
GASOLINE SERVICE STATION 1618, 1622 ROGER STEVENS DRIVE OTTAWA, ONTARIO TRANSPORTATION IMPACT ASSESSMENT. Prepared for:
 GASOLINE SERVICE STATION 1618, 1622 ROGER STEVENS DRIVE OTTAWA, ONTARIO TRANSPORTATION IMPACT ASSESSMENT Prepared for: Invecta Development (Ottawa) Corporation 758 Shanks Height Milton, ON L9T 7P7 May
Traffic Impact Analysis. Alliance Cole Avenue Residential Site Dallas, Texas. Kimley-Horn and Associates, Inc. Dallas, Texas.
 Traffic Impact Analysis Alliance Cole Avenue Residential Site Dallas, Texas February 15, 2018 Kimley-Horn and Associates, Inc. Dallas, Texas Project #064524900 Registered Firm F-928 Traffic Impact Analysis
Traffic Feasibility Study
 Traffic Feasibility Study Town Center South Robbinsville Township, Mercer County, New Jersey December 19, 2017 Prepared For Robbinsville Township Department of Community Development 2298 Route 33 Robbinsville,
Traffic Impact Analysis 5742 BEACH BOULEVARD MIXED USE PROJECT
 Traffic Impact Analysis 5742 BEACH BOULEVARD MIXED USE PROJECT CITY OF BUENA PARK Prepared by Project No. 14139 000 April 17 th, 2015 DKS Associates Jeffrey Heald, P.E. Rohit Itadkar, T.E. 2677 North Main
Volume 1 Traffic Impact Analysis Turtle Creek Boulevard Dallas, Texas. Kimley-Horn and Associates, Inc. Dallas, Texas.
 Volume 1 Traffic Impact Analysis 2727 Dallas, Texas June 18, 2018 Kimley-Horn and Associates, Inc. Dallas, Texas Project #064523000 Registered Firm F-928 Traffic Impact Analysis 2727 Dallas, Texas Prepared
Appendix J Traffic Impact Study
 MRI May 2012 Appendix J Traffic Impact Study Level 2 Traffic Assessment Limited Impact Review Appendix J [This page was left blank intentionally.] www.sgm-inc.com Figure 1. Site Driveway and Trail Crossing
Technical Memorandum. To: From: Date: October 14 th, 2018 Project #: 1302 Project Name: Subject: Distribution:
 Technical Memorandum To: Tom Hanrahan Jeff Sharp From: Date: October 14 th, 2018 Project #: 1302 Project Name: Subject: Distribution: Barrie Lockhart Road LP Conformity Review Scott Young Sorbara Group
TIMBERVINE TRANSPORTATION IMPACT STUDY FORT COLLINS, COLORADO JANUARY Prepared for:
 TIMBERVINE TRANSPORTATION IMPACT STUDY FORT COLLINS, COLORADO JANUARY 2014 Prepared for: Hartford Companies 1218 W. Ash Street Suite A Windsor, Co 80550 Prepared by: DELICH ASSOCIATES 2272 Glen Haven Drive
L1TILE BEARS DAY CARE TRANSPORTATION IMPACT STUDY FORT COLLINS, COLORADO MAY Prepared for:
 L1TILE BEARS DAY CARE TRANSPORTATION IMPACT STUDY FORT COLLINS, COLORADO MAY 2012 Prepared for: Hillside Construction, Inc. 216 Hemlock Street, Suite B Fort Collins, CO 80534 Prepared by: DELICH ASSOCIATES
Transportation & Traffic Engineering
 Transportation & Traffic Engineering 1) Project Description This report presents a summary of findings for a Traffic Impact Analysis (TIA) performed by A+ Engineering, Inc. for the Hill Country Family
APPENDIX B Traffic Analysis
 APPENDIX B Traffic Analysis Rim of the World Unified School District Reconfiguration Prepared for: Rim of the World School District 27315 North Bay Road, Blue Jay, CA 92317 Prepared by: 400 Oceangate,
Airport Road Improvements
 Airport Road Improvements October 2015 ENVIRONMENTAL STUDY REPORT Airport Road from 1.0 km north of Mayfield to 0.6 km north of King Street Town of Caledon D TRAFFIC STUDY & ROUNDABOUT EVALUATIONS Airport
PROPOSED RESIDENTIAL & COMMERCIAL DEVELOPMENT (ERF 1692), FRANSCHHOEK. Traffic Impact Assessment
, FRANSCHHOEK. Traffic Impact Assessment") PROPOSED RESIDENTIAL & COMMERCIAL DEVELOPMENT (ERF 1692), FRANSCHHOEK Traffic Impact Assessment LOCATED ERF 1692 IN FRANSCHHOEK, WESTERN CAPE Project No. : STUR0202 NOVEMBER 2017 PREPARED BY: STURGEON
PROPOSED RESIDENTIAL & COMMERCIAL DEVELOPMENT (ERF 1692), FRANSCHHOEK Traffic Impact Assessment LOCATED ERF 1692 IN FRANSCHHOEK, WESTERN CAPE Project No. : STUR0202 NOVEMBER 2017 PREPARED BY: STURGEON
D. J. Halpenny & Associates Ltd. Consulting Transportation Engineers
 D. J. Halpenny & Associates Ltd. Consulting Transportation Engineers August 24, 2015 File: 115-622 Mr. R. Baumann, President The RGB Group 277 Kirchoffer Avenue Ottawa, ON K2A 1Y1 RE: RESIDENTIAL DEVELOPMENT
NEWCASTLE MIDDLE SCHOOL Traffic Impact Analysis
 Gibson Traffic Consultants 2802 Wetmore Avenue Suite 220 Everett, WA 98201 425.339.8266 NEWCASTLE MIDDLE SCHOOL Traffic Impact Analysis Prepared for: Renton School District Jurisdiction: City of Newcastle
THE CORNERSTONE APARTMENTS TRAFFIC IMPACT STUDY R&M PROJECT NO
 THE CORNERSTONE APARTMENTS SITUATED AT N/E/C OF STAUDERMAN AVENUE AND FOREST AVENUE VILLAGE OF LYNBROOK NASSAU COUNTY, NEW YORK TRAFFIC IMPACT STUDY R&M PROJECT NO. 2018-089 September 2018 50 Elm Street,
Proposed location of Camp Parkway Commerce Center. Vicinity map of Camp Parkway Commerce Center Southampton County, VA
 Proposed location of Camp Parkway Commerce Center Vicinity map of Camp Parkway Commerce Center Southampton County, VA Camp Parkway Commerce Center is a proposed distribution and industrial center to be
Traffic Engineering Study
 Traffic Engineering Study Bellaire Boulevard Prepared For: International Management District Technical Services, Inc. Texas Registered Engineering Firm F-3580 November 2009 Executive Summary has been requested
Location Concept Plan Amendment Recommendation Approved 2011 Concept Plan
 Valley Line West LRT Concept Plan Recommended Amendments Lewis Farms LRT Terminus Site Location Concept Plan Amendment Recommendation Approved 2011 Concept Plan Lewis Farms LRT terminus site, 87 Avenue/West
Traffic Impact Study Speedway Gas Station Redevelopment
 Traffic Impact Study Speedway Gas Station Redevelopment Warrenville, Illinois Prepared For: Prepared By: April 11, 2018 Table of Contents 1. Introduction... 1 2. Existing Conditions... 4 Site Location...
RESPONSE TO TRAFFIC IMPACT STUDY COMMENTS
 RESPONSE TO TRAFFIC IMPACT STUDY COMMENTS Proposed Gas Station 40 Arthur Street (Highway 26), Town of the Blue Mountains (Thornbury), County of Grey, Ontario AUGUST 2013 August 27, 2013 MR. REG RUSSWURM
APPENDIX C1 TRAFFIC ANALYSIS DESIGN YEAR TRAFFIC ANALYSIS
 APPENDIX C1 TRAFFIC ANALYSIS DESIGN YEAR TRAFFIC ANALYSIS DESIGN YEAR TRAFFIC ANALYSIS February 2018 Highway & Bridge Project PIN 6754.12 Route 13 Connector Road Chemung County February 2018 Appendix
TRAFFIC IMPACT STUDY DERRY GREEN CORPORATE BUSINESS PARK MILTON SECONDARY PLAN MODIFICATION
 TRAFFIC IMPACT STUDY DERRY GREEN CORPORATE BUSINESS PARK MILTON SECONDARY PLAN MODIFICATION TRAFFIC IMPACT STUDY DERRY GREEN CORPORATE BUSINESS PARK MILTON SECONDARY PLAN MODIFICATION DECEMBER 2014 UPDATED
King County Metro. Columbia Street Transit Priority Improvements Alternative Analysis. Downtown Southend Transit Study. May 2014.
 King County Metro Columbia Street Transit Priority Improvements Alternative Analysis Downtown Southend Transit Study May 2014 Parametrix Table of Contents Introduction... 1 Methodology... 1 Study Area...
MEMO VIA . Ms. Amy Roth DPS Director, City of Three Rivers. To:
 MEMO To: Ms. Amy Roth DPS Director, City of Three Rivers VIA EMAIL From: Michael J. Labadie, PE Julie M. Kroll, PE, PTOE Brandon Hayes, PE, P.Eng. Fleis & VandenBrink Date: January 5, 2017 Re: Proposed
appendix 4: Parking Management Study, Phase II
 appendix 4: Parking Management Study, Phase II A4-1 A4-2 Eastlake Parking Management Study Final Phase 2 Report Future Parking Demand & Supply January 6, 2017 Submitted by Denver Corp Center III 7900 E.
830 Main Street Halifax Regional Municipality
 830 Main Street Halifax Regional Municipality Traffic Impact Statement Final Report Prepared by: GRIFFIN transportation group inc. 30 Bonny View Drive Fall River, NS B2T 1R2 www.griffininc.ca Prepared
Ref. No Task 3. April 28, Mr. Cesar Saleh, P. Eng. VP Planning and Design W.M. Fares Group th
 Ref. No. 151-00564 Task 3 April 28, 2015 Mr. Cesar Saleh, P. Eng. VP Planning and Design W.M. Fares Group th 3480 Joseph Howe Drive, 5 Floor HALIFAX NS B3L 4H7 Sent via Email to ceasr.saleh@wmfares.com
Traffic Impact Statement (TIS)
") Traffic Impact Statement (TIS) Vincentian PUDA Collier County, FL 10/18/2013 Prepared for: Global Properties of Naples Prepared by: Trebilcock Consulting Solutions, PA 2614 Tamiami Trail N, Suite 615 1205
Traffic Impact Statement (TIS) Vincentian PUDA Collier County, FL 10/18/2013 Prepared for: Global Properties of Naples Prepared by: Trebilcock Consulting Solutions, PA 2614 Tamiami Trail N, Suite 615 1205
TRAFFIC IMPACT STUDY FOR SONIC DRIVE-IN RESTAURANT. Vallejo, CA. Prepared For:
 TRAFFIC IMPACT STUDY FOR SONIC DRIVE-IN RESTAURANT Vallejo, CA Prepared For: ELITE DRIVE-INS, INC. 2190 Meridian Park Blvd, Suite G Concord, CA 94520 Prepared By: KD Anderson & Associates 3853 Taylor Road,
ZINFANDEL LANE / SILVERADO TRAIL INTERSECTION TRAFFIC ANALYSIS
 ZINFANDEL LANE / SILVERADO TRAIL INTERSECTION TRAFFIC ANALYSIS UPDATED TRAFFIC STUDY FOR THE PROPOSED RAYMOND VINEYARDS WINERY USE PERMIT MODIFICATION #P11-00156 AUGUST 5, 2014 PREPARED BY: OMNI-MEANS,
Environmental Assessment Derry Road and Argentia Road Intersection
 Air and Noise Study Environmental Assessment Derry Road and Argentia Road Intersection Project 11-4295 City of Mississauga, Region of Peel October 17, 2014 1 Region of Peel Environmental Assessment for
TRAFFIC IMPACT ANALYSIS SHORTBREAD LOFTS 2009 MODIFICATION Chapel Hill, North Carolina
 TRAFFIC IMPACT ANALYSIS SHORTBREAD LOFTS 2009 MODIFICATION Chapel Hill, North Carolina Prepared for: The Town of Chapel Hill, NC Prepared by: Architects-Engineers-Planners, Inc. November 2009 Traffic Impact
Proposed CVS/pharmacy
 Traffic Impact and Access Study Proposed CVS/pharmacy West Main Street (Route 1) at Hull Street Clinton, Connecticut PREPARED FOR Arista Development LLC 520 Providence Highway, Suite 9 Norwood, Massachusetts
TRANSPORTATION REVIEW
 TRANSPORTATION REVIEW - PROPOSED MIX OF LAND USES IS CONSISTENT WITH THE CITY S UNDER THE GRANVILLE BRIDGE POLICIES THAT AIM TO MEET NEIGHBOURING RESIDENTS SHOPPING NEEDS AND REDUCE RELIANCE ON AUTOMOBILE
Appendix 5. Haymeadow Interim Traffic Analysis
 Appendix 5 Haymeadow Interim Traffic Analysis 20 MEMORANDUM To: From: Rick Pylman Gary Brooks Bill Fox Date: September 15, 2016 Project: Subject: Haymeadow Evaluation of interim access configuration Currently
Traffic Impact Analysis West Street Garden Plots Improvements and DuPage River Park Garden Plots Development Naperville, Illinois
 Traffic Impact Analysis West Street Garden Plots Improvements and DuPage River Park Garden Plots Development Naperville, Illinois Submitted by April 9, 2009 Introduction Kenig, Lindgren, O Hara, Aboona,
ORIGINAL AND REVISED DEVELOPMENT CONCEPTS
 Reference No.: 141-24579 Mr. Tyson Simms, MCIP, LPP Planner II Rural Policy and Applications Current Planning Planning and Development P.O. Box 1749 Halifax, NS B3J 3A5 Re: : (WSP Canada Inc, March 2015)
Parking/Traffic Assessment Study
 Brock Road Industrial Mall 985 Brock Road South City of Pickering Parking/Traffic Assessment Study Prepared by: Tranplan Associates, Toronto Toronto 416-670-2005 Sudbury 705-522-0272 Peterborough 705-874-3638
Traffic Generation November 28, Mr. Todd Baker Baker Properties, LLC 953 Islington Street Suite 23D Portsmouth, NH 03801
 28-1932-03 November 28, 2016 Mr. Todd Baker Baker Properties, LLC 953 Islington Street Suite 23D Portsmouth, NH 03801 Re: Traffic Impact Evaluation The Rose Farm Residential Development Exeter, New Hampshire
LCPS Valley Service Center
 Traffic Impact Study LCPS Valley Service Center Loudoun County, Virginia November 4, 2015 Prepared For: Loudoun County Public Schools 21000 Education Court Ashburn, VA 20148 Prepared by: 1140 Connecticut
Creditview Road Schedule C Class Environmental Assessment Traffic Operations Analysis Final Report
 Capability City of Mississauga Creditview Road Schedule C Class Environmental Assessment Traffic Operations Analysis Final Report Prepared by: AECOM 5080 Commerce Boulevard 905 238 0007 tel Mississauga,
Transportation Review
 1445-1455 West Georgia Street Transportation Review Draft Report Prepared for BCG Developments Date November 10, 2016 Project No. 4608.12 November 10, 2016 4608.12 Dawn Guspie James KM Cheng Architects
The major roadways in the study area are State Route 166 and State Route 33, which are shown on Figure 1-1 and described below:
 3.5 TRAFFIC AND CIRCULATION 3.5.1 Existing Conditions 3.5.1.1 Street Network DRAFT ENVIRONMENTAL IMPACT REPORT The major roadways in the study area are State Route 166 and State Route 33, which are shown
TABLE OF CONTENTS 1.0 INTRODUCTION AND SUMMARY Purpose of Report and Study Objectives... 2
 TABLE OF CONTENTS 1.0 INTRODUCTION AND SUMMARY 1 1.1 Purpose of Report and Study Objectives... 2 1.2 Executive Summary... 3 1.2.1 Site Location and Study Area... 3 1.2.2 Development Description... 3 1.2.3
Proposed Hotel and Restaurant Development
 Traffic Impact Study Proposed Hotel and Restaurant Development Marbledale Road Tuckahoe, NY PREPARED FOR BILLWIN DEVELOPMENT AFFILIATES, LLC 365 WHITE PLAINS ROAD EASTCHESTER, NY. 10709 PREPARED BY Engineering
Traffic Impact Assessment
 Delta Mixed-Use Tower Traffic Impact Assessment Final V3 Prepared for Hari Homes, Inc. Date August 23, 2017 Project No. 6180.01 August 23, 2017 6180.01 Mr. Aloke Chowdhury Hari Homes, Inc. 206-8434 120th
TRAFFIC DATA. Existing Derousse Ave./River Rd. AM LOS Analysis Existing Derousse Ave./River Rd. PM LOS Analysis
 Appendix E NJ TRANSIT Pennsauken Junction Transit Center and Park & Ride RiverLINE and Atlantic City Line Pennsauken Township, Camden County, New Jersey TRAFFIC DATA Background Traffic Information for
Draft Report: West Berkeley Bowl Project
 Draft Report: West Berkeley Bowl Project July 2004 Prepared for: The City of Berkeley 1031-1925 F EHR & PEERS TRANSPORTATION CONSULTANTS 3685 Mt. Diablo Blvd. #301 Lafayette, CA 94549 925-284-3200 Fax: