APPENDIX I. Traffic Impact Analysis
|
|
|
- Christopher Parsons
- 5 years ago
- Views:
Transcription
1 APPENDIX I Traffic Impact Analysis
2
3
4 TRAFFIC IMPACT ANALYSIS FOR ASSISTED LIVING AND SKILLED NURSING FACILITY Located at La Cienega Boulevard In the City of Los Angeles Prepared by: Overland Traffic Consultants, Inc Tourney Road # 206 Santa Clarita, California (661) July 2008
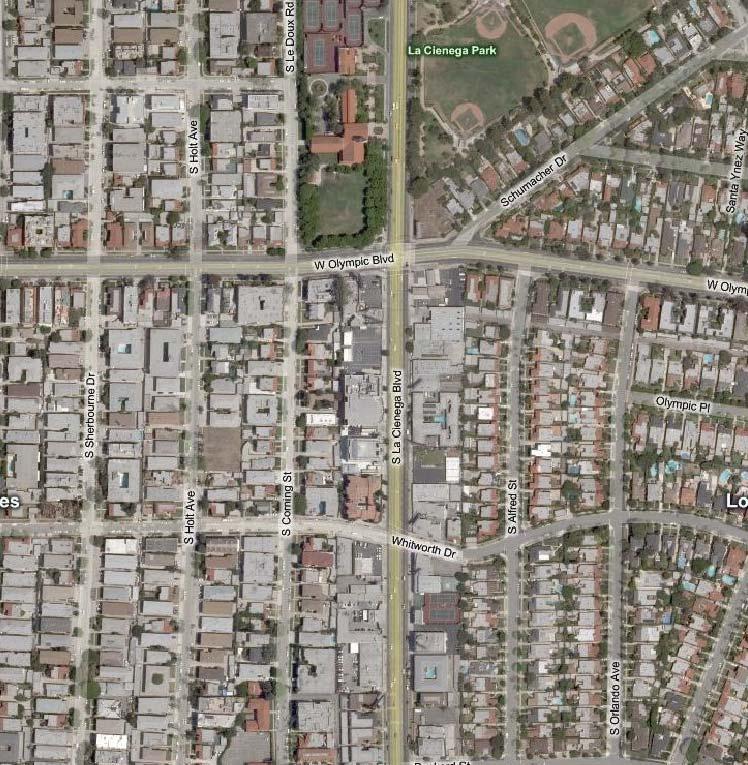
5 Overland Traffic Consultants, Inc. EXECUTIVE SUMMARY The project being analyzed in this traffic impact study is an assisted living and skilled nursing facility located at La Cienega Boulevard. The project is located on the east side of La Cienega Boulevard south of Olympic Boulevard in the City of Los Angeles, as shown in the following aerial photograph. The project consists of a 22-unit skilled nursing facility and a 153-unit (183 beds) senior assisted living facility. On-site parking will be provided in a two level subterranean parking structure with approximately 218 parking spaces. Access to the parking garage is provided by one driveway serving the skilled nursing facility and a circular driveway serving the senior assisted living facility. The project site is currently occupied with a 36 unit apartment building. The existing building will be removed as part of the development project. It is estimated that the project will generate approximately 531 daily trips, 27 morning peak hour trips and 44 afternoon peak hour trips. After accounting for the removal of the apartment building, the net change in traffic generated by the site is expected to be an increase of 289 daily trips, 8 morning trips and 22 afternoon trips. To be conservative, no trip credits were taken for commercial uses that were recently removed from the site. The focus of this traffic study is to evaluate the potential traffic impact created by the change in land use. The study intersections were determined based on the expected travel routes to and from the site and the estimated amount of traffic volume that would have the potential to create significant traffic impacts at nearby intersections. Intersections with low volumes of project traffic were not included in this analysis La Cienega Boulevard Page i July 2008 Traffic Impact Study Executive Summary
6 Overland Traffic Consultants, Inc. Highway Dedications and Street Standards As part of the project application process, the City of Los Angeles will review the adjacent street standards for La Cienega Boulevard and may require additional street dedications and improvements. Below are the adjacent streets standards and current conditions. La Cienega Boulevard is designated a major highway class II. The standard for a major highway class II is 104 feet of right-of-way consisting of an 80 foot wide street with two 12 foot sidewalks. The dedication and street improvement standards are therefore 52 feet of right-of-way with a 40 foot wide street and 12 foot sidewalks for each half-street. A review of the city files shows that La Cienega Boulevard is currently developed with a total right-of-way of 100 feet (50 feet each half). The street is developed to approximately 70 feet in width consisting of two 35-foot half streets. The east sidewalk is 15 feet in width. There may be exceptions to the highway standards and criteria contained in the Circulation Element of the General Plan and the City's Standard Street Dimensions as listed above when environmental issues, planning practices and community desires, among other factors, warrant alternate standards La Cienega Boulevard Page ii July 2008 Traffic Impact Study Executive Summary

7
8 Overland Traffic Consultants, Inc. TABLE OF CONTENTS Chapter 1 - Introduction 1 Chapter 2 - Project Description 4 Chapter 3 - Environmental Setting 6 Land Use 6 Transportation Network 6 Transit Information 7 Chapter 4 - Project Traffic 9 Traffic Generation 9 Distribution of Trip Origins and Destinations 11 Assignment of Project Traffic Volume to Area Streets 11 Chapter 5 - Traffic Conditions Analysis 16 Existing Peak Hour Traffic Volumes 16 Analysis of Existing Traffic Conditions 16 Analysis of Future Traffic Conditions 22 Impacts on Regional Transportation System 35 Chapter 6 - Mitigation Measures 36 Appendix A Site Plan Appendix B Community Plan Land Use Appendix C Circulation Maps, Street Standards & Street Plans Appendix D Transit Routes Appendix E Traffic Volume Data Appendix F Level of Service Worksheets La Cienega Boulevard Page iv July 2008 Traffic Impact Study Table of Contents
9 Overland Traffic Consultants, Inc. FIGURES Figure 1 - Project Location... 3 Figure 2 - Project Site Plan... 5 Figure 3 - Study Intersections Characteristics... 8 Figure 4 - Project Traffic Distribution Figure 5 - Project Traffic Assignment Percentages Figure 6 - Project Traffic Volume - AM Peak Hour Figure 7 - Project Traffic Volume - PM Peak Hour Figure 8 - Existing Traffic Volume - AM Peak Hour Figure 9 - Existing Traffic Volume - PM Peak Hour Figure 10 - Related Projects Location Map Figure 11 - Future Traffic Volume (Without Project) - AM Peak Hour Figure 12 - Future Traffic Volume (Without Project) - PM Peak Hour Figure 13 - Future Traffic Volume (With Project) - AM Peak Hour Figure 14 - Future Traffic Volume (With Project) - PM Peak Hour La Cienega Boulevard Page v July 2008 Traffic Impact Study List of Figures
10 Overland Traffic Consultants, Inc. TABLES Table 1 - Project Trip Generation Rates Table 2 - Project Traffic Generation Table 3 - Level of Service Definitions Table 4 - Existing Traffic Conditions Summary Table 5 - Related Projects Descriptions Table 6 - Related Projects Trip Generation Table 7 - Future Traffic Conditions Without Project Table 8 - Future Traffic Conditions With Project Table 9 - Future Traffic Conditions With Project Mitigation La Cienega Boulevard Page vi July 2008 Traffic Impact Study List of Tables
11 Overland Traffic Consultants, Inc. CHAPTER 1 INTRODUCTION An evaluation of the potential traffic impacts created by the proposed project has been conducted as part of the project s environmental review. This traffic study was prepared using procedures adopted by the City of Los Angeles to evaluate the potential traffic impacts of the proposed project. The potential traffic impact of the proposed development has been evaluated using the Critical Movement Analysis (CMA) method. The CMA analysis method quantifies the operating conditions of an intersection using a ratio of peak hour traffic volume to intersection capacity. The amount of new traffic added to an intersection by the proposed project determines the significance of the project traffic impact. The proposed project is located on the east side of La Cienega Boulevard between Olympic Boulevard and Whitworth Drive as shown on Figure 1. Three intersections have been selected for the project s traffic impact analysis. These intersections are: 1. Olympic Boulevard and La Cienega Boulevard; 2. Whitworth Drive and La Cienega Boulevard; and 3. Pico Boulevard and La Cienega Boulevard La Cienega Boulevard Page 1 July 2008 Traffic Impact Study Introduction
12 Overland Traffic Consultants, Inc. The analysis of traffic flow has been conducted for present conditions and for future conditions. The future analysis documents traffic conditions with the proposed project and other potential land development projects in the study area. Pursuant to the City of Los Angeles traffic impact guidelines, the following steps have been taken to develop the future traffic volume estimate: (a) Existing traffic + ambient growth to 2010 study year (added 1% per year); (b) Traffic in (a) + other development related projects (without project scenario); (c) Traffic in (b) with the proposed project traffic (with project scenario); (d) Traffic in (c) + traffic mitigation, if necessary La Cienega Boulevard Page 2 July 2008 Traffic Impact Study Introduction
13
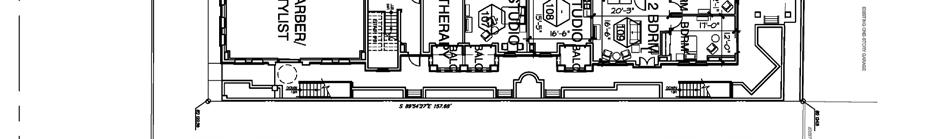
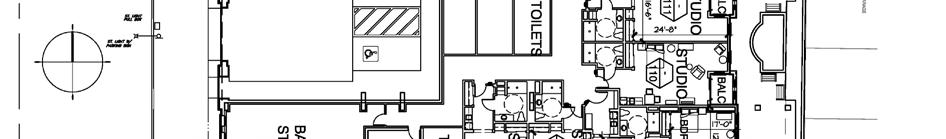
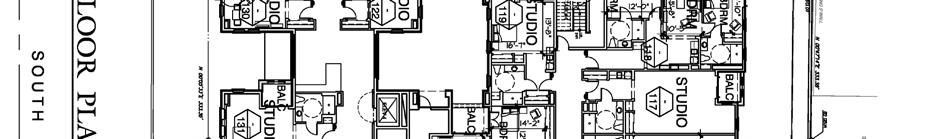
14 Overland Traffic Consultants, Inc. CHAPTER 2 PROJECT DESCRIPTION The project being proposed by the applicant is the construction of a skilled nursing facility of 22-units and an assisted living facility with 183 beds. Parking will be provided in a two level subterranean parking garage. The parking will consist of approximately 110 standard parking spaces, 4 handicapped spaces, and 104 compact spaces for a total of 218 spaces. Figure 2 shows the proposed 1 st floor plan which illustrates driveway locations and access to the parking and project site plan. Project access to the parking is provided by three driveways. The southerly driveway is an entry only driveway which serves the lobby area for the assisted living facility. Valet service and delivery vehicles will be served by this onsite motor court. The middle driveway provides an entry/exit for the parking garage and an exit for the motor court. The northerly driveway also provides an entry/exit to the parking garage. Floor plans for the entire project and garage parking layouts are provided in Appendix A La Cienega Boulevard Page 4 July 2008 Traffic Impact Study Project Description


15
16 Overland Traffic Consultants, Inc. CHAPTER 3 ENVIRONMENTAL SETTING Land Use The project is located in the Wilshire community plan area. The predominant land uses in the community plan area are single family and multi-family residential. The majority of commercial uses are situated along the major highways, including portions of Beverly Boulevard, Fairfax Avenue, 3 rd Street, Pico Boulevard, Wilshire Boulevard, Olympic Boulevard, Melrose Avenue, La Cienega Boulevard, La Brea Avenue, Western Avenue and Vermont Avenue. The land uses in the vicinity of the project site are commercial along La Cienega Boulevard and multi-family to the west and east. The land uses within the City of Los Angeles Wilshire plan area are approximately 2,078 acres (23.2%) single family, 2,788 acres (31.1%) multiple family, 1,222 acres (13.6%) commercial, 40 acres (0.4%) industrial, 412 acres (4.3%) open space/public facilities and 2,422 acres (27%) streets. The community land use summary table and land use map for the study area are provided in Appendix B. The streets within the study area are under the jurisdiction of the City of Los Angeles. A map illustrating the community plan highway designations, Los Angeles street standards and street layout plans are included in Appendix C of this report. Transportation Network The Santa Monica Freeway (Interstate 10) is located approximately 1.5 miles to the south of the project site. This east-west freeway provides 4 mixed-flow lanes in each direction in the vicinity of La Cienega Boulevard. Full access to the freeway is provided at Robertson Boulevard and at La Cienega Boulevard. The San Diego Freeway (Interstate 405) is located approximately 3 3/4 miles to the west of the project site. This north-south freeway provides 4-5 mixed-flow lanes in each direction in the vicinity of La Cienega Boulevard Page 6 July 2008 Traffic Impact Study Environmental Setting
17 Overland Traffic Consultants, Inc. Olympic Boulevard. Partial access to the freeway is provided at Pico Boulevard and at Olympic Boulevard. The Hollywood Freeway (U.S. Highway 101) is located approximately 5 miles to the east of the project site. This north-south freeway provides five mixed-flow lanes in each direction in the vicinity of Beverly Boulevard/Silver Lake Boulevard. La Cienega Boulevard is a north-south major highway constructed to a 70-foot width in the vicinity of the project site providing three lanes in each direction during peak hours (7-9am and 4-7pm) On-street parking is metered (1 and 2 hours) during the off peak time from 9 am to 4 pm along some segments of La Cienega Boulevard. Pico Boulevard is an east-west major highway constructed to a 70-foot width in the study area providing two lanes in each direction with a third lane westbound during the morning peak period (7-9am). On-street parking is metered during the off peak time from 9 am to 6 pm. Whitworth Drive is designated a local street east of La Cienega Boulevard and a collector street west of La Cienega Boulevard. Whitworth Drive provides one lane in each direction and on-street parking. Olympic Boulevard is an east-west major highway with two lanes in each direction with a third lane provided during both the morning and afternoon peak periods (7-9am and 3-7pm). On-street metered parking is provided during off-peak periods. In addition to collecting traffic volume data at the study intersections, field surveys were conducted to determine the roadway and intersection geometry and traffic controls (i.e., stop signs and traffic signals). Figure 3 illustrates the study locations, type of intersection traffic control and lane configurations La Cienega Boulevard Page 7 July 2008 Traffic Impact Study Environmental Setting
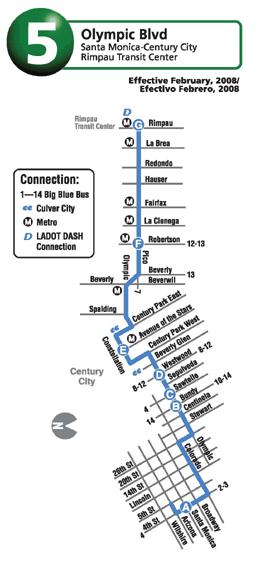
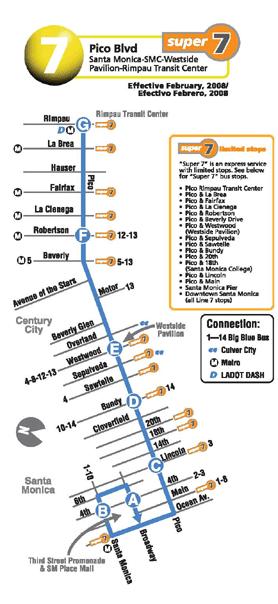
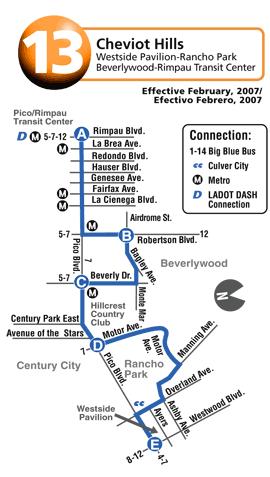
18 Overland Traffic Consultants, Inc. Transit Information Public transportation in the study area is provided by the Metropolitan Transportation Authority (Metro) and Santa Monica s Big Blue Bus. Metro provides route 28 and 728 rapid service along Olympic Boulevard, and routes 105 and 705 rapid service along La Cienega Boulevard. Santa Monica lines include 5, 7, and 13 along Pico Boulevard though the study area. Transit maps are illustrated in Appendix D La Cienega Boulevard Page 8 July 2008 Traffic Impact Study Environmental Setting
19
20 Overland Traffic Consultants, Inc. CHAPTER 4 PROJECT TRAFFIC This chapter describes the procedures for estimating the potential traffic volume generated by the project and its directional orientation. Traffic Generation Traffic-generating characteristics of uses associated with the project have been surveyed by the Institute of Transportation Engineers (ITE). The results of these traffic generation studies have been published in a handbook titled Trip Generation,7 th Edition. This publication of traffic generation data is the industry standard for estimating traffic generation for different land uses and is used when analyzing traffic impacts. The ITE studies show that the trip-making characteristics of the proposed uses generate peak hour traffic as shown by the average traffic generation rates contained in Table 1. It is estimated that the project will generate approximately 531 daily trips, 27 morning peak hour trips and 44 afternoon peak hour trips. After accounting for the removal of the apartment building, the net change in traffic generated by the site is expected to be an increase of 289 daily trips, 8 morning trips and 22 afternoon trips. The following analysis is conservative because traffic credits have not been taken for the commercial retail uses previously on the site: 4,464 square feet of retail uses and 9,581 square feet of automotive care facility. It is estimated those uses would have generated 42 morning peak hour trips and 66 afternoon peak hour trips using the ITE trips generation rates, respectively. A net negative trip generation would result if the prior commercial uses were accounted for. Table 1 Project Trip Generation Rates AM Peak Hour PM Peak Hour Land Use ITE Code Daily Total In Out Total In Out Apartments (per unit) Assisted Living (per bed) Skilled Nursing (per unit) La Cienega Boulevard Page 10 July 2008 Traffic Impact Study Project Traffic
21 Overland Traffic Consultants, Inc. Table 2 Estimated Project Traffic Generation Daily AM Peak Hour PM Peak Hour Proposed Land Use Traffic Total In Out Total In Out 183 bed Assisted Living unit Skilled Nursing Existing Land Use 36 Apartments Net Project Trips Distribution of Trip Origins and Destinations The primary factor affecting the distribution of the traffic flow is the location of the current population, residents and patrons of the uses which would generate trip origins and destinations. Figure 4 illustrates the estimated project traffic distribution percentages. Assignment of project traffic volume to surrounding streets Traffic to and from the project site has been assigned to the most direct and reasonable routes considering the project driveway location and surrounding street system. Percentages of the traffic flows are illustrated in Figure 5. The hourly traffic volume at each study intersection was calculated by multiplying the assigned intersection percentages as shown in Figure 5 to the net traffic generation estimates in Table 2. The resulting peak hour traffic volumes are shown in Figure 6 for the morning and Figure 7 for the afternoon peak hours La Cienega Boulevard Page 11 July 2008 Traffic Impact Study Project Traffic

22
23
24
25
26 Overland Traffic Consultants, Inc. CHAPTER 5 TRAFFIC CONDITIONS ANALYSIS Existing Peak Hour Traffic Volumes Traffic volume data used in the following peak hour intersectional analysis were based on traffic counts conducted by The Traffic Solution, an independent traffic data collection company. The AM and PM peak period counts were conducted manually from 7:00 AM to 9:00 AM and from 4:00 PM to 6:00 PM. Traffic counts were conducted by counting the number of vehicles at each of the 3 study intersections making each movement. The peak hour volume for each intersection was then determined by finding the four highest consecutive 15-minute volumes for all movements. Existing peak hour traffic volume at each study intersection is illustrated in Figure 8 for the morning rush hour and Figure 9 for the afternoon rush hour. Data collection worksheets for the peak hour counts are contained in Appendix E. Analysis of Existing Traffic Conditions The traffic conditions analysis was conducted using the Critical Movement Analysis (CMA) method. All study intersections were evaluated using this methodology pursuant to the criteria established by the City of Los Angeles Department of Transportation. The peak hour traffic counts were used along with current intersection geometrics and traffic controls to determine the intersection s operating condition. The CMA procedure uses a ratio of the traffic volume to the capacity of an intersection. The highest combinations of conflicting traffic volume (V) at an intersection are divided by the intersection capacity value. Intersection capacity (C) represents the maximum volume of vehicles which has a reasonable expectation of passing through an intersection in one hour under typical traffic flow conditions La Cienega Boulevard Page 16 July 2008 Traffic Impact Study Traffic Conditions Analysis
27
28
29 Overland Traffic Consultants, Inc. The CMA procedure uses a ratio of the traffic volume to the capacity of an intersection. This volume-to-capacity (V/C) ratio defines the proportion of an hour necessary to accommodate all the traffic moving through the intersection assuming all approaches were operating at full capacity. V/C ratios provide an ideal means for quantifying intersection operating characteristics. For example, if an intersection has a CMA value of 0.70, the intersection is operating at 70% capacity with 30% unused capacity. Once the volume-to-capacity ratio has been calculated, operating characteristics are assigned a level of service grade (A through F) to estimate the level of congestion and stability of the traffic flow. The term "Level of Service" (LOS) is used by traffic engineers to describe the quality of traffic flow. Definitions of the LOS grades are shown in Table La Cienega Boulevard Page 19 July 2008 Traffic Impact Study Traffic Conditions Analysis
30 Overland Traffic Consultants, Inc. LOS (V/C) Ratio Table 3 Level of Service Definitions Operating Conditions A At LOS A, there are no cycles that are fully loaded, and few are even close to loaded. No approach phase is fully utilized by traffic and no vehicle waits longer than one red indication. Typically, the approach appears quite open, turning movements are easily made, and nearly all drivers find freedom of operation. B > LOS B represents stable operation. An occasional approach phase is fully utilized and a substantial number are approaching full use. Many drivers begin to feel somewhat restricted with platoons of vehicles. C > In LOS C stable operation continues. Full signal cycle loading is still intermittent, but more frequent. Occasionally drivers may have to wait through more than one red signal indication, and back-ups may develop behind turning vehicles. D > LOS D encompasses a zone of increasing restriction, approaching instability. Delays to approaching vehicles may be substantial during short peaks within the peak period, but enough cycles with lower demand occur to permit periodic clearance of developing queues, thus preventing excessive back-ups. E > LOS E represents the most vehicles that any particular intersection approach can accommodate. At capacity (V/C = 1.00) there may be long queues of vehicles waiting upstream of the intersection and delays may be great (up to several signal cycles). F >1.000 LOS F represents jammed conditions. Back-ups from location downstream or on the cross street may restrict or prevent movement of vehicles out of the approach under consideration; hence, volumes carried are not predictable. V/C values are highly variable, because full utilization of the approach may be prevented by outside conditions La Cienega Boulevard Page 20 July 2008 Traffic Impact Study Traffic Conditions Analysis
31 Overland Traffic Consultants, Inc. By applying these procedures to the intersection data, the CMA values and the corresponding Levels of Service (LOS) for existing traffic conditions were determined for each intersection. The LOS values are summarized in Table 4. Supporting capacity worksheets are contained in Appendix F of this report. Table 4 Level of Service for Existing Conditions AM Peak Hour PM Peak Hour No. Intersection CMA LOS CMA LOS 1. La Cienega Blvd. & Olympic Blvd D D 2. La Cienega Blvd. & Whitworth Dr A A 3. La Cienega Blvd. & Pico Blvd E E La Cienega Boulevard Page 21 July 2008 Traffic Impact Study Traffic Conditions Analysis
32 Overland Traffic Consultants, Inc. Analysis of Future Traffic Conditions Future traffic volume projections have been developed to analyze the traffic conditions after completion of other planned land developments including the proposed project. Pursuant to the City of Los Angeles traffic impact guidelines, the following steps have been taken to develop the future traffic volume estimate: (a) Existing traffic plus ambient growth (1 percent per year) to 2010 study year; (b) Traffic in (a) plus related projects (without project scenario); (c) Traffic in (b) with the proposed project traffic (with project scenario); (d) Traffic in (c) plus traffic mitigation, if necessary. The future cumulative analysis includes other development projects located within the study area that are either under construction or planned. As part of this analysis, development information was obtained from the City of Los Angles Department of Transportation and the City of Beverly Hills. Development lists were reviewed to identify those projects that could produce additional traffic at the study intersections by the future study year It should be noted that this project, or any actions taken by the City regarding this project, does not have a direct bearing on these other proposed related projects. The locations of the 50 related projects are shown in Figure 10, with their descriptions provided in Table 5. To evaluate future traffic conditions with the related projects, estimates of the peak hour trips generated by the other developments were developed. The potential net increase in traffic from the related projects is provided in Table 6. The traffic impact of traffic volume increases has been calculated by adding the existing traffic volume, the ambient growth factor and traffic from other development projects. Future cumulative without project peak hour traffic volume estimates are shown in Figures 11 and 12 for the morning and afternoon, respectively La Cienega Boulevard Page 22 July 2008 Traffic Impact Study Traffic Conditions Analysis
33 Overland Traffic Consultants, Inc. Table 5 Related Projects Descriptions No. Project Size Location 1 Hotel 228 rooms N. Beverly Drive Condominiums 37 units specialty retail 791 s.f. Restaurant 2,230 s.f. 2 Office 41,500 s.f. 265 N. Beverly Drive 3 Church 9,325 s.f. 432 S. Beverly Drive 4 Condominiums 88 units Wilshire Bd. shopping center 40,000 s.f. 5 automotive 39,700 s.f Olympic Bd. 6 Office 19,000 s.f Wilshire Bd. 7 mixed-use 41,500 s.f Wilshire Bd. 8 Apartments 37 units 8601 Wilshire Bd. 9 medical office 85,000 s.f Wilshire Bd. 10 Condominiums 16 units 216 N. Arnaz Drive 11 congregate care 80 units 201 N. Crescent Drive 12 Condominiums 11 units 155 N. Hamilton Drive 13 Condominiums 11 units 140 S. Oakhurst Drive 14 Condominiums 23 units 261 Reeves Drive 15 apartment 1 unit 428 Smithwood Drive 16 Condominiums 3 units 115 N. Swall Drive 17 Retail 7,872 sf 1070 La Cienega Bd. Office 16,200 sf 18 Condominiums 53 units 9200 Wilshire Bd. Retail 8,400 sf restaurant 5,600 sf 19 day care 84 students 1062 Robertson Bd. private school K students 20 condominiums 65 units Third St. & La Cienega Bd. assisted living 181 units retail less theaters 20,000 sf 21 synagogue 9,000 sf 9090 Olympic Bd. private school 10,000 sf 22 screening room 66 seats 150 E. Camino Drive 23 retail/office 14,750 sf 8800 Burton Way 24 office to medical 14,000 sf 50 N. La Cienega Bd La Cienega Boulevard Page 23 July 2008 Traffic Impact Study Traffic Conditions Analysis
34 Overland Traffic Consultants, Inc. Table 5 (cont d) Related Projects Descriptions No. Project Size Location 25 Condominiums 60 units 9590 Wilshire Bd. commercial 12,000 sf 26 Condominiums 25 units 317 Elm Drive removed 6 units 27 Condominiums 27 units 225 S. Hamilton Drive removed 14 units 28 Condominiums 16 units 156 N. La Peer Drive removed 6 units 29 Condominiums 5 units 1488 S Rexfird Dr. 30 Condominiums 4 units 918 S Wooster St. 31 Condominiums 4 units 924 S Sherbourne Dr. 32 Condominiums 5 units 1069 S Sherbourne Dr. 33 Condominiums 16 units 908 S Shenandoah St. 34 Condominiums 15 units 1237 S Holt Ave. 35 Apartments 68 units 375 La Cienega Boulevard 36 Condominiums 140 units 300 Wetherly Drive 37 Apartments 39 units 8525 Pico Boulevard Shopping Center 11,327 sf 38 private school 140 students 329 La Cienega Boulevard 231 Beverly Drive 39 Retail 29,060 sf 6411 Wilshire Bl Fast Food 2,500 sf Apartments 130 apts 40 Apt Addition 300 apts 6300 W 3rd St 41 LACMA 652 S Ogden 42 Condominiums 62 units 100 N La Cienega Bl Apartments 177 apts High turn Res. 38,739 sf Retail 316,279 sf 43 Apartments 60 units rd Street Retail 5,350 sf 44 Private School 170 Students 310 N Huntley Dr La Cienega Boulevard Page 24 July 2008 Traffic Impact Study Traffic Conditions Analysis
35 Overland Traffic Consultants, Inc. Table 5 (cont d) Related Projects Descriptions No. Project Size Location 45 Chabad 423 students Pico Boulevard 9,615 retail 31 apts 46 Office 7 ksf 5900 W Wilshire Bl High turn Res. 3.5 ksf restaurant ksf 47 Office 28.8 ksf 725 S Curson Av High turn Res. 800 sf 48 Museum 8,375 sf 7600 Beverly Blvd 49 Apartments 175 units 5500 Wilshire Boulevard 50 Apartments 288 units 5600 Wilshire Boulevard La Cienega Boulevard Page 25 July 2008 Traffic Impact Study Traffic Conditions Analysis
36 Overland Traffic Consultants, Inc. Table 6 Estimated Traffic Generation for Other Projects Daily AM Peak Hour PM Peak Hours No. Project Traffic In Out Total In Out Total 1 Hotel 2, Office Church Condominiums 2, automotive 1, Office mixed-use Apartments medical office 1, Condominiums congregate care Condominiums Condominiums Condominiums apartment Condominiums retail/office Condominiums 1, day care condominiums 1, synagogue screening room retail/office office to medical Condominiums Condominiums Condominiums Condominiums Condominiums Condominiums Condominiums Condominiums La Cienega Boulevard Page 26 July 2008 Traffic Impact Study Traffic Conditions Analysis
37 Overland Traffic Consultants, Inc. Table 6 (cont d) Estimated Traffic Generation for Other Projects Daily AM Peak Hour PM Peak Hours No. Project Traffic In Out Total In Out Total 33 Condominiums Condominiums Apartments Condominiums Apartments Shopping Center private school Retail Fast Food Apartments Apt Addition LACMA Condominiums Apartments High turn Res Retail Apartments Retail Private School Chabad Office High turn Res restaurant Office High turn Res Museum Apartments Apartments La Cienega Boulevard Page 27 July 2008 Traffic Impact Study Traffic Conditions Analysis
38
39
40
41 Overland Traffic Consultants, Inc. The impact of a development project is determined by comparing, at each study intersection, the changes in the traffic conditions between the different growth scenarios. According to the standards adopted by the City of Los Angeles, a traffic impact is considered significant if the related increase in the V/C value equals or exceeds the thresholds shown in the table below and are marked in the following tables with an asterisk ( * ). City of Los Angeles Criterion LOS Final V/C Value Increase in V/C Value C D E, F > or more As shown in Table 7, traffic growth from the related projects and the ambient growth will increase traffic congestion in the study area. The traffic impact of project s traffic volume has been calculated by adding the project volume to the non-project traffic growth. Table 7 Future Traffic Conditions Without Project Peak Existing Future Without Project No. Intersection Hour CMA LOS CMA LOS Growth 1. La Cienega Boulevard & AM D F Olympic Boulevard PM D E La Cienega Boulevard & AM A A Whitworth Drive PM A B La Cienega Boulevard & AM E F Pico Boulevard PM E F La Cienega Boulevard Page 31 July 2008 Traffic Impact Study Traffic Conditions Analysis
42 Overland Traffic Consultants, Inc. Table 8 contains the project impact values at the study intersections. As shown below, none of the study intersections are expected to be significantly impacted by project traffic volume using the significant impact criteria established by the City of Los Angeles Department of Transportation. It should be noted that the impact analysis does not consider any changes to the existing intersection configuration (i.e., future roadway improvements). Future cumulative with project peak hour traffic volumes are shown in Figures 13 and 14 for the morning and afternoon, respectively. Table 8 Future Traffic Conditions Without and With Project Peak Future Without Future With Project No. Intersection Hour CMA LOS CMA LOS Growth 1. La Cienega Boulevard & AM F F Olympic Boulevard PM E E La Cienega Boulevard & AM A A Whitworth Drive PM B B La Cienega Boulevard & AM F F Pico Boulevard PM F F La Cienega Boulevard Page 32 July 2008 Traffic Impact Study Traffic Conditions Analysis
43
44
45 Overland Traffic Consultants, Inc. Impacts on Regional Transportation System The Congestion Management Program (CMP) was adopted to track regional traffic growth, building permits and transportation improvements. The CMP designated a transportation network including all state highways and some arterials within the County to be monitored by local jurisdictions. If the LOS standard deteriorates on the CMP network, then local jurisdictions must prepare a deficiency plan to be in conformance with the CMP program. Current changes to the CMP program being considered by local officials include adding a countywide trip fee to mitigate regional cumulative impacts. For purposes of the CMP LOS analysis, a substantial change in freeway segments are defined as an increase or decrease of 0.10 in the demand to capacity ratio and a change in LOS. A CMP traffic impact analysis is required if a project will add 150 or more trips to a freeway segment in either direction and where the project will add 50 or more trips to any CMP monitoring intersection during either the AM or PM weekday peak hour. The nearest CMP monitoring location is Wilshire Boulevard and La Cienega Boulevard. The traffic study shows that significant traffic impacts would not be exceeded at this location. As shown in Figures 6 and 7, the proposed project does not exceed the CMP traffic limits. Therefore, no additional CMP analysis is necessary La Cienega Boulevard Page 35 July 2008 Traffic Impact Study Traffic Conditions Analysis
46 Overland Traffic Consultants, Inc. CHAPTER 6 MITIGATION MEASURES Based on the analysis in this study, it has been determined that the added traffic generated by the proposed project will not significant impact any of the three study intersections using criteria established by the City of Los Angeles. Therefore, no traffic mitigation is necessary La Cienega Boulevard Page 36 July 2008 Traffic Impact Study Mitigation Measures
47 APPENDIX A PROJECT SITE PLANS
48 APPENDIX B COMMUNITY PLAN LAND USE
49 WILSHIRE SUMMARY OF LAND USE CATEGORY LAND USE CORRESPONDING ZONES NET ACRES % AREA TOTAL NET ACRES TOTAL % AREA RESIDENTIAL Single Family 2, Very Low I RE20, RA Very Low II RE15, RE Low I RE Low II R1, RS, RD6 1, Multiple Family 2, Low Medium I R2,RD3, RD4,RZ3, RZ4, Low Medium II RD1.5, RD2, RW2, RZ Medium R3 1, High Medium R COMMERCIAL 1, Limited CR, C1, C1.5, P General C1.5, C2, C4, P Neighborhood C1, C1.5, C2, C4, P Community CR, C2, C4, P, PB Regional Center CR, C1.5, C2, C4,R3, R4, INDUSTRIAL Limited CM, MR1, M1, P OPEN SPACE/PUBLIC FACILITIES Open Space OS, A Public Facilities PF STREETS 2, Private Street Public Street 2, TOTAL 8, WILSHIRE
50
51 APPENDIX C CIRCULATION MAPS, STREET STANDARDS & STREET PLANS
52
53
54
55
56 APPENDIX D TRANSIT ROUTES
57 43rd St BBB5 BBB7 BBB12 BBB ROUTE MAP N MAP NOTES LEGEND INSET 1 CRENSHAW N Sunset Bl Holloway Dr Santa Monica Bl a Vernon Blue Line Station Metro Bus Lines 105, 611, 705; DASH Pueblo Del Rio, DASH Southeast b Kenneth Hahn State Recreatio Area c Washington/Fairfax Transit Center Metro Bus Lines 35, 37, 38, 105, 217, 335, 534, 439, 705, 780; C1; CE 437 d Kaiser Hospital e Plaza La Cienega f La Cienega Park g Cedars Sinai Medical Center h Beverly Center i Leimert Park j Baldwin Hills Crenshaw Plaza Line 105 Route Extended Route of Weekday Peak Trips Timepoint Metro Rail Metro Rail Station Transit Center Connecting Line 000 Rapid Connecting Line BBB Santa Monica s Big Blue Bus CC Culver City Bus CE LADOT Commuter Express INSET 1 CRENSHAW Line 105 Route Timepoint Leimert Bl M L King Bl 705 Melrose Av 714 San Vicente Bl Beverly Bl 3rd St Crenshaw Bl 305 BEVERLY HILLS Burton Wy Wilshire Bl Olympic Bl Marlton Av Santa Rosalia Dr M L King Bl Stocker Dr Robertson Bl Pico Bl La Cienega Bl Airdrome St Hillcrest Dr Fairfax Av th St Coliseum St Cadillac Av CE Adams Bl Jefferson Bl 38 Exposition Bl C4 C1 Venice Bl Washington Bl National Bl Long Beach Av E Long Beach Av W Main St Normandie Av Western Av Atlantic Bl Boyle Av Soto St Broadway Arlington Av Crenshaw Bl Compton Av Hooper Av Central Av Avalon Bl 10 Figueroa St Vermont Av Rodeo Rd Coliseum St 710 CULVER CITY Downey Rd VERNON M.L. King Bl Leimert Bl Vernon Av SEE INSET 1 La Brea Av Sycamore Av 212 La Cienega Bl VERNON 53 rd St Stocker Dr Cudahy Av Pacific Bl 760 Santa Fe Av Crenshaw Bl C CRENSHAW
58 BBB5 BBB7 BBB12 BBB13 37 CE ROUTE MAP INSET 1 CRENSHAW Coliseum St M L King Bl N 60 VERNON 760 Long Beach Av E Long Beach Av W Pacific Bl VERNON Santa Fe Av N 760 Hillcrest Dr Santa Rosalia Dr Marlton Av Stocker Dr Crenshaw Bl 43rd St M L King Bl Leimert Bl Vernon Av Compton Av Hooper Av Central Av Avalon Bl Main St Broadway Vernon Av LEGEND CC BBB Rapid Line 705 Route Northbound Route Only Timepoint Rapid Stop Southbound Rapid Stop Only Metro Rail Metro Rail Station Transit Center Connecting Line Rapid Connecting Line Culver City Bus Santa Monica s Big Blue Bus INSET 1 CRENSHAW Rapid Line 705 Route Timepoint Rapid Stop MAP NOTES a Vernon Blue Line Station Metro Bus Lines 105, 611, 705; DASH Pueblo Del Rio, DASH Southeast b Kenneth Hahn State Recreation Area c Washington/Fairfax Transit Center Metro Bus Lines 35, 37, 38, 105, 217, 335, 534, 439, 705, 780; C1; CE 437 d Kaiser Hospital e Plaza La Cienega f La Cienega Park g Cedars Sinai Medical Center h Beverly Center i Leimert Park j Baldwin Hills Crenshaw Plaza 728 Fairfax Av Adams Bl Crenshaw Bl Jefferson Bl Exposition Bl Figueroa St Vermont Av Rodeo Rd Coliseum St M.L. King Bl Leimert Bl 42 SEE INSET 1 CRENSHAW La Brea Av Sycamore Av 212 Western Av Stocker Dr Normandie Av 207 Arlington Av Crenshaw Bl Palm Av Santa Monica Bl 105 San Vicente Bl Melrose Av Beverly Bl 305 3rd St Burton Wy 550 BEVERLY HILLS Wilshire Bl Olympic Bl Robertson Bl Pico Bl La Cienega Bl Airdrome St 18th St Cadillac Av 10 C4 Venice Bl C1 Washington Bl National Bl CULVER CITY La Cienega Bl 439 C5
59 Burton Way Wilshire Bl Wilshire Bl Pico Bl Wilshire Bl Olympic Bl Figueroa St Pico Bl Figueroa St Flower St S Hope St Grand Av Olive St Broadway Main St Hill St Los Angeles St Maple Av Wall St Central Av Alameda St Flower St S Hope St Grand Av Broadway Main St ROUTE MAP N DOWNTOWN L.A. Union Av SEE INSET #1 INSET MAP 1 - DOWNTOWN LOS ANGELES Alvarado St 200 WESTLAKE/ MACARTHUR PARK PERSHING SQUARE 4th St Winston St 5th St Hoover St Vermont Av Normandie Av Western Av WILSHIRE/ VERMONT WILSHIRE/ NORMANDIE WILSHIRE/ WESTERN KOREATOWN TH ST/METRO CENTER METRO BLUE LINE METRO RED LINE METRO RED LINE 7th St 8th St 9th St Spring St 6th St Olympic Bl Wilton Pl Arlington Av Staples Center 11th St Rossmore Av th St Rimpau Bl Keniston Av CE534 Crenshaw Bl MAP NOTES a Shubert Theatre LEGEND La Brea Av Hauser Bl Fairfax Av La Cienega Bl Robertson Bl Doheny Dr BEVERLY HILLS Beverly Dr MIRACLE MILE San Vicente Bl Foster Dr Rexford Dr Crescent Dr Canon Dr Carrillo Dr 550 Genesee Av Beverly Dr BBB5 Beverwil Dr ### ### AV BBB C CE M SC Route of Line 28 Short Line Turnaround Late Night Route Timepoint Metro Rail Metro Rail Station Connecting Line Rapid Connecting Line Antelope Valley Transit Authority Santa Monica s Big Blue Bus Culver City Bus LADOT Commuter Express Montebello Municipal Bus Santa Clarits Transit INSET 1 DOWNTOWN LOS ANGELES Route of Line 28 Late Night Route Local Stop Stop and Timepoint Metro Rail Station Metro Rail Station Entrance Metro Rail Constellation a Santa Monica Bl BBB5 CE534 Pico Bl Century Park East Ave Of The Stars MGM Dr SC792,797 CE573 Century Park West BBB5 C3 CENTURY CITY
60 Burton Way Wilshire Bl Wilshire Bl Pico Bl Wilshire Bl Figueroa St Olympic Bl Pico Bl Figueroa St Flower St S Hope St Grand Av Olive St Broadway Main St Hill St Los Angeles St Maple Av Central Av Alameda St Flower St Broadway Main St Central Av Alameda St Grand Av Vignes St ROUTE MAP N Hoover St Vermont Av Normandie Av Western Av Union Av Alvarado St 200 WILSHIRE/ VERMONT WILSHIRE/ NORMANDIE WILSHIRE/ WESTERN WESTLAKE/ MACARTHUR PARK SEE INSET #1 & 2 KOREATOWN DOWNTOWN L.A INSET MAP 1 - DOWNTOWN LOS ANGELES Cesar E Chavez Av 101 S Hope St N Hope St 7TH ST/METRO CENTER Arcadia St Temple St PERSHING SQUARE METRO RED LINE CIVIC CENTER METRO RED LINE UNION STATION 1st St 2nd St 3rd St 4th St Winston St 5th St 6th St 7th St Wilton Pl Arlington Av 8th St Spring St Rossmore Av Rimpau Bl Keniston Av CE534 Crenshaw Bl METRO BLUE LINE Staples Center 9th St Olympic Bl 11th St 12th St La Brea Av Hauser Bl Fairfax Av MIRACLE MILE Genesee Av MAP NOTES a LEGEND Shubert Theatre La Cienega Bl Robertson Bl Doheny Dr BEVERLY HILLS Beverly Dr San Vicente Bl Carrillo Dr Foster Dr Rexford Dr Crescent Dr Canon Dr 14 Beverly Dr BBB5 Beverwil Dr ### ### AV BBB C CE M SC Route of Line 728 Metro Rapid Stops Timepoint & Metro Rapid Stops Metro Rail Metro Rail Station Connecting Line Rapid Connecting Line Antelope Valley Transit Authority Santa Monica s Big Blue Bus Culver City Bus LADOT Commuter Express Montebello Municipal Bus Santa Clarita Transit INSET 1 DOWNTOWN LOS ANGELES Route of Line 728 Local Stop Stop and Timepoint Metro Rail Station Metro Rail Station Entrance Metro Rail Pico Bl Constellation a BBB5 CE534 Century Park East Ave Of The Stars MGM Dr SC792,797 CE573 Century Park West BBB5 C3 Santa Monica Bl CENTURY CITY
61
62 * n
63
64 APPENDIX E TRAFFIC VOLUME DATA
65 INTERSECTION TURNING MOVEMENT COUNT SUMMARY CLIENT: OVERLAND TRAFFIC CONSULTANTS, INC. PROJECT: LOS ANGELES DATE: THURSDAY, APRIL 10, 2008 PERIOD: 07:00 AM TO 09:00 AM INTERSECTION: N/S LA CIENEGA BOULEVARD E/W OLYMPIC BOULEVARD FILE NUMBER: 1-AM 15 MINUTE TOTALS SBRT SBTH SBLT WBRT WBTH WBLT NBRT NBTH NBLT EBRT EBTH EBLT HOUR TOTALS SBRT SBTH SBLT WBRT WBTH WBLT NBRT NBTH NBLT EBRT EBTH EBLT TOTALS A.M. PEAK HOUR OLYMPIC BOULEVARD LA CIENEGA BOULEVARD THE TRAFFIC SOLUTION 329 DIAMOND STREET ARCADIA, CALIFORNIA
66 INTERSECTION TURNING MOVEMENT COUNT SUMMARY CLIENT: OVERLAND TRAFFIC CONSULTANTS, INC. PROJECT: LOS ANGELES DATE: THURSDAY, APRIL 10, 2008 PERIOD: 04:00 PM TO 06:00 PM INTERSECTION: N/S LA CIENEGA BOULEVARD E/W OLYMPIC BOULEVARD FILE NUMBER: 1-PM 15 MINUTE TOTALS SBRT SBTH SBLT WBRT WBTH WBLT NBRT NBTH NBLT EBRT EBTH EBLT HOUR TOTALS SBRT SBTH SBLT WBRT WBTH WBLT NBRT NBTH NBLT EBRT EBTH EBLT TOTALS P.M. PEAK HOUR OLYMPIC BOULEVARD LA CIENEGA BOULEVARD THE TRAFFIC SOLUTION 329 DIAMOND STREET ARCADIA, CALIFORNIA
67 INTERSECTION TURNING MOVEMENT COUNT SUMMARY CLIENT: OVERLAND TRAFFIC CONSULTANTS, INC. PROJECT: LOS ANGELES DATE: THURSDAY, APRIL 10, 2008 PERIOD: 07:00 AM TO 09:00 AM INTERSECTION: N/S LA CIENEGA BOULEVARD E/W WHITWORTH DRIVE FILE NUMBER: 2-AM 15 MINUTE TOTALS SBRT SBTH SBLT WBRT WBTH WBLT NBRT NBTH NBLT EBRT EBTH EBLT HOUR TOTALS SBRT SBTH SBLT WBRT WBTH WBLT NBRT NBTH NBLT EBRT EBTH EBLT TOTALS A.M. PEAK HOUR WHITWORTH DRIVE LA CIENEGA BOULEVARD THE TRAFFIC SOLUTION 329 DIAMOND STREET ARCADIA, CALIFORNIA
68 INTERSECTION TURNING MOVEMENT COUNT SUMMARY CLIENT: OVERLAND TRAFFIC CONSULTANTS, INC. PROJECT: LOS ANGELES DATE: THURSDAY, APRIL 10, 2008 PERIOD: 04:00 PM TO 06:00 PM INTERSECTION: N/S LA CIENEGA BOULEVARD E/W WHITWORTH DRIVE FILE NUMBER: 2-PM 15 MINUTE TOTALS SBRT SBTH SBLT WBRT WBTH WBLT NBRT NBTH NBLT EBRT EBTH EBLT HOUR TOTALS SBRT SBTH SBLT WBRT WBTH WBLT NBRT NBTH NBLT EBRT EBTH EBLT TOTALS P.M. PEAK HOUR WHITWORTH DRIVE LA CIENEGA BOULEVARD THE TRAFFIC SOLUTION 329 DIAMOND STREET ARCADIA, CALIFORNIA
69 INTERSECTION TURNING MOVEMENT COUNT SUMMARY CLIENT: OVERLAND TRAFFIC CONSULTANTS, INC. PROJECT: LOS ANGELES DATE: THURSDAY, APRIL 10, 2008 PERIOD: 07:00 AM TO 09:00 AM INTERSECTION: N/S LA CIENEGA BOULEVARD E/W PICO BOULEVARD FILE NUMBER: 3-AM 15 MINUTE TOTALS SBRT SBTH SBLT WBRT WBTH WBLT NBRT NBTH NBLT EBRT EBTH EBLT HOUR TOTALS SBRT SBTH SBLT WBRT WBTH WBLT NBRT NBTH NBLT EBRT EBTH EBLT TOTALS A.M. PEAK HOUR PICO BOULEVARD LA CIENEGA BOULEVARD THE TRAFFIC SOLUTION 329 DIAMOND STREET ARCADIA, CALIFORNIA
70 INTERSECTION TURNING MOVEMENT COUNT SUMMARY CLIENT: OVERLAND TRAFFIC CONSULTANTS, INC. PROJECT: LOS ANGELES DATE: THURSDAY, APRIL 10, 2008 PERIOD: 04:00 PM TO 06:00 PM INTERSECTION: N/S LA CIENEGA BOULEVARD E/W PICO BOULEVARD FILE NUMBER: 3-PM 15 MINUTE TOTALS SBRT SBTH SBLT WBRT WBTH WBLT NBRT NBTH NBLT EBRT EBTH EBLT HOUR TOTALS SBRT SBTH SBLT WBRT WBTH WBLT NBRT NBTH NBLT EBRT EBTH EBLT TOTALS P.M. PEAK HOUR PICO BOULEVARD LA CIENEGA BOULEVARD THE TRAFFIC SOLUTION 329 DIAMOND STREET ARCADIA, CALIFORNIA
IV. ENVIRONMENTAL IMPACT ANALYSIS M. TRANSPORTATION AND TRAFFIC
 IV. ENVIRONMENTAL IMPACT ANALYSIS M. TRANSPORTATION AND TRAFFIC INTRODUCTION This section of the (Draft EIR) addresses the subject of traffic and transportation with respect to the proposed (Project or
IV. ENVIRONMENTAL IMPACT ANALYSIS N. TRANSPORTATION AND TRAFFIC
 IV. ENVIRONMENTAL IMPACT ANALYSIS N. TRANSPORTATION AND TRAFFIC The following section summarizes the information provided in the traffic report entitled Traffic Impact Analysis for a Proposed Residential
TRANSPORTATION STUDY FOR THE 8899 BEVERLY BOULEVARD PROJECT
 DRAFT TRANSPORTATION STUDY FOR THE 8899 BEVERLY BOULEVARD PROJECT WEST HOLLYWOOD, CALIFORNIA NOVEMBER 2013 PREPARED FOR BEVERLY BOULEVARD ASSOCIATION PREPARED BY DRAFT TRANSPORTATION STUDY FOR THE 8899
MINERVA PARK SITE TRAFFIC IMPACT STUDY M/I HOMES. September 2, 2015
 5500 New Albany Road Columbus, Ohio 43054 Phone: 614.775.4500 Fax: 614.775.4800 Toll Free: 1-888-775-EMHT emht.com 2015-1008 MINERVA PARK SITE TRAFFIC IMPACT STUDY M/I HOMES September 2, 2015 Engineers
IV. ENVIRONMENTAL IMPACT ANALYSIS B. TRAFFIC AND CIRCULATION
 IV. ENVIRONMENTAL IMPACT ANALYSIS B. TRAFFIC AND CIRCULATION 1. INTRODUCTION This section is based on the technical report, Traffic Study for 10131 Constellation Boulevard Residential Project, prepared
Traffic Impact Analysis 5742 BEACH BOULEVARD MIXED USE PROJECT
 Traffic Impact Analysis 5742 BEACH BOULEVARD MIXED USE PROJECT CITY OF BUENA PARK Prepared by Project No. 14139 000 April 17 th, 2015 DKS Associates Jeffrey Heald, P.E. Rohit Itadkar, T.E. 2677 North Main
IV. ENVIRONMENTAL IMPACT ANALYSIS L. TRANSPORTATION/TRAFFIC
 IV. ENVIRONMENTAL IMPACT ANALYSIS L. TRANSPORTATION/TRAFFIC INTRODUCTION The following section summarizes the information provided in the traffic report entitled Traffic Impact Analysis for a Proposed
4.4 Transportation and Circulation
 4.4.1 Introduction This section evaluates the potential for construction traffic and operational impacts to result from implementation of the proposed project. This includes the potential for the project
4.1 Traffic, Circulation, and Parking
 4.1 Traffic, This section describes the existing transportation and parking conditions within and adjacent to the project area. A traffic report describing the potential impacts of the proposed project
King Soopers #116 Thornton, Colorado
 Traffic Impact Study King Soopers #116 Thornton, Colorado Prepared for: Galloway & Company, Inc. T R A F F I C I M P A C T S T U D Y King Soopers #116 Thornton, Colorado Prepared for Galloway & Company
2.4 Build Alternatives
 Table 2-1. Future Transit Network Changes between No Build and TSM Alternatives Operator Route Group No. Route ID and Description Peak Headway (min) No Build Off-peak Headway (min) Peak Headway (min) TSM
TRANSPORTATION 1. INTRODUCTION
 IV.F TRANSPORTATION 1. INTRODUCTION This section evaluates potential impacts associated with Project-related traffic, circulation, and access. The analysis summarizes the findings of the traffic study
2. Valley Circle Boulevard/Andora Avenue/Baden Avenue and Lassen Street
 IV.J TRANSPORTATION 1. INTRODUCTION This section presents an overview of the existing traffic and circulation system in and surrounding the project site. This section also discusses the potential impacts
Project Scoping Report Appendix B Project Web Site. APPENDIX B Project Web Site
 Project Scoping Report Appendix B Project Web Site APPENDIX B Project Web Site WESTSIDE EXTENSION TRANSIT CORRIDOR STUDY February 4, 2008 News and Info of 1 http://metro.net/projects_programs/westside/news_info.htm#topofpage
Escondido Marriott Hotel and Mixed-Use Condominium Project TRAFFIC IMPACT ANALYSIS REPORT
 Escondido Marriott Hotel and Mixed-Use Condominium Project TRAFFIC IMPACT ANALYSIS REPORT Prepared for Phelps Program Management 420 Sixth Avenue, Greeley, CO 80632 Prepared by 5050 Avenida Encinas, Suite
IV. ENVIRONMENTAL IMPACT ANALYSIS I. TRAFFIC / TRANSPORTATION
 IV. ENVIRONMENTAL IMPACT ANALYSIS I. TRAFFIC / TRANSPORTATION 1. INTRODUCTION The following section summarizes the information provided in the following traffic studies and collectively referred to as
ENVIRONMENTAL IMPACT ANALYSIS D. TRANSPORTATION AND CIRCULATION 1. INTRODUCTION
 IV. ENVIRONMENTAL IMPACT ANALYSIS 1. INTRODUCTION This section is based on a traffic and parking impact study that was prepared for the proposed CSMC West Tower Project by Linscott, Law & Greenspan, Engineers,
Appendix Q Traffic Study
 Appendices Appendix Q Traffic Study Crummer Site Subdivision Draft EIR City of Malibu Appendices This page intentionally left blank. The Planning Center April 2013 TRAFFIC IMPACT ANALYSIS Photo z here
APPENDIX C-2. Traffic Study Supplemental Analysis Memo
 APPENDIX C-2 Traffic Study Supplemental Analysis Memo The Mobility Group Transportation Strategies & Solutions Memorandum To: From: Subject: Tomas Carranza, LADOT Matthew Simons Traffic Review - Revised
APPENDIX B Traffic Analysis
 APPENDIX B Traffic Analysis Rim of the World Unified School District Reconfiguration Prepared for: Rim of the World School District 27315 North Bay Road, Blue Jay, CA 92317 Prepared by: 400 Oceangate,
TRAFFIC IMPACT STUDY PROPOSED RESIDENTIAL CARE FACILITY (ASSISTED LIVING) AND 8 SINGLE FAMILY HOMES 3814 LENAWEE AVENUE CULVER CITY, CALIFORNIA
 AND 8 SINGLE FAMILY HOMES 3814 LENAWEE AVENUE CULVER CITY, CALIFORNIA") TRAFFIC IMPACT STUDY PROPOSED RESIDENTIAL CARE FACILITY (ASSISTED LIVING) AND 8 SINGLE FAMILY HOMES 84 LENAWEE AVENUE CULVER CITY, CALIFORNIA PREPARED BY ALLAN ENGINEERING NOV. 05 SUMMARY OF TRAFFIC ELEMENT
TRAFFIC IMPACT STUDY PROPOSED RESIDENTIAL CARE FACILITY (ASSISTED LIVING) AND 8 SINGLE FAMILY HOMES 84 LENAWEE AVENUE CULVER CITY, CALIFORNIA PREPARED BY ALLAN ENGINEERING NOV. 05 SUMMARY OF TRAFFIC ELEMENT
IV. ENVIRONMENTAL IMPACT ANALYSIS J. TRANSPORTATION AND TRAFFIC
 IV. ENVIRONMENTAL IMPACT ANALYSIS J. TRANSPORTATION AND TRAFFIC This Section summarizes the information provided in the Traffic Study for the Santa Monica College Bundy Campus Master Plan (Traffic Study),
Table Existing Traffic Conditions for Arterial Segments along Construction Access Route. Daily
 5.8 TRAFFIC, ACCESS, AND CIRCULATION This section describes existing traffic conditions in the project area; summarizes applicable regulations; and analyzes the potential traffic, access, and circulation
WESTSIDE SUBWAY EXTENSION PROJECT. Updated Off-street Parking Analysis Memorandum
 WESTSIDE SUBWAY EXTENSION PROJECT Updated Off-street Analysis Memorandum April 2011 Table of Contents 1.0 INTRODUCTION... 1 2.0 DATA SOURCE... 1 3.0 OFF-STREET LAND USE & PARKING ANALYSIS... 2 3.1 Station
NOTICE OF PUBLIC HEARING Los Angeles County Metropolitan Transportation Authority
 NOTICE OF PUBLIC HEARING Los Angeles County Metropolitan Transportation Authority The Los Angeles County Metropolitan Transportation Authority will hold public hearings in February 2011 to receive community
Oakbrook Village Plaza City of Laguna Hills
 Oakbrook Village Plaza City of Laguna Hills Traffic Impact Analysis Prepared by: HDR Engineering 3230 El Camino Real, Suite 200 Irvine, CA 92602 October 2012 Revision 3 D-1 Oakbrook Village Plaza Laguna
TRANSPORTATION 1. INTRODUCTION 2. METHODOLOGY
 IV.K TRANSPORTATION 1. INTRODUCTION This section provides an analysis of potential impacts associated with traffic, parking, and access. The analysis provides an overview of existing traffic conditions
Appendix C. Traffic Study
 Appendix C Traffic Study TABLE OF CONTENTS SECTION Executive Summary PAGE 1.0 Introduction... 1 1.1 Scope of Work... 1 1.2 Study Area... 2 2.0 Project Description... 3 2.1 Site Access... 4 2.2 Pedestrian
Traffic Impact Analysis for 2171 Rosecrans Avenue
 Traffic Impact Analysis for 2171 Rosecrans Avenue Prepared for: Continental Development Corporation Revised May 2016 LA16-2831 Prepared by: Fehr & Peers 600 Wilshire Blvd, Suite 1050 Los Angeles, CA 90017
TRAFFIC IMPACT ANALYSIS FOR. McDONALD S RESTAURANT IN CARMICAEL Sacramento County, CA. Prepared For:
 TRAFFIC IMPACT ANALYSIS FOR McDONALD S RESTAURANT IN CARMICAEL Sacramento County, CA Prepared For: McDonald s USA, LLC Pacific Sierra Region 2999 Oak Road, Suite 900 Walnut Creek, CA 94597 Prepared By:
EXECUTIVE SUMMARY. The following is an outline of the traffic analysis performed by Hales Engineering for the traffic conditions of this project.
 EXECUTIVE SUMMARY This study addresses the traffic impacts associated with the proposed Shopko redevelopment located in Sugarhouse, Utah. The Shopko redevelopment project is located between 1300 East and
TRAFFIC IMPACT ANALYSIS FOR A PROPOSED CHICK - FIL - A RESTAURANT. Located at 8521 Sepulveda Boulevard. City of Los Angeles
 TRAFFIC IMPACT ANALYSIS FOR A PROPOSED CHICK - FIL - A RESTAURANT Located at 8521 Sepulveda Boulevard City of Los Angeles Prepared for: 4G Development & Consulting Prepared by: Overland Traffic Consultants,
We re using a giant machine to dig tunnels for trains.
 metro.net/crenshaw We re using a giant machine to dig tunnels for trains. crenshaw/lax transit project Tunnel Boring Machine Fun Facts #CrenshawTBM What is a Tunnel Boring Machine (TBM)? A TBM is like
APPENDIX TR-1 PARKING AND QUEUING ASSESSMENT
 APPENDIX TR-1 PARKING AND QUEUING ASSESSMENT Overland Overland Traffic Consultants, Traffic Consultants, Inc. Inc. Overland Traffic Consultants 952 Manhattan Beach Boulevard, Suite #100 Manhattan Beach,
Impacts to street segments were analyzed based on procedures detailed in the Highway Capacity Manual for levels of service related to roadways.
 4.7 Transportation and Circulation This report documents the results of a study of the potential traffic impacts created by the Whittier Main Oil Field Development Project. The study is included as Appendix
IV. Environmental Impact Analysis J. Traffic, Access, and Parking
 IV. Environmental Impact Analysis J. Traffic, Access, and Parking 1. Introduction This section of the Draft EIR analyzes the proposed Project s potential impacts on traffic, access, and parking. This section
2.0 Development Driveways. Movin Out June 2017
 Movin Out June 2017 1.0 Introduction The proposed Movin Out development is a mixed use development in the northeast quadrant of the intersection of West Broadway and Fayette Avenue in the City of Madison.
TRAFFIC IMPACT ANALYSIS FOR A PROPOSED MIXED USE DEVELOPMENT
 TRAFFIC IMPACT ANALYSIS FOR A PROPOSED MIXED USE DEVELOPMENT Located at southeast corner of Winnetka Avenue and Prairie Street In the City of Los Angeles Prepared for: Sky Tech Management & Construction
Transportation & Traffic Engineering
 Transportation & Traffic Engineering 1) Project Description This report presents a summary of findings for a Traffic Impact Analysis (TIA) performed by A+ Engineering, Inc. for the Hill Country Family
4.14 TRANSPORTATION AND CIRCULATION
 4.14 TRANSPORTATION AND CIRCULATION 4.14.1 Summary Table 4.14-1 summarizes the identified environmental impacts, proposed mitigation measures, and residual impacts of the proposed project with regard to
Appendix B Traffic Impact Analysis, Asphalt Plant No. 1 Replacement and Modernization
 Appendix B Traffic Impact Analysis, Asphalt Plant No. 1 Replacement and Modernization REPORT Traffic Impact Analysis, Asphalt Plant No. 1 Replacement and Modernization Prepared for City of Los Angeles
Traffic Impact Statement (TIS)
") Traffic Impact Statement (TIS) Vincentian PUDA Collier County, FL 10/18/2013 Prepared for: Global Properties of Naples Prepared by: Trebilcock Consulting Solutions, PA 2614 Tamiami Trail N, Suite 615 1205
Traffic Impact Statement (TIS) Vincentian PUDA Collier County, FL 10/18/2013 Prepared for: Global Properties of Naples Prepared by: Trebilcock Consulting Solutions, PA 2614 Tamiami Trail N, Suite 615 1205
Appendix G Traffic and Parking Report
 Appendix G Traffic and Parking Report TABLE OF CONTENTS SECTION PAGE Executive Summary... v 1.0 Introduction... 1 1.1 Study Area... 3 2.0 Project Description... 4 2.1 Site Location... 4 2.2 Existing Project
The major roadways in the study area are State Route 166 and State Route 33, which are shown on Figure 1-1 and described below:
 3.5 TRAFFIC AND CIRCULATION 3.5.1 Existing Conditions 3.5.1.1 Street Network DRAFT ENVIRONMENTAL IMPACT REPORT The major roadways in the study area are State Route 166 and State Route 33, which are shown
Appendix B Traffic Impact Analysis, Asphalt Plant No. 1 Replacement and Modernization
 Appendix B Traffic Impact Analysis, Asphalt Plant No. 1 Replacement and Modernization DRAFT REPORT Traffic Impact Analysis, Asphalt Plant No. 1 Replacement and Modernization Prepared for City of Los Angeles
IRSCH REEN Hirsch/Green Transportation Consulting, Inc.
 IRSCH REEN Hirsch/Green Transportation Consulting, Inc. February 6, 2013 Mr. David Weil Director of Finance St. Matthew s Parish School 1031 Bienveneda Avenue Pacific Palisades, California 90272 RE: Trip
TRAFFIC SIGNAL DESIGN REPORT KING OF PRUSSIA ROAD & RAIDER ROAD RADNOR TOWNSHIP PENNSYLVANIA
 TRAFFIC SIGNAL DESIGN REPORT KING OF PRUSSIA ROAD & RAIDER ROAD RADNOR TOWNSHIP PENNSYLVANIA PREPARED FOR: UNIVERSITY OF PENNSYLVANIA HEALTH SYSTEM 34 CIVIC CENTER BOULEVARD PHILADELPHIA, PA 1987 (61)
Trip Generation & Parking Occupancy Data Collection: Grocery Stores Student Chapter of Institute of Transportation Engineers at UCLA Spring 2014
 Trip Generation & Parking Occupancy Data Collection: Grocery Stores Student Chapter of Institute of Transportation Engineers at UCLA Spring 2014 Page 1 Introduction The UCLA Institute of Transportation
Traffic Impact Study Speedway Gas Station Redevelopment
 Traffic Impact Study Speedway Gas Station Redevelopment Warrenville, Illinois Prepared For: Prepared By: April 11, 2018 Table of Contents 1. Introduction... 1 2. Existing Conditions... 4 Site Location...
TALMONT TOWNHOMES MADISON KENNETH SPA TRAFFIC IMPACT STUDY. Sacramento, CA. Prepared For: MBK Homes. Prepared By:
 TALMONT TOWNHOMES MADISON KENNETH SPA TRAFFIC IMPACT STUDY Sacramento, CA Prepared For: MBK Homes Prepared By: KD Anderson & Associates 3853 Taylor Road, Suite G Loomis, California 95650 (916) 660-1555
Traffic Impact Analysis. Alliance Cole Avenue Residential Site Dallas, Texas. Kimley-Horn and Associates, Inc. Dallas, Texas.
 Traffic Impact Analysis Alliance Cole Avenue Residential Site Dallas, Texas February 15, 2018 Kimley-Horn and Associates, Inc. Dallas, Texas Project #064524900 Registered Firm F-928 Traffic Impact Analysis
TRAFFIC PARKING ANALYSIS
 TRAFFIC PARKING ANALYSIS NAPA FLEA MARKET COUNTY OF NAPA Prepared for: Tom Harding Napa-Vallejo Flea Market 33 Kelly Road American Canyon, CA 9453 Prepared by: 166 Olympic Boulevard, Suite 21 Walnut Creek,
4.7 Construction Surface Transportation
 4.7 Construction Surface Transportation 4.7.1 Introduction The traffic analysis presented in this section addresses the construction traffic impacts specific to the proposed Project. The construction traffic
IV. ENVIRONMENTAL IMPACT ANALYSIS K.2. PARKING
 IV. ENVIRONMENTAL IMPACT ANALYSIS K.2. PARKING ENVIRONMENTAL SETTING The following analysis summarizes the findings and conclusions of the Traffic Analysis (Traffic Study), prepared by The Mobility Group,
Section 3.12 Traffic and Transportation
 Section. Traffic and Transportation SECTION SUMMARY This section describes existing ground transportation within the Port and surrounding area associated with implementation of the proposed Project. An
Volume 1 Traffic Impact Analysis Turtle Creek Boulevard Dallas, Texas. Kimley-Horn and Associates, Inc. Dallas, Texas.
 Volume 1 Traffic Impact Analysis 2727 Dallas, Texas June 18, 2018 Kimley-Horn and Associates, Inc. Dallas, Texas Project #064523000 Registered Firm F-928 Traffic Impact Analysis 2727 Dallas, Texas Prepared
TRAFFIC IMPACT ANALYSIS
 TRAFFIC IMPACT ANALYSIS Emerald Isle Commercial Development Prepared by SEPI Engineering & Construction Prepared for Ark Consulting Group, PLLC March 2016 I. Executive Summary A. Site Location The Emerald
Executive Summary. Draft Environmental Impact Statement/Environmental Impact Report ES-1
 Executive Summary Introduction The Eastside Transit Corridor Phase 2 Project is a vital public transit infrastructure investment that would provide a transit connection to the existing Metro Gold Line
INDUSTRIAL DEVELOPMENT
 INDUSTRIAL DEVELOPMENT Traffic Impact Study Plainfield, Illinois August 2018 Prepared for: Seefried Industrial Properties, Inc. TABLE OF CONTENTS Executive Summary 2 Introduction 3 Existing Conditions
IV. ENVIRONMENTAL IMPACT ANALYSIS C. TRAFFIC CIRCULATION AND PARKING
 IV. ENVIRONMENTAL IMPACT ANALYSIS C. TRAFFIC CIRCULATION AND PARKING 1. INTRODUCTION This section is based on the technical report Traffic Impact Study Health Sciences Campus Project, City of Los Angeles,
RE: A Traffic Impact Statement for a proposed development on Quinpool Road
 James J. Copeland, P.Eng. GRIFFIN transportation group inc. 30 Bonny View Drive Fall River, NS B2T 1R2 May 31, 2018 Ellen O Hara, P.Eng. Project Engineer DesignPoint Engineering & Surveying Ltd. 200 Waterfront
Parks and Transportation System Development Charge Methodology
 City of Sandy Parks and Transportation System Development Charge Methodology March, 2016 Background In order to implement a City Council goal the City of Sandy engaged FCS Group in January of 2015 to update
Costco Gasoline Fuel Station Transportation Characteristics
 Exhibit A MEMORANDUM Date: May 23, 2013 Project #: I-10 To: Jennifer Murillo, Costco Wholesale Terry Odle, Mulvanny G2 Architecture From: Sonia Hennum, PTOE Project: Subject: Signal Hill Costco Gasoline
TRAFFIC IMPACT STUDY FOR SONIC DRIVE-IN RESTAURANT. Vallejo, CA. Prepared For:
 TRAFFIC IMPACT STUDY FOR SONIC DRIVE-IN RESTAURANT Vallejo, CA Prepared For: ELITE DRIVE-INS, INC. 2190 Meridian Park Blvd, Suite G Concord, CA 94520 Prepared By: KD Anderson & Associates 3853 Taylor Road,
Alpine Highway to North County Boulevard Connector Study
 Alpine Highway to North County Boulevard Connector Study prepared by Avenue Consultants March 16, 2017 North County Boulevard Connector Study March 16, 2017 Table of Contents 1 Summary of Findings... 1
APPENDIX H. Transportation Impact Study
 APPENDIX H Transportation Impact Study BUENA VISTA LAGOON ENHANCEMENT PROJECT TRANSPORTATION IMPACT STUDY Prepared for: San Diego Association of Governments Prepared by: VRPA Technologies, Inc. 9520 Padgett
IV. ENVIRONMENTAL IMPACT ANALYSIS L. TRAFFIC, TRANSPORTATION, AND PARKING
 IV. NVIRONMNTAL IMPACT ANALYSIS L. TRAFFIC, TRANSPORTATION, AND PARKING INTRODUCTION The following summarizes the information provided in the traffic report prepared by Hirsch/Green Transportation Consulting,
APPENDIX G TRAFFIC STUDY TECHNICAL MEMORANDUM
 APPENDIX G TRAFFIC STUDY TECHNICAL MEMORANDUM TECHNICAL MEMORANDUM To: From: Date: Subject: Jerry Flores - AECOM Brian A. Marchetti, AICP September 9, 5 DRAFT Traffic Study LABOE Channel 5 Studio Relocation
REGIONAL TRANSPORTATION SETTING
 CIRCULATION ELEMENT WHITE PAPER NO. 1 REGIONAL TRANSPORTATION SETTING INTRODUCTION According to the Southern California Association of Governments (SCAG), by 2030 the six- County region will be home to
Draft Report: West Berkeley Bowl Project
 Draft Report: West Berkeley Bowl Project July 2004 Prepared for: The City of Berkeley 1031-1925 F EHR & PEERS TRANSPORTATION CONSULTANTS 3685 Mt. Diablo Blvd. #301 Lafayette, CA 94549 925-284-3200 Fax:
4.11 TRANSPORTATION AND CIRCULATION
 4.11 TRANSPORTATION AND CIRCULATION This section analyzes onsite development s impacts to the local transportation and circulation system. The analysis is based upon the traffic study prepared by KOA Corporation
APPENDIX C1 TRAFFIC ANALYSIS DESIGN YEAR TRAFFIC ANALYSIS
 APPENDIX C1 TRAFFIC ANALYSIS DESIGN YEAR TRAFFIC ANALYSIS DESIGN YEAR TRAFFIC ANALYSIS February 2018 Highway & Bridge Project PIN 6754.12 Route 13 Connector Road Chemung County February 2018 Appendix
V. ENVIRONMENTAL IMPACT ANALYSIS F. TRANSPORTATION/CIRCULATION
 V. ENVIRONMENTAL IMPACT ANALYSIS F. TRANSPORTATION/CIRCULATION The following Section presents a summary of the Traffic Study for the Proposed Civic Center/Metlox Development Project in the City of Manhattan
THE CORNERSTONE APARTMENTS TRAFFIC IMPACT STUDY R&M PROJECT NO
 THE CORNERSTONE APARTMENTS SITUATED AT N/E/C OF STAUDERMAN AVENUE AND FOREST AVENUE VILLAGE OF LYNBROOK NASSAU COUNTY, NEW YORK TRAFFIC IMPACT STUDY R&M PROJECT NO. 2018-089 September 2018 50 Elm Street,
4.7 Construction Surface Transportation
 4.7.1 Introduction The traffic analysis presented in this section addresses the construction traffic impacts specific to the proposed Project. The construction traffic impacts were analyzed for both the
TABLE OF CONTENTS EXECUTIVE SUMMARY...1 INTRODUCTION...3 PROJECTED FUTURE GROWTH...3 ROADWAY IMPROVEMENT PROJECTS...4 POTENTIAL FUNDING SOURCES...
 Transportation Impact Fee Study September 2014 TABLE OF CONTENTS EXECUTIVE SUMMARY...1 INTRODUCTION...3 PROJECTED FUTURE GROWTH...3 ROADWAY IMPROVEMENT PROJECTS......4 POTENTIAL FUNDING SOURCES...7 PROPOSED
Section 5.8 Transportation and Traffic
 Section 5.8 Transportation and Traffic 5.8 TRANSPORTATION AND TRAFFIC Generous This Section is based on the Topgolf Specific Plan Traffic Impact Analysis (RK Engineering Group, Inc., October 31, 2016);
L1TILE BEARS DAY CARE TRANSPORTATION IMPACT STUDY FORT COLLINS, COLORADO MAY Prepared for:
 L1TILE BEARS DAY CARE TRANSPORTATION IMPACT STUDY FORT COLLINS, COLORADO MAY 2012 Prepared for: Hillside Construction, Inc. 216 Hemlock Street, Suite B Fort Collins, CO 80534 Prepared by: DELICH ASSOCIATES
King County Metro. Columbia Street Transit Priority Improvements Alternative Analysis. Downtown Southend Transit Study. May 2014.
 King County Metro Columbia Street Transit Priority Improvements Alternative Analysis Downtown Southend Transit Study May 2014 Parametrix Table of Contents Introduction... 1 Methodology... 1 Study Area...
NEWCASTLE MIDDLE SCHOOL Traffic Impact Analysis
 Gibson Traffic Consultants 2802 Wetmore Avenue Suite 220 Everett, WA 98201 425.339.8266 NEWCASTLE MIDDLE SCHOOL Traffic Impact Analysis Prepared for: Renton School District Jurisdiction: City of Newcastle
700 University Avenue Mixed-Use Development. Traffic Impact Analysis
 700 University Avenue Mixed-Use Development Traffic Impact Analysis January 20, 2006 Prepared by 700 UNIVERSITY AVENUE MIXED- USE DEVELOPMENT TRAFFIC IMPACT STUDY Table of Contents 1.0 Executive Summary...
3.8 TRANSPORTATION, CIRCULATION AND PARKING
 3.8 TRANSPORTATION, CIRCULATION AND PARKING This section provides an overview of traffic, circulation and parking impacts and evaluates the construction and operational impacts associated with the Proposed
Table of Contents INTRODUCTION... 3 PROJECT STUDY AREA Figure 1 Vicinity Map Study Area... 4 EXISTING CONDITIONS... 5 TRAFFIC OPERATIONS...
 Crosshaven Drive Corridor Study City of Vestavia Hills, Alabama Table of Contents INTRODUCTION... 3 PROJECT STUDY AREA... 3 Figure 1 Vicinity Map Study Area... 4 EXISTING CONDITIONS... 5 TRAFFIC OPERATIONS...
L. KASSAN, P.E. Consulting Traffic Engineer
 ARTHUR L. KASSAN, P.E. Consulting Traffic Engineer Honorable Members of the Planning and Land Use Management Committee c/o City Clerk Room 395, City Hall 200 North Spring Street Los Angeles, CA 90012 Subject:
TRAFFIC IMPACT ANALYSIS SHORTBREAD LOFTS 2009 MODIFICATION Chapel Hill, North Carolina
 TRAFFIC IMPACT ANALYSIS SHORTBREAD LOFTS 2009 MODIFICATION Chapel Hill, North Carolina Prepared for: The Town of Chapel Hill, NC Prepared by: Architects-Engineers-Planners, Inc. November 2009 Traffic Impact
LAWRENCE TRANSIT CENTER LOCATION ANALYSIS 9 TH STREET & ROCKLEDGE ROAD / 21 ST STREET & IOWA STREET LAWRENCE, KANSAS
 LAWRENCE TRANSIT CENTER LOCATION ANALYSIS 9 TH STREET & ROCKLEDGE ROAD / 21 ST STREET & IOWA STREET LAWRENCE, KANSAS TRAFFIC IMPACT STUDY FEBRUARY 214 OA Project No. 213-542 TABLE OF CONTENTS 1. INTRODUCTION...
TABLE OF CONTENTS SECTION PAGE. Executive Summary... xii
 TABLE OF CONTENTS SECTION PAGE Executive Summary... xii 1.0 Introduction... 1 1.1 Study Area... 2 1.2 Traffic Impact Analysis Scenarios... 4 1.3 Study Area - City of Orange... 4 2.0 Project Description
Table of Contents. Traffic Impact Analysis Capital One Building at Schilling Place
 Traffic Impact Analysis Capital One Building at Schilling Place Table of Contents Executive Summary... 1 1. Introduction... 4 2. Project Description... 4 3. Background Information... 4 4. Study Scope...
YULA Boys High School Expansion
 Environmental Review Section City Hall 200 N. Spring Street, Room 750 Los Angeles, CA 90012 RECIRCULATED TRAFFIC/TRANSPORTATION/PARKING CHAPTER WEST LOS ANGELES COMMUNITY PLAN AREA YULA Boys High School
3.14 Parks and Community Facilities
 3.14 Parks and Community Facilities 3.14.1 Introduction This section identifies the park and community facility resources in the study area and examines the potential impacts that the proposed Expo Phase
Traffic Engineering Study
 Traffic Engineering Study Bellaire Boulevard Prepared For: International Management District Technical Services, Inc. Texas Registered Engineering Firm F-3580 November 2009 Executive Summary has been requested
Craig Scheffler, P.E., PTOE HNTB North Carolina, P.C. HNTB Project File: Subject
 TECHNICAL MEMORANDUM To Kumar Neppalli Traffic Engineering Manager Town of Chapel Hill From Craig Scheffler, P.E., PTOE HNTB North Carolina, P.C. Cc HNTB Project File: 38435 Subject Obey Creek TIS 2022
Traffic Impact Study for Proposed Olive Boulevard Development
 Traffic Impact Study for Proposed 11330 Olive Boulevard Development Creve Coeur, Missouri July 7, 2017 Prepared For: 11330 Olive Boulevard Development 11330 Olive Boulevard Creve Coeur, Missouri 63141
TRAFFIC DATA. Existing Derousse Ave./River Rd. AM LOS Analysis Existing Derousse Ave./River Rd. PM LOS Analysis
 Appendix E NJ TRANSIT Pennsauken Junction Transit Center and Park & Ride RiverLINE and Atlantic City Line Pennsauken Township, Camden County, New Jersey TRAFFIC DATA Background Traffic Information for
EXECUTIVE SUMMARY. The valet operation, service area, and drop-off lanes provided will be adequate Page i
 EXECUTIVE SUMMARY MacKenzie Engineering and Planning, Inc. performed an analysis of the traffic impacts resulting from the proposed project site located at 25 SE 4th Avenue, Delray Beach, Florida (PCN
The key roadways in the project vicinity are described below. Exhibit displays the existing number of lanes on the study roadways.
 4.2 TRAFFIC AND CIRCULATION This section presents the key assumptions, methods, and results of analysis for the transportation and circulation impacts of the proposed project. This section is based on
MAYWOOD FLORENCE CHESTERFIELD SQUARE WINDSOR HILLS CULVER CITY. MARINA del REY VENICE C1
 ROUTE MAP Carmelita Av MAYWOOD 251 751 Figueroa St CULVER CITY Boyle Av Soto St Pacific Bl Holmes Av (To Los Angeles) Compton Av Central Av Avalon Bl Main St CHESTERFIELD SQUARE Crenshaw Bl La Brea Av
IV. ENVIRONMENTAL IMPACT ANALYSIS C. TRAFFIC, CIRCULATION AND PARKING
 IV. ENVIRONMENTAL IMPACT ANALYSIS C. TRAFFIC, CIRCULATION AND PARKING 1. INTRODUCTION This section is based on the technical report Traffic Study for the Villa Marina Residential Project, prepared by Kaku
Appendix F: Traffic Impact Analysis
 City of Commerce - Commerce Walmart Project Draft EIR Appendix F: Traffic Impact Analysis Michael Brandman Associates H:\Client (PN-JN)\4147\41470001\EIR\4 - Screencheck2 DEIR\41470001 Sec99-00 Appendix
West Hills Shopping Centre Lowe s Expansion Traffic Impact Study
 West Hills Shopping Centre Lowe s Expansion Traffic Impact Study Prepared for: Armel Corporation January 2015 Paradigm Transportation Solutions Ltd. 22 King Street South, Suite 300 Waterloo ON N2J 1N8