ENVIRONMENTAL IMPACT ANALYSIS D. TRANSPORTATION AND CIRCULATION 1. INTRODUCTION
|
|
|
- Brianne Todd
- 5 years ago
- Views:
Transcription
1 IV. ENVIRONMENTAL IMPACT ANALYSIS 1. INTRODUCTION This section is based on a traffic and parking impact study that was prepared for the proposed CSMC West Tower Project by Linscott, Law & Greenspan, Engineers, dated June 3, 008 (see Appendix E: Traffic Impact Study), which report is incorporated fully herein. The traffic impact study has been prepared through coordination with and reviewed by the City of Los Angeles Department of Transportation ( LADOT ). This section discusses potential impacts on transportation facilities and parking resulting from the proposed Project.. ENVIRONMENTAL CONDITIONS a. Physical Setting Local Street and Freeway System The City of Los Angeles utilizes the roadway categories recognized by regional, state and federal transportation agencies. There are four categories in the roadway hierarchy, ranging from freeways, with the highest capacity, to two-lane undivided roadways, with the lowest capacity. The roadway categories are summarized as follows: Freeways. Limited-access and high-speed travel ways included in the state and federal highway systems. Their purpose is to carry regional through-traffic. Access is provided by interchanges with typical spacing of one mile or greater. No local access is provided to adjacent land uses. There are no regional freeways in the immediate Project area. Within a radius of several miles, however, the Hollywood (101) Freeway runs north-south to the east of the Project Site, the Santa Monica/Rosa Parks (10) Freeway runs east-west to the south of the Project Site and the San Diego (405) Freeway runs north-south to the west of the Project Site. Arterial. Major streets that primarily serve through-traffic and provide access to abutting properties as a secondary function. Arterials are generally designed with two to six travel lanes and their major intersections are signalized. This roadway type is divided into two categories: principal and minor arterials. For the City of Los Angeles, these are referred to as Major Highways Class II and Secondary Highways, respectively. Principal arterials (Major Highway Class II) are typically four-or-more lane roadways and serve both local and regional throughtraffic. Minor arterials (Secondary Highways) are typically two-to-four lane streets that service local and commuter traffic. San Vicente Boulevard and Beverly Boulevard are examples of principal arterials or Major Highways. Robertson Boulevard and Third Street are examples of secondary arterials or Secondary Highways. Collector. Streets that provide access and traffic circulation within residential and nonresidential (e.g., commercial and industrial) areas. They connect local streets to arterials and are PAGE 157
2 typically designed with two through travel lanes (i.e., one through travel lane in each direction) that may accommodate on-street parking and/or provide access to abutting properties. Local. Roadways that distribute traffic within a neighborhood or similar adjacent neighborhoods and are not intended for use as a through-street or a link between higher capacity facilities such as collector or arterial roadways. Local streets are generally fronted by residential uses and do not typically serve commercial uses. Brief descriptions of the important roadways in the Project Site vicinity are provided below: Robertson Boulevard. A north-south oriented roadway that is located immediately adjacent to the west of the CSMC Campus. Robertson Boulevard is designated as a Secondary Highway in the City of Los Angeles General Plan Transportation Element. One through travel lane is provided in each direction on Robertson Boulevard north of Burton Way, and two lanes are provided in each direction on the roadway south of Burton Way. Two hour parking between the hours of 8:00 A.M. and 6:00 P.M. is generally provided along both sides of Robertson Boulevard near the CSMC Campus. Robertson Boulevard is posted for a 35 miles per hour speed limit within the Project study area. George Burns Road. A north-south oriented roadway that bisects the CSMC Campus, extending between Beverly Boulevard and Third Street. George Burns Road is a private roadway within the CSMC Campus, as designated by the City of Los Angeles. The roadway serves as a primary access point to the CSMC Campus, including access to the North and South Towers, the Davis Research Building and the Project Site. One through travel lane is provided in each direction on the roadway and speed humps are provided between Beverly Boulevard and Gracie Allen Drive. The George Burns Road/Gracie Allen Drive intersection is currently all-way stop sign controlled. Parking is prohibited along both sides of George Burns Road within the CSMC Campus. George Burns Road becomes Hamel Road to the south of Third Street outside of the CSMC Campus. Willaman Drive. A north-south oriented roadway that extends between Third Street and Gregory Way. Willaman Drive is designated as a Local roadway in the City of Los Angeles General Plan Transportation Element. One through travel lane is provided in each direction on Willaman Drive in the Project vicinity. Two hour parking between the hours of 8:00 A.M. and 6:00 P.M. is generally provided along both sides of Willaman Drive near the CSMC Campus. There is no posted speed limit on this segment of Willaman Drive in the Project vicinity, thus it is assumed to have a prima facie speed limit of 5 miles per hour. Sherbourne Drive. A north-south oriented roadway that extends southerly from Gracie Allen Drive on the CSMC Campus to Clifton Way. Within the CSMC Campus (i.e., between Gracie Allen Drive and Third Street), Sherbourne Drive is a private CSMC roadway. South of Third Street, Sherbourne Drive is designated as a Collector roadway in the City of Los Angeles General Plan Transportation Element. One through travel lane is provided in each direction on Sherbourne Drive in the Project vicinity. Parking is prohibited along both sides of Sherbourne Drive north of Third Street within the CSMC Campus. South of Third Street, two hour parking PAGE 158
3 between the hours of 8:00 A.M. and 6:00 P.M. is generally provided along both sides of the roadway. San Vicente Boulevard. A northwest-to-southeast oriented roadway that borders the CSMC Campus to the east. San Vicente Boulevard is designated as a Major Highway Class II in the City of Los Angeles General Plan Transportation Element. Two through travel lanes are provided in each direction on San Vicente Boulevard in the Project vicinity. Parking is prohibited along both sides of San Vicente Boulevard south of Beverly Boulevard. North of Beverly Boulevard, two hour parking between the hours of 7:00 A.M. and 7:00 P.M. is generally provided along both sides of the roadway. San Vicente Boulevard is posted for a 35 miles per hour speed limit within the Project study area. La Cienega Boulevard. A north-south oriented roadway that is located east of the CSMC Campus. La Cienega Boulevard is designated as a Major Highway Class II in the City of Los Angeles General Plan Transportation Element. Two through travel lanes are provided in each direction on La Cienega Boulevard in the Project vicinity. Parking is prohibited along both sides of the roadway in the vicinity of the CSMC Campus. La Cienega Boulevard is posted for a 35 miles per hour speed limit within the Project study area. Beverly Boulevard. An east-west oriented roadway that borders the CSMC Campus to the north. Beverly Boulevard is designated as a Major Highway Class II in the City of Los Angeles General Plan Transportation Element. Two through travel lanes are provided in each direction on Beverly Boulevard in the Project vicinity. Two hour parking between the hours of 8:00 A.M. and 6:00 P.M. is generally provided along both sides of the roadway near the CSMC Campus. Beverly Boulevard is posted for a 35 miles per hour speed limit within the Project study area. Gracie Allen Drive. An east-west oriented roadway that bisects the CSMC Campus, extending between Robertson Boulevard and San Vicente Boulevard. Gracie Allen Drive is a private roadway within the CSMC Campus, as designated by the City of Los Angeles. Gracie Allen Drive serves as a primary access point to the CSMC Campus, including access to the S. Mark Taper Foundation Imaging Center, the emergency entrance to the North Tower, and the Project Site. One to two through travel lanes are provided in each direction on Gracie Allen Drive in the Project vicinity. The George Burns Road/Gracie Allen Drive intersection is currently all-way stop sign controlled. Parking is prohibited along both sides of Gracie Allen Drive within the CSMC Campus. Gracie Allen Drive becomes Alden Drive between George Burns Road and Robertson Boulevard and continues as Alden Drive west of Robertson Boulevard. Third Street. An east-west oriented roadway that borders the CSMC Campus to the south. Third Street is designated as a Secondary Highway in the City of Los Angeles General Plan Transportation Element. One through travel lane is provided in each direction on Third Street near the CSMC Campus, although two through travel lanes are provided in each direction on the roadway as a result of weekday peak commuter period curbside parking restrictions. Parking is prohibited along the north side of Third Street adjacent to the CSMC Campus. Two hour parking between the hours of 9:00 AM and 4:00 PM, however, is generally provided along the south side of Third Street near the CSMC Campus. Third Street is posted for a 30 miles per hour speed limit within the Project study area. PAGE 159
4 Burton Way. An east-west oriented roadway that is located south of the CSMC Campus. Burton Way is designated as a Secondary Highway in the City of Los Angeles General Plan Transportation Element. A raised median island is provided on the roadway within the Project area. Three through travel lanes are provided in each direction on Burton Way in the vicinity of the CSMC Campus. Two hour parking between the hours of 8:00 A.M. and 6:00 P.M. is generally provided along both sides of Burton Way within the Project area. Burton Way is posted for a 35 miles per hour speed limit within the Project study area. Wilshire Boulevard. An east-west oriented roadway that is located south of the CSMC Campus. Wilshire Boulevard is designated as a Major Highway Class II in the City of Los Angeles General Plan Transportation Element. Three through travel lanes are provided in each direction on Wilshire Boulevard within the Project area. One hour parking between the hours of 10:00 AM and 3:00 PM is generally provided along both sides of Wilshire Boulevard within the Project area. Wilshire Boulevard is posted for a 35 miles per hour speed limit within the Project study area. () Traffic Conditions and Levels of Service The traffic analysis study area is generally comprised of locations that have the greatest potential to experience significant traffic impacts due to the Project, as defined by the Lead Agency. In the traffic engineering practice, the study area generally includes those intersections that are: a. Immediately adjacent or in close proximity to the project site; b. In the vicinity of the project site that are documented to have current or projected future adverse operational issues; and c. In the vicinity of the project site that are forecast to experience a relatively greater percentage of project-related vehicular turning movements (e.g., at freeway ramp intersections). (a) Study Intersections After conferencing with City of Los Angeles staff, twenty-two () study intersections were identified for evaluation of potential Project impacts during the weekday morning ( A.M. ) and afternoon ( P.M. ). A traffic sub-consultant, Accutek Traffic Data, Inc., conducted manual counts at the study intersections during October 007 and observed peak hour traffic volumes were increased at an annual rate of one percent (1%) per year to reflect year 008 existing conditions. The following study intersections were selected for analyses in consultation with LADOT staff in order to determine potential impacts related to the proposed Project: Int. No. 1: Robertson Boulevard/Beverly Boulevard. 1 Int. No. : Robertson Boulevard/Alden Drive-Gracie Allen Drive. 1 City of West Hollywood study intersection. City of Los Angeles study intersection. PAGE 160
5 Int. No. 3: Robertson Boulevard/Third Street. Int. No. 4: Robertson Boulevard/Burton Way. 3 Int. No. 5: Robertson Boulevard/Wilshire Boulevard. 4 Int. No. 6: George Burns Road/Beverly Boulevard. 1 Int. No. 7: George Burns Road/Gracie Allen Drive. 5 Int. No. 8: George Burns Road-Hamel Road/Third Street. Int. No. 9: Willaman Drive/Third Street. Int. No. 10: Willaman Drive/Wilshire Boulevard. 4 Int. No. 11: Sherbourne Drive/Third Street. Int. No. 1: San Vicente Boulevard/Melrose Avenue. 1 Int. No. 13: San Vicente Boulevard/Beverly Boulevard. 1 Int. No. 14: San Vicente Boulevard/Gracie Allen Drive-Beverly Center. Int. No. 15: San Vicente Boulevard/Third Street. Int. No. 16: San Vicente Boulevard-Le Doux Road/Burton Way. Int. No. 17: San Vicente Boulevard/Wilshire Boulevard. 3 Int. No. 18: La Cienega Boulevard/Beverly Boulevard. Int. No. 19: La Cienega Boulevard/Third Street. Int. No. 0: La Cienega Boulevard/San Vicente Boulevard. Int. No. 1 La Cienega Boulevard/Wilshire Boulevard. 4 Int. No. Orlando Avenue/Third Street. The general location of the Project in relation to the study locations and surrounding street system is presented in Figure 31: Study Intersection Map. The existing weekday A.M. and P.M. peak commuter period manual counts of turning vehicles at the study intersections are summarized in Table 4: Existing Traffic Volumes. The existing traffic volumes at the study intersections during the weekday A.M. and P.M. peak commuter hours are shown in Figure 3: Existing Traffic Volumes - A.M. Peak Hour and Figure 33: Existing Traffic Volumes - P.M. Peak Hour, respectively. Summary data worksheets of the manual traffic counts at the study intersections are contained in Appendix E: Traffic Impact Study. A total of 1 of the study intersections are controlled by traffic signals. The remaining study intersection (Intersection No. 7, George Burns Road/Gracie Allen Drive) is controlled by all-way stop signs. The existing lane configurations at the study intersections are displayed in Figure 34: Existing Lane Configuration at Study Intersections. 3 Shared City of Los Angeles/City of Beverly Hills study intersection. 4 City of Beverly Hills study intersection. 5 CSMC privately controlled study intersection. PAGE 161

6 CITY OF LOS ANGELES STUDY INTERSECTION PROJECT SITE CITY OF WEST HOLLYWOOD CITY OF BEVERLY HILLS SOURCE: LINSCOTT, LAW & GREENSPAN, ENGINEERS FIGURE 31 STUDY INTERSECTION MAP NORTH PAGE 16
7 TABLE 4 EXISTING TRAFFIC VOLUMES [1] AM PEAK HOUR PM PEAK HOUR NO. INTERSECTION DATE DIR BEGAN VOLUME BEGAN VOLUME 1 Robertson Boulevard/ Beverly Boulevard Robertson Boulevard/ Alden Drive-Gracie Allen Drive 3 Robertson Boulevard/ Third Street 4 Robertson Boulevard/ Burton Way 5 Robertson Boulevard/ Wilshire Boulevard 6 George Burns Road/ Beverly Boulevard 7 George Burns Road/ Gracie Allen Drive 8 George Burns Road- Hamel Road/ Third Street 10/09/007 10/09/007 10/09/007 10/17/007 10/17/007 10/10/007 10/10/007 10/10/007 NB SB 8: : EB 1,09 1,330 WB 1,54 1,11 NB SB 8: :45 57 EB WB NB SB 8: :45 59 EB WB NB SB 8: : EB 779 1,01 WB 1,540 1,043 NB SB 8: :00 86 EB 1,51 1,978 WB,177 1,511 NB SB 8:00 9 4:30 73 EB 1,018 1,314 WB 1,790 1,19 NB SB 7: :30 7 EB WB NB SB 8:00 1 4: EB WB 1, PAGE 163
8 TABLE 4 (CONTINUED) EXISTING TRAFFIC VOLUMES [1] AM PEAK HOUR PM PEAK HOUR NO. INTERSECTION DATE DIR BEGAN VOLUME BEGAN VOLUME 9 Wilaman Drive/ Third Street 10 Willaman Drive/ Wilshire Boulevard 11 Sherbourne Drive/ Third Street 1 San Vicente Boulevard/ Melrose Avenue 13 San Vicente Boulevard/ Beverly Boulevard 14 San Vicente Boulevard/ Gracie Allen Drive- Beverly Center 15 San Vicente Boulevard/ Third Street 16 San Vicente Boulevard- Le Doux Road/ Burton Way 10/10/007 10/17/007 10/10/007 10/17/007 10/11/007 10/11/007 10/11/007 10/16/007 NB SB 8:30 0 4:45 0 EB WB 1, NB SB 8: : EB 1,67 1,758 WB,036 1,45 NB SB 8: : EB 68 1,178 WB 1, NB 813 1,095 SB 8: : EB WB 1,08 87 NB 891 1,07 SB 8:30 1,076 4: EB 78 1,331 WB 1,55 1,06 NB SB 8: : EB WB NB SB 8: :00 1,16 EB 551 1,31 WB 1, NB 0 65 SB 8: :45 1,070 EB 537 1,198 WB,056 1,336 PAGE 164
9 TABLE 4 (CONTINUED) EXISTING TRAFFIC VOLUMES [1] AM PEAK HOUR PM PEAK HOUR NO. INTERSECTION DATE DIR BEGAN VOLUME BEGAN VOLUME 17 San Vicente Boulevard/ Wilshire Boulevard 18 La Cienega Boulevard/ Beverly Boulevard 19 La Cienega Boulevard/ Third Street 0 La Cienega Boulevard/ San Vicente Boulevard 1 La Cienega Boulevard/ Wilshire Boulevard Orlando Avenue/ Third Street 10/18/007 10/18/007 10/16/007 10/16/007 10/18/007 10/10/007 NB 1,7 969 SB 8:15 1,061 5:00 1,448 EB 1,3 1,519 WB 1,448 1,446 NB 1,019 1,719 SB 8:45 1,58 5:00 1,76 EB 779 1,649 WB 1,515 1,104 NB 1,305 1,687 SB 8:00 1,437 5:00 1,318 EB 535 1,33 WB 1, NB 1,389 1,66 SB 8:00 1,570 5:00 1,346 EB 1,183,16 WB,040 1,476 NB 1,73 1,585 SB 8:15 1,334 5:00 1,545 EB 1,75 1,653 WB 1,841 1,509 NB SB 8: :00 45 EB 600 1,91 WB 1, [1] Counts conducted by Accutek. NOTE: Year 007 manual traffic counts were adjusted by a 1.0 percent (1.0%) ambient growth factor to reflect year 008 existing conditions. PAGE 165
10 SOURCE: LINSCOTT, LAW & GREENSPAN, ENGINEERS FIGURE 3 EXISTING TRAFFIC VOLUMES - A.M. PEAK HOUR NORTH PAGE 166
11 SOURCE: LINSCOTT, LAW & GREENSPAN, ENGINEERS FIGURE 33 EXISTING TRAFFIC VOLUMES - P.M. PEAK HOUR NORTH PAGE 167
12 FIGURE 34 EXISTING LANE CONFIGURATION AT STUDY INTERSECTIONS SOURCE: LINSCOTT, LAW & GREENSPAN, ENGINEERS NORTH PAGE 168
13 (b) Level of Service Methodology The study intersections were evaluated using the Critical Movement Analysis ( CMA ) method, which determines the Volume-to-Capacity ( V/C ) ratio on a critical lane basis. The V/C ratio is a measure of an intersection s traffic (existing or projected) as compared to the theoretical (design) capacity of the intersection. The overall intersection V/C ratio is subsequently assigned a Level of Service ( LOS ) value to describe intersection operations. LOS is a qualitative indicator of an intersection's operating conditions, which is used to represent various degrees of congestion and delay. LOS varies from LOS A (free flow with little or no delay) to LOS F (jammed conditions resulting from extreme congestion). A more detailed description of the CMA method and values and explanation of corresponding Levels of Service are provided in Appendix B of Appendix E: Traffic Impact Study. The relationship between CMA V/C ratios and LOS for intersection capacity calculations is generally as follows: Existing Intersection LOS V/C RATIO LOS 0 to 0.60 A 0.61 to 0.70 B 0.71 to 0.80 C 0.81 to 0.90 D 0.91 to l.00 E 1.00 F Eighteen of the study intersections are presently operating at LOS D or better during the weekday A.M. and P.M. peak hours under existing conditions, as will be discussed in more detail in a later section. The following four study intersections are currently operating at LOS E during the weekday peak hours as shown below: Int. No. 1: Robertson Blvd./Beverly Blvd. Int. No. 5: Robertson Blvd./Wilshire Blvd. Int. No. 18: La Cienega Blvd./Beverly Blvd. Int. No. 1: La Cienega Blvd./Wilshire Blvd. A.M. Peak Hour: V/C=0.914, LOS E A.M. Peak Hour: V/C=0.957, LOS E P.M. Peak Hour: V/C=0.990, LOS E P.M. Peak Hour: V/C=0.989, LOS E A.M. Peak Hour: V/C=0.976, LOS E P.M. Peak Hour: V/C=0.996, LOS E (3) Access and Local Circulation The CSMC Campus and Project Site may be accessed through a combination of the local public street system and the private CSMC Campus internal streets, as shown on Figure 35: CSMC Campus Access. PAGE 169

14 SOURCE: HOK FIGURE 35 CSMC CAMPUS ACCESS NORTH PAGE 170
15 External vehicular access to the CSMC Campus is provided via five key intersections that are presently traffic signal controlled and are located on the periphery of the CSMC Campus. Leftturn lanes are provided at all of the subject intersections to facilitate access into the CSMC Campus. The five key CSMC Campus access intersections are: Robertson Boulevard/Alden Drive-Gracie Allen Drive George Burns Road/Beverly Boulevard George Burns Road-Hamel Road/Third Street Sherbourne Drive/Third Street San Vicente Boulevard/Gracie Allen Drive-Beverly Center Internal circulation within the CSMC Campus is primarily facilitated by three private roadways that provide access to the CSMC Campus parking facilities and medical buildings: the northsouth oriented George Burns Road, the east-west oriented Gracie Allen Drive and the northsouth oriented Sherbourne Drive. Two external CSMC Campus driveways are provided on the south side of Beverly Boulevard between George Burns Road and San Vicente Boulevard and two are provided on the west side of San Vicente Boulevard between Gracie Allen Drive and Third Street. All of the remaining CSMC Campus driveways providing access to parking facilities and medical buildings are situated within the CSMC Campus. This Project contains no planned changes to the five CSMC Campus key access intersections or the external CSMC Campus driveways as they were approved under the Master Plan. The existing internal driveway, located at the northwest corner of George Burns Road and Gracie Allen Drive that accesses the Project Site, will be removed; however, access to the planned adjoining parking structure will be provided via a new driveway along the north side of Gracie Allen Drive. (4) Parking A total of 6,894 parking spaces are currently provided on the CSMC Campus, in accordance with the City parking requirements approved under Ordinance No. 168,847. This total includes 5,40 spaces in parking facilities controlled by CSMC and a total of 1,654 parking spaces in the two Medical Office Tower parking structures located south of the CSMC Campus along Third Street. After completion of the Advanced Health Sciences Pavilion (construction beginning in the first quarter of 009), a net additional 381 parking spaces 6 will be provided on the Campus, bringing the total amount of parking provided on the Campus to 7,75 parking spaces by the start of the construction/demolition process for the Project. For purposes of this Draft SEIR, the 7,75 parking spaces resulting after construction of the Advanced Health Sciences Pavilion will be considered as the currently existing parking count. 6 The net additional 381 parking spaces accounts for demolition of the existing 166-space parking lot at the Advanced Health Sciences Pavilion site and construction of 547 new parking spaces ( = 381 net additional spaces). PAGE 171
16 (5) Public Transit The Metro, LADOT and the City of West Hollywood currently provide public bus transit service within the CSMC Campus area. A summary of existing transit routes that serve the Project vicinity is provided in Table 5: Existing Public Transit Routes and illustrated in Figure 36: Existing Public Transit Routes. TABLE 5 EXISTING PUBLIC TRANSIT ROUTES [1] ROUTE DESTINATIONS ROADWAY NEAR SITE Metro 14 Beverly Hills to Downtown Los Angeles Beverly Boulevard Metro 16 Metro 18 Metro 0 Metro 316 Metro 305 Metro 550 Century City to Downtown Los Angeles (via Hancock Park, Westlake) Cedars-Sinai Medical Center to Studio City (via Beverly Hills, Park La Brea, West Hollywood) Culver City to West Hollywood (via Beverly Hills) Century City to Downtown Los Angeles (via Hancock Park, Westlake) Willowbrook to Westwood (via Watts, South LA, Crenshaw District, Mid-City, Miracle Mile, West Hollywood, Beverly Hills) San Pedro to West Hollywood (via Harbor City, Harbor Gateway, Los Angeles Exposition Park, Mid-City, Beverly Hills) Third Street Third Street Robertson Boulevard Third Street San Vicente Boulevard San Vicente Boulevard Metro 714 Beverly Hills to Downtown Los Angeles Beverly Boulevard Dash- Fairfax [] Dash- Hollywood/ West Hollywood [] West Hollywood City Line Route A/B [3] Wilshire Boulevard to Robertson Boulevard (Fairfax Avenue., Melrose Avenue, La Cienega Boulevard) Hollywood to West Hollywood Hollywood to Beverly Hills (via West Hollywod) Third Street Gracie Allen Drive San Vicente Boulevard NO. OF BUSES DURING PEAK HOUR DIR AM PM EB 6 6 WB EB WB NB SB NB SB EB WB [1] Sources: Los Angeles County Metropolitan Transportation Authority (LACMTA) Website, [] Sources: City of Los Angeles Department of Transportation (LADOT) Website, [3] Sources: City of West Hollywood Website, NB SB NB SB EB WB EB WB EB WB EB WB PAGE 17

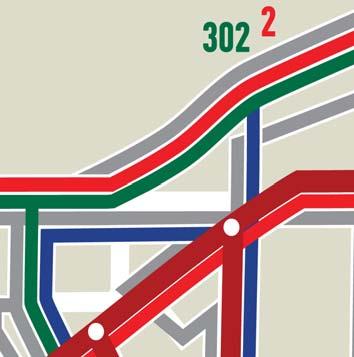

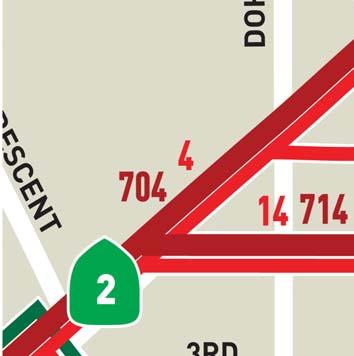
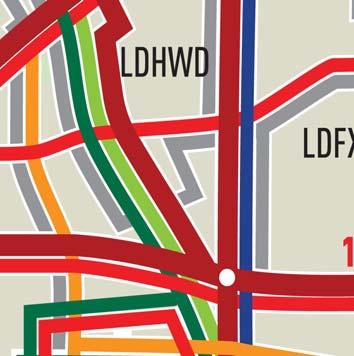
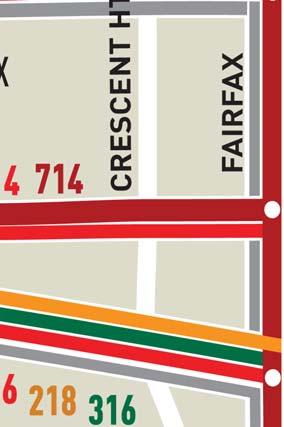
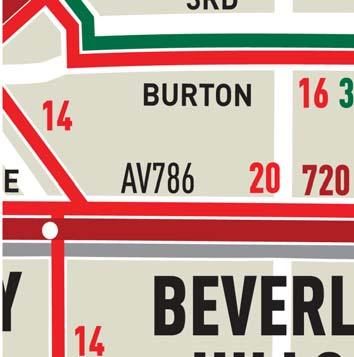
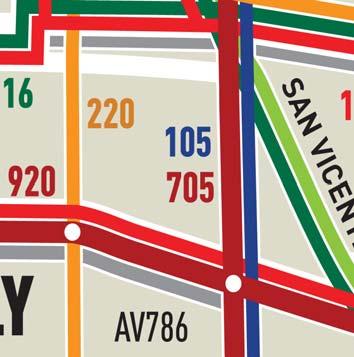
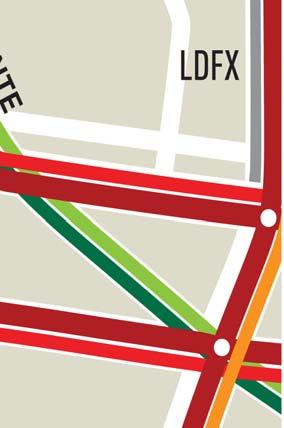
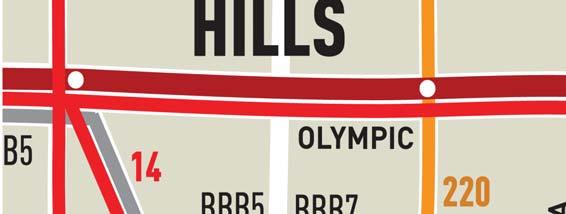

17 PROJECT SITE SOURCE: METROPOLITAN TRANSPORTATION AUTHORITY FIGURE 36 EXISTING PUBLIC TRANSIT ROUTES NORTH PAGE 173
18 The location of the CSMC Campus facilitates pedestrian activity, bicycle usage and use of public transit services, particularly due to the proximity of nearby commercial corridors. Regional and local public bus transit stops are provided on the periphery of the CSMC Campus, as well as within the Campus along George Burns Road and Gracie Allen Drive. b. Regulatory and Policy Setting General Plan Circulation Element and Community Plan The Wilshire Community Plan (the Community Plan ) was adopted on September 19, 001 to guide the development in the Project area. The Community Plan includes goals, objectives and policies pertaining to transportation issues, which focus predominantly on public transit, alternative transportation modes, transportation systems and congestion management, and parking. The Community Plan notes that some of the major public transportation opportunities within the Community Plan area relate to the MTA rail transit lines and bus transit service. The Community Plan recognizes that the operation of a safe, convenient, and efficient mass transit line would also lessen regional dependence on the private automobile and the need for additional traffic capacity. With regard to transportation demand management ( TDM ), it is the City's objective that the traffic LOS on the street system not exceed LOS D. TDM is a program designed to encourage people to change their mode of travel from single occupancy automotive vehicles to more efficient transportation modes. People are given incentives to utilize TDM measures such as public transit, ridesharing, modified work schedules, van pools, telecommuting, and nonmotorized transportation modes such as the bicycle. The City actively enforces TDM requirements through a City-wide TDM Ordinance, participation in regional transportation management programs, and formation of localized transportation management associations. () Regional Transportation System The Congestion Management Program (the CMP ) is a state-mandated program that was enacted by the State Legislature with the passage of Proposition 111 in 1990 to address the impact of local growth on the regional transportation system. The MTA developed the 004 CMP Traffic Impact Analysis ( TIA ) guidelines for Los Angeles County (July 004), which require that intersection and/or freeway monitoring locations be examined if a proposed project will add 50 or 150 more trips, respectively, during the A.M. or P.M. weekday peak periods. The following CMP intersection monitoring locations in the Project area have been identified and will be discussed later: CMP Station Designation Intersection Int. No. 5 Santa Monica Boulevard/Wilshire Boulevard Int. No. 6 Wilshire Boulevard/La Cienega Boulevard (Study Int. No. 1) Int. No. 161 Santa Monica Boulevard/La Cienega Boulevard PAGE 174
19 c. CSMC Campus Background and 1993 Approvals On June 3, 1993, the Los Angeles City Council passed Ordinance Nos. 168,847 and 168,848 approving a Development Agreement, Master Plan, and Zone/Height District Change for the CSMC Campus. The CSMC Master Plan includes 700,000 square feet of medical space floor area, as analyzed and certified in the Original EIR, of which 59,350 square feet will have been built at the time of Project construction (including the Advanced Health Sciences Pavilion to begin construction in first quarter of 009). Thus, the Master Plan currently contains 170,650 square feet of remaining entitlements that are un-built. The proposed Project includes an amendment to the Master Plan to accommodate 100 additional inpatient beds within 00,000 additional square feet of inpatient floor area on the CSMC Campus. The Original EIR examined the transportation impacts associated with development of the Approved Building on the Project Site under the Master Plan; therefore, several findings discussed in the Original EIR will reasonably apply to the transportation impact analysis for the proposed Project below. Therefore, the findings of the Original EIR will be referenced and used for comparison when reasonably applicable in the transportation analysis of this Draft SEIR. 3. ENVIRONMENTAL IMPACTS a. Methodology Construction Analysis To estimate the construction traffic impacts of the CSMC West Tower Project, certain construction assumptions must be made, which are detailed in the construction analysis below. After assumptions are made, construction traffic trip generations are calculated for daily construction trips associated with worker vehicles, haul trucks and miscellaneous trucks used during the construction process. A standard percentage of the daily construction trips generated are then assumed to be traveling during the weekday A.M. peak hour and P.M. peak hour. For miscellaneous construction trucks, a Passenger Car Equivalency ( PCE ) has been determined and has been applied to the truck trips to estimate the number of passenger vehicle trips that would be associated with these trucks. The final estimated weekday A.M. and P.M. peak hour trips are expressed in PCE vehicle trips. () Intersection Analysis To estimate the traffic impacts of the West Tower Project, a multi-step process was utilized. First, trip generation estimates are used to calculate the total arriving and departing traffic volumes on a peak hour (i.e., A.M. and P.M.) and daily basis. The traffic generation potential is forecast by applying the appropriate vehicle trip generation equations or rates to the Project development tabulation (i.e., 100 inpatient beds). Second, trip distribution identifies the origins and destinations of inbound and outbound Project traffic volumes. These origins and destinations are typically based on demographics and existing/anticipated travel patterns in the study area. PAGE 175
20 Third, traffic assignment involves the allocation of Project traffic to study area streets and intersections. Traffic assignment is typically based on minimization of travel time, which may or may not involve the shortest route, depending on prevailing operating conditions and travel speeds. Traffic distribution patterns are indicated by general percentage orientation, while traffic assignment allocates specific volume forecasts to individual roadway links and intersection turning movements throughout the study area. With the forecasting process complete and project traffic assignments developed, the impact of the Project is isolated by comparing operational (i.e., LOS) conditions at the selected key intersections using expected future traffic volumes with and without the forecasted Project traffic. The need for site-specific and/or cumulative local area traffic improvements can then be evaluated and the significance of the Project s impacts identified. As previously explained, the study intersections were evaluated using the CMA method of analysis. The relative impact of the added traffic volumes to be generated by the Project during the A.M. and P.M. peak hours was evaluated based on analysis of future operating conditions at the study intersections, with and without the forecasted Project traffic. The previously discussed capacity analysis procedures were utilized to evaluate the future V/C relationships and LOS characteristics at each study intersection. Traffic impacts at the study intersections were analyzed for the following conditions: [a] Existing conditions. [b] Condition [a] plus 1.0 percent (1.0%) ambient traffic growth through year 03 ( Existing With Ambient Growth Conditions ). [c] Condition [b] with completion and occupancy of the Related Projects ( Future Pre- Project Conditions ). [d] Condition [c] with completion and occupancy of the Project ( Future With Project Conditions ). [e] Condition [d] with implementation of Project mitigation measures, where necessary ( Future Project with Mitigation Conditions ). The traffic volumes for each new condition were added to the volumes in the prior condition to determine the change in capacity utilization at the study intersections. Thus, the Future With Project Conditions analyze the cumulative impact of the proposed Project and provide a conservative and comprehensive analysis of the future conditions in the study area after anticipated full occupancy of the proposed Project in year 03. Summaries of the forecast V/C ratios and LOS values for the study intersections during the A.M. and P.M. peak hours are shown in Table 6: Summary of Volume-To-Capacity Ratios and Levels of Service. The traffic analysis PAGE 176
21 NO INTERSECTION PEAK HOUR [1] EXISTING TABLE 6 SUMMARY OF VOLUME TO CAPACITY RATIOS AND LEVEL OF SERVICE [] YEAR 03 W/ AMBIENT GROWTH [3] YEAR 03 W/ RELATED PROJECTS YEAR 03 W/ PROPOSED PROJECT [4] [5] CHANGE V/C ([4] - [3]) SIGNIF. IMPACT YEAR 03 W/ PROJECT MITIGATION CHANGE V/C ([5] - [3]) V/C LOS V/C LOS V/C LOS V/C LOS V/C LOS AM E F F 1.30 F NO 1.30 F Robertson Boulevard/ Beverly Boulevard PM C 0.83 D 1.3 F 1.39 F NO 1.39 F Robertson Boulevard/ Alden Drive- Gracie Allen Drive AM A A 0.85 D 0.87 D 0.0 YES 0.87 D YES PM 0.57 A B F F 0.09 YES E YES Robertson Boulevard/ AM C C 1.18 F F NO F Third Street PM B C 1.3 F 1.7 F NO 1.7 F Robertson Boulevard/ AM 0.84 D 0.98 E 1.6 F 1.66 F NO 1.66 F Burton Way PM 0.87 D E 1.87 F 1.95 F NO 1.95 F Robertson Boulevard/ AM E F F F NO F Wilshire Boulevard PM E F F F NO F George Burns Road/ AM 0.53 A 0.58 A B C 0.00 NO B Beverly Boulevard PM B C 0.99 E E 0.0 YES E YES George Burns Road/ AM A 0.53 A B C NO C Gracie Allen Drive PM A B B C NO C George Burns Road- AM B C D D 0.01 NO D 0.01 Hamel Road/ Third Street PM A 0.48 A B B NO B Willaman Drive/ AM A A A A NO A Third Street PM A A B B NO B Willaman Drive/ AM C 0.80 D E E NO E Wilshire Boulevard PM B C D D NO D Sherbourne Drive/ AM A 0.50 A B B NO C Third Street PM 0.44 A A 0.65 B B NO B San Vicente Boulevard/ AM D E 1.10 F 1.11 F NO 1.11 F Melrose Avenue PM 0.77 C D 1.33 F 1.35 F 0.00 NO 1.35 F 0.00 San Vicente Boulevard/ AM 0.73 C D F F NO F Beverly Boulevard PM C D F F NO F San Vicente Boulevard/ AM A A A A NO A Gracie Allen Drive- Beverly Center PM A B C C NO C San Vicente Boulevard/ AM C 0.83 D F 1.15 F NO 1.15 F Third Street PM C C F F NO F MITI- GATED PAGE 177
22 NO INTERSECTION San Vicente Boulevard- Le Doux Road/ Burton Way PEAK HOUR [1] EXISTING TABLE 6 (CONTINUED) SUMMARY OF VOLUME TO CAPACITY RATIOS AND LEVEL OF SERVICE [4] [5] [] YEAR 03 W/ AMBIENT GROWTH [3] YEAR 03 W/ RELATED PROJECTS YEAR 03 W/ PROPOSED PROJECT CHANGE V/C ([4] - [3]) SIGNIF. IMPACT YEAR 03 W/ PROJECT MITIGATION CHANGE V/C ([5] - [3]) V/C LOS V/C LOS V/C LOS V/C LOS V/C LOS AM A A C C NO C PM A B E E NO E San Vicente Boulevard/ AM C D F F NO F Wilshire Boulevard PM 0.71 C D F F NO F La Cienega Boulevard/ AM 0.88 D E 1.19 F 1.01 F NO 1.01 F Beverly Boulevard PM E F F F NO F La Cienega Boulevard/ AM 0.85 D 0.99 E 1.16 F 1.1 F NO 1.1 F Third Street PM D E F 1.37 F NO 1.37 F La Cienega Boulevard/ AM 0.8 D 0.95 E 1.31 F 1.34 F NO 1.34 F San Vicente Boulevard PM 0.73 C 0.8 D 1.19 F F NO F La Cienega Boulevard/ AM E 1.1 F F F NO F Wilshire Boulevard PM E F F F 0.00 NO F 0.00 Orlando Avenue/ AM C D E E NO E Third Street PM C C F F 0.00 NO F 0.00 MITI- GATED PAGE 178
23 follows the City of Los Angeles traffic study guidelines 7 and is consistent with traffic impact assessment guidelines set forth in the Los Angeles County Congestion Management Program. 8 This traffic analysis evaluates potential Project-related impacts at the study intersections in the vicinity of the Project Site. The forecast of future conditions was prepared in accordance with procedures outlined in Section of the CEQA Guidelines. Specifically, the CEQA Guidelines provide two options for developing the future traffic volume forecast: (A) A list of past, present, and probable future projects producing related or cumulative impacts, including, if necessary, those projects outside the control of the [lead] agency, or (B) A summary of projections contained in an adopted general plan or related planning document, or in a prior environmental document which has been adopted or certified, which described or evaluated regional or area-wide conditions contributing to the cumulative impact. Any such planning document shall be referenced and made available to the public at a location specified by the lead agency. Accordingly, the traffic analysis provides a highly conservative estimate of future traffic volumes as it incorporates both the A and B options outlined in CEQA Guidelines for purposes of developing the forecast. (3) Comparative Analysis When applicable in the impact analysis, references and comparisons have been made to the Master Plan development entitlement (i.e., 700,000 square feet) analyzed in the Original EIR. The resulting net Project traffic impacts to LOS at the study intersections (of which 18 were studied in the Original EIR as discussed below), parking, access, public transit, plan and policy consistency and cumulative impacts will be compared to the environmental impacts resulting from development of the adopted Master Plan. This comparison will determine the incremental impact of the Project and will analyze the substantiality of the Project s net transportation impacts above those determined for the Master Plan considered in the Original EIR. It should be noted that the traffic impacts associated only with the proposed Project have been isolated in the traffic impact study to determine the true net impact of the Project beyond the impacts of the Master Plan addressed in the Original EIR. The residual 170,650 square feet of Master Plan entitlement, encompassed as part of the West Tower, have been analyzed in the traffic impact study as a Related Project (Related Project No. LA39 as shown in Table 9: List of Related Projects [page 194]). Doing so allows the impact analysis to account for the traffic impacts of this residual Master Plan entitlement on a cumulative basis, while still allowing for 7 City of Los Angeles Department of Transportation, Traffic Study Policies and Procedures, (March 00). 8 Los Angeles County Metropolitan Transportation Authority, 004 Congestion Management Program for Los Angeles County, (July 004). PAGE 179
24 the isolation of impact findings for the proposed Project. Therefore, the impacts of full build-out of the Master Plan are forecast through the Future Pre-Project Conditions; subsequently, the net incremental impact of the Project is then added to that condition to forecast Future With Project Conditions. The 90,000 square feet of space incorporated from the Existing Building into the West Tower will continue to be considered as existing pre-master Plan development. Consequently, the impacts of the Existing Building uses were considered as existing traffic conditions for the Master Plan in the Original EIR and all impacts associated with this component have already been considered. Therefore, transportation impacts of all components of the 460,650 square foot West Tower will have been considered in this Draft SEIR. b. Thresholds of Significance In accordance with Los Angeles CEQA Thresholds Guide (as adopted 006), the project would have significant impact on transportation and circulation if it would cause any of the following conditions to occur: Construction Thresholds The determination of significance shall be made on a case-by-case basis, considering the following factors: Temporary Traffic Impacts: Length of time of temporary street closures or closures of two or more traffic lanes; Classification of the street affected; Existing traffic levels and LOS on the affected streets and intersections; Whether the affected street directly leads to a freeway on- or off-ramp or other state highway; Potential safety issues involved with street or lane closures; and Presence of emergency services located nearby that regularly use the affected street. Temporary Loss of Access: Length of time of any loss of vehicular or pedestrian access to a parcel fronting the construction area; Availability of alternative vehicular or pedestrian access within ¼ mile of the lost access; and Type of land uses affected, and related safety, convenience, and/or economic issues. Temporary Loss of Bus Stops Length of time that an existing bus stop would be unavailable or that existing service would be interrupted; Availability of a nearby location (within ¼ mile) to which the bus stop or route can be temporarily relocated; PAGE 180
25 Existence of other bus stops or routes with similar routes/destinations within a ¼ mile radius of the affected stops or routes; and Whether the interruption would occur on a weekday, weekend or holiday, and whether the existing bus route typically provides service that/those day(s). Temporary Loss of On-Street Parking Current utilization of existing on-street parking; Availability of alternative parking locations or public transit options within ¼ mile of the project site; and Length of time that existing parking spaces would be unavailable. () Intersection Traffic Thresholds The significance of the potential impacts of Project generated traffic at each study intersection was identified using the traffic impact criteria set forth in LADOT s Traffic Study Policies and Procedures, (March 00). According to the City s published traffic study guidelines, a significant transportation impact is determined based on the Sliding Scale criteria presented in Table 7: City of Los Angeles Intersection Impact Threshold Criteria. TABLE 7 CITY OF LOS ANGELES INTERSECTION IMPACT THRESHOLD CRITERIA FINAL V/C LEVEL OF SERVICE (LOS) PROJECT RELATED INCREASE IN V/C C equal to or greater than D equal to or greater than 0.00 >0.90 E or F equal to or greater than The City s Sliding Scale Method requires mitigation of project traffic impacts whenever traffic generated by the proposed development causes an increase of the analyzed intersection Volumeto-Capacity (V/C) ratio by an amount equal to or greater than the values shown above. (3) Access Thresholds The Project would have a significant Project access impact if the intersection(s) nearest the primary site access is/are projected to operate at LOS E or F during the A.M. or P.M. peak hour, under Future With Project Conditions (as defined under Methodology herein). (4) Parking Thresholds The Project would have a significant impact on parking if the project provides less parking than needed as determined through an analysis of demand from the Project. PAGE 181
26 (5) Transit System Thresholds The determination of significance shall be made on a case-by-case basis, considering the projected number of additional transit passengers expected with implementation of the proposed Project and available transit capacity. c. Project Impacts Construction Activity 9 (a) Construction Assumptions Certain assumptions must be made about the demolition/construction process in order to determine the estimated traffic impacts caused by construction activities for the proposed Project. It is assumed that demolition and grading/excavation would occur on the Project Site during the first year of construction, in which it is estimated that approximately 78,100 cubic yards of dirt from the Project Site would be removed. It is also assumed that after completion of the demolition and grading phase of construction, the final grading and structure construction phase would begin and would extend over a two-year period. It is also assumed that the equipment staging area during the initial phases of grading, as well as after the start of construction, would occur on the Project Site or within the CSMC Campus. Construction worker parking would also occur within the CSMC Campus. (b) Construction Traffic Generation Demolition, Grading and Material Export While heavy construction equipment would be located at the CSMC Campus during grading activities and would not travel to and from the Project Site on a daily basis, truck trips would be generated during the demolition, grading, and export period, so as to remove material (from demolition) from the Project Site. Trucks are expected to carry the export material to a receptor site located within 5 miles of the Project Site. CSMC anticipates that trucks with a capacity to carry at least 14 cubic yards of material per truck would be used during the export period. Assuming the export period will require approximately workdays per month for five months, during the peak demolition, grading and export activities, up to 100 truck trips per day (i.e., 50 inbound trips and 50 outbound trips) are anticipated from the Project Site. Of the 100 daily truck trips, it is estimated that approximately ten trucks trips (five inbound trips and five outbound trips) would occur during the weekday A.M. peak hour and P.M. peak hour. Construction traffic impacts during the demolition, grading and material export period were not discussed in the Original EIR. 9 All construction activity analysis and data was generated by Linscott Law & Greenspan Engineers, Cedars-Sinai Medical Center West Tower Project Construction Traffic Review to Planning Associates Inc., 16 April 008. PAGE 18
27 Final Grading and Structure Construction Activities related to the final grading and structure construction period would generate a higher number of vehicle trips as compared to the demolition, grading and material export period due to the larger amount of construction workers commuting daily to and from the Project Site. Thus, the greatest potential for impact on the adjacent street system would occur during the final grading and structure construction period. During this period, a trip generation rate of 0.3 worker vehicle trips per 1,000 square feet of commercial development per day is used. 10 Construction workers are expected to typically arrive at the Project Site before 7:00 A.M. and most will depart before 3:00 P.M. Thus, these construction work trips would occur outside of the A.M. and P.M. peak hours of traffic on the local street system. Construction workers are also expected to remain on-site throughout the day. Taking into consideration these expectations, the construction workers are estimated to generate approximately 306 vehicle trips per day (i.e., 153 trips inbound and 153 trips outbound) during the peak construction phases at the Project Site. Of the peak construction daily trip generation of 306 daily trips, it is estimated that approximately 31 construction worker vehicle trips (ten percent of the daily construction worker inbound or outbound trips) would occur during each of the weekday A.M. peak hour and P.M. peak hour. In addition to construction worker vehicles, additional vehicle trips may be generated by miscellaneous trucks traveling to and from the Project Site. These trucks may consist of larger vehicles delivering equipment and/or construction materials to the Project Site, or smaller pickup trucks or four-wheel drive vehicles used by construction supervisors and/or City inspectors. During peak construction phases, it is estimated that approximately 50 trips per day would be made by miscellaneous trucks. To conservatively estimate the equivalent number of vehicles associated with the truck trips, a Passenger Car Equivalency or PCE factor of.0 was utilized based on standard traffic engineering practice. 11 Therefore, conservatively assuming 50 daily truck trips, it is estimated that the trucks would generate approximately 100 PCE vehicles trips (i.e., 50 trips inbound and 50 trips outbound) on a daily basis. Assuming ten percent of the daily truck trips occur during the peak hours, it is estimated that approximately 10 PCE vehicle trips (five inbound trips and five outbound trips) would occur during the weekday A.M. peak hour and P.M. peak hour. Summed together, the construction worker vehicles and miscellaneous trucks are forecast to generate 406 PCE vehicle trips per day (i.e., 03 inbound and 03 outbound) during peak final grading and structure construction phases at the Project Site. During the weekday A.M. peak hour and P.M. peak hour, it is estimated that approximately 41 PCE vehicle trips would be generated during each of these peak hours. The Original EIR did not discuss construction traffic impacts associated with final grading and structure construction. 10 Linscott Law & Greenspan Engineers, Cedars-Sinai Medical Center West Tower Project Construction Traffic Review to Planning Associates Inc., 16 April Ibid. PAGE 183
28 (c) Project Construction Impact and Management Based on the relatively low number of construction trips generated as compared to the proposed Project s daily operational trip generation (as analyzed below) and the temporary nature of the additional trips, the traffic impacts (LOS, etc.) due to construction activities are forecast to be less than significant at the study intersections during the weekday A.M. and P.M. peak hours. Further, due to the existing excess in parking spaces on the CSMC Campus, discussed below, construction worker parking is not anticipated to result in a significant impact on parking availability at the CSMC Campus. Temporary, partial lane closures are anticipated during Project construction only on the private internal streets located within the CSMC campus. It can be expected that temporary, partial lane closures may occur on George Burns Road and Gracie Allen Drive. Construction for this type of street work is normally limited from 9:00 A.M. to 3:00 P.M. The private internal streets are expected to remain open during construction and detours around the construction site as a result of lane closures would not be required. Flag-men, however, would be used to control traffic movement during the ingress and egress of trucks and heavy equipment at the Project Site. Thus, Campus access on the private internal streets will only be lost over short periods of time during construction. Due to the utilization of the CSMC Campus for construction activities, the on-street parking outside of the Campus will not be affected. The Project construction is also not expected to affect existing transit bus stops or lines that traverse the CSMC Campus, as most of these are located on the east side of the Campus. Therefore, the proposed Project construction will not result in a significant impact to access and public transit on the Campus. Although construction-related traffic impacts were not discussed in the Original EIR, the originally anticipated Approved Building and Approved Parking Structure under the Master Plan, which is of similar massing and size as the Project, would likely result in very similar construction activities, equipment and impacts as the proposed Project. Therefore, the proposed Project does not represent a substantial incremental impact beyond those anticipated for the Master Plan. (d) Haul Route Approval Approvals required by the City of Los Angeles for implementation of the proposed Project must include a haul route program approved by LADOT. According to Section of the Los Angeles Building Code, truck haul routes would only require a public hearing before the Board of Building and Safety Commissioners for any import or export of more than 1,000 cubic yards of earth material in a grading hillside area. Although import and export for the proposed Project would exceed the 1,000 cubic yards of earth material, the location of the Project Site is not within a grading hillside area; therefore, the proposed Project would not require a public hearing. With regard to other construction traffic-related issues, construction equipment would be stored within the perimeter fence of the construction site. With the required haul route approval and other construction management practices described above, construction activities are anticipated to result in a less than significant impact. Haul route impacts would be further reduced with the implementation of the following design features when the haul route is approved: PAGE 184
29 Maintain existing access for the CSMC campus buildings and parking facilities; Limit any potential on-campus roadway lane closures to off-peak travel periods; Schedule receipt of construction materials to non-peak travel periods, to the extent possible; Coordinate deliveries to reduce the potential of trucks waiting to unload for protracted periods of times; and Prohibit parking by construction workers on adjacent streets and direct the construction workers to available parking within the CSMC campus. A proposed haul route was not discussed in the Original EIR for the Project Site; however, a haul route will be determined before the beginning of the demolition, grading and export period and will be approved by the City of Los Angeles with potential input from the community. () Long-Term Operation (a) Roadways and Intersections Project Traffic Generation The trip generation rates and forecast of the vehicular trips anticipated to be generated by the proposed Project (which includes the addition of 100 inpatient beds equivalent to 00,000 square feet of floor area on the CSMC Campus) are presented in Table 8: Project Traffic Generation. The Project trip generation forecast was submitted for review and approval by LADOT staff. Traffic generation is expressed in vehicle trip ends, defined as one-way vehicular movements, either entering or exiting the generating land use. Generation equations and/or rates used in the traffic forecasting procedure are found in the Seventh Edition of Trip Generation, published by the Institute of Transportation Engineers (ITE) [Washington D.C., 003]. Traffic volumes expected to be generated by the Project were based upon rates per number of hospital beds. ITE Land Use Code 610 (Hospital) trip generation average rates were used to forecast the traffic volumes expected to be generated by the 100 new inpatient hospital beds planned for the Project. TABLE 8 PROJECT TRAFFIC GENERATION [1] LAND USE SIZE DAILY TRIP ENDS AM PEAK HOUR VOLUMES [] PM PEAK HOUR VOLUMES [] VOLUMES [] IN OUT TOTAL IN OUT TOTAL Hospital [3] 100 Beds 1, Total 1, [1] Source: Institute of Transportation Engineers ( ITE ), Trip Generation, 7 th Edition, 003. [] Trips are one-way traffic movements, entering or leaving. [3] ITE Land Use Code 610 (Hospital) trip generation average rates. The number of impatient hospital beds is based on a total of 00,000 square feet of development with an estimate of,000 square feet for each hospital bed (i.e., 00,000 SF /,000 SF = 100 beds). - Daily Trip Rate: trips/bed; 50% inbound; 50% outbound - A.M. Peak Hour Trip Rate: 1.13 trips/bed; 70% inbound; 30% outbound - P.M. Peak Hour Trip Rate: 1.30 trips/bed; 36% inbound; 64% outbound PAGE 185
30 As presented in Table 8: Project Traffic Generation, the Project is expected to generate 113 net new vehicle trips (79 inbound trips and 34 outbound trips) during the A.M. peak hour. During the P.M. peak hour, the Project is expected to generate 130 net new vehicle trips (47 inbound trips and 83 outbound trips). Over a 4-hour period, the Project is forecast to generate 1,181 net new daily trip ends during a typical weekday (approximately 59 inbound trips and 59 outbound trips). In the Original EIR, build-out of the Master Plan was estimated to generate 594 new vehicle trips during the A.M. peak hour and 1,794 new vehicle trips during the P.M. peak hour, resulting in approximately 3,90 additional daily vehicle trips during a typical weekday. [Original EIR Findings, Section III.B.11] Project Traffic Distribution and Assignment Analysis Project traffic volumes both entering and exiting the site have been distributed and assigned to the adjacent street system based on the following considerations: The site's proximity to major traffic corridors (i.e., Robertson Boulevard, San Vicente Boulevard, Beverly Boulevard, Third Street, Burton Way, etc.); Expected localized traffic flow patterns based on adjacent roadway channelization and presence of traffic signals; Existing intersection traffic volumes; Ingress/egress availability at the CSMC Campus; The location of existing and proposed parking areas; and Input from LADOT staff. The general, directional traffic distribution pattern for the proposed Project is presented in Figure 37: Project Trip Distribution. The forecast A.M. and P.M. peak hour traffic volumes associated with the Project are presented in Figure 38: A.M. Peak Hour Project Traffic Volumes and Figure 39: P.M. Peak Hour Project Traffic Volumes, respectively. The traffic volume assignments presented in Figure 40: A.M. Peak Hour Project Traffic Volumes and Figure 41: P.M. Peak Hour Project Traffic Volumes reflect the traffic distribution characteristics shown in Figure 37: Project Trip Distribution and the Project traffic generation forecast presented in Table 8: Project Traffic Generation. Existing Conditions As indicated in column [1] of Table 6: Summary of Volume To Capacity Ratios and Levels of Service, 18 of the study intersections are currently operating at LOS D or better during the A.M. and P.M. peak hours under existing conditions. The following four study intersections are currently operating at LOS E or F during the peak hours shown below (see Figure 3: Existing Traffic Volumes - A.M. Peak Hour and Figure 33: Existing Traffic Volumes - P.M. Peak Hour). Int. No. 1: Robertson Blvd./Beverly Blvd. Int. No. 5: Robertson Blvd./Wilshire Blvd. A.M. Peak Hour: V/C =0.914, LOS E A.M. Peak Hour: V/C =0.957, LOS E P.M. Peak Hour: V/C =0.990, LOS E PAGE 186
31 SOURCE: LINSCOTT, LAW & GREENSPAN, ENGINEERS FIGURE 37 PROJECT TRIP DISTRIBUTION NORTH PAGE 187
32 SOURCE: LINSCOTT, LAW & GREENSPAN, ENGINEERS FIGURE 38 A.M. PEAK HOUR PROJECT TRAFFIC VOLUMES NORTH PAGE 188
33 SOURCE: LINSCOTT, LAW & GREENSPAN, ENGINEERS FIGURE 39 P.M. PEAK HOUR PROJECT TRAFFIC VOLUMES NORTH PAGE 189
34 FIGURE 40 EXISTING WITH AMBIENT GROWTH TRAFFIC VOLUMES FOR A.M. PEAK HOUR SOURCE: LINSCOTT, LAW & GREENSPAN, ENGINEERS NORTH PAGE 190
35 FIGURE 41 EXISTING WITH AMBIENT GROWTH TRAFFIC VOLUMES FOR P.M. PEAK HOUR SOURCE: LINSCOTT, LAW & GREENSPAN, ENGINEERS NORTH PAGE 191
36 Int. No. 18: La Cienega Blvd./Beverly Blvd. Int. No. 1: La Cienega Blvd./Wilshire Blvd. P.M. Peak Hour: V/C =0.989, LOS E A.M. Peak Hour: V/C =0.976, LOS E P.M. Peak Hour: V/C =0.996, LOS E Existing With Ambient Growth Conditions In order to account for unknown Related Projects not included in this analysis, the existing traffic volumes were increased at an annual rate of one percent (1.0%) per year to the year 03 (i.e., the anticipated year of Project build-out). This ambient growth factor was based on general traffic growth factors provided in the 004 Congestion Management Program for Los Angeles County (the CMP manual ) and determined in consultation with LADOT staff. It is noted that based on review of the general traffic growth factors provided in the CMP manual for the West Los Angeles area, it is anticipated that the existing traffic volumes are expected to increase at an annual rate of less than 1.0% per year between the years 005 and 05. Thus, application of this annual growth factor allows for a conservative, worst case forecast of future traffic volumes in the Project area. Further, it is noted that the CMP manual s traffic growth rate is intended to anticipate future traffic generated by development projects in the Project vicinity. Therefore, the inclusion in this traffic analysis of both a forecast of traffic generated by known Related Projects plus the use of an ambient growth factor based on CMP traffic model data will result in a conservative estimate of future traffic volumes at the Project study intersections. The 1.0% ambient growth would incrementally increase the V/C ratios at all of the study intersections. As shown in column [] of Table 6: Summary of Volume To Capacity Ratios and Levels of Service, 14 of the study intersections are expected to continue to operate at LOS D or better during the A.M. and P.M. peak hours with the addition of ambient growth traffic through the year 03. The following eight study intersections are expected to operate at LOS E or F during the peak hours shown below with the addition of ambient growth traffic: Int. No. 1: Robertson Blvd./Beverly Blvd. Int. No. 4: Robertson Blvd./Burton Way Int. No. 5: Robertson Blvd./Wilshire Blvd. Int. No. 1: San Vicente Blvd./Melrose Ave. Int. No. 18: La Cienega Blvd./Beverly Blvd. Int. No. 19: La Cienega Blvd./Third St. A.M. Peak Hour: V/C =1.031, LOS F A.M. Peak Hour: V/C =0.98, LOS E P.M. Peak Hour: V/C =0.983, LOS E A.M. Peak Hour: V/C =1.101, LOS F P.M. Peak Hour: V/C =1.138, LOS F A.M. Peak Hour: V/C =0.937, LOS E A.M. Peak Hour: V/C =0.994, LOS E P.M. Peak Hour: V/C =1.118, LOS F A.M. Peak Hour: V/C =0.99, LOS E P.M. Peak Hour: V/C =0.984, LOS E PAGE 19
37 Int. No. 0: La Cienega Blvd./San Vicente Blvd. A.M. Peak Hour: V/C =0.95, LOS E Int. No. 1: La Cienega Blvd./Wilshire Blvd. A.M. Peak Hour: V/C =1.1, LOS F P.M. Peak Hour: V/C =1.145, LOS F The existing with ambient growth traffic volumes at the study intersections during the A.M. and P.M. peak hours are shown in Figure 40: Existing with Ambient Growth Traffic Volumes for A.M. Peak Hour and Figure 41: Existing with Ambient Growth Traffic Volumes for P.M. Peak Hour, respectively. Future Pre-Project Conditions A forecast of on-street traffic conditions prior to occupancy of the proposed Project was prepared by incorporating the potential trips associated with other known development projects ( Related Projects ) within the Project area. With this information, the potential impact of the Project can be evaluated within the context of the cumulative impact of all ongoing development. The list of Related Projects was based on information on file at LADOT, the City of West Hollywood and the City of Beverly Hills, as well as recently accepted traffic impact analysis reports prepared for Related Projects in the vicinity of the CSMC Campus. The list of Related Projects in the Project area is presented in Table 9: List of Related Projects. The location of the Related Projects is shown in Figure 4: Location of Related Projects. The list of Related Projects was submitted to LADOT staff for review and approval. It is important to note that the proposed Project is the addition of 100 inpatient beds (00,000 square feet) to the CSMC Campus to be contained within the West Tower. The West Tower will contain 170,650 square feet of residual entitlement already approved under the Master Plan and covered under the Original EIR, as well as an approved 90,000 square-foot Existing Building that will be demolished and incorporated into the new facility. The 170,650 square feet of remaining entitlement under the Master Plan, as well as the approximately 396,000 square foot Advanced Health Sciences Pavilion (beginning construction on the CSMC Campus in first quarter of 009), which also utilizes entitlements under the Master Plan, are considered as Related Projects for the purposes of this traffic analysis and for the reasons described in the Methodology above. Further, since the remaining entitlement of the Master Plan is considered as a Related Project in the traffic impact study, the Future Pre-Project Conditions represent the full build-out of the Master Plan on the CSMC Campus without the proposed Project. Expected traffic volumes from the Related Projects were calculated using rates provided in the ITE Trip Generation manual. The Related Projects respective traffic generation for the A.M. and P.M. peak hours, as well as on a daily basis for a typical weekday, is summarized in Table 30: Related Project Traffic Generation. The anticipated distribution of the Related Projects traffic volumes to the study intersections during the A.M. and P.M. peak hours is displayed in Figure 43: Related Projects Traffic Volumes for A.M. Peak Hour and Figure 44: Related Projects Traffic Volumes for P.M. Peak Hour, respectively. The V/C ratios at all of the study intersections are incrementally increased with the addition of traffic generated by the Related Projects listed in PAGE 193
38 MAP NO. FILE PROJECT NUMBER TABLE 9 LIST OF RELATED PROJECTS [1] PROJECT NAME LOCATION LAND USE SIZE STATUS CITY OF LOS ANGELES LA1 EAF W Pico Bl Private School (Pre- K to 5th grade) 4,000 SF LA EAF S La Cienega Bl Auto Body Shop 17,036 SF LA3 EAF N Fairfax Av Apartments Retail 93 DU 15,86 SF LA4 EAF S La Cienega Bl Private School 140 Students 6 DU LA5 EAF N La Cienega Bl Apartments 177 DU High Turnover Restaurant 38,739 SF Retail 316,79 SF LA6 LA7 LA8 Park La Brea Apartment Addition EAF Wilshire Skyline 003-CEN-463 Sunset Legacy Lofts 698 W 3rd St Apartments 300 DU 6411 W Wilshire Bl 7950 W Sunset Bl LA9 ENV MN 855 W Pico Bl Retail Fast-Food Restaurant Apartments Retail Apartments Retail 9,060 SF,500 SF 130 DU 183 DU 1,891 SF 39 DU 11,37 SF LA10 TT S Shenandoah St 16 DU LA11 ENV MND 357 N Hayworth Ave 16 DU LA1 ZA ZAA 80 S Bedford St 1 DU LA13 ZA CU 603 N Fairfax Av Hotel 17 Rooms LA14 ENV EAF 48 S Willaman Dr 14 DU LA15 ENV MND 600 S Ridgeley Dr DU LA16 ZA CUB 8108 W 3rd St Restaurant 4 Seats LA17 VTT S Masselin Ave 60 DU LA18 VTT N Hayworth Ave 8 DU LA19 TT S Hamel Rd 8 DU LA0 TT S Croft Ave 10 DU LA1 TT S Curson Ave 10 DU LA EAF W Pico Bl Retail 7,99 SF LA3 EAF S La Cienega Bl Fast Food Restaurant w/ Drive-Thru 1,600 SF LA4 EAF S La Cienega Bl Fast Food Restaurant w/ Drive-Thru 3,160 SF LA5 EAF S Fairfax Av Food Court 11,03 SF LA W Sunset Bl Retail,97 SF Restaurant 10,300 SF LA7 CPC ZC-GPA-CU 111 S The Grove Dr Self-storage facility 139,00 SF LA8 ZA CUB 189 S The Grove Dr Restaurant 150 Seats PAGE 194
39 MAP NO. FILE PROJECT NUMBER CITY OF LOS ANGELES TABLE 9 (CONTINUED) LIST OF RELATED PROJECTS [1] PROJECT NAME LOCATION LAND USE SIZE STATUS LA9 EAF N La Brea Avenue Shopping Center 18, 610 SF LA W Pico Boulevard Private School Addition,000 SF LA W Wilshire Boulevard Apartments 175 DU LA W Beverly Boulevard Museum 8,400 SF LA S La Brea Avenue Retail Restaurant 118 DU 6,400 SF 3,000 SF LA34 ENV EA 75 S Curson Avenue Office 8,800 SF Restaurant 800 SF LA W 3rd Street Apartments 60 DU LA W Wilshire Boulevard Office High Turnover Restaurant Restaurant 7,000 SF 3,500 SF 15,613 SF LA S Wetherly Drive 140 DU LA S Robertson Boulevard School Expansion 38,40 SF LA39A Cedars-Sinai Medical Center Medical Suites 11,100 SF Advanced Health Hospital 74,900 SF Sciences Pavilion LA39B Cedars-Sinai Medical Center (Remaining Entitled Development under Ordinance No. 168,847) LA CEN W Wilshire Boulevard LA CEN N La Cienega Boulevard CITY OF BEVERLY HILLS BH1 BH BH3 BH4 BH Burton Way 8800 W Wilshire Bl 9590 W Wilshire Bl 900 W Wilshire Bl 8600 W Wilshire Bl Medical Suites Hospital Apartments Restaurant Retail Apartments Retail Retail Office Retail Existing Office Retail Office Existing Office Retail Retail/Restaurant Medical Office 87,900 SF 8,750 SF 88 DU 4,000 GSF 8,500 GLSF 15 DU,300 GLSF (19,00 GLSF) 11,700 SF,870 SF (1,60 SF),870 SF 11,700 SF (1,60 SF) 60 DU 1,000 SF 53 DU 14,000 SF 1 DU 4,800 SF BH6 31 N Beverly Dr Office/Entertainment 01,000 SF BH S Elm Dr 5 DU Existing (8 DU) BH8 447 N Doheny Dr 3 DU Existing Apartments (16 DU) BH S Reeves Dr 10 DU Existing Apartments (4 DU) PAGE 195
40 MAP NO. FILE PROJECT NUMBER TABLE 9 (CONTINUED) LIST OF RELATED PROJECTS [1] PROJECT NAME LOCATION LAND USE SIZE STATUS CITY OF BEVERLY HILLS BH N La Peer Dr 16 DU Existing (6 DU) BH11 Young Israel Sanctuary 14,811 SF 961 Alden Dr Synagogue Multi-Purpose Room 1,54 SF BH1 Hotel 14 Rooms Beverly Hills 5 DU Public Gardens/ 0-40 N Beverly Dr Retail/Restaurants 7,000 SF Montage Hotel Public Garden 33,79 SF BH13 65 N Beverly Dr Office 41,500 SF BH14 Gagossian Gallery 456 N Camden Dr Retail Expansion 1,750 SF Medical Office 3,139 SF BH15 57 N Canon Dr Surgery Center Retail 13,609 SF 8,148 SF BH N Canon Dr Retail 11,900 SF BH17 BH18 BH19 BH0 Beverly Hills Cultural Center Mercedes-Benz Service facility N Crescent Dr Apartments Retail/Office 88 DU 40,000 SF 469 N Crescent Dr Cultural Center 34,000 SF 400 Foothill Rd Service Facility 53,000 SF 50 N La Cienega Bl Medical Office Existing Office 14,000 SF (14,000 SF) BH1 BMW 9001 Olympic Bl New Car Dealer 39,700 SF BH 36 N Rodeo Dr Retail 4,550 SF BH Wilshire Bl Medical Office Retail 1,445 SF 1,445 SF BH Wilshire Bl 37 DU BH Wilshire Bl Retail/Office 75,000 SF BH N Arnaz Dr 3 DU BH S Arnaz Dr 16 DU BH8 01 N Crescent Dr Assisted Care Facility 80 DU BH N Hamilton Dr 11 DU BH30 5 S Hamilton Dr Existing 7 DU (14 DU) BH S Oakhurst Dr 11 DU BH3 43 N Oakhurst Dr 34 DU BH N Palm Dr 38 DU BH N Palm Dr 13 DU BH Clark Dr Retail Existing Single-Family Home 500 SF 6 DU (1 DU) HB Wilshire Boulevard Commercial 95,000 SF Existing Retail (9,633 SF) BH Wilshire Boulevard Office 4,566 SF Medical Office 7,977 SF PAGE 196
41 MAP NO. FILE PROJECT NUMBER CITY OF BEVERLY HILLS BH38 TABLE 9 (CONTINUED) LIST OF RELATED PROJECTS [1] PROJECT NAME LOCATION 9876 Wilshire Boulevard LAND USE SIZE STATUS Residential Existing Non-Hotel Office Existing Hotel Support Existing Hotel 10 DU (13,030 SF) (1,804 SF) (47 Rooms) BH39 19 S. Linden Drive Senior Congregation 76 DU BH40 CITY OF WEST HOLLYWOOD 9900 Wilshire Boulevard Retail Restaurant 5 DU 15,600 SF 4,800 SF WH1 TT N Croft Ave 1 DU WH ENV CE 141 S Clark Dr 105 DU WH3 Beverly West Square Commercial Center Beverly Bl & Doheny Bl Retail Center 94,000 SF TIS WH4 Sunset Millennium Project TIS La Cienega Bl & Sunset Bl Hotel Retail/Restaurant 96 Rooms 39,440 SF 189 DU WH5 DMP Beverly Bl Retail 39,178 SF Existing (8 DU) Retail 1,500 SF WH6 DVP Hancock Ave Restaurant 40 DU 3,00 SF WH7 DVP Havenhurst Dr 1 DU WH8 DMP Hayworth Ave Apartments Existing Apartments 16 DU (10 DU) WH9 CUP Huntley Dr Day Care Center 8 Children WH10 TTM Laurel Ave 16 DU Existing (6 DU) WH11 TTM Larrabee St Apartments 15 DU Existing Apartments (13 DU) WH1 DVP Laurel Ave Senior Housing 35 DU WH13 TTM Hayworth Ave 17 DU Existing Apartments (16 DU) WH14 DMP Melrose Ave Retail 9,995 SF Existing Retail (6,475 SF) WH15 DMP Melrose Ave Retail 6,905 SF Existing Retail (3,53 SF) WH16 DMP Nemo St Mixed-Use (Retail, Office, ) 9,990 SF WH17 DMP Palm Ave 0 DU Existing (8 DU) WH18 DMP Santa Monica Bl Retail 13,830 SF 8 DU WH19 DVP Santa Monica Bl Retail 4,00 SF WH0 DVP Shoreham Dr 15 DU WH1 DMP Shoreham Dr Existing Single-Family Home 1 DU (1 DU) PAGE 197
42 MAP NO. FILE PROJECT NUMBER CITY OF WEST HOLLYWOOD WH Mixed-Use Project DMP TABLE 9 (CONTINUED) LIST OF RELATED PROJECTS [1] PROJECT NAME LOCATION 9040 Sunset Bl WH3 DMP Westmont Dr WH4 DVP Croft Avenue LAND USE SIZE STATUS Retail/Restaurant/Office Apartments Retail Townhomes Existing Single-Family Home 190,350 SF 61 DU 15 DU,900 SF 6DU 11 DU ( SF) WH5 100 Alta loma Rd Hotel Addition 40 Rooms WH Bonner Dr Retail 1,000 SF WH N Edinburgh Ave 18 DU Existing (8 DU) WH Havenhurst Dr Apartments 4 DU Existing Apartments (3 DU) WH Holloway Dr Hotel Restaurant 16 DU 0 Rooms 4,619 SF 18 DU 85 N Kings Rd WH30 Existing Single-Family Home (1 DU) WH N La Cienega Bl 16 DU WH N Laurel Ave Existing Existing ( DU) 16 DU (10 DU) WH Melrose Ave Retail 4,000 SF WH Melrose Ave Retail Existing Single-Family Home 9,06 SF ( DU) WH Melrose Ave Office 400,000 SF WH Melrose Ave Medical Office 10,000 SF 191 DU WH37 Melrose Triangle Santa Monica Bl Retail 71,000 SF Self-storage Facility 37,000 SF Existing Retail (90,000 SF) WH Norton Ave 16 DU Existing Single-Family Home (3 DU) WH39 10 N Orange Grove Ave 1 DU WH W. Sunset Boulevard WH41 Sunset Olive 8430 W Sunset Bl Existing Single-Family Home Retail/Restaurant Hotel Residential Retail (1 DU) 39,440 SF 96 Rooms 189 DU 35,000 SF 138 DU WH W Sunset Bl Retail,33 SF WH W Sunset Bl Retail 9,995 SF WH W Sunset Bl Hotel 196 Rooms 4 DU WH W Sunset Bl Medical Office 107,900 SF Existing Retail (11,400 SF) WH Westmount Dr 16 DU WH N Huntley Dr Private School 170 Student WH48 TTM Hacienda Place Existing Single-Family Home 10 DU (1 SF) PAGE 198
43 MAP NO. FILE PROJECT NUMBER CITY OF WEST HOLLYWOOD TABLE 9 (CONTINUED) LIST OF RELATED PROJECTS [1] PROJECT NAME LOCATION LAND USE SIZE STATUS WH49 TTM Harper Avenue 40 DU WH50 DMP Santa Monica Boulevard Retail Restaurant Five Existing Lots 4 DU Apartments 8 DU WH51 DVP Wetherly Drive DU Senior Housing 6 DU Existing Single-Family Home ( SF) WH5 DVP Santa Monica Boulevard Supermarket 65,35 SF WH W. Sunset Boulevard Retail 7,76 SF WH N. Formosa Avenue 11 DU WH55 39 N. La Cienega Boulevard Private School 140 Stds. WH Nemo Street Retail 0,105 SF 4 DU WH N. San Vicente Boulevard 135 DU Senior Housing 4 DU WH Santa Monica Boulevard Commercial 70,000 SF WH W. Sunset Boulevard Retail Restaurant,97 SF 10,300 SF [1] Sources: - City of Los Angeles, Departments of Planning and Transportation - City of Beverly Hills, Planning and Community Development Department - City of West Hollywood, Planning and Community Development Department - Impact Sciences, Inc., Draft Environmental Report, Volume 1, for 9900 Wilshire Project, August Linscott, Law & Greenspan Engineers, Traffic Impact Study, Westfield Century City for New Century Plan, September 007 PAGE 199
44 SOURCE: THOMAS BROS. GUIDE/ LINSCOTT, LAW & GREENSPAN, ENGINEERS PROJECT SITE FIGURE 4 LOCATION OF RELATED PROJECTS NORTH PAGE 00
45 NO. LAND USE SIZE CITY OF LOS ANGELES TABLE 30 RELATED PROJECT TRAFFIC GENERATION [1] DAILY TRIP ENDS VOLUMES [] AM PEAK HOUR VOLUMES [] PM PEAK HOUR VOLUMES [] IN OUT TOTAL IN OUT TOTAL LA1 Private School [3] 4,000 GSF 1, LA Auto Body Shop [4] 17,036 GLSF LA3 Apartments [5] Retail [6] 93 DU 15,86 GLSF LA4 Private School [3] 140 Students LA5 [7] Apartments [5] Restaurant [8] Retail [9] 6 DU 177 DU 38,739 GSF 316,79 GLSF 363 1,189 4,96 14, ,339 LA6 Apartments [5] 300 DU, LA7 Retail [6] Fast-Food Restaurant [10] Apartments [5] 9,060 GLSF,500 GSF 130 DU 1,48 1, LA8 [7] Retail [6] 183 DU 1,891 GLSF 1, LA9 Apartments [5] Retail [6] 39 DU 11,37 GLSF LA10 [7] 16 DU LA11 [7] 16 DU LA1 [7] 1 DU LA13 Hotel [11] 17 Rooms LA14 [7] 14 DU LA15 [7] DU LA16 Restaurant [8] 4 Seats LA17 [7] 60 DU LA18 [7] 8 DU LA19 [7] 8 DU LA0 [7] 10 DU LA1 [7] 10 DU LA Retail [6] 7,99 GLSF LA3 Fast-Food Restaurant [10] 1,600 GSF PAGE 01
46 NO. LAND USE SIZE CITY OF LOS ANGELES TABLE 30 (CONTINUED) RELATED PROJECT TRAFFIC GENERATION [1] DAILY TRIP ENDS VOLUMES [] AM PEAK HOUR VOLUMES [] PM PEAK HOUR VOLUMES [] IN OUT TOTAL IN OUT TOTAL LA4 Fast-Food Restaurant [10] 3,160 GSF 1, LA5 Food Court [8] 11,03 GSF 1, LA6 Retail [6] Restaurant [8],97 GLSF 10,300 GSF 18 1, LA7 Self Storage [1] 139,00 GSF LA8 Restaurant [8] 150 Seats LA9 Retail [6] 18,610 SF LA30 Private School (addition) [4] 14,800 Students LA31 Apartment [5] 175 DU 1, LA3 Museum [33] 8,400 SF 30 Nom. Nom. Nom. 3 5 LA33 [7] Retail [6] Restaurant [6] 118 DU 6,400 GLSF 3,000 GSF 691 1, LA34 Office [14] Retail [6] 8,800 GSF 800 GLSF LA35 Apartments [5] 60 DU LA36 Office [14] High Turnover Restaurant [8] Restaurant [6] 7,000 SF 3,500 SF 15,613 SF , LA37 [7] 140 DU LA38 School Expansion [9] 38,40 SF Nom. Nom. Nom. LA39A CSMC AHSP [30] 396,000 SF 10, LA39B CSMC Remaining Entitled [30] 170,650 SF 5, LA40 Apartment [5] Restaurant [6] Retail [6] 88 DU 4,000 GSF 8,500 GLSF 1, LA41 Apartment [5] Retail [6] Retail [6] 15 DU,300 GLSF (19,00) GLSF (84) (1) 51 9 (8) 64 3 (0) (35) 7 44 (37) (7) PAGE 0
47 NO. LAND USE SIZE CITY OF BEVERLY HILLS TABLE 30 (CONTINUED) RELATED PROJECT TRAFFIC GENERATION [1] DAILY TRIP ENDS VOLUMES [] AM PEAK HOUR VOLUMES [] PM PEAK HOUR VOLUMES [] IN OUT TOTAL IN OUT TOTAL BH1 Mixed-Use [13] 14,570 GSF BH Retail [6] Office [14] Office (Less Existing) [14],870 GLSF 11,700 GSF (1,60) GSF (14) 16 () () () () BH3 [7] Retail [6] 60 DU 1,000 GLSF BH4 [7] Retail [6] 53 DU 14,000 GLSF BH5 [7] Medical Office [15] 5 DU 4,800 GSF BH6 Office [14] 01,000 GSF, BH7 [7] (Less Existing) [7] 5 DU (8) DU 147 (47) 9 (3) 11 (4) 9 (3) 4 13 (4) BH8 [7] Apartments (Less Existing) [5] 3 DU (16) DU 135 (108) () 8 (6) 10 (8) 8 (7) 4 (3) 1 (10) BH9 [7] Apartments (Less Existing) [5] 10 DU 91 (7) () 8 () () BH10 [7] (Less Existing) [7] 16 DU (6) DU 94 (35) 1 6 () 7 (3) 5 () 3 8 (3) BH11 Synagogue [16] BH1 Beverly Hill Gardens [17], BH13 Office [14] 41,500 GSF BH14 Retail [6] 1,750 GLSF BH15 Medical Office [15] Medical Office [15] Retail [6] 3,139 GSF 13,609 GSF 8,148 GLSF BH16 Retail [6] 11,900 GLSF BH17 Apartments [5] Office [14] 88 DU 40,000 GSF BH18 Cultural Center [16] 34,000 GSF BH19 Service Facility [4] 53,000 GSF 1, BH0 Medical Office [15] Office (Less Existing) [14] 14,000 GSF (14,000) GSF 506 (154) 8 (19) 7 (3) 35 () 14 (4) 38 (17) 5 (1) PAGE 03
48 NO. LAND USE SIZE CITY OF BEVERLY HILLS TABLE 30 (CONTINUED) RELATED PROJECT TRAFFIC GENERATION [1] DAILY TRIP ENDS VOLUMES [] AM PEAK HOUR VOLUMES [] PM PEAK HOUR VOLUMES [] IN OUT TOTAL IN OUT TOTAL BH1 New Car Sales [18] 39,700 GSF 1, BH Retail [6] 4,550 GLSF BH3 Medical Office [15] Retail [6] 1,445 GSF 1,445 GLSF BH4 [7] 37 DU BH5 Office [14] 75,000 GSF Bh6 [7] 3 DU BH7 [7] 16 DU BH8 Assisted Living [19] 80 Beds BH9 [7] 11 DU BH30 [7] (Less Existing) [7] 7 DU (14) DU 158 (8) 10 (5) 1 (6) 9 (5) 5 () 14 (7) BH31 [7] 11 DU BH3 [7] 34 DU BH33 [7] 38 DU BH34 [7] 13 DU BH35 Retail [6] [7] Single-Family Home (Less Existing) [3] 500 GLSF 6 DU DU 1 35 (10) BH36 Beverly Hills Gateway [4] 95,000 SF 1, (4) BH37 Office [14] Medical Office [15] 4,566 SF 7,977 SF BH38 [7] Office (Less Existing) [14] Hotel Support (Less Existing) [14] Hotel (Less Existing) [11] 10 DU (13,030) SF (1,804) SF (47) Rooms 703 (143) (0) (384) 9 (18) (3) (16) 44 () 0 (10) 53 (0) (3) (6) 4 (3) (15) 0 (16) () (13) 6 (19) (3) (8) BH39 Senior Congregation [7] 76 DU BH Wilshire Project [5] (31) (6) (18) (4) PAGE 04
49 NO. LAND USE SIZE CITY OF WEST HOLLYWOOD TABLE 30 (CONTINUED) RELATED PROJECT TRAFFIC GENERATION [1] DAILY TRIP ENDS VOLUMES [] AM PEAK HOUR VOLUMES [] PM PEAK HOUR VOLUMES [] IN OUT TOTAL IN OUT TOTAL WH1 [7] 1 DU WH [7] 105 DU WH3 Retail [6] 94,000 GLSF 4, WH4 Hotel [11] Retail [6] [7] 96 Rooms 39,440 GLSF 189 DU,640 1,694 1, WH5 Retail [6] (Less Existing) [7] 37,178 GLSF (8) DU 1,596 (47) 3 15 (3) 38 (4) 67 (3) (4) WH6 Retail [6] [7] 1,500 GLSF 40 DU WH7 [7] 1 DU WH8 Apartments [5] Apartments (Less Existing) [5] 16 DU (10) DU 108 (67) 6 (4) 8 (5) 7 (4) 3 () 10 (6) WH9 Day Care Center [0] 8 Students WH10 [7] (Less Existing) [7] 16 DU (6) DU 94 (35) 1 6 () 7 (3) 5 () 3 8 (3) WH11 Apartments [5] Apartments (Less Existing) [5] 15 DU (13) DU 101 (87) 6 (6) 8 (7) 6 (5) 3 (3) 9 (8) WH1 Senior Housing [1] 35 Occ. DU WH13 [7] Apartments (Less Existing) [5] 17 DU (16) DU 100 (108) 1 () 6 (6) 7 (8) 6 (7) 3 (3) 9 (10) WH14 Retail [6] Retail (Less Existing) [6] 9,995 GLSF (6,475) GLSF 49 (78) 6 (4) 4 (3) 10 (7) 18 (1) 19 (1) 37 (4) WH15 Retail [6] Retail (Less Existing) [6] 6,905 GLSF (3,53) GLSF 97 (151) 4 () 3 () 7 (4) 1 (6) 14 (7) 6 (13) WH16 Retail [6] 9,990 GLSF WH17 [7] (Less Existing) [7] 0 DU (8) DU 117 (47) 7 (3) 9 (4) 7 (3) 3 10 (4) WH18 Retail [6] [7] 13,830 GLSF 8 DU WH19 Retail [6] 4,00 GLSF WH0 [7] 15 DU PAGE 05
50 NO. LAND USE SIZE CITY OF WEST HOLLYWOOD TABLE 30 (CONTINUED) RELATED PROJECT TRAFFIC GENERATION [1] DAILY TRIP ENDS VOLUMES [] AM PEAK HOUR VOLUMES [] PM PEAK HOUR VOLUMES [] IN OUT TOTAL IN OUT TOTAL WH1 [7] Single-Family Home (Less Existing) 1 DU DU 70 (10) WH Retail [9] [7] Apartments [5] 190,350 GLSF 61 DU 15 DU 10, WH3 Retail [6] Townhouses [7],900 GLSF 6 DU WH4 [7] Single-Family Home (Less Existing) 11 DU () DU 64 (19) () 4 6 () WH5 Hotel Addition [11] 40 Rooms WH6 Retail [6] 1,000 GLSF WH7 [7] (Less Existing) [7] 18 DU (8) DU 105 (47) 1 7 (3) 8 (4) 6 (3) 3 9 (4) WH8 Apartments [5] Apartments (Less Existing) [5] 4 DU (3) DU 161 (0) 0 10 () 1 () () WH9 [7] Hotel [11] Restaurant [8] 16 DU 0 Rooms 4,619 GSF WH30 [7] Single-Family Home (Less Existing) 18 DU DU 105 (10) WH31 [7] (Less Existing) [7] 16 DU () DU 94 (1) WH3 [7] (Less Existing) [7] 16 DU (10) DU 94 (59) 1 6 (3) 7 (4) 5 (3) 3 () 8 (5) WH33 Retail [6] 4,000 GLSF WH34 Retail [6] Single-Family Home (Less Existing) 9,06 GLSF () DU 395 (19) () () WH35 Office [3] 400,000 GSF 3, WH36 Medical Office [15] 10,000 GSF 4, WH37 [7] Retail [6] Self Storage [1] Retail (Less Existing) [6] 191 DU 71,000 GLSF 3,7000 GSF (90,000) GLSF 1,119 3, (3,865) (57) (36) (93) (16) (176) (338) PAGE 06
51 NO. LAND USE SIZE CITY OF WEST HOLLYWOOD TABLE 30 (CONTINUED) RELATED PROJECT TRAFFIC GENERATION [1] DAILY TRIP ENDS VOLUMES [] AM PEAK HOUR VOLUMES [] PM PEAK HOUR VOLUMES [] IN OUT TOTAL IN OUT TOTAL WH38 [7] Single-Family Home (Less Existing) 16 DU (3) DU 94 (9) () 5 () 3 8 (3) WH39 [7] Single-Family Home (Less Existing) 1 DU DU 70 (10) WH40 Retail/Restaurant [6] Hotel [11] Residential [7] 39,440 SF 96 Rooms 189 DU 1,694,640 1, WH41 Retail [6] [7] 35,000 GLSF 138 DU 1, WH4 Retail [6],33 GLSF WH43 Retail [6] 9,995 GLSF WH44 Hotel [11] [7] 196 Rooms 4 DU 1, WH45 Medical Office [15] Retail (Less Existing) [6] 10,7900 GSF (11,400) GLSF 3,898 (490) 1 (7) 56 (5) 68 (1) 108 (1) 93 () 401 (43) WH46 [7] 16 DU WH47 Private School [3] 170 Students WH48 [7] Single-Family Home (Less Existing) 10 DU DU 59 (10) WH49 [7] 40 DU WH50 [7] 4 DU WH51 Apartments [5] [7] Senior Housing [1] Single-Family Home (Less Existing) 8 DU DU 6 Occ. DU () DU (19) () () WH5 Supermarket [] 65,35 GSF 6, WH53 Retail [6] 776 SF WH54 [7] 11 DU WH55 Private School [8] 140 Students WH56 Retail [6] [7] 0,105 SF 4 DU PAGE 07
52 NO. LAND USE SIZE CITY OF WEST HOLLYWOOD TABLE 30 (CONTINUED) RELATED PROJECT TRAFFIC GENERATION [1] DAILY TRIP ENDS VOLUMES [] AM PEAK HOUR VOLUMES [] PM PEAK HOUR VOLUMES [] IN OUT TOTAL IN OUT TOTAL WH57 [7] Senior Housing [7] 135 DU 4 DU WH58 Commercial [14] 70,000 SF WH59 Retail [6] Restaurant [6],97 SF 10,300 SF TOTAL 15,108 5,864 4,34 10,0 6,596 7,74 14,338 [1] Source: ITE, Trip Generation, 7th Edition, 003. [] Trips are one-way traffic movements, entering or leaving. [3] ITE Land Use Code 534 (Private School (K-8) trip generation average rates. Please note that no weekday daily trip rates are provided for ITE Land Use 534. As such, a comparison of the ITE Land Use Code 536 (Private School [K-1]) weekday daily and AM peak hour trips rates (.48 per student and 0.79 per student, respectively) with the AM peak hour trip rate for ITE Land Use Code 534 (i.e., per 1,000 SF) was made in order to derive a weekday daily trip rate for this land use: (11.91 / 0.79) x.48 = trips per 1,000 SF Similarly, a comparison of the ITE Land Use Code 536 daily and PM peak hour of generator was made to derive a weekday daily trip rate based on number of students: (0.55 / 0.61) x.48 =.4 trips per student [4] ITE Land Use Code 94 (Automobile Care Center) trip generation average rates. [5] ITE Land Use Code 0 (Apartment) trip generation average rates. [6] ITE Land Use Code 80 (Shopping Center) trip generation average rates. [7] ITE Land Use Code 30 (Residential Condominium/Townhouse) trip generation average rates. [8] ITE Land Use Code 93 (High-Turnover [Sit-Down] Restaurant) trip generation average rates. [9] ITE Land Use Code 80 (Shopping Center) trip generation equation rates. [10] ITE Land Use Code 934 (Fast-Food Restaurant With Drive-Through Window) trip generation average rates. [11] ITE Land Use Code 310 (Hotel [Occupied Rooms]) trip generation average rates. [1] ITE Land Use Code 151 (Mini-Warehouse) trip generation average rates. [13] Coco Traffic Planners, Inc., Traffic & Parking Study for the 8800 Burton Way Mixed-Use Development Project, February 006. [14] ITE Land Use Code 710 (General Office) trip generation average rates. [15] ITE Land Use Code 70 (Medical-Dental Office Building) trip generation average rates. [16] Crain & Associates, Transportation Systems Analysis, UCLA Long Range Development Plan, October 00. [17] Parsons Transportation Group, Traffic and Parking Impact Analysis for Beverly Hills Gardens and Montage Hotel Project, November 003. [18] ITE Land Use Code 841 (New Car Sales) trip generation average rates. [19] ITE Land Use Code 54 (Assisted Living) trip generation average rates. [0] ITE Land Use Code 565 (Day Care Center) trip generation average rates. [1] ITE Land Use Code 5 (Senior Adult Housing - Attached) trip generation average rates. [] ITE Land Use Code 850 (Supermarket) trip generation average rates. [3] ITE Land Use Code 710 (General Office) trip generation equation rates. [4] Linscott, Law & Greenspan Engineers, Traffic Impact Study for Westfield Century City for New Century Plan,September 007. [5] Impact Sciences, Inc., Draft Environmental Impact Report, Volume I, for 9900 Wilshire Project, August 007. [6] ITE Land Use Code 931 (Quality Restaurant) trip generation average rates. [7] ITE Land Use Code 51 (Senior Adult Housing - Detached) trip generation average rates. [8] ITE Land Use Code 536 (Private School [K-1]) trip generation average rates. [9] ITE Land Use Code 50 (Elementary School) trip generation average rates. [30] ITE Land Use Code 70 (Medical-Dental Office Building) and Code 610 (Hospital) trip generation average rates. Trip generation increased by 15% to reflect gross building floor area. [31] ITE Land Use Code 10 (Single Family Detached Housing) trip generation average rates. [3] The daily traffic volumes and distributational splits for the peak hour traffic volumes is calculated based on other City of Los Angeles Museum daily rates. It is assumed that there is no AM peak hour as the peak hour period during weekdays for Museums generally occur between 1:00 PM and 1:00 PM. PAGE 08
53 FIGURE 43 RELATED PROJECTS TRAFFIC VOLUME FOR A.M. PEAK HOUR SOURCE: LINSCOTT, LAW & GREENSPAN, ENGINEERS NORTH PAGE 09
54 FIGURE 44 RELATED PROJECTS TRAFFIC VOLUME FOR P.M. PEAK HOUR SOURCE: LINSCOTT, LAW & GREENSPAN, ENGINEERS NORTH PAGE 10
55 Table 9: List of Related Projects. As presented in column [3] of Table 6: Summary of Volume To Capacity Ratios and Levels of Service, seven of the study intersections are expected to continue operating at LOS D or better during the A.M. and P.M. peak hours with the addition of growth in ambient traffic and the traffic due to the Related Projects. The following 15 study intersections are expected to operate at LOS E or F during the peak hours shown below with the addition of ambient traffic and the traffic due to the Related Projects: Int. No. 1: Robertson Blvd./Beverly Blvd. Int. No. : Robertson Bl./Alden-Gracie Allen Dr. Int. No. 3: Robertson Blvd./Third St. Int. No. 4: Robertson Blvd./Burton Way Int. No. 5: Robertson Blvd./Wilshire Blvd. Int. No. 6: George Burns Rd./Beverly Blvd. Int. No. 10: Williaman Dr./Wilshire Blvd. Int. No. 1: San Vicente Blvd./Melrose Ave. Int. No. 13: San Vicente Blvd./Beverly Blvd. Int. No. 15: San Vicente Blvd./Third St. A.M. Peak Hour: V/C =1.316, LOS F P.M. Peak Hour: V/C =1.3, LOS F P.M. Peak Hour: V/C =1.034, LOS F A.M. Peak Hour: V/C =1.18, LOS F P.M. Peak Hour: V/C =1.3, LOS F A.M. Peak Hour: V/C =1.6, LOS F P.M. Peak Hour: V/C =1.87, LOS F A.M. Peak Hour: V/C =1.397, LOS F P.M. Peak Hour: V/C =1.481, LOS F P.M. Peak Hour: V/C =0.99, LOS E A.M. Peak Hour: V/C =0.941, LOS E A.M. Peak Hour: V/C =1.10, LOS F P.M. Peak Hour: V/C =1.33, LOS F A.M. Peak Hour: V/C =1.050, LOS F P.M. Peak Hour: V/C =1.100, LOS F A.M. Peak Hour: V/C =1.119, LOS F P.M. Peak Hour: V/C =1.035, LOS F Int. No. 16: S. Vicente Bl-LeDoux Rd./Burton Wy. P.M. Peak Hour: V/C =0.901, LOS E Int. No. 17: San Vicente Blvd./Wilshire Blvd. Int. No. 18: La Cienega Blvd./Beverly Blvd. Int. No. 19: La Cienega Blvd./Third St. A.M. Peak Hour: V/C =1.060, LOS F P.M. Peak Hour: V/C =1.010, LOS F A.M. Peak Hour: V/C =1.19, LOS F P.M. Peak Hour: V/C =1.580, LOS F A.M. Peak Hour: V/C =1.16, LOS F P.M. Peak Hour: V/C =1.369, LOS F PAGE 11
56 Int. No. 0: La Cienega Blvd./San Vicente Blvd. Int. No. 1: La Cienega Blvd./Wilshire Blvd. Int. No. : Orlando Ave./Third St. A.M. Peak Hour: V/C =1.31, LOS F P.M. Peak Hour: V/C =1.19, LOS F A.M. Peak Hour: V/C =1.450, LOS F P.M. Peak Hour: V/C =1.501, LOS F A.M. Peak Hour: V/C =0.958, LOS E P.M. Peak Hour: V/C =1.007, LOS F The Future Pre-Project (existing, ambient growth and Related Projects) traffic volumes at the study intersections during the A.M. and P.M. peak hours are presented in Figure 45: Future Pre- Project Traffic Volumes for A.M. Peak Hour and Figure 46: Future Pre-Project Traffic Volumes for P.M. Peak Hour, respectively. The Original EIR found that when traffic from the original Project was combined with existing traffic, a 1.5% ambient growth rate and traffic generated by the Related Projects, it was determined that 10 intersections within the traffic study area would be adversely impacted in the A.M. peak hour and 16 intersections within the traffic study area would be adversely impacted in the P.M. peak hour. Without mitigation, a total of 16 study intersections would operate at LOS E or F in both the A.M. and P.M. peak hours, compared with 10 existing intersections that operated at LOS E or F in 1990 [See Original EIR Findings, Section III.B.11]. The Future Pre-Project Conditions would not represent an incrementally substantial impact above those determined for the Master Plan in the Original EIR. Summary of Project Impacts and Mitigations (Future With Project Conditions and Future Project With Mitigation Conditions) As demonstrated in column [4] of Table 6: Summary of Volume-To-Capacity Ratios and Levels of Service, application of the City s traffic threshold criteria (see Table 7: City of Los Angeles Intersection Impact Threshold Criteria) to the Future With Project scenario indicates that the Project is anticipated to create significant impacts at the following two study intersections: Int. No. : Robertson Blvd./Alden Dr.-Gracie Allen Dr. for A.M. and P.M. peak hours Int. No. 6: George Burns Rd./Beverly Blvd. for P.M. peak hour Thus, prior to implementation of the mitigation measures, Intersection No. will be operating at a V/C of 0.87 (LOS D) during the A.M. peak hour and (LOS F) during the P.M. peak hour. Intersection No. 6 will be operating at a V/C of (LOS E) during the P.M. peak hour. As a result, the Project would cause significant impacts for the two intersections. However, with implementation of mitigation measure improvements, the impacts for both intersections will reduce the potentially significant Project-related impacts to less than significant levels. The following summarizes the recommended transportation mitigation measure improvements for the subject study intersections. PAGE 1
57 FIGURE 45 FUTURE PRE-PROJECT TRAFFIC VOLUMES FOR A.M. PEAK HOUR SOURCE: LINSCOTT, LAW & GREENSPAN, ENGINEERS NORTH PAGE 13
58 FIGURE 46 FUTURE PRE-PROJECT TRAFFIC VOLUMES FOR P.M. PEAK HOUR SOURCE: LINSCOTT, LAW & GREENSPAN, ENGINEERS NORTH PAGE 14
59 Int. No. : Robertson Blvd./Alden Dr.-Gracie Allen Dr. Provide a right-turn-only lane at the northbound approach of Robertson Boulevard at the Alden Drive-Gracie Allen Drive intersection, as well as a right-turn-only lane at the westbound approach of Alden Drive-Gracie Allen Drive at the intersection. The resultant lane configurations at the northbound approach to the intersection will be one exclusive left-turn lane, one through lane and one right-turn-only lane. The resultant lane configurations at the westbound approach to the intersection will be one shared left-turn/through lane and one right-turn-only lane. These improvement measures would require restriping both the northbound and southbound approaches to the intersection; widening the westbound approach along the north side of Alden Drive- Gracie Allen Drive by.5 feet for a distance of approximately 100 feet (not including the transition length back to the existing sidewalk width), thereby reducing sidewalk width from the existing 1.5 feet to 10 feet; as well as the removal of on-street parking along the eastside of Robertson Boulevard south of the intersection for a distance of approximately 130 feet (approximately 6 spaces). Currently, the standard 1.5-foot sidewalk to be affected experiences pedestrian traffic from the surrounding retail and restaurant uses, as well as from CSMC. However, this level of utilization does not exceed the capacity of the sidewalk. As this segment of sidewalk is fairly well utilized by patrons to the shops and restaurants in the area, the proposed measures may result in less than significant secondary impacts in the immediate vicinity of the improvements due to the narrowing of sidewalks and loss of parking spaces. Currently, a right-turn-only lane at the northbound approach to the intersection on Robertson Boulevard is not warranted by existing right-turn traffic volumes. Therefore, to defer the loss of parking (approximately 6 spaces) on Robertson Boulevard until traffic demands warrant the need for a right-turn-only lane, this mitigation measure should be implemented in two phases. First, the applicant would widen Alden Drive and restripe the westbound approach as proposed above. In the second phase, a traffic warrant analysis would be conducted years after full occupancy of the Project to determine the need for a right-turn-only lane at the northbound approach to the intersection. If warranted, the right-turn-only lane would be implemented on Robertson Boulevard. For visualization, a conceptual roadway mitigation improvement plan for the Robertson Boulevard/Alden Drive-Gracie Allen Drive intersection is contained in Appendix C of Appendix E: Traffic Impact Study. As indicated in column [5] of Table 6: Summary of Volume To Capacity Ratios and Levels of Service, this measure is anticipated to reduce the potentially significant Projectrelated impacts to less than significant levels for both the A.M. and P.M. peak hours. In comparison to the Future Pre-Project Conditions, the Project s proposed mitigation measure improvements for the intersection are expected to improve operations to 0.87 (LOS D) from (LOS D) during the A.M. peak hour and to (LOS E) from (LOS F) during the P.M. peak hour. Int. No. 6: George Burns Rd./Beverly Blvd. Provide a right-turn-only lane at the eastbound approach of Beverly Boulevard at the George Burns Road intersection, as well as two lanes at the northbound approach of PAGE 15
60 George Burns Road at the intersection. The resultant lane configurations at the eastbound approach to the intersection will be one center two-way left-turn lane, two through lanes and one right-turn-only lane. The resultant lane configurations at the northbound approach to the intersection will be one shared left-turn/through lane and one right-turnonly lane. These improvement measures would require widening along the south side of Beverly Boulevard west of the intersection by approximately three feet and the removal of on-street parking for a distance of approximately 55 feet to accommodate the installation of the eastbound right-turn-only lane (approximately 4 parking spaces). The three-foot widening would also reduce the existing sidewalk width from 15 feet to 1 feet, which still exceeds the minimum 8 foot sidewalk for a Major Highway 1, for a distance of approximately 100 feet (not including the transition length back to the existing sidewalk width). Depending on current utilization, these measures may result in a secondary impact in the immediate vicinity of the improvements. For visualization, a conceptual roadway mitigation improvement plan for the George Burns Road/Beverly Boulevard intersection is contained in Appendix C of Appendix E: Traffic Impact Study. As indicated in column [5] of Table 6: Summary of Volume To Capacity Ratios and Levels of Service, this measure is anticipated to reduce the potentially significant Projectrelated impacts to less than significant levels for the P.M. peak hour. In comparison to the Future Pre-Project Conditions, the Project s proposed mitigation measure improvements for the intersection are expected to improve operations to (LOS E) from 0.99 (LOS E) during the P.M. peak hour. While this recommended mitigation measure is feasible, it is noted that this intersection is located in the City of West Hollywood and thus implementation of the recommended mitigation is beyond the control of the Lead Agency (City of Los Angeles). Should the City of West Hollywood not allow the implementation of this recommended mitigation measure, a significant unmitigated impact would result for this intersection and a Statement of Overriding Consideration would be required. However, impacts could still be reasonably mitigated in the future with cooperation of the City of West Hollywood. The Original EIR analyzed the traffic impacts of the Master Plan development at 18 study intersections in the Master Plan project area. All 18 study intersections have also been analyzed in this Draft SEIR, however, four study intersections have been added to this Draft SEIR, which were not included in the Original EIR: Int. No. 6: George Burns Rd./Beverly Blvd. Int. No. 7: George Burns Rd./Gracie Allen Dr. Int. No. 9: Willaman Dr./Third St. Int. No. 10: Willaman Dr./Wilshire Blvd. Excluding the above intersections, in the anticipated Master Plan build-out year of 005 under the Future With Project Conditions, 16 of the 18 study intersections were anticipated to operate at LOS E or LOS F during the A.M. and/or P.M. peak hours. This finding is more or less consistent with the Future Pre-Project Conditions analyzed above, which account for the full 1 City of West Hollywood General Plan Section 5.0 Circulation, page 183. PAGE 16
61 build-out of the Master Plan. Subsequently, these 16 study intersections resulted in significant impacts during the A.M. and/or P.M. peak hours. It was determined that the significant impacts at 15 of the 16 impacted intersections could me mitigated to less than significant levels with implementation of appropriate mitigation measures, as enumerated in the Original EIR 13. However, the intersection of Sherbourne Dr./Third St. was forecast to result in significant and unavoidable impacts with development of the Master Plan and an SOC was issued. As discussed, the proposed Project will result in a significant net impact during the A.M. and P.M. peak hours at one of the 18 study intersections analyzed in the Original EIR Int. No. : Robertson Blvd./Alden Drive-Gracie Allen Drive (formerly known as Robertson Blvd./Alden Dr. in the Original EIR). However, the Project impacts at this intersection may be mitigated to a less than significant level and thus will not add substantial impact above the Master Plan development. The remaining impacted intersection (Int. No. 6: George Burns Rd./Beverly Blvd.) was not analyzed in the Original EIR. However, the impacts at this intersection may also be mitigated to less than significant levels (with cooperation from the City of West Hollywood), and thus will not add substantial impact above the Master Plan development. Congestion Management Program Traffic Impact Assessment As required by the CMP, the traffic impact study has been prepared to determine the potential impacts on the designated monitoring locations above. According to Section B.9.1 (Appendix B, Page B-6) of the 004 CMP manual, the criteria for determining a significant impact is as follows: A significant transportation impact occurs when the Project increases traffic demand by % of capacity (V/C 0.0), causing or worsening LOS F (V/C 1.00). The proposed Project will not add 50 or more trips during the A.M. or P.M. peak hours. The proposed Project will not add 50 or more trips during the A.M. or P.M. peak hours at any of the CMP monitoring intersections. Therefore, no further review of potential impacts to intersection monitoring locations that are part of the CMP highway system is required. Also, no CMP freeway monitoring locations have been identified in the Project area. Therefore, no further review of potential impacts to freeway monitoring locations which are part of the CMP highway system is required. Transportation Demand Management Assessment City of Los Angeles Ordinance No. 168,847, which approved the Master Plan and Development Agreement for the CSMC Campus, includes two related trip reduction requirements associated with CSMC: 1) Prepare and submit a TDM program to achieve an 18 percent reduction in P.M. peak hour trips above SCAQMD Regulation XV requirements for new facilities and a 9 percent overall P.M. peak hour trip reduction for the entire CSMC Campus, and ) At the time of Master 13 As addressed in the Original EIR, mitigation measures proposed at certain intersections were dependent upon concurrent approval and cooperation by the Cities of West Hollywood and Beverly Hills. PAGE 17
62 Plan build-out, CSMC shall achieve a final Average Vehicle Ridership ( AVR ) 14 of 1.8 persons per vehicle for full-time employees. The measures in the Ordinance are a result of findings in the Original EIR, which estimated that implementation of a TDM program at the CSMC Campus could reduce the potential traffic generation of,048 P.M. peak hour trips from facilities proposed under the Master Plan by approximately 5 percent, equivalent to approximately 51 P.M. peak hour trips. Thus, for purposes of mitigation of traffic impacts as determined in the Original EIR, only the 9 percent reduction in overall P.M. peak hour trips was required. The required attainment of a 1.8 AVR for full-time employees was added as a condition of approval of Ordinance 168,847 for purposes of facilitating the 9 percent P.M. peak hour trip reduction. The Original EIR did not establish a trip generation baseline for the entire CSMC Campus on which to base compliance with the trip reduction requirements in Ordinance 168,847. Therefore, at the direction of LADOT, to verify whether the trip reduction goals are being met by CSMC and to establish a baseline from which the traffic reduction requirements can be compared, P.M. peak hour traffic counts 15 at the CSMC Campus were conducted at the driveways serving existing CSMC parking facilities and at the two parking structures serving the Third Street Medical Office Towers. 16 Based on the traffic counts, the existing CSMC Campus 17 generates a total of 1,91 P.M. peak hour trips (350 inbound and 1,57 outbound). 18 In contrast, the existing CSMC facilities are forecast to generate at total of,994 P.M. peak hour trips, which serves as the baseline for existing CSMC facilities. 19 Thus, the current measured trip generation of the CSMC Campus (1,91 P.M. peak hour trips) is approximately 36 percent less than the estimated baseline (,994 P.M. peak hour trips) based on existing facilities. This reduction is well in excess of the minimum 9 percent required reduction target for the entire Campus, per Ordinance 168,847. CSMC currently operates an aggressive TDM program, in which a total of 5,503 employees 0 participate, that has successfully reduced vehicle traffic and parking demand at the CSMC Campus. Pursuant to the most recent rideshare report filed with the SCAQMD, CSMC has also 14 Average Vehicle Ridership or AVR is the average number of employees who report to a work site divided by the average number of vehicles driven by these employees, calculated for an established time period. This calculation recognizes vehicle trip reductions from telecommuting, compressed work-weeks, and non-motorized transportation. 15 Traffic counts were conducted during P.M. peak period (4:00 to 6:00 P.M.) on Tuesday, Wednesday and Thursday, June 19, 0, and 1, 007 respectively. 16 The Third Street Medical Office Towers parking structures were included because CSMC employees park in these garages and CSMC leases space within these buildings. 17 For purposes of establishing a true baseline trip generation, existing CSMC Campus facilities are considered to be all buildings and structures built and occupied as of the publication of this Draft SEIR, and does not include the Advanced Health Sciences Pavilion which is scheduled to begin construction in the first quarter of Linscott, Law & Greenspan Engineers, Traffic Impact Study, Cedars-Sinai Medical Center Project, June 3, Ibid. Based on nationally accepted trip generation rates established in the Trip Generation Manual, 7 th Edition by the Institute of Transportation Engineers for medical facilities. 0 Pursuant to CSMC Rule 0 File 008, the total current number of employees reporting to the Campus within the designated peak window is 5,503 employees. PAGE 18
63 attained an AVR among its full-time employees of approximately 1.4 persons per vehicle. 1 In addition to trip reduction programs available to full-time employees, CSMC encourages ridesharing and other programs to part-time and contract employees, as well as to patients and visitors to further reduce vehicle trips during peak commute hours. The TDM program administered by CSMC includes two full-time ride share coordinators, a zip code matching database for ride-sharing, vanpooling, prizes and incentives for ride-sharing, preferential parking for carpoolers and vanpoolers, guaranteed rides home, transit pass subsidies, flexible work schedules, and accessibility to public transportation. Further, the urban nature of the CSMC Campus and surrounding synergistic land uses which support CSMC (such as medical office buildings, retail, and restaurant uses that draw patronage from CSMC) allow for trips made by walking and bicycling. The existing TDM program will incorporate the employees who work in the proposed Project. As part of the Project, CSMC requests that the 1.8 AVR requirement for full-time employees be eliminated as it has been demonstrated that the required overall Campus trip reductions can be achieved through implementation of travel demand programs for full-time employees and non- CSMC full-time employees (i.e., part-time and contract employees), as well as through development synergies that facilitate trips between CSMC Campus uses through means other than the private automobile. Further, additional scheduling limitations imposed on full-time employees as a result of an AVR requirement could adversely affect CSMC s ability to continue to provide a high level of healthcare to the community. LADOT has concurred that the measurement of AVR for full-time employees can be eliminated, with the provision that all trips that would be potentially eliminated by achievement of the 1.8 AVR be added to the overall CSMC Campus trip reduction target in order to justify the elimination of the requirement. Build-out of the remaining entitlement under the Master Plan and the proposed Project would increase the Campus-wide forecast trip generation (without a TDM program) from,994 P.M. peak hour trips to 4,9 P.M. peak hour trips. Per the requirements of Ordinance 168,847, CSMC would be required to implement a TDM program that would reduce the Campus-wide 4,9 P.M. peak hour trips by 9% (or 381 trips) to 3,848 P.M. peak hour trips. Additionally, per the AVR provisions of the existing Ordinance, CSMC would be required to operate at a 1.8 AVR, thereby reducing the unmanaged forecast of 4,9 P.M. peak hour trips by 804 trips to 3,45 P.M. peak hour trips, which equates to a 19% reduction in P.M. peak hour trips. If CSMC achieves the 19% reduction in P.M. peak hour trips, LADOT has determined that CSMC can achieve equivalency to the required reductions in traffic generation imposed by Ordinance 168,847 without attaining a 1.8 AVR. Therefore, in lieu of AVR requirements, LADOT has recommended that a more appropriate measurement to meet the goals and requirements of Ordinance 168,847 would be to utilize this 19% target to reduce the number of P.M. peak hour trips generated by the entire CSMC Campus. 3 This reduction target would be 1 Linscott, Law & Greenspan Engineers, Traffic Impact Study, Cedars-Sinai Medical Center Project, June 3, 008. Trip generation based on ITE Rates. 3 The reduction target is deemed more appropriate by Los Angeles Department of Transportation (LADOT). Traffic Impact Study for the Cedars-Sinai Medical Center (CSMC) Project Located on CSMC Campus (ENV EIR), Inter-Departmental Correspondence to Department of City Planning, Jimmy Liao. July 15, 008. PAGE 19
64 applied to the entire Campus, with annual reports submitted by CSMC to LADOT to monitor compliance. The P.M. peak hour reduction target would exceed the trip reduction estimates in both the TDM and AVR analysis in the Original EIR. Therefore, the amended trip reduction target will provide at least equivalent mitigation, and no new impacts, to development of the Master Plan analyzed in the Original EIR. Therefore, assuming compliance with the 19% P.M. peak hour trip reduction target and with LADOT reporting and monitoring requirements, the Project is anticipated to result in less than a significant impact to trip reduction provisions and the existing TDM program. Residential Street Segment Analysis (Cut-Through Traffic) 4 A total of 11 residential street segments located in the Project area were analyzed to determine the potential Project-related impacts of non-residential traffic using local streets in adjacent residential neighborhoods (known as cut-through traffic). 5 As shown in Figure 47: Residential Street Segment Locations, the analyzed street segments included: 1. Huntley Drive south of Melrose Avenue 6. Rosewood Avenue east of Norwich Drive 6 3. Ashcroft Avenue west of Sherbourne Drive 6 4. Rosewood Avenue west of Sherbourne Drive 6 5. Bonner Drive west of Sherbourne Drive 6 6. Sherbourne Drive south of Ashcroft Avenue 6 7. Alden Drive between Swall Drive and Clark Drive 7 8. Hamel Road between 3 rd Street and Burton Way 7 9. Willaman Drive between 3 rd Street and Burton Way Willaman Drive between Burton Way and Colgate Avenue Sherbourne Drive between 3 rd Street and Burton Way 7 Pursuant to the LADOT Traffic Study Policies and Procedures manual, a transportation impact on a local residential street shall be deemed significant based on a percentage increase in the Project average daily traffic ( ADT ) volumes as shown in Table 31: Residential Street Segment Impact Threshold Criteria. It must be noted that the City of West Hollywood and City of Los Angeles use similar traffic analysis methodologies and significance thresholds for determining potential impacts to local residential streets. 4 Information provided from Linscott, Law & Greenspan Engineers, Cedars-Sinai Medical Center Project Neighborhood Street Segment Analysis, memorandum to Planning Associates, Inc., July 3, The street segments analyzed were selected based on comments received during the Notice of Preparation process and proximity to the CSMC Campus. 6 City of West Hollywood street segment. 7 City of Los Angeles street segment. PAGE 0


65 SOURCE: THOMAS BROS. GUIDE/ LINSCOTT, LAW & GREENSPAN, ENGINEERS FIGURE 47 RESIDENTIAL STREET SEGMENT LOCATIONS NORTH PAGE 1
TRANSPORTATION STUDY FOR THE 8899 BEVERLY BOULEVARD PROJECT
 DRAFT TRANSPORTATION STUDY FOR THE 8899 BEVERLY BOULEVARD PROJECT WEST HOLLYWOOD, CALIFORNIA NOVEMBER 2013 PREPARED FOR BEVERLY BOULEVARD ASSOCIATION PREPARED BY DRAFT TRANSPORTATION STUDY FOR THE 8899
3.8 TRANSPORTATION, CIRCULATION AND PARKING
 3.8 TRANSPORTATION, CIRCULATION AND PARKING This section provides an overview of traffic, circulation and parking impacts and evaluates the construction and operational impacts associated with the Proposed
IV. ENVIRONMENTAL IMPACT ANALYSIS B. TRAFFIC AND CIRCULATION
 IV. ENVIRONMENTAL IMPACT ANALYSIS B. TRAFFIC AND CIRCULATION 1. INTRODUCTION This section is based on the technical report, Traffic Study for 10131 Constellation Boulevard Residential Project, prepared
IV. ENVIRONMENTAL IMPACT ANALYSIS N. TRANSPORTATION AND TRAFFIC
 IV. ENVIRONMENTAL IMPACT ANALYSIS N. TRANSPORTATION AND TRAFFIC The following section summarizes the information provided in the traffic report entitled Traffic Impact Analysis for a Proposed Residential
Appendix G Traffic and Parking Report
 Appendix G Traffic and Parking Report TABLE OF CONTENTS SECTION PAGE Executive Summary... v 1.0 Introduction... 1 1.1 Study Area... 3 2.0 Project Description... 4 2.1 Site Location... 4 2.2 Existing Project
4.4 Transportation and Circulation
 4.4.1 Introduction This section evaluates the potential for construction traffic and operational impacts to result from implementation of the proposed project. This includes the potential for the project
2. Valley Circle Boulevard/Andora Avenue/Baden Avenue and Lassen Street
 IV.J TRANSPORTATION 1. INTRODUCTION This section presents an overview of the existing traffic and circulation system in and surrounding the project site. This section also discusses the potential impacts
IV. ENVIRONMENTAL IMPACT ANALYSIS C. TRAFFIC CIRCULATION AND PARKING
 IV. ENVIRONMENTAL IMPACT ANALYSIS C. TRAFFIC CIRCULATION AND PARKING 1. INTRODUCTION This section is based on the technical report Traffic Impact Study Health Sciences Campus Project, City of Los Angeles,
ENVIRONMENTAL IMPACT ANALYSIS J. TRAFFIC, CIRCULATION AND ACCESS
 IV. ENVIRONMENTAL IMPACT ANALYSIS A traffic study was prepared for the Proposed Project by Linscott, Law & Greenspan, Engineers, dated August 5, 2008 (see Appendix I: Traffic Study). The traffic study
Appendix C. Traffic Study
 Appendix C Traffic Study TABLE OF CONTENTS SECTION Executive Summary PAGE 1.0 Introduction... 1 1.1 Scope of Work... 1 1.2 Study Area... 2 2.0 Project Description... 3 2.1 Site Access... 4 2.2 Pedestrian
Alpine Highway to North County Boulevard Connector Study
 Alpine Highway to North County Boulevard Connector Study prepared by Avenue Consultants March 16, 2017 North County Boulevard Connector Study March 16, 2017 Table of Contents 1 Summary of Findings... 1
IV. ENVIRONMENTAL IMPACT ANALYSIS M. TRANSPORTATION AND TRAFFIC
 IV. ENVIRONMENTAL IMPACT ANALYSIS M. TRANSPORTATION AND TRAFFIC INTRODUCTION This section of the (Draft EIR) addresses the subject of traffic and transportation with respect to the proposed (Project or
Table Existing Traffic Conditions for Arterial Segments along Construction Access Route. Daily
 5.8 TRAFFIC, ACCESS, AND CIRCULATION This section describes existing traffic conditions in the project area; summarizes applicable regulations; and analyzes the potential traffic, access, and circulation
4.1 Traffic, Circulation, and Parking
 4.1 Traffic, This section describes the existing transportation and parking conditions within and adjacent to the project area. A traffic report describing the potential impacts of the proposed project
2.4 Build Alternatives
 Table 2-1. Future Transit Network Changes between No Build and TSM Alternatives Operator Route Group No. Route ID and Description Peak Headway (min) No Build Off-peak Headway (min) Peak Headway (min) TSM
Traffic Impact Analysis 5742 BEACH BOULEVARD MIXED USE PROJECT
 Traffic Impact Analysis 5742 BEACH BOULEVARD MIXED USE PROJECT CITY OF BUENA PARK Prepared by Project No. 14139 000 April 17 th, 2015 DKS Associates Jeffrey Heald, P.E. Rohit Itadkar, T.E. 2677 North Main
IV. ENVIRONMENTAL IMPACT ANALYSIS K.2. PARKING
 IV. ENVIRONMENTAL IMPACT ANALYSIS K.2. PARKING ENVIRONMENTAL SETTING The following analysis summarizes the findings and conclusions of the Traffic Analysis (Traffic Study), prepared by The Mobility Group,
TRANSPORTATION 1. INTRODUCTION 2. METHODOLOGY
 IV.K TRANSPORTATION 1. INTRODUCTION This section provides an analysis of potential impacts associated with traffic, parking, and access. The analysis provides an overview of existing traffic conditions
APPENDIX J LAKE WOHLFORD DAM REPLACEMENT PROJECT TRAFFIC IMPACT ANALYSIS (DAM REPLACEMENT) Lake Wohlford Dam Replacement Project EIR
 Lake Wohlford Dam Replacement Project EIR") APPENDIX J LAKE WOHLFORD DAM REPLACEMENT PROJECT TRAFFIC IMPACT ANALYSIS (DAM REPLACEMENT) Replacement Project EIR Appendices TRAFFIC IMPACT ANALYSIS LAKE WOHLFORD DAM Escondido, California December 19,
APPENDIX J LAKE WOHLFORD DAM REPLACEMENT PROJECT TRAFFIC IMPACT ANALYSIS (DAM REPLACEMENT) Replacement Project EIR Appendices TRAFFIC IMPACT ANALYSIS LAKE WOHLFORD DAM Escondido, California December 19,
Escondido Marriott Hotel and Mixed-Use Condominium Project TRAFFIC IMPACT ANALYSIS REPORT
 Escondido Marriott Hotel and Mixed-Use Condominium Project TRAFFIC IMPACT ANALYSIS REPORT Prepared for Phelps Program Management 420 Sixth Avenue, Greeley, CO 80632 Prepared by 5050 Avenida Encinas, Suite
IV. ENVIRONMENTAL IMPACT ANALYSIS L. TRANSPORTATION/TRAFFIC
 IV. ENVIRONMENTAL IMPACT ANALYSIS L. TRANSPORTATION/TRAFFIC INTRODUCTION The following section summarizes the information provided in the traffic report entitled Traffic Impact Analysis for a Proposed
APPENDIX B Traffic Analysis
 APPENDIX B Traffic Analysis Rim of the World Unified School District Reconfiguration Prepared for: Rim of the World School District 27315 North Bay Road, Blue Jay, CA 92317 Prepared by: 400 Oceangate,
4.7 Construction Surface Transportation
 4.7 Construction Surface Transportation 4.7.1 Introduction The traffic analysis presented in this section addresses the construction traffic impacts specific to the proposed Project. The construction traffic
INDUSTRIAL DEVELOPMENT
 INDUSTRIAL DEVELOPMENT Traffic Impact Study Plainfield, Illinois August 2018 Prepared for: Seefried Industrial Properties, Inc. TABLE OF CONTENTS Executive Summary 2 Introduction 3 Existing Conditions
The major roadways in the study area are State Route 166 and State Route 33, which are shown on Figure 1-1 and described below:
 3.5 TRAFFIC AND CIRCULATION 3.5.1 Existing Conditions 3.5.1.1 Street Network DRAFT ENVIRONMENTAL IMPACT REPORT The major roadways in the study area are State Route 166 and State Route 33, which are shown
Section 5.8 Transportation and Traffic
 Section 5.8 Transportation and Traffic 5.8 TRANSPORTATION AND TRAFFIC Generous This Section is based on the Topgolf Specific Plan Traffic Impact Analysis (RK Engineering Group, Inc., October 31, 2016);
Transportation & Traffic Engineering
 Transportation & Traffic Engineering 1) Project Description This report presents a summary of findings for a Traffic Impact Analysis (TIA) performed by A+ Engineering, Inc. for the Hill Country Family
IV. Environmental Impact Analysis J. Traffic, Access, and Parking
 IV. Environmental Impact Analysis J. Traffic, Access, and Parking 1. Introduction This section of the Draft EIR analyzes the proposed Project s potential impacts on traffic, access, and parking. This section
Traffic Engineering Study
 Traffic Engineering Study Bellaire Boulevard Prepared For: International Management District Technical Services, Inc. Texas Registered Engineering Firm F-3580 November 2009 Executive Summary has been requested
Volume 1 Traffic Impact Analysis Turtle Creek Boulevard Dallas, Texas. Kimley-Horn and Associates, Inc. Dallas, Texas.
 Volume 1 Traffic Impact Analysis 2727 Dallas, Texas June 18, 2018 Kimley-Horn and Associates, Inc. Dallas, Texas Project #064523000 Registered Firm F-928 Traffic Impact Analysis 2727 Dallas, Texas Prepared
Section 3.12 Traffic and Transportation
 Section. Traffic and Transportation SECTION SUMMARY This section describes existing ground transportation within the Port and surrounding area associated with implementation of the proposed Project. An
Traffic Impact Analysis. Alliance Cole Avenue Residential Site Dallas, Texas. Kimley-Horn and Associates, Inc. Dallas, Texas.
 Traffic Impact Analysis Alliance Cole Avenue Residential Site Dallas, Texas February 15, 2018 Kimley-Horn and Associates, Inc. Dallas, Texas Project #064524900 Registered Firm F-928 Traffic Impact Analysis
TIMBERVINE TRANSPORTATION IMPACT STUDY FORT COLLINS, COLORADO JANUARY Prepared for:
 TIMBERVINE TRANSPORTATION IMPACT STUDY FORT COLLINS, COLORADO JANUARY 2014 Prepared for: Hartford Companies 1218 W. Ash Street Suite A Windsor, Co 80550 Prepared by: DELICH ASSOCIATES 2272 Glen Haven Drive
Project Scoping Report Appendix B Project Web Site. APPENDIX B Project Web Site
 Project Scoping Report Appendix B Project Web Site APPENDIX B Project Web Site WESTSIDE EXTENSION TRANSIT CORRIDOR STUDY February 4, 2008 News and Info of 1 http://metro.net/projects_programs/westside/news_info.htm#topofpage
King County Metro. Columbia Street Transit Priority Improvements Alternative Analysis. Downtown Southend Transit Study. May 2014.
 King County Metro Columbia Street Transit Priority Improvements Alternative Analysis Downtown Southend Transit Study May 2014 Parametrix Table of Contents Introduction... 1 Methodology... 1 Study Area...
BERKELEY DOWNTOWN AREA PLAN PROGRAM ENVIRONMENTAL IMPACT REPORT TRAFFIC IMPACT ANALYSIS
 BERKELEY DOWNTOWN AREA PLAN PROGRAM ENVIRONMENTAL IMPACT REPORT TRAFFIC IMPACT ANALYSIS Prepared for: City of Berkeley Prepared by: REVISED JANUARY 9, 2009 Berkeley Downtown Area Plan Program EIR Traffic
LAWRENCE TRANSIT CENTER LOCATION ANALYSIS 9 TH STREET & ROCKLEDGE ROAD / 21 ST STREET & IOWA STREET LAWRENCE, KANSAS
 LAWRENCE TRANSIT CENTER LOCATION ANALYSIS 9 TH STREET & ROCKLEDGE ROAD / 21 ST STREET & IOWA STREET LAWRENCE, KANSAS TRAFFIC IMPACT STUDY FEBRUARY 214 OA Project No. 213-542 TABLE OF CONTENTS 1. INTRODUCTION...
MILLERSVILLE PARK TRAFFIC IMPACT ANALYSIS ANNE ARUNDEL COUNTY, MARYLAND
 MILLERSVILLE PARK TRAFFIC IMPACT ANALYSIS ANNE ARUNDEL COUNTY, MARYLAND Prepared for: Department of Public Works Anne Arundel County Prepared by: URS Corporation 4 North Park Drive, Suite 3 Hunt Valley,
IV. ENVIRONMENTAL IMPACT ANALYSIS J. TRANSPORTATION AND TRAFFIC
 IV. ENVIRONMENTAL IMPACT ANALYSIS J. TRANSPORTATION AND TRAFFIC This Section summarizes the information provided in the Traffic Study for the Santa Monica College Bundy Campus Master Plan (Traffic Study),
4.7 Construction Surface Transportation
 4.7.1 Introduction The traffic analysis presented in this section addresses the construction traffic impacts specific to the proposed Project. The construction traffic impacts were analyzed for both the
Appendix Q Traffic Study
 Appendices Appendix Q Traffic Study Crummer Site Subdivision Draft EIR City of Malibu Appendices This page intentionally left blank. The Planning Center April 2013 TRAFFIC IMPACT ANALYSIS Photo z here
Traffic Impact Statement (TIS)
") Traffic Impact Statement (TIS) Vincentian PUDA Collier County, FL 10/18/2013 Prepared for: Global Properties of Naples Prepared by: Trebilcock Consulting Solutions, PA 2614 Tamiami Trail N, Suite 615 1205
Traffic Impact Statement (TIS) Vincentian PUDA Collier County, FL 10/18/2013 Prepared for: Global Properties of Naples Prepared by: Trebilcock Consulting Solutions, PA 2614 Tamiami Trail N, Suite 615 1205
Traffic Impact Study Speedway Gas Station Redevelopment
 Traffic Impact Study Speedway Gas Station Redevelopment Warrenville, Illinois Prepared For: Prepared By: April 11, 2018 Table of Contents 1. Introduction... 1 2. Existing Conditions... 4 Site Location...
Lacey Gateway Residential Phase 1
 Lacey Gateway Residential Phase Transportation Impact Study April 23, 203 Prepared for: Gateway 850 LLC 5 Lake Bellevue Drive Suite 02 Bellevue, WA 98005 Prepared by: TENW Transportation Engineering West
APPENDIX H. Transportation Impact Study
 APPENDIX H Transportation Impact Study BUENA VISTA LAGOON ENHANCEMENT PROJECT TRANSPORTATION IMPACT STUDY Prepared for: San Diego Association of Governments Prepared by: VRPA Technologies, Inc. 9520 Padgett
BARRHAVEN FELLOWSHIP CRC 3058 JOCKVALE ROAD OTTAWA, ONTARIO TRANSPORTATION BRIEF. Prepared for:
 BARRHAVEN FELLOWSHIP CRC 3058 JOCKVALE ROAD OTTAWA, ONTARIO TRANSPORTATION BRIEF Prepared for: Barrhaven Fellowship CRC 3058 Jockvale Road Ottawa, ON K2J 2W7 December 7, 2016 116-649 Report_1.doc D. J.
Diablo Vista Pumping Plant Replacement
 Diablo Vista Pumping Plant Replacement Traffic Study PHA Transportation Consultants 12-05-359 October 2012 Diablo Vista Pumping Plant Replacement Traffic Study For EBMUD October 2012 PHA Transportation
APPENDIX C-2. Traffic Study Supplemental Analysis Memo
 APPENDIX C-2 Traffic Study Supplemental Analysis Memo The Mobility Group Transportation Strategies & Solutions Memorandum To: From: Subject: Tomas Carranza, LADOT Matthew Simons Traffic Review - Revised
Executive Summary. Draft Environmental Impact Statement/Environmental Impact Report ES-1
 Executive Summary Introduction The Eastside Transit Corridor Phase 2 Project is a vital public transit infrastructure investment that would provide a transit connection to the existing Metro Gold Line
TRAFFIC IMPACT STUDY DERRY GREEN CORPORATE BUSINESS PARK MILTON SECONDARY PLAN MODIFICATION
 TRAFFIC IMPACT STUDY DERRY GREEN CORPORATE BUSINESS PARK MILTON SECONDARY PLAN MODIFICATION TRAFFIC IMPACT STUDY DERRY GREEN CORPORATE BUSINESS PARK MILTON SECONDARY PLAN MODIFICATION DECEMBER 24 UPDATED
TABLE OF CONTENTS SECTION PAGE. Executive Summary... xii
 TABLE OF CONTENTS SECTION PAGE Executive Summary... xii 1.0 Introduction... 1 1.1 Study Area... 2 1.2 Traffic Impact Analysis Scenarios... 4 1.3 Study Area - City of Orange... 4 2.0 Project Description
RICHMOND OAKS HEALTH CENTRE 6265 PERTH STREET OTTAWA, ONTARIO TRANSPORTATION BRIEF. Prepared for: Guycoki (Eastern) Limited.
 Limited.") RICHMOND OAKS HEALTH CENTRE 6265 PERTH STREET OTTAWA, ONTARIO TRANSPORTATION BRIEF Prepared for: Guycoki (Eastern) Limited June 16, 2016 116-638 Brief_1.doc D. J. Halpenny & Associates Ltd. Consulting
RICHMOND OAKS HEALTH CENTRE 6265 PERTH STREET OTTAWA, ONTARIO TRANSPORTATION BRIEF Prepared for: Guycoki (Eastern) Limited June 16, 2016 116-638 Brief_1.doc D. J. Halpenny & Associates Ltd. Consulting
IRSCH REEN Hirsch/Green Transportation Consulting, Inc.
 IRSCH REEN Hirsch/Green Transportation Consulting, Inc. February 6, 2013 Mr. David Weil Director of Finance St. Matthew s Parish School 1031 Bienveneda Avenue Pacific Palisades, California 90272 RE: Trip
EXECUTIVE SUMMARY. The following is an outline of the traffic analysis performed by Hales Engineering for the traffic conditions of this project.
 EXECUTIVE SUMMARY This study addresses the traffic impacts associated with the proposed Shopko redevelopment located in Sugarhouse, Utah. The Shopko redevelopment project is located between 1300 East and
The key roadways in the project vicinity are described below. Exhibit displays the existing number of lanes on the study roadways.
 4.2 TRAFFIC AND CIRCULATION This section presents the key assumptions, methods, and results of analysis for the transportation and circulation impacts of the proposed project. This section is based on
Los Angeles Mission College Facilities Master Plan Draft Program Environmental Impact Report 3.13 TRANSPORTATION / TRAFFIC
 3.13 TRANSPORTATION / TRAFFIC As a result of the analysis undertaken in the Initial Study for the Los Angeles Mission College Facilities Master Plan, the (LACCD) determined that the proposed project may
APPENDIX E. Traffic Analysis Report
 APPENDIX E Traffic Analysis Report THIS PAGE INTENTIONALLY BLANK EAGLE RIVER TRAFFIC MITIGATION PHASE I OLD GLENN HIGHWAY/EAGLE RIVER ROAD INTERSECTION IMPROVEMENTS TRAFFIC ANALYSIS Eagle River, Alaska
TRANSPORTATION 1. INTRODUCTION
 IV.F TRANSPORTATION 1. INTRODUCTION This section evaluates potential impacts associated with Project-related traffic, circulation, and access. The analysis summarizes the findings of the traffic study
Appendix B Traffic Impact Analysis, Asphalt Plant No. 1 Replacement and Modernization
 Appendix B Traffic Impact Analysis, Asphalt Plant No. 1 Replacement and Modernization REPORT Traffic Impact Analysis, Asphalt Plant No. 1 Replacement and Modernization Prepared for City of Los Angeles
MERIVALE PRIORITY SQUARE 2852 MERIVALE ROAD CITY OF OTTAWA TRANSPORTATION BRIEF. Prepared for: ONT Inc. 25 Winding Way Nepean, Ontario K2C 3H1
 MERIVALE PRIORITY SQUARE 2852 MERIVALE ROAD CITY OF OTTAWA TRANSPORTATION BRIEF Prepared for: 2190986ONT Inc. 25 Winding Way Nepean, Ontario K2C 3H1 October 6, 2010 110-502 Report_1.doc D. J. Halpenny
BROWARD BOULEVARD CORRIDOR TRANSIT STUDY
 BROWARD BOULEVARD CORRIDOR TRANSIT STUDY FM # 42802411201 EXECUTIVE SUMMARY July 2012 GOBROWARD Broward Boulevard Corridor Transit Study FM # 42802411201 Executive Summary Prepared For: Ms. Khalilah Ffrench,
2.0 Development Driveways. Movin Out June 2017
 Movin Out June 2017 1.0 Introduction The proposed Movin Out development is a mixed use development in the northeast quadrant of the intersection of West Broadway and Fayette Avenue in the City of Madison.
Proposed location of Camp Parkway Commerce Center. Vicinity map of Camp Parkway Commerce Center Southampton County, VA
 Proposed location of Camp Parkway Commerce Center Vicinity map of Camp Parkway Commerce Center Southampton County, VA Camp Parkway Commerce Center is a proposed distribution and industrial center to be
MEMO VIA . Ms. Amy Roth DPS Director, City of Three Rivers. To:
 MEMO To: Ms. Amy Roth DPS Director, City of Three Rivers VIA EMAIL From: Michael J. Labadie, PE Julie M. Kroll, PE, PTOE Brandon Hayes, PE, P.Eng. Fleis & VandenBrink Date: January 5, 2017 Re: Proposed
TRAFFIC SIGNAL DESIGN REPORT KING OF PRUSSIA ROAD & RAIDER ROAD RADNOR TOWNSHIP PENNSYLVANIA
 TRAFFIC SIGNAL DESIGN REPORT KING OF PRUSSIA ROAD & RAIDER ROAD RADNOR TOWNSHIP PENNSYLVANIA PREPARED FOR: UNIVERSITY OF PENNSYLVANIA HEALTH SYSTEM 34 CIVIC CENTER BOULEVARD PHILADELPHIA, PA 1987 (61)
Subarea Study. Manning Avenue (CSAH 15) Corridor Management and Safety Improvement Project. Final Version 1. Washington County.
 Corridor Management and Safety Improvement Project. Final Version 1. Washington County.") Subarea Study Manning Avenue (CSAH 15) Corridor Management and Safety Improvement Project Final Version 1 Washington County June 12, 214 SRF No. 138141 Table of Contents Introduction... 1 Forecast Methodology
Subarea Study Manning Avenue (CSAH 15) Corridor Management and Safety Improvement Project Final Version 1 Washington County June 12, 214 SRF No. 138141 Table of Contents Introduction... 1 Forecast Methodology
STUDIO CITY SENIOR LIVING CENTER PROJECT ENV EIR APPENDIX I TRAFFIC IMPACT STUDY
 STUDIO CITY SENIOR LIVING CENTER PROJECT ENV 2001-1196-EIR APPENDIX I TRAFFIC IMPACT STUDY TABLE OF CONTENTS SECTION PAGE 1.0 Introduction... 1 1.1 Study Area... 3 2.0 Project Description... 4 2.1 Site
Appendix B Traffic Impact Analysis, Asphalt Plant No. 1 Replacement and Modernization
 Appendix B Traffic Impact Analysis, Asphalt Plant No. 1 Replacement and Modernization DRAFT REPORT Traffic Impact Analysis, Asphalt Plant No. 1 Replacement and Modernization Prepared for City of Los Angeles
APPENDIX G TRAFFIC STUDY TECHNICAL MEMORANDUM
 APPENDIX G TRAFFIC STUDY TECHNICAL MEMORANDUM TECHNICAL MEMORANDUM To: From: Date: Subject: Jerry Flores - AECOM Brian A. Marchetti, AICP September 9, 5 DRAFT Traffic Study LABOE Channel 5 Studio Relocation
Energy Technical Memorandum
 Southeast Extension Project Lincoln Station to RidgeGate Parkway Prepared for: Federal Transit Administration Prepared by: Denver Regional Transportation District May 2014 Table of Contents Page No. Chapter
Downtown Lee s Summit Parking Study
 Downtown Lee s Summit Parking Study As part of the Downtown Lee s Summit Master Plan, a downtown parking and traffic study was completed by TranSystems Corporation in November 2003. The parking analysis
5.9 TRANSPORTATION AND TRAFFIC
 5.9 TRANSPORTATION AND TRAFFIC This section evaluates transportation- and traffic-related impacts that have the potential to result from the construction and operation of the Project. Information and analysis
Section 5.0 Traffic Information
 Section 5.0 Traffic Information 10.0 TRANSPORTATION MDM Transportation Consultants, Inc. (MDM) has prepared an evaluation of transportation impacts for the proposed evaluation for the expansion of the
DEVELOPMENT PROPERTY 1627 MAXIME STREET CITY OF OTTAWA TRANSPORTATION OVERVIEW. Prepared for: Subhas Bhargava. July 9, Overview_1.
 DEVELOPMENT PROPERTY 1627 MAXIME STREET CITY OF OTTAWA TRANSPORTATION OVERVIEW Prepared for: Subhas Bhargava July 9, 2015 115-620 Overview_1.doc D. J. Halpenny & Associates Ltd. Consulting Transportation
REGIONAL TRANSPORTATION SETTING
 CIRCULATION ELEMENT WHITE PAPER NO. 1 REGIONAL TRANSPORTATION SETTING INTRODUCTION According to the Southern California Association of Governments (SCAG), by 2030 the six- County region will be home to
Date: February 7, 2017 John Doyle, Z-Best Products Robert Del Rio. T.E. Z-Best Traffic Operations and Site Access Analysis
 Memorandum Date: February 7, 07 To: From: Subject: John Doyle, Z-Best Products Robert Del Rio. T.E. Z-Best Traffic Operations and Site Access Analysis Introduction Hexagon Transportation Consultants, Inc.
TRAFFIC IMPACT ANALYSIS
 TRAFFIC IMPACT ANALYSIS Emerald Isle Commercial Development Prepared by SEPI Engineering & Construction Prepared for Ark Consulting Group, PLLC March 2016 I. Executive Summary A. Site Location The Emerald
Appendix G Traffic Study Methodology
 REVISED DRAFT ENVIRONMENTAL IMPACT REPORT/ Appendix G Traffic Forecasting Model Methodology In addition to the existing/baseline condition (year 2005), a level of service (LOS) analysis was conducted for
TRAFFIC PARKING ANALYSIS
 TRAFFIC PARKING ANALYSIS NAPA FLEA MARKET COUNTY OF NAPA Prepared for: Tom Harding Napa-Vallejo Flea Market 33 Kelly Road American Canyon, CA 9453 Prepared by: 166 Olympic Boulevard, Suite 21 Walnut Creek,
TALMONT TOWNHOMES MADISON KENNETH SPA TRAFFIC IMPACT STUDY. Sacramento, CA. Prepared For: MBK Homes. Prepared By:
 TALMONT TOWNHOMES MADISON KENNETH SPA TRAFFIC IMPACT STUDY Sacramento, CA Prepared For: MBK Homes Prepared By: KD Anderson & Associates 3853 Taylor Road, Suite G Loomis, California 95650 (916) 660-1555
L1TILE BEARS DAY CARE TRANSPORTATION IMPACT STUDY FORT COLLINS, COLORADO MAY Prepared for:
 L1TILE BEARS DAY CARE TRANSPORTATION IMPACT STUDY FORT COLLINS, COLORADO MAY 2012 Prepared for: Hillside Construction, Inc. 216 Hemlock Street, Suite B Fort Collins, CO 80534 Prepared by: DELICH ASSOCIATES
Madison BRT Transit Corridor Study Proposed BRT Operations Plans
 Madison BRT Transit Corridor Study Proposed BRT Operations Plans This paper presents a description of the proposed BRT operations plan for use in the Madison BRT Transit Corridor Study. The objective is
Clean Harbors Canada, Inc.
 Clean Harbors Canada, Inc. Proposed Lambton Landfill Expansion Environmental Assessment Terms of Reference Transportation Assessment St. Clair Township, Ontario September 2009 itrans Consulting Inc. 260
V. DEVELOPMENT OF CONCEPTS
 Martin Luther King, Jr. Drive Extension FINAL Feasibility Study Page 9 V. DEVELOPMENT OF CONCEPTS Throughout the study process several alternative alignments were developed and eliminated. Initial discussion
V. ENVIRONMENTAL IMPACT ANALYSIS F. TRANSPORTATION/CIRCULATION
 V. ENVIRONMENTAL IMPACT ANALYSIS F. TRANSPORTATION/CIRCULATION The following Section presents a summary of the Traffic Study for the Proposed Civic Center/Metlox Development Project in the City of Manhattan
King Soopers #116 Thornton, Colorado
 Traffic Impact Study King Soopers #116 Thornton, Colorado Prepared for: Galloway & Company, Inc. T R A F F I C I M P A C T S T U D Y King Soopers #116 Thornton, Colorado Prepared for Galloway & Company
MONTEREY BAY AQUARIUM RESEARCH INSTITUTE (MBARI) MASTER PLAN UPDATE MOSS LANDING, CALIFORNIA
 MASTER PLAN UPDATE MOSS LANDING, CALIFORNIA") MONTEREY BAY AQUARIUM RESEARCH INSTITUTE (MBARI) MASTER PLAN UPDATE MOSS LANDING, CALIFORNIA TRAFFIC IMPACT ANALYSIS Administrative Draft Report Prepared For Monterey Bay Aquarium Research Institute Moss
MONTEREY BAY AQUARIUM RESEARCH INSTITUTE (MBARI) MASTER PLAN UPDATE MOSS LANDING, CALIFORNIA TRAFFIC IMPACT ANALYSIS Administrative Draft Report Prepared For Monterey Bay Aquarium Research Institute Moss
Impacts to street segments were analyzed based on procedures detailed in the Highway Capacity Manual for levels of service related to roadways.
 4.7 Transportation and Circulation This report documents the results of a study of the potential traffic impacts created by the Whittier Main Oil Field Development Project. The study is included as Appendix
APPENDIX VMT Evaluation
 APPENDIX 2.7-2 VMT Evaluation MEMORANDUM To: From: Mr. Jonathan Frankel New Urban West, Incorporated Chris Mendiara LLG, Engineers Date: May 19, 2017 LLG Ref: 3-16-2614 Subject: Villages VMT Evaluation
MEMORANDUM. Project Description. Operational Trip Generation. Construction Trip Generation. Date: August 12, 2014 TG: To: From: Subject:
 MEMORANDUM Date: August 12, 2014 TG: 13329.01 To: From: Subject: Jeremy Krout EPD Solutions Inc. Rafik Albert EPD Solutions Inc. Rawad Hani Transpo Group AP North Lake Solar Project Traffic Scoping The
Table of Contents. Traffic Impact Analysis Capital One Building at Schilling Place
 Traffic Impact Analysis Capital One Building at Schilling Place Table of Contents Executive Summary... 1 1. Introduction... 4 2. Project Description... 4 3. Background Information... 4 4. Study Scope...
Vanier Parkway and Presland Road Residential Development Transportation Impact Study
 Vanier Parkway and Presland Road Residential Development Transportation Impact Study Final Report (Revised) March 2011 Submitted to: Groupe Lépine Ottawa Project No. 09-1613 Submitted by: Groupe Lépine
Parks and Transportation System Development Charge Methodology
 City of Sandy Parks and Transportation System Development Charge Methodology March, 2016 Background In order to implement a City Council goal the City of Sandy engaged FCS Group in January of 2015 to update
Attachment D Environmental Justice and Outreach
 Attachment D Environmental Justice and Outreach ATTACHMENT D Environmental Justice and Outreach Indicate whether the project will have disproportionately high and adverse impacts on minority or low income
Traffic Impact Analysis West Street Garden Plots Improvements and DuPage River Park Garden Plots Development Naperville, Illinois
 Traffic Impact Analysis West Street Garden Plots Improvements and DuPage River Park Garden Plots Development Naperville, Illinois Submitted by April 9, 2009 Introduction Kenig, Lindgren, O Hara, Aboona,
Trip Generation & Parking Occupancy Data Collection: Grocery Stores Student Chapter of Institute of Transportation Engineers at UCLA Spring 2014
 Trip Generation & Parking Occupancy Data Collection: Grocery Stores Student Chapter of Institute of Transportation Engineers at UCLA Spring 2014 Page 1 Introduction The UCLA Institute of Transportation
Mercer Island Center for the Arts Parking Management Plan
 Parking Stalls Mercer Island Center for the Arts Parking Management Plan June 15, 2016 This Parking Management Plan (P) covers all tenants at the Mercer Island Center for the Arts (MICA) campus, including
IV. ENVIRONMENTAL IMPACT ANALYSIS I. TRAFFIC / TRANSPORTATION
 IV. ENVIRONMENTAL IMPACT ANALYSIS I. TRAFFIC / TRANSPORTATION 1. INTRODUCTION The following section summarizes the information provided in the following traffic studies and collectively referred to as
4.14 TRANSPORTATION AND CIRCULATION
 4.14 TRANSPORTATION AND CIRCULATION 4.14.1 Summary Table 4.14-1 summarizes the identified environmental impacts, proposed mitigation measures, and residual impacts of the proposed project with regard to
YULA Boys High School Expansion
 Environmental Review Section City Hall 200 N. Spring Street, Room 750 Los Angeles, CA 90012 RECIRCULATED TRAFFIC/TRANSPORTATION/PARKING CHAPTER WEST LOS ANGELES COMMUNITY PLAN AREA YULA Boys High School