TRAFFIC IMPACT ANALYSIS FOR A PROPOSED MIXED USE DEVELOPMENT
|
|
|
- Augustus Wood
- 5 years ago
- Views:
Transcription
1
2 TRAFFIC IMPACT ANALYSIS FOR A PROPOSED MIXED USE DEVELOPMENT Located at southeast corner of Winnetka Avenue and Prairie Street In the City of Los Angeles Prepared for: Sky Tech Management & Construction Prepared by: Overland Traffic Consultants, Inc Main Street # 202 Santa Clarita, California (661) January 2014 Revised October 2014
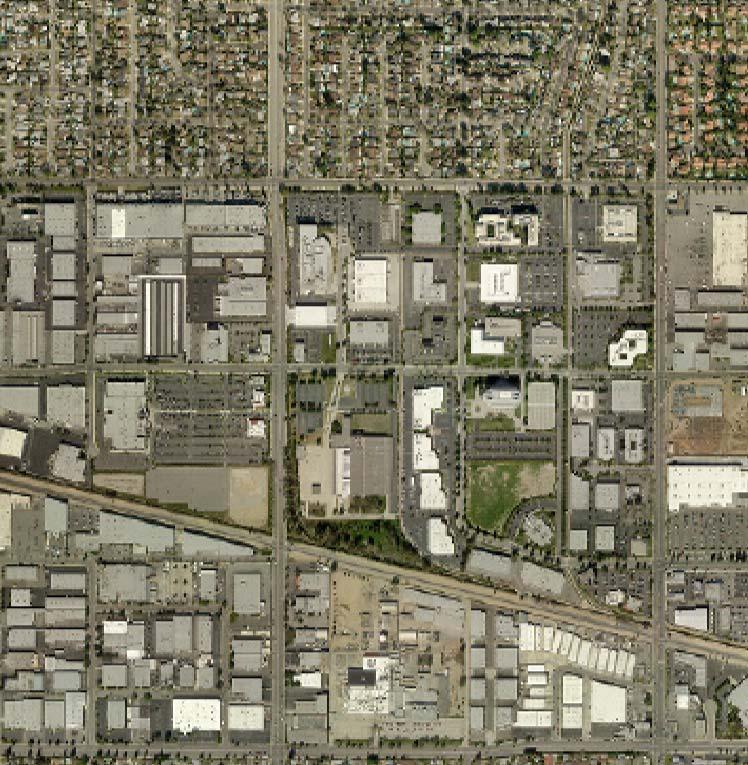
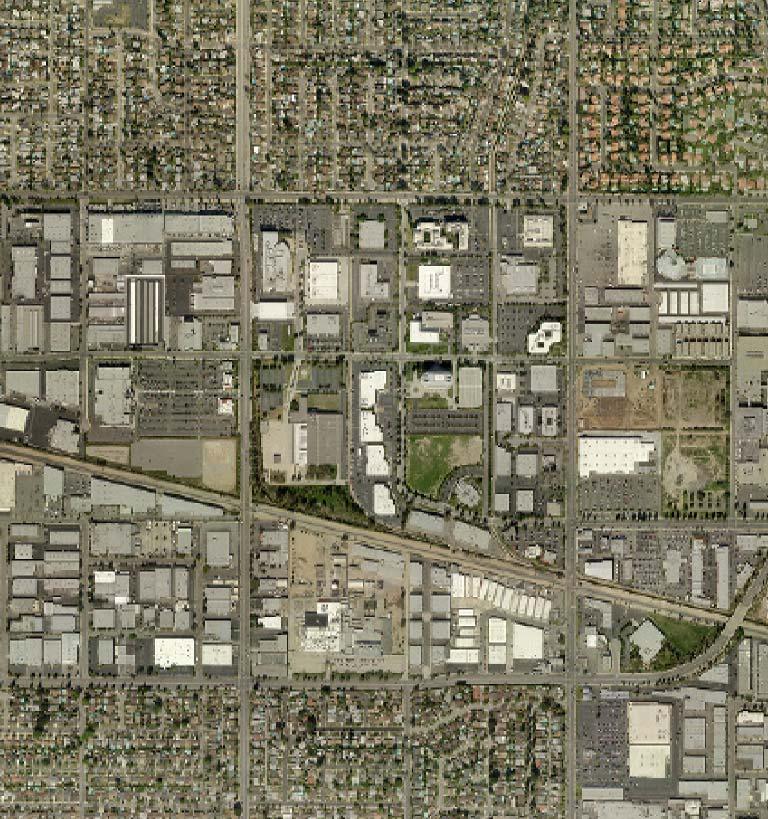
3 Overland Traffic Consultants, Inc. EXECUTIVE SUMMARY Purpose of Study This report documents the results of a study evaluating potential traffic impacts created by a mixed-use project and recommends traffic mitigation measures to accommodate the future development. The study addresses traffic patterns, vehicle routing, roadway capacity and parking requirements. The proposed project consisting of 700 apartments, 11,000 square feet of commercial retail use, 3,000 square feet of restaurant, 43,000 square feet of creative office and 212,815 square feet of light industrial to be used as a corporate headquarters for MGA Entertainment. The development is located at the southeast corner of Winnetka Avenue and Prairie Street. The project site is shown on the following aerial photograph. Traffic Generation It is estimated that the project would generate 8,157 daily vehicle trips with 788 morning and 860 afternoon peak hour trips. It is important to note that no traffic credits are available for the prior LA Times industrial building located on-site. Parking will be provided by 1,467 parking spaces in several parking structures and surface lots. Access to the parking is via two driveways on Prairie Street and one signalized driveway on Winnetka Avenue. Project s Potential Traffic Impacts The focus of this traffic study is to evaluate the potential traffic impact created by the development of the mixed - use project. This traffic study provides two baseline scenarios to evaluate the project s traffic impacts: (1) existing traffic conditions plus the project traffic volume ( Existing + Project ) and (2) future 2019 cumulative traffic conditions plus the project traffic volume ( Future 2019 Cumulative + Project ). MGA Chatsworth Mixed - Use Page i January 2014 Traffic Impact Study Executive Summary
4 Overland Traffic Consultants, Inc. Project Traffic Impacts (Existing + Project) Using criteria in the City of Los Angeles Traffic Study Guidelines, it has been determined that the changes in the existing traffic conditions caused by the project s traffic flow will significantly impact two study intersections: 1. Winnetka Avenue and Parthenia Street (#6) is significantly impacted during the weekday morning peak hour prior to implementing traffic mitigation measures. 2. The intersection of Corbin Avenue and Plummer Street (#8) is also significantly impacted during the weekday morning peak hour prior to implementing traffic mitigation measures. Private Shuttle To mitigate the project s existing traffic impacts, it is recommended that the project operate a peak hour private shuttle. This shuttle will be available to serve the site during mid-day and evening hours to provide residents and employees more mobility choices through out the day. This will allow residents and employees to be car-free if desired. The shuttle route is targeted to Warner Center, the Metro Orange Line and the Chatsworth Metrolink Station. The peak hour routes will allow residents and employees to ride shuttles for work and non-work trips and provide connections to train and bus stations/stops at the Pierce College station, the Warner Center Owensmouth Transit Center and the Metro Chatsworth Orange Line / Metro link Station. Street Improvements In addition to the private shuttle, several street improvements have been selected to address localized traffic congestion in the study area. Listed below are the recommended roadway traffic mitigation measures. 1. Winnetka Avenue and Parthenia Street (#6) - It is recommended that Parthenia Street be restriped for a westbound right-turn only lane Street at Winnetka Avenue. Traffic signals will be upgraded to accommodate the new right turn lane and brought up to current traffic signal standards. MGA Chatsworth Mixed - Use Page ii January 2014 Traffic Impact Study Executive Summary
5 Overland Traffic Consultants, Inc. 2. Corbin Avenue and Plummer Street (#8) - It is recommended that Corbin Avenue be restriped for a southbound right-turn only lane at Plummer Street. Traffic signals will be upgraded to accommodate the new right turn lane and brought up to current traffic signal standards. 3. Install a new traffic signal at the intersection of Winnetka Avenue and MGA Winnetka Avenue driveway. Project Traffic Impacts (Future 2019 Cumulative + Project) Based on the future traffic conditions analyses for 2019, five study intersections are significantly impacted by the project s traffic. The intersections and impacted time periods are: 1. Winnetka Avenue and Nordhoff Street (#5) during the morning peak hour; 2. Winnetka Avenue and Parthenia Street (#6) during both the morning and afternoon peak hours; 3. Winnetka Avenue and Roscoe Boulevard (#7) during the morning peak hour; 4. Corbin Avenue and Plummer Street (#8) during both the morning and afternoon peak hours; and 5. Corbin Avenue and Prairie Street (#9) during the morning peak hour. Future cumulative traffic impacts with an expanded MGA Transportation Demand Management (TDM) program and the roadway improvements previously described will reduce the significant traffic impacts to less than significance at 3 of the 5 intersections. Significant traffic impacts, however, will remain at the intersections of Corbin Avenue and Plummer Street and at Corbin Avenue and Prairie Street. Listed below are the recommended traffic mitigation measures. Transportation Demand Management (TDM) Although roadway improvements will continue to be an important strategy for providing mobility, the focus of the transportation mitigation plan for the MGA mixed use project is to develop a congestion avoidance program through trip reductions while maintaining and providing transportation mobility. MGA Chatsworth Mixed - Use Page iii January 2014 Traffic Impact Study Executive Summary
6 Overland Traffic Consultants, Inc. The MGA TDM program is designed to maximize the people-moving capability by increasing the number of person in a vehicle, or by influencing the time of, or need to, travel. To accomplish these types of changes in travel behavior, the TDM program elements must rely on incentives or disincentives to make these shifts in behavior attractive. Employer based TDM programs often are the most effective in reducing trips. TDM strategies can be chosen to meet a relatively narrow set of worksite and commuter demographic characteristics. Information dissemination can be targeted precisely to the employees and residents most likely to use the alternatives, and offered in a personalized manner that eases the transition to a different and possibly unfamiliar travel mode. Furthermore, it is very important the MGA establishes a corporate culture that affirms employees and residents decisions to use a commuting alternative. Although employer support measures are very important in supporting TDM alternatives, they are not instruments that, in themselves, actually change behavior. A truly effective TDM program will implement incentives and disincentives that are clearly perceived by the individual making the decision to travel. I. Improved Transit Alternatives 1. Private MGA Transit (shuttle service) Continue to operate the private shuttle service targeted specifically to the needs of the MGA residents and employees. It is recommended that MGA provide a fixed-route shuttle route providing 30 - minute headways during the morning and afternoon peak hour to the nearby transit stations and work centers. Mid-day and off-peak schedules will be more demand-responsive providing viable and convenient transit options for MGA residents and employees. o Warner Center / Chatsworth Orange Line Route - traveling along Winnetka Avenue to the Orange Line Pierce College Station then along Victory Boulevard to the Warner Center Station and lastly along Canoga Avenue to the Chatsworth Station, returning to the MGA site along Nordhoff Street. MGA Chatsworth Mixed - Use Page iv January 2014 Traffic Impact Study Executive Summary
7 Overland Traffic Consultants, Inc. o Shuttles will be equipped with bike racks to promote the bike usage program. Note that DASH service does not currently provide bike racks. II. TDM Alternatives (carpool and bike with site improvements) 1. Carpool program o MGA contracts with local taxi company to provide a guaranteed ride home for late workers, workers who miss their ride or need to attend to a midday emergency. o MGA provides preferential parking for carpoolers and vanpoolers. o MGA assists in providing one-on-one employee and resident assistance in forming and maintaining rideshare arrangement. 2. Bicycle program o MGA will provide support facilities and services, such as bike parking and storage facilities, bike repair facilities, changing and shower facilities. o MGA will provide areas for bike displays from bicycle manufacturers and local shops at periodic bike fairs and promotional events. 3. MGA Multi-modal Site Improvements A common objection to ridesharing is the need to have a car during the day to perform personal or job-related errands. o MGA will provide on-site Day Care, retail and employee cafeteria to reduce trip making. o MGA will establish a satellite remote work center for MGA residents who are non-mga employees but choose to telecommute. o MGA will provide an on-site designated rideshare friendly shuttle plaza and loading area. MGA Chatsworth Mixed - Use Page v January 2014 Traffic Impact Study Executive Summary
8 Overland Traffic Consultants, Inc. III. Incentives and Disincentives 1. MGA Support Measures o Corporate commitment to the overall level of support for the TDM program. Promote a corporate culture to reflect the willingness to devote resources to the program and provide tangible benefits to commute alternatives. o Provide on-site TDM marketing features to disseminate information thru bulletin boards, new employee / resident orientation, news letters, promotional fairs, etc. o Staff a TDM Coordinator to manage the programs development, implementation, marketing, administration and program evaluation. Services include personalize commute planning assistance. o Support promotional activities such as fairs, clubs and awards that can increase commuters interest in ridesharing. 2. Parking Management Price of parking is the single most influential factor determining the share of commuters who drove to work. A reduced parking supply and chase-out parking at work can dramatically alter travel behavior and reduce solo drive-alone travel patterns. o Provide monthly stipend for employees to use on whatever travel mode they wish, including driving alone. Implemented thru the daily cash out credit / debit tracking employee identification card. Daily Cash Out Program gives commuters a new choice, rewards the alternative to solo driving, reduces trips and treats all commuters equally. MGA will continue to offer subsidized parking but will broaden the offer to include the option to take the cash equivalent of the parking subsidy instead of the parking subsidy itself. The forgone cash mean MGA Chatsworth Mixed - Use Page vi January 2014 Traffic Impact Study Executive Summary
9 Overland Traffic Consultants, Inc. drivers in effect pay for their free parking. Parking cash out is a buyback not a take-way, it rewards commuters for choosing the alternate to driving to work alone, rather than punishing them for solo driving. For example: under the program, MGA employees can park free at work on any day, but any commuter who brings a car will scan an employee ID card to enter the garage and receive a debit. All employees automatically earn a credit each day when they use their employee identification card to enter the office building. These accumulated credits and debits are tallied each month to determine the employee s cash or cash equivalent transportation allowance. Each member of a carpool / vanpool receives a credit for reporting to work and the one whose identification card activates the parking lot gate incurs the debit, which can be credited back via carpool/ vanpool registration program. 3. Alternative Work Arrangements Alternative Work Hours can reduce the number of days and thus the number of miles traveled commuting, and shift employees travel to a time outside normal daily peak periods. Because of these two factors, the alternative work hours program can be effective in reduce traffic congestion and air pollution. o Staggered work hours In a staggered work hour program, MGA employee s start work times are scheduled at intervals so that different groups of employees (often by departments) begin work at different times. o Compressed work hours Compressed work week programs allow employees to work a full work week in fewer than the usual five days. The most common are: 4/10 with four 10-hour days; 3/36 with three 12-hour days and 9/80 with eight 9-hour days and one 8-hour day. MGA Chatsworth Mixed - Use Page vii January 2014 Traffic Impact Study Executive Summary
10 Overland Traffic Consultants, Inc. o Flexible work hours (flextime) Flextime allows employees to set their own arrival and departure times within core hours during which all employees must be in the office. Trip cap monitoring agreement The success of the TDM plan is dependent on the type and level of TDM strategies implemented. The key to developing an effective program is to determine what strategies the employees and residents of the MGA mixed -use project would be able to use and then build the program incentives around those strategies.. It is recommend that a 1 year trip count be conducted after occupancy of the MGA Corporate Headquarters building to establish the true impact and assist in targeting the most effective TDM measures with a second trip count after occupancy of the first 350 apartment units. Note that large trip reductions may not be entirely necessary. The trip generation rates used by LADOT for this study are mainly based on the square footage for corporate headquarters. MGA will also have limited assembly, showroom space and production facilities. As a result the employee density is much lower and may generated significantly less traffic and less impact that estimated by LADOT s trip generation estimates based on gross floor area. It is recommend that a 1 year trip count evaluation at the projects driveways and TDM survey be conducted to establish the true impact and assist in targeting the most effective TDM measures. Peak Parking Demand Based on recommendations from the ULI database, the amount of parking needed for this mix use project is primarily affected by the proportion of reserved parking for the residential units and the peak parking demand of the office uses. The peak parking demand estimated by this evaluation represents the total parking demand to serve the needs of customers, visitors and employees. The parking demand calculated for the MGA mixed use project is 1,334 parking spaces using the ULI parking demand model. The project is providing 1,467 parking spaces. MGA Chatsworth Mixed - Use Page viii January 2014 Traffic Impact Study Executive Summary
11
12 Overland Traffic Consultants, Inc. TABLE OF CONTENTS Chapter 1 - Introduction... 1 Chapter 2 - Project Description... 3 Chapter 3 - Environmental Setting... 6 Land Use... 6 Transportation Facilities... 6 Transit Information... 9 Chapter 4 - Project Traffic Characteristics Project Traffic Generation Traffic Distribution and Assignment of Project Traffic Chapter 5 - Traffic Conditions Analysis Analysis of Existing Traffic Conditions Analysis of Existing + Project Traffic Conditions Analysis of Future Traffic Conditions Impacts on Regional Transportation System Chapter 6 - Mitigation Measures Project Traffic Impacts (Existing + Project) Project Traffic Impacts (Future Project) Recommended Traffic Mitigation Measures Chapter 7 - Parking Demand MGA Chatsworth Mixed - Use Page x January 2014 Traffic Impact Study Table of Contents
13 Overland Traffic Consultants, Inc. List of Appendix Appendix A Community Plan Land Use Information Appendix B Circulation Maps, Street Standards & Street Plans Appendix C Transit Routes Appendix D Traffic Volume Data Appendix E Level of Service Worksheets Appendix F Related Projects Flow Maps Appendix G Projects Driveway Volume Appendix H Project s Traffic Signal Warrant Analysis Appendix I Planned Bike Lanes MGA Chatsworth Mixed - Use Page xi January 2014 Traffic Impact Study List of Appendix
14 Overland Traffic Consultants, Inc. LIST OF FIGURES Figure 1 - Project Location... 4 Figure 2 - Project Site Plans... 5 Figure 3 - Study Intersection Characteristics Figure 4 - Project Traffic Assignment Percentages Figure 5 - Project Traffic - AM Peak Hour Figure 6 - Project Traffic - PM Peak Hour Figure 7 - Existing (2013) Traffic Volume - AM Peak Hour Figure 8 - Existing (2013) Traffic Volume - PM Peak Hour Figure 9 - Existing + Project Traffic Volume - AM Peak Hour Figure 10 - Existing + Project Traffic Volume - PM Peak Hour Figure 11 - Related Project Map Figure 12 - Future Traffic Volume (Without Project) - AM Peak Hour Figure 13 - Future Traffic Volume (Without Project) - PM Peak Hour Figure 14 - Future Traffic Volume (With Project) - AM Peak Hour Figure 15 - Future Traffic Volume (With Project) - PM Peak Hour Figure 16 - Conceptual Traffic Mitigation - Winnetka Av. & Parthenia St.. 38 Figure 17 - Conceptual Traffic Mitigation Corbin Av. & Plummer St Figure 18 - MAG West Shuttle Route MGA Chatsworth Mixed - Use Page xii January 2014 Traffic Impact Study List of Figures
15 Overland Traffic Consultants, Inc. LIST OF TABLES Table 1 - Project Trip Generation Rates Table 2 - Project Traffic Generation Table 3 - Level of Service Definitions Table 4 - Existing Traffic Conditions Summary Table 5 - Existing + Project Traffic Conditions Summary Table 6 - Related Projects Descriptions Table 7 - Related Projects Traffic Generation Table 8 - Future Traffic Conditions Without Project Table 9 - Future Traffic Conditions With Project Table 10 - Existing + Project Traffic Mitigation Summary Table 11 - Future Cumulative + Project Traffic Mitigation Summary Table 12 - Hourly Parking Demand Values for MGA Campus MGA Chatsworth Mixed - Use Page xiii January 2014 Traffic Impact Study List of Tables
16 Overland Traffic Consultants, Inc. CHAPTER 1 INTRODUCTION An evaluation of the potential traffic impacts created by the proposed project has been conducted as part of the project s environmental review. This traffic study was prepared using procedures adopted by the City of Los Angeles Department of Transportation (LADOT) to evaluate the potential traffic impacts of the proposed project. The impact of a development project is determined by comparing the changes in the traffic conditions at selected study intersections. The amount of new traffic added to an intersection by the proposed project determines the significance of the project traffic impact. Potential traffic impacts caused by a development project that exceed limits established by the City of Los Angeles are deemed significant traffic impacts. All significantly impacted intersections are then evaluated for possible traffic mitigation measures. The traffic impact of the proposed development has been calculated using the LADOT Critical Movement Analysis (CMA) method. The CMA analysis method quantifies the operating conditions of an intersection using a ratio of peak hour traffic volume to intersection capacity (V/C). According to the standards adopted by the City of Los Angeles, a traffic impact is considered significant if the related increase in the V/C value equals or exceeds the thresholds for each Level of Service (LOS) as shown in the table below. City of Los Angeles Significance Thresholds LOS Final V/C Value Increase in V/C Value C D E and F > or more MGA Chatsworth Mixed - Use Page 1 January 2014 Traffic Impact Study Introduction
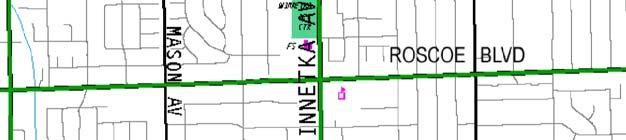
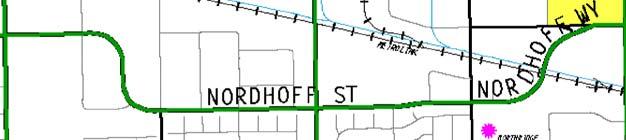
17 Overland Traffic Consultants, Inc. Eleven study intersections have been selected by LADOT for the project s traffic impact analysis. Only signalized intersections are included in the traffic impact analysis. The existing intersection of Prairie Street and Penfield Avenue has been evaluated for the potential installation of a new traffic signal. 1. Mason Avenue and Plummer Street; 2. Winnetka Avenue and Lassen Street; 3. Winnetka Avenue and Plummer Street; 4. Winnetka Avenue and Prairie Street; 5. Winnetka Avenue and Nordhoff Street; 6. Winnetka Avenue and Parthenia Street; 7. Winnetka Avenue and Roscoe Boulevard; 8. Corbin Avenue and Plummer Street; 9. Corbin Avenue and Prairie Street; and, 10. Corbin Avenue and Nordhoff Place; 11. Corbin Avenue and Nordhoff Street/Nordhoff Way; and 12. Penfield Avenue and Prairie Street (for traffic signal warrant). The analysis of traffic flow has been conducted for existing and for future conditions. The future analysis documents traffic conditions with the proposed project and other potential land development projects near the study area. Pursuant to the LADOT s traffic study guidelines, the following steps have been taken to develop the traffic volume estimates: (a) Existing traffic; (b) Existing traffic + project traffic; (c) Traffic in (b) + traffic mitigation, if necessary; (d) Existing traffic + ambient growth to study year (added 1.5% per year); (e) Traffic in (d) + other development related projects (without project scenario); (f) Traffic in (e) + project traffic (with project scenario); and (g) Traffic in (f) + traffic mitigation, if necessary. MGA Chatsworth Mixed - Use Page 2 January 2014 Traffic Impact Study Introduction
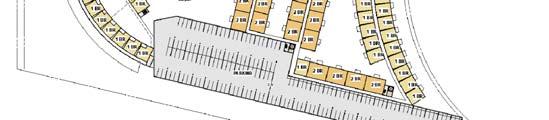
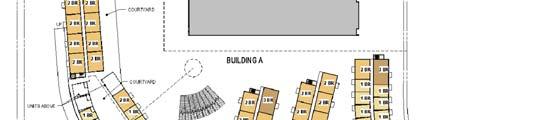
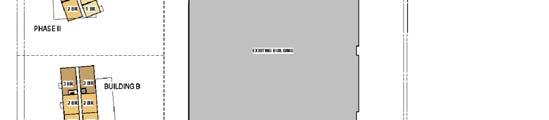
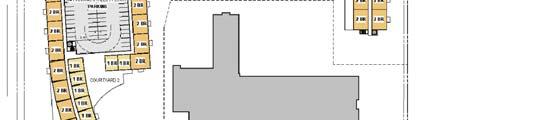
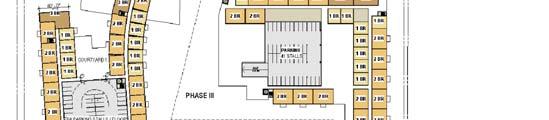
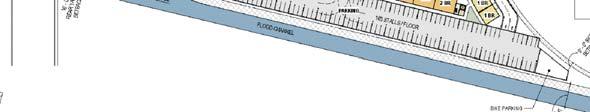
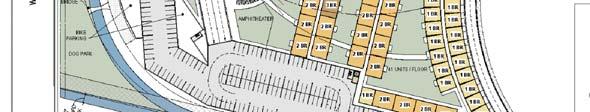
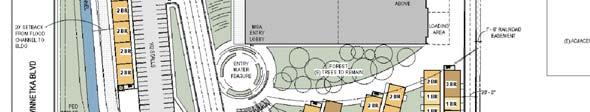
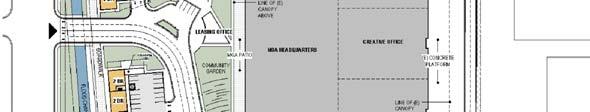
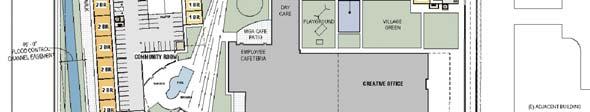
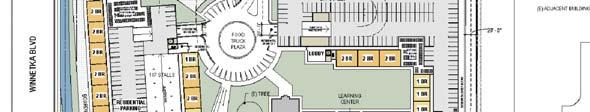
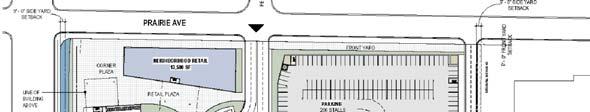
18 Overland Traffic Consultants, Inc. CHAPTER 2 PROJECT DESCRIPTION The project being proposed is a mixed-use project consisting of 700 apartment dwelling units, 11,000 square feet of commercial retail use, 3,000 square feet of restaurant, 43,000 square feet of creative office and 212,815 square feet of light industrial to be used as a corporate headquarters for MGA Entertainment. It is important to note that no traffic credits have been given for the prior LA Times industrial building. The project site is located at the southeast corner of Winnetka Avenue and Prairie Street, as shown in Figure 1. A total of 1,467 parking spaces and a minimum of 274 bike parking spaces are being provided. Locations for additional bike parking have been identified at the southeast and southwest corners of the site. Access to the vehicular parking is via two driveways on Prairie Street and one signalized driveway on Winnetka Avenue. A new traffic signal is proposed for the project s Winnetka Avenue driveway. Figure 2 illustrates the proposed building locations, parking and access. MGA Chatsworth Mixed - Use Page 3 January 2014 Traffic Impact Study Project Description
19
20
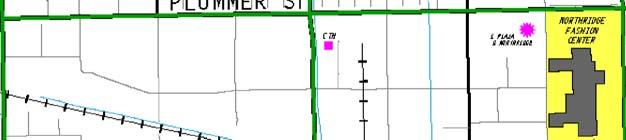
21 Overland Traffic Consultants, Inc. CHAPTER 3 ENVIRONMENTAL SETTING Land Use The project is located in the Chatsworth Porter Ranch Community plan area located approximately 22 miles northwest of downtown Los Angeles. Industrial land uses surround the project site, with single -family residential land uses further to the north and south. Community land use maps for the study area are provided in Appendix A. Transportation Facilities The streets within the study area are under the jurisdiction of the City of Los Angeles. A map illustrating the community plan highway designations and Los Angeles street standards are included in Appendix B. The nearest regional facility serving the site is the Ronald Reagan Freeway (State Highway 118), which is under the jurisdiction of the California Department of Transportation (Caltrans). In addition to collecting traffic volume data, field surveys were conducted to determine the roadway and intersection geometry and traffic signal operations. All of the intersections studied are controlled by traffic signals. Figure 3 illustrates the study locations, type of intersection traffic control and lane configurations. A brief description of the adjacent roadway facilities is provided below with street plans of all the study intersections and roadway geometrics provided in Appendix B. The Ronald Reagan Freeway (State Highway 118) is located approximately 2.5 miles north of the project site. This east - west freeway provides four mixed-flow lanes and one high-occupancy lane (HOV) in each direction. Full access to the freeway is provided from De Soto Avenue and Tampa Avenue. Average daily traffic volume on the 118 Freeway east of De Soto Avenue is approximately 150,000 vehicles per day (ADT). Current non-directional peak hour traffic volume on the 118 Freeway is approximately 14,000 VPH per Caltrans. As reported by the Los Angeles County Congestion MGA Chatsworth Mixed - Use Page 6 January 2014 Traffic Impact Study Environmental Setting
22 Overland Traffic Consultants, Inc. Management Program (CMP), the 118 Freeway at Woodley Avenue is operating at LOS E in the morning peak hour and LOS D in the afternoon peak hour. Winnetka Avenue, adjacent to the project site is a north-south class II major highway. Winnetka Avenue provides two lanes in the each direction, median channelization and bike lanes between Devonshire Street and Gault Street. The posted speed limit is 40 mph at Prairie Street. The street is developed with residential uses north of Plummer Street and industrial uses south of Plummer Street. The Pacific Theater complex and supporting retail center is located adjacent to the project site along the west side of Winnetka Avenue south of Prairie Street. On street parking is not allowed adjacent to the project site. Corbin Avenue is a north-south secondary highway. The street is also developed with residential uses north of Plummer Street and industrial uses south of Plummer Street. In the vicinity of the project, Corbin Avenue provides two lanes in the each direction with left-turn channelization. A third northbound lane is added between Parthenia Street and Plummer Street. A third southbound lane is provided between Dearborn Street and Nordhoff Street/Nordhoff Way. The roadway width varies and on-street parking is permitted where the roadway width is sufficient. Bike lanes have been installed on Corbin Avenue north of Lassen Street. Mason Avenue is a north-south secondary highway providing two lanes in the each direction and on-street parking. There is an at-grade rail crossing south of Prairie Street. Prairie Street is an east-west collector street adjacent to the project site with a western terminus at De Soto Avenue; the roadway changes its name to Lurline Avenue west of Mason Avenue. The eastern terminus of Prairie Street is located at the Northridge Fashion Center at Shirley Avenue. The roadway provides one lane in each direction, median channelization and bike lanes. Bike lanes have been recently installed on Prairie Street as part of the City s Bike Master Plan. MGA Chatsworth Mixed - Use Page 7 January 2014 Traffic Impact Study Environmental Setting
23 Overland Traffic Consultants, Inc. Lassen Street is an east-west secondary highway providing two lanes in each direction, left turn channelization and on-street parking. The posted speed limit on Lassen Street is 40 MPH. The intersection with Winnetka Avenue is traffic signal controlled. Plummer Street is an east-west secondary highway in the vicinity of the project. Plummer Street provides two lanes in each direction with left turn channelization and on street parking. Plummer Street is a designated bicycle route with a class II bikeway (bicycle lanes) east of Winnetka Avenue and a class III bikeway (shared facility) west of Winnetka Avenue. Nordhoff Street is an east-west class II major highway. Nordhoff Street forms a jogged intersection at Corbin Avenue with the westerly leg approximately 0.25 miles south of the easterly leg. Nordhoff Street is striped for two lanes in the each direction with left turn channelization. West of Quartz Lane, an afternoon peak hour lane is provided in each direction. East of the Northridge Fashion Center s Sears driveway, Nordhoff Street provides three lanes in each direction and median channelization. The Nordhoff Way connector road provides a continuous bypass route for Nordhoff Street traffic, eliminating the need for east-west through traffic to negotiate the two jogged intersections of Nordhoff Street at Corbin Avenue. Bike lanes on Nordhoff Street are planned as part of the City s Bike Maser Plan. Roscoe Boulevard is an east-west class II major highway. In the vicinity of the project, the roadway provides two lanes in each direction with median channelization plus peak hour traffic lanes. Figure 3 illustrates the lane configurations and traffic control at the study intersections. MGA Chatsworth Mixed - Use Page 8 January 2014 Traffic Impact Study Environmental Setting
24 Overland Traffic Consultants, Inc. Transit Information No direct transit access currently exists on Winnetka Avenue or on Prairie Street adjacent to the project site. LADOT provides a local shuttle line Northridge DASH east of the project. The nearest DASH stop is located at Nordhoff Street and Corbin Avenue. Northridge DASH serves the Northridge Metrolink Station, the Northridge Plaza and the Northridge Fashion Center. The Northridge DASH route along Prairie Street with stops near the project was discontinued. The nearest Metro transit stops for the project s transit users are located to the south at Winnetka Avenue at Nordhoff Street (approximately 1,500 ), to the north at Winnetka Avenue at Plummer Street (approximately 1,300 ) and to the east at Corbin Avenue and Prairie Street (approximately 2,200 ). The transit lines are illustrated in Appendix C. MGA Chatsworth Mixed - Use Page 9 January 2014 Traffic Impact Study Environmental Setting

25
26 Overland Traffic Consultants, Inc. CHAPTER 4 PROJECT TRAFFIC CHARACTERISTICS Project Traffic Generation Traffic generating characteristics of many land uses have been surveyed by the Institute of Transportation Engineers (ITE). The results of the traffic generation studies have been published in a handbook titled Trip Generation, 9 th Edition. The ITE studies indicate that the uses associated with the proposed project generate traffic volume as shown by the traffic rates in Table 1. Table 1 ITE Trip Generation Rates AM Peak Hour PM Peak Hour Land Use ITE Code Daily Total In Out Total In Out Apartments % 80 % % 35 % Light Industrial * % 12 % % 83 % Shopping Center % 38 % % 52 % Restaurant (HT) % 45 % % 40 % Corporate Headquarters % 7 % % 90 % * General Office rates applied to MGA headquarters and creative office to be more conservative. Table 2 provides an estimate of the project traffic. It is estimated that the project would generate 8,157 daily vehicle trips with 788 morning and 860 afternoon peak hour trips. Table 2 Estimated Project Traffic Generation Daily AM Peak Hour PM Peak Hour Proposed Project Traffic Total In Out Total In Out 212,815 s.f. MGA Headquarters 2, ,000 s.f. Creative Office ,000 s.f. Retail ,000 s,f, Restaurant Restaurant Pass-by (20%) Retail Pass-by (50%) unit Apartment 4, Total 8, MGA Chatsworth Mixed - Use Page 11 January 2014 Traffic Impact Study Project Traffic
27 Overland Traffic Consultants, Inc. Trip Distribution and Assignment of Project Traffic A primary factor affecting trip direction is the spatial distribution of population and employment that would generate project trip origins and destinations. The estimated project directional trip distribution is also based on the study area roadway network, traffic flow patterns in and out of this area of Chatsworth / Northridge. Figure 4 shows the estimated project traffic percentages detailed at each of the study intersections as reviewed and approved by LADOT. Using the traffic assignment at each intersection and the estimated peak hour traffic volume as provided in the Table 2, peak hour traffic volumes at each study location have been calculated and are shown in Figures 5 and 6 for the am and pm peak hours, respectively. This estimated assignment of the project traffic flow provides the information necessary to analyze the potential traffic impacts generated by the project at the study intersections. MGA Chatsworth Mixed - Use Page 12 January 2014 Traffic Impact Study Project Traffic
28
29
30
31 Overland Traffic Consultants, Inc. CHAPTER 5 TRAFFIC CONDITIONS ANALYSIS Analysis of Existing Traffic Conditions The traffic conditions analysis was conducted using the Critical Movement Analysis (CMA) method. The study intersections were evaluated using this methodology pursuant to criteria established by the LADOT. The existing peak hour traffic counts were used along with intersection lane configurations and traffic controls to determine the intersection s current operating condition. The CMA procedure uses a ratio of the intersection s traffic volume to its capacity for rating an intersection s congestion level. The highest combinations of conflicting traffic volume (V) divided by the intersection s capacity (C) value represents the intersection V/C ratio. Intersection capacity represents the maximum volume of vehicles passing through an intersection in one hour under typical traffic flow conditions. This volume-tocapacity (V/C) ratio defines the proportion of an hour necessary to accommodate all the traffic moving through the intersection assuming all approaches were operating at full capacity. For planning purposes, the CMA ratio method provides an ideal means for quantifying intersection operating characteristics. For example, if an intersection has a CMA value of 0.700, the intersection is operating at 70% capacity with 30% unused capacity. Once the volume-to-capacity ratio has been calculated, operating characteristics are assigned a level of service grade (A through F) to estimate the level of congestion and stability of the traffic flow. The term, Level of Service (LOS) is used by traffic engineers to describe the quality of the traffic flow. Definitions of the LOS grades are provided in Table 3. MGA Chatsworth Mixed - Use Page 16 January 2014 Traffic Impact Study Traffic Conditions Analysis
32 Overland Traffic Consultants, Inc. Table 3 Level of Service Definitions Level of Service Description of Operating Condition Equivalent CMA A Free flow conditions with low traffic density B A stable flow of traffic C Light congestion but stable, occasional backups behind left-turning vehicles. D Approaching instability, drivers are restricted in freely changing lanes. Vehicles may be required to wait through more than one cycle. E At or near capacity with possible long queues for left-turning vehicles. Blockage of intersection may occur if traffic signal does not provide for protected turning movements. F Jammed conditions with stoppages of long duration. > Traffic volume data used in the following peak hour intersection analyses were based on traffic counts conducted by The Traffic Solution, an independent traffic data collection company. Traffic counts were conducted on a typical weekday in March and April Existing peak hour traffic volumes at the study intersections are depicted in Figure 7 for the morning peak hour and Figure 8 for the afternoon peak hour. Traffic volume data for the peak hour counts are contained in Appendix D. MGA Chatsworth Mixed - Use Page 17 January 2014 Traffic Impact Study Traffic Conditions Analysis
33
34
35 Overland Traffic Consultants, Inc. By applying the CMA procedures to the intersection data, the V/C values and the corresponding Levels of Service (LOS) for existing traffic conditions were determined. The LOS values are summarized in Table 4. Supporting capacity worksheets are contained in Appendix E of this report. Table 4 Existing Traffic Conditions Summary AM Peak Hour PM Peak Hour No Intersection CMA LOS CMA LOS 1. Mason Av. & Plummer St B B 2. Winnetka Av. & Lassen St A A 3. Winnetka Av. & Plummer St A A 4. Winnetka Av. & Prairie St A A 5. Winnetka Av. & Nordhoff St B A 6. Winnetka Av. & Parthenia St C B 7. Winnetka Av. & Roscoe Bd B C 8. Corbin Av. & Plummer Av C C 9. Corbin Av. & Prairie St A A 10. Corbin Av. & Nordhoff Pl A A 11. Corbin Av. & Nordhoff St./Nordhoff Way B A MGA Chatsworth Mixed - Use Page 20 January 2014 Traffic Impact Study Traffic Conditions Analysis
36 Overland Traffic Consultants, Inc. Analysis of Existing + Project Traffic Conditions Traffic volume projections have been developed to analyze the existing traffic conditions after completion of the proposed project. Pursuant to the City of Los Angeles traffic impact guidelines, the potential traffic impact of the project s traffic volume on existing traffic conditions has been analyzed. No changes to the existing intersection operating conditions have been made. By applying the CMA procedures, the V/C ratios and the corresponding LOS for existing + project traffic conditions were determined for each intersection. The V/C intersection ratios and the corresponding LOS values are summarized in Table 5. Comparing changes in the traffic conditions between the different scenarios provides the necessary information to determine if the traffic increases create a significant impact at a study intersection. According to the standards adopted by the City of Los Angeles, a traffic impact is considered significant if the related increase in the V/C value equals or exceeds the thresholds shown in the table below. LOS Final V/C Value Increase in V/C Value C D E and F > or more As shown in Table 5 below, two of the study intersections would be significantly impact by the project s traffic in the morning peak hour in the existing + project conditions. The intersections significantly are: Winnetka Avenue and Parthenia Street (#6) and Corbin Avenue and Plummer Street (#8). Existing + project peak hour traffic volumes at the study intersections are illustrated in Figure 9 for the morning peak hour and Figure 10 for the afternoon peak hour. MGA Chatsworth Mixed - Use Page 21 January 2014 Traffic Impact Study Traffic Conditions Analysis
37 Overland Traffic Consultants, Inc. Table 5 Existing + Project Traffic Conditions Peak Existing Existing With Project No. Intersection Hour CMA LOS CMA LOS Impact 1. Mason Av. & AM B C Plummer St. PM B B Winnetka Av. & AM A A Lassen St. PM A A Winnetka Av. & AM A A Plummer St. PM A A Winnetka Av. & AM A A Prairie St. PM A A Winnetka Av. & AM B B Nordhoff St. PM A A Winnetka Av. & AM C C * Parthenia St. PM B B Winnetka Av. & AM B C Roscoe Bd. PM C C Corbin Av. & AM C D * Plummer St. PM C C Corbin Av. & AM A B Prairie St. PM A A Corbin Av. & AM A A Nordhoff Pl. PM A A Corbin Av. & AM B B Nordhoff St. / Way PM A B * Indicates significant traffic impact per City of Los Angeles Department of Transportation MGA Chatsworth Mixed - Use Page 22 January 2014 Traffic Impact Study Traffic Conditions Analysis
38
39
40 Overland Traffic Consultants, Inc. Analysis of Future Traffic Conditions Future traffic volume projections have been developed to analyze the traffic conditions after completion of other planned land developments including the proposed project. Pursuant to the City of Los Angeles traffic impact guidelines, the following steps have been taken to develop the future traffic volume estimates: (a) Existing traffic + ambient growth (1.5% per year) (b) Traffic in (a) + related projects (without project scenario); (c) Traffic in (b) with the proposed project traffic (with project scenario); (d) Traffic in (c) + the proposed traffic mitigation, if necessary. The future cumulative analysis includes other development projects located within the study area either under construction or planned. As part of this analysis, the related project information was obtained from the City of Los Angeles Department of Transportation. It should be noted that this project, or any actions taken by the City regarding this project, does not have a direct bearing on these other proposed related projects. Table 6 provides the description of the related projects used in this analysis. To evaluate future traffic conditions with related projects, estimates of the peak hour trips generated by the related projects were developed. The potential net increase in traffic from the related projects is shown in Table 7. The locations of nine (9) related projects used in this study are shown in Figure 11. Appendix F contains the related project traffic flow maps. Future cumulative without project peak hour traffic volume estimates are shown in Figures 12 and 13 for the morning and afternoon peak hours, respectively. MGA Chatsworth Mixed - Use Page 25 January 2014 Traffic Impact Study Traffic Conditions Analysis
41 Overland Traffic Consultants, Inc. Table 6 Related Projects Descriptions No Location Size Units Description Mason Avenue 525 du Townhomes 24,463 sf Retail Reseda Boulevard 7,800 sf Retail Parthenia Street 312 du Apartments 35,694 sf Retail 7,470 sf Storage Plummer Street 368 du Condominiums (occupied) 10,000 sf Retail 5,000 sf Restaurant Winnetka Avenue 375 Students Private School Nordhoff Street 13,000 sf Government Office 10,400 sf Warehouse Winnetka Avenue 73 du Single Family 8 Kaiser Permanente Chatsworth MOB 83,000 sf Medical Office -42,030 sf Retail Nordhoff Street (vtt63625-m5) 20,475 sf Retail 617 du Apartments Table 7 Related Project Trip Generation AM Peak Hour PM Peak Hour No Location Daily In Out Total In Out Total Mason Avenue 1, Reseda Boulevard Parthenia Street 3, Plummer Street 1, Winnetka Avenue Nordhoff Street Winnetka Avenue Kaiser Permanente Chatsworth MOB 2, Nordhoff Street (vtt63625-m5) , MGA Chatsworth Mixed - Use Page 26 January 2014 Traffic Impact Study Traffic Conditions Analysis
42
43
44
45 Overland Traffic Consultants, Inc. The future cumulative traffic conditions are shown below in Table 8. Table 8 Future Cumulative Traffic Conditions Without Project Peak Existing Future Without Project No. Intersection Hour CMA LOS CMA LOS Impact 1. Mason Av. & AM B D Plummer St. PM B C Winnetka Av. & AM A B Lassen St. PM A A Winnetka Av. & AM A A Plummer St. PM A A Winnetka Av. & AM A A Prairie St. PM A A Winnetka Av. & AM B D Nordhoff St. PM A C Winnetka Av. & AM C D Parthenia St. PM B C Winnetka Av. & AM B D Roscoe Bd. PM C D Corbin Av. & AM C D Plummer Av. PM C D Corbin Av. & AM A B Prairie St. PM A A Corbin Av. & AM A A Nordhoff Pl. PM A A Corbin Av. & AM B D Nordhoff St. / Way PM A C MGA Chatsworth Mixed - Use Page 30 January 2014 Traffic Impact Study Traffic Conditions Analysis
46 Overland Traffic Consultants, Inc. Traffic conditions after completion of the project have been calculated by adding the project volumes to the future 2019 cumulative without traffic volumes. The traffic impacts of the added project traffic at the study intersections are shown in Table 9. As shown in Table 9, five of the study intersections are impacted by project traffic volume in the future cumulative 2019 scenario using the significant impact criteria established by LADOT. The significantly impacted intersections are: 1. Winnetka Avenue and Nordhoff Street (#5) during the morning peak hour; 2. Winnetka Avenue and Parthenia Street (#6) during both the morning and afternoon peak peak hours; 3. Winnetka Avenue and Roscoe Boulevard (#7) during the morning peak hour; 4. Corbin Avenue and Plummer Street (#8) during both the morning and afternoon peak hours: 5. Corbin Avenue and Prairie Street (#9) during the morning peak hour. Future cumulative with project peak hour traffic volumes are shown in Figures 14 and 15 for the morning and afternoon, respectively. MGA Chatsworth Mixed - Use Page 31 January 2014 Traffic Impact Study Traffic Conditions Analysis
47 Overland Traffic Consultants, Inc. Table 9 Future Cumulative Traffic Conditions With Project Peak Future Without Future With Project No. Intersection Hour CMA LOS CMA LOS Impact 1. Mason Av. & AM D D Plummer St. PM C D Winnetka Av. & AM B B Lassen St. PM A A Winnetka Av. & AM A B Plummer St. PM A A Winnetka Av. & AM A A Prairie St. PM A A Winnetka Av. & AM D D * Nordhoff St. PM C C Winnetka Av. & AM D D * Parthenia St. PM C D * 7. Winnetka Av. & AM D den32 D * Roscoe Bd. PM D D Corbin Av. & AM D E * Plummer Av. PM D D * 9. Corbin Av. & AM B C * Prairie St. PM A B Corbin Av. & AM A A Nordhoff Pl. PM A A Corbin Av. & AM D D Nordhoff St. / Way PM C C * Indicates significant traffic impact per City of Los Angeles Department of Transportation MGA Chatsworth Mixed - Use Page 32 January 2014 Traffic Impact Study Traffic Conditions Analysis
48
49
50 Overland Traffic Consultants, Inc. Impacts on Regional Transportation System The Congestion Management Program (CMP) was adopted to monitor regional traffic growth and related transportation improvements. The CMP designated a transportation network including all state highways and some arterials within the County to be monitored by of local jurisdictions. If LOS standards deteriorate on the CMP network, then local jurisdictions must prepare a deficiency plan to be in conformance with the program. Local jurisdictions found to be in nonconformance with the CMP risk the loss of state gas tax funding. For purposes of the CMP LOS analysis, a substantial change in freeway segments are defined as an increase or decrease of 0.10 in the demand to capacity ratio and a change in LOS. A CMP traffic impact analysis is required if a project will add 150 or more trips to a freeway segment in either direction during either the AM or PM weekday peak hour. An analysis is also required at all CMP monitoring intersections where a project would add 50 or more peak hour trips. As shown in Figures 5 and 6, the proposed project does not exceed these CMP traffic growth limits. Therefore, no additional CMP traffic analysis is necessary. MGA Chatsworth Mixed - Use Page 35 January 2014 Traffic Impact Study Traffic Conditions Analysis
51 Overland Traffic Consultants, Inc. CHAPTER 6 MITIGATION MEASURES Based on the analysis in this study, it has been determined that the added traffic generated by the proposed project will significant impact two (2) intersections in the existing + project scenario and five (5) intersections in the future 2019 cumulative scenario. The recommended traffic mitigation program combines a mix of roadway capacity enhancements to improve traffic flow and traffic management programs to alter travel patterns and reduce trip making. Project traffic impacts and the MGA traffic mitigation program are described below: Project traffic impacts (Existing + Project) Using criteria in the City s TIA Guidelines, it has been determined that the changes in the existing traffic conditions caused by the project - generated traffic flow will significantly impact two study intersections. 1. Winnetka Avenue and Parthenia Street (#6) is significantly impacted during the weekday morning peak hour prior to implementing traffic mitigation measures. As shown in Table 5, the morning traffic impact is an increase in the CMA value by at LOS C. 2. The intersection of Corbin Avenue and Plummer Street (#8) is also significantly impacted during the weekday morning peak hour prior to implementing traffic mitigation measures. As shown in Table 5, the morning traffic impact is calculated at at LOS D. Although Metro transit and LADOT DASH no longer serve the project site, the foundation of the start-up multi-mode program for MGA is to create a site-serving transit service by the implementation of a private shuttle route to connect residents and employees to nearby employment centers, transit stations and commercial retail centers. The goal of full Transportation Demand Management program will be to create a multi-mobile hub at the MGA campus with bike and car share programs and other TDM programs for both MGA residents and employees. These measures are described in more detail later in this chapter. MGA Chatsworth Mixed - Use Page 36 January 2014 Traffic Impact Study Mitigation Measures
52 Overland Traffic Consultants, Inc. To mitigate the project s existing traffic impacts, it is recommended that the project operate a peak hour private shuttle. This shuttle will then be available to serve the site during mid-day and evening hours to provide residents and employees more mobility choices through out the day. This will allow residents and employees to be car-free if desired. The shuttle route is targeted to Warner Center, the Metro Orange Line and the Chatsworth Metrolink Station. The peak hour routes will allow residents and employees to take shuttles for work and non-work trips and provide connections to train and bus stations/stops at the Pierce College station, the Warner Center Owensmouth Transit Center and the Metro Chatsworth Orange Line / Metro link Station. In addition, several street improvements have been selected to address localized traffic congestion in the study area. Listed below are the recommended roadway traffic mitigation measures. 1. Winnetka Avenue and Parthenia Street (#6) - It is recommended that Parthenia Street be restriped to install a westbound right-turn only lane on Parthenia Street at Winnetka Avenue, conceptual traffic mitigation plans illustrated in Figure 16. Traffic signals will be upgraded to accommodate the new right turn lane and brought up to current traffic signal standards. 2. Corbin Avenue and Plummer Street (#8) - It is recommended that Corbin Avenue be restriped to install a southbound right-turn only lane on Corbin Avenue at Plummer Street, conceptual traffic mitigation plans illustrated in Figure 17. Traffic signals will be upgraded to accommodate the new right turn lane and brought up to current traffic signal standards. 3. New traffic signal at the intersection of Winnetka Avenue and MGA driveway, see Appendix H for the traffic signal peak hour signal warrant justification. As a result of these measures, the project s significant traffic impacts on existing conditions will be reduced to less than significance as shown in Table 10. MGA Chatsworth Mixed - Use Page 37 January 2014 Traffic Impact Study Mitigation Measures
53
54
55 Overland Traffic Consultants, Inc. Table 10 Existing + Project Traffic Conditions With Mitigation Peak Existing Existing With Project Mitigation No. Intersection Hour CMA LOS CMA LOS Impact 6. Winnetka Av. & AM C C Parthenia St. PM B B Corbin Av. & AM C C Plummer Av. PM C C Project traffic impacts (Future 2019 Cumulative + Project) Based on the future traffic conditions analysis for 2019, five (5) intersections are significantly impacted by the project s traffic. The intersections and impacted time periods are: 1. Winnetka Avenue and Nordhoff Street (#5) during the morning peak hour; 2. Winnetka Avenue and Parthenia Street (#6) during both the morning and afternoon peak hours; 3. Winnetka Avenue and Roscoe Boulevard (#7) during the morning peak hour; 4. Corbin Avenue and Plummer Street (#8) during both the morning and afternoon peak hours; 5. Corbin Avenue and Prairie Street (#9) during the morning peak hour. Future cumulative traffic impacts with an expanded MGA Transportation Demand Management Program (TDM) and the roadway improvements, as described below, will reduce the significant traffic impacts to less than significance at 3 of the 5 intersections. Significant traffic impacts, however, will remain at the intersections of Corbin Avenue and Plummer Street and at Corbin Avenue and Prairie Street. Transportation Demand Management (TDM) Although roadway improvements will continue to be an important strategy for providing mobility, the focus of the transportation mitigation plan for the MGA mixed use project is to develop a congestion avoidance program through trip reductions while maintaining and providing transportation mobility. MGA Chatsworth Mixed - Use Page 40 January 2014 Traffic Impact Study Mitigation Measures
56 Overland Traffic Consultants, Inc. The MGA TDM program is designed to maximize the people-moving capability by increasing the number of person in a vehicle, or by influencing the time of, or need to, travel. To accomplish these types of changes in travel behavior, the TDM program elements must rely on incentives or disincentives to make these shifts in behavior attractive. Employer based TDM programs often are the most effective in reducing trips. TDM strategies can be chosen to meet a relatively narrow set of worksite and commuter demographic characteristics. Information dissemination can be targeted precisely to the employees and residents most likely to use the alternatives, and offered in a personalized manner that eases the transition to a different and possibly unfamiliar travel mode. Furthermore, it is very important the MGA establishes a corporate culture that affirms employees and residents decisions to use a commuting alternative. Although employer support measures are very important in supporting TDM alternatives, they are not instruments that, in themselves, actually change behavior. A truly effective TDM program will implement incentives and disincentives that are clearly perceived by the individual making the decision to travel. I. Improved Transit Alternatives 1. Private MGA Transit (shuttle service) Continue to operate the private shuttle service targeted specifically to the needs of the MGA residents and employees. It is recommended that MGA provide a fixed-route shuttle route providing 30 - minute headways during the morning and afternoon peak hour to the nearby transit stations and work centers. Mid-day and off-peak schedules will be more demand-responsive providing viable and convenient transit options for MGA residents and employees. o Warner Center / Chatsworth Orange Line Route - traveling along Winnetka Avenue to the Orange Line Pierce College Station then along Victory Boulevard to the Warner Center Station and lastly along Canoga Avenue to the Chatsworth Station, returning to the MGA site along Nordhoff Street, see Figure 18. MGA Chatsworth Mixed - Use Page 41 January 2014 Traffic Impact Study Mitigation Measures
57
58 Overland Traffic Consultants, Inc. o Shuttle will be equipped with bike racks to promote the bike usage program. Note that DASH service does not currently provide bike racks. II. TDM Alternatives (carpool and bike with site improvements) 1. Carpool program o MGA contracts with local taxi company to provide a guaranteed ride home for late workers, workers who miss their ride or need to attend to a midday emergency. o MGA provides preferential parking for carpoolers and vanpoolers. o MGA assists in providing one-on-one employee and resident assistance in forming and maintaining rideshare arrangement. 2. Bicycle program o MGA will provide support facilities and services, such as bike parking and storage facilities, bike repair facilities, changing and shower facilities. o MGA will provide areas for bike displays from bicycle manufacturers and local shops at periodic bike fairs and promotional events. 3. MGA Multi-modal Site Improvements A common objection to ridesharing is the need to have a car during the day to perform personal or job-related errands. o MGA will provide on-site Day Care, retail and employee cafeteria to reduce trip making. o MGA will establish a satellite remote work center for MGA residents who are non-mga employees but choose to telecommute. o MGA will provide an on-site designated rideshare friendly shuttle plaza and loading area. MGA Chatsworth Mixed - Use Page 43 January 2014 Traffic Impact Study Mitigation Measures
59 Overland Traffic Consultants, Inc. III. Incentives and Disincentives 1. MGA Support Measures o Corporate commitment to the overall level of support for the TDM program. Promote a corporate culture to reflect the willingness to devote resources to the program and provide tangible benefits to commute alternatives. o Provide on-site TDM marketing features to disseminate information thru bulletin boards, new employee / resident orientation, news letters, promotional fairs, etc. o Staff a TDM Coordinator to manage the programs development, implementation, marketing, administration and program evaluation. Services include personalize commute planning assistance. o Support promotional activities such as fairs, clubs and awards that can increase commuters interest in ridesharing. 2. Parking Management Price of parking is the single most influential factor determining the share of commuters who drove to work. A reduced parking supply and chase-out parking at work can dramatically alter travel behavior and reduce solo drive-alone travel patterns. o Provide monthly stipend for employees to use on whatever travel mode they wish, including driving alone. Implemented thru the daily cash out credit / debit tracking employee identification card o Daily Cash Out Program gives commuters a new choice, rewards the alternative to solo driving, reduces trips and treats all commuters equally. MGA will continue to offer subsidized parking but will broaden the offer to include the option to take the cash equivalent of the parking subsidy instead of the parking subsidy itself. The forgone cash mean drivers in effect pay for their free parking. Parking cash out is a buy- MGA Chatsworth Mixed - Use Page 44 January 2014 Traffic Impact Study Mitigation Measures
60 Overland Traffic Consultants, Inc. back not a take-way, it rewards commuters for choosing the alternate to driving to work alone, rather than punishing them for solo driving. For example: under the program, MGA employees can park free at work on any day, but any commuter who brings a car will scan an employee ID card to enter the garage and receive a debit. All employees automatically earn a credit each day when they use their employee identification card to enter the office building. These accumulated credits and debits are tallied each month to determine the employee s cash or cash equivalent transportation allowance. Each member of a carpool / vanpool receives a credit for reporting to work and the one whose identification card activates the parking lot gate incurs the debit, which can be credited back via carpool/ vanpool registration program. 3. Alternative Work Arrangements Alternative Work Hours can reduce the number of days and thus the number of miles traveled commuting, and shift employees travel to a time outside normal daily peak periods. Because of these two factors, the alternative work hours program can be effective in reduce traffic congestion and air pollution. o Staggered work hours In a staggered work hour program, MGA employee s start work times are scheduled at intervals so that different groups of employees (often by departments) begin work at different times. o Compressed work hours Compressed work week programs allow employees to work a full work week in fewer than the usual five days. The most common are: 4/10 with four 10-hour days; 3/36 with three 12-hour days and 9/80 with eight 9-hour days and one 8-hour day. o Flexible work hours (flextime) Flextime allows employees to set their own arrival and departure times within core hours during which all employees must be in the office. MGA Chatsworth Mixed - Use Page 45 January 2014 Traffic Impact Study Mitigation Measures
61 Overland Traffic Consultants, Inc. Table 11 contains the level of service values and effectiveness for the cumulative traffic mitigation program. A 6 % TDM trip reduction has been assumed for the calculation. Table 11 Future + Project Traffic Conditions With Mitigation Peak Future W/O With Project Mitigation No. Intersection Hour CMA LOS CMA LOS Impact 5. Winnetka Av. & AM D D Nordhoff St. PM C C Winnetka Av. & AM D C Parthenia St. PM C C Winnetka Av. & AM D D Roscoe Bd. PM D D Corbin Av. & AM D D Plummer Av. PM D D * 9. Corbin Av. & AM B C * Prairie St. PM A B * Indicates significant traffic impact per City of Los Angeles Department of Transportation Trip cap monitoring agreement The success of the TDM plan is dependent on the type and level of TDM strategies implemented. The key to developing an effective program is to determine what strategies the employees and residents of the MGA mixed -use project would be able to use and then build the program incentives around those strategies. It is recommend that a 1 year trip count be conducted after occupancy of the MGA Corporate Headquarters building to establish the true impact and assist in targeting the most effective TDM measures with a second trip count after occupancy of the first 350 apartment units. Note that large trip reductions may not be entirely necessary. The trip generation rates used by LADOT for this study are mainly based on the square footage for corporate headquarters. MGA will also have limited assembly, showroom space and production facilities. As a result the employee density is much lower and may generated significantly less traffic and less impact that estimated by LADOT s trip generation estimates based on gross floor area. MGA Chatsworth Mixed - Use Page 46 January 2014 Traffic Impact Study Mitigation Measures
62 Overland Traffic Consultants, Inc. CHAPTER 7 PARKING DEMAND City of Los Angeles Municipal Code Parking Requirements Municipal Code Section authorizes the City to establish a special Modified Parking Requirement District ( MPR District ) for unique properties at least 5 acres in size (LAMC 13.15B). The MGA Campus Project includes a complementary mix of residential, commercial and light industrial uses with various shared amenities across a 24 acre site. As such, to promote efficient site planning, the Applicant proposes an MPR District to allow for appropriately tailored parking ratios and shared parking usage throughout the Campus Project. In total, the Campus Project would provide 1,467 parking spaces for the uses. Urban Land Institute (ULI) Parking Requirement Based on recommendations from the ULI database, the amount of parking needed for this mix use project is primarily affected by the proportion of reserved parking for the residential units and the peak parking demand of the commercial uses. The peak parking demand estimated by this evaluation represents the total parking demand to serve the needs of residents, customers, visitors and employees. For this analysis at least the first parked vehicle per residential unit (700 spaces) was allocated as reserved parking. The remaining peak hour spaces would be considered as residential parking that can be shared with other uses. Because of the low employee density for the MGA corporate headquarters and the creative office use, the parking demand was based on 500 office employees. The parking demand calculated for the MGA mixed use project is 1,334 parking spaces using the ULI parking demand model: the parking model provides 700 spaces reserved for the residential, 346 spaces reserved for the commercial and 288 spaces will be unassigned, i.e., open for sharing with the residential, commercial and guests. The estimated hourly parking demand is shown in Table 12.. MGA Chatsworth Mixed Use Page 47 January 2014 Traffic Impact Study Parking Demand
63 Overland Traffic Consultants, Inc. Table 12 Hourly Parking Demand Values MGA Campus 6 AM 7 AM 8 AM 9 AM 10 AM 11 AM 12 PM 1 PM 2 PM 3 PM 4 PM 5 PM 6 PM 7 PM 8 PM 9 PM 10 PM 11 PM 12 AM Retail Retail Employee Restaurant Employee Residential, Rental, Shared Residential Reserved Residential Guests Office Guests Employees, assumes TOTAL DEMAND 1,020 1,094 1,246 1,311 1,334 1,308 1,257 1,281 1,322 1,304 1,277 1,205 1,159 1,173 1,162 1,145 1,132 1,101 1,061 MGA Chatsworth Mixed Use Page 48 January 2014 Traffic Impact Study Parking Demand
64 APPENDIX A COMMUNITY PLAN LAND USE INFORMATION
65
66
67 APPENDIX B CIRCULATION MAPS, STREET STANDARDS & STREET PLANS
68
69
70
71
72
73
74
75
76
77
78
79
80 APPENDIX C TRANSIT ROUTES
81 WEST HILLS West Hills Medical Center 162 CHATSWORTH NORDHOFF 245 SC791 ROSCOE SHERMAN WAY 158 CE AV787 SC AV Northridge Fashion Center LDNOR Cal S Unive North CSU TRAN NOR SATICOY 169 CANOGA PARK RES 2 TOPANGA CYN RESEDA DE SOTO CORBIN TAMPA NORDHOFF ROSCOE SATICOY PRAIRIE PARTHENIA PLUMMER NORTHRIDGE SHERMAN ROSC
82 Monday through Friday Schedule Effective Jun Northbound on Winnetka (Approximate Times) WOODLAND HILLS WINNETKA NORTHRIDGE CHATSWORTH PORTER RANCH Southbound on Winnetka (Approximate Times) PORTER RANCH 243 CHATSWORTH NORTHRIDGE WINNETKA WOODLAND HILLS Ventura & Winnetka Winnetka & Vanowen Corbin & Nordhoff Mason & Devonshire Rinaldi & Town Center 5:30A 5:36A 5:47A 5:56A 6:03A 6:29 6:35 6:47 6:56 7:03 7:07 7:13 7:25 7:35 7:42 7:45 7:53 8:05 8:15 8:22 8:23 8:29 8:40 8:49 8:56 9:07 9:13 9:24 9:33 9:40 10:07 10:13 10:24 10:33 10:40 11:07 11:14 11:25 11:34 11:41 12:07P 12:14P 12:26P 12:36P 12:43P 1:06 1:13 1:25 1:35 1:42 2:05 2:12 2:24 2:34 2:41 2:57 3:05 3:18 3:28 3:35 C3:21 3:32 3:45 3:55 4:02 C3:24 3:35 3:48 3:58 4:05 3:58 4:06 4:19 4:29 4:36 4:58 5:07 5:20 5:29 5:36 5:58 6:05 6:17 6:26 6:33 6:58 7:05 7:16 7:25 7:32 7:58 8:05 8:16 8:23 8:30 Monday through Friday Schedule Rinaldi & Town Center Mason & Devonshire Nordhoff & Corbin 5:24A 5:36A 5:44A 5:55A 6:00A 6:13 6:25 6:33 6:45 6:52 6:38 6:50 6:58 7:12 7:22 6:56 7:08 7:18 7:33 7:44 7:01 7:13 7:23 7:37 7:48 7:28 7:40 7:50 8:03 8:12 8:01 8:13 8:22 8:34 8:42 8:54 9:06 9:15 9:27 9:35 9:55 10:07 10:16 10:27 10:35 10:55 11:07 11:16 11:27 11:35 11:55 12:07P 12:16P 12:27P 12:35P 12:55P 1:07 1:16 1:27 1:35 1:50 2:02 2:14 2:26 2:35 2:51 3:03 3:15 3:27 3:35 3:42 3:54 4:06 4:18 4:26 4:24 4:36 4:48 5:00 5:08 5:07 5:19 5:31 5:42 5:50 6:09 6:21 6:31 6:41 6:48 7:14 7:26 7:34 7:44 7:51 Note: Southbound trips continue as Northbound 242 trips at Ventura and Winnetka Winnetka & Vanowen Ventura & Winnetka 242 Northbound on Tampa (Approximate Times) WOODLAND HILLS RESEDA NORTHRIDGE PORTER RANCH Southbound on Tampa (Approximate Times) PORTER RANCH NORTHRIDGE RESEDA WOODLAND HILLS Ventura & Winnetka Tampa & Sherman Way Tampa & Nordhoff Tampa & Devonshire Rinaldi & Town Center 6:00A 6:09A 6:16A 6:20A 6:28A 6:52 7:01 7:10 7:14 7:24 7:22 7:32 7:40 7:44 7:54 7:48 8:00 8:08 8:12 8:22 8:12 8:23 8:31 8:35 8:44 8:42 8:53 9:01 9:05 9:14 9:35 9:46 9:54 9:58 10:07 10:35 10:46 10:54 10:58 11:07 11:35 11:46 11:54 11:58 12:07P 12:35P 12:47P 12:56P 1:00P 1:09 1:35 1:48 1:57 2:02 2:11 2:35 2:49 2:59 3:04 3:13 3:35 3:49 3:59 4:04 4:14 4:26 4:40 4:50 4:55 5:05 5:08 5:22 5:32 5:36 5:46 5:50 6:03 6:13 6:17 6:27 6:48 6:59 7:06 7:10 7:19 7:51 8:01 8:08 8:12 8:21 Rinaldi & Town Center Tampa & Devonshire Tampa & Nordhoff Tampa & Sherman Way Ventura & Winnetka 5:02A 5:09A 5:15A 5:22A 5:30A 6:00 6:07 6:13 6:20 6:29 6:35 6:42 6:48 6:57 7:07 7:09 7:16 7:22 7:31 7:45 7:48 7:55 8:01 8:10 8:23 8:34 8:41 8:47 8:56 9:07 9:36 9:43 9:49 9:57 10:07 10:37 10:44 10:49 10:57 11:07 11:33 11:40 11:47 11:56 12:07P 12:32P 12:39P 12:46P 12:55P 1:06 1:31 1:38 1:45 1:54 2:05 2:23 2:30 2:37 2:46 2:57 3:23 3:30 3:37 3:46 3:58 4:22 4:30 4:37 4:46 4:58 5:22 5:30 5:37 5:46 5:58 6:25 6:33 6:39 6:47 6:58 7:28 7:35 7:41 7:49 7:58 Note: Southbound trips continue as Northbound 243 trips at Ventura and Winnetka Sunday & Holiday Schedule No service operated on Sunday and the following holidays: New Year s Day, Memorial Day, Independence Day, Labor Day, Thanksgiving Day and Christmas Day. Special Notes C Trip operates on school days only. Horarios en los días feriados No habra servicio los domingos ni los siguientes dias festivos: New Year s Day, Memorial Day, Independence Day, Labor Day, Thanksgiving Day y Christmas Day. Avisos especiales C Viaje opera los dias de escuela solamente.
83 244 AV Saturday Schedule Effective Jun Northbound on Winnetka (Approximate Times) WOODLAND HILLS WINNETKA NORTHRIDGE CHATSWORTH PORTER RANCH Southbound on Winnetka (Approximate Times) PORTER RANCH 243 CHATSWORTH NORTHRIDGE WINNETKA WOODLAND HILLS Ventura & Winnetka Winnetka & Vanowen Corbin & Nordhoff Mason & Devonshire Rinaldi & Town Center 6:30A 6:35A 6:44A 6:51A 6:57A 7:30 7:36 7:45 7:53 7:59 8:30 8:36 8:46 8:54 9:00 9:30 9:36 9:46 9:54 10:00 10:30 10:36 10:46 10:54 11:00 11:30 11:36 11:47 11:55 12:01P 12:30P 12:36P 12:47P 12:55P 1:01 1:30 1:36 1:47 1:55 2:01 2:30 2:36 2:47 2:55 3:01 3:30 3:36 3:47 3:54 4:00 4:30 4:35 4:45 4:52 4:58 5:30 5:35 5:45 5:52 5:58 6:30 6:35 6:45 6:52 6:58 7:30 7:35 7:45 7:52 7:58 Saturday Schedule Rinaldi & Town Center Mason & Devonshire Nordhoff & Corbin 6:25A 6:35A 6:44A 6:54A 7:00A 7:25 7:35 7:44 7:54 8:00 8:24 8:34 8:43 8:53 9:00 9:24 9:34 9:43 9:53 10:00 10:24 10:34 10:43 10:53 11:00 11:24 11:34 11:43 11:53 11:59 12:25P 12:35P 12:43P 12:53P 1:00P 1:25 1:35 1:43 1:53 2:00 2:24 2:35 2:43 2:53 3:00 3:24 3:35 3:43 3:53 4:00 4:24 4:35 4:43 4:53 5:00 5:24 5:35 5:43 5:53 6:00 6:27 6:36 6:44 6:54 7:00 7:28 7:37 7:45 7:54 8:00 Note: Southbound trips continue as Northbound 242 trips at Ventura and Winnetka Winnetka & Vanowen Ventura & Winnetka 242 Northbound on Tampa (Approximate Times) WOODLAND HILLS RESEDA NORTHRIDGE PORTER RANCH Southbound on Tampa (Approximate Times) PORTER RANCH NORTHRIDGE RESEDA WOODLAND HILLS Ventura & Winnetka Tampa & Sherman Way Tampa & Nordhoff Tampa & Devonshire Rinaldi & Town Center 7:00A 7:11A 7:19A 7:23A 7:31A 8:00 8:11 8:19 8:23 8:31 9:00 9:11 9:19 9:23 9:32 10:00 10:11 10:19 10:24 10:33 11:00 11:11 11:20 11:25 11:34 11:59 12:12P 12:22P 12:27P 12:36P 1:00P 1:12 1:22 1:27 1:36 2:00 2:12 2:22 2:27 2:36 3:00 3:11 3:21 3:26 3:35 4:00 4:11 4:21 4:26 4:35 5:00 5:10 5:19 5:24 5:32 6:00 6:10 6:18 6:23 6:31 7:00 7:10 7:17 7:21 7:29 8:00 8:10 8:17 8:21 8:29 Rinaldi & Town Center Tampa & Devonshire Tampa & Nordhoff 6:03A 6:09A 6:15A 6:22A 6:30A 7:01 7:08 7:14 7:21 7:30 8:00 8:07 8:13 8:20 8:30 9:01 9:07 9:13 9:20 9:30 9:59 10:05 10:12 10:19 10:30 10:58 11:04 11:11 11:19 11:30 11:58 12:04P 12:11P 12:19P 12:30P 12:58P 1:04 1:11 1:19 1:30 1:58 2:04 2:11 2:19 2:30 2:58 3:04 3:11 3:19 3:30 3:58 4:04 4:11 4:19 4:30 4:59 5:05 5:12 5:20 5:30 5:59 6:05 6:12 6:20 6:30 7:04 7:10 7:15 7:21 7:30 Note: Southbound trips continue as Northbound 243 trips at Ventura and Winnetka Tampa & Sherman Way Ventura & Winnetka ROUTE MAP CHATSWORTH CANOGA PARK WARNER CENTER Victory Bl CE Erwin St Oxnard St AV787 Parthenia St Owensmouth Av Saticoy St Rinaldi St Chatsworth St Vanowen St Canoga Av San Jose St AM ML DeSoto Av Mason Av 3 Mason Av Porter Ranch Rd 118 Winnetka Av Town Center 1 Devonshire St Lassen St Plummer St Corbin Av Strathern St PORTER RANCH 2 Tampa Av WINNETKA 164 San Fernando Mission Bl Chatsworth St NORTHRIDGE Wilbur Av Reseda Bl WOODLAND HILLS Burbank Bl 4 SC796 SC Nordhoff St Roscoe Bl Sherman Way 167 ML MAP NOTES 1 Porter Ranch Town Center 2 Northridge Fashion Center 3 Los Angeles Pierce College 4 Kaiser Permanente Hospital 5 Taft High School LEGEND AM ML AV CE SC Route of Line 242 Route of Line 243 Route of Orange Line Metrolink Metro Orange Line Station Amtrak Station Metrolink Station Timepoint Antelope Valley Transit Authority LADOT Commuter Express Santa Clarita Transit 101 Ventura Bl
84 Monday through Friday Effective Jun Eastbound Southbound (Approximate Times) CHATSWORTH NORTHRIDGE NORTH HILLS 167 PANORAMA CITY NORTH HOLLYWOOD STUDIO CITY Chatsworth Station Plummer & De Soto Nordhoff & Reseda Plummer & Balboa Sepulveda Veterans Hospital Outpatient Clinic 4:34A 4:40A 4:51A 4:57A 5:05A 5:12A 5:25A 5:34A 5:39A 5:49A 5:35 5:41 5:52 5:58 6:06 6:13 6:27 6:38 6:45 6:57 6:30 6:38 6:54 7:02 7:11 7:19 7:36 7:49 7:59 8:17 7:12 7:21 7:38 7:46 7:55 8:03 8:20 8:33 8:43 9:01 8:07 8:16 8:33 8:41 8:50 8:58 9:15 9:28 9:38 9:52 8:55 9:04 9:21 9:29 9:39 9:47 10:05 10:17 10:27 10:41 9:54 10:03 10:20 10:28 10:38 10:46 11:05 11:17 11:27 11:41 10:41 10:50 11:07 11:16 11:26 11:34 11:53 12:05P 12:15P 12:29P 11:29 11:38 11:56 12:05P 12:15P 12:23P 12:42P 12:54 1:04 1:18 12:11P 12:21P 12:39P 12:48 12:58 1:06 1:25 1:37 1:47 2:01 1:01 1:11 1:29 1:38 1:48 1:56 2:15 2:27 2:37 2:51 1:51 2:01 2:20 2:30 2:40 2:49 3:08 3:20 3:30 3:44 2:29 2:40 2:59 3:09 3:19 3:28 3:47 3:59 4:09 4:23 3:08 3:19 3:38 3:48 3:58 4:07 4:26 4:38 4:48 5:02 3:50 4:01 4:22 4:32 4:42 4:51 5:10 5:22 5:32 5:46 4:32 4:43 5:04 5:14 5:24 5:33 5:52 6:04 6:14 6:28 5:14 5:25 5:45 5:55 6:04 6:12 6:30 6:40 6:49 7:01 6:00 6:10 6:28 6:37 6:46 6:54 7:11 7:21 7:30 7:41 6:44 6:53 7:10 7:19 7:28 7:36 7:53 8:03 8:10 8:20 7:35 7:43 8:00 8:08 8:17 8:25 8:40 8:50 8:56 9:07 8:38 8:46 9:01 9:08 9:15 9:22 9:35 9:44 9:50 10:00 9:40 9:47 10:00 10:07 10:14 A10:21 10:34 10:38 10:45 10:58 11:05 11:12 A11:19 11:32 Monday through Friday Plummer & Van Nuys Roscoe & Woodman Coldwater Canyon & Vanowen Valley College Orange Line Station Ventura & Goodland (Coldwater Canyon) 167 Westbound Northbound (Approximate Times) STUDIO CITY NORTH HOLLYWOOD PANORAMA CITY NORTH HILLS NORTHRIDGE CHATSWORTH Ventura & Goodland (Coldwater Canyon) Valley College Orange Line Station Coldwater Canyon & Vanowen Roscoe & Woodman Plummer & Van Nuys Sepulveda Veterans Hospital Outpatient Clinic 4:49A 4:58A 5:05A 5:15A 5:28A 5:37A 5:42A 5:48A 6:01A 6:06A 5:28 5:37 5:44 5:54 6:07 6:17 6:23 6:31 6:47 6:52 5:57 6:07 6:15 6:26 6:41 6:52 6:58 7:07 7:24 7:31 6:39 6:50 6:58 7:10 7:26 7:37 7:43 7:52 8:08 8:15 7:16 7:28 7:38 7:50 8:06 8:17 8:23 8:32 8:48 8:55 7:55 8:07 8:17 8:29 8:45 8:56 9:02 9:11 9:27 9:34 8:36 8:48 8:58 9:10 9:26 9:37 9:43 9:52 10:08 10:15 9:20 9:33 9:44 9:56 10:13 10:24 10:30 10:40 10:56 11:03 10:05 10:18 10:29 10:42 10:59 11:10 11:16 11:26 11:42 11:49 10:52 11:05 11:16 11:29 11:46 11:57 12:03P 12:13P 12:29P 12:36P 11:54 12:06P 12:17P 12:29P 12:46P 12:57P 1:03 1:13 1:29 1:36 12:47P 1:00 1:11 1:24 1:42 1:53 1:59 2:10 2:27 2:34 1:29 1:42 1:53 2:06 2:24 2:35 2:41 2:52 3:09 3:16 2:12 2:25 2:37 2:50 3:08 3:18 3:24 3:34 3:51 3:58 3:02 3:15 3:27 3:41 4:00 4:10 4:16 4:26 4:43 4:50 3:55 4:09 4:21 4:36 4:55 5:05 5:11 5:21 5:38 5:45 4:34 4:48 5:00 5:16 5:36 5:46 5:52 6:02 6:18 6:25 5:22 5:36 5:49 6:03 6:22 6:32 6:38 6:47 7:02 7:08 6:11 6:25 6:37 6:50 7:07 7:17 7:23 7:30 7:43 7:48 7:17 7:28 7:36 7:46 8:01 8:10 8:16 8:22 8:35 8:40 8:14 8:24 8:32 8:42 8:56 9:04 9:09 9:15 9:27 9:32 9:20 9:28 9:35 9:44 9:56 10:03 10:08 10:14 10:26 10:31 10:44 10:56 11:03 11:08 11:14 11:26 11:31 Saturday Schedule Plummer & Balboa Reseda & Nordhoff De Soto & Plummer Chatsworth Station 167 Eastbound Southbound (Approximate Times) CHATSWORTH NORTHRIDGE NORTH HILLS PANORAMA CITY NORTH HOLLYWOOD STUDIO CITY Chatsworth Station Plummer & De Soto Nordhoff & Reseda Plummer & Balboa Sepulveda Veterans Hospital Outpatient Clinic 4:34A 4:41A 4:52A 4:59A 5:07A 5:14A 5:28A 5:37A 5:44A 5:54A 5:34 5:41 5:52 5:59 6:07 6:14 6:28 6:37 6:44 6:54 6:27 6:34 6:45 6:52 7:00 7:07 7:22 7:31 7:38 7:49 7:16 7:23 7:34 7:41 7:50 7:57 8:13 8:23 8:31 8:42 8:03 8:11 8:23 8:31 8:40 8:47 9:04 9:14 9:22 9:33 8:52 9:00 9:13 9:21 9:30 9:37 9:54 10:04 10:12 10:23 9:42 9:50 10:03 10:11 10:20 10:27 10:46 10:56 11:04 11:15 10:32 10:40 10:53 11:01 11:10 11:17 11:36 11:46 11:54 12:05P 11:22 11:30 11:43 11:51 11:59 12:07P 12:26P 12:36P 12:44P 12:55 12:12P 12:20P 12:33P 12:41P 12:50P 12:57 1:16 1:26 1:34 1:45 1:03 1:11 1:24 1:32 1:40 1:47 2:06 2:16 2:24 2:35 1:53 2:01 2:14 2:22 2:30 2:37 2:55 3:05 3:13 3:24 2:43 2:51 3:04 3:12 3:20 3:27 3:45 3:55 4:03 4:14 3:33 3:41 3:54 4:02 4:10 4:17 4:35 4:45 4:53 5:04 4:26 4:34 4:47 4:55 5:03 5:10 5:29 5:39 5:47 5:58 5:24 5:32 5:45 5:53 6:01 6:08 6:27 6:37 6:45 6:56 6:25 6:33 6:46 6:54 7:02 7:09 7:25 7:34 7:41 7:52 7:28 7:36 7:49 7:57 8:04 8:11 8:26 8:35 8:41 8:51 8:31 8:38 8:50 8:57 9:04 A9:11 9:25 9:40 9:47 9:58 10:05 10:12 A10:19 10:33 10:38 10:45 10:56 11:03 11:10 A11:17 11:31 Saturday Schedule Plummer & Van Nuys Roscoe & Woodman Coldwater Canyon & Vanowen Valley College Orange Line Station Ventura & Goodland (Coldwater Canyon) 167 Westbound Northbound (Approximate Times) STUDIO CITY NORTH HOLLYWOOD PANORAMA CITY NORTH HILLS NORTHRIDGE CHATSWORTH Ventura & Goodland (Coldwater Canyon) Valley College Orange Line Station Coldwater Canyon & Vanowen Roscoe & Woodman Plummer & Van Nuys Sepulveda Veterans Hospital Outpatient Clinic 5:42A 5:49A 5:55A 6:04A 6:15A 6:23A 6:28A 6:35A 6:45A 6:51A 6:36 6:43 6:49 6:58 7:10 7:18 7:23 7:30 7:41 7:47 7:23 7:30 7:36 7:47 8:00 8:09 8:14 8:21 8:32 8:38 8:10 8:18 8:25 8:36 8:50 8:59 9:04 9:12 9:23 9:30 8:57 9:06 9:14 9:25 9:40 9:49 9:54 10:02 10:13 10:20 9:44 9:53 10:01 10:13 10:30 10:39 10:44 10:53 11:04 11:11 10:32 10:42 10:50 11:03 11:20 11:29 11:34 11:43 11:55 12:02P 11:24 11:34 11:42 11:54 12:10P 12:19P 12:24P 12:32P 12:44P 12:51 12:14P 12:24P 12:32P 12:44P 1:00 1:08 1:13 1:21 1:33 1:40 1:04 1:14 1:22 1:34 1:50 1:58 2:03 2:11 2:22 2:29 1:55 2:05 2:13 2:24 2:40 2:48 2:53 3:01 3:12 3:19 2:44 2:54 3:03 3:15 3:31 3:39 3:44 3:52 4:03 4:10 3:35 3:45 3:54 4:06 4:21 4:29 4:34 4:43 4:54 5:01 4:25 4:35 4:44 4:56 5:11 5:20 5:25 5:34 5:45 5:52 5:15 5:25 5:34 5:46 6:01 6:10 6:15 6:23 6:34 6:41 6:07 6:17 6:26 6:38 6:53 7:02 7:07 7:15 7:25 7:33 7:05 7:14 7:22 7:33 7:47 7:55 8:00 8:07 8:17 8:23 8:09 8:18 8:25 8:34 8:48 8:55 9:00 9:06 9:15 9:20 9:37 9:49 9:55 9:59 10:05 10:14 10:19 10:44 10:56 11:02 11:06 11:12 11:21 11:26 Plummer & Balboa Reseda & Nordhoff De Soto & Plummer Chatsworth Station Sunday and Holiday Schedules Sunday and Holiday Schedule in effect on New Year s Day, Memorial Day, Independence Day, Labor Day, Thanksgiving Day and Christmas Day. Horarios de domingo y días feriados Horarios de domingo y días feriados en vigor para New Year s Day, Memorial Day, Independence Day, Labor Day, Thanksgiving Day y Christmas Day Special Notes A Passengers traveling to Ventura Bl must transfer at Plummer and Van Nuys to Line 233. Avisos especiales A Los pasajeros que viajan hacia Ventura Bl deben transferirse a la Línea 233 en Plummer y Van Nuys.
85 Sunday and Holiday Schedule Effective Jun Eastbound Southbound (Approximate Times) CHATSWORTH NORTHRIDGE NORTH HILLS 167 PANORAMA CITY NORTH HOLLYWOOD STUDIO CITY Chatsworth Station Plummer & De Soto Nordhoff & Reseda Plummer & Balboa Sepulveda Veterans Hospital Outpatient Clinic 4:34A 4:41A 4:52A 4:59A 5:07A 5:14A 5:27A 5:36A 5:42A 5:52A 5:34 5:41 5:52 5:59 6:07 6:14 6:27 6:36 6:42 6:52 6:29 6:36 6:47 6:54 7:02 7:09 7:23 7:32 7:39 7:51 7:19 7:26 7:37 7:44 7:52 7:59 8:14 8:24 8:31 8:43 8:05 8:13 8:25 8:33 8:41 8:49 9:05 9:15 9:22 9:34 8:54 9:02 9:15 9:23 9:31 9:39 9:56 10:06 10:14 10:25 9:44 9:52 10:05 10:13 10:21 10:29 10:45 10:55 11:03 11:14 10:34 10:42 10:55 11:03 11:11 11:19 11:35 11:45 11:53 12:04P 11:24 11:32 11:45 11:53 12:01P 12:09P 12:25P 12:35P 12:43P 12:54 12:13P 12:21P 12:34P 12:42P 12:50 12:58 1:16 1:26 1:34 1:45 1:03 1:11 1:24 1:32 1:40 1:48 2:06 2:16 2:24 2:35 1:52 2:00 2:13 2:21 2:29 2:36 2:54 3:04 3:12 3:23 2:42 2:50 3:03 3:11 3:19 3:26 3:44 3:54 4:02 4:13 3:32 3:40 3:53 4:01 4:09 4:16 4:33 4:43 4:51 5:02 4:26 4:34 4:47 4:55 5:03 5:10 5:28 5:38 5:46 5:57 5:24 5:32 5:45 5:53 6:01 6:08 6:26 6:36 6:44 6:55 6:24 6:32 6:45 6:53 7:01 7:08 7:23 7:33 7:40 7:51 7:25 7:33 7:46 7:54 8:02 8:09 8:23 8:33 8:39 8:49 8:28 8:36 8:48 8:55 9:02 A9:09 9:22 9:40 9:47 9:58 10:05 10:12 A10:19 10:32 10:38 10:45 10:56 11:03 11:10 A11:17 11:30 Sunday and Holiday Schedule Plummer & Van Nuys Roscoe & Woodman Coldwater Canyon & Vanowen Valley College Orange Line Station Ventura & Goodland (Coldwater Canyon) 167 Westbound Northbound (Approximate Times) STUDIO CITY NORTH HOLLYWOOD PANORAMA CITY NORTH HILLS NORTHRIDGE CHATSWORTH Ventura & Goodland (Coldwater Canyon) Valley College Orange Line Station Coldwater Canyon & Vanowen Roscoe & Woodman Plummer & Van Nuys Sepulveda Veterans Hospital Outpatient Clinic 5:42A 5:49A 5:55A 6:04A 6:15A 6:22A 6:26A 6:32A 6:41A 6:48A 6:37 6:44 6:50 6:59 7:10 7:18 7:22 7:29 7:39 7:45 7:23 7:30 7:36 7:47 8:00 8:09 8:14 8:22 8:33 8:39 8:12 8:20 8:26 8:37 8:50 8:59 9:04 9:12 9:23 9:30 8:59 9:08 9:15 9:26 9:40 9:49 9:54 10:02 10:13 10:20 9:49 9:58 10:05 10:16 10:30 10:39 10:44 10:52 11:03 11:10 10:35 10:45 10:53 11:04 11:20 11:29 11:34 11:42 11:53 11:59 11:25 11:35 11:43 11:54 12:10P 12:19P 12:24P 12:32P 12:43P 12:50P 12:15P 12:25P 12:33P 12:44P 1:00 1:09 1:14 1:22 1:33 1:40 1:05 1:15 1:23 1:34 1:50 1:59 2:04 2:12 2:23 2:30 1:55 2:05 2:13 2:24 2:40 2:49 2:54 3:02 3:13 3:20 2:45 2:55 3:03 3:14 3:30 3:39 3:44 3:52 4:03 4:10 3:35 3:45 3:53 4:04 4:20 4:29 4:34 4:42 4:53 5:00 4:24 4:34 4:42 4:54 5:10 5:19 5:24 5:32 5:43 5:50 5:16 5:26 5:34 5:45 6:00 6:09 6:14 6:22 6:33 6:40 6:09 6:19 6:26 6:37 6:52 7:00 7:05 7:13 7:24 7:31 7:04 7:13 7:20 7:30 7:45 7:53 7:57 8:05 8:14 8:20 8:07 8:16 8:23 8:32 8:46 8:53 8:57 9:03 9:12 9:17 9:35 9:47 9:53 9:57 10:03 10:12 10:17 10:42 10:54 11:00 11:04 11:10 11:19 11:24 Plummer & Balboa Reseda & Nordhoff De Soto & Plummer Chatsworth Station
86 CE CE419 Marilla St 152 AV Strathern St Saticoy St Sherman Way Vanowen St Oxnard St Burbank Bl Chandler Bl N Chandler Bl S Magnolia Bl Riverside Dr Moorpark St Victory Bl CE N CSUN TRANSIT CENTER INSET Operates through Cal State Northridge Weekdays Only Plummer St CSU Northridge 3 Vincennes St Etiwanda Av Darby Av Reseda Bl SEPULVEDA V.A. AMBULATORY CARE CENTER INSET N Lassen Bldg. 99 Kinzie Rd Haskell 4 Bldg. 22 Lewis B. Chesty Puller George S Patton Dr Bldg. 200 Audie Murphy Dr Woodley Outpatient Clinic Plummer ROUTE MAP N MAP NOTES 1 Chatsworth Station Metro 158, 166, 167, 244, 245, 364, Metro Orange Line; CE419: SC791; SV-C; Ventura County Metrolink Line: Amtrak 2 Northridge Fashion Center 3 California State University, Northridge Transit Center Metro 167, 741, AV787 4 Sepulveda V.A. Ambulatory Care Center 5 Kaiser Hospital 6 Valley College Station Metro 156, 167, 656, Orange Line; CE549; LDVAN 7 L.A. Valley College NORTH HILLS NORTHRIDGE CHATSWORTH Devonshire St Van Nuys Bl Vesper Av Lassen St Zelzah Av Mason Av 1 ML AM Terra Bella St SEE V.A. INSET Osborne St 158 Sheldon St Arleta Av Woodman Av Plummer St 239 SEE CSUN INSET 243 Old Depot Plaza Rd 237 Nordhoff St SUN VALLEY Branford St Chase St Roscoe Bl CE573, NORDHOFF Saticoy St PANORAMA CITY Van Nuys Bl 169 Sepulveda Bl ROSCOE Woodley Av Balboa Av White Oak Av Lindley Av Reseda Bl Tampa Av Corbin Av Winnetka Av De Soto Av Canoga Av Topanga Cyn Bl Woodman Av LEGEND Whitsett Av RESEDA 761 Route of Line 167 Extended Route of Line 167 (Weekdays Only) Timepoint Metro Orange Line Metrolink, Amtrak Orange Line Station Orange Line Station & Timepoint Transit Center Amtrak Station Metrolink Station Antelope Valley Transit LADOT Commuter Express LADOT Dash Santa Clarita Transit Simi Valley Transit NORTH HOLLYWOOD VALLEY COLLEGE 6 Coldwater Cyn Av Fulton Av AM ML 101 AV CE LD SC SV Ventura Bl STUDIO CITY Goodland Av
87 NOR THR IDGE EFFECTIVE JULY 1, EFECTIVO 1 JULIO, 2013 DASH NORTHRIDGE Leaves/Sale Northridge Metrolink Station Nordhoff & Tampa Reseda & Nordhoff Reseda & Roscoe Sherman Way & Reseda Wilbur & Saticoy Arrives/Llega Northridge Metrolink Station FIRST BUS/ EL PRIMERO AUTOBÚS then every/ entonces cada 15 minutes until/ minutos hasta then every/ entonces cada 20 minutes until/ minutos hasta LAST BUS/ EL ÚLTIMO AUTOBÚS 5:30AM 5:35 5:38 5:42 5:46 5:50 5:55 :45 :00 :15 :30 6:45AM 7:00AM :20 :40 :00 :50 :05 :20 :35 6:50 7:06 :26 :46 :06 MONDAY-FRIDAY/LUNES-VIERNES :53 :08 :23 :38 6:53 7:11 :31 :51 :11 :57 :12 :27 :42 6:57 7:17 :37 :57 :17 :01 :16 :31 :46 7:01 7:22 :42 :02 :22 :05 :20 :35 :50 7:05 7:28 :48 :08 :28 :10 :25 :40 :55 7:10 7:00PM 7:06 7:11 7:17 7:22 7:28 7:35 7:35 :55 :15 :35 FIRST BUS/ EL PRIMERO AUTOBÚS then every/ entonces cada 20 minutes until/ minutos hasta LAST BUS/ EL ÚLTIMO AUTOBÚS 9:00AM 9:06 9:11 9:17 9:22 9:28 9:35 :20 :40 :00 :26 :46 :06 SATURDAY/SÁBADO :31 :51 :11 :37 :57 :17 5:00PM 5:06 5:11 5:17 5:22 5:28 5:35 :42 :02 :22 :48 :08 :28 :55 :15 :35 Note: Schedules are subject to traffi c, weather and other conditions. Please be patient as these conditions are out of the control of the driver and LADOT. Also remember to allow suffi cient time to make transfers to other services./nota: Los horarios están sujetos al tráfi co, el clima y a otras condiciones. Favor de ser paciente porque dichas condiciones están fuera del control del conductor y de LADOT. Recuerde el darse sufi ciente tiempo para hacer transbordes a otros servicios. City of Los Angeles Department of Transportation (213, 310, 323 or/o 818)
 Metrolink Station (Estación de Metrolink) Metrolink Tracks (Ferrocarril Metrolink) City of Los Angeles Department of Transportation (213, 310, 323 or/o 818) 808-2273 www.")
88 NOR THR IDGE EFFECTIVE JULY 1, EFECTIVO 1 JULIO, 2013 DASH Northridge Route Bus Stop (Parada de Autobús) Points of Interest (Puntos de Interés) A T Time Point (Punto Clave de Horario) Transfer Point (Punto de Transbordo) Metrolink Station (Estación de Metrolink) Metrolink Tracks (Ferrocarril Metrolink) City of Los Angeles Department of Transportation (213, 310, 323 or/o 818)
89 Monday through Friday Schedule Effective Jun Eastbound ( pproximate Times) Metro range ine Westbound ( pproximate Times) Chatsworth Station Warner Center Station Canoga Station A Pierce College Station Balboa Station Van Nuys Station North Hollywood Station North Hollywood Station Valley College Station Sepulveda Station Reseda Station Canoga Station B Warner Center Station Chatsworth Station H TSW TH W NE ENTE N W NNET N N YS N TH H YW N TH H YW EY EN N N YS T Z N N W NE ENTE H TSW TH ADDITIONA PEAK HOUR TRIPS SHOWN IN CHATSWORTH TO WARNER CENTER SHUTT E SECTION OF THIS TI ETAB E 3:41A 3:46A 3:50A 4:00A 4:09A 4:23A 3:53A 4:05 4:09 4:19 4:28 4:42 4:15 4:20 4:24 4:34 4:43 4:57 4:22 4:34 4:38 4:48 4:57 5:11 4:41 4:46 4:50 5:00 5:09 5:23 4:43 4:55 4:59 5:09 5:18 5:32 4:57 5:02 5:06 5:16 5:25 5:39 4:56 5:08 5:12 5:22 5:31 5:45 5:09 5:14 5:18 5:28 5:37 5:51 5:06 5:18 5:22 5:32 5:41 5:55 5:17 5:22 5:26 5:36 5:45 5:59 5:15 5:27 5:31 5:41 5:50 6:04 5:26 5:31 5:35 5:45 5:54 6:08 5:23 5:35 5:39 5:49 5:58 6:12 5:34 5:39 5:43 5:53 6:02 6:16 5:31 5:43 5:47 5:57 6:06 6:20 5:42 5:47 5:51 6:01 6:10 6:24 5:39 5:51 5:55 6:06 6:15 6:29 5:49 5:54 5:58 6:09 6:18 6:32 5:46 5:58 6:02 6:13 6:22 6:36 5:57 6:02 6:06 6:17 6:26 6:40 5:53 6:06 6:10 6:21 6:30 6:44 6:05 6:10 6:14 6:25 6:34 6:48 6:00 6:13 6:17 6:28 6:37 6:52 6:12 6:17 6:21 6:32 6:41 6:56 6:08 6:21 6:25 6:36 6:46 7:01 6:19 6:24 6:28 6:39 6:50 7:05 6:16 6:29 6:33 6:44 6:55 7:10 6:27 6:32 6:36 6:48 6:59 7:14 6:23 6:36 6:40 6:52 7:03 7:18 6:35 6:40 6:44 6:56 7:07 7:22 6:31 6:44 6:48 7:00 7:11 7:26 6:43 6:48 6:52 7:04 7:15 7:30 6:39 6:52 6:56 7:08 7:19 7:34 6:51 6:56 7:00 7:12 7:23 7:38 6:47 7:00 7:04 7:16 7:27 7:42 7:00 7:05 7:09 7:21 7:32 7:47 6:57 7:10 7:14 7:26 7:37 7:52 7:09 7:14 7:18 7:30 7:41 7:56 7:05 7:18 7:22 7:34 7:45 8:00 7:18 7:23 7:27 7:39 7:50 8:05 7:15 7:28 7:32 7:44 7:55 8:10 7:27 7:32 7:36 7:48 7:59 8:14 7:23 7:36 7:40 7:52 8:03 8:18 7:35 7:40 7:44 7:56 8:07 8:22 7:31 7:44 7:48 8:00 8:11 8:26 7:43 7:48 7:52 8:04 8:15 8:30 7:39 7:52 7:56 8:08 8:19 8:34 7:51 7:56 8:00 8:12 8:23 8:38 7:47 8:00 8:04 8:16 8:27 8:42 7:59 8:04 8:08 8:20 8:31 8:46 7:55 8:08 8:12 8:24 8:35 8:50 8:08 8:13 8:17 8:29 8:40 8:55 8:04 8:17 8:21 8:33 8:44 8:59 8:17 8:22 8:26 8:38 8:49 9:04 8:13 8:26 8:30 8:42 8:53 9:08 8:25 8:30 8:34 8:46 8:57 9:13 8:22 8:35 8:39 8:51 9:02 9:18 8:34 8:39 8:43 8:55 9:07 9:23 8:31 8:44 8:48 9:00 9:12 9:28 8:44 8:49 8:53 9:05 9:17 9:33 8:43 8:56 9:00 9:12 9:24 9:40 8:58 9:03 9:07 9:19 9:31 9:47 8:58 9:11 9:15 9:27 9:39 9:55 9:14 9:19 9:23 9:35 9:47 10:03 9:14 9:27 9:31 9:43 9:55 10:11 9:31 9:36 9:40 9:52 10:04 10:20 9:31 9:44 9:48 10:00 10:12 10:28 9:47 9:52 9:56 10:08 10:20 10:36 9:47 10:00 10:04 10:16 10:28 10:44 10:03 10:08 10:12 10:24 10:36 10:52 10:02 10:16 10:20 10:32 10:44 11:00 10:19 10:24 10:28 10:40 10:52 11:08 10:18 10:32 10:36 10:48 11:00 11:16 10:35 10:40 10:44 10:56 11:08 11:24 10:34 10:48 10:52 11:04 11:16 11:32 10:51 10:56 11:00 11:12 11:24 11:40 10:50 11:04 11:08 11:20 11:32 11:48 11:07 11:12 11:16 11:28 11:40 11:56 11:06 11:20 11:24 11:36 11:48 12:04P 11:23 11:28 11:32 11:44 11:56 12:12 11:22 11:36 11:40 11:52 12:04P 12:20 11:39 11:44 11:48 11:59 12:12 12:28 11:38 11:52 11:56 12:08P 12:20 12:36 11:55 11:59 12:04P 12:16 12:28 12:44 11:54 12:08P 12:12 12:24 12:36 12:52 12:11P 12:16 12:20 12:32 12:44 1:00 12:10P 12:24 12:28 12:40 12:52 1:08 12:27 12:32 12:36 12:48 1:00 1:16 12:26 12:40 12:44 12:56 1:08 1:24 12:43 12:48 12:52 1:04 1:16 1:32 12:42 12:56 1:00 1:12 1:24 1:40 12:59 1:04 1:08 1:20 1:32 1:48 12:58 1:12 1:16 1:28 1:40 1:56 1:15 1:20 1:24 1:36 1:48 2:04 1:14 1:28 1:32 1:44 1:56 2:12 1:31 1:36 1:40 1:52 2:04 2:20 1:30 1:44 1:48 2:00 2:12 2:28 1:46 1:51 1:55 2:07 2:19 2:35 1:44 1:58 2:02 2:14 2:26 2:42 1:59 2:04 2:08 2:20 2:32 2:48 1:56 2:10 2:14 2:26 2:38 2:54 2:11 2:16 2:20 2:32 2:44 3:00 2:08 2:22 2:26 2:38 2:50 3:06 2:23 2:28 2:32 2:44 2:56 3:12 2:20 2:34 2:38 2:50 3:02 3:18 2:35 2:40 2:44 2:56 3:08 3:24 2:32 2:46 2:50 3:02 3:14 3:30 2:46 2:51 2:55 3:07 3:19 3:35 2:42 2:56 3:00 3:12 3:24 3:40 2:56 3:01 3:05 3:17 3:29 3:45 2:51 3:05 3:09 3:21 3:33 3:49 3:04 3:09 3:13 3:25 3:37 3:53 3:00 3:14 3:18 3:30 3:42 3:58 3:13 3:18 3:22 3:34 3:46 4:02 3:08 3:22 3:26 3:38 3:50 4:06 3:21 3:26 3:30 3:42 3:54 4:10 3:16 3:30 3:34 3:46 3:58 4:14 3:29 3:34 3:38 3:50 4:02 4:18 3:24 3:38 3:42 3:54 4:06 4:22 3:37 3:42 3:46 3:58 4:10 4:26 3:32 3:46 3:50 4:02 4:14 4:30 3:45 3:50 3:54 4:06 4:18 4:34 3:40 3:54 3:58 4:10 4:22 4:38 3:53 3:58 4:02 4:14 4:26 4:42 3:48 4:02 4:06 4:18 4:30 4:46 4:01 4:06 4:10 4:22 4:34 4:50 3:56 4:10 4:14 4:26 4:38 4:54 4:09 4:14 4:18 4:30 4:42 4:58 4:04 4:18 4:22 4:34 4:46 5:02 4:17 4:22 4:26 4:38 4:50 5:06 4:12 4:26 4:30 4:42 4:54 5:10 4:25 4:30 4:34 4:46 4:58 5:14 4:20 4:34 4:38 4:50 5:02 5:18 4:33 4:38 4:42 4:54 5:06 5:22 4:28 4:42 4:46 4:58 5:10 5:26 4:41 4:46 4:50 5:02 5:14 5:30 4:36 4:50 4:54 5:06 5:18 5:34 4:50 4:55 4:59 5:11 5:23 5:39 4:45 4:59 5:03 5:15 5:27 5:43 4:59 5:04 5:08 5:20 5:32 5:48 4:54 5:08 5:12 5:24 5:36 5:52 5:08 5:13 5:17 5:29 5:41 5:57 5:03 5:17 5:21 5:33 5:45 6:01 5:16 5:21 5:25 5:37 5:49 6:05 5:11 5:25 5:29 5:41 5:53 6:09 5:25 5:30 5:34 5:46 5:58 6:14 5:20 5:34 5:38 5:50 6:02 6:18 5:33 5:38 5:42 5:54 6:06 6:22 5:28 5:42 5:46 5:58 6:10 6:26 5:41 5:46 5:50 6:02 6:14 6:30 5:36 5:50 5:54 6:06 6:18 6:34 5:49 5:54 5:58 6:10 6:22 6:38 5:44 5:58 6:02 6:14 6:26 6:42 5:57 6:02 6:06 6:18 6:30 6:46 5:53 6:07 6:11 6:23 6:35 6:51 6:07 6:12 6:16 6:28 6:40 6:56 6:04 6:18 6:22 6:34 6:46 7:02 6:20 6:25 6:29 6:41 6:53 7:09 6:18 6:32 6:36 6:48 7:00 7:16 6:36 6:41 6:45 6:57 7:08 7:24 6:37 6:51 6:55 7:06 7:17 7:33 6:55 7:00 7:04 7:15 7:26 7:42 6:55 7:09 7:13 7:24 7:35 7:51 7:14 7:19 7:23 7:34 7:45 8:01 7:11 7:28 7:32 7:36 7:47 7:58 8:14 7:26 7:43 7:47 7:51 8:02 8:13 8:29 7:41 7:58 8:02 8:06 8:17 8:28 8:44 7:56 8:13 8:17 8:21 8:32 8:43 8:59 8:11 8:28 8:32 8:36 8:47 8:58 9:14 8:26 8:43 8:47 8:51 9:02 9:13 9:29 8:41 8:58 9:02 9:06 9:17 9:28 9:44 8:56 9:13 9:17 9:21 9:32 9:43 9:59 9:11 9:28 9:32 9:36 9:47 9:58 10:14 9:26 9:43 9:47 9:51 10:02 10:13 10:29 9:42 9:59 10:03 10:07 10:18 10:29 10:45 10:00 10:17 10:21 10:25 10:36 10:47 11:03 10:21 10:38 10:42 10:46 10:57 11:08 11:24 10:42 10:59 11:03 11:07 11:18 11:28 11:43 11:06 11:23 11:27 11:31 11:42 11:52 12:07A 11:27 11:44 11:48 11:52 12:03A 12:13A 12:27 11:46 12:03A 12:07A 12:11A 12:21 12:31 12:45 Service continues on Friday nights only. See ate Night Section below. Friday ate Night and Saturday ate Night nly ADDITIONA PEAK HOUR TRIPS SHOWN IN CHATSWORTH TO WARNER CENTER SHUTT E SECTION OF THIS TI ETAB E 4:32A 4:41A 4:50A 5:00A 5:11A 5:23A 4:50 4:59 5:08 5:18 5:30 5:35A 5:05 5:14 5:23 5:33 5:44 5:56 5:20 5:29 5:38 5:48 6:00 6:05 5:32 5:41 5:50 6:00 6:12 6:25 5:44 5:53 6:02 6:13 6:25 6:30 5:52 6:01 6:11 6:22 6:34 6:47 6:00 6:09 6:19 6:30 6:42 6:47 6:05 6:14 6:24 6:35 6:47 7:00 6:10 6:19 6:29 6:40 6:52 6:57 6:15 6:24 6:34 6:45 6:57 7:10 6:19 6:28 6:38 6:49 7:01 7:06 6:23 6:32 6:42 6:53 7:05 7:18 6:27 6:36 6:46 6:57 7:09 7:14 6:31 6:40 6:50 7:01 7:13 7:26 6:35 6:44 6:54 7:05 7:17 7:22 6:39 6:48 6:58 7:09 7:21 7:34 6:43 6:52 7:02 7:13 7:25 7:30 6:47 6:56 7:06 7:17 7:29 7:42 6:51 7:00 7:10 7:21 7:33 7:38 6:55 7:04 7:14 7:25 7:37 7:50 6:59 7:08 7:18 7:29 7:41 7:46 7:03 7:12 7:22 7:33 7:45 7:58 7:07 7:16 7:26 7:37 7:49 7:54 7:11 7:20 7:30 7:41 7:53 8:06 7:15 7:24 7:34 7:45 7:57 8:02 7:19 7:28 7:38 7:49 8:01 8:14 7:23 7:32 7:42 7:53 8:05 8:10 7:27 7:36 7:46 7:57 8:09 8:22 7:31 7:40 7:50 8:01 8:13 8:18 7:35 7:44 7:54 8:05 8:17 8:30 7:39 7:48 7:58 8:09 8:21 8:26 7:43 7:52 8:02 8:13 8:25 8:38 7:47 7:56 8:06 8:17 8:29 8:34 7:51 8:00 8:10 8:21 8:33 8:46 7:55 8:04 8:14 8:25 8:37 8:42 7:59 8:08 8:18 8:29 8:41 8:54 8:03 8:12 8:22 8:33 8:45 8:50 8:07 8:16 8:26 8:37 8:49 9:02 8:11 8:20 8:30 8:41 8:53 8:58 8:15 8:24 8:34 8:45 8:57 9:10 8:19 8:28 8:38 8:49 9:01 9:06 8:23 8:32 8:42 8:53 9:05 9:18 8:27 8:36 8:46 8:57 9:09 9:14 8:31 8:40 8:50 9:01 9:13 9:26 8:36 8:45 8:55 9:06 9:18 9:23 8:40 8:49 8:59 9:10 9:22 9:35 8:44 8:53 9:03 9:14 9:26 9:31 8:48 8:57 9:07 9:18 9:30 9:43 8:52 9:01 9:11 9:22 9:34 9:39 8:56 9:05 9:15 9:26 9:38 9:51 9:00 9:09 9:19 9:30 9:42 9:47 9:04 9:13 9:23 9:34 9:46 9:59 9:08 9:17 9:27 9:38 9:50 9:55 9:12 9:21 9:31 9:42 9:54 10:07 9:17 9:26 9:36 9:47 9:59 10:04 9:22 9:32 9:42 9:53 10:05 10:18 9:27 9:37 9:47 9:58 10:10 10:15 9:32 9:42 9:52 10:03 10:15 10:28 9:38 9:48 9:58 10:09 10:21 10:26 9:44 9:54 10:04 10:15 10:27 10:40 9:50 10:00 10:10 10:21 10:33 10:38 9:58 10:08 10:18 10:29 10:41 10:54 10:06 10:16 10:26 10:37 10:49 10:54 10:14 10:24 10:34 10:45 10:57 11:10 10:22 10:32 10:42 10:53 11:05 11:10 10:30 10:40 10:50 11:01 11:13 11:26 10:38 10:48 10:58 11:09 11:21 11:26 10:46 10:56 11:06 11:17 11:29 11:42 10:54 11:04 11:14 11:25 11:37 11:42 11:02 11:12 11:22 11:33 11:45 11:58 11:10 11:20 11:30 11:41 11:53 11:58 11:18 11:28 11:38 11:49 12:01P 12:14P 11:26 11:36 11:46 11:57 12:09 12:14P 11:34 11:44 11:54 12:05P 12:17 12:30 11:42 11:52 12:02P 12:13 12:25 12:30 11:50 11:59 12:10 12:21 12:33 12:46 11:58 12:08P 12:18 12:29 12:41 12:46 12:06P 12:16 12:26 12:37 12:49 1:02 12:14 12:24 12:34 12:45 12:57 1:02 12:22 12:32 12:42 12:53 1:05 1:18 12:30 12:40 12:50 1:01 1:13 1:18 12:38 12:48 12:58 1:09 1:21 1:34 12:46 12:56 1:06 1:17 1:29 1:34 12:54 1:04 1:14 1:25 1:37 1:50 1:02 1:12 1:22 1:33 1:45 1:50 1:10 1:20 1:30 1:41 1:53 2:06 1:18 1:28 1:38 1:49 2:01 2:06 1:26 1:36 1:46 1:57 2:09 2:22 1:34 1:44 1:54 2:05 2:17 2:22 1:42 1:52 2:02 2:13 2:25 2:38 1:50 2:00 2:10 2:21 2:33 2:38 1:58 2:08 2:18 2:29 2:41 2:54 2:06 2:16 2:26 2:37 2:49 2:54 2:14 2:24 2:34 2:45 2:57 3:10 2:22 2:32 2:42 2:53 3:05 3:10 2:30 2:40 2:50 3:01 3:13 3:26 2:38 2:48 2:58 3:09 3:21 3:26 2:45 2:55 3:05 3:16 3:28 3:41 2:52 3:02 3:12 3:23 3:35 3:40 2:59 3:09 3:19 3:30 3:42 3:55 3:06 3:16 3:26 3:37 3:49 3:54 3:13 3:23 3:33 3:44 3:56 4:09 3:20 3:30 3:40 3:51 4:03 4:08 3:27 3:37 3:47 3:58 4:10 4:23 3:33 3:43 3:53 4:04 4:16 4:21 3:38 3:48 3:58 4:09 4:21 4:34 3:43 3:53 4:03 4:14 4:26 4:31 3:47 3:57 4:07 4:18 4:30 4:43 3:52 4:02 4:12 4:23 4:35 4:40 3:57 4:07 4:17 4:28 4:40 4:53 4:01 4:11 4:21 4:32 4:44 4:49 4:06 4:16 4:26 4:37 4:49 5:02 4:10 4:20 4:30 4:41 4:53 4:58 4:14 4:24 4:34 4:45 4:57 5:10 4:18 4:28 4:38 4:49 5:01 5:06 4:22 4:32 4:42 4:53 5:05 5:18 4:26 4:36 4:46 4:57 5:09 5:14 4:30 4:40 4:50 5:01 5:13 5:26 4:34 4:44 4:54 5:05 5:17 5:22 4:38 4:48 4:58 5:09 5:21 5:34 4:42 4:52 5:02 5:13 5:25 5:30 4:47 4:57 5:07 5:18 5:30 5:43 4:51 5:01 5:11 5:22 5:34 5:39 4:55 5:05 5:15 5:26 5:38 5:51 4:59 5:09 5:19 5:30 5:42 5:47 5:03 5:13 5:23 5:34 5:46 5:59 5:07 5:17 5:27 5:38 5:50 5:55 5:11 5:21 5:31 5:42 5:54 6:07 5:15 5:25 5:35 5:46 5:58 6:03 5:19 5:29 5:39 5:50 6:02 6:15 5:23 5:33 5:43 5:54 6:06 6:11 5:27 5:37 5:47 5:58 6:10 6:23 5:31 5:41 5:51 6:02 6:14 6:19 5:35 5:45 5:55 6:06 6:18 6:31 5:39 5:49 5:59 6:10 6:22 6:27 5:43 5:53 6:03 6:14 6:26 6:39 5:47 5:57 6:07 6:18 6:30 6:35 5:52 6:02 6:12 6:23 6:35 6:48 5:56 6:06 6:16 6:27 6:39 6:44 6:01 6:11 6:21 6:32 6:44 6:57 6:05 6:15 6:25 6:36 6:48 6:53 6:10 6:20 6:30 6:41 6:53 7:06 6:14 6:24 6:34 6:45 6:57 7:02 6:18 6:28 6:38 6:49 7:01 7:14 6:22 6:32 6:42 6:53 7:05 7:10 6:26 6:36 6:46 6:57 7:09 7:22 6:30 6:40 6:50 7:01 7:13 7:18 6:34 6:44 6:54 7:05 7:17 7:30 6:38 6:48 6:58 7:09 7:21 7:26 6:43 6:53 7:03 7:14 7:26 7:39 6:48 6:58 7:08 7:19 7:31 7:36 6:53 7:03 7:13 7:24 7:36 7:49 6:58 7:07 7:17 7:28 7:40 7:45 7:02 7:11 7:21 7:32 7:44 7:57 7:07 7:16 7:26 7:37 7:49 7:54 7:12 7:21 7:31 7:42 7:54 8:07 7:17 7:26 7:36 7:47 7:59 8:04 7:23 7:32 7:42 7:53 8:05 8:18 7:29 7:38 7:48 7:59 8:11 8:16 7:36 7:45 7:55 8:06 8:17 8:22 8:39 7:45 7:54 8:04 8:15 8:26 8:31 8:48 7:54 8:03 8:13 8:24 8:35 8:40 8:57 8:03 8:12 8:22 8:33 8:44 8:49 9:06 8:13 8:22 8:32 8:43 8:54 8:59 9:16 8:24 8:33 8:43 8:54 9:05 9:10 9:27 8:39 8:48 8:58 9:09 9:20 9:25 9:42 8:54 9:03 9:13 9:24 9:35 9:40 9:57 9:09 9:18 9:28 9:39 9:50 9:55 10:12 9:24 9:33 9:43 9:54 10:05 10:10 10:27 9:39 9:48 9:58 10:08 10:19 10:24 10:41 9:54 10:03 10:13 10:23 10:34 10:39 10:56 10:09 10:18 10:28 10:38 10:49 10:54 11:11 10:24 10:33 10:43 10:53 11:04 11:09 11:26 10:39 10:48 10:58 11:08 11:19 11:24 11:41 10:55 11:04 11:14 11:24 11:35 11:40 11:57 11:15 11:24 11:34 11:44 11:55 11:59 12:17A 11:35 11:44 11:54 12:04A 12:15A 12:20A 12:37 11:55 12:04A 12:14A 12:24 12:35 12:40 12:57 12:16A 12:25 12:35 12:45 12:56 1:01 1:18 12:35 12:44 12:54 1:04 1:15 1:20 1:37 12:55 1:04 1:14 1:24 1:35 1:40 1:57 Service continues on Friday nights only. See ate Night Section below. Metro range ine Eastbound ( pproximate Times) H TSW TH W NE ENTE N W NNET N N YS N TH H YW Warner Center Canoga Station Pierce College Van Nuys North Hollywood Chatsworth Station Station A Station Balboa Station Station Station 12:06A 12:18A 12:23A 12:31A 12:41A 12:51A 1:05A 12:26 12:38 12:43 12:51 1:01 1:11 1:25 12:46 12:58 1:03 1:11 1:21 1:31 1:45 1:06 1:18 1:23 1:31 1:41 1:51 2:05 1:26 1:38 1:43 1:51 2:01 2:11 2:25 1:46 1:58 2:03 2:11 2:21 2:31 2:45 Westbound ( pproximate Times) N TH EY EN N N YS T Z N N W NE ENTE H TSW TH H YW North Hollywood Valley College Canoga Station Warner Center Station Station Sepulveda Station Reseda Station B Station Chatsworth Station 1:15A 1:24A 1:34A 1:44A 1:55A 2:00A 2:17A 1:35 1:44 1:54 2:04 2:15 2:20 2:37 1:55 2:04 2:14 2:24 2:35 2:40 2:57 2:15 2:24 2:34 2:44 2:55 3:00 3:17 2:35 2:44 2:54 3:04 3:15 3:20 3:37 2:55 3:04 3:14 3:24 3:35 3:40 3:57

 WARNER CENTER")

90 Chatsworth - Warner Center Shuttle Weekday Peak Hours Only Metro Orange Line Eastbound (Approximate Times) CHATSWORTH CANOGA PARK WARNER CENTER Chatsworth Station Canoga Station Warner Center Station 5:35A 5:48A 5:53A 6:05 6:18 6:23 6:29 6:42 6:47 6:54 7:07 7:12 7:12 7:25 7:30 7:44 7:57 8:02 7:56 8:09 8:14 8:39 8:52 8:57 8:55 9:08 9:13 SHUTTLE TRIPS DO NOT OPERATE MIDDAY 2:00P 2:14P 2:19P 2:52 3:06 3:11 3:19 3:33 3:38 3:42 3:56 4:01 4:23 4:37 4:42 4:40 4:54 4:59 5:11 5:25 5:30 5:33 5:47 5:52 6:00 6:14 6:19 During midday when shuttle is not in operation, passengers traveling between Warner Center and Chatsworth Station may board regular Orange Line trips and transfer at Canoga Station Chatsworth - Warner Center Shuttle Weekday Peak Hours Only Westbound (Approximate Times) WARNER CENTER CANOGA PARK CHATSWORTH Metro Orange Line Warner Center Station Canoga Station Chatsworth Station 6:00A 6:05A 6:18A 6:30 6:35 6:48 6:48 6:53 7:06 7:13 7:18 7:31 7:31 7:36 7:49 8:03 8:08 8:21 8:16 8:21 8:34 9:02 9:07 9:20 9:15 9:20 9:33 SHUTTLE TRIPS DO NOT OPERATE MIDDAY 2:25P 2:30P 2:43P 3:14 3:19 3:32 3:54 3:59 4:12 4:06 4:11 4:24 4:43 4:48 5:01 5:03 5:08 5:21 5:31 5:36 5:49 6:08 6:13 6:26 6:23 6:28 6:41 Durante el mediodía cuando el servicio de enlance no opera, usuarios viajando entre las estaciones Warner Ctr y Chatsworth pueden abordar Metro Orange Line con servicio regular y transbordar en la estación Canoga. Saturday, Sunday and Holiday Schedules Saturday, Sunday and Holiday Schedule in effect on New Year s Day, Memorial Day, Independence Day, Labor Day, Thanksgiving Day and Christmas Day. Special Notes A Trips departing Warner Ctr will stop at Platform 4 at Canoga. Trips departing from Chatsworth will stop at Platform 2 at Canoga. See Inset Map B Trips terminating at Warner Ctr will stop at Platform 3 at Canoga. Trips terminating at Chatsworth will stop at Platform 1 at Canoga. See Inset Map. Shaded trips operate between Chatsworth Station and North Hollywood Station via Warner Ctr. Trips will serve both stops at Canoga Station. Horarios de sábado, domingo y días feriados Horarios de sábado, domingo, y días feriados en vigor para New Year s Day, Memorial Day, Independence Day, Labor Day, Thanksgiving Day y Christmas Day. Avisos especiales A Viajes saliendo de Warner Ctr pararán en la plataforma 4 en Canoga. Viajes saliendo de Chatsworth pararán en la plataforma 2 en Canoga. Vea el mapa. B Viajes terminando en Warner Ctr pararán en la plataforma 3 en Canoga. Viajes terminando en Chatsworth pararán en la plataforma 1 en Canoga. Vea el mapa. Viajes bajo columnas sombreadas operarán entre las estaciones Chatsworth y North Hollywood a lo largo de Warner Ctr. Viajes servirán ambas paradas en la estación Canoga.
91 Saturday, Sunday and Holiday Schedule Effective Jun Metro Orange Line Saturday, Sunday and Holiday Schedule Metro Orange Line Eastbound (Approximate Times) CHATSWORTH WARNER CENTER CANOGA PARK WINNETKA VAN NUYS NORTH HOLLYWOOD Chatsworth Station Warner Center Station Canoga Station A Pierce College Station Balboa Station Van Nuys Station North Hollywood Station 3:41A 3:46A 3:50A 4:00A 4:09A 4:23A 3:50A 4:02 4:06 4:16 4:25 4:39 4:13 4:18 4:22 4:32 4:41 4:55 4:22 4:34 4:38 4:48 4:57 5:11 4:40 4:45 4:49 4:59 5:08 5:22 4:47 4:59 5:03 5:13 5:22 5:36 5:08 5:13 5:17 5:27 5:36 5:50 5:16 5:28 5:32 5:42 5:51 6:05 5:37 5:42 5:46 5:56 6:05 6:19 5:43 5:55 5:59 6:10 6:19 6:33 6:02 6:07 6:11 6:22 6:31 6:45 6:05 6:18 6:22 6:33 6:43 6:58 6:23 6:28 6:32 6:43 6:54 7:09 6:25 6:38 6:42 6:54 7:05 7:20 6:44 6:49 6:53 7:05 7:16 7:31 6:47 7:00 7:04 7:16 7:27 7:42 7:06 7:11 7:15 7:27 7:38 7:53 7:09 7:22 7:26 7:38 7:49 8:04 7:28 7:33 7:37 7:49 8:00 8:15 7:31 7:44 7:48 8:00 8:11 8:26 7:50 7:55 7:59 8:11 8:22 8:37 7:53 8:06 8:10 8:22 8:33 8:48 8:12 8:17 8:21 8:33 8:44 8:59 8:15 8:28 8:32 8:44 8:55 9:11 8:33 8:38 8:42 8:54 9:05 9:21 8:34 8:47 8:51 9:03 9:15 9:31 8:52 8:57 9:01 9:13 9:25 9:41 8:54 9:07 9:11 9:23 9:35 9:51 9:12 9:17 9:21 9:33 9:45 10:01 9:14 9:27 9:31 9:43 9:55 10:11 9:32 9:37 9:41 9:53 10:05 10:21 9:34 9:47 9:51 10:03 10:15 10:31 9:52 9:57 10:01 10:13 10:25 10:41 9:54 10:07 10:11 10:23 10:35 10:51 10:12 10:17 10:21 10:33 10:45 11:01 10:13 10:27 10:31 10:43 10:55 11:11 10:32 10:37 10:41 10:53 11:05 11:21 10:33 10:47 10:51 11:03 11:15 11:31 10:52 10:57 11:01 11:13 11:25 11:41 10:53 11:07 11:11 11:23 11:35 11:51 11:12 11:17 11:21 11:33 11:45 12:01P 11:13 11:27 11:31 11:43 11:55 12:11 11:32 11:37 11:41 11:53 12:05P 12:21 11:33 11:47 11:51 12:03P 12:15 12:31 11:52 11:57 12:01P 12:13 12:25 12:41 11:53 12:07P 12:11 12:23 12:35 12:51 12:12P 12:17 12:21 12:33 12:45 1:01 12:13P 12:27 12:31 12:43 12:55 1:11 12:32 12:37 12:41 12:53 1:05 1:21 12:33 12:47 12:51 1:03 1:15 1:31 12:52 12:57 1:01 1:13 1:25 1:41 12:53 1:07 1:11 1:23 1:35 1:51 1:12 1:17 1:21 1:33 1:45 2:01 1:13 1:27 1:31 1:43 1:55 2:11 1:32 1:37 1:41 1:53 2:05 2:21 1:33 1:47 1:51 2:03 2:15 2:31 1:52 1:57 2:01 2:13 2:25 2:41 1:53 2:07 2:11 2:23 2:35 2:51 2:12 2:17 2:21 2:33 2:45 3:01 2:13 2:27 2:31 2:43 2:55 3:11 2:32 2:37 2:41 2:53 3:05 3:21 2:33 2:47 2:51 3:03 3:15 3:31 2:52 2:57 3:01 3:13 3:25 3:41 2:53 3:07 3:11 3:23 3:35 3:51 3:12 3:17 3:21 3:33 3:45 4:01 3:13 3:27 3:31 3:43 3:55 4:11 3:32 3:37 3:41 3:53 4:05 4:21 3:33 3:47 3:51 4:03 4:15 4:31 3:52 3:57 4:01 4:13 4:25 4:41 3:53 4:07 4:11 4:23 4:35 4:51 4:12 4:17 4:21 4:33 4:45 5:01 4:13 4:27 4:31 4:43 4:55 5:11 4:32 4:37 4:41 4:53 5:05 5:21 4:33 4:47 4:51 5:03 5:15 5:31 4:52 4:57 5:01 5:13 5:25 5:41 4:53 5:07 5:11 5:23 5:35 5:51 5:12 5:17 5:21 5:33 5:45 6:01 5:13 5:27 5:31 5:43 5:55 6:11 5:33 5:38 5:42 5:54 6:06 6:22 5:35 5:49 5:53 6:05 6:17 6:33 5:55 6:00 6:04 6:16 6:28 6:44 5:58 6:12 6:16 6:28 6:40 6:56 6:19 6:24 6:28 6:40 6:52 7:08 6:23 6:37 6:41 6:53 7:05 7:21 6:47 6:52 6:56 7:07 7:18 7:34 6:51 7:05 7:09 7:20 7:31 7:47 7:14 7:19 7:23 7:34 7:45 8:01 7:20 7:33 7:37 7:48 7:59 8:15 7:42 7:47 7:51 8:02 8:13 8:29 7:41 7:58 8:02 8:06 8:17 8:28 8:44 7:56 8:13 8:17 8:21 8:32 8:43 8:59 8:11 8:28 8:32 8:36 8:47 8:58 9:14 8:26 8:43 8:47 8:51 9:02 9:13 9:29 8:41 8:58 9:02 9:06 9:17 9:28 9:44 8:56 9:13 9:17 9:21 9:32 9:43 9:59 9:11 9:28 9:32 9:36 9:47 9:58 10:14 9:26 9:43 9:47 9:51 10:02 10:13 10:29 9:42 9:59 10:03 10:07 10:18 10:29 10:45 10:00 10:17 10:21 10:25 10:36 10:47 11:03 10:21 10:38 10:42 10:46 10:57 11:08 11:24 10:42 10:59 11:03 11:07 11:18 11:28 11:43 11:06 11:23 11:27 11:31 11:42 11:52 12:07A 11:27 11:44 11:48 11:52 12:03A 12:13A 12:27 11:46 12:03A 12:07A 12:11A 12:21 12:31 12:45 Service continues on Saturday nights only. See Late Night Section ROUTE MAP Topanga Canyon Bl SEE INSET MAP Owensmouth Av Canoga Av De Soto Av Devonshire St Plummer St CHATSWORTH Roscoe Bl ROSCOE CANOGA PARK Saticoy St Erwin St WARNER CENTER Oxnard St WOODLAND HILLS CHATSWORTH NORDHOFF SHERMAN WAY CANOGA Victory Bl Pierce College 101 Nordhoff St Mason Av DE SOTO Ventura Bl Lassen St Winnetka Av PIERCE COLLEGE INSET MAP CANOGA STATION Canoga Av ML AM To Warner Center Victory Bl PARK AND RIDE LOT PLATFORM # 3 ORANGE LINE PLATFORM # 4 WINNETKA Topham St To Chatsworth Tampa Av PLATFORM # 1 ORANGE LINE PLATFORM # 2 RESEDA TAMPA Reseda Bl To Northridge RESEDA TARZANA Vanowen St Victory Bl LAKE BALBOA Sherman Wy White Oak Av Oxnard St Burbank Bl Ventura Bl Balboa Bl BALBOA Van Nuys Airport Woodley Av Sepulveda Basin ENCINO Westbound (Approximate Times) NORTH HOLLYWOOD North Hollywood Station Bus and Rail Lines Serving Metro Stations North Hollywood Metro Red Line, 152, 154, 156, 162, 183, 224, 353, 656 Owl; BB Media District, Airport/Empire, CE549; SC757 Laurel Canyon 156, 230, 656 Valley College 156, 167, CE549, 656, LDVAN Woodman 154, 158 Van Nuys 154, 156, 233, 237, 656, 761, LDVAN Sepulveda 234, 734 Woodley 164, 237 Balboa 164, 236, 237, CE573, CE574 Reseda 240, 741 Tampa 242 Pierce College 164, 243 Platform 1 - Northbound to Chatsworth Station Plataforma 1 - Rumbo al norte a Chatsworth Station Platform 2 - Eastbound to North Hollywood Weekday peak hours shuttle trips do not stop here. Plataforma 2 - Rumbo al este a North Hollywood Autobus entre semana durante horas pico no para aquí. Platform 3 - Westbound to Warner Center Plataforma 3 - Rumbo al oeste a Warner Center Platform 4 - Eastbound to North Hollywood Weekday peak hours shuttle trips do not stop here. Plataforma 4 - Rumbo al este a North Hollywood Autobus entre semana durante horas pico no para aquí. ORANGE LINE To North Hollywood VALLEY GLEN VAN NUYS TARZANA CANOGA PARK WARNER CENTER CHATSWORTH Valley College Station Sepulveda Station Reseda Stattion Canoga Station B Warner Center Station Chatsworth Station 4:32A 4:41A 4:50A 5:00A 5:11A 5:23A 4:48 4:57 5:06 5:16 5:27 5:39 5:04 5:13 5:22 5:32 5:44 5:49A 5:20 5:29 5:38 5:48 5:59 6:12 5:35 5:44 5:53 6:03 6:15 6:20 5:49 5:58 6:08 6:19 6:31 6:44 6:03 6:12 6:22 6:33 6:45 6:50 6:18 6:27 6:37 6:48 7:00 7:13 6:31 6:40 6:50 7:01 7:13 7:18 6:44 6:53 7:03 7:14 7:26 7:39 6:57 7:06 7:16 7:27 7:39 7:44 7:10 7:19 7:29 7:40 7:52 8:05 7:19 7:28 7:38 7:49 8:01 8:06 7:31 7:40 7:50 8:01 8:13 8:26 7:43 7:52 8:02 8:13 8:25 8:30 7:55 8:04 8:14 8:25 8:37 8:50 8:07 8:16 8:26 8:37 8:49 8:54 8:19 8:28 8:38 8:49 9:01 9:14 8:30 8:39 8:49 9:00 9:12 9:17 8:42 8:51 9:01 9:12 9:24 9:37 8:53 9:02 9:12 9:23 9:35 9:40 9:03 9:12 9:22 9:33 9:45 9:58 9:13 9:22 9:32 9:43 9:55 10:00 9:22 9:32 9:42 9:53 10:05 10:18 9:32 9:42 9:52 10:03 10:15 10:20 9:42 9:52 10:02 10:13 10:25 10:38 9:52 10:02 10:12 10:23 10:35 10:40 10:02 10:12 10:22 10:33 10:45 10:58 10:12 10:22 10:32 10:43 10:55 11:00 10:22 10:32 10:42 10:53 11:05 11:18 10:32 10:42 10:52 11:03 11:15 11:20 10:42 10:52 11:02 11:13 11:25 11:38 10:52 11:02 11:12 11:23 11:35 11:40 11:02 11:12 11:22 11:33 11:45 11:58 11:12 11:22 11:32 11:43 11:55 11:59 11:22 11:32 11:42 11:53 12:05P 12:18P 11:32 11:42 11:52 12:03P 12:15 12:20P 11:42 11:52 12:02P 12:13 12:25 12:38 11:52 12:02P 12:12 12:23 12:35 12:40 12:02P 12:12 12:22 12:33 12:45 12:58 12:12 12:22 12:32 12:43 12:55 1:00 12:22 12:32 12:42 12:53 1:05 1:18 12:32 12:42 12:52 1:03 1:15 1:20 12:42 12:52 1:02 1:13 1:25 1:38 12:52 1:02 1:12 1:23 1:35 1:40 1:02 1:12 1:22 1:33 1:45 1:58 1:12 1:22 1:32 1:43 1:55 2:00 1:22 1:32 1:42 1:53 2:05 2:18 1:32 1:42 1:52 2:03 2:15 2:20 1:42 1:52 2:02 2:13 2:25 2:38 1:52 2:02 2:12 2:23 2:35 2:40 2:02 2:12 2:22 2:33 2:45 2:58 2:12 2:22 2:32 2:43 2:55 3:00 2:22 2:32 2:42 2:53 3:05 3:18 2:32 2:42 2:52 3:03 3:15 3:20 2:42 2:52 3:02 3:13 3:25 3:38 2:52 3:02 3:12 3:23 3:35 3:40 3:02 3:12 3:22 3:33 3:45 3:58 3:12 3:22 3:32 3:43 3:55 4:00 3:22 3:32 3:42 3:53 4:05 4:18 3:32 3:42 3:52 4:03 4:15 4:20 3:42 3:52 4:02 4:13 4:25 4:38 3:52 4:02 4:12 4:23 4:35 4:40 4:02 4:12 4:22 4:33 4:45 4:58 4:12 4:22 4:32 4:43 4:55 5:00 4:22 4:32 4:42 4:53 5:05 5:18 4:32 4:42 4:52 5:03 5:15 5:20 4:42 4:52 5:02 5:13 5:25 5:38 4:52 5:02 5:12 5:23 5:35 5:40 5:02 5:12 5:22 5:33 5:45 5:58 5:12 5:22 5:32 5:43 5:55 6:00 5:22 5:32 5:42 5:53 6:05 6:18 5:32 5:42 5:52 6:03 6:15 6:20 5:42 5:52 6:02 6:13 6:25 6:38 5:52 6:02 6:12 6:23 6:35 6:40 6:02 6:12 6:22 6:33 6:45 6:58 6:12 6:22 6:32 6:43 6:55 7:00 6:22 6:32 6:42 6:53 7:05 7:18 6:33 6:43 6:53 7:04 7:16 7:21 6:45 6:55 7:05 7:16 7:28 7:41 6:57 7:07 7:17 7:28 7:39 7:44 8:01 7:09 7:18 7:28 7:39 7:50 7:55 8:12 7:21 7:30 7:40 7:51 8:02 8:07 8:24 7:32 7:41 7:51 8:02 8:13 8:18 8:35 7:45 7:54 8:04 8:15 8:26 8:31 8:48 7:58 8:07 8:17 8:28 8:39 8:44 9:01 8:11 8:20 8:30 8:41 8:52 8:57 9:14 8:24 8:33 8:43 8:54 9:05 9:10 9:27 8:39 8:48 8:58 9:09 9:20 9:25 9:42 8:54 9:03 9:13 9:24 9:35 9:40 9:57 9:09 9:18 9:28 9:39 9:50 9:55 10:12 9:24 9:33 9:43 9:54 10:05 10:10 10:27 9:39 9:48 9:58 10:08 10:19 10:24 10:41 9:54 10:03 10:13 10:23 10:34 10:39 10:56 10:09 10:18 10:28 10:38 10:49 10:54 11:11 10:24 10:33 10:43 10:53 11:04 11:09 11:26 10:39 10:48 10:58 11:08 11:19 11:24 11:41 10:55 11:04 11:14 11:24 11:35 11:40 11:57 11:15 11:24 11:34 11:44 11:55 11:59 12:17A 11:35 11:44 11:54 12:04A 12:15A 12:20A 12:37 11:55 12:04A 12:14A 12:24 12:35 12:40 12:57 12:16A 12:25 12:35 12:45 12:56 1:01 1:18 12:35 12:44 12:54 1:04 1:15 1:20 1:37 12:55 1:04 1:14 1:24 1:35 1:40 1:57 Service continues on Saturday nights only. See Late Night Section 405 WOODLEY SEPULVEDA To Westwood Sepulveda Bl 405 To Sylmar VAN NUYS Erwin St De Soto 164, 244, SC796 Canoga 164, 150, AV 787, SC796 Warner Center 150, 161, 164, 245, 645, 750, CE422, VISTA Highway 101/Conejo Connection Sherman Way 162, 163 Roscoe 152, 353 Nordhoff 166, 364 Chatsworth 158, 166, 167, 244, 245, 364; CE419; SC791; SV-C; METROLINK; AMTRAK Van Nuys Bl Southbound Stop Burbank Bl Van Nuys Bl Huston St SHERMAN OAKS To Pacoima VAN NUYS Sherman Wy VALLEY GLEN Van Nuys Government Center Northbound Stop VALLEY COLLEGE Chandler Bl North Chandler Bl South Magnolia Bl Woodman Av To Universal City LEGEND Metro Orange Line Metro Red Line (To Union Station) Metro Rapid Lines Chatsworth-Warner Ctr Shuttle Metrolink/Amtrak Metro Rapid Stops Metro Orange Line Station Westbound only Timepoint Eastbound only Timepoint Timetable Timepoint Parking WOODMAN Fulton Av AV BB CE LD SC SV VISTA Valley College AM ML 101 Coldwater Cyn Av 170 Oxnard St Laurel Cyn Bl Lankershim Bl Victory Bl NORTH HOLLYWOOD LAUREL CANYON Colfax Av Tujunga Av Lankershim Bl NORTH VALLEY HOLLYWOOD VILLAGE 170 Amtrak Station Metrolink Station Transit Center Antelope Valley Transit Authority Burbank Bus LADOT Commuter Express LADOT Dash Santa Clarita Transit Simi Valley Transit Ventura Intercity Service Transit Authority Vanowen St Vineland Av Cumpston St
92 APPENDIX D TRAFFIC VOLUME DATA
93 INTERSECTION TURNING MOVEMENT COUNT SUMMARY CLIENT: OVERLAND TRAFFIC CONSULTANTS, INC. PROJECT: CHATSWORTH DATE: PERIOD: THURSDAY, MARCH 21, :00 AM TO 09:00 AM INTERSECTION N/S MASON AVENUE E/W PLUMMER STREET FILE NUMBER: 1-AM 15 MINUTE TOTALS SBRT SBTH SBLT WBRT WBTH WBLT NBRT NBTH NBLT EBRT EBTH EBLT HOUR TOTALS SBRT SBTH SBLT WBRT WBTH WBLT NBRT NBTH NBLT EBRT EBTH EBLT TOTALS A.M. PEAK HOUR PLUMMER STREET MASON AVENUE DATA PROVIDED BY: THE TRAFFIC SOLUTION 329 DIAMOND STREET ARCADIA, CALIFORNIA PH: FAX:
94 INTERSECTION TURNING MOVEMENT COUNT SUMMARY CLIENT: OVERLAND TRAFFIC CONSULTANTS, INC. PROJECT: CHATSWORTH DATE: PERIOD: THURSDAY, MARCH 21, :00 PM TO 06:00 PM INTERSECTION N/S MASON AVENUE E/W PLUMMER STREET FILE NUMBER: 1-PM 15 MINUTE TOTALS SBRT SBTH SBLT WBRT WBTH WBLT NBRT NBTH NBLT EBRT EBTH EBLT HOUR TOTALS SBRT SBTH SBLT WBRT WBTH WBLT NBRT NBTH NBLT EBRT EBTH EBLT TOTALS P.M. PEAK HOUR PLUMMER STREET MASON AVENUE DATA PROVIDED BY: THE TRAFFIC SOLUTION 329 DIAMOND STREET ARCADIA, CALIFORNIA PH: FAX:
95 INTERSECTION TURNING MOVEMENT COUNT SUMMARY CLIENT: OVERLAND TRAFFIC CONSULTANTS, INC. PROJECT: CHATSWORTH DATE: TUESDAY, APRIL 02, 2013 PERIOD: 07:00 AM TO 10:00 AM INTERSECTION N/S WINNETKA AVENUE E/W LASSEN STREET FILE NUMBER: 2-AM 15 MINUTE TOTALS SBRT SBTH SBLT WBRT WBTH WBLT NBRT NBTH NBLT EBRT EBTH EBLT HOUR TOTALS SBRT SBTH SBLT WBRT WBTH WBLT NBRT NBTH NBLT EBRT EBTH EBLT TOTALS A.M. PEAK HOUR LASSEN STREET THE TRAFFIC SOLUTION 329 DIAMOND STREET ARCADIA, CALIFORNIA PHONE FAX WINNETKA AVENUE
96 INTERSECTION TURNING MOVEMENT COUNT SUMMARY CLIENT: OVERLAND TRAFFIC CONSULTANTS, INC. PROJECT: CHATSWORTH DATE: TUESDAY, APRIL 02, 2013 PERIOD: 03:00 PM TO 06:00 PM INTERSECTION N/S WINNETKA AVENUE E/W LASSEN STREET FILE NUMBER: 2-PM 15 MINUTE TOTALS SBRT SBTH SBLT WBRT WBTH WBLT NBRT NBTH NBLT EBRT EBTH EBLT HOUR TOTALS SBRT SBTH SBLT WBRT WBTH WBLT NBRT NBTH NBLT EBRT EBTH EBLT TOTALS P.M. PEAK HOUR LASSEN STREET THE TRAFFIC SOLUTION 329 DIAMOND STREET ARCADIA, CALIFORNIA PHONE FAX WINNETKA AVENUE
97 INTERSECTION TURNING MOVEMENT COUNT SUMMARY CLIENT: OVERLAND TRAFFIC CONSULTANTS, INC. PROJECT: CHATSWORTH DATE: TUESDAY, APRIL 02, 2013 PERIOD: 07:00 AM TO 10:00 AM INTERSECTION N/S WINNETKA AVENUE E/W PLUMMER STREET FILE NUMBER: 3-AM 15 MINUTE TOTALS SBRT SBTH SBLT WBRT WBTH WBLT NBRT NBTH NBLT EBRT EBTH EBLT HOUR TOTALS SBRT SBTH SBLT WBRT WBTH WBLT NBRT NBTH NBLT EBRT EBTH EBLT TOTALS A.M. PEAK HOUR PLUMMER STREET THE TRAFFIC SOLUTION 329 DIAMOND STREET ARCADIA, CALIFORNIA PHONE FAX WINNETKA AVENUE
98 INTERSECTION TURNING MOVEMENT COUNT SUMMARY CLIENT: OVERLAND TRAFFIC CONSULTANTS, INC. PROJECT: CHATSWORTH DATE: TUESDAY, APRIL 02, 2013 PERIOD: 03:00 PM TO 06:00 PM INTERSECTION N/S WINNETKA AVENUE E/W PLUMMER STREET FILE NUMBER: 3-PM 15 MINUTE TOTALS SBRT SBTH SBLT WBRT WBTH WBLT NBRT NBTH NBLT EBRT EBTH EBLT HOUR TOTALS SBRT SBTH SBLT WBRT WBTH WBLT NBRT NBTH NBLT EBRT EBTH EBLT TOTALS P.M. PEAK HOUR PLUMMER STREET THE TRAFFIC SOLUTION 329 DIAMOND STREET ARCADIA, CALIFORNIA PHONE FAX WINNETKA AVENUE
99 INTERSECTION TURNING MOVEMENT COUNT SUMMARY CLIENT: OVERLAND TRAFFIC CONSULTANTS, INC. PROJECT: CHATSWORTH DATE: TUESDAY, APRIL 02, 2013 PERIOD: 07:00 AM TO 10:00 AM INTERSECTION N/S WINNETKA AVENUE E/W PRAIRIE STREET FILE NUMBER: 4-AM 15 MINUTE TOTALS SBRT SBTH SBLT WBRT WBTH WBLT NBRT NBTH NBLT EBRT EBTH EBLT HOUR TOTALS SBRT SBTH SBLT WBRT WBTH WBLT NBRT NBTH NBLT EBRT EBTH EBLT TOTALS A.M. PEAK HOUR PRAIRIE STREET THE TRAFFIC SOLUTION 329 DIAMOND STREET ARCADIA, CALIFORNIA PHONE FAX WINNETKA AVENUE
100 INTERSECTION TURNING MOVEMENT COUNT SUMMARY CLIENT: OVERLAND TRAFFIC CONSULTANTS, INC. PROJECT: CHATSWORTH DATE: TUESDAY, APRIL 02, 2013 PERIOD: 03:00 PM TO 06:00 PM INTERSECTION N/S WINNETKA AVENUE E/W PRAIRIE STREET FILE NUMBER: 4-PM 15 MINUTE TOTALS SBRT SBTH SBLT WBRT WBTH WBLT NBRT NBTH NBLT EBRT EBTH EBLT HOUR TOTALS SBRT SBTH SBLT WBRT WBTH WBLT NBRT NBTH NBLT EBRT EBTH EBLT TOTALS P.M. PEAK HOUR PRAIRIE STREET THE TRAFFIC SOLUTION 329 DIAMOND STREET ARCADIA, CALIFORNIA PHONE FAX WINNETKA AVENUE
101 INTERSECTION TURNING MOVEMENT COUNT SUMMARY CLIENT: OVERLAND TRAFFIC CONSULTANTS, INC. PROJECT: CHATSWORTH DATE: TUESDAY, APRIL 02, 2013 PERIOD: 07:00 AM TO 10:00 AM INTERSECTION N/S WINNETKA AVENUE E/W NORDHOFF STREET FILE NUMBER: 5-AM 15 MINUTE TOTALS SBRT SBTH SBLT WBRT WBTH WBLT NBRT NBTH NBLT EBRT EBTH EBLT HOUR TOTALS SBRT SBTH SBLT WBRT WBTH WBLT NBRT NBTH NBLT EBRT EBTH EBLT TOTALS A.M. PEAK HOUR NORDHOFF STREET THE TRAFFIC SOLUTION 329 DIAMOND STREET ARCADIA, CALIFORNIA PHONE FAX WINNETKA AVENUE
102 INTERSECTION TURNING MOVEMENT COUNT SUMMARY CLIENT: OVERLAND TRAFFIC CONSULTANTS, INC. PROJECT: CHATSWORTH DATE: TUESDAY, APRIL 02, 2013 PERIOD: 03:00 PM TO 06:00 PM INTERSECTION N/S WINNETKA AVENUE E/W NORDHOFF STREET FILE NUMBER: 5-PM 15 MINUTE TOTALS SBRT SBTH SBLT WBRT WBTH WBLT NBRT NBTH NBLT EBRT EBTH EBLT HOUR TOTALS SBRT SBTH SBLT WBRT WBTH WBLT NBRT NBTH NBLT EBRT EBTH EBLT TOTALS P.M. PEAK HOUR NORDHOFF STREET THE TRAFFIC SOLUTION 329 DIAMOND STREET ARCADIA, CALIFORNIA PHONE FAX WINNETKA AVENUE
103 Project ID: CA13_5160_004 Intersection Turning Movement Prepared by: National Data & Surveying Services Day: TUESDAY City: City of Northridge NS/EW Streets: Winnetka Ave Winnetka Ave NORTHBOUND SOUTHBOUND AM Parthenia St EASTBOUND Date: 4/2/2013 Parthenia St WESTBOUND NL NT NR SL ST SR EL ET ER WL WT WR TOTAL LANES: :00 AM :15 AM :30 AM :45 AM :00 AM :15 AM :30 AM :45 AM :00 AM :15 AM :30 AM :45 AM NL NT NR SL ST SR EL ET ER WL WT WR TOTAL TOTAL VOLUMES : APPROACH %'s : 7.36% 81.85% 10.79% 9.25% 83.67% 7.08% 10.61% 82.92% 6.47% 10.84% 77.82% 11.34% nb a nb d sb a sb d eb a eb d wb a nb d PEAK HR START TIME : 715 AM TOTAL PEAK HR VOL : PEAK HR FACTOR : CONTROL : Signalized
104 Project ID: CA13_5160_004 NS/EW Streets: City: City of Northridge Intersection Turning Movement Prepared by: National Data & Surveying Services Winnetka Ave Winnetka Ave Parthenia St NORTHBOUND SOUTHBOUND EASTBOUND PM Day: TUESDAY Date: 4/2/2013 Parthenia St WESTBOUND NL NT NR SL ST SR EL ET ER WL WT WR TOTAL LANES: :00 PM :15 PM :30 PM :45 PM :00 PM :15 PM :30 PM :45 PM :00 PM :15 PM :30 PM :45 PM NL NT NR SL ST SR EL ET ER WL WT WR TOTAL TOTAL VOLUMES : APPROACH %'s : 6.61% 80.56% 12.83% 11.07% 81.81% 7.11% 8.92% 83.97% 7.11% 14.08% 76.14% 9.78% nb a nb d sb a sb d eb a eb d wb a nb d PEAK HR START TIME : 500 PM TOTAL PEAK HR VOL : PEAK HR FACTOR : CONTROL : Signalized
105 INTERSECTION TURNING MOVEMENT COUNT SUMMARY CLIENT: OVERLAND TRAFFIC CONSULTANTS, INC. PROJECT: CHATSWORTH DATE: TUESDAY, APRIL 02, 2013 PERIOD: 07:00 AM TO 10:00 AM INTERSECTION N/S WINNETKA AVENUE E/W ROSCOE BOULEVARD FILE NUMBER: 6-AM 15 MINUTE TOTALS SBRT SBTH SBLT WBRT WBTH WBLT NBRT NBTH NBLT EBRT EBTH EBLT HOUR TOTALS SBRT SBTH SBLT WBRT WBTH WBLT NBRT NBTH NBLT EBRT EBTH EBLT TOTALS A.M. PEAK HOUR ROSCOE BOULEVARD THE TRAFFIC SOLUTION 329 DIAMOND STREET ARCADIA, CALIFORNIA PHONE FAX WINNETKA AVENUE
106 INTERSECTION TURNING MOVEMENT COUNT SUMMARY CLIENT: OVERLAND TRAFFIC CONSULTANTS, INC. PROJECT: CHATSWORTH DATE: TUESDAY, APRIL 02, 2013 PERIOD: 03:00 PM TO 06:00 PM INTERSECTION N/S WINNETKA AVENUE E/W ROSCOE BOULEVARD FILE NUMBER: 6-PM 15 MINUTE TOTALS SBRT SBTH SBLT WBRT WBTH WBLT NBRT NBTH NBLT EBRT EBTH EBLT HOUR TOTALS SBRT SBTH SBLT WBRT WBTH WBLT NBRT NBTH NBLT EBRT EBTH EBLT TOTALS P.M. PEAK HOUR ROSCOE BOULEVARD THE TRAFFIC SOLUTION 329 DIAMOND STREET ARCADIA, CALIFORNIA PHONE FAX WINNETKA AVENUE
107 INTERSECTION TURNING MOVEMENT COUNT SUMMARY CLIENT: OVERLAND TRAFFIC CONSULTANTS, INC. PROJECT: CHATSWORTH DATE: PERIOD: THURSDAY, MARCH 21, :00 AM TO 09:00 AM INTERSECTION N/S CORBIN AVENUE E/W PLUMMER STREET FILE NUMBER: 7-AM 15 MINUTE TOTALS SBRT SBTH SBLT WBRT WBTH WBLT NBRT NBTH NBLT EBRT EBTH EBLT HOUR TOTALS SBRT SBTH SBLT WBRT WBTH WBLT NBRT NBTH NBLT EBRT EBTH EBLT TOTALS A.M. PEAK HOUR PLUMMER STREET CORBIN AVENUE DATA PROVIDED BY: THE TRAFFIC SOLUTION 329 DIAMOND STREET ARCADIA, CALIFORNIA PH: FAX:
108 INTERSECTION TURNING MOVEMENT COUNT SUMMARY CLIENT: OVERLAND TRAFFIC CONSULTANTS, INC. PROJECT: CHATSWORTH DATE: PERIOD: THURSDAY, MARCH 21, :00 PM TO 06:00 PM INTERSECTION N/S CORBIN AVENUE E/W PLUMMER STREET FILE NUMBER: 7-PM 15 MINUTE TOTALS SBRT SBTH SBLT WBRT WBTH WBLT NBRT NBTH NBLT EBRT EBTH EBLT HOUR TOTALS SBRT SBTH SBLT WBRT WBTH WBLT NBRT NBTH NBLT EBRT EBTH EBLT TOTALS P.M. PEAK HOUR PLUMMER STREET CORBIN AVENUE DATA PROVIDED BY: THE TRAFFIC SOLUTION 329 DIAMOND STREET ARCADIA, CALIFORNIA PH: FAX:
109 INTERSECTION TURNING MOVEMENT COUNT SUMMARY CLIENT: OVERLAND TRAFFIC CONSULTANTS, INC. PROJECT: CHATSWORTH DATE: PERIOD: THURSDAY, MARCH 21, :00 AM TO 09:00 AM INTERSECTION N/S CORBIN AVENUE E/W PRAIRIE STREET FILE NUMBER: 8-AM 15 MINUTE TOTALS SBRT SBTH SBLT WBRT WBTH WBLT NBRT NBTH NBLT EBRT EBTH EBLT HOUR TOTALS SBRT SBTH SBLT WBRT WBTH WBLT NBRT NBTH NBLT EBRT EBTH EBLT TOTALS A.M. PEAK HOUR PRAIRIE STREET CORBIN AVENUE DATA PROVIDED BY: THE TRAFFIC SOLUTION 329 DIAMOND STREET ARCADIA, CALIFORNIA PH: FAX:
110 INTERSECTION TURNING MOVEMENT COUNT SUMMARY CLIENT: OVERLAND TRAFFIC CONSULTANTS, INC. PROJECT: CHATSWORTH DATE: PERIOD: THURSDAY, MARCH 21, :00 PM TO 06:00 PM INTERSECTION N/S CORBIN AVENUE E/W PRAIRIE STREET FILE NUMBER: 8-PM 15 MINUTE TOTALS SBRT SBTH SBLT WBRT WBTH WBLT NBRT NBTH NBLT EBRT EBTH EBLT HOUR TOTALS SBRT SBTH SBLT WBRT WBTH WBLT NBRT NBTH NBLT EBRT EBTH EBLT TOTALS P.M. PEAK HOUR PRAIRIE STREET CORBIN AVENUE DATA PROVIDED BY: THE TRAFFIC SOLUTION 329 DIAMOND STREET ARCADIA, CALIFORNIA PH: FAX:
111 INTERSECTION TURNING MOVEMENT COUNT SUMMARY CLIENT: OVERLAND TRAFFIC CONSULTANTS, INC. PROJECT: DATE: PERIOD: CHATSWORTH WEDNESDAY, AUGUST 28, :00 AM TO 10:00 AM INTERSECTION N/S CORBIN AVENUE E/W NORDHOFF PLACE FILE NUMBER: 1-AM 15 MINUTE TOTALS SBRT SBTH SBLT WBRT WBTH WBLT NBRT NBTH NBLT EBRT EBTH EBLT HOUR TOTALS SBRT SBTH SBLT WBRT WBTH WBLT NBRT NBTH NBLT EBRT EBTH EBLT TOTALS A.M. PEAK HOUR NORDHOFF PLACE DATA PROVIDED BY: THE TRAFFIC SOLUTION 329 DIAMOND STREET ARCADIA, CALIFORNIA PH: FAX: CORBIN AVENUE
112 INTERSECTION TURNING MOVEMENT COUNT SUMMARY CLIENT: OVERLAND TRAFFIC CONSULTANTS, INC. PROJECT: DATE: PERIOD: CHATSWORTH WEDNESDAY, AUGUST 28, :00 PM TO 06:00 PM INTERSECTION N/S CORBIN AVENUE E/W NORDHOFF PLACE FILE NUMBER: 1-PM 15 MINUTE TOTALS SBRT SBTH SBLT WBRT WBTH WBLT NBRT NBTH NBLT EBRT EBTH EBLT HOUR TOTALS SBRT SBTH SBLT WBRT WBTH WBLT NBRT NBTH NBLT EBRT EBTH EBLT TOTALS P.M. PEAK HOUR NORDHOFF PLACE DATA PROVIDED BY: THE TRAFFIC SOLUTION 329 DIAMOND STREET ARCADIA, CALIFORNIA PH: FAX: CORBIN AVENUE
113 INTERSECTION TURNING MOVEMENT COUNT SUMMARY CLIENT: OVERLAND TRAFFIC CONSULTANTS, INC. PROJECT: CHATSWORTH DATE: TUESDAY, APRIL 02, 2013 PERIOD: 07:00 AM TO 10:00 AM INTERSECTION N/S CORBIN AVENUE E/W NORDHOFF STREET / NORDHOFF WAY FILE NUMBER: 9-AM 15 MINUTE TOTALS SBRT SBTH SBLT WBRT WBTH WBLT NBRT NBTH NBLT EBRT EBTH EBLT HOUR TOTALS SBRT SBTH SBLT WBRT WBTH WBLT NBRT NBTH NBLT EBRT EBTH EBLT TOTALS A.M. PEAK HOUR NORDHOFF STREET / NORDHOFF WAY THE TRAFFIC SOLUTION 329 DIAMOND STREET ARCADIA, CALIFORNIA PHONE FAX CORBIN AVENUE
114 INTERSECTION TURNING MOVEMENT COUNT SUMMARY CLIENT: OVERLAND TRAFFIC CONSULTANTS, INC. PROJECT: CHATSWORTH DATE: TUESDAY, APRIL 02, 2013 PERIOD: 03:00 PM TO 06:00 PM INTERSECTION N/S CORBIN AVENUE E/W NORDHOFF STREET / NORDHOFF WAY FILE NUMBER: 9-PM 15 MINUTE TOTALS SBRT SBTH SBLT WBRT WBTH WBLT NBRT NBTH NBLT EBRT EBTH EBLT HOUR TOTALS SBRT SBTH SBLT WBRT WBTH WBLT NBRT NBTH NBLT EBRT EBTH EBLT TOTALS P.M. PEAK HOUR NORDHOFF STREET / NORDHOFF WAY THE TRAFFIC SOLUTION 329 DIAMOND STREET ARCADIA, CALIFORNIA PHONE FAX CORBIN AVENUE
115 INTERSECTION TURNING MOVEMENT COUNT SUMMARY CLIENT: OVERLAND TRAFFIC CONSULTANTS, INC. PROJECT: CHATSWORTH DATE: PERIOD: TUESDAY, APRIL 02, :00 AM TO 09:00 AM INTERSECTION N/S PENFIELD AVENUE E/W PRAIRIE STREET FILE NUMBER: 10-AM 15 MINUTE TOTALS SBRT SBTH SBLT WBRT WBTH WBLT NBRT NBTH NBLT EBRT EBTH EBLT HOUR TOTALS SBRT SBTH SBLT WBRT WBTH WBLT NBRT NBTH NBLT EBRT EBTH EBLT TOTALS A.M. PEAK HOUR PRAIRIE STREET PENFIELD AVENUE DATA PROVIDED BY: THE TRAFFIC SOLUTION 329 DIAMOND STREET ARCADIA, CALIFORNIA PH: FAX:
116 INTERSECTION TURNING MOVEMENT COUNT SUMMARY CLIENT: OVERLAND TRAFFIC CONSULTANTS, INC. PROJECT: CHATSWORTH DATE: PERIOD: TUESDAY, APRIL 02, :00 PM TO 06:00 PM INTERSECTION N/S PENFIELD AVENUE E/W PRAIRIE STREET FILE NUMBER: 10-PM 15 MINUTE TOTALS SBRT SBTH SBLT WBRT WBTH WBLT NBRT NBTH NBLT EBRT EBTH EBLT HOUR TOTALS SBRT SBTH SBLT WBRT WBTH WBLT NBRT NBTH NBLT EBRT EBTH EBLT TOTALS P.M. PEAK HOUR PRAIRIE STREET PENFIELD AVENUE DATA PROVIDED BY: THE TRAFFIC SOLUTION 329 DIAMOND STREET ARCADIA, CALIFORNIA PH: FAX:
117 APPENDIX E LEVEL OF SERVICE WORKSHEETS
118 Level of Service Workheet (Circular 212 Method) I/S #: North-South Street: Winnetka Avenue Conducted by: JO Date: 10/10/ East-West Street: Parthenia Street Peak Hour: AM Project: Chatsworth MGA No. of Phases Opposed Ø'ing: N/S-1, E/W-2 or Both-3? Right Turns: FREE-1, NRTOR-2 or OLA-3? NB-- 0 SB-- 0 NB-- 0 SB-- 0 NB-- 0 SB-- 0 EB-- 0 WB-- 0 EB-- 0 WB-- 0 EB-- 0 WB-- 0 ATSAC-1 or ATSAC+ATCS-2? Override Capacity EXISTING CONDITION EXISTING PLUS PROJECT EXISTING W/ PROJECT W/ MITIGATION MOVEMENT No. of Lane Added Total No. of Lane Added Total No. of Lane Volume Lanes Volume Volume Volume Lanes Volume Volume Volume Lanes Volume Left Left-Through Through Through-Right Right Left-Through-Right Left-Right NORTHBOUND SOUTHBOUND EASTBOUND Left Left-Through Through Through-Right Right Left-Through-Right Left-Right Left Left-Through Through Through-Right Right Left-Through-Right Left-Right WESTBOUND Left Left-Through Through Through-Right Right Left-Through-Right Left-Right North-South: 586 North-South: 627 North-South: 610 CRITICAL VOLUMES East-West: 633 East-West: 653 East-West: 651 SUM: 1219 SUM: 1280 SUM: 1261 VOLUME/CAPACITY (V/C) RATIO: V/C LESS ATSAC/ATCS ADJUSTMENT: LEVEL OF SERVICE (LOS): C C C REMARKS: Version: 1i Beta; 8/4/2011 PROJECT IMPACT hange in v/c due to project: v/c after mitigation: Significant impacted? YES Fully mitigated? YES 1/19/ :41 AM 1 6 EXISTING MIT winnetka parthenia.xls
119 Level of Service Workheet (Circular 212 Method) I/S #: North-South Street: Winnetka Avenue Conducted by: JO Date: 10/10/ East-West Street: Parthenia Street Peak Hour: PM Project: Chatsworth MGA No. of Phases Opposed Ø'ing: N/S-1, E/W-2 or Both-3? Right Turns: FREE-1, NRTOR-2 or OLA-3? NB-- 0 SB-- 0 NB-- 0 SB-- 0 NB-- 0 SB-- 0 EB-- 0 WB-- 0 EB-- 0 WB-- 0 EB-- 0 WB-- 0 ATSAC-1 or ATSAC+ATCS-2? Override Capacity EXISTING CONDITION EXISTING PLUS PROJECT FUTURE W/ PROJECT W/ MITIGATION MOVEMENT No. of Lane Added Total No. of Lane Added Total No. of Lane Volume Lanes Volume Volume Volume Lanes Volume Volume Volume Lanes Volume Left Left-Through Through Through-Right Right Left-Through-Right Left-Right NORTHBOUND SOUTHBOUND EASTBOUND Left Left-Through Through Through-Right Right Left-Through-Right Left-Right Left Left-Through Through Through-Right Right Left-Through-Right Left-Right WESTBOUND Left Left-Through Through Through-Right Right Left-Through-Right Left-Right North-South: 576 North-South: 610 North-South: 593 CRITICAL VOLUMES East-West: 590 East-West: 590 East-West: 590 SUM: 1166 SUM: 1200 SUM: 1183 VOLUME/CAPACITY (V/C) RATIO: V/C LESS ATSAC/ATCS ADJUSTMENT: LEVEL OF SERVICE (LOS): B C B REMARKS: Version: 1i Beta; 8/4/2011 PROJECT IMPACT hange in v/c due to project: v/c after mitigation: Significant impacted? NO Fully mitigated? N/A 1/19/ :41 AM 1 6 EXISTING MIT winnetka parthenia.xls
120 Level of Service Workheet (Circular 212 Method) I/S #: North-South Street: Corbin Avenue Conducted by: JO Date: 10/10/ East-West Street: Plummer Street Peak Hour: AM Project: Chatsworth MGA No. of Phases Opposed Ø'ing: N/S-1, E/W-2 or Both-3? Right Turns: FREE-1, NRTOR-2 or OLA-3? NB-- 0 SB-- 0 NB-- 0 SB-- 0 NB-- 0 SB-- 0 EB-- 0 WB-- 0 EB-- 0 WB-- 0 EB-- 0 WB-- 0 ATSAC-1 or ATSAC+ATCS-2? Override Capacity EXISTING CONDITION EXISTING PLUS PROJECT FUTURE W/ PROJECT W/ MITIGATION MOVEMENT No. of Lane Added Total No. of Lane Added Total No. of Lane Volume Lanes Volume Volume Volume Lanes Volume Volume Volume Lanes Volume Left Left-Through Through Through-Right Right Left-Through-Right Left-Right NORTHBOUND SOUTHBOUND EASTBOUND Left Left-Through Through Through-Right Right Left-Through-Right Left-Right Left Left-Through Through Through-Right Right Left-Through-Right Left-Right WESTBOUND Left Left-Through Through Through-Right Right Left-Through-Right Left-Right North-South: 863 North-South: 885 North-South: 751 CRITICAL VOLUMES East-West: 466 East-West: 497 East-West: 495 SUM: 1329 SUM: 1382 SUM: 1246 VOLUME/CAPACITY (V/C) RATIO: V/C LESS ATSAC/ATCS ADJUSTMENT: LEVEL OF SERVICE (LOS): C D C REMARKS: Version: 1i Beta; 8/4/2011 PROJECT IMPACT hange in v/c due to project: v/c after mitigation: Significant impacted? YES Fully mitigated? YES 1/19/ :53 AM 1 8 EXISTNG MITcorbin plummer.xls
121 Level of Service Workheet (Circular 212 Method) I/S #: North-South Street: Corbin Avenue Conducted by: JO Date: 10/10/ East-West Street: Plummer Street Peak Hour: PM Project: Chatsworth MGA No. of Phases Opposed Ø'ing: N/S-1, E/W-2 or Both-3? Right Turns: FREE-1, NRTOR-2 or OLA-3? NB-- 0 SB-- 0 NB-- 0 SB-- 0 NB-- 0 SB-- 0 EB-- 0 WB-- 0 EB-- 0 WB-- 0 EB-- 0 WB-- 0 ATSAC-1 or ATSAC+ATCS-2? Override Capacity EXISTING CONDITION EXISTING PLUS PROJECT FUTURE W/ PROJECT W/ MITIGATION MOVEMENT No. of Lane Added Total No. of Lane Added Total No. of Lane Volume Lanes Volume Volume Volume Lanes Volume Volume Volume Lanes Volume Left Left-Through Through Through-Right Right Left-Through-Right Left-Right NORTHBOUND SOUTHBOUND EASTBOUND Left Left-Through Through Through-Right Right Left-Through-Right Left-Right Left Left-Through Through Through-Right Right Left-Through-Right Left-Right WESTBOUND Left Left-Through Through Through-Right Right Left-Through-Right Left-Right North-South: 684 North-South: 708 North-South: 706 CRITICAL VOLUMES East-West: 563 East-West: 594 East-West: 592 SUM: 1247 SUM: 1302 SUM: 1298 VOLUME/CAPACITY (V/C) RATIO: V/C LESS ATSAC/ATCS ADJUSTMENT: LEVEL OF SERVICE (LOS): C C C REMARKS: Version: 1i Beta; 8/4/2011 PROJECT IMPACT hange in v/c due to project: v/c after mitigation: Significant impacted? NO Fully mitigated? N/A 1/19/ :54 AM 1 8 EXISTNG MITcorbin plummer.xls
122 Level of Service Workheet (Circular 212 Method) I/S #: North-South Street: Mason Avenue Year of Count: 2013 Ambient Growth: (%): 1.5 Conducted by: JO Date: 10/4/ East-West Street: Plummer Street Projection Year: 2019 Peak Hour: AM Reviewed by: Project: Chatsworth MGA No. of Phases Opposed Ø'ing: N/S-1, E/W-2 or Both-3? Right Turns: FREE-1, NRTOR-2 or OLA-3? NB-- 0 SB-- 0 NB-- 0 SB-- 0 NB-- 0 SB-- 0 NB-- 0 SB-- 0 NB-- 0 SB-- 0 EB-- 0 WB-- 0 EB-- 0 WB-- 0 EB-- 0 WB-- 0 EB-- 0 WB-- 0 EB-- 0 WB-- 0 ATSAC-1 or ATSAC+ATCS-2? Override Capacity EXISTING CONDITION EXISTING PLUS PROJECT FUTURE CONDITION W/O PROJECT FUTURE CONDITION W/ PROJECT FUTURE W/ PROJECT W/ MITIGATION MOVEMENT No. of Lane Project Total Lane Added Total No. of Lane Added Total No. of Lane Added Total No. of Lane Volume Lanes Volume Traffic Volume Volume Volume Volume Lanes Volume Volume Volume Lanes Volume Volume Volume Lanes Volume Left Through Through-Right Right NORTHBOUND SOUTHBOUND EASTBOUND Left Through Through-Right Right Left Through Through-Right Right WESTBOUND Left Through Through-Right Right North-South: 845 North-South: 856 North-South: 964 North-South: 975 North-South: 974 CRITICAL VOLUMES East-West: 350 East-West: 361 East-West: 398 East-West: 409 East-West: 408 SUM: 1195 SUM: 1217 SUM: 1362 SUM: 1384 SUM: 1382 VOLUME/CAPACITY (V/C) RATIO: V/C LESS ATSAC/ATCS ADJUSTMENT: LEVEL OF SERVICE (LOS): B C D D D Version: 1i Beta; 8/4/2011 REMARKS: PROJECT IMPACT Change in v/c due to project: v/c after mitigation: Significant impacted? NO Fully mitigated? N/A 10/3/ :38 AM 1 1 mason plummer CMA
123 Level of Service Workheet (Circular 212 Method) I/S #: North-South Street: Mason Avenue Year of Count: 2013 Ambient Growth: (%): 1.5 Conducted by: JO Date: 10/4/ East-West Street: Plummer Street Projection Year: 2019 Peak Hour: PM Reviewed by: Project: Chatsworth MGA No. of Phases Opposed Ø'ing: N/S-1, E/W-2 or Both-3? Right Turns: FREE-1, NRTOR-2 or OLA-3? NB-- 0 SB-- 0 NB-- 0 SB-- 0 NB-- 0 SB-- 0 NB-- 0 SB-- 0 NB-- 0 SB-- 0 EB-- 0 WB-- 0 EB-- 0 WB-- 0 EB-- 0 WB-- 0 EB-- 0 WB-- 0 EB-- 0 WB-- 0 ATSAC-1 or ATSAC+ATCS-2? Override Capacity EXISTING CONDITION EXISTING PLUS PROJECT FUTURE CONDITION W/O PROJECT FUTURE CONDITION W/ PROJECT FUTURE W/ PROJECT W/ MITIGATION MOVEMENT No. of Lane Project Total Lane Added Total No. of Lane Added Total No. of Lane Added Total No. of Lane Volume Lanes Volume Traffic Volume Volume Volume Volume Lanes Volume Volume Volume Lanes Volume Volume Volume Lanes Volume Left Through Through-Right Right NORTHBOUND SOUTHBOUND EASTBOUND Left Through Through-Right Right Left Through Through-Right Right WESTBOUND Left Through Through-Right Right North-South: 765 North-South: 777 North-South: 873 North-South: 885 North-South: 884 CRITICAL VOLUMES East-West: 373 East-West: 385 East-West: 465 East-West: 477 East-West: 476 SUM: 1138 SUM: 1162 SUM: 1338 SUM: 1362 SUM: 1360 VOLUME/CAPACITY (V/C) RATIO: V/C LESS ATSAC/ATCS ADJUSTMENT: LEVEL OF SERVICE (LOS): B B C D D Version: 1i Beta; 8/4/2011 REMARKS: PROJECT IMPACT Change in v/c due to project: v/c after mitigation: Significant impacted? NO Fully mitigated? N/A 10/3/ :40 AM 1 1 mason plummer CMA
124 Level of Service Workheet (Circular 212 Method) I/S #: North-South Street: Winnetka Avenue Year of Count: 2013 Ambient Growth: (%): 1.5 Conducted by: JO Date: 10/4/ East-West Street: Lassen Street Projection Year: 2019 Peak Hour: AM Reviewed by: Project: Chatsworth MGA No. of Phases Opposed Ø'ing: N/S-1, E/W-2 or Both-3? Right Turns: FREE-1, NRTOR-2 or OLA-3? NB-- 0 SB-- 0 NB-- 0 SB-- 0 NB-- 0 SB-- 0 NB-- 0 SB-- 0 NB-- 0 SB-- 0 EB-- 0 WB-- 0 EB-- 0 WB-- 0 EB-- 0 WB-- 0 EB-- 0 WB-- 0 EB-- 0 WB-- 0 ATSAC-1 or ATSAC+ATCS-2? Override Capacity EXISTING CONDITION EXISTING PLUS PROJECT FUTURE CONDITION W/O PROJECT FUTURE CONDITION W/ PROJECT FUTURE W/ PROJECT W/ MITIGATION MOVEMENT No. of Lane Project Total Lane Added Total No. of Lane Added Total No. of Lane Added Total No. of Lane Volume Lanes Volume Traffic Volume Volume Volume Volume Lanes Volume Volume Volume Lanes Volume Volume Volume Lanes Volume Left Through Through-Right Right NORTHBOUND SOUTHBOUND EASTBOUND Left Through Through-Right Right Left Through Through-Right Right WESTBOUND Left Through Through-Right Right North-South: 528 North-South: 578 North-South: 594 North-South: 644 North-South: 641 CRITICAL VOLUMES East-West: 431 East-West: 464 East-West: 480 East-West: 513 East-West: 511 SUM: 959 SUM: 1042 SUM: 1074 SUM: 1157 SUM: 1152 VOLUME/CAPACITY (V/C) RATIO: V/C LESS ATSAC/ATCS ADJUSTMENT: LEVEL OF SERVICE (LOS): A A B B B Version: 1i Beta; 8/4/2011 REMARKS: PROJECT IMPACT Change in v/c due to project: v/c after mitigation: Significant impacted? NO Fully mitigated? N/A 10/3/ :46 AM 1 2 winnetka lassen
125 Level of Service Workheet (Circular 212 Method) I/S #: North-South Street: Winnetka Avenue Year of Count: 2013 Ambient Growth: (%): 1.5 Conducted by: JO Date: 10/4/ East-West Street: Lassen Street Projection Year: 2019 Peak Hour: PM Reviewed by: Project: Chatsworth MGA No. of Phases Opposed Ø'ing: N/S-1, E/W-2 or Both-3? Right Turns: FREE-1, NRTOR-2 or OLA-3? NB-- 0 SB-- 0 NB-- 0 SB-- 0 NB-- 0 SB-- 0 NB-- 0 SB-- 0 NB-- 0 SB-- 0 EB-- 0 WB-- 0 EB-- 0 WB-- 0 EB-- 0 WB-- 0 EB-- 0 WB-- 0 EB-- 0 WB-- 0 ATSAC-1 or ATSAC+ATCS-2? Override Capacity EXISTING CONDITION EXISTING PLUS PROJECT FUTURE CONDITION W/O PROJECT FUTURE CONDITION W/ PROJECT FUTURE W/ PROJECT W/ MITIGATION MOVEMENT No. of Lane Project Total Lane Added Total No. of Lane Added Total No. of Lane Added Total No. of Lane Volume Lanes Volume Traffic Volume Volume Volume Volume Lanes Volume Volume Volume Lanes Volume Volume Volume Lanes Volume Left Through Through-Right Right NORTHBOUND SOUTHBOUND EASTBOUND Left Through Through-Right Right Left Through Through-Right Right WESTBOUND Left Through Through-Right Right North-South: 354 North-South: 390 North-South: 389 North-South: 426 North-South: 424 CRITICAL VOLUMES East-West: 513 East-West: 542 East-West: 591 East-West: 619 East-West: 618 SUM: 867 SUM: 932 SUM: 980 SUM: 1045 SUM: 1042 VOLUME/CAPACITY (V/C) RATIO: V/C LESS ATSAC/ATCS ADJUSTMENT: LEVEL OF SERVICE (LOS): A A A A A Version: 1i Beta; 8/4/2011 REMARKS: PROJECT IMPACT Change in v/c due to project: v/c after mitigation: Significant impacted? NO Fully mitigated? N/A 10/3/ :44 AM 1 2 winnetka lassen
126 Level of Service Workheet (Circular 212 Method) I/S #: North-South Street: Winnetka Avenue Year of Count: 2013 Ambient Growth: (%): 1.5 Conducted by: JO Date: 10/4/ East-West Street: Plummer Street Projection Year: 2019 Peak Hour: AM Reviewed by: Project: Chatsworth MGA No. of Phases Opposed Ø'ing: N/S-1, E/W-2 or Both-3? Right Turns: FREE-1, NRTOR-2 or OLA-3? NB-- 0 SB-- 0 NB-- 0 SB-- 0 NB-- 0 SB-- 0 NB-- 0 SB-- 0 NB-- 0 SB-- 0 EB-- 0 WB-- 0 EB-- 0 WB-- 0 EB-- 0 WB-- 0 EB-- 0 WB-- 0 EB-- 0 WB-- 0 ATSAC-1 or ATSAC+ATCS-2? Override Capacity EXISTING CONDITION EXISTING PLUS PROJECT FUTURE CONDITION W/O PROJECT FUTURE CONDITION W/ PROJECT FUTURE W/ PROJECT W/ MITIGATION MOVEMENT No. of Lane Project Total Lane Added Total No. of Lane Added Total No. of Lane Added Total No. of Lane Volume Lanes Volume Traffic Volume Volume Volume Volume Lanes Volume Volume Volume Lanes Volume Volume Volume Lanes Volume Left Through Through-Right Right NORTHBOUND SOUTHBOUND EASTBOUND Left Through Through-Right Right Left Through Through-Right Right WESTBOUND Left Through Through-Right Right North-South: 578 North-South: 650 North-South: 645 North-South: 717 North-South: 713 CRITICAL VOLUMES East-West: 392 East-West: 403 East-West: 405 East-West: 405 East-West: 405 SUM: 970 SUM: 1053 SUM: 1050 SUM: 1122 SUM: 1118 VOLUME/CAPACITY (V/C) RATIO: V/C LESS ATSAC/ATCS ADJUSTMENT: LEVEL OF SERVICE (LOS): A B A B B Version: 1i Beta; 8/4/2011 REMARKS: PROJECT IMPACT Change in v/c due to project: v/c after mitigation: Significant impacted? NO Fully mitigated? N/A 10/3/ :53 AM 1 3 winnetka plummer
127 Level of Service Workheet (Circular 212 Method) I/S #: North-South Street: Winnetka Avenue Year of Count: 2013 Ambient Growth: (%): 1.5 Conducted by: JO Date: 10/4/ East-West Street: Plummer Street Projection Year: 2019 Peak Hour: PM Reviewed by: Project: Chatsworth MGA No. of Phases Opposed Ø'ing: N/S-1, E/W-2 or Both-3? Right Turns: FREE-1, NRTOR-2 or OLA-3? NB-- 0 SB-- 0 NB-- 0 SB-- 0 NB-- 0 SB-- 0 NB-- 0 SB-- 0 NB-- 0 SB-- 0 EB-- 0 WB-- 0 EB-- 0 WB-- 0 EB-- 0 WB-- 0 EB-- 0 WB-- 0 EB-- 0 WB-- 0 ATSAC-1 or ATSAC+ATCS-2? Override Capacity EXISTING CONDITION EXISTING PLUS PROJECT FUTURE CONDITION W/O PROJECT FUTURE CONDITION W/ PROJECT FUTURE W/ PROJECT W/ MITIGATION MOVEMENT No. of Lane Project Total Lane Added Total No. of Lane Added Total No. of Lane Added Total No. of Lane Volume Lanes Volume Traffic Volume Volume Volume Volume Lanes Volume Volume Volume Lanes Volume Volume Volume Lanes Volume Left Through Through-Right Right NORTHBOUND SOUTHBOUND EASTBOUND Left Through Through-Right Right Left Through Through-Right Right WESTBOUND Left Through Through-Right Right North-South: 423 North-South: 484 North-South: 469 North-South: 530 North-South: 527 CRITICAL VOLUMES East-West: 324 East-West: 324 East-West: 370 East-West: 370 East-West: 370 SUM: 747 SUM: 808 SUM: 839 SUM: 900 SUM: 897 VOLUME/CAPACITY (V/C) RATIO: V/C LESS ATSAC/ATCS ADJUSTMENT: LEVEL OF SERVICE (LOS): A A A A A Version: 1i Beta; 8/4/2011 REMARKS: PROJECT IMPACT Change in v/c due to project: v/c after mitigation: Significant impacted? NO Fully mitigated? N/A 10/3/ :54 AM 1 3 winnetka plummer
128 Level of Service Workheet (Circular 212 Method) I/S #: North-South Street: Winnetka Avenue Year of Count: 2013 Ambient Growth: (%): 1.5 Conducted by: JO Date: 10/4/ East-West Street: Prairie Street Projection Year: 2019 Peak Hour: AM Reviewed by: Project: Chatsworth MGA No. of Phases Opposed Ø'ing: N/S-1, E/W-2 or Both-3? Right Turns: FREE-1, NRTOR-2 or OLA-3? NB-- 0 SB-- 0 NB-- 0 SB-- 0 NB-- 0 SB-- 0 NB-- 0 SB-- 0 NB-- 0 SB-- 0 EB-- 0 WB-- 0 EB-- 0 WB-- 0 EB-- 0 WB-- 0 EB-- 0 WB-- 0 EB-- 0 WB-- 0 ATSAC-1 or ATSAC+ATCS-2? Override Capacity EXISTING CONDITION EXISTING PLUS PROJECT FUTURE CONDITION W/O PROJECT FUTURE CONDITION W/ PROJECT FUTURE W/ PROJECT W/ MITIGATION MOVEMENT No. of Lane Project Total Lane Added Total No. of Lane Added Total No. of Lane Added Total No. of Lane Volume Lanes Volume Traffic Volume Volume Volume Volume Lanes Volume Volume Volume Lanes Volume Volume Volume Lanes Volume Left Through Through-Right Right NORTHBOUND SOUTHBOUND EASTBOUND Left Through Through-Right Right Left Through Through-Right Right WESTBOUND Left Through Through-Right Right North-South: 567 North-South: 611 North-South: 640 North-South: 685 North-South: 682 CRITICAL VOLUMES East-West: 71 East-West: 114 East-West: 105 East-West: 158 East-West: 155 SUM: 638 SUM: 725 SUM: 745 SUM: 843 SUM: 837 VOLUME/CAPACITY (V/C) RATIO: V/C LESS ATSAC/ATCS ADJUSTMENT: LEVEL OF SERVICE (LOS): A A A A A Version: 1i Beta; 8/4/2011 REMARKS: PROJECT IMPACT Change in v/c due to project: v/c after mitigation: Significant impacted? NO Fully mitigated? N/A 10/3/2014-1:00 AM 1 4 winnetka prairie
129 Level of Service Workheet (Circular 212 Method) I/S #: North-South Street: Winnetka Avenue Year of Count: 2013 Ambient Growth: (%): 1.5 Conducted by: JO Date: 10/4/ East-West Street: Prairie Street Projection Year: 2019 Peak Hour: PM Reviewed by: Project: Chatsworth MGA No. of Phases Opposed Ø'ing: N/S-1, E/W-2 or Both-3? Right Turns: FREE-1, NRTOR-2 or OLA-3? NB-- 0 SB-- 0 NB-- 0 SB-- 0 NB-- 0 SB-- 0 NB-- 0 SB-- 0 NB-- 0 SB-- 0 EB-- 0 WB-- 0 EB-- 0 WB-- 0 EB-- 0 WB-- 0 EB-- 0 WB-- 0 EB-- 0 WB-- 0 ATSAC-1 or ATSAC+ATCS-2? Override Capacity EXISTING CONDITION EXISTING PLUS PROJECT FUTURE CONDITION W/O PROJECT FUTURE CONDITION W/ PROJECT FUTURE W/ PROJECT W/ MITIGATION MOVEMENT No. of Lane Project Total Lane Added Total No. of Lane Added Total No. of Lane Added Total No. of Lane Volume Lanes Volume Traffic Volume Volume Volume Volume Lanes Volume Volume Volume Lanes Volume Volume Volume Lanes Volume Left Through Through-Right Right NORTHBOUND SOUTHBOUND EASTBOUND Left Through Through-Right Right Left Through Through-Right Right WESTBOUND Left Through Through-Right Right North-South: 440 North-South: 529 North-South: 503 North-South: 592 North-South: 589 CRITICAL VOLUMES East-West: 265 East-West: 340 East-West: 314 East-West: 389 East-West: 385 SUM: 705 SUM: 869 SUM: 817 SUM: 981 SUM: 974 VOLUME/CAPACITY (V/C) RATIO: V/C LESS ATSAC/ATCS ADJUSTMENT: LEVEL OF SERVICE (LOS): A A A A A Version: 1i Beta; 8/4/2011 REMARKS: PROJECT IMPACT Change in v/c due to project: v/c after mitigation: Significant impacted? NO Fully mitigated? N/A 10/3/2014-1:04 AM 1 4 winnetka prairie
130 Level of Service Workheet (Circular 212 Method) I/S #: North-South Street: Winnetka Avenue Year of Count: 2013 Ambient Growth: (%): 1.5 Conducted by: JO Date: 10/4/ East-West Street: Nordhoff Street Projection Year: 2019 Peak Hour: AM Reviewed by: Project: Chatsworth MGA No. of Phases Opposed Ø'ing: N/S-1, E/W-2 or Both-3? Right Turns: FREE-1, NRTOR-2 or OLA-3? NB-- 0 SB-- 3 NB-- 0 SB-- 3 NB-- 0 SB-- 3 NB-- 0 SB-- 3 NB-- 0 SB-- 3 EB-- 0 WB-- 0 EB-- 0 WB-- 0 EB-- 0 WB-- 0 EB-- 0 WB-- 0 EB-- 0 WB-- 0 ATSAC-1 or ATSAC+ATCS-2? Override Capacity EXISTING CONDITION EXISTING PLUS PROJECT FUTURE CONDITION W/O PROJECT FUTURE CONDITION W/ PROJECT FUTURE W/ PROJECT W/ MITIGATION MOVEMENT No. of Lane Project Total Lane Added Total No. of Lane Added Total No. of Lane Added Total No. of Lane Volume Lanes Volume Traffic Volume Volume Volume Volume Lanes Volume Volume Volume Lanes Volume Volume Volume Lanes Volume Left Through Through-Right Right NORTHBOUND SOUTHBOUND EASTBOUND Left Through Through-Right Right Left Through Through-Right Right WESTBOUND Left Through Through-Right Right North-South: 629 North-South: 664 North-South: 729 North-South: 763 North-South: 746 CRITICAL VOLUMES East-West: 373 East-West: 414 East-West: 562 East-West: 597 East-West: 565 SUM: 1002 SUM: 1078 SUM: 1291 SUM: 1360 SUM: 1311 VOLUME/CAPACITY (V/C) RATIO: V/C LESS ATSAC/ATCS ADJUSTMENT: LEVEL OF SERVICE (LOS): B B D D D Version: 1i Beta; 8/4/2011 REMARKS: PROJECT IMPACT Change in v/c due to project: v/c after mitigation: Significant impacted? YES Fully mitigated? NO 10/3/2014-1:09 AM 1 5 winnetka nordhoff
131 Level of Service Workheet (Circular 212 Method) I/S #: North-South Street: Winnetka Avenue Year of Count: 2013 Ambient Growth: (%): 1.5 Conducted by: JO Date: 10/4/ East-West Street: Nordhoff Street Projection Year: 2019 Peak Hour: PM Reviewed by: Project: Chatsworth MGA No. of Phases Opposed Ø'ing: N/S-1, E/W-2 or Both-3? Right Turns: FREE-1, NRTOR-2 or OLA-3? NB-- 0 SB-- 3 NB-- 0 SB-- 3 NB-- 0 SB-- 3 NB-- 0 SB-- 3 NB-- 0 SB-- 3 EB-- 0 WB-- 0 EB-- 0 WB-- 0 EB-- 0 WB-- 0 EB-- 0 WB-- 0 EB-- 0 WB-- 0 ATSAC-1 or ATSAC+ATCS-2? Override Capacity EXISTING CONDITION EXISTING PLUS PROJECT FUTURE CONDITION W/O PROJECT FUTURE CONDITION W/ PROJECT FUTURE W/ PROJECT W/ MITIGATION MOVEMENT No. of Lane Project Total Lane Added Total No. of Lane Added Total No. of Lane Added Total No. of Lane Volume Lanes Volume Traffic Volume Volume Volume Volume Lanes Volume Volume Volume Lanes Volume Volume Volume Lanes Volume Left Through Through-Right Right NORTHBOUND SOUTHBOUND EASTBOUND Left Through Through-Right Right Left Through Through-Right Right WESTBOUND Left Through Through-Right Right North-South: 447 North-South: 496 North-South: 509 North-South: 557 North-South: 540 CRITICAL VOLUMES East-West: 455 East-West: 455 East-West: 671 East-West: 671 East-West: 671 SUM: 902 SUM: 951 SUM: 1180 SUM: 1228 SUM: 1211 VOLUME/CAPACITY (V/C) RATIO: V/C LESS ATSAC/ATCS ADJUSTMENT: LEVEL OF SERVICE (LOS): A A C C C Version: 1i Beta; 8/4/2011 REMARKS: PROJECT IMPACT Change in v/c due to project: v/c after mitigation: Significant impacted? NO Fully mitigated? N/A 10/3/2014-1:12 AM 1 5 winnetka nordhoff
132 Level of Service Workheet (Circular 212 Method) I/S #: North-South Street: Winnetka Avenue Year of Count: 2013 Ambient Growth: (%): 1.5 Conducted by: JO Date: 10/4/ East-West Street: Parthenia Street Projection Year: 2019 Peak Hour: AM Reviewed by: Project: Chatsworth MGA No. of Phases Opposed Ø'ing: N/S-1, E/W-2 or Both-3? Right Turns: FREE-1, NRTOR-2 or OLA-3? NB-- 0 SB-- 0 NB-- 0 SB-- 0 NB-- 0 SB-- 0 NB-- 0 SB-- 0 NB-- 0 SB-- 0 EB-- 0 WB-- 0 EB-- 0 WB-- 0 EB-- 0 WB-- 0 EB-- 0 WB-- 0 EB-- 0 WB-- 0 ATSAC-1 or ATSAC+ATCS-2? Override Capacity EXISTING CONDITION EXISTING PLUS PROJECT FUTURE CONDITION W/O PROJECT FUTURE CONDITION W/ PROJECT FUTURE W/ PROJECT W/ MITIGATION MOVEMENT No. of Lane Project Total Lane Added Total No. of Lane Added Total No. of Lane Added Total No. of Lane Volume Lanes Volume Traffic Volume Volume Volume Volume Lanes Volume Volume Volume Lanes Volume Volume Volume Lanes Volume Left Through Through-Right Right NORTHBOUND SOUTHBOUND EASTBOUND Left Through Through-Right Right Left Through Through-Right Right WESTBOUND Left Through Through-Right Right North-South: 586 North-South: 627 North-South: 669 North-South: 710 North-South: 692 CRITICAL VOLUMES East-West: 633 East-West: 653 East-West: 709 East-West: 729 East-West: 632 SUM: 1219 SUM: 1280 SUM: 1378 SUM: 1439 SUM: 1324 VOLUME/CAPACITY (V/C) RATIO: V/C LESS ATSAC/ATCS ADJUSTMENT: LEVEL OF SERVICE (LOS): C C D D C Version: 1i Beta; 8/4/2011 REMARKS: PROJECT IMPACT Change in v/c due to project: v/c after mitigation: Significant impacted? YES Fully mitigated? YES 10/3/2014-1:16 AM 1 6 winnetka parthenia
133 Level of Service Workheet (Circular 212 Method) I/S #: North-South Street: Winnetka Avenue Year of Count: 2013 Ambient Growth: (%): 1.5 Conducted by: JO Date: 10/4/ East-West Street: Parthenia Street Projection Year: 2019 Peak Hour: PM Reviewed by: Project: Chatsworth MGA No. of Phases Opposed Ø'ing: N/S-1, E/W-2 or Both-3? Right Turns: FREE-1, NRTOR-2 or OLA-3? NB-- 0 SB-- 0 NB-- 0 SB-- 0 NB-- 0 SB-- 0 NB-- 0 SB-- 0 NB-- 0 SB-- 0 EB-- 0 WB-- 0 EB-- 0 WB-- 0 EB-- 0 WB-- 0 EB-- 0 WB-- 0 EB-- 0 WB-- 0 ATSAC-1 or ATSAC+ATCS-2? Override Capacity EXISTING CONDITION EXISTING PLUS PROJECT FUTURE CONDITION W/O PROJECT FUTURE CONDITION W/ PROJECT FUTURE W/ PROJECT W/ MITIGATION MOVEMENT No. of Lane Project Total Lane Added Total No. of Lane Added Total No. of Lane Added Total No. of Lane Volume Lanes Volume Traffic Volume Volume Volume Volume Lanes Volume Volume Volume Lanes Volume Volume Volume Lanes Volume Left Through Through-Right Right NORTHBOUND SOUTHBOUND EASTBOUND Left Through Through-Right Right Left Through Through-Right Right WESTBOUND Left Through Through-Right Right North-South: 576 North-South: 610 North-South: 653 North-South: 687 North-South: 670 CRITICAL VOLUMES East-West: 590 East-West: 590 East-West: 669 East-West: 669 East-West: 669 SUM: 1166 SUM: 1200 SUM: 1322 SUM: 1356 SUM: 1339 VOLUME/CAPACITY (V/C) RATIO: V/C LESS ATSAC/ATCS ADJUSTMENT: LEVEL OF SERVICE (LOS): B C C D C Version: 1i Beta; 8/4/2011 REMARKS: PROJECT IMPACT Change in v/c due to project: v/c after mitigation: Significant impacted? YES Fully mitigated? YES 10/3/2014-1:17 AM 1 6 winnetka parthenia
134 Level of Service Workheet (Circular 212 Method) I/S #: North-South Street: Winnetka Avenue Year of Count: 2013 Ambient Growth: (%): 1.5 Conducted by: JO Date: 10/4/ East-West Street: Roscoe Boulevard Projection Year: 2019 Peak Hour: AM Reviewed by: Project: Chatsworth MGA No. of Phases Opposed Ø'ing: N/S-1, E/W-2 or Both-3? Right Turns: FREE-1, NRTOR-2 or OLA-3? NB-- 0 SB-- 0 NB-- 0 SB-- 0 NB-- 0 SB-- 0 NB-- 0 SB-- 0 NB-- 0 SB-- 0 EB-- 0 WB-- 0 EB-- 0 WB-- 0 EB-- 0 WB-- 0 EB-- 0 WB-- 0 EB-- 0 WB-- 0 ATSAC-1 or ATSAC+ATCS-2? Override Capacity EXISTING CONDITION EXISTING PLUS PROJECT FUTURE CONDITION W/O PROJECT FUTURE CONDITION W/ PROJECT FUTURE W/ PROJECT W/ MITIGATION MOVEMENT No. of Lane Project Total Lane Added Total No. of Lane Added Total No. of Lane Added Total No. of Lane Volume Lanes Volume Traffic Volume Volume Volume Volume Lanes Volume Volume Volume Lanes Volume Volume Volume Lanes Volume Left Through Through-Right Right NORTHBOUND SOUTHBOUND EASTBOUND Left Through Through-Right Right Left Through Through-Right Right WESTBOUND Left Through Through-Right Right North-South: 574 North-South: 591 North-South: 669 North-South: 687 North-South: 670 CRITICAL VOLUMES East-West: 508 East-West: 516 East-West: 582 East-West: 594 East-West: 594 SUM: 1082 SUM: 1107 SUM: 1251 SUM: 1281 SUM: 1264 VOLUME/CAPACITY (V/C) RATIO: V/C LESS ATSAC/ATCS ADJUSTMENT: LEVEL OF SERVICE (LOS): B C D D D Version: 1i Beta; 8/4/2011 REMARKS: PROJECT IMPACT Change in v/c due to project: v/c after mitigation: Significant impacted? YES Fully mitigated? YES 10/3/2014-1:29 AM 1 7 winnetka roscoe
135 Level of Service Workheet (Circular 212 Method) I/S #: North-South Street: Winnetka Avenue Year of Count: 2013 Ambient Growth: (%): 1.5 Conducted by: JO Date: 10/4/ East-West Street: Roscoe Boulevard Projection Year: 2019 Peak Hour: PM Reviewed by: Project: Chatsworth MGA No. of Phases Opposed Ø'ing: N/S-1, E/W-2 or Both-3? Right Turns: FREE-1, NRTOR-2 or OLA-3? NB-- 0 SB-- 0 NB-- 0 SB-- 0 NB-- 0 SB-- 0 NB-- 0 SB-- 0 NB-- 0 SB-- 0 EB-- 0 WB-- 0 EB-- 0 WB-- 0 EB-- 0 WB-- 0 EB-- 0 WB-- 0 EB-- 0 WB-- 0 ATSAC-1 or ATSAC+ATCS-2? Override Capacity EXISTING CONDITION EXISTING PLUS PROJECT FUTURE CONDITION W/O PROJECT FUTURE CONDITION W/ PROJECT FUTURE W/ PROJECT W/ MITIGATION MOVEMENT No. of Lane Project Total Lane Added Total No. of Lane Added Total No. of Lane Added Total No. of Lane Volume Lanes Volume Traffic Volume Volume Volume Volume Lanes Volume Volume Volume Lanes Volume Volume Volume Lanes Volume Left Through Through-Right Right NORTHBOUND SOUTHBOUND EASTBOUND Left Through Through-Right Right Left Through Through-Right Right WESTBOUND Left Through Through-Right Right North-South: 648 North-South: 672 North-South: 724 North-South: 749 North-South: 733 CRITICAL VOLUMES East-West: 545 East-West: 545 East-West: 601 East-West: 601 East-West: 601 SUM: 1193 SUM: 1217 SUM: 1325 SUM: 1350 SUM: 1334 VOLUME/CAPACITY (V/C) RATIO: V/C LESS ATSAC/ATCS ADJUSTMENT: LEVEL OF SERVICE (LOS): C C D D D Version: 1i Beta; 8/4/2011 REMARKS: PROJECT IMPACT Change in v/c due to project: v/c after mitigation: Significant impacted? NO Fully mitigated? N/A 10/3/2014-1:23 AM 1 7 winnetka roscoe
136 Level of Service Workheet (Circular 212 Method) I/S #: North-South Street: Corbin Avenue Year of Count: 2013 Ambient Growth: (%): 1.5 Conducted by: JO Date: 10/4/ East-West Street: Plummer Street Projection Year: 2019 Peak Hour: AM Reviewed by: Project: Chatsworth MGA No. of Phases Opposed Ø'ing: N/S-1, E/W-2 or Both-3? Right Turns: FREE-1, NRTOR-2 or OLA-3? NB-- 0 SB-- 0 NB-- 0 SB-- 0 NB-- 0 SB-- 0 NB-- 0 SB-- 0 NB-- 0 SB-- 0 EB-- 0 WB-- 0 EB-- 0 WB-- 0 EB-- 0 WB-- 0 EB-- 0 WB-- 0 EB-- 0 WB-- 0 ATSAC-1 or ATSAC+ATCS-2? Override Capacity EXISTING CONDITION EXISTING PLUS PROJECT FUTURE CONDITION W/O PROJECT FUTURE CONDITION W/ PROJECT FUTURE W/ PROJECT W/ MITIGATION MOVEMENT No. of Lane Project Total Lane Added Total No. of Lane Added Total No. of Lane Added Total No. of Lane Volume Lanes Volume Traffic Volume Volume Volume Volume Lanes Volume Volume Volume Lanes Volume Volume Volume Lanes Volume Left Through Through-Right Right NORTHBOUND SOUTHBOUND EASTBOUND Left Through Through-Right Right Left Through Through-Right Right WESTBOUND Left Through Through-Right Right North-South: 863 North-South: 885 North-South: 962 North-South: 984 North-South: 838 CRITICAL VOLUMES East-West: 466 East-West: 497 East-West: 529 East-West: 560 East-West: 558 SUM: 1329 SUM: 1382 SUM: 1491 SUM: 1544 SUM: 1396 VOLUME/CAPACITY (V/C) RATIO: V/C LESS ATSAC/ATCS ADJUSTMENT: LEVEL OF SERVICE (LOS): C D D E D Version: 1i Beta; 8/4/2011 REMARKS: PROJECT IMPACT Change in v/c due to project: v/c after mitigation: Significant impacted? YES Fully mitigated? YES 10/3/2014-1:34 AM 1 8 corbin plummer
137 Level of Service Workheet (Circular 212 Method) I/S #: North-South Street: Corbin Avenue Year of Count: 2013 Ambient Growth: (%): 1.5 Conducted by: JO Date: 10/4/ East-West Street: Plummer Street Projection Year: 2019 Peak Hour: PM Reviewed by: Project: Chatsworth MGA No. of Phases Opposed Ø'ing: N/S-1, E/W-2 or Both-3? Right Turns: FREE-1, NRTOR-2 or OLA-3? NB-- 0 SB-- 0 NB-- 0 SB-- 0 NB-- 0 SB-- 0 NB-- 0 SB-- 0 NB-- 0 SB-- 0 EB-- 0 WB-- 0 EB-- 0 WB-- 0 EB-- 0 WB-- 0 EB-- 0 WB-- 0 EB-- 0 WB-- 0 ATSAC-1 or ATSAC+ATCS-2? Override Capacity EXISTING CONDITION EXISTING PLUS PROJECT FUTURE CONDITION W/O PROJECT FUTURE CONDITION W/ PROJECT FUTURE W/ PROJECT W/ MITIGATION MOVEMENT No. of Lane Project Total Lane Added Total No. of Lane Added Total No. of Lane Added Total No. of Lane Volume Lanes Volume Traffic Volume Volume Volume Volume Lanes Volume Volume Volume Lanes Volume Volume Volume Lanes Volume Left Through Through-Right Right NORTHBOUND SOUTHBOUND EASTBOUND Left Through Through-Right Right Left Through Through-Right Right WESTBOUND Left Through Through-Right Right North-South: 684 North-South: 708 North-South: 767 North-South: 791 North-South: 789 CRITICAL VOLUMES East-West: 563 East-West: 594 East-West: 638 East-West: 669 East-West: 668 SUM: 1247 SUM: 1302 SUM: 1405 SUM: 1460 SUM: 1457 VOLUME/CAPACITY (V/C) RATIO: V/C LESS ATSAC/ATCS ADJUSTMENT: LEVEL OF SERVICE (LOS): C C D D D Version: 1i Beta; 8/4/2011 REMARKS: PROJECT IMPACT Change in v/c due to project: v/c after mitigation: Significant impacted? YES Fully mitigated? NO 10/3/2014-1:39 AM 1 8 corbin plummer
138 Level of Service Workheet (Circular 212 Method) I/S #: North-South Street: Corbin Avenue Year of Count: 2013 Ambient Growth: (%): 1.5 Conducted by: JO Date: 10/4/ East-West Street: Prairie Street Projection Year: 2019 Peak Hour: AM Reviewed by: Project: Chatsworth MGA No. of Phases Opposed Ø'ing: N/S-1, E/W-2 or Both-3? Right Turns: FREE-1, NRTOR-2 or OLA-3? NB-- 0 SB-- 0 NB-- 0 SB-- 0 NB-- 0 SB-- 0 NB-- 0 SB-- 0 NB-- 0 SB-- 0 EB-- 0 WB-- 0 EB-- 0 WB-- 0 EB-- 0 WB-- 0 EB-- 0 WB-- 0 EB-- 0 WB-- 0 ATSAC-1 or ATSAC+ATCS-2? Override Capacity EXISTING CONDITION EXISTING PLUS PROJECT FUTURE CONDITION W/O PROJECT FUTURE CONDITION W/ PROJECT FUTURE W/ PROJECT W/ MITIGATION MOVEMENT No. of Lane Project Total Lane Added Total No. of Lane Added Total No. of Lane Added Total No. of Lane Volume Lanes Volume Traffic Volume Volume Volume Volume Lanes Volume Volume Volume Lanes Volume Volume Volume Lanes Volume Left Through Through-Right Right NORTHBOUND SOUTHBOUND EASTBOUND Left Through Through-Right Right Left Through Through-Right Right WESTBOUND Left Through Through-Right Right North-South: 925 North-South: 958 North-South: 1012 North-South: 1045 North-South: 1044 CRITICAL VOLUMES East-West: 102 East-West: 203 East-West: 139 East-West: 240 East-West: 199 SUM: 1027 SUM: 1161 SUM: 1151 SUM: 1285 SUM: 1243 VOLUME/CAPACITY (V/C) RATIO: V/C LESS ATSAC/ATCS ADJUSTMENT: LEVEL OF SERVICE (LOS): A B B C C Version: 1i Beta; 8/4/2011 REMARKS: PROJECT IMPACT Change in v/c due to project: v/c after mitigation: Significant impacted? YES Fully mitigated? NO 10/3/2014-2:15 AM 1 9 corbin prairie
139 Level of Service Workheet (Circular 212 Method) I/S #: North-South Street: Corbin Avenue Year of Count: 2013 Ambient Growth: (%): 1.5 Conducted by: JO Date: 10/4/ East-West Street: Prairie Street Projection Year: 2019 Peak Hour: PM Reviewed by: Project: Chatsworth MGA No. of Phases Opposed Ø'ing: N/S-1, E/W-2 or Both-3? Right Turns: FREE-1, NRTOR-2 or OLA-3? NB-- 0 SB-- 0 NB-- 0 SB-- 0 NB-- 0 SB-- 0 NB-- 0 SB-- 0 NB-- 0 SB-- 0 EB-- 0 WB-- 0 EB-- 0 WB-- 0 EB-- 0 WB-- 0 EB-- 0 WB-- 0 EB-- 0 WB-- 0 ATSAC-1 or ATSAC+ATCS-2? Override Capacity EXISTING CONDITION EXISTING PLUS PROJECT FUTURE CONDITION W/O PROJECT FUTURE CONDITION W/ PROJECT FUTURE W/ PROJECT W/ MITIGATION MOVEMENT No. of Lane Project Total Lane Added Total No. of Lane Added Total No. of Lane Added Total No. of Lane Volume Lanes Volume Traffic Volume Volume Volume Volume Lanes Volume Volume Volume Lanes Volume Volume Volume Lanes Volume Left Through Through-Right Right NORTHBOUND SOUTHBOUND EASTBOUND Left Through Through-Right Right Left Through Through-Right Right WESTBOUND Left Through Through-Right Right North-South: 505 North-South: 533 North-South: 585 North-South: 613 North-South: 612 CRITICAL VOLUMES East-West: 337 East-West: 442 East-West: 420 East-West: 525 East-West: 519 SUM: 842 SUM: 975 SUM: 1005 SUM: 1138 SUM: 1131 VOLUME/CAPACITY (V/C) RATIO: V/C LESS ATSAC/ATCS ADJUSTMENT: LEVEL OF SERVICE (LOS): A A A B B Version: 1i Beta; 8/4/2011 REMARKS: PROJECT IMPACT Change in v/c due to project: v/c after mitigation: Significant impacted? NO Fully mitigated? N/A 10/3/2014-1:43 AM 1 9 corbin prairie
140 Level of Service Workheet (Circular 212 Method) I/S #: North-South Street: Corbin Avenue Year of Count: 2013 Ambient Growth: (%): 1.5 Conducted by: JO Date: 10/4/ East-West Street: Nordhoff Place Projection Year: 2019 Peak Hour: AM Reviewed by: Project: Chatsworth MGA No. of Phases Opposed Ø'ing: N/S-1, E/W-2 or Both-3? Right Turns: FREE-1, NRTOR-2 or OLA-3? NB-- 0 SB-- 0 NB-- 0 SB-- 0 NB-- 0 SB-- 0 NB-- 0 SB-- 0 NB-- 0 SB-- 0 EB-- 0 WB-- 0 EB-- 0 WB-- 0 EB-- 0 WB-- 0 EB-- 0 WB-- 0 EB-- 0 WB-- 0 ATSAC-1 or ATSAC+ATCS-2? Override Capacity EXISTING CONDITION EXISTING PLUS PROJECT FUTURE CONDITION W/O PROJECT FUTURE CONDITION W/ PROJECT FUTURE W/ PROJECT W/ MITIGATION MOVEMENT No. of Lane Project Total Lane Added Total No. of Lane Added Total No. of Lane Added Total No. of Lane Volume Lanes Volume Traffic Volume Volume Volume Volume Lanes Volume Volume Volume Lanes Volume Volume Volume Lanes Volume Left Through Through-Right Right NORTHBOUND SOUTHBOUND EASTBOUND Left Through Through-Right Right Left Through Through-Right Right WESTBOUND Left Through Through-Right Right North-South: 516 North-South: 538 North-South: 586 North-South: 608 North-South: 607 CRITICAL VOLUMES East-West: 140 East-West: 140 East-West: 153 East-West: 166 East-West: 165 SUM: 656 SUM: 678 SUM: 739 SUM: 774 SUM: 772 VOLUME/CAPACITY (V/C) RATIO: V/C LESS ATSAC/ATCS ADJUSTMENT: LEVEL OF SERVICE (LOS): A A A A A Version: 1i Beta; 8/4/2011 REMARKS: PROJECT IMPACT Change in v/c due to project: v/c after mitigation: Significant impacted? NO Fully mitigated? N/A 10/3/2014-1:57 AM 1 10 corbin nordhoff place
141 Level of Service Workheet (Circular 212 Method) I/S #: North-South Street: Corbin Avenue Year of Count: 2013 Ambient Growth: (%): 1.5 Conducted by: JO Date: 10/4/ East-West Street: Nordhoff Place Projection Year: 2019 Peak Hour: PM Reviewed by: Project: Chatsworth MGA No. of Phases Opposed Ø'ing: N/S-1, E/W-2 or Both-3? Right Turns: FREE-1, NRTOR-2 or OLA-3? NB-- 0 SB-- 0 NB-- 0 SB-- 0 NB-- 0 SB-- 0 NB-- 0 SB-- 0 NB-- 0 SB-- 0 EB-- 0 WB-- 0 EB-- 0 WB-- 0 EB-- 0 WB-- 0 EB-- 0 WB-- 0 EB-- 0 WB-- 0 ATSAC-1 or ATSAC+ATCS-2? Override Capacity EXISTING CONDITION EXISTING PLUS PROJECT FUTURE CONDITION W/O PROJECT FUTURE CONDITION W/ PROJECT FUTURE W/ PROJECT W/ MITIGATION MOVEMENT No. of Lane Project Total Lane Added Total No. of Lane Added Total No. of Lane Added Total No. of Lane Volume Lanes Volume Traffic Volume Volume Volume Volume Lanes Volume Volume Volume Lanes Volume Volume Volume Lanes Volume Left Through Through-Right Right NORTHBOUND SOUTHBOUND EASTBOUND Left Through Through-Right Right Left Through Through-Right Right WESTBOUND Left Through Through-Right Right North-South: 576 North-South: 576 North-South: 651 North-South: 651 North-South: 651 CRITICAL VOLUMES East-West: 293 East-West: 307 East-West: 345 East-West: 369 East-West: 368 SUM: 869 SUM: 883 SUM: 996 SUM: 1020 SUM: 1019 VOLUME/CAPACITY (V/C) RATIO: V/C LESS ATSAC/ATCS ADJUSTMENT: LEVEL OF SERVICE (LOS): A A A A A Version: 1i Beta; 8/4/2011 REMARKS: PROJECT IMPACT Change in v/c due to project: v/c after mitigation: Significant impacted? NO Fully mitigated? N/A 10/3/2014-2:01 AM 1 10 corbin nordhoff place
142 Level of Service Workheet (Circular 212 Method) I/S #: North-South Street: Corbin Avenue Year of Count: 2013 Ambient Growth: (%): 1.5 Conducted by: JO Date: 10/4/ East-West Street: Nordhoff Street / Way Projection Year: 2019 Peak Hour: AM Reviewed by: Project: Chatsworth MGA No. of Phases Opposed Ø'ing: N/S-1, E/W-2 or Both-3? Right Turns: FREE-1, NRTOR-2 or OLA-3? NB-- 0 SB-- 0 NB-- 0 SB-- 0 NB-- 0 SB-- 0 NB-- 0 SB-- 0 NB-- 0 SB-- 0 EB-- 0 WB-- 0 EB-- 0 WB-- 0 EB-- 0 WB-- 0 EB-- 0 WB-- 0 EB-- 0 WB-- 0 ATSAC-1 or ATSAC+ATCS-2? Override Capacity EXISTING CONDITION EXISTING PLUS PROJECT FUTURE CONDITION W/O PROJECT FUTURE CONDITION W/ PROJECT FUTURE W/ PROJECT W/ MITIGATION MOVEMENT No. of Lane Project Total Lane Added Total No. of Lane Added Total No. of Lane Added Total No. of Lane Volume Lanes Volume Traffic Volume Volume Volume Volume Lanes Volume Volume Volume Lanes Volume Volume Volume Lanes Volume Left Through Through-Right Right NORTHBOUND SOUTHBOUND EASTBOUND Left Through Through-Right Right Left Through Through-Right Right WESTBOUND Left Through Through-Right Right North-South: 615 North-South: 624 North-South: 711 North-South: 719 North-South: 719 CRITICAL VOLUMES East-West: 412 East-West: 418 East-West: 604 East-West: 613 East-West: 613 SUM: 1027 SUM: 1042 SUM: 1315 SUM: 1332 SUM: 1332 VOLUME/CAPACITY (V/C) RATIO: V/C LESS ATSAC/ATCS ADJUSTMENT: LEVEL OF SERVICE (LOS): B B D D D Version: 1i Beta; 8/4/2011 REMARKS: PROJECT IMPACT Change in v/c due to project: v/c after mitigation: Significant impacted? NO Fully mitigated? N/A 10/3/2014-2:07 AM 1 11 corbin nordhoff st
143 Level of Service Workheet (Circular 212 Method) I/S #: North-South Street: Corbin Avenue Year of Count: 2013 Ambient Growth: (%): 1.5 Conducted by: JO Date: 10/4/ East-West Street: Nordhoff Street / Way Projection Year: 2019 Peak Hour: PM Reviewed by: Project: Chatsworth MGA No. of Phases Opposed Ø'ing: N/S-1, E/W-2 or Both-3? Right Turns: FREE-1, NRTOR-2 or OLA-3? NB-- 0 SB-- 0 NB-- 0 SB-- 0 NB-- 0 SB-- 0 NB-- 0 SB-- 0 NB-- 0 SB-- 0 EB-- 0 WB-- 0 EB-- 0 WB-- 0 EB-- 0 WB-- 0 EB-- 0 WB-- 0 EB-- 0 WB-- 0 ATSAC-1 or ATSAC+ATCS-2? Override Capacity EXISTING CONDITION EXISTING PLUS PROJECT FUTURE CONDITION W/O PROJECT FUTURE CONDITION W/ PROJECT FUTURE W/ PROJECT W/ MITIGATION MOVEMENT No. of Lane Project Total Lane Added Total No. of Lane Added Total No. of Lane Added Total No. of Lane Volume Lanes Volume Traffic Volume Volume Volume Volume Lanes Volume Volume Volume Lanes Volume Volume Volume Lanes Volume Left Through Through-Right Right NORTHBOUND SOUTHBOUND EASTBOUND Left Through Through-Right Right Left Through Through-Right Right WESTBOUND Left Through Through-Right Right North-South: 586 North-South: 598 North-South: 657 North-South: 669 North-South: 668 CRITICAL VOLUMES East-West: 404 East-West: 409 East-West: 523 East-West: 532 East-West: 532 SUM: 990 SUM: 1007 SUM: 1180 SUM: 1201 SUM: 1200 VOLUME/CAPACITY (V/C) RATIO: V/C LESS ATSAC/ATCS ADJUSTMENT: LEVEL OF SERVICE (LOS): A B C C C Version: 1i Beta; 8/4/2011 REMARKS: PROJECT IMPACT Change in v/c due to project: v/c after mitigation: Significant impacted? NO Fully mitigated? N/A 10/3/2014-2:10 AM 1 11 corbin nordhoff st
144 APPENDIX F RELATED PROJECTS FLOW MAPS
145
146
147 APPENDIX G PROJECT DRIVEWAY DATA
148
149 Appendix H TRAFFIC SIGNAL WARRANT FOR MGA WINNETKA AVENUE DRIVEWAY
150 . The California Manual on Uniform Traffic Control Devices (MUTCD) is a document published by the State of California, Department of Transportation and issued to adopt uniform standards and specification for all official traffic control devices in California, in accordance with Section of the California Vehicle Code. This California MUTCD incorporates Federal Highway Administration s MUTCD (FHWA) of the United States Department of Transportation (USDOT). Traffic Signals Warrant 3 - Peak Hour The Peak Hour signal warrant is intended for use at a location where traffic conditions are such that for a minimum of 1 hour of an average day, the minor street traffic suffers undue delay when entering or crossing the major street. Standard: The need for a traffic control signal shall be considered if an engineering study finds that the criteria in either of the following two categories are met: A. If all three of the following conditions exist for the same 1 hour (any four consecutive 15- muinute periods) of an average day: 1. The total stopped time delay experienced by the traffic on one minor street approach (one direction only) controlled by a stop sign equals or exceeds: 4 vehicle hours for a one lane approach; or 5 vehicles hours for a two lane approach, and 2. The volume on the same minor street approach (one direction only) equals or exceeds 100 vehicles per hour for one moving lane of traffic or 150 vehicles per hour for two moving lanes, and 3. The total entering volume serviced during the hour equals or exceeds 650 vehicles per hour for intersections with three approaches or 800 vehicles per hour for intersections with four or more approaches. The plotted point representing the vehicles per hour on the major street (total of both approaches) and the corresponding vehicles per hour on the higher volume minor street approach (one direction only) for 1 hour (any four consecutive 15-minute periods) of an average day falls above the applicable curve in Figure 4C-3 for the existing combination of approach lanes.
151
152
153 APPENDIX H City Los Angeles 2010 Bicycle Plan Study Area Map
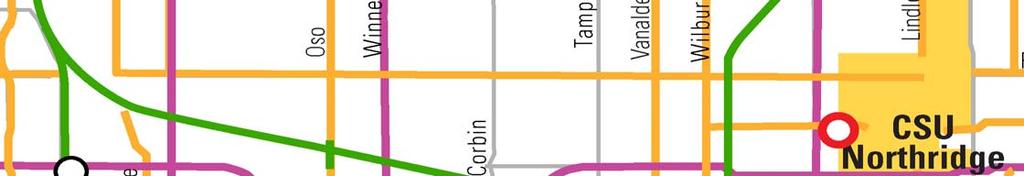
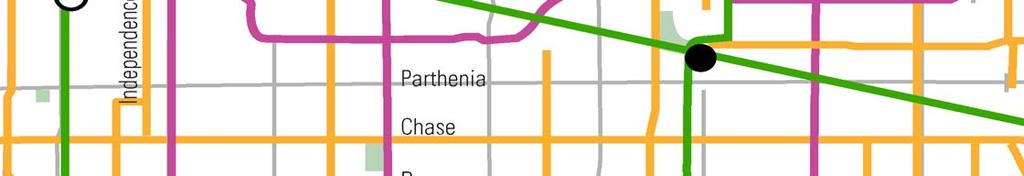
154
2. Valley Circle Boulevard/Andora Avenue/Baden Avenue and Lassen Street
 IV.J TRANSPORTATION 1. INTRODUCTION This section presents an overview of the existing traffic and circulation system in and surrounding the project site. This section also discusses the potential impacts
Traffic Impact Analysis 5742 BEACH BOULEVARD MIXED USE PROJECT
 Traffic Impact Analysis 5742 BEACH BOULEVARD MIXED USE PROJECT CITY OF BUENA PARK Prepared by Project No. 14139 000 April 17 th, 2015 DKS Associates Jeffrey Heald, P.E. Rohit Itadkar, T.E. 2677 North Main
IV. ENVIRONMENTAL IMPACT ANALYSIS N. TRANSPORTATION AND TRAFFIC
 IV. ENVIRONMENTAL IMPACT ANALYSIS N. TRANSPORTATION AND TRAFFIC The following section summarizes the information provided in the traffic report entitled Traffic Impact Analysis for a Proposed Residential
IV. ENVIRONMENTAL IMPACT ANALYSIS L. TRANSPORTATION/TRAFFIC
 IV. ENVIRONMENTAL IMPACT ANALYSIS L. TRANSPORTATION/TRAFFIC INTRODUCTION The following section summarizes the information provided in the traffic report entitled Traffic Impact Analysis for a Proposed
Address Land Use Approximate GSF
 M E M O R A N D U M To: Kara Brewton, From: Nelson\Nygaard Date: March 26, 2014 Subject: Brookline Place Shared Parking Analysis- Final Memo This memorandum presents a comparative analysis of expected
King Soopers #116 Thornton, Colorado
 Traffic Impact Study King Soopers #116 Thornton, Colorado Prepared for: Galloway & Company, Inc. T R A F F I C I M P A C T S T U D Y King Soopers #116 Thornton, Colorado Prepared for Galloway & Company
TRANSPORTATION STUDY FOR THE 8899 BEVERLY BOULEVARD PROJECT
 DRAFT TRANSPORTATION STUDY FOR THE 8899 BEVERLY BOULEVARD PROJECT WEST HOLLYWOOD, CALIFORNIA NOVEMBER 2013 PREPARED FOR BEVERLY BOULEVARD ASSOCIATION PREPARED BY DRAFT TRANSPORTATION STUDY FOR THE 8899
Appendix Q Traffic Study
 Appendices Appendix Q Traffic Study Crummer Site Subdivision Draft EIR City of Malibu Appendices This page intentionally left blank. The Planning Center April 2013 TRAFFIC IMPACT ANALYSIS Photo z here
Escondido Marriott Hotel and Mixed-Use Condominium Project TRAFFIC IMPACT ANALYSIS REPORT
 Escondido Marriott Hotel and Mixed-Use Condominium Project TRAFFIC IMPACT ANALYSIS REPORT Prepared for Phelps Program Management 420 Sixth Avenue, Greeley, CO 80632 Prepared by 5050 Avenida Encinas, Suite
EXECUTIVE SUMMARY. The following is an outline of the traffic analysis performed by Hales Engineering for the traffic conditions of this project.
 EXECUTIVE SUMMARY This study addresses the traffic impacts associated with the proposed Shopko redevelopment located in Sugarhouse, Utah. The Shopko redevelopment project is located between 1300 East and
Appendix C. Traffic Study
 Appendix C Traffic Study TABLE OF CONTENTS SECTION Executive Summary PAGE 1.0 Introduction... 1 1.1 Scope of Work... 1 1.2 Study Area... 2 2.0 Project Description... 3 2.1 Site Access... 4 2.2 Pedestrian
APPENDIX B Traffic Analysis
 APPENDIX B Traffic Analysis Rim of the World Unified School District Reconfiguration Prepared for: Rim of the World School District 27315 North Bay Road, Blue Jay, CA 92317 Prepared by: 400 Oceangate,
IV. ENVIRONMENTAL IMPACT ANALYSIS
 IV. ENVIRONMENTAL IMPACT ANALYSIS J. TRANSPORTATION AND CIRCULATION This section presents the findings of the traffic study for the proposed project prepared by Crain & Associates of Southern California
TABLE OF CONTENTS SECTION PAGE. Executive Summary... xii
 TABLE OF CONTENTS SECTION PAGE Executive Summary... xii 1.0 Introduction... 1 1.1 Study Area... 2 1.2 Traffic Impact Analysis Scenarios... 4 1.3 Study Area - City of Orange... 4 2.0 Project Description
Traffic Impact Study Speedway Gas Station Redevelopment
 Traffic Impact Study Speedway Gas Station Redevelopment Warrenville, Illinois Prepared For: Prepared By: April 11, 2018 Table of Contents 1. Introduction... 1 2. Existing Conditions... 4 Site Location...
IV. ENVIRONMENTAL IMPACT ANALYSIS B. TRAFFIC AND CIRCULATION
 IV. ENVIRONMENTAL IMPACT ANALYSIS B. TRAFFIC AND CIRCULATION 1. INTRODUCTION This section is based on the technical report, Traffic Study for 10131 Constellation Boulevard Residential Project, prepared
IV. ENVIRONMENTAL IMPACT ANALYSIS M. TRANSPORTATION AND TRAFFIC
 IV. ENVIRONMENTAL IMPACT ANALYSIS M. TRANSPORTATION AND TRAFFIC INTRODUCTION This section of the (Draft EIR) addresses the subject of traffic and transportation with respect to the proposed (Project or
2.0 Development Driveways. Movin Out June 2017
 Movin Out June 2017 1.0 Introduction The proposed Movin Out development is a mixed use development in the northeast quadrant of the intersection of West Broadway and Fayette Avenue in the City of Madison.
Appendix G Traffic and Parking Report
 Appendix G Traffic and Parking Report TABLE OF CONTENTS SECTION PAGE Executive Summary... v 1.0 Introduction... 1 1.1 Study Area... 3 2.0 Project Description... 4 2.1 Site Location... 4 2.2 Existing Project
INDUSTRIAL DEVELOPMENT
 INDUSTRIAL DEVELOPMENT Traffic Impact Study Plainfield, Illinois August 2018 Prepared for: Seefried Industrial Properties, Inc. TABLE OF CONTENTS Executive Summary 2 Introduction 3 Existing Conditions
4.14 TRANSPORTATION AND CIRCULATION
 4.14 TRANSPORTATION AND CIRCULATION 4.14.1 Summary Table 4.14-1 summarizes the identified environmental impacts, proposed mitigation measures, and residual impacts of the proposed project with regard to
Traffic Impact Statement (TIS)
") Traffic Impact Statement (TIS) Vincentian PUDA Collier County, FL 10/18/2013 Prepared for: Global Properties of Naples Prepared by: Trebilcock Consulting Solutions, PA 2614 Tamiami Trail N, Suite 615 1205
Traffic Impact Statement (TIS) Vincentian PUDA Collier County, FL 10/18/2013 Prepared for: Global Properties of Naples Prepared by: Trebilcock Consulting Solutions, PA 2614 Tamiami Trail N, Suite 615 1205
APPENDIX C-2. Traffic Study Supplemental Analysis Memo
 APPENDIX C-2 Traffic Study Supplemental Analysis Memo The Mobility Group Transportation Strategies & Solutions Memorandum To: From: Subject: Tomas Carranza, LADOT Matthew Simons Traffic Review - Revised
TRANSPORTATION 1. INTRODUCTION
 IV.F TRANSPORTATION 1. INTRODUCTION This section evaluates potential impacts associated with Project-related traffic, circulation, and access. The analysis summarizes the findings of the traffic study
IRSCH REEN Hirsch/Green Transportation Consulting, Inc.
 IRSCH REEN Hirsch/Green Transportation Consulting, Inc. February 6, 2013 Mr. David Weil Director of Finance St. Matthew s Parish School 1031 Bienveneda Avenue Pacific Palisades, California 90272 RE: Trip
Transportation & Traffic Engineering
 Transportation & Traffic Engineering 1) Project Description This report presents a summary of findings for a Traffic Impact Analysis (TIA) performed by A+ Engineering, Inc. for the Hill Country Family
Trip Generation & Parking Occupancy Data Collection: Grocery Stores Student Chapter of Institute of Transportation Engineers at UCLA Spring 2014
 Trip Generation & Parking Occupancy Data Collection: Grocery Stores Student Chapter of Institute of Transportation Engineers at UCLA Spring 2014 Page 1 Introduction The UCLA Institute of Transportation
Volume 1 Traffic Impact Analysis Turtle Creek Boulevard Dallas, Texas. Kimley-Horn and Associates, Inc. Dallas, Texas.
 Volume 1 Traffic Impact Analysis 2727 Dallas, Texas June 18, 2018 Kimley-Horn and Associates, Inc. Dallas, Texas Project #064523000 Registered Firm F-928 Traffic Impact Analysis 2727 Dallas, Texas Prepared
TIMBERVINE TRANSPORTATION IMPACT STUDY FORT COLLINS, COLORADO JANUARY Prepared for:
 TIMBERVINE TRANSPORTATION IMPACT STUDY FORT COLLINS, COLORADO JANUARY 2014 Prepared for: Hartford Companies 1218 W. Ash Street Suite A Windsor, Co 80550 Prepared by: DELICH ASSOCIATES 2272 Glen Haven Drive
Section 5.8 Transportation and Traffic
 Section 5.8 Transportation and Traffic 5.8 TRANSPORTATION AND TRAFFIC Generous This Section is based on the Topgolf Specific Plan Traffic Impact Analysis (RK Engineering Group, Inc., October 31, 2016);
APPENDIX TR-1 PARKING AND QUEUING ASSESSMENT
 APPENDIX TR-1 PARKING AND QUEUING ASSESSMENT Overland Overland Traffic Consultants, Traffic Consultants, Inc. Inc. Overland Traffic Consultants 952 Manhattan Beach Boulevard, Suite #100 Manhattan Beach,
Table of Contents. Traffic Impact Analysis Capital One Building at Schilling Place
 Traffic Impact Analysis Capital One Building at Schilling Place Table of Contents Executive Summary... 1 1. Introduction... 4 2. Project Description... 4 3. Background Information... 4 4. Study Scope...
Lacey Gateway Residential Phase 1
 Lacey Gateway Residential Phase Transportation Impact Study April 23, 203 Prepared for: Gateway 850 LLC 5 Lake Bellevue Drive Suite 02 Bellevue, WA 98005 Prepared by: TENW Transportation Engineering West
Traffic Impact Analysis. Alliance Cole Avenue Residential Site Dallas, Texas. Kimley-Horn and Associates, Inc. Dallas, Texas.
 Traffic Impact Analysis Alliance Cole Avenue Residential Site Dallas, Texas February 15, 2018 Kimley-Horn and Associates, Inc. Dallas, Texas Project #064524900 Registered Firm F-928 Traffic Impact Analysis
TRAFFIC PARKING ANALYSIS
 TRAFFIC PARKING ANALYSIS NAPA FLEA MARKET COUNTY OF NAPA Prepared for: Tom Harding Napa-Vallejo Flea Market 33 Kelly Road American Canyon, CA 9453 Prepared by: 166 Olympic Boulevard, Suite 21 Walnut Creek,
MONTEREY BAY AQUARIUM RESEARCH INSTITUTE (MBARI) MASTER PLAN UPDATE MOSS LANDING, CALIFORNIA
 MASTER PLAN UPDATE MOSS LANDING, CALIFORNIA") MONTEREY BAY AQUARIUM RESEARCH INSTITUTE (MBARI) MASTER PLAN UPDATE MOSS LANDING, CALIFORNIA TRAFFIC IMPACT ANALYSIS Administrative Draft Report Prepared For Monterey Bay Aquarium Research Institute Moss
MONTEREY BAY AQUARIUM RESEARCH INSTITUTE (MBARI) MASTER PLAN UPDATE MOSS LANDING, CALIFORNIA TRAFFIC IMPACT ANALYSIS Administrative Draft Report Prepared For Monterey Bay Aquarium Research Institute Moss
Table of Contents INTRODUCTION... 3 PROJECT STUDY AREA Figure 1 Vicinity Map Study Area... 4 EXISTING CONDITIONS... 5 TRAFFIC OPERATIONS...
 Crosshaven Drive Corridor Study City of Vestavia Hills, Alabama Table of Contents INTRODUCTION... 3 PROJECT STUDY AREA... 3 Figure 1 Vicinity Map Study Area... 4 EXISTING CONDITIONS... 5 TRAFFIC OPERATIONS...
appendix 4: Parking Management Study, Phase II
 appendix 4: Parking Management Study, Phase II A4-1 A4-2 Eastlake Parking Management Study Final Phase 2 Report Future Parking Demand & Supply January 6, 2017 Submitted by Denver Corp Center III 7900 E.
Oakbrook Village Plaza City of Laguna Hills
 Oakbrook Village Plaza City of Laguna Hills Traffic Impact Analysis Prepared by: HDR Engineering 3230 El Camino Real, Suite 200 Irvine, CA 92602 October 2012 Revision 3 D-1 Oakbrook Village Plaza Laguna
Traffic Impact Study for the proposed. Town of Allegany, New York. August Project No Prepared For:
 Appendix B SRF Traffic Study (Revised November 2005) Draft Environmental Impact Statement University Commons Town of Allegany, Cattaraugus County, NY December 2005 Traffic Impact Study for the proposed
Table Existing Traffic Conditions for Arterial Segments along Construction Access Route. Daily
 5.8 TRAFFIC, ACCESS, AND CIRCULATION This section describes existing traffic conditions in the project area; summarizes applicable regulations; and analyzes the potential traffic, access, and circulation
CHAPTER 9: VEHICULAR ACCESS CONTROL Introduction and Goals Administration Standards
 9.00 Introduction and Goals 9.01 Administration 9.02 Standards 9.1 9.00 INTRODUCTION AND GOALS City streets serve two purposes that are often in conflict moving traffic and accessing property. The higher
MINERVA PARK SITE TRAFFIC IMPACT STUDY M/I HOMES. September 2, 2015
 5500 New Albany Road Columbus, Ohio 43054 Phone: 614.775.4500 Fax: 614.775.4800 Toll Free: 1-888-775-EMHT emht.com 2015-1008 MINERVA PARK SITE TRAFFIC IMPACT STUDY M/I HOMES September 2, 2015 Engineers
Traffic Engineering Study
 Traffic Engineering Study Bellaire Boulevard Prepared For: International Management District Technical Services, Inc. Texas Registered Engineering Firm F-3580 November 2009 Executive Summary has been requested
Construction Realty Co.
 MEMORANDUM TO: FROM : Jeff Pickus Construction Realty Co. Luay R. Aboona, PE Principal 9575 West Higgins Road, Suite 400 Rosemont, Illinois 60018 p: 847-518-9990 f: 847-518-9987 DATE: May 22, 2014 SUBJECT:
L1TILE BEARS DAY CARE TRANSPORTATION IMPACT STUDY FORT COLLINS, COLORADO MAY Prepared for:
 L1TILE BEARS DAY CARE TRANSPORTATION IMPACT STUDY FORT COLLINS, COLORADO MAY 2012 Prepared for: Hillside Construction, Inc. 216 Hemlock Street, Suite B Fort Collins, CO 80534 Prepared by: DELICH ASSOCIATES
APPENDIX C1 TRAFFIC ANALYSIS DESIGN YEAR TRAFFIC ANALYSIS
 APPENDIX C1 TRAFFIC ANALYSIS DESIGN YEAR TRAFFIC ANALYSIS DESIGN YEAR TRAFFIC ANALYSIS February 2018 Highway & Bridge Project PIN 6754.12 Route 13 Connector Road Chemung County February 2018 Appendix
4.7 Construction Surface Transportation
 4.7 Construction Surface Transportation 4.7.1 Introduction The traffic analysis presented in this section addresses the construction traffic impacts specific to the proposed Project. The construction traffic
Los Angeles Mission College Facilities Master Plan Draft Program Environmental Impact Report 3.13 TRANSPORTATION / TRAFFIC
 3.13 TRANSPORTATION / TRAFFIC As a result of the analysis undertaken in the Initial Study for the Los Angeles Mission College Facilities Master Plan, the (LACCD) determined that the proposed project may
IV. ENVIRONMENTAL IMPACT ANALYSIS K.2. PARKING
 IV. ENVIRONMENTAL IMPACT ANALYSIS K.2. PARKING ENVIRONMENTAL SETTING The following analysis summarizes the findings and conclusions of the Traffic Analysis (Traffic Study), prepared by The Mobility Group,
LAWRENCE TRANSIT CENTER LOCATION ANALYSIS 9 TH STREET & ROCKLEDGE ROAD / 21 ST STREET & IOWA STREET LAWRENCE, KANSAS
 LAWRENCE TRANSIT CENTER LOCATION ANALYSIS 9 TH STREET & ROCKLEDGE ROAD / 21 ST STREET & IOWA STREET LAWRENCE, KANSAS TRAFFIC IMPACT STUDY FEBRUARY 214 OA Project No. 213-542 TABLE OF CONTENTS 1. INTRODUCTION...
Trip Generation and Parking Study New Californian Apartments, Berkeley
 Trip Generation and Parking Study New Californian Apartments, Berkeley Institute of Transportation Engineers University of California, Berkeley Student Chapter Spring 2012 Background The ITE Student Chapter
3.8 TRANSPORTATION, CIRCULATION AND PARKING
 3.8 TRANSPORTATION, CIRCULATION AND PARKING This section provides an overview of traffic, circulation and parking impacts and evaluates the construction and operational impacts associated with the Proposed
TRAFFIC IMPACT ANALYSIS FOR. McDONALD S RESTAURANT IN CARMICAEL Sacramento County, CA. Prepared For:
 TRAFFIC IMPACT ANALYSIS FOR McDONALD S RESTAURANT IN CARMICAEL Sacramento County, CA Prepared For: McDonald s USA, LLC Pacific Sierra Region 2999 Oak Road, Suite 900 Walnut Creek, CA 94597 Prepared By:
Parks and Transportation System Development Charge Methodology
 City of Sandy Parks and Transportation System Development Charge Methodology March, 2016 Background In order to implement a City Council goal the City of Sandy engaged FCS Group in January of 2015 to update
Date: February 7, 2017 John Doyle, Z-Best Products Robert Del Rio. T.E. Z-Best Traffic Operations and Site Access Analysis
 Memorandum Date: February 7, 07 To: From: Subject: John Doyle, Z-Best Products Robert Del Rio. T.E. Z-Best Traffic Operations and Site Access Analysis Introduction Hexagon Transportation Consultants, Inc.
The major roadways in the study area are State Route 166 and State Route 33, which are shown on Figure 1-1 and described below:
 3.5 TRAFFIC AND CIRCULATION 3.5.1 Existing Conditions 3.5.1.1 Street Network DRAFT ENVIRONMENTAL IMPACT REPORT The major roadways in the study area are State Route 166 and State Route 33, which are shown
Trip Generation and Parking Utilization Data Collection at Mini-Mart with Gas Station
 Trip Generation and Parking Utilization Data Collection at Mini-Mart with Gas Station Final Report 2013 ITE District 6 - Data Collection Project Institute of Transportation Engineers Student Chapter at
BARRHAVEN FELLOWSHIP CRC 3058 JOCKVALE ROAD OTTAWA, ONTARIO TRANSPORTATION BRIEF. Prepared for:
 BARRHAVEN FELLOWSHIP CRC 3058 JOCKVALE ROAD OTTAWA, ONTARIO TRANSPORTATION BRIEF Prepared for: Barrhaven Fellowship CRC 3058 Jockvale Road Ottawa, ON K2J 2W7 December 7, 2016 116-649 Report_1.doc D. J.
IV. ENVIRONMENTAL IMPACT ANALYSIS J. TRANSPORTATION AND TRAFFIC
 IV. ENVIRONMENTAL IMPACT ANALYSIS J. TRANSPORTATION AND TRAFFIC This Section summarizes the information provided in the Traffic Study for the Santa Monica College Bundy Campus Master Plan (Traffic Study),
West Hills Shopping Centre Lowe s Expansion Traffic Impact Study
 West Hills Shopping Centre Lowe s Expansion Traffic Impact Study Prepared for: Armel Corporation January 2015 Paradigm Transportation Solutions Ltd. 22 King Street South, Suite 300 Waterloo ON N2J 1N8
TRANSPORTATION REVIEW
 TRANSPORTATION REVIEW - PROPOSED MIX OF LAND USES IS CONSISTENT WITH THE CITY S UNDER THE GRANVILLE BRIDGE POLICIES THAT AIM TO MEET NEIGHBOURING RESIDENTS SHOPPING NEEDS AND REDUCE RELIANCE ON AUTOMOBILE
Executive Summary. Draft Environmental Impact Statement/Environmental Impact Report ES-1
 Executive Summary Introduction The Eastside Transit Corridor Phase 2 Project is a vital public transit infrastructure investment that would provide a transit connection to the existing Metro Gold Line
IV. ENVIRONMENTAL IMPACT ANALYSIS C. TRAFFIC CIRCULATION AND PARKING
 IV. ENVIRONMENTAL IMPACT ANALYSIS C. TRAFFIC CIRCULATION AND PARKING 1. INTRODUCTION This section is based on the technical report Traffic Impact Study Health Sciences Campus Project, City of Los Angeles,
TRAFFIC IMPACT ANALYSIS
 TRAFFIC IMPACT ANALYSIS Emerald Isle Commercial Development Prepared by SEPI Engineering & Construction Prepared for Ark Consulting Group, PLLC March 2016 I. Executive Summary A. Site Location The Emerald
Mercer Island Center for the Arts Parking Management Plan
 Parking Stalls Mercer Island Center for the Arts Parking Management Plan June 15, 2016 This Parking Management Plan (P) covers all tenants at the Mercer Island Center for the Arts (MICA) campus, including
Proposed location of Camp Parkway Commerce Center. Vicinity map of Camp Parkway Commerce Center Southampton County, VA
 Proposed location of Camp Parkway Commerce Center Vicinity map of Camp Parkway Commerce Center Southampton County, VA Camp Parkway Commerce Center is a proposed distribution and industrial center to be
Service Quality: Higher Ridership: Very Affordable: Image:
 Over the past decade, much attention has been placed on the development of Bus Rapid Transit (BRT) systems. These systems provide rail-like service, but with buses, and are typically less expensive to
Alpine Highway to North County Boulevard Connector Study
 Alpine Highway to North County Boulevard Connector Study prepared by Avenue Consultants March 16, 2017 North County Boulevard Connector Study March 16, 2017 Table of Contents 1 Summary of Findings... 1
TRANSPORTATION 1. INTRODUCTION 2. METHODOLOGY
 IV.K TRANSPORTATION 1. INTRODUCTION This section provides an analysis of potential impacts associated with traffic, parking, and access. The analysis provides an overview of existing traffic conditions
Traffic Impact Analysis for 2171 Rosecrans Avenue
 Traffic Impact Analysis for 2171 Rosecrans Avenue Prepared for: Continental Development Corporation Revised May 2016 LA16-2831 Prepared by: Fehr & Peers 600 Wilshire Blvd, Suite 1050 Los Angeles, CA 90017
MILLERSVILLE PARK TRAFFIC IMPACT ANALYSIS ANNE ARUNDEL COUNTY, MARYLAND
 MILLERSVILLE PARK TRAFFIC IMPACT ANALYSIS ANNE ARUNDEL COUNTY, MARYLAND Prepared for: Department of Public Works Anne Arundel County Prepared by: URS Corporation 4 North Park Drive, Suite 3 Hunt Valley,
Develop ground transportation improvements to make the Airport a multi-modal regional
 Project Overview TRANSPORTATION IMPROVEMENTS WHAT ARE THE PROJECT GOALS? Transportation transportation hub. Develop ground transportation improvements to make the Airport a multi-modal regional Land Use
DEVELOPMENT PROPERTY 1627 MAXIME STREET CITY OF OTTAWA TRANSPORTATION OVERVIEW. Prepared for: Subhas Bhargava. July 9, Overview_1.
 DEVELOPMENT PROPERTY 1627 MAXIME STREET CITY OF OTTAWA TRANSPORTATION OVERVIEW Prepared for: Subhas Bhargava July 9, 2015 115-620 Overview_1.doc D. J. Halpenny & Associates Ltd. Consulting Transportation
Traffic Impact Study for Proposed Olive Boulevard Development
 Traffic Impact Study for Proposed 11330 Olive Boulevard Development Creve Coeur, Missouri July 7, 2017 Prepared For: 11330 Olive Boulevard Development 11330 Olive Boulevard Creve Coeur, Missouri 63141
Appendix B Traffic Impact Analysis, Asphalt Plant No. 1 Replacement and Modernization
 Appendix B Traffic Impact Analysis, Asphalt Plant No. 1 Replacement and Modernization REPORT Traffic Impact Analysis, Asphalt Plant No. 1 Replacement and Modernization Prepared for City of Los Angeles
BERKELEY DOWNTOWN AREA PLAN PROGRAM ENVIRONMENTAL IMPACT REPORT TRAFFIC IMPACT ANALYSIS
 BERKELEY DOWNTOWN AREA PLAN PROGRAM ENVIRONMENTAL IMPACT REPORT TRAFFIC IMPACT ANALYSIS Prepared for: City of Berkeley Prepared by: REVISED JANUARY 9, 2009 Berkeley Downtown Area Plan Program EIR Traffic
MERIVALE PRIORITY SQUARE 2852 MERIVALE ROAD CITY OF OTTAWA TRANSPORTATION BRIEF. Prepared for: ONT Inc. 25 Winding Way Nepean, Ontario K2C 3H1
 MERIVALE PRIORITY SQUARE 2852 MERIVALE ROAD CITY OF OTTAWA TRANSPORTATION BRIEF Prepared for: 2190986ONT Inc. 25 Winding Way Nepean, Ontario K2C 3H1 October 6, 2010 110-502 Report_1.doc D. J. Halpenny
Traffic Impact Analysis West Street Garden Plots Improvements and DuPage River Park Garden Plots Development Naperville, Illinois
 Traffic Impact Analysis West Street Garden Plots Improvements and DuPage River Park Garden Plots Development Naperville, Illinois Submitted by April 9, 2009 Introduction Kenig, Lindgren, O Hara, Aboona,
Impacts to street segments were analyzed based on procedures detailed in the Highway Capacity Manual for levels of service related to roadways.
 4.7 Transportation and Circulation This report documents the results of a study of the potential traffic impacts created by the Whittier Main Oil Field Development Project. The study is included as Appendix
Craig Scheffler, P.E., PTOE HNTB North Carolina, P.C. HNTB Project File: Subject
 TECHNICAL MEMORANDUM To Kumar Neppalli Traffic Engineering Manager Town of Chapel Hill From Craig Scheffler, P.E., PTOE HNTB North Carolina, P.C. Cc HNTB Project File: 38435 Subject Obey Creek TIS 2022
700 University Avenue Mixed-Use Development. Traffic Impact Analysis
 700 University Avenue Mixed-Use Development Traffic Impact Analysis January 20, 2006 Prepared by 700 UNIVERSITY AVENUE MIXED- USE DEVELOPMENT TRAFFIC IMPACT STUDY Table of Contents 1.0 Executive Summary...
TALMONT TOWNHOMES MADISON KENNETH SPA TRAFFIC IMPACT STUDY. Sacramento, CA. Prepared For: MBK Homes. Prepared By:
 TALMONT TOWNHOMES MADISON KENNETH SPA TRAFFIC IMPACT STUDY Sacramento, CA Prepared For: MBK Homes Prepared By: KD Anderson & Associates 3853 Taylor Road, Suite G Loomis, California 95650 (916) 660-1555
HUMC/Mountainside Hospital Redevelopment Plan
 Traffic and Parking Analysis HUMC/Mountainside Hospital Redevelopment Plan in Glen Ridge Borough and Montclair Township PREPARED FOR H2M 119 Cherry Hill Road, Suite 110 Parsippany, NJ 07054 862.207.5900
Appendix B Traffic Impact Analysis, Asphalt Plant No. 1 Replacement and Modernization
 Appendix B Traffic Impact Analysis, Asphalt Plant No. 1 Replacement and Modernization DRAFT REPORT Traffic Impact Analysis, Asphalt Plant No. 1 Replacement and Modernization Prepared for City of Los Angeles
Section 3.12 Traffic and Transportation
 Section. Traffic and Transportation SECTION SUMMARY This section describes existing ground transportation within the Port and surrounding area associated with implementation of the proposed Project. An
Appendix C. Traffic Impact Study
 Appendix C Traffic Impact Study TRAFFIC STUDY FOR THE EAGLE ROCK AGGREGATE TERMINAL Prepared by: FEHR & PEERS 201 Santa Monica Blvd. Suite 500 Santa Monica, CA 90401-2213 T. (310) 458-9916 F. (310) 394-7663
Downtown Lee s Summit Parking Study
 Downtown Lee s Summit Parking Study As part of the Downtown Lee s Summit Master Plan, a downtown parking and traffic study was completed by TranSystems Corporation in November 2003. The parking analysis
Paid Parking at Park & Ride Lots: Framing the Issues. Capital Programs Committee May 2014
 Paid Parking at Park & Ride Lots: Framing the Issues Capital Programs Committee May 2014 Outline Current Status Industry Review DART Case Study Issues Alternatives Mechanics 2 Current Status: All Lots
TRAFFIC IMPACT STUDY. USD #497 Warehouse and Bus Site
 TRAFFIC IMPACT STUDY for USD #497 Warehouse and Bus Site Prepared by: Jason Hoskinson, PE, PTOE BG Project No. 16-12L July 8, 216 145 Wakarusa Drive Lawrence, Kansas 6649 T: 785.749.4474 F: 785.749.734
Trip and Parking Generation Data Collection at Grocery Store with Gas Station and Auto Repair
 Trip and Parking Generation Data Collection at Grocery Store with Gas Station and Auto Repair Final Report 2011 ITE District 6 - Data Collection Project Institute of Transportation Engineers Student Chapter
V. ENVIRONMENTAL IMPACT ANALYSIS F. TRANSPORTATION/CIRCULATION
 V. ENVIRONMENTAL IMPACT ANALYSIS F. TRANSPORTATION/CIRCULATION The following Section presents a summary of the Traffic Study for the Proposed Civic Center/Metlox Development Project in the City of Manhattan
4.7 Construction Surface Transportation
 4.7.1 Introduction The traffic analysis presented in this section addresses the construction traffic impacts specific to the proposed Project. The construction traffic impacts were analyzed for both the
Re: Addendum No. 4 Transportation Overview 146 Mountshannon Drive Ottawa, Ontario
 April 18 th, 2017 Mr. Kevin Yemm Vice President, Land Development Richraft Group of Companies 2280 St. Laurent Boulevard, Suite 201 Ottawa, Ontario (Tel: 613.739.7111 / e-mail: keviny@richcraft.com) Re:
TRAFFIC IMPACT ANALYSIS SHORTBREAD LOFTS 2009 MODIFICATION Chapel Hill, North Carolina
 TRAFFIC IMPACT ANALYSIS SHORTBREAD LOFTS 2009 MODIFICATION Chapel Hill, North Carolina Prepared for: The Town of Chapel Hill, NC Prepared by: Architects-Engineers-Planners, Inc. November 2009 Traffic Impact
APPENDIX E. Traffic Analysis Report
 APPENDIX E Traffic Analysis Report THIS PAGE INTENTIONALLY BLANK EAGLE RIVER TRAFFIC MITIGATION PHASE I OLD GLENN HIGHWAY/EAGLE RIVER ROAD INTERSECTION IMPROVEMENTS TRAFFIC ANALYSIS Eagle River, Alaska
THE CORNERSTONE APARTMENTS TRAFFIC IMPACT STUDY R&M PROJECT NO
 THE CORNERSTONE APARTMENTS SITUATED AT N/E/C OF STAUDERMAN AVENUE AND FOREST AVENUE VILLAGE OF LYNBROOK NASSAU COUNTY, NEW YORK TRAFFIC IMPACT STUDY R&M PROJECT NO. 2018-089 September 2018 50 Elm Street,
TRAFFIC SIGNAL DESIGN REPORT KING OF PRUSSIA ROAD & RAIDER ROAD RADNOR TOWNSHIP PENNSYLVANIA
 TRAFFIC SIGNAL DESIGN REPORT KING OF PRUSSIA ROAD & RAIDER ROAD RADNOR TOWNSHIP PENNSYLVANIA PREPARED FOR: UNIVERSITY OF PENNSYLVANIA HEALTH SYSTEM 34 CIVIC CENTER BOULEVARD PHILADELPHIA, PA 1987 (61)
Bi-County Transitway/ Bethesda Station Access Demand Analysis
 Bi-County Transitway/ Bethesda Station Access Demand Analysis Prepared for: Washington Metropolitan Area Transit Authority Office of Planning and Project Development May 2005 Prepared by: in conjunction
Perris Apartments Traffic Impact Analysis City of Perris, California
 Perris Apartments Traffic Impact Analysis City of Perris, California Prepared for: JD Pierce Company, Inc. 2222 Martin St., Suite 100 Irvine, CA 92612 Prepared by: TJW ENGINEERING, INC. 540 N. Golden Circle