Memorandum. 1 Short List Analysis Background. James Hinkamp and Tony Coe, City of Lafayette Steering Committee
|
|
|
- Christiana Cooper
- 6 years ago
- Views:
Transcription
1 To Copies James Hinkamp and Tony Coe, City of Lafayette Steering Committee Date August 26, 2016 Reference number From Mike Iswalt, Vanessa Peers, Will Baumgardner File reference 4-05 Subject Lafayette Downtown Congestion Study: Preliminary Detailed Network Traffic Analysis Work-in-Progress Findings 1 Short List Analysis Background This memorandum provides a progress update on the detailed traffic analysis of Short List strategies presented at the Steering Committee meeting on June 22, 2016 and summarized in the memorandum Lafayette Downtown Congestion Study: Long List to Short List of Strategies and Projects (Arup, June 16, 2016). A multi-stage screening process has been utilized to narrow down the original Long List of potential strategies to a Short List for more detailed analysis. This process includes: 1. Developed the Long List strategy matrix: Arup, with guidance from the Steering Committee, developed the Long List matrix that assessed the congestion benefits, costs, and trade-offs of over 50 projects. 2. Steering Committee screening: The Steering Committee met on March 22, 2016 and utilized a range of criteria to narrow the Long List down to a working Short List of 19 strategies 3. Short List refinement and scenario development: Arup and the Steering Committee worked through an iterative process of defining and mapping the 19 strategies, developing conceptual plans, and grouping the strategies into three packages that approximate time horizons for further assessment. The three packages include: Near-Term, Medium-Term (Light Infrastructure), and Long-Term (Heavy Infrastructure). This refinement occurred in April 2016 and was utilized in the initial assessment of the Short List. 4. Initial Assessment ( Mini Studies ) Traffic Analysis: Arup conducted the initial assessment of the Short List packages and presented the findings to the Steering Committee on June 22, This initial assessment consisted of a series of mini studies that evaluated each of the Short List strategies independently to assess the traffic capacity impacts, the design requirements, and any potential right-of-way (R/W) impacts. This initial assessment helped screen out a few additional projects and helped us better identify how to construct the packages in the detailed traffic analysis. The Steering Committee was interested in evaluating how effective the Near-Term and Medium-Term packages were at reducing congestion without having to require one of the very expensive Heavy Infrastructure projects. Page 1 of 24
2 5. Detailed Network Traffic Analysis: Arup utilized the outcome of the initial assessment to develop a more detailed process for evaluating the Short List strategy packages. To do this, Arup utilized traffic microscopic simulation ( microsimulation ) models of Downtown for the morning (AM) peak hour and the two-hour afternoon (mid-day (MD)/PM) peak period. Microsimulation software tools simulate individual vehicle and pedestrian movements on the street network using assumptions on how drivers accelerate, change lanes, and interact with pedestrians. These tools generate metrics such as travel time, delay, and queuing. This detailed analysis process is still ongoing and is summarized in this memorandum. 2 Detailed Network Traffic Analysis Modeling This memorandum outlines the process Arup has developed to provide a more detailed traffic analysis of the Short List strategy packages. Traffic volumes are generally the highest at most intersection approaches across the study area during the afternoon period. Table 1 presents the peak hour turning movement counts from May 2015 for Mount Diablo Boulevard (MDB) / Moraga Road during the AM (7:45-8:45 AM), MD (2:45-3:45 PM), and PM (5:00-6:00 PM) peak hours. The peak hour for each approach and for the intersection overall are highlighted in yellow. Table 1: Turning Movement Counts With Peak Approach Volumes by Hour (May 2015) Northbound Moraga Rd Southbound Shopping Ctr Eastbound MDB Westbound MDB Grand Hr NBL NBT NBR TTL SBL SBT SBR TTL EBL EBT EBR TTL WBL WBT WBR TTL TTL AM , ,028 MD , , ,404 PM , ,394 Highlighted cells represent the peak hour for each intersection approach. Source: All Traffic Data, Arup (2015). The traffic counts indicate that the peak hour for MDB / Moraga Road occurs between 2:45 and 3:45 in the afternoon. This is driven by the peak school activity, as well as retail activity in Downtown. However, three of the four approaches (including both approaches on MDB) experience a peak hour during the 5:00 to 6:00 PM hour. This reflects peak commuting and retail activity. In fact, a closer inspection of 15-minute volumes indicates that traffic volumes stay relatively constant throughout a three-hour period from 2:30 to 5:30 in the afternoon. The one critical approach that does not experience a peak in the afternoon is the northbound approach on Moraga Road, which experiences peak traffic in the morning. The project analysis completed so far has indicated that Moraga Road is the primary congestion point within Downtown. Therefore, the morning and afternoon models described below focus on Moraga Road. To address the varying traffic patterns and congestion levels on Moraga Road in the morning and afternoon, two microsimulation models were developed: 1. MD/PM two-hour model: a microsimulation model was developed for the entire study area and calibrated for a two-hour MD/PM peak period (3:00 to 5:00 PM) using the software package VISSIM. The two-hour MD/PM analysis period captures the tail-end of school activity as well as peak commuting and retail activity along MDB. The MD/PM VISSIM model analysis period Page 2 of 24
3 overlaps with the peak period identified using the May 2015 counts. VISSIM was selected because it provides a robust network modeling tool for the larger Downtown study network. 2. AM peak hour model: a microsimulation model of Moraga Road and MDB between Oak Hill Road and 1st Street was developed for the AM peak hour (7:45 to 8:45 AM) using the software package Synchro/SimTraffic. The City maintains Synchro models of Downtown, and SimTraffic is the microsimulation program integrated with Synchro. Synchro/SimTraffic was selected because the critical study area focuses on Moraga Road in the AM peak hour only, and Synchro/SimTraffic allows for quick adjustments of signal timings while providing the same traffic performance metrics as VISSIM Additional background information on existing traffic conditions, future land use and traffic growth, and information on the development and calibration of the VISSIM microsimulation model can be found in the Lafayette Downtown Congestion Study Background Conditions Report (Arup, February 2016). The two microsimulation models were used to assess a subset of the Short List packages and to compare the results to existing conditions and to future baseline conditions with no improvements. Traffic metrics such as level-of-service (LOS), travel time, and average delay, are reported and represent one grouping of performance measures that can be used to assess strategies. Additional qualitative measures such as safety and pedestrian/bicycling connectivity are also critical and will be included in the final evaluation of the strategies. Page 3 of 24

4 3 Study Area The extent of the area modeled in VISSIM is shown in Figure 1 and includes St Mary s Road in the south, Deer Hill Road in the north, Village Center/Risa Road in the west and Almanor Lane in the east. Figure 1: MD/PM VISSIM model extent Figure 2 presents the extents of the study area modeled in Synchro/SimTraffic. The Synchro model study area is smaller because the focus is primarily on northbound traffic flow on Moraga Road. Page 4 of 24
5 Figure 2: AM Synchro/SimTraffic model extent (existing 2015 traffic volumes are shown) Page 5 of 24


6 4 Short List Packages The Short List packages, with the refined list of strategies, are summarized in the series of tables and figures below. The packages are meant to be additive and not exclusive. The Near-Term strategies are meant to be implemented in combination with, and not instead of, the Medium-Term strategies. Table 2: Near-Term Improvement Projects Figure 3: Near-Term Improvement Projects Page 6 of 24


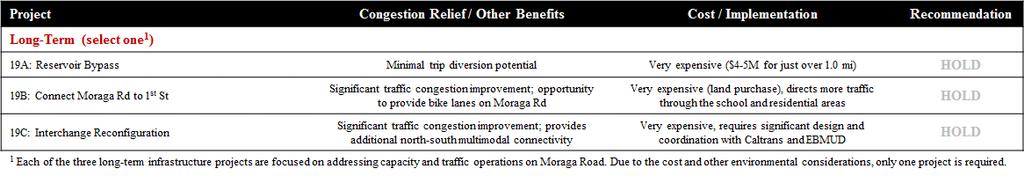
7 Table 3: Medium-Term Improvement Projects Figure 4: Medium-Term Improvement Projects Table 4: Long-Term Improvement Projects Page 7 of 24

8 Figure 5: Long-Term Improvement Projects The detailed network traffic analysis focuses on capacity projects. The analysis was conducted using the two microsimulation models of AM and MD/PM conditions described above along with the following steps: 1. The Near-Term projects were grouped into capacity increasing projects and school-related projects and strategies. The capacity projects included #s 1, 3, 4, and 5, while the school projects included #s 6, 9, and 10. The other school projects do not have a direct impact on network traffic operations. The capacity projects were tested first to assess their effectiveness at alleviating traffic congestion and their ability to serve additional traffic. The traffic analysis focused on the capacity projects first to assess their effectiveness at reducing congestion because there is some uncertainty regarding the redistribution potential of the remote school drop-off areas. If the analysis indicates that the capacity projects are sufficient, then the school projects could be relied on as a means to provide further congestion relief as well as provide other safety benefits for students. The school projects, most notably the remote drop-off areas, would divert some trips outside of the Moraga Road corridor. 2. The Medium-Term projects were grouped into capacity increasing projects on the Brook-to- School connection on Moraga Road (#s 15 and 16), the Downtown Couplet (#s 13 and 14), and other projects (#s 11, 17, and 18). The Brook-to-School connection was the focus the analysis, as the Downtown Couplet did not perform well under the initial analysis mini studies and the other projects (e.g., MDB road diet) were either analyzed sufficiently in the initial analysis or do not have a direct impact on network traffic operations. Page 8 of 24
9 3. The initial analysis indicated that the Long-Term projects would have too great of a cost and impact on existing buildings and properties. For these reasons, the Long-Term projects were not analyzed in greater detail using the traffic microsimulation models. 5 Traffic Forecasts Traffic forecasting is challenging as traditional methods typically rely on large-scale regional travel demand models to forecast traffic volumes at model gateways, traffic analysis zones, or turning movement volumes at individual intersections or driveways. This requires a high level of precision for an important assumption that suffers from a great deal of uncertainty. Growth based methods are another approach that scales traffic volumes by applying a growth factor to various model trip generators. This eliminates the need for being too precise about exactly where traffic growth is generated in the future and instead focus on the operations questions. This growth factor approach was utilized in this analysis. Growth factors were developed for areas within Lafayette and Moraga to better scale gateways in the traffic microsimulation models. Refer to the Background Report for information on the traffic forecasting process. The traffic forecast scenarios used to evaluate the Short List packages were developed using a variety of regional sources. First, a long-term forecast year of 2040 was selected to match regional land use planning documents. The year 2040 population and employment projections were obtained from the CCTA Development Forecasts, Plan Bay Area, and the Downtown Specific Plan. Table 5 presents the population and employment growth forecasts from the CCTA Development Forecasts for areas in Downtown Lafayette and for other areas of Lamorinda ( ). Table 5: Population and employment forecasts ( ) Area Population Growth Employment Growth Total Growth Downtown Lafayette 32% 15% 24% Lamorinda 14% 14% 14% Source: CCTA, City of Lafayette, MTC These year 2040 growth rates were applied to the traffic model volumes based on the location of the trip generation zone and the type of trip (residential or employment). The overall weighted average traffic forecast for year 2040 conditions is approximately 18 percent. This growth rate was rounded up to 20 percent for the following reasons: It is a conservative assumption. It is in-line with traffic forecasts for SR 24. Daily freeway traffic is expected to increase 20 percent by It is in-line with the number of vehicle trips (1,900 in the peak hour) utilized in the Cumulative With Specific Plan impact analysis presented in the DSP Environmental Impact Report (EIR). Page 9 of 24
10 Based on these land use projections and the traffic forecasting methodology detailed in the Background Report, three traffic volume scenarios were developed for the detailed traffic analysis of the Short List packages: Existing Conditions (2015): the traffic models were developed and calibrated using a combination of 2015 counts and travel time measurements with earlier data. Future year 2025: this represents an approximate mid-point forecast year for traffic growth and is half of the year 2040 growth. This assumes some front-loading of development projects in the next few years. Future year 2040: this applies the 20% growth rate over existing volumes described above. The horizon year on the scenarios is meant as a rough guide to when strategies would be needed to serve the higher volumes. The three volume scenarios were analyzed using the AM Synchro/SimTraffic and MD/PM VISSIM models developed to assess the Near-Term and Medium-Term Short-List packages in an incremental fashion: Existing conditions (2015) this was analyzed to verify existing conditions Future 2025 with no improvements this scenario provides a baseline for evaluating the Near-Term strategies Future 2025 traffic demand with Near-Term projects Future 2040 traffic demand with Near-Term projects this scenario provides a baseline for evaluating the Medium-Term strategies Future 2040 traffic demand with Medium-Term projects 6 Traffic Analysis Results This report summarizes the results for the intersections in the primary focus area, including: MDB / Oak Hill Road MDB / 1 st Street MDB / Moraga Road Moraga Road / Moraga Boulevard Moraga Road / Brook Street-School Street Moraga Road / St. Mary s Road The level of service (LOS) has been defined in accordance with the Highway Capacity Manual (HCM 2000). The travel time required for vehicles to traverse Moraga Road from St. Mary s Road to MDB in both the northbound and southbound direction was also measured as well as the average delay per vehicle in the network. The MD/PM results are reported for both hours of the two-hour period. Page 10 of 24
11 6.1 Existing conditions (2015) The results of the existing scenario are given in Table 6 below and can also be found in the Background Conditions Report. The LOS and travel times for the AM peak hour from the Synchro/SimTraffic model and each individual hour in the MD/PM VISSIM model are shown. [Note: additional locations are presented in the table below for informational purposes. The AM Synchro/SimTraffic model covers a smaller study area, therefore, LOS results are not reported for several intersections on MDB.] Table 6: Existing Conditions scenario analysis results Intersection AM Peak Hour (Synchro/SimTraffic) Midday Peak Hour (VISSIM) PM Peak Hour (VISSIM) Delay (s) LOS Delay (s) LOS Delay (s) LOS Mount Diablo / Risa 17.6 B 19.3 B Mount Diablo / Dolores 18.4 B 20.3 C Mount Diablo / Happy Valley 24.3 C 25.5 C Mount Diablo / Dewing 15.8 B 15.4 B Mount Diablo / Lafayette Circle 11.1 B 10.6 B Mount Diablo / Oak Hill 25 C 28.5 C 27.1 C Mount Diablo / Moraga 44 D 49.3 D 40.2 D Moraga / Moraga Blvd 18 C 34.1 C 14.3 B Moraga / Brook Moraga / School 39 D 26.5 C 19.9 B Moraga / St Mary s 14 B 16.1 B 8.8 A Mount Diablo / 1st 25 C 29.2 C 27.4 C Mount Diablo / 2nd 10.0 A 8.1 A Mount Diablo / Brown 11.1 B 11.4 B Deer Hill / 1st 18.4 B 18.1 B Deer Hill / SR24 WB ramps 28.2 C 26.9 C Travel Time Time (mm:ss) Time (mm:ss) Time (mm:ss) Moraga Road NB 4:36 3:24 2:20 Moraga Road SB 2:45 1:27 1:23 The existing conditions results for microsimulation models were calibrated to the observed traffic volumes and travel times. The LOS results were compared to the DSP EIR and several differences were identified: The DLTM used a microsimulation model, while the Downtown Specific Plan used HCM LOS methodologies. These generate different results. Page 11 of 24
12 Microsimulation models are random simulations of vehicle movements throughout a network, which does a better job of estimating queuing between intersections. HCM methods utilize deterministic equations based on observed data. These methods often generate different results. The majority of intersections showed similar LOS results between the DLTM and Downtown Specific Plan EIR. The Moraga Road / Brook Street and Moraga Road / School Street locations were combined in the DLTM because the proximity of intersections are so close. The Downtown Specific Plan mid-day peak, which captures the peak school activity on Moraga Road, is slightly earlier than the first hour of the DLTM (3:00 4:00 PM). Therefore, the LOS results differ. The one LOS comparison that stands out is the School Street intersection during the mid-day peak hour. The school pick-up period generates a short, yet intensive travel peak on School Street as part of student pick-up activity. HCM intersection analyses incorporate the delay for the peak 15-minute period, while the DLTM incorporates the average delay over the entire hour. The HCM results reflect the very peaked condition associated with school activities, while the DLTM reflects average conditions experienced over the entire hour and during periods when school drop-off has ended. 6.2 Future 2025 with no improvements with no improvements To determine the impact of the Future 2025 traffic demand (existing+10% growth) on the performance of the road network in downtown Lafayette, the 2025 traffic volumes were analyzed in both the AM and MD/PM traffic models. This scenar 1.1 with no improvements with no improvementsio does not assume any improvements to the road network and therefore provides an indication of how conditions could deteriorate without any improvements. The results are summarized in Table 7 below. Page 12 of 24
13 Table 7: 2025 traffic demand with no improvements analysis results Intersection AM Peak Hour Midday Peak Hour PM Peak Hour Delay (s) LOS Delay (s) LOS Delay (s) LOS Mt Diablo Blvd / Oak Hill Rd 26 C 30.7 C 26.2 C Mt Diablo Blvd / Moraga Rd 47 D 50.5 D 49.0 D Moraga Rd / Moraga Blvd 60 E 34.2 C 49.3 D Moraga Rd / School St / Brook St 76 E 53.2 D 94.1 F Moraga Rd / St Marys Rd / Herman Dr 49 D 32.4 C 60.4 E Mt Diablo Blvd / 1 st St 27 C 31.5 C 30.6 C Travel time Time (mm:ss) Time (mm:ss) Time (mm:ss) Moraga Road NB 07:45 03:47 04:27 Moraga Road SB 07:11 1:36 03:12 Average delay per vehicle -- 02:00 02:17 In the Future 2025 with no improvements scenario, the increase in traffic volumes would cause an increase in delays at the intersections of Moraga Road and Brook Street/School Street and Moraga Road and St. Mary s Road. This increase in delay was the result of increased traffic volumes and a host of additional factors that impeded the progression of vehicles along northbound Moraga Road resulting in queues backing up into upstream intersections (see Figure 6): 60% of vehicles travelling north on Moraga Road turn right into MDB. With only one short right turning lane on this approach there is insufficient capacity for these vehicles to queue and the right turning queue spills into the middle lane and into upstream intersections. Vehicles travelling southbound on Moraga Road and turning left into Moraga Boulevard block through traffic on this approach which increases the delay of southbound vehicles. These queues have been observed to extend back to MDB and block east and westbound traffic on MDB. This is expected to worsen in the future. The signals at Moraga Road and St. Mary s Road are not included in the existing coordinated signal system which impedes the progression of vehicles. Page 13 of 24

14 Figure 6: 2025 traffic demand with no improvements findings Page 14 of 24
15 In the AM model, the increase in traffic volumes caused an increase in delay primarily along northbound Moraga Road. 6.3 Future 2025 traffic demand with Near-Term projects The Future 2025 traffic scenarios were evaluated with a subset of Near-Term projects were to evaluate the effect on traffic performance. Table 8 summarizes the traffic results for the Near-Term strategies included in this scenario: #1: Smart corridors which include coordinating the signals along Moraga Boulevard and providing additional green time to the northbound approach of Moraga Road at MDB. #4: Allow right turning movements from the middle northbound lane on Moraga Road and MDB. #5: Add a short left turning lane on the southbound approach of Moraga Road at Moraga Boulevard. Table 8: 2025 traffic demand with near-term projects analysis results Intersection AM Peak Hour Midday Peak Hour PM Peak Hour Delay (s) LOS Delay (s) LOS Delay (s) LOS Mt Diablo Blvd / Oak Hill Rd 25 C 36.8 D 29.3 C Mt Diablo Blvd / Moraga Rd 50 D 53.5 D 47.4 D Moraga Rd / Moraga Blvd 21 C 21.2 C 23.5 C Moraga Rd / School St / Brook St 32 C 24.5 C 32.2 C Moraga Rd / St Marys Rd / Herman Dr 13 B 17.1 B 13.9 B Mt Diablo Blvd / 1 st St 29 C 31.3 C 29.1 C Travel time Time (mm:ss) Time (mm:ss) Time (mm:ss) Moraga Road NB 4:43 02:40 03:07 Moraga Road SB 4:48 01:29 01:29 Average delay per vehicle -- 01:56 01:58 Providing additional capacity to the northbound right turning traffic and coordinating the signals along Moraga Road resulted in improved progression of vehicles, shorter queues, and shorter delays and travel times in both the AM and the MD/PM periods. See Figure 7 for a discussion of the MD/PM findings. The Near-Term projects included in this analysis (#s 1, 4, and 5) are sufficient to address the Future 2025 traffic growth. The school strategies (#s 6, 9, and 10) were not evaluated in this phase of the analysis, but can be included in future model runs. The school strategies would provide additional congestion relief, as well as other benefits such as additional school parking and enhanced pedestrian and bicycling access for students. Page 15 of 24

16 Figure 7: 2025 traffic demand with near-term projects findings Page 16 of 24
17 6.4 Future 2040 traffic demand with Near-Term projects The Future 2040 traffic volumes (existing + 20% growth) were input into the AM and MD/PM traffic microsimulation models to determine if the Near-Term projects analyzed in the previous Future 2025 scenarios would provide enough capacity to accommodate the projected Future year 2040 traffic volumes. The results of the 2040 traffic demand with Near-Term projects are provided in Table 9 below. Table 9: 2040 traffic demand with near-term projects analysis results Intersection AM Peak Hour Midday Peak Hour PM Peak Hour Delay (s) LOS Delay (s) LOS Delay (s) LOS Mt Diablo Blvd / Oak Hill Rd 27 C 40.9 D 39.4 D Mt Diablo Blvd / Moraga Rd 60 E 63.7 E 72.8 E Moraga Rd / Moraga Blvd 68 E 34.9 C 42.3 D Moraga Rd / School St / Brook St 61 E 55.3 E 69.0 E Moraga Rd / St Marys Rd / Herman Dr 30 C 43.2 D 43.5 D Mt Diablo Blvd / 1 st St 30 C 35.1 D 32.0 C Travel time Time (mm:ss) Time (mm:ss) Time (mm:ss) Moraga Road NB 06:48 04:07 05:11 Moraga Road SB 07:06 01:59 01:50 Average delay per vehicle 02:30 02:42 As expected, the increase in traffic volumes would result in increased delays at all of the intersections and increased travel times. The model shows that the network is saturated and that the increased traffic volumes are unable to clear the intersections after every signal cycle causing queues and delays (see Figure 8 below). Under the Future 2040 scenario, the Near-Term package of projects that were analyzed do not provide enough capacity. Under Future 2040 conditions, implementing the school strategies would begin to provide additional congestion relief in the AM and MD peak hours. However, the school strategies would not provide much relief in the PM conditions as this period occurs after school hours. Page 17 of 24

18 Memorandum Figure 8: 2040 traffic demand with near-term projects findings Page 18 of 24
19 6.5 Future 2040 traffic demand with Medium-Term projects To improve the performance of the road network under the Future 2040 scenario, the Medium-Term improvement projects #15 and #16, which involve connecting Brook Street with School Street and providing a short southbound left-turn at School Street, were evaluated in the AM and MD/PM models. The results are provided in Table 10 below. The MD/PM results in italics should be treated as preliminary and based on a limited number of VISSIM runs. Table 10: 2040 traffic demand with medium-term projects Intersection AM Peak Hour Midday Peak Hour PM Peak Hour Delay (s) LOS Delay (s) LOS Delay (s) LOS Mt Diablo Blvd / Oak Hill Rd 26 C 43 D 40 D Mt Diablo Blvd / Moraga Rd 48 D 66 E 75 E Moraga Rd / Moraga Blvd 7 A 48 D 62 E Moraga Rd / School St / Brook St 19 B 39 D 58 E Moraga Rd / St Marys Rd / Herman Dr 20 C 39 D 52 D Mt Diablo Blvd / 1st St 29 C 36 D 31 C Travel time Time (mm:ss) Time (mm:ss) Time (mm:ss) Moraga Road NB 03:54 04:59 05:41 Moraga Road SB 03:16 01:23 01:31 Average delay per vehicle -- 03:10 03:19 The AM peak hour analysis indicates that Brook-to-School connection with the southbound left-turn pocket has clear benefits to LOS and travel time along Moraga Road. These strategies provide the following benefits: The combination of two intersections into one provides operational efficiencies by simplifying the corridor. The removal of the existing pedestrian scramble phase at Brook Street reduces the amount of loss time at the proposed combined intersection. Pedestrians would cross at standard crosswalks at each of the intersection s four legs. A prohibition on right-turns on red could be implemented during the AM peak hour to provide enhanced safety for students crossing Moraga Road. The southbound left-turn pocket provides queuing space for southbound vehicles, which reduces the likelihood that queues block southbound through traffic. However, the analysis indicates that during the PM peak, overall travel times and LOS do not improve with the implementation of this Medium-Term strategies. This is because the northbound approach at MDB / Moraga Road remains the critical pinch-point in the network causing queues to spill back along Moraga Road to School Street and Brook Street. These queues would occur even with the proposed connection of School Street with Brook Street. Page 19 of 24
20 The MD/PM results will require further investigation in VISSIM. The results presented in this memorandum represent a small sample of runs and could represent noise in the model. The signal timings, progression parameters, and additional runs are required to understand the variability in delay and travel times. 7 Conclusions and recommendations The results for the AM and the MD/PM model results are summarized in Table 11 and Table 12 respectively. Generally, the performance of the intersections along Moraga Road during the PM peak hour (the second hour of the MD/PM VISSIM model) are worse than the MD hour (the first hour of the VISSIM model). Therefore, only the results for PM peak hour are provided below. Table 11: Summary of AM peak hour analysis results Traffic Growth Scenario Roadway Network Scenario Existing (2015) Existing (2015) Existing roadway configuration, signal timings Future 2025 Traffic Demand ( % growth) No Improvements Existing roadway configuration, signal timings Near-Term Improvements Intersection LOS / Delay (sec) (Smart Corridor, Moraga Blvd SBL, 2 nd NBR) Future 2040 Traffic Demand ( % growth) Near-Term Improvements (Smart Corridor, Moraga Blvd SBL, 2 nd NBR) Medium-Term Improvements (Smart Corridor, Moraga Blvd SBL, 2 nd NBR, Brook/School Connection) MDB/Oak Hill Rd C / 25 C / 26 C / 25 C / 27 C / 26 MDB/1st St C / 25 C / 27 C / 29 C / 30 C / 29 MDB/Moraga Rd D / 44 D / 47 D / 50 E / 60 D / 48 Moraga Rd/Moraga Blvd C / 18 E / 60 C / 21 E / 68 A / 7 Moraga Rd/Brook/School D / 39 E / 76 C / 32 E / 61 B / 19 Moraga Rd/St Marys B / 14 D / 49 B / 13 C / 30 C / 20 NB Moraga Rd St Mary s to MDB SB Moraga Rd MDB to St Mary s Travel Time (mm:ss) 4:36 7:45 4:43 6:48 3:54 2:45 7:11 4:48 7:06 3:16 Page 20 of 24
21 Table 12: Summary of PM peak hour analysis results Traffic Growth Scenario Roadway Network Scenario Existing (2015) Existing (2015) Existing roadway configuration, signal timings Future 2025 Traffic Demand ( % growth) No Improvements Existing roadway configuration, signal timings Intersection LOS / Delay (sec) Near-Term Improvements (Smart Corridor, Moraga Blvd SBL, 2 nd NBR) Future 2040 Traffic Demand ( % growth) Near-Term Improvements (Smart Corridor, Moraga Blvd SBL, 2 nd NBR) Medium-Term Improvements (Smart Corridor, Moraga Blvd SBL, 2 nd NBR, Brook/School Connection) MDB/Oak Hill Rd C / 29 C / 26 C / 29 D / 39 D / 40 MDB/1st St C / 29 C / 31 C / 29 C / 32 E / 75 MDB/Moraga Rd D / 49 D / 49 D / 47 E / 73 E / 62 Moraga Rd/Moraga Blvd C / 34 D / 49 C / 24 D / 42 E / 58 Moraga Rd/Brook/School C / 27 F / 94 C / 32 E / 69 D / 32 Moraga Rd/St Marys B / 16 E / 60 B / 14 D / 44 C / 31 NB Moraga Rd St Mary s to MDB SB Moraga Rd MDB to St Mary s Total System (average delay per vehicle) Travel Time (mm:ss) 3:24 04:27 03:07 05:11 05:41 1:27 03:12 01:29 01:50 01:31 Vehicle Hours of Delay (VHD) -- 02:17 01:58 02:42 03:19 The modeling indicates that the initial package of Near-Term projects (#s 1, 4 and 5) provides sufficient capacity to accommodate the growth in Future 2025 traffic (existing+10% growth). The school strategies are not required to improve LOS and travel time but could still be pursued as they will have additional congestion benefits in the AM peak hour (less in the MD/PM periods) as well as other safety and pedestrian/bicycle benefits. The Near-Term strategies evaluated in this analysis do not provide sufficient capacity to accommodate the anticipated Future 2040 traffic demand, which would require implementing some of the Medium- Term strategies (#s 15 and 16). These strategies are sufficient to address congestion in the AM peak hour, but not during the MD/PM peak. During the PM peak, these Medium-Term projects at School and Brook Streets do not provide additional capacity at the pinch-point at MDB and Moraga Road. Therefore, queues would still spill back Moraga Road to School Street and Brook Street. However, the Brook-to-School connection would still provide safety benefits and an improved east-west bicycle Page 21 of 24
22 connection from Downtown to the Lafayette-Moraga Regional Trail. The AM peak hour appears to work better because traffic is flowing in one peak direction. Therefore, it is easier to readjust signal timings and improve coordination offsets to improve progression. During the MD/PM period traffic volumes are higher at most approaches, which does not allow for as much priority in any one direction. This reduces the effectiveness of these improvements. This analysis is still in progress, and we are exploring alternative signal timing and progression parameters along Moraga Road during the MD/PM period to try and improve the performance. Page 22 of 24
23 Detailed Analysis Results The detailed VISSIM results by approach are provided below for each of the VISSIM scenarios. Midday and PM peak hours 2025 traffic demand with no improvements (midday peak hour) Node No Name AVG NB AVG SB AVG EB AVG WB TOTAL LOS 106 Mt Diablo Blvd /Oak Hill Rd C 107 Mt Diablo Blvd / Moraga Rd D 108 Moraga Rd / Moraga Blvd C 109 Moraga Rd / School St / Brook St D 110 Moraga Rd / St Marys Rd / Herman Dr C 111 Mt Diablo Blvd / 1st St C 2025 traffic demand with no improvements (PM peak hour) Node No Name AVG NB AVG SB AVG EB AVG WB TOTAL LOS 106 Mt Diablo Blvd /Oak Hill Rd C 107 Mt Diablo Blvd / Moraga Rd D 108 Moraga Rd / Moraga Blvd D 109 Moraga Rd / School St / Brook St F 110 Moraga Rd / St Marys Rd / Herman Dr E 111 Mt Diablo Blvd / 1st St C 2025 traffic demand with near term improvements (midday peak hour) Node No Name AVG NB AVG SB AVG EB AVG WB TOTAL LOS 106 Mt Diablo Blvd /Oak Hill Rd D 107 Mt Diablo Blvd / Moraga Rd D 108 Moraga Rd / Moraga Blvd C 109 Moraga Rd / School St / Brook St C 110 Moraga Rd / St Marys Rd / Herman Dr B 111 Mt Diablo Blvd / 1st St C Page 23 of 24
24 2025 traffic demand with near term improvements (PM peak hour) Node No Name AVG NB AVG SB AVG EB AVG WB TOTAL LOS 106 Mt Diablo Blvd /Oak Hill Rd C 107 Mt Diablo Blvd / Moraga Rd D 108 Moraga Rd / Moraga Blvd C 109 Moraga Rd / School St / Brook St C 110 Moraga Rd / St Marys Rd / Herman Dr B 111 Mt Diablo Blvd / 1st St C 2040 traffic demand with near term improvements (midday peak hour) Node No Name AVG NB AVG SB AVG EB AVG WB TOTAL LOS 106 Mt Diablo Blvd /Oak Hill Rd D 107 Mt Diablo Blvd / Moraga Rd E 108 Moraga Rd / Moraga Blvd C 109 Moraga Rd / School St / Brook St E 110 Moraga Rd / St Marys Rd / Herman Dr D 111 Mt Diablo Blvd / 1st St D 2040 traffic demand with near term improvements (PM peak hour) Node No Name AVG NB AVG SB AVG EB AVG WB TOTAL LOS 106 Mt Diablo Blvd /Oak Hill Rd D 107 Mt Diablo Blvd / Moraga Rd E 108 Moraga Rd / Moraga Blvd D 109 Moraga Rd / School St / Brook St E 110 Moraga Rd / St Marys Rd / Herman Dr D 111 Mt Diablo Blvd / 1st St C Page 24 of 24
City of Lafayette Agenda Downtown Congestion Reduction Plan Steering Committee
 City of Lafayette Agenda Downtown Congestion Reduction Plan Steering Committee Regular Meeting Date: Wednesday, August 31, 2016 Time: 7:00 p.m. Location: Lafayette City Offices Room 265 3675 Mount Diablo
MEMO. McCORMICK RANKIN CORPORATION. File FROM: Keyur Shah DATE: February 1, 2010 COPIES: OUR FILE: SUBJECT: TO:
 McCORMICK RANKIN CORPORATION 2655 North Sheridan Way Mississauga, Ontario, L5K 2P8 Tel: (905)823-8500 Fax: (905) 823-8503 E-mail: mrc@mrc.ca Website: www.mrc.ca MEMO TO: File FROM: Keyur Shah DATE: February
PROJECT: Wilkinson Road Corridor Improvement Traffic Management Planning Project SUBJECT: Traffic Analysis
 TECHNICAL MEMORANDUM DATE: September 10, 2014 PROJECT 5861.03 NO: PROJECT: Wilkinson Road Corridor Improvement Traffic Management Planning Project SUBJECT: Traffic Analysis TO: Steve Holroyd - District
Alpine Highway to North County Boulevard Connector Study
 Alpine Highway to North County Boulevard Connector Study prepared by Avenue Consultants March 16, 2017 North County Boulevard Connector Study March 16, 2017 Table of Contents 1 Summary of Findings... 1
Bennett Pit. Traffic Impact Study. J&T Consulting, Inc. Weld County, Colorado. March 3, 2017
 Bennett Pit Traffic Impact Study J&T Consulting, Inc. Weld County, Colorado March 3, 217 Prepared By: Sustainable Traffic Solutions, Inc. http://www.sustainabletrafficsolutions.com/ Joseph L. Henderson,
MEMO. McCORMICK RANKIN CORPORATION. File Mark VanderSluis, Keyur Shah DATE: October 26, 2009 COPIES: OUR FILE: TO: FROM: Jack Thompson
 McCORMICK RANKIN CORPORATION 2655 North Sheridan Way Mississauga, Ontario, L5K 2P8 Tel: (95)823-85 Fax: (95) 823-853 E-mail: mrc@mrc.ca Website: www.mrc.ca MEMO TO: FROM: File Mark VanderSluis, Keyur Shah
Transit City Etobicoke - Finch West LRT
 Delcan Corporation Transit City Etobicoke - Finch West LRT APPENDIX D Microsimulation Traffic Modeling Report March 2010 March 2010 Appendix D CONTENTS 1.0 STUDY CONTEXT... 2 Figure 1 Study Limits... 2
V. DEVELOPMENT OF CONCEPTS
 Martin Luther King, Jr. Drive Extension FINAL Feasibility Study Page 9 V. DEVELOPMENT OF CONCEPTS Throughout the study process several alternative alignments were developed and eliminated. Initial discussion
INTERSECTION ANALYSIS PARK AVENUE AND BRADDOCK ROAD (FROSTBURG, MD) FOR LENHART TRAFFIC CONSULTING, INC.
 FOR LENHART TRAFFIC CONSULTING, INC.") INTERSECTION ANALYSIS FOR PARK AVENUE AND BRADDOCK ROAD (FROSTBURG, MD) Prepared for: City of Frostburg, Maryland & Allegany County Commissioners Prepared by: LENHART TRAFFIC CONSULTING, INC. TRAFFIC ENGINEERING
INTERSECTION ANALYSIS FOR PARK AVENUE AND BRADDOCK ROAD (FROSTBURG, MD) Prepared for: City of Frostburg, Maryland & Allegany County Commissioners Prepared by: LENHART TRAFFIC CONSULTING, INC. TRAFFIC ENGINEERING
County State Aid Highway 30 (Diffley Road) and Dodd Road Intersection Study
 and Dodd Road Intersection Study") County State Aid Highway 30 (Diffley Road) and Dodd Road Intersection Study City of Eagan, Dakota County, Minnesota Date: March 2012 Project No. 14957.000 444 Cedar Street, Suite 1500 Saint Paul, MN 55101
County State Aid Highway 30 (Diffley Road) and Dodd Road Intersection Study City of Eagan, Dakota County, Minnesota Date: March 2012 Project No. 14957.000 444 Cedar Street, Suite 1500 Saint Paul, MN 55101
TRAFFIC AND TRANSPORTATION TECHNICAL MEMORANDUM
 TRAFFIC AND TRANSPORTATION TECHNICAL MEMORANDUM for ENVIRONMENTAL ASSESSMENT US 460 Bypass Interchange and Southgate Drive Relocation State Project No.: 0460-150-204, P101, R201, C501, B601; UPC 99425
Interstate Operations Study: Fargo-Moorhead Metropolitan Area Simulation Output
 NDSU Dept #2880 PO Box 6050 Fargo, ND 58108-6050 Tel 701-231-8058 Fax 701-231-6265 www.ugpti.org www.atacenter.org Interstate Operations Study: Fargo-Moorhead Metropolitan Area 2015 Simulation Output Technical
Craig Scheffler, P.E., PTOE HNTB North Carolina, P.C. HNTB Project File: Subject
 TECHNICAL MEMORANDUM To Kumar Neppalli Traffic Engineering Manager Town of Chapel Hill From Craig Scheffler, P.E., PTOE HNTB North Carolina, P.C. Cc HNTB Project File: 38435 Subject Obey Creek TIS 2022
Oakbrook Village Plaza City of Laguna Hills
 Oakbrook Village Plaza City of Laguna Hills Traffic Impact Analysis Prepared by: HDR Engineering 3230 El Camino Real, Suite 200 Irvine, CA 92602 October 2012 Revision 3 D-1 Oakbrook Village Plaza Laguna
Interstate Operations Study: Fargo-Moorhead Metropolitan Area Simulation Results
 NDSU Dept #2880 PO Box 6050 Fargo, ND 58108-6050 Tel 701-231-8058 Fax 701-231-6265 www.ugpti.org www.atacenter.org Interstate Operations Study: Fargo-Moorhead Metropolitan Area 2025 Simulation Results
APPENDIX E. Traffic Analysis Report
 APPENDIX E Traffic Analysis Report THIS PAGE INTENTIONALLY BLANK EAGLE RIVER TRAFFIC MITIGATION PHASE I OLD GLENN HIGHWAY/EAGLE RIVER ROAD INTERSECTION IMPROVEMENTS TRAFFIC ANALYSIS Eagle River, Alaska
APPENDIX C1 TRAFFIC ANALYSIS DESIGN YEAR TRAFFIC ANALYSIS
 APPENDIX C1 TRAFFIC ANALYSIS DESIGN YEAR TRAFFIC ANALYSIS DESIGN YEAR TRAFFIC ANALYSIS February 2018 Highway & Bridge Project PIN 6754.12 Route 13 Connector Road Chemung County February 2018 Appendix
RESPONSE TO TRAFFIC IMPACT STUDY COMMENTS
 RESPONSE TO TRAFFIC IMPACT STUDY COMMENTS Proposed Gas Station 40 Arthur Street (Highway 26), Town of the Blue Mountains (Thornbury), County of Grey, Ontario AUGUST 2013 August 27, 2013 MR. REG RUSSWURM
Downtown One Way Street Conversion Technical Feasibility Report
 Downtown One Way Street Conversion Technical Feasibility Report As part of the City s Transportation Master Plan, this report reviews the technical feasibility of the proposed conversion of the current
Appendix C-5: Proposed Refinements Rail Operations and Maintenance Facility (ROMF) Traffic Impact Analysis. Durham-Orange Light Rail Transit Project
 Traffic Impact Analysis. Durham-Orange Light Rail Transit Project") Appendix C-5: Proposed Refinements Rail Operations and Maintenance Facility (ROMF) Traffic Impact Analysis Durham-Orange Light Rail Transit Project July 25, 218 ROMF Transportation Impact Analysis Version
Appendix C-5: Proposed Refinements Rail Operations and Maintenance Facility (ROMF) Traffic Impact Analysis Durham-Orange Light Rail Transit Project July 25, 218 ROMF Transportation Impact Analysis Version
King County Metro. Columbia Street Transit Priority Improvements Alternative Analysis. Downtown Southend Transit Study. May 2014.
 King County Metro Columbia Street Transit Priority Improvements Alternative Analysis Downtown Southend Transit Study May 2014 Parametrix Table of Contents Introduction... 1 Methodology... 1 Study Area...
Project Advisory Committee
 Meredith US 3/NH 25 Improvements Transportation Planning Study Project Advisory Committee March 18, 2008 Meredith US 3/NH 25 Improvements Transportation Planning Study Meeting Agenda Welcome Traffic Model
Table 1 - Land Use Comparisons - Proposed King s Wharf Development. Retail (SF) Office (SF) 354 6,000 10, Land Uses 1
 Office (SF) 354 6,000 10, Land Uses 1") Ref. No. 171-6694 Phase 2 November 23, 217 Mr. David Quilichini, Vice President Fares & Co. Developments Inc. 31 Place Keelson Sales Centre DARTMOUTH NS B2Y C1 Sent Via Email to David@faresinc.com RE:
Ref. No. 171-6694 Phase 2 November 23, 217 Mr. David Quilichini, Vice President Fares & Co. Developments Inc. 31 Place Keelson Sales Centre DARTMOUTH NS B2Y C1 Sent Via Email to David@faresinc.com RE:
Appendix H: Construction Impacts H-2 Transportation
 Appendix H: Construction Impacts H-2 Transportation \ AECOM 71 W. 23 rd Street New York, NY 10010 www.aecom.com 212 366 6200 tel 212 366 6214 fax Memorandum To CC Subject Robert Conway Donald Tone Construction
L1TILE BEARS DAY CARE TRANSPORTATION IMPACT STUDY FORT COLLINS, COLORADO MAY Prepared for:
 L1TILE BEARS DAY CARE TRANSPORTATION IMPACT STUDY FORT COLLINS, COLORADO MAY 2012 Prepared for: Hillside Construction, Inc. 216 Hemlock Street, Suite B Fort Collins, CO 80534 Prepared by: DELICH ASSOCIATES
EXECUTIVE SUMMARY. The following is an outline of the traffic analysis performed by Hales Engineering for the traffic conditions of this project.
 EXECUTIVE SUMMARY This study addresses the traffic impacts associated with the proposed Shopko redevelopment located in Sugarhouse, Utah. The Shopko redevelopment project is located between 1300 East and
6. ADJOURNMENT. James Hinkamp, Transportation Planner
 City of Lafayette Public Meeting Agenda Downtown Congestion Reduction Plan Steering Committee Wednesday, June 22, 2016, 6:00 PM City of Lafayette Offices 3675 Mt. Diablo Blvd., Room 240*, Lafayette, California
BERKELEY DOWNTOWN AREA PLAN PROGRAM ENVIRONMENTAL IMPACT REPORT TRAFFIC IMPACT ANALYSIS
 BERKELEY DOWNTOWN AREA PLAN PROGRAM ENVIRONMENTAL IMPACT REPORT TRAFFIC IMPACT ANALYSIS Prepared for: City of Berkeley Prepared by: REVISED JANUARY 9, 2009 Berkeley Downtown Area Plan Program EIR Traffic
MEMORANDUM. Figure 1. Roundabout Interchange under Alternative D
 MEMORANDUM Date: To: Liz Diamond, Dokken Engineering From: Subject: Dave Stanek, Fehr & Peers Western Placerville Interchanges 2045 Analysis RS08-2639 Fehr & Peers has completed a transportation analysis
MEMO VIA . Ms. Amy Roth DPS Director, City of Three Rivers. To:
 MEMO To: Ms. Amy Roth DPS Director, City of Three Rivers VIA EMAIL From: Michael J. Labadie, PE Julie M. Kroll, PE, PTOE Brandon Hayes, PE, P.Eng. Fleis & VandenBrink Date: January 5, 2017 Re: Proposed
Traffic Impact Analysis Update
 Willow Bend Traffic Impact Analysis Update TABLE OF CONTENTS Page I. INTRODUCTION -------------------------------------------------------------------------------------------- 1 II. EXISTING CONDITIONS
 Traffic Analysis For Approved Uses within the St. Lucie West DRI Aldi Port St. Lucie, FL Prepared for: Bohler Engineering, LLC 1000 Corporate Drive Suite 250 Fort Lauderdale, FL 33334 Prepared by: 10795
RTE. 1 at RTE. 637 & RTE. 639
 INTERSECTION SAFETY STUDY Prepared for: Virginia Department of Transportation Central Region Operations Traffic Engineering (UPC #81378, TO 12-092) DAVENPORT Project Number: 13-368 / /2014 RTE. 1 at RTE.
INTERCHANGE OPERTIONS STUDY Interstate 77 / Wallings Road Interchange
 INTERCHANGE OPERTIONS STUDY Interstate 77 / Wallings Road Interchange City of Broadview Heights, Cuyahoga County, Ohio Prepared For: City of Broadview Heights Department of Engineering 9543 Broadview Road
Proposed Hotel and Restaurant Development
 Traffic Impact Study Proposed Hotel and Restaurant Development Marbledale Road Tuckahoe, NY PREPARED FOR BILLWIN DEVELOPMENT AFFILIATES, LLC 365 WHITE PLAINS ROAD EASTCHESTER, NY. 10709 PREPARED BY Engineering
886 March Road McDonald's Transportation Study
 McDonald's Restaurants of Canada Limited March 2013 886 March Road McDonald's Transportation Study Submitted by: HDR Corporation 100 York Boulevard, Suite 300 Richmond Hill, ON L4B 1J8 (905) 882-4100 www.hdrinc.com
MEMORANDUM. Date: November 4, Cheryl Burrell, Pebble Beach Company. Rob Rees, P.E. Inclusionary Housing Transportation Analysis WC
 MEMORANDUM Date: November 4, 2013 To: From: Subject: Cheryl Burrell, Pebble Beach Company Rob Rees, P.E. Inclusionary Housing Transportation Analysis As requested, Fehr & Peers is providing clarification
To: File From: Adrian Soo, P. Eng. Markham, ON File: Date: August 18, 2015
 Memo To: From: Adrian Soo, P. Eng. Markham, ON : 165620021 Date: Reference: E.C. Row Expressway, Dominion Boulevard Interchange, Dougall Avenue Interchange, and Howard 1. Review of Interchange Geometry
King Soopers #116 Thornton, Colorado
 Traffic Impact Study King Soopers #116 Thornton, Colorado Prepared for: Galloway & Company, Inc. T R A F F I C I M P A C T S T U D Y King Soopers #116 Thornton, Colorado Prepared for Galloway & Company
DRAFT TRANSPORTATION IMPACT STUDY CASTILIAN REDEVELOPMENT PROJECT
 DRAFT TRANSPORTATION IMPACT STUDY CASTILIAN REDEVELOPMENT PROJECT Prepared for: Submitted by: 299 Lava Ridge Ct. Suite 2 Roseville, CA. 95661 June 212 TABLE OF CONTENTS 1. Introduction... 1 Project Location
Provide an overview of the development proposal including projected site traffic volumes;
 December 19, 2013 File: 163600935 Attention: Troy Elliott Carl Elliott Limited 15-1831 Robertson Road PO Box 11117 Nepean, Ontario K1H 7T8 Dear Mr. Elliott, Reference: 2235 and 2265 Robertson Road Transportation
Sugarland Crossing Gwinnett County, Georgia
 Sugarland Crossing Gwinnett County, Georgia S IGNAL W ARRANT A NALYSIS For the Intersection of: Sugarloaf Parkway / Richards Middle School Driveway / Sugarland Crossing Main Site Driveway Prepared for:
Traffic Impact Study Proposed Commercial Development Ballwin, Missouri. Technical Memorandum for Traffic Impact Study
 Traffic Impact Study Proposed Commercial Development Ballwin, Missouri Technical Memorandum for Traffic Impact Study Crawford, Bunte, Brammeier May 1, 2009 MEMORANDUM Date: April 24, 2009 To: From: Subject:
Ingraham High School Parking and Traffic Analysis
 Parking and Traffic Analysis Seattle, WA Prepared for: URS Corporation 1501 4th Avenue, Suite 1400 Seattle, WA 98101-1616 Mirai Transportation Planning & Engineering 11410 NE 122nd Way, Suite 320 Kirkland,
LATSON INTERCHANGE DEVELOPMENT TRAFFIC STUDIES. Genoa Township, Livingston County, MI
 LATSON INTERCHANGE DEVELOPMENT TRAFFIC STUDIES Genoa Township, Livingston County, MI DRAFT TRAFFIC STUDY FOR I-96 AT LATSON RD INTERCHANGE Livingston County CS 47065 JN 101622C Submitted to: Michigan Department
TRAFFIC IMPACT ANALYSIS
 TRAFFIC IMPACT ANALYSIS Emerald Isle Commercial Development Prepared by SEPI Engineering & Construction Prepared for Ark Consulting Group, PLLC March 2016 I. Executive Summary A. Site Location The Emerald
LAWRENCE TRANSIT CENTER LOCATION ANALYSIS 9 TH STREET & ROCKLEDGE ROAD / 21 ST STREET & IOWA STREET LAWRENCE, KANSAS
 LAWRENCE TRANSIT CENTER LOCATION ANALYSIS 9 TH STREET & ROCKLEDGE ROAD / 21 ST STREET & IOWA STREET LAWRENCE, KANSAS TRAFFIC IMPACT STUDY FEBRUARY 214 OA Project No. 213-542 TABLE OF CONTENTS 1. INTRODUCTION...
BUCKLEY ANNEX REDEVELOPMENT PLAN TRANSPORTATION ANALYSIS ADDENDUM
 BUCKLEY ANNEX REDEVELOPMENT PLAN TRANSPORTATION ANALYSIS ADDENDUM Prepared for: City and County of Denver Prepared by: Contact: Brian Bern, P.E., PTOE 303.572.0200 On Behalf of: Lowry Redevelopment Authority
D & B COMMERCIAL TRAFFIC IMPACT ANALYSIS
 D & B COMMERCIAL TRAFFIC IMPACT ANALYSIS TABLE OF CONTENTS I. Introduction...3 II. Project Description...3 III. Existing Conditions...3 IV. Future Traffic Conditions...8 V. Conclusions and Mitigation...14
Re: Cyrville Road Car Dealership
 1223 Michael Street, Suite 100, Ottawa, ON K1J 7T2 Tel: 613.738.4160 Fax: 613.739.7105 www.delcan.com February 25, 2013 OUR REF: TO3098TOE Mark Motors of Ottawa 611 Montreal Road Ottawa, ON K1K 0T8 Attention:
Traffic Impact Analysis Farmington Center Village
 Traffic Impact Analysis Farmington Center Village Route 4 (Farmington Avenue) Farmington, Connecticut Prepared for: The Town of Farmington, CT Prepared By: BL Companies Meriden, Connecticut December 2016
Traffic Engineering Study
 Traffic Engineering Study Bellaire Boulevard Prepared For: International Management District Technical Services, Inc. Texas Registered Engineering Firm F-3580 November 2009 Executive Summary has been requested
MINERVA PARK SITE TRAFFIC IMPACT STUDY M/I HOMES. September 2, 2015
 5500 New Albany Road Columbus, Ohio 43054 Phone: 614.775.4500 Fax: 614.775.4800 Toll Free: 1-888-775-EMHT emht.com 2015-1008 MINERVA PARK SITE TRAFFIC IMPACT STUDY M/I HOMES September 2, 2015 Engineers
One Harbor Point Residential
 Residential Gig Harbor, WA Transportation Impact Analysis January 23, 2017 Prepared for: Neil Walter Company PO Box 2181 Tacoma, WA 98401 Prepared by: TENW Transportation Engineering NorthWest 11400 SE
Freeway Weaving and Ramp Junction Analysis
 TEXAS TECH UNIVERSITY Freeway Weaving and Ramp Junction Analysis Along IH 27 at Plainview, TX Hao Xu, Jared A. Squyres, Wesley Kumfer, and Hongchao Liu 7/15/2011 Table of Contents Project Description...
BROWARD BOULEVARD CORRIDOR TRANSIT STUDY
 BROWARD BOULEVARD CORRIDOR TRANSIT STUDY FM # 42802411201 EXECUTIVE SUMMARY July 2012 GOBROWARD Broward Boulevard Corridor Transit Study FM # 42802411201 Executive Summary Prepared For: Ms. Khalilah Ffrench,
Traffic Impact Analysis. Alliance Cole Avenue Residential Site Dallas, Texas. Kimley-Horn and Associates, Inc. Dallas, Texas.
 Traffic Impact Analysis Alliance Cole Avenue Residential Site Dallas, Texas February 15, 2018 Kimley-Horn and Associates, Inc. Dallas, Texas Project #064524900 Registered Firm F-928 Traffic Impact Analysis
Re: Residential Development - Ogilvie/Cummings Transportation Overview
 1223 Michael Street, Suite 100, Ottawa, ON K1J 7T2 Tel: 613.738.4160 Fax: 613.739.7105 www.delcan.com March 28, 2012 OUR REF: TO3088TOY Barry J. Hobin & Architects 63 Pamilla Street Ottawa, ON K1S 3K7
Village of Richmond Transportation Brief
 Village of Richmond Transportation Brief GENIVAR Project Number 111-18482-00 June 21 st, 2011 www.genivar.com GENIVAR 15 Fitzgerald Road, Suite 100 Ottawa, Ontario, CANADA K2H 9G1 Telephone: 613-829-2800
TRAFFIC IMPACT STUDY DERRY GREEN CORPORATE BUSINESS PARK MILTON SECONDARY PLAN MODIFICATION
 TRAFFIC IMPACT STUDY DERRY GREEN CORPORATE BUSINESS PARK MILTON SECONDARY PLAN MODIFICATION TRAFFIC IMPACT STUDY DERRY GREEN CORPORATE BUSINESS PARK MILTON SECONDARY PLAN MODIFICATION DECEMBER 2014 UPDATED
Signal System Timing and Phasing Program SAMPLE. Figure 1: General Location Map. Second St.
 I. Overview Consultant A was retained by the Ohio Department of Transportation to conduct traffic signal timing analyses on approximately one mile of roadway on between the Main Street and the Fourth Street
Ref. No Task 3. April 28, Mr. Cesar Saleh, P. Eng. VP Planning and Design W.M. Fares Group th
 Ref. No. 151-00564 Task 3 April 28, 2015 Mr. Cesar Saleh, P. Eng. VP Planning and Design W.M. Fares Group th 3480 Joseph Howe Drive, 5 Floor HALIFAX NS B3L 4H7 Sent via Email to ceasr.saleh@wmfares.com
ARVADA TRIANGLE REDEVELOPMENT TRAFFIC IMPACT ANALYSIS
 ARVADA TRIANGLE REDEVELOPMENT TRAFFIC IMPACT ANALYSIS Prepared for: Arvada Urban Renewal Authority 5601 Olde Wadsworth Boulevard, Suite 210 Arvada, Colorado 80002 (720) 898-7062 Prepared by: Felsburg Holt
TRAFFIC SIGNAL DESIGN REPORT KING OF PRUSSIA ROAD & RAIDER ROAD RADNOR TOWNSHIP PENNSYLVANIA
 TRAFFIC SIGNAL DESIGN REPORT KING OF PRUSSIA ROAD & RAIDER ROAD RADNOR TOWNSHIP PENNSYLVANIA PREPARED FOR: UNIVERSITY OF PENNSYLVANIA HEALTH SYSTEM 34 CIVIC CENTER BOULEVARD PHILADELPHIA, PA 1987 (61)
MILLERSVILLE PARK TRAFFIC IMPACT ANALYSIS ANNE ARUNDEL COUNTY, MARYLAND
 MILLERSVILLE PARK TRAFFIC IMPACT ANALYSIS ANNE ARUNDEL COUNTY, MARYLAND Prepared for: Department of Public Works Anne Arundel County Prepared by: URS Corporation 4 North Park Drive, Suite 3 Hunt Valley,
Final Technical Report US 17 Corridor Study Update (Market Street Road Diet)
") Market Street Road Diet Wilmington, NC 2016 Final Technical Report US 17 Corridor Study Update (Market Street Road Diet) Wilmington, NC Parsons Brinckerhoff January 2016 FINAL TECHNICAL REPORT US 17 Corridor
Market Street Road Diet Wilmington, NC 2016 Final Technical Report US 17 Corridor Study Update (Market Street Road Diet) Wilmington, NC Parsons Brinckerhoff January 2016 FINAL TECHNICAL REPORT US 17 Corridor
West Hills Shopping Centre Lowe s Expansion Traffic Impact Study
 West Hills Shopping Centre Lowe s Expansion Traffic Impact Study Prepared for: Armel Corporation January 2015 Paradigm Transportation Solutions Ltd. 22 King Street South, Suite 300 Waterloo ON N2J 1N8
LOST LAKE CORRIDOR REVIEW
 LOST LAKE CORRIDOR REVIEW Prepared for: Prepared by: Broadview Developments Inc. c/o Westbrook Consulting Watt Consulting Group Our File: 2064.B01 Date: October 31, 2016 TABLE OF CONTENTS 1.0 INTRODUCTION...
Environmental Assessment Derry Road and Argentia Road Intersection
 Air and Noise Study Environmental Assessment Derry Road and Argentia Road Intersection Project 11-4295 City of Mississauga, Region of Peel October 17, 2014 1 Region of Peel Environmental Assessment for
Quantitative analyses of weekday a.m. and p.m. commuter hour conditions have been conducted for the following five scenarios:
 6.1 TRANSPORTATION AND CIRCULATION 6.1.1 INTRODUCTION This section of the EIR presents the results of TJKM s traffic impact analysis of the proposed Greenbriar Development. The analysis includes consideration
INDUSTRIAL DEVELOPMENT
 INDUSTRIAL DEVELOPMENT Traffic Impact Study Plainfield, Illinois August 2018 Prepared for: Seefried Industrial Properties, Inc. TABLE OF CONTENTS Executive Summary 2 Introduction 3 Existing Conditions
Proposed location of Camp Parkway Commerce Center. Vicinity map of Camp Parkway Commerce Center Southampton County, VA
 Proposed location of Camp Parkway Commerce Center Vicinity map of Camp Parkway Commerce Center Southampton County, VA Camp Parkway Commerce Center is a proposed distribution and industrial center to be
County State Aid Highway 32 (Cliff Road) and Dodd Road Intersection Study
 and Dodd Road Intersection Study") County State Aid Highway 32 (Cliff Road) and Dodd Road Intersection Study City of Eagan, Dakota County, Minnesota Date: March 2012 Project No. 14957.000 444 Cedar Street, Suite 1500 Saint Paul, MN 55101
County State Aid Highway 32 (Cliff Road) and Dodd Road Intersection Study City of Eagan, Dakota County, Minnesota Date: March 2012 Project No. 14957.000 444 Cedar Street, Suite 1500 Saint Paul, MN 55101
TRAFFIC IMPACT STUDY FOR SONIC DRIVE-IN RESTAURANT. Vallejo, CA. Prepared For:
 TRAFFIC IMPACT STUDY FOR SONIC DRIVE-IN RESTAURANT Vallejo, CA Prepared For: ELITE DRIVE-INS, INC. 2190 Meridian Park Blvd, Suite G Concord, CA 94520 Prepared By: KD Anderson & Associates 3853 Taylor Road,
Traffic Analysis for Bon Air Bridge Mitigation Magnolia Storm Water Quality Project
 Memo To: Paul DiDonato, ATI Architects and Engineers From: David Parisi, PE and Ashley Tam, EIT Date: February 23, 216 Subject: Traffic Analysis for Bon Air Bridge Mitigation Magnolia Storm Water Quality
Prepared For: Toronto Transit Commission 1138 Bathurst Street Toronto, Ontario M5R 3H2. Prepared By:
 TRAFFIC IMPACT STUDY FOR THE TTC MCNICOLL BUS GARAGE CITY OF TORONTO Prepared For: Toronto Transit Commission 1138 Bathurst Street Toronto, Ontario M5R 3H2 Prepared By: Canada Inc. 4th Floor, 3 Leek Crescent
Mr. Kyle Zimmerman, PE, CFM, PTOE County Engineer
 Los Alamos County Engineering Division 1925 Trinity Drive, Suite B Los Alamos, NM 87544 Attention: County Engineer Dear Kyle: Re: NM 502 Transportation Corridor Study and Plan Peer Review Los Alamos, New
Vanier Parkway and Presland Road Residential Development Transportation Impact Study
 Vanier Parkway and Presland Road Residential Development Transportation Impact Study Final Report (Revised) March 2011 Submitted to: Groupe Lépine Ottawa Project No. 09-1613 Submitted by: Groupe Lépine
Traffic Impact Analysis West Street Garden Plots Improvements and DuPage River Park Garden Plots Development Naperville, Illinois
 Traffic Impact Analysis West Street Garden Plots Improvements and DuPage River Park Garden Plots Development Naperville, Illinois Submitted by April 9, 2009 Introduction Kenig, Lindgren, O Hara, Aboona,
ZINFANDEL LANE / SILVERADO TRAIL INTERSECTION TRAFFIC ANALYSIS
 ZINFANDEL LANE / SILVERADO TRAIL INTERSECTION TRAFFIC ANALYSIS UPDATED TRAFFIC STUDY FOR THE PROPOSED RAYMOND VINEYARDS WINERY USE PERMIT MODIFICATION #P11-00156 AUGUST 5, 2014 PREPARED BY: OMNI-MEANS,
TIMBERVINE TRANSPORTATION IMPACT STUDY FORT COLLINS, COLORADO JANUARY Prepared for:
 TIMBERVINE TRANSPORTATION IMPACT STUDY FORT COLLINS, COLORADO JANUARY 2014 Prepared for: Hartford Companies 1218 W. Ash Street Suite A Windsor, Co 80550 Prepared by: DELICH ASSOCIATES 2272 Glen Haven Drive
June 21, Mr. Jeff Mark The Landhuis Company 212 North Wahsatch Avenue, Suite 301. Colorado Springs, CO 80903
 LSC TRANSPORTATION CONSULTANTS, INC. 545 East Pikes Peak Avenue, Suite 210 Colorado Springs, CO 80903 (719) 633-2868 FAX (719) 633-5430 E-mail: lsc@lsctrans.com Website: http://www.lsctrans.com June 21,
Weaver Road Senior Housing Traffic Impact Analysis
 Gibson Traffic Consultants, Inc. 2813 Rockefeller Avenue Suite B Everett, WA 9821 425.339.8266 Weaver Road Senior Housing Traffic Impact Analysis Jurisdiction: City of Snohomish January 218 GTC #17-37
Diablo Vista Pumping Plant Replacement
 Diablo Vista Pumping Plant Replacement Traffic Study PHA Transportation Consultants 12-05-359 October 2012 Diablo Vista Pumping Plant Replacement Traffic Study For EBMUD October 2012 PHA Transportation
TRAFFIC IMPACT STUDY DERRY GREEN CORPORATE BUSINESS PARK MILTON SECONDARY PLAN MODIFICATION
 TRAFFIC IMPACT STUDY DERRY GREEN CORPORATE BUSINESS PARK MILTON SECONDARY PLAN MODIFICATION TRAFFIC IMPACT STUDY DERRY GREEN CORPORATE BUSINESS PARK MILTON SECONDARY PLAN MODIFICATION DECEMBER 24 UPDATED
Lakeside Terrace Development
 Lakeside Terrace Development City of Barrie, County of Simcoe Traffic Brief for: Type of Document: Final Report Project Number: JDE 1617 Date Submitted: April 29 th, 216 4/29/16 John Northcote, P.Eng.
Traffic Impact Study for Proposed Olive Boulevard Development
 Traffic Impact Study for Proposed 11330 Olive Boulevard Development Creve Coeur, Missouri July 7, 2017 Prepared For: 11330 Olive Boulevard Development 11330 Olive Boulevard Creve Coeur, Missouri 63141
1012 & 1024 McGarry Terrace
 December 217 112 & 124 McGarry Terrace Transportation Impact Study 112 & 124 McGarry Terrace Transportation Impact Study prepared for: Lépine Corporation 32 March Road Kanata, ON K2K 2E3 prepared by: 1223
Richards Boulevard Olive Drive Corridor
 Richards Boulevard ive Corridor December 2016 RS16-3438 Richards Boulevard-ive Corridor Table of Contents EXECUTIVE SUMMARY... 5 1.0 INTRODUCTION... 8 Study Area... 8 Report Organization... 11 2.0 EXISTING
Volume 1 Traffic Impact Analysis Turtle Creek Boulevard Dallas, Texas. Kimley-Horn and Associates, Inc. Dallas, Texas.
 Volume 1 Traffic Impact Analysis 2727 Dallas, Texas June 18, 2018 Kimley-Horn and Associates, Inc. Dallas, Texas Project #064523000 Registered Firm F-928 Traffic Impact Analysis 2727 Dallas, Texas Prepared
TRAFFIC IMPACT ANALYSIS FOR. RESIDENCE INN PROJECT Davis, CA. Prepared For: JACKSON PROPERTIES 155 Cadillac Drive, Suite 100 Sacramento, CA 95825
 TRAFFIC IMPACT ANALYSIS FOR RESIDENCE INN PROJECT Davis, CA Prepared For: JACKSON PROPERTIES 155 Cadillac Drive, Suite 100 Sacramento, CA 95825 Prepared By: KD Anderson & Associates, Inc. 3853 Taylor Road,
Lacey Gateway Residential Phase 1
 Lacey Gateway Residential Phase Transportation Impact Study April 23, 203 Prepared for: Gateway 850 LLC 5 Lake Bellevue Drive Suite 02 Bellevue, WA 98005 Prepared by: TENW Transportation Engineering West
830 Main Street Halifax Regional Municipality
 830 Main Street Halifax Regional Municipality Traffic Impact Statement Final Report Prepared by: GRIFFIN transportation group inc. 30 Bonny View Drive Fall River, NS B2T 1R2 www.griffininc.ca Prepared
April 7, Mr. Blake Shutler Compass Homes Development LLC Summit Homes Construction, LLC PO Box 6539 Dillon, CO 80435
 Compass Homes Development LLC Summit Homes Construction, LLC PO Box 6539 Dillon, CO 80435 Re: Trip Generation Comparison West Hills Townhomes Keystone, Colorado FHU Reference No. 116388-01 Dear Mr. Shutler:
APPENDIX A LEVEL OF SERVICE CONCEPTS, ANALYSIS METHODOLOGIES,STANDARDS OF SIGNIFICANCE
 APPENDIX A LEVEL OF SERVICE CONCEPTS, ANALYSIS METHODOLOGIES,STANDARDS OF SIGNIFICANCE Roadway Segment Level of Service Definitions LOS V/C Congestion/Delay Traffic Description (Used for surface streets,
Critical Movement* Delay (sec/veh) Critical Movement* LOS 8 a.m. 9 a.m. B 25.2 C. 3 p.m. 4 p.m. B 17.3 B
 Critical Movement* LOS 8 a.m. 9 a.m. B 25.2 C. 3 p.m. 4 p.m. B 17.3 B") Memorandum DATE: AUGUST 1, 2013 TO: PAUL TILTON, P.E., SANDWICH DPW DIRECTOR/TOWN ENGINEER FROM: LEV MALAKHOFF, SR. TRANSPORTATION ENGINEER RE: ROUTE 130/QUAKER MEETINGHOUSE ROAD INTERSECTION Paul: Per
Memorandum DATE: AUGUST 1, 2013 TO: PAUL TILTON, P.E., SANDWICH DPW DIRECTOR/TOWN ENGINEER FROM: LEV MALAKHOFF, SR. TRANSPORTATION ENGINEER RE: ROUTE 130/QUAKER MEETINGHOUSE ROAD INTERSECTION Paul: Per
Winnetka Avenue Bike Lanes Traffic Impact Analysis
 Winnetka Avenue Bike Lanes Traffic Impact Analysis January 4, 2019 Prepared by City of Los Angeles Department of Transportation Active Transportation Division Winnetka Ave Bike Lanes Traffic Impact Analysis
Traffic Impact Study Speedway Gas Station Redevelopment
 Traffic Impact Study Speedway Gas Station Redevelopment Warrenville, Illinois Prepared For: Prepared By: April 11, 2018 Table of Contents 1. Introduction... 1 2. Existing Conditions... 4 Site Location...
Paisley & Whitelaw - Paisley Park OPA / ZBA for Mixed Density Residential Use
 Paisley & Whitelaw - Paisley Park OPA / ZBA for Mixed Density Residential Use Transportation Impact Study City of Guelph Prepared for: Armel Corporation August 2018 Table of Contents 1 Introduction...
MURRIETA APARTMENTS TRAFFIC IMPACT ANALYSIS CITY OF MURRIETA, CALIFORNIA
 MURRIETA APARTMENTS TRAFFIC IMPACT ANALYSIS CITY OF MURRIETA, CALIFORNIA SEPTEMBER 20, 2012 Prepared for: Golden Eagle Multi-Family Properties, LLC 6201 Oak Canyon Rd., Suite 250 Irvine, CA 92618 Prepared