State Route 1/State Route 41/ Main Street Intersection Control Evaluation (Step 2) Report. City of Morro Bay. Prepared for: Prepared by:
|
|
|
- Elwin Barber
- 6 years ago
- Views:
Transcription
")

1 State Route 1/State Route 41/ Main Street Intersection Control Evaluation (Step 2) Report Prepared for: City of Morro Bay Prepared by: (Caltrans Project No , EA 0F670)
2 State Route 1/State Route 41/Main Street Intersection Control Evaluation (Step 2) Report Prepared for: Morro Bay 595 Harbor Street Morro Bay CA Prepared by: Omni-Means, Ltd. 669 Pacific Street, Suite A San Luis Obispo, CA (805) (Final) May R1881RPT008 (Caltrans Project No , EA 0F670)
3
4 TABLE OF CONTENTS 1. Executive Summary Introduction Need & Purpose Project Funding... 2 FUNDING TABLE Existing Conditions Existing Roadway Geometric Features Existing Data Existing Land Uses Collision History Transportation Planning Document State Route 1 Transportation Concept Report Route Concept and Corridor Vision Design Vehicle State Route 41 Transportation Concept Report Route Concept and Corridor Vision Design Vehicle Multi-Modal Transportation Public Transportation Bicycle Facilities Pedestrian Facilities Design Year Volumes Design Alternatives No Build Alternative Signal Alternative Signal Performance Checks Roundabout Alternative... 9 Final State Route 1/State Route 41 Intersection Control Evaluation (ICE) - Step - 2 City of Morro Bay Page i R1881RPT008
5 Roundabout Performance Checks Fastest Path and Vehicle Speed Checks Natural Path Alignment Sight Distance View Angles Alternative Design Consideration Features Guide Signing Truck Accommodation Pedestrian/Bike Accommodation Signal Alternative Roundabout Alternative Safety Characteristics Non-Conforming Features Signal Alternative Roundabout Alternative Traffic Operations & Safety Analysis Traffic Operations Analysis Analysis Criteria Signal Alternative Analysis Interim Design Year (2030) Ultimate Design Year (2040) SR 41/SR 1 SB Ramp Intersection Roundabout Alternative Analysis Interim Design Year (2030) Ultimate Design Year (2040) Safety Analysis CMF for total crashes: CMF for fatal/severe injury crashes Number of Conflicting Points Reduced Speed Potential and Crash Severity Potential Life-Cycle Analysis Final State Route 1/State Route 41 /Main Street Intersection Control Evaluation (ICE) - Step 2 City of Morro Bay Page ii R1881RPT008
6 9.1. Collision Costs Mobility Costs Environmental Costs Other Costs Operation & Maintenance Cost Landscape Maintenance Cost Pavement Rehabilitation Service Life Summary of Findings Recommendations Appendix... 1 LIST OF FIGURES Figure 1: Signal Phasing... 7 Figure 2: Available Corner Sight Distance... 9 Figure 3: Preliminary Roundabout Geometrics Figure 4 - Fast Path Critical Speed Locations Figure 5: Fastest Path Design Figure 6: Natural Path Design Figure 7: Intersection Sight Distance Figure 8: Stopping Sight Distance Figure 9: View Angles Figure 10: Typical Conflict Points at Typical Intersections Final State Route 1/State Route 41 /Main Street Intersection Control Evaluation (ICE) - Step 2 City of Morro Bay Page iii R1881RPT008
7 LIST OF TABLES Table 1 Funding Summary No Table 2 Intersection Traffic Collision Data... 4 Table 3 Fastest Path Vehicle Speeds Table 4 Natural Path Vehicle Speeds Table 5 Intersection Sight Distance Table 6 Stopping Sight Distance to Entry Table 7 Stopping Sight Distance to Pedestrian Crossing Table 8A Interim Design Year (2030) AM Peak Hour Signal Alternative Table 8B Interim Design Year (2030) PM Peak Hour Signal Alternative Table 9A Ultimate Design Year (2040) AM Peak Hour Signal Alternative Table 9B Ultimate Design Year (2040) PM Peak Hour Signal Alternative Table 10 Eastbound SR 41/SR 1 NB Ramp Approach Queuing Analysis Table 11A Interim Design Year (2030) AM Peak Hour Roundabout Alternative Table 11B Interim Design Year (2030) PM Peak Hour Roundabout Alternative Table 12A Ultimate Design Year AM Peak Hour Roundabout Alternative Table 12B Ultimate Design Year PM Peak Hour Roundabout Alternative Table 13 Alternative Performance Comparison APPENDIX Appendix A Traffic Volumes Appendix B Truck Turn Exhibits Appendix C East SR 41 Access Exhibit Appendix D Level of Service (LOS) Criteria Appendix E Synchro/ Sim Traffic Outputs Appendix F Sidra Outputs Appendix G Cost Estimates Appendix H Response to Comments Design Memorandum Final State Route 1/State Route 41 /Main Street Intersection Control Evaluation (ICE) - Step 2 City of Morro Bay Page iv R1881RPT008
8 1. Executive Summary Omni-Means conducted this traffic operations report in support of the Intersection Control Evaluation (ICE) process for the City of Morro Bay to evaluate three (3) alternatives at the State Route (SR) 1 Northbound Ramps / SR 41 and at the SR 41 / Main Street intersections (hereafter referred to as the SR 1/SR 41/Main Street intersections). The alternatives that were evaluated as part of this analysis are provided below: a) No Build Alternative b) Signal Alternative c) Roundabout Alternative The No Build alternative utilized the existing lane geometrics and intersection control at the SR 1/SR 41/Main Street intersections. This alternative did not provide acceptable operations beyond the year 2020 horizon. This alternative is projected to provide unacceptable LOS in Baseline Conditions. As such, this alternative was not included for further analysis in the ICE alternatives comparison. The ICE process alternative comparison includes evaluation of two build alternatives, a Signal alternative and a Roundabout alternative at the study intersections. The evaluation was based on design features, traffic operations, design life for year 2020 (opening), year 2030 (interim), and year 2040 (ultimate) conditions, and overall life-cycle cost analysis. The key findings were as follows: With respect to traffic operations, the Roundabout alternative is projected to provide acceptable LOS, delays and queues for the opening, interim, and ultimate design years for all approaches. The Signal alternative is projected to provide acceptable LOS, delays, and queues for the opening year; however, in regards to the interim and ultimate design year, this alternative would not provide acceptable LOS, delays, and queues. Under year 2030 (interim) design conditions, the 95th percentile queues for the eastbound left turn and eastbound through/ right lane are expected to spill back past the southbound ramps. Under year 2040 (ultimate) design conditions, the intersection will be operating at a LOS D for the AM peak hour. In addition to the spillback from the eastbound queues, the southbound right turn from Main Street is projected to have an unacceptable 95th percentile queue. The Roundabout and Signal alternatives both provide equal pedestrian access. With respect to access to Sunset Street, both alternatives would restrict eastbound left turns. The Signal alternative will provide a potentially unsafe southbound left turn movement. In regards to access to the gas station, both alternatives allow for full access. The Roundabout alternative would provide left turn access via u-turns in the roundabout. The Signal alternative may provide a potentially unsafe left turn movement into the gas station. The Roundabout alternative is estimated to have a higher construction cost and require more right-of-way take than the Signal alternative. The Roundabout alternative performed better when compared to the Signal alternative in terms of the collision and mobility costs. Final State Route 1/State Route 41 Intersection Control Evaluation (ICE) - Step - 2 Page 1 City of Morro Bay R1881RPT008
9 The Roundabout alternative met more performance measures when compared to the Signal alternative. Based on the results of this analysis, the City of Morro Bay should recommend the Roundabout alternative as the preferred alternative for State Route 1/ State Route 41/ Main Street intersection. 2. Introduction This report has been prepared to present the results of conceptual alternatives analysis performed by Omni-Means for the City of Morro Bay in support of the Intersection Control Evaluation (ICE)-Step 2 process. The term project, as used in this report, refers to potential improvements that can be constructed at the SR 1/SR 41/Main Street intersections. The project is located in the northern end of the City of Morro Bay. 2.1 Need & Purpose Omni-Means completed the Intersection Control Evaluation (ICE)-Step 1 process in December 2014 where it was identified that the greatest challenge to improving the operation of these intersections is their close proximity to one another. The intersection currently experiences congested conditions; therefore, improvement alternatives should focus on reducing congestion and improving safety conditions at these two intersections. The two study intersections are approximately 75 feet apart. The SR 41/ SR 1 northbound ramps intersection is stop controlled on the northbound ramps approach and the SR 41/Main Street intersection is stop controlled on all four approaches. Due to the close intersection spacing and the existing control, the two intersections operate as one intersection with five approaches and exits, including SR 41 (also known as Atascadero Road) extending to the east and the west, Main Street which extends to the north and south, and the SR 1 northbound on and off-ramps extending to the north and south, respectively. Currently, these intersections operate as one unsignalized intersection and present a number of challenges for any operational improvement alternative. The combined intersection of SR 1 NB ramps/sr 41/Main Street is currently operating at unacceptable conditions. These conditions will be further exacerbated with Year 2030 (interim) and Year 2040 (ultimate) traffic volumes. With the close proximity of the intersections, any signalized improvements would have to be phased and coordinated in such a way to minimize queues between the intersections and ensure that queues do not block or restrict other movements. The provision of a roundabout at this location offers an alternative to the Signal alternative. This alternative features the construction of a six-leg roundabout, where the general alignment of the intersection would remain the same. The proposed roundabout alternative is similar to what was proposed in the Initial Study & Checklist Roundabout at Main St/Route 1/Route 41 Intersection document dated September 20, Project Funding There is an existing Cooperative Agreement ( ) between the City of Morro Bay an Caltrans for the study intersection. Table 1 is a copy of the Funding Summary No. 01 table as provided in the Cooperative Agreement. Final State Route 1/State Route 41 /Main Street Intersection Control Evaluation (ICE) - Step 2 Page 2 City of Morro Bay R1881RPT008
10 TABLE 1 FUNDING SUMMARY NO. 1 FUNDING TABLE v. 112 IMPLEMENTING AGENCY CITY CITY CITY Source FUNDING PARTNER Fund Type PA&ED PS&E R/W SUPPORT R/W CAPITAL Totals Federal CITY CMAQ * 120, , ,000 Federal CITY RSTP * 0 113, ,000 Federal CITY CMAQ * 0 41,285 37,500 62, ,285 Local CITY Local 104, ,430 Local CITY Local 0 41,285 37,500 62, ,285 *This fund type includes federal funds Totals 225, ,000 75, , ,000 As shown in Table 1, the project is currently funded using a combination of City (local) funds and Federal CMAQ and RSTP funds. The project has funding for PA & ED, PS&E, and Right of Way phases of the project. The agencies will update the funding for construction and construction oversight phases after the preferred alternative is selected and will be sourced from Local, Federal, and State funds. 3. Existing Conditions 3.1 Existing Roadway Geometric Features State Route 1 (SR 1) traverses north-south along the coast of California. SR 1 in this area serves as the main inter-regional auto and truck travel route that connects the coastal communities including Big Sur, Cambria, Cayucos, and Morro Bay with the San Luis Obispo area to the southeast and the Monterey Bay area to the north. Within the City of Morro Bay, SR 1 serves as a commuter route providing north-south circulation. Within the study area, SR 1 is a four-lane divided freeway with a grassy median. State Route 41 (SR 41) is a state highway facility which traverses east-west connecting Morro Bay to Atascadero and ultimately to SR 46, a route which connects to California's Central Valley. Within the study area, SR 41 is a principal arterial which passes through intersections at Sunset Street and extends west under SR 1 as Atascadero Road. Access to SR 1 is provided through a tight diamond interchange with two unsignalized ramp intersections on either side of the overcrossing. Main Street is a north-south minor arterial that runs east of and parallel to SR 1 from the northern City limits to the interchange with SR 1. South of the interchange, Main Street provides Final State Route 1/State Route 41 /Main Street Intersection Control Evaluation (ICE) - Step 2 Page 3 City of Morro Bay R1881RPT008
11 service to the downtown core of Morro Bay. In the study area, Main Street is parallel to SR 1 and is offset approximately 20 to 100 feet from the SR 1 main line. 3.2 Existing Data Traffic and pedestrian volumes collected in February 2014 during both AM-peak hour and PMpeak hour by Ruettgers & Schuler for the 'Sonic Drive-in Restaurant Traffic Impact Study in Morro Bay, California (Sonic TIS) were utilized in this study. This information was supplemented with Average Daily Traffic count and heavy vehicle data conducted in May 2014 for the SR 41 segment. The truck percentages were observed to be 3% in the AM peak hour and 2% in the PM peak hour. 3.3 Existing Land Uses On the west side of SR 1, Morro Bay High School is on the north side and two hotels and a park are on the south side. Farther down Atascadero Road are two RV parks and access to the beach. On the east side of SR 1, the adjacent land uses are commercial. The southeast corner houses a Chevron gas station with driveways located on Main Street and SR 41. There is a liquor store to the east of the gas station and a Taco Bell located to the south. The northeast corner is the location of a proposed Sonic Drive-In restaurant. Beyond these commercial land uses, residential areas are the primary surrounding land uses. 3.4 Collision History Traffic Accident Surveillance and Analysis (TASAS), Table B Selective Accident Rate Calculation collision data was obtained from Caltrans for the three year period from October 1, 2010 through September 30, 2013 at the SR 41 intersections with both the SR 1 northbound ramps (PM 0.021) and with Main Street (PM 0.040). Table 2 provides the number of collisions and the corresponding collision rates at both intersections during this three-year period. Intersections SR 41 / SR 1 NB Ramps TABLE 2 INTERSECTION TRAFFIC COLLISION DATA (October 1, 2010 through September 30, 2013) No. of Collisions / Actual Significance Collision Rates Average Collision Rates FAT INJ F + I TOTAL FAT F + I TOTAL FAT F + I TOTAL SR 41 / Main Street As shown in Table 2, one (1) collision was reported at the SR 41/SR 1 NB Ramps intersection and two (2) collisions were reported at the SR 41/Main Street intersection during the 3-year period. As also shown, the actual collision rates are lower than the respective statewide average collision rates for similar facilities at both of the SR 41 intersections. Final State Route 1/State Route 41 /Main Street Intersection Control Evaluation (ICE) - Step 2 Page 4 City of Morro Bay R1881RPT008
12 3.5. Transportation Planning Document State Route 1 Transportation Concept Report Route Concept and Corridor Vision The SR 1 Transportation Conceptual Report (TCR) provides the long-range planning concept for the corridor through the year SR 1 in the project vicinity is in an urban area with level terrain. SR 1 in the project vicinity accommodates local and regional trips between North Coast communities as well as interregional tourist trips to Central Coast destinations. The transportation concept for SR 1 in the project's vicinity is peak LOS C/D or better. The TCR states that the interchange with SR 41 operates poorly due to the spillback from queues generated at the intersection of SR 1/SR 41/ Main Street. The interchange of SR 1 with SR 41 is identified as needing improvement, and a roundabout would clear the intersection more effectively than existing conditions. The facility in existing conditions is generally a four-lane expressway with a short freeway section in the project vicinity. It is proposed to consolidate access in order to eventually convert the facility to a four-lane freeway Design Vehicle SR 1 is designated as a Terminal Access (STAA) facility. Therefore, the STAA-standard truck was used as the design vehicle for SR 1 in preparing the alternative improvement concepts State Route 41 Transportation Concept Report Route Concept and Corridor Vision The SR 41 Transportation Conceptual Report (TCR) provides the long-range planning concept for the corridor through the year SR 41 in the project vicinity is in an urban area with level terrain. SR 41 in the project vicinity accommodates local and regional trips between North Coast communities as well as interregional tourist trips to Central Coast destinations. The transportation concept for SR 41 in the project's vicinity is peak LOS C or better. The facility in existing conditions is a two-lane conventional highway with a continuous left-turn lane. SR 41 is proposed to remain as is, with improvements to the intersection with Main Street and the interchange with SR 1. Operational and landscaping improvements are also proposed to SR Design Vehicle SR 41 is designated as a Terminal Access (STAA) facility. Therefore, the STAA-standard truck was used as the design vehicle for SR 41 in preparing the alternative improvement concepts. Because SR 41 also provides access with Main Street, and as Main Street is not designated as a Terminal Access (STAA) facility, the California Legal (50) truck was also used as the design vehicle for movements between SR 41 and Main Street Multi-Modal Transportation Public Transportation San Luis Obispo Regional Transportation Authority (SLORTA) Route 15 operates a fixed route service between Morro Bay and San Simeon, which passes through the project intersections. Final State Route 1/State Route 41 /Main Street Intersection Control Evaluation (ICE) - Step 2 Page 5 City of Morro Bay R1881RPT008
13 This route has a transit stop on Main Street at Errol Street (approximately 400' south of SR 41). The Morro Bay Transit (MBT) North Morro Bay Route has a stop at the same location Bicycle Facilities Currently, there are Class II bike lanes delineated on Main Street in both directions. On the west side of SR 1, there is an existing Class I bike path that is parallel to SR 1 and connects the downtown area to North Morro Bay Pedestrian Facilities Continuous pedestrian facilities currently do not exist along Main Street and SR 41 through the study area. Sidewalks are present along the east side of Main Street and on SR 41 under the overcrossing and on the southeast corner along the gas station property. The City of Morro Bay Bike and Pedestrian Master Plan 2011 identifies two improvements near the study location: improve sidewalk along Main Street south of SR 41 and Atascadero Road safety improvements at the overcrossing. There are marked pedestrian crossings across each leg of the intersections; however, not all curb ramps meet current ADA standards. No signage for pedestrian crossings is currently provided for these crosswalks. 4. Design Year Volumes Previously, Omni-Means prepared the State Route 1/State Route 41/Main Street Intersection Control Evaluation (ICE) - Step 1, dated December 2014 that analyzed the alternatives using the SLOCOG traffic model and input from the City of Morro Bay. It should be noted that the Caltrans historic data for SR 41 shows that the average daily traffic has generally declined in Morro Bay over the past decade. This procedure is consistent with the assumptions used in the Sonic TIS and accepted by Caltrans. The ICE Step 1 evaluation assumed that the year 2020 represented the project s opening year. Caltrans stipulates that interim projects be designed for at least a 10-year design life. Therefore, the year 2030 was assumed to represent the interim design year. Sonic TIS project only volumes were added to the year 2030 conditions derived through the use of 2% annual growth rate to obtain the interim design year (2030) traffic volumes. The year 2030 volumes were then further adjusted through a 1% straight line annual growth rate annually until the year 2040 to derive the ultimate design year (2040) traffic volumes. The interim (2030) and ultimate (2040) design year peak hour traffic volumes developed for the ICE Step 1 evaluation were again used for the ICE Step 2 alternatives analysis. The peak hour turning movement counts are provided in Appendix A. 5. Design Alternatives This study included analysis of three different alternatives. The first alternative is a No Build alternative that assumes existing lane geometrics and control for various analysis periods. The second alternative is the Signalized alternative with modified lane geometrics. The third alternative is the Roundabout alternative with modified lane geometrics. The signal alternative and roundabout alternative are consistent with what was provided in the Draft Project Report phase of the project (September 2002). Final State Route 1/State Route 41 /Main Street Intersection Control Evaluation (ICE) - Step 2 Page 6 City of Morro Bay R1881RPT008


14 5.1. No Build Alternative Within this alternative, the existing lane geometrics and control were utilized. This alternative is projected to provide unacceptable LOS in Baseline Conditions. As such, the alternative was not included in the ICE alternatives comparison. However, the summary of the delay and LOS is provided in the subsequent section Signal Alternative With the Signal alternative, the study intersection controls are converted from an all-way stop control to a coordinated signalized intersection system. The Signal alternative lane geometrics are shown on Figure 1. The signals are coded in such a way that they are operated by one controller to provide better circulation between the two study intersections. The proposed signal phasing along with a brief description of the signal phasing is expected to operate is also provided in Figure 1. Figure 1: Signal Phasing Notes: #1 refers to the signalized intersection of SR 1 NB Ramps/SR 41 and #2 refers to the signalized intersection of SR 41/Main Street When the northbound left (phase 5) and southbound left (phase 1) at the SR 41/Main Street intersection (intersection #2) receive green time, the westbound through Final State Route 1/State Route 41 /Main Street Intersection Control Evaluation (ICE) - Step 2 Page 7 City of Morro Bay R1881RPT008
15 movement at the SR 1 NB Ramps/SR 41 intersection (intersection #1) will also receive green time. When the northbound and southbound through and right turn movements (phase 14 and phase 10) at the SR 41/Main Street intersection (intersection #2) receive green time, the westbound through movement at the SR 1 NB Ramps/SR 41 intersection (intersection #1) will also receive green time. When the westbound left and through movements (phase 3 and phase 8) at the SR 41/Main Street intersection (intersection #2) receive green time, the westbound through movement at the SR 1 NB Ramps/SR 41 intersection (intersection #1) will also receive green time. When the eastbound left and through movements (phase 7 and phase 4) at the SR 41/Main Street intersection (intersection #2) receive green time, the eastbound left and through movements at the SR 1 NB Ramps/SR 41 intersection (intersection #1) will also receive green time. When the northbound left and right turn movements (phase 11) at the SR 1 NB Ramps/SR 41 intersection (intersection #1) receive green time, the eastbound left, through and right movements at the SR 41/Main Street intersection (intersection #2) will also receive green time. As such, the signals would work in a system where the queues between the NB ramps and Main Street will be insignificant (approximately 1 vehicle) Signal Performance Checks The following design criteria were used to analyze the geometrics and safety performance of the proposed Signal alternative: The STAA-Standard-56 design vehicle from the Caltrans Highway Design Manual, 6th Edition (update September 2014) shall be accommodated on all movements from SR 1 and SR 41. The "California Legal" design vehicle from the Caltrans Highway Design Manual, 6th Edition (update September 2014) shall be accommodated on all movements from Main Street. Exhibits illustrating the truck off-tracking for each condition are provided in Appendix B. The existing SR 1 structure over SR 41 represents a potential restrictive condition for providing the required corner sight distance for signalized intersections between both the SR 1 northbound off-ramp and northbound Main Street and eastbound SR 41 as defined in HDM Index 405.1(2)(b). Figure 2 presents the available corner sight distance at both locations. The corner sight distance triangles shown on Figure 2 are based on the posted 25 mph speed limit on eastbound SR 41 downstream from the intersections and the corresponding stopping sight distance (150 feet at 25 mph) as given in Table in the HDM. As shown on the figure, the required sight distance would be provided between northbound Main Street and eastbound SR 41. With modifications to the existing SR 1 side slope and vegetation at the SR 41 undercrossing, the analysis indicates that the required sight distance can also be provided between the SR 1 northbound off-ramp and eastbound SR 41. Final State Route 1/State Route 41 /Main Street Intersection Control Evaluation (ICE) - Step 2 Page 8 City of Morro Bay R1881RPT008

16 Figure 2: Available Corner Sight Distance 5.3. Roundabout Alternative The Roundabout alternative features the construction of a six-leg roundabout, where the general alignment of the intersection would remain the same. The proposed roundabout alternative is similar to what was proposed in the Initial Study & Checklist Roundabout at Main St/Route 1/Route 41 Intersection document dated September 20, The preliminary geometrics for the proposed roundabout alternative are shown on Figure 3. Due to the complexity in the design, several performance checks need to be conducted to verify the Roundabout's feasibility. These performance checks meet current Caltrans TOPD and HDM which mandates conformance with the National Cooperative Highway Research Program (NCHRP) Report 672 entitled "Roundabouts An Informational Guide, 2nd edition". Performance measures listed in the NCHRP Report 672 are described in Section Final State Route 1/State Route 41 /Main Street Intersection Control Evaluation (ICE) - Step 2 Page 9 City of Morro Bay R1881RPT008
17
18 Roundabout Performance Checks The following design criteria were used to analyze the geometrics and safety performance of the proposed Roundabout alternative: Criteria and methodologies to be consistent with Caltrans DIB 80-01, Caltrans Highway Design Manual, and Report 672 of the National Cooperative Highway Research Program (NCHRP) titled Roundabouts: An Informational Guide (Second Edition). This document supersedes the original roundabout guide published by the FHWA in The STAA-Standard-56 design vehicle from the Caltrans Highway Design Manual, 6th Edition (update September 2014) shall be accommodated on all movements from SR 1 and SR 41 and for all Main Street movements to/from the SR 1 NB on and off ramps. The "California Legal" design vehicle from the Caltrans Highway Design Manual, 6th Edition (update September 2014) shall be accommodated on all movements from Main Street. These vehicles shall be accommodated such that the tractor portion of the vehicle does not need to mount any truck aprons. The Bus-45, motor coach design vehicle from the Caltrans Highway Design Manual, 6th Edition (update September 2014) shall be accommodated on all movements. This vehicle shall be accommodated such that it does not need to mount any truck aprons. Fast path entry speeds on single lane roundabout approaches should be 25 mph or less. Fast path entry speeds on multi-lane approaches should be 30 mph or less. Minimum stopping sight distance for posted speed limits should be provided for vehicles approaching roundabout entrances and pedestrian crosswalks. View angles for all legs of the roundabout should be no more than 15 degrees. Entry angles for all legs of the roundabout should be between 20 and 40 degrees Fastest Path and Vehicle Speed Checks The Fastest Path represents the path that the most aggressive drivers could take through the roundabout and assumes no other traffic to be within the intersection. NCHRP Report 672 indicates that the recommended maximum vehicle entry speeds along the fastest path should be less than 25 mph at urban single-lane roundabouts, and less than 30 mph at urban multilane roundabouts. NCHRP Report 672 also indicates that the differential speed between consecutive or conflicting projected fast path speeds should be less than 15 mph. Fast path speeds are determined for five locations per approach. These include entry speeds (referred to as V1); through movement circulating speeds (V2); exiting speeds (V3); left turn movement circulating speeds (V4); and right turn speeds (V5). A diagram of the described locations is shown in Figure 4. Final State Route 1/State Route 41 /Main Street Intersection Control Evaluation (ICE) - Step 2 Page 11 City of Morro Bay R1881RPT008
19 Figure 4 - Fast Path Critical Speed Locations Fastest-path speeds for the Roundabout alternative are provided below in Table 3 and shown on Figure 5. TABLE 3 FASTEST PATH VEHICLE SPEEDS Northbound Northbound Southbound Eastbound Westbound Movement SR 1 NB Off-Ramp Main Street Main Street SR 41 SR 41 (N#) (n#) (S#) (E#) (W#) Entering (V1) Circulating (V2) Exiting (V3) Left Turn (V4) Right Turn (V5) N/A Notes: All values are in miles per hour V3 exiting speeds are derived from vehicle acceleration formulas in NCHRP 672 V3 fast path speed measured at exit crosswalk or 100 feet downstream from V2. 2% cross-slope assumed for determining Fastest path As shown in Table 3 and on Figure 5, the proposed Roundabout alternative achieves the target safety performance criteria for fast-path and vehicle speed through the corridor. Final State Route 1/State Route 41 /Main Street Intersection Control Evaluation (ICE) - Step 2 Page 12 City of Morro Bay R1881RPT008
20 Northbound Northbound SOUTHBOUND EASTBOUND WESTBOUND MOVEMENT SR1 NB Off Ramp Main St Main St SR41 SR41 (N#) (n#) (S#) (E#) (W#) ENTERING (R1) CIRCULATING (R2) EXITING (R3) LEFT TURN (R4) RIGHT TURN (R5) Northbound Northbound Southbound Eastbound Westbound MOVEMENT SR1 NB Off Ramp Main St Main St SR41 SR41 (N#) (n#) (S#) (E#) (W#) ENTERING (V1) CIRCULATING (V2) EXITING (V3) LEFT TURN (V4) RIGHT TURN (V5) N/A
21 Natural Path Alignment The Natural Path is the path that drivers will comfortably and naturally steer their vehicle through the roundabout, assuming that other traffic is also present in the intersection. Determining natural paths is particularly important on multi-lane approaches and circulating areas of roundabouts when considering the potential for path overlap problems. In order for most drivers to drive a fluid and natural path, consecutive curve radii and associated speeds should not differ drastically, and sufficient space should be provided for drivers to transition between reversing curves. Natural paths for the proposed roundabout are detailed in Table 4. TABLE 4 NATURAL PATH VEHICLE SPEEDS SR 41 Westbound Movement Left Through/ Right (W1#) (W2#) Entering (V1) Circulating (V2) Exiting (V3) N/A 23.3 Left Turn (V4) 15.2 N/A Right Turn (V5) N/A N/A Notes: All values are in miles per hour V3 exiting speeds are derived from vehicle acceleration formulas in NCHRP 672 V3 natural path speed measured at exit crosswalk or 100 feet downstream from V2. N/A = Natural path speed does not exist for this approach 2% cross-slope assumed for determining natural path As shown in Table 4 and on Figure 6, the proposed Roundabout alternative meets the performance criteria for natural paths through the corridor Sight Distance Intersection sight distance differs at roundabouts versus other intersections. Drivers must be able to see potentially conflicting oncoming traffic from the left as they approach the roundabout entry. NCHRP Report 672 provides methodologies to establish the required sight distance triangles for conflicting traffic in both the entering and circulating approaches. The stopping and intersection sight distance triangles were overlaid onto the 2030 Interim roundabout concept to show clear vision areas for the intersection. Sight distance lengths vary according to vehicle fast path vehicle speeds. Table 5 presents the required intersection sight distances with the corresponding sight triangles shown on Figure 7. Both Table 5 and Figure 7 show that the required intersection sight distance would be provided on all movements. Final State Route 1/State Route 41 /Main Street Intersection Control Evaluation (ICE) - Step 2 Page 14 City of Morro Bay R1881RPT008
22 SR 41 MOVEMENT LEFT (W1#) THRU/ RIGHT (W2#) ENTERING (R1) CIRCULATING (R2) EXITING (R3) LEFT TURN (R4) 56.3 RIGHT TURN (R5) SR 41 MOVEMENT LEFT (W1#) THRU/ RIGHT (W2#) ENTERING (V1) CIRCULATING (V2) EXITING (V3) N/A 23.3 LEFT TURN (V4) 15.2 N/A RIGHT TURN (V5) N/A N/A
23 APPROACH CONFLICTING SPEED (MPH) SIGHT TRIANGLE LENGTH (FT) EASTBOUND SR 41 ENTERING LEG (D1) CIRCULATING LEG (D2) WESTBOUND SR 41 ENTERING LEG (D1) CIRCULATING LEG (D2) SOUTHBOUND MAIN STREET ENTERING LEG (D1) CIRCULATING LEG (D2) NORTHBOUND SR 1 OFF-RAMP ENTERING LEG-SR 41 (D1) ENTERING LEG-MAIN STREET (D1) CIRCULATING LEG (D2) NORTHBOUND MAIN STREET ENTERING LEG-SR 1 NB OFF-RAMP (D1) ENTERING LEG-SR 41 (D1) CIRCULATING LEG (D2)
24 Eastbound SR 41 Westbound SR 41 Southbound Main Street Northbound SR 1 Off-Ramp Northbound Main Street Approach TABLE 5 INTERSECTION SIGHT DISTANCE Conflicting Speed (mph) Sight Triangle Length (Feet) Entering Leg (D1) Circulating Leg (D2) Entering Leg (D1) Circulating Leg (D2) Entering Leg (D1) Circulating Leg (D2) Entering Leg - SR 41 (D1) Entering Leg - Main Street (D1) Circulating Leg (D2) Entering Leg - SR 1 NB Off-Ramp (D1) Entering Leg - SR 41 (D1) Circulating Leg (D2) Note: Intersection Sight Distance criteria obtained from NCHRP Report 672 with 6.5 second Critical Headway (t c ) Required stopping sight distances at the entries to the roundabout are provided in Table 6 and the pedestrian crossing stopping distances are provided in Table 7. Both required stopping sight distances are also graphically shown on Figure 8. TABLE 6 STOPPING SIGHT DISTANCE TO ENTRY Approach Design Speed Stopping Sight Distance (mph) (Feet) SR 1 NB Off-Ramp Entrance NB Main Street Entrance SB Main Street Entrance EB SR 41 Entrance WB SR 41 Entrance Note: Stopping Sight Distance criteria obtained from NCHRP Report 672 Final State Route 1/State Route 41 /Main Street Intersection Control Evaluation (ICE) - Step 2 Page 17 City of Morro Bay R1881RPT008
25 SR 1 NB Off- Ramp SR 1 NB On- Ramp NB Main Street SB Main Street EB SR 41 WB SR 41 TABLE 7 STOPPING SIGHT DISTANCE TO PEDESTRIAN CROSSING Approach Design Speed (mph) Stopping Sight Distance (Feet) SR 1 NB Off-Ramp Initial Speed WB SR 41 Circulating (V2) SB Main Street Right Turn (V5) NB Main Street Initial Speed SB Main Street Circulating (V2) EB SR 41 Right Turn (V5) SB Main Street Initial Speed NB Main Street Circulating (V2) WB SR 41 Right Turn (V5) EB SR 41 Initial Speed WB SR 41 Circulating (V2) SB Main Street Right Turn (V5) WB SR 41 Initial Speed SR 1 NB Off-Ramp Circulating (V2) EB SR 41 Circulating (V2) NB Main Street Right Turn (V5) Note: Stopping Sight Distance criteria obtained from NCHRP Report 672 From Tables 5, 6, and 7 the proposed Roundabout alternative provides sufficient intersection and stopping sight distance. Though sight distance requirements are met for the proposed roundabout alternative, special consideration to landscaping features will be necessary to ensure proper sight distance at the intersections. Figures 8 to 9 display the sight distance triangles that should be kept clear of obstruction in the final design stages View Angles The angle between consecutive entries must not be overly acute in order to allow drivers to comfortably turn their heads to the left to view oncoming traffic from the adjacent upstream entry. Guidance from the NCHRP section recommends a minimum 75 intersection angle (15 view angle). Figure 8 illustrates the view angles for drivers on the approaches; as can be seen all approaches have view angles that are less than 15. Final State Route 1/State Route 41 /Main Street Intersection Control Evaluation (ICE) - Step 2 Page 18 City of Morro Bay R1881RPT008
26 APPROACH INITIAL SPEED (MPH) STOPPING SIGHT DISTANCE (FT) APPROACH CIRCULATING SPEED (MPH) STOPPING SIGHT DISTANCE (FT) SR 1 NB OFF-RAMP ENTRANCE NB MAIN STREET ENTRANCE SB MAIN STREET ENTRANCE EB SR 41 ENTRANCE WB SR 41 ENTRANCE SR 1 NB OFF-RAMP CIRCULATING NB MAIN STREET CIRCULATING SB MAIN STREET CIRCULATING EB SR 41 CIRCULATING WB SR 41 CIRCULATING LEG CONFLICTING MOVEMENT DESIGN SPEED (MPH) STOPPING SIGHT DISTANCE (FT) SR 1 NB OFF-RAMP SR 1 NB ON-RAMP NB MAIN STREET SB MAIN STREET SR 1 NB OFF-RAMP INITIAL SPEED WB SR 41 CIRCULATING (V2) SB MAIN STREET RIGHT TURN (V5) NB MAIN STREET INITIAL SPEED SB MAIN STREET CIRCULATING (V2) EB SR 41 RIGHT TURN (V5) SB MAIN STREET INITIAL SPEED NB MAIN STREET CIRCULATING (V2) WB SR 41 RIGHT TURN (V5) EB SR 41 INITIAL SPEED EB SR 41 WB SR 41 CIRCULATING (V2) SB MAIN STREET RIGHT TURN (V5) WB SR 41 INITIAL SPEED WB SR 41 SR 1 NB OFF-RAMP CIRCULATING (V2) EB SR 41 CIRCULATING (V2) NB MAIN STREET ENTERING (V1)
27
28 6. Alternative Design Consideration Features Several geometric design features needs to be considered for both roundabout and signal design. Below are the descriptions of the design features that are most important for this project Guide Signing Guide signing is critical for providing proper direction to drivers as they approach any type of intersection or diverging roadway. Due to the project s proximity to SR 1 and SR 41 and close intersection spacing, guide signing could have an impact on traffic operations. The key aspects of guide signing for the project are as follows: Guidance to SR 1 On-Ramp on Main Street Guidance to SR 41/ beach access on Main Street Guidance to SR 41/ beach access on SR1 Off-Ramp Guidance to SR 1 On-Ramp from SR 41 Guidance to Main Street/ Downtown Morro Bay on SR 41 Guidance of vehicles to the correct travel lane when approaching the roundabout intersection. The Signal and Roundabout alternatives were compared based on the complexity of the guide signing needed to support the proposed geometric configurations. Signing for the Signal alternative would be simpler due to the fact that this alternative would mimic existing movements throughout the study area. The Roundabout alternative would require additional guide signage at the approaches and exits to ensure drivers can safely and efficiently reach their destination Truck Accommodation The design vehicles for the study intersection are the STAA-Standard truck and California Legal (CA-Legal 50) truck as outlined in Section 3.5. Attempts were made to accommodate movements among all legs by the design truck's template from the 2014 Caltrans Highway Design Manual. For the Roundabout alternative, the truck turn templates are illustrated allowing truck aprons to be mounted only by the truck trailer and not the tractor. The exhibits showing the truck turning movements for the Signal and Roundabout alternatives are located in Appendix B. The Signal and Roundabout alternatives were compared based on the ability to adequately serve the required design vehicle for all movements. Both the Signal and Roundabout alternatives serve the STAA Standard and/or CA-Legal 50 truck for all movements; therefore, both concepts equally satisfy the performance criteria for accommodating trucks with one exception. This exception is for the STAA truck u-turn movements between Main Street and the SR 1 NB ramps. As shown in Appendix B, on Figure No. B-5, though these movements can be accommodated, the truck speeds are less than 10 MPH. Though a design exception fact sheet will not be required, Caltrans has requested that any design speed that will be less than 10 MPH be documented as to why this minimum speed cannot be provided during the PA&ED phase Pedestrian/Bike Accommodation The accommodation of bicycles and pedestrians through the study intersection was compared for the two alternatives. Final State Route 1/State Route 41 /Main Street Intersection Control Evaluation (ICE) - Step 2 Page 21 City of Morro Bay R1881RPT008
29 Signal Alternative The Signal alternative accommodates pedestrians and bicycles with standard Caltrans Class II bike lanes, sidewalks, and intersection crossings along SR 41 and Main Street. Each crossing is 10 wide and extends across the entire intersection length; there are refuge areas between Main Street and the SR 1 NB Ramps Roundabout Alternative Pedestrian crossings are provided on all legs of the Roundabout alternative. Crossings are 10 feet in width and set back a minimum of 20 feet from the roundabout s circulating roadway. Where crosswalks intersect splitter islands or medians, a 6 feet long minimum paved pathway is provided between the travel lanes for safety and refuge when waiting to cross. Shared-use pathways, 10 feet in width and located outside of the roundabout, are setback a minimum of 5 feet from the circulatory road with a landscape strip to increase accessibility and discourage pedestrians from crossing into the central traveled way. Bicycles are accommodated by navigating through the roundabout in two ways. Cyclists may choose to take the travel lane and travel through the roundabout as a vehicle or may choose to take the separated bike ramp / shared use path and travel around the roundabout as a pedestrian. The performance of the Signal and Roundabout alternatives were compared based on the ability to accommodate pedestrians and cyclists through the corridor. In general, both alternatives provide an acceptable level of accommodation and safety; however, the Roundabout alternative provide better safety as the vehicle/pedestrian/cyclist interactions are limited to crossing locations and are (typically) separated from the traveled way by a landscape buffer Safety Characteristics A quantitative comparison of the safety characteristic for both alternatives is provided in the Highway Safety Manual (HSM). Crash Modification Factors (CMF) is provided in HSM for various alternatives that help to quantify the resulting change due to changes in the design or intersection control. A detailed description and analysis for the alternatives in regards to safety characteristic can be found in a later section (Section 8.2) of this report. 7. Non-Conforming Features Non-conforming geometric design features are identified and compared between the signal and roundabout alternatives. Due to the preliminary planning stage of this ICE document, it needs to be stated and understood that the identified features and the resulting study alternative should not be considered complete and comprehensive. During detailed engineering design, some design parameters and/or elements may change before the intersection concept is approved and constructed Signal Alternative The signal alternative concept was compared to the 2014 Caltrans Highway Design Manual (HDM) to determine any non-conforming features. The non-conforming features for the signal concept include but are not exclusive to the following: Final State Route 1/State Route 41 /Main Street Intersection Control Evaluation (ICE) - Step 2 Page 22 City of Morro Bay R1881RPT008
30 The existing culvert and/or the existing drainage ditch located between the SR 1 NB On- Ramp and southbound Main Street will require reconstruction in order to accommodate the right turn lane on southbound Main Street. The proposed canal structure may exceed standard HDM culvert design. The intersection spacing between SR 41/SR 1 SB Ramps and the SR 1 NB Ramps/SR 41/Main Street is shorter than HDM standard requiring a 400 foot minimum distance between ramp intersections and local road intersections. The proposed left-turn pocket on westbound SR 41 extends past the driveways to the gas station and the liquor store and past Sunset Street. Left-turn access at these locations will be available, but could result in unsafe turns. The proposed left-turn pocket on northbound Main Street extends past the driveways to the gas station and Taco Bell. Left-turn access at these locations will be available, but could result in unsafe turns Roundabout Alternative The roundabout alternative concept was compared to the 2014 Caltrans Highway Design Manual (HDM), Caltrans Design Information Bulletin 80-01, and National Cooperative Highway Research Program (NCHRP) Report 672 Roundabout: An Informational Guide to determine any non-conforming features. The non-conforming features for the roundabout concept include but are not exclusive to the following: The existing culvert located between the SR 1 NB On-Ramp and southbound Main Street will require reconstruction in order to accommodate the roundabout footprint. The proposed canal structure may exceed standard HDM culvert design. The intersection spacing between SR 41/SR 1 SB Ramps and the SR 1 NB Ramps/SR 41/Main Street roundabout is shorter than HDM standard requiring a 400 foot minimum distance between ramp intersections and local road intersections. Access to Chevron Gas Station will be restricted to right-in/ right-out access only, with left-turns being provided by a u-turn movement in the roundabout. It is also proposed to restrict left turn access between eastbound SR 41 and Sunset Street. by extending the length of the splitter island past the return of Sunset Street. This change in access is illustrated on the East SR 41 Access exhibit provided in Appendix C. A realignment of the SR 1 NB Ramps is required in order to accommodate the through and right turn movements from the off-ramp and an acceptable radius for the on-ramp. Due to vertical grade differences between the SR 1 mainline and the SR 1 NB On- Ramp, a retaining wall will need to be constructed on the west side of the SR 1 NB On- Ramp. The STAA truck u-turn movements between Main Street and the SR 1 NB ramps can be accommodated, however, the truck speeds are less than 10 MPH. Though a design exception fact sheet will not be required, Caltrans has requested that any design speed that will be less than 10 MPH be documented as to why this minimum speed cannot be provided during the PA&ED phase. Due to the roundabout alternative s complex design and non-conforming features, the signal alternative was found to best meet the performance criteria for standard intersection design. Final State Route 1/State Route 41 /Main Street Intersection Control Evaluation (ICE) - Step 2 Page 23 City of Morro Bay R1881RPT008
31 8. Traffic Operations & Safety Analysis The traffic operations of the Signal and Roundabout alternatives were analyzed for AM and PM peak hours for both the interim design year (2030) and the ultimate design year (2040) traffic scenarios using the traffic volumes presented in Appendix A. The Signal alternative was analyzed using Synchro/Sim-traffic traffic analysis software, and the Roundabout alternative was analyzed using SIDRA analysis software. Analysis procedures from the Highway Capacity Manual (HCM), 2000 were used to determine the level-of-service (LOS), Volume/Capacity (V/C) ratio and delay for the signal alternative. Sim-traffic was utilized to determine the queuing characteristics of the Signal alternative. As accepted by Caltrans, SIDRA analysis methodology was used to determine the LOS, V/C, delay and 95th percentile queues for the Roundabout alternative Traffic Operations Analysis Traffic operations have been quantified through the determination of Level of Service (LOS). LOS is a qualitative measure of traffic measuring conditions, whereby a letter grade "A" through "F" is assigned to an intersection or roadway segment representing progressively worsening traffic conditions. LOS was calculated for different intersection control types using the methods documented in the Highway Capacity Manual 2000 (HCM 2000). LOS definitions and criteria for different types of intersection controls are provided in a table in Appendix D. Although Caltrans has not designated a LOS standard, Caltrans' Guide for the Preparation of Traffic Impact Studies (December 2002) indicates that Caltrans endeavors to maintain a target LOS at the transition between "C" and "D". However, Caltrans acknowledges that this may not always be feasible and recommends that the lead agency consult with Caltrans to determine the appropriate target LOS. Consistent with the previously approved studies (Sonic TIS), LOS "C" was identified as the appropriate target LOS for state facilities in the study area Analysis Criteria The following criteria are incorporated in the analysis in order to most accurately reflect intersection operating conditions. PHF: 0.92 was used for all intersections Truck Percentages: Data Counts from May 2014 Pedestrian data from February Environmental factor for Opening Year roundabout analysis 1.05 Environmental factor for Design Year roundabout analysis Signal Alternative Analysis This section provides a summary of the intersection operations associated with the Signal alternative for various time periods. The Signal alternative lane geometrics can be found in an earlier section of this report Interim Design Year (2030) Tables 8A & 8B shows the volume/capacity (V/C) ratio, delay, delay, LOS and 95 th percentile queues for interim design year conditions during AM and PM peak hour conditions, respectively. Final State Route 1/State Route 41 /Main Street Intersection Control Evaluation (ICE) - Step 2 Page 24 City of Morro Bay R1881RPT008
32 Appendix E contains the Synchro and Sim-traffic outputs. As noted previously, the level-ofservice (LOS), delay and queuing characteristics from HCM 2000 methodologies are presented for comparison purposes only. TABLE 8A INTERIM DESIGN YEAR (2030) AM PEAK HOUR SIGNAL ALTERNATIVE Signal Alternative 95 th V/C Delay Level Of Delay Level Of Int. Percentile # Intersection/Approach Ratio 1 (sec) 1 Service 1 (sec) 2 Service 2 Queue (ft) 2 1 SR 1 NB Ramps &SR C 24.6 C -- Eastbound D 73.1 E 190 Westbound A 2.1 A 60 Northbound D 34.6 C Main St & SR D 54.8 D -- Eastbound B 7.6 A 50 Westbound E 59.1 E 450 Northbound D 39.6 D 180 Southbound D 32.2 C Traffic Operation outputs calculated using HCM 2000 methodology for Signals. 2. Traffic Operation outputs calculated using Sim-traffic methodology for Signals. TABLE 8B INTERIM DESIGN YEAR (2030) PM PEAK HOUR SIGNAL ALTERNATIVE Signal Alternative 95 th V/C Delay Level Of Delay Level Of Int. Percentile # Intersection/Approach Ratio 1 (sec) 1 Service 1 (sec) 2 Service 2 Queue (ft) 2 1 SR 1 NB Ramps &SR B 32.2 C -- Eastbound C 65.5 E 160 Westbound A 1.9 A 50 Northbound D 65.4 E Main St & SR D 28.6 C -- Eastbound B 10.3 B 50 Westbound D 38.0 D 210 Northbound D 41.6 D 310 Southbound C 20.2 C Traffic Operation outputs calculated using HCM 2000 methodology for Signals. 2. Traffic Operation outputs calculated using Sim-traffic methodology for Signals. As shown in Tables 8A & 8B, the signal alternative will provide acceptable LOS and 95 th percentile queues with the following exception: Unacceptable 95 th percentile queues in the eastbound approach at intersection Ultimate Design Year (2040) Tables 9A & 9B show the volume/capacity (V/C) ratio, delay, LOS and 95 th percentile queues for ultimate design year conditions during AM and PM peak hour conditions, respectively. Appendix E contains the Synchro and Sim-Traffic outputs. As noted previously, the level-of-service (LOS), Final State Route 1/State Route 41 /Main Street Intersection Control Evaluation (ICE) - Step 2 Page 25 City of Morro Bay R1881RPT008
33 delay and queuing characteristics from HCM 2000 methodologies are presented for comparison purposes only. TABLE 9A ULTIMATE DESIGN YEAR (2040) AM PEAK HOUR SIGNAL ALTERNATIVE Signal Alternative 95 th Int. V/C Delay Level Of Delay Level Of Percentile # Intersection/Approach Ratio 1 (sec) 1 Service 1 (sec) 2 Service 2 Queue (ft) 2 1 SR 1 NB Ramps &SR C 43.9 D -- Eastbound E F 350 Westbound A 2.2 A 60 Northbound D 42.9 D Main St & SR D 39.4 D -- Eastbound B 7.5 A 50 Westbound E 62.1 E 520 Northbound E 44.9 D 200 Southbound D 34.7 C Traffic Operation outputs calculated using HCM 2000 methodology for Signals. 2. Traffic Operation outputs calculated using Sim-traffic methodology for Signals. TABLE 9B ULTIMATE DESIGN YEAR (2040) PM PEAK HOUR SIGNAL ALTERNATIVE Signal Alternative 95 th V/C Delay Level Of Delay Level Of Int. Percentile # Intersection/Approach Ratio 1 (sec) 1 Service 1 (sec) 2 Service 2 Queue (ft) 2 1 SR 1 NB Ramps &SR B 43.7 D -- Eastbound C 46.0 D 160 Westbound A 2.3 A 60 Northbound D F Main St & SR D 52.5 D -- Eastbound B 9.5 A 50 Westbound D 41.1 D 270 Northbound F F 470 Southbound C 30.3 C Traffic Operation outputs calculated using HCM 2000 methodology for Signals. 2. Traffic Operation outputs calculated using Sim-traffic methodology for Signals. As shown in Tables 9A & 9B, the Signal alternative will provide acceptable LOS and 95 th percentile queues, except for following locations: Unacceptable 95 th percentile queue for NBL movement at intersection 1 Unacceptable 95 th percentile queues in the eastbound approach at intersection 1 Unacceptable 95 th percentile queue for NBL movement at intersection 2 Unacceptable 95th percentile queue for the southbound approach at intersection 2 To provide acceptable operations, widening of the SR 41 segment to four lanes, beginning at the SB ramps and through both study intersections is required. For the purpose of this analysis, Final State Route 1/State Route 41 /Main Street Intersection Control Evaluation (ICE) - Step 2 Page 26 City of Morro Bay R1881RPT008
34 widening of the SR 41 was not considered to be economically feasible. Therefore, traffic operations for these improved conditions were not evaluated SR 41/SR 1 SB Ramp Intersection The SR 41/SR 1 SB Ramp intersection is currently stop sign controlled on the southbound ramp approach. This intersection control is also assumed for both Design Year conditions. This section focuses on the potential impacts to this intersection from eastbound queued vehicles at the SR 41/SR 1 NB Ramp intersection for all analysis conditions. The Signal alternative lane geometrics provided on Figure 1 will provide approximately 120 feet of vehicle storage on both the eastbound through plus right turn lane and on the left turn lane at the approach to the SR 41/SR 1 NB Ramp intersection. This available vehicle storage was compared to the estimated 95 th percentile queues provided in the various tables with the results shown in Table 10. As shown in the table, eastbound vehicles are projected to queue back along SR 41 and impede access to/from the SR 1 SB ramps under both Design Year (interim and buildout) conditions. TABLE 10 EASTBOUND SR 41/SR 1 NB RAMP APPROACH QUEUING ANALYSIS Condition/Time Period Available Storage to SR 1 SB Ramp Intersection 95 th Percentile Queue Sufficient Storage Available Interim AM 240 feet (both lanes) 325 feet No Interim PM 240 feet (both lanes) 260 feet No Ultimate AM 240 feet (both lanes) 455 feet No Ultimate PM 240 feet (both lanes) 275 feet No Roundabout Alternative Analysis This section provides a summary of the intersection operations associated with the Roundabout alternative. The Roundabout alternative geometrics can be found on Figure 3. During Caltrans review and comment on the Draft ICE Step 2 document, a non-standard intersection sight distance (ISD) was identified from the NB off-ramp to EB SR 41 due to the existing SR 1 structure. One design modification to help correct the ISD included eliminating the right turn movement from the NB off-ramp at the roundabout (also reference the Response to Comments Design Memorandum provided in Attachment H). Caltrans has requested though that a by-pass lane between the NB off-ramp and SB Main Street be evaluated during the PA&ED phase. The methodology employed to evaluate the resulting roundabout operations with this restriction is also provided in the Response to Comments Memorandum with the results summarized in the following sections Interim Design Year (2030) Tables 11A & 11B show the volume/capacity (V/C) ratio, delay, LOS and 95 th percentile queues for Interim Design Year conditions during AM and PM peak hour conditions, respectively. The SIDRA 6 output can be found in Appendix F. Final State Route 1/State Route 41 /Main Street Intersection Control Evaluation (ICE) - Step 2 Page 27 City of Morro Bay R1881RPT008
35 TABLE 11A INTERIM DESIGN YEAR (2030) AM PEAK HOUR ROUNDABOUT ALTERNATIVE Int. # Roundabout Alternative Intersection/Approach V/C Ratio Delay (sec) Level Of Service 95 th Percentile Queue (ft) 1 Main St/ SR 1 NB Ramps & SR B - Eastbound A 35 Westbound B 95 Northbound B 125 Southbound B 125 Northbound Ramp B Traffic Operation outputs calculated using SIDRA 6 methodology for Roundabouts. 2. Worst lane movement (of the approach) value stated. Int. # TABLE 11B INTERIM DESIGN YEAR (2030) PM PEAK HOUR ROUNDABOUT ALTERNATIVE Roundabout Alternative Intersection/Approach V/C Ratio Delay (sec) Level Of Service 95 th Percentile Queue (ft) 1 Main St/ SR 1 NB Ramps & SR B - Eastbound A 30 Westbound A 70 Northbound B 210 Southbound A 90 Northbound Ramp B Traffic Operation outputs calculated using SIDRA 6 methodology for Roundabouts. 2. Worst lane movement (of the approach) value stated. As shown in Tables 11A & 11B, the Roundabout alternative will provide acceptable LOS and 95 th percentile queues Ultimate Design Year (2040) Tables 12A & 12B show the volume/capacity (V/C) ratio, delay, LOS and 95 th percentile queues for Ultimate Design Year conditions during AM and PM peak hour conditions, respectively. The SIDRA 6 output can be found in Appendix F. Final State Route 1/State Route 41 /Main Street Intersection Control Evaluation (ICE) - Step 2 Page 28 City of Morro Bay R1881RPT008
36 Int. # TABLE 12A ULTIMATE DESIGN YEAR AM PEAK HOUR ROUNDABOUT ALTERNATIVE Roundabout Alternative Intersection/Approach V/C Ratio Delay (sec) Level Of Service 95 th Percentile Queue (ft) 1 Main St/ SR 1 NB Ramps & SR B - Eastbound A 40 Westbound B 155 Northbound C 205 Southbound C 205 Northbound Ramp B Traffic Operation outputs calculated using SIDRA 6 methodology for Roundabouts. 2. Worst lane movement (of the approach) value stated. TABLE 12B ULTIMATE DESIGN YEAR PM PEAK HOUR ROUNDABOUT ALTERNATIVE Int. # Roundabout Alternative Intersection/Approach V/C Ratio Delay (sec) Level Of Service 95 th Percentile Queue (ft) 1 Main St/ SR 1 NB Ramps & SR B - Eastbound A 35 Westbound B 100 Northbound C 355 Southbound B 130 Northbound Ramp B Traffic Operation outputs calculated using SIDRA 6 methodology for Roundabouts. 2. Worst lane movement (of the approach) value stated. As shown in Tables 12A & 12B, the Roundabout alternative will provide acceptable LOS and 95 th percentile queues Safety Analysis Crash Modification Factors (CMF) are provided by FHWA in their technical report "Desktop Reference for Crash Reduction Factor. This technical report contains a CMF for converting an all-way stop control and two-way stop control to a roundabout and traffic signal. The existing condition at the two study intersections are as follows: SR 1 NB Ramps/ SR 41 - Two-way stop control SR 41/Main Street - All-way stop control The CMF factors for both - total collisions and fatal/severe injury types are provided below: CMF for total crashes: CMF for converting two-way stop control to roundabout is 56% with +/- 6% standard error. CMF for converting all-way stop control to a roundabout is 72% with +/- 6% standard error. CMF for converting two-way/all-way stop control to signal - 17%. Final State Route 1/State Route 41 /Main Street Intersection Control Evaluation (ICE) - Step 2 Page 29 City of Morro Bay R1881RPT008
37 CMF for fatal/severe injury crashes CMF for converting two-way stop control to roundabout is 78% with +/- 7% standard error. CMF for converting all-way stop control to a roundabout 88% with +/- 8% standard error. CMF for converting two-way/all-way stop control to signal - 23% with +/- 22% standard error. As noted above, the CMF for converting the intersections to a roundabout is higher when compared to converting it to a signal. The higher CMF directly correlates to a greater reduction in collision rates. The CMF does not, however, account for the closely spaced intersection which needs a detailed examination of conflict point parameters for both alternatives Number of Conflicting Points CMF factors do not account for the closely spaced intersection which needs a detailed examination of conflict point parameters for both the Signal and Roundabout alternatives. The number of conflicting points within an intersection directly correlates to the risk of an incident, especially at intersections. Conflicting points are locations at which a roadway user can cross, merge, diverge, etc. with another roadway user. A diagram of conflict locations at typical intersections are provided in Figure 10. Figure 10: Typical Conflict Points at Typical Intersections The number of conflicting points for each of the proposed alternatives are provided below: Signal Alternative=44 Conflicts Roundabout Alternative=13 Conflicts The analysis above illustrates the advantages that the Roundabout alternative provides by significantly reducing the number of conflict points between vehicles and further justifies the higher CMF values as the exposure to risk is significantly reduced at roundabout intersections. Final State Route 1/State Route 41 /Main Street Intersection Control Evaluation (ICE) - Step 2 Page 30 City of Morro Bay R1881RPT008
38 Reduced Speed Potential and Crash Severity Potential Typically, the roundabout design forces the driver to reduce the speed in the intersection to 20 MPH. However, drivers can travel an intersection with signal control at speeds higher than posted speed limits due to there being no geometric constraints. Due to reduced travel speeds through the intersection and fewer conflict points, the Roundabout alternative is likely to eliminate most severe crash types. 9. Life-Cycle Analysis 9.1. Collision Costs Costs associated with each collision type have been quantified using the expected crash reduction (CMF) for the intersection type as noted in the previous section and the number of collisions identified in Section 3.4 Collision History. Transportation Planning Department of Caltrans provides the costs associated with collision types in their Life-Cycle Benefit-Cost Analysis Economic Parameter 2012 webpage located at: ( The costs are as follows: Fatal Collision: $4,800,000 Injury Collision: $67,400 Property Damage (PDO) Collision: $10,200 Average Cost per Collision: $52,500 At the two (2) SR 41 study intersections, there were a total of three (3) reported collisions in the 3-year period from October 1, 2010 through September 30, All three (3) collisions were property damage only collisions. As such the total collision cost is calculated to be $10,200 / year (($10,200 *3) / 3 years). Using the CRF reduction of 56%, the cost reduction for the Roundabout alternative is approximately $5,700 / year. Using the CRF reduction of 17%, the cost reduction for the Signal alternative is approximately $1,700 / year. Therefore, the Roundabout alternative will result in lower collision costs when compared to the Signal alternative Mobility Costs To calculate the mobility cost for both the Signal and Roundabout alternatives, the vehicle operating costs were quantified for the project. The vehicle volume is projected to be higher during the AM peak hour, so the mobility costs for both alternatives were compared during this time period. The mobility costs (vehicle operating costs) were computed using the costs module in SIDRA for both the Signal and Roundabout alternatives. The output files from SIDRA showing the cost for both alternatives can be found in Appendix F. The vehicle operating cost parameters were obtained from Life-Cycle Benefit-Cost Analysis Economic Parameters 2012 published by Caltrans. The cost of average fuel price was documented as $3.714 for regular unleaded and $3.941 for diesel. An overall average cost of $3.83 was utilized for analysis purpose. Final State Route 1/State Route 41 /Main Street Intersection Control Evaluation (ICE) - Step 2 Page 31 City of Morro Bay R1881RPT008
39 The total mobility cost for the Signal alternative was calculated to be $18.69/hour The total mobility cost for the Roundabout alternative is $13.58/hour. Therefore, it can be concluded that the Roundabout alternative will result in lower mobility costs when compared to the Signal alternative Environmental Costs To calculate the environmental cost for the alternatives, the greenhouse gas emissions costs were quantified for the project. The vehicle volume is projected to be higher during the AM peak hour, so the greenhouse gas emissions for both alternatives were compared during this time period. Sim-Traffic provided the gas emissions output for the Signal alternative and SIDRA provided the gas emission outputs for the Roundabout alternative. However, for purpose of comparison with the same methodology, the Signal alternative was modeled in SIDRA using the same cycle length and phases as provided in Synchro. The output files from SIDRA showing the cost for both alternatives can be found in Appendix F. The vehicle operating cost parameters were obtained from Life-Cycle Benefit-Cost Analysis Economic Parameters 2012 published by Caltrans. The cost of Carbon Monoxide (CO) in California urban areas was stated to be $75/ton. The cost of Nitrogen Oxide (NO x ) in California urban areas was stated to be $17,300/ton. The total environmental cost for the Signal alternative was calculated to be $0.94/hour The total environmental cost for the Roundabout alternative is $1.10/hour. Therefore, it can be concluded that the Signal alternative will result in slightly lower greenhouse emission costs when compared to the Roundabout alternative Other Costs In addition to the collision, environmental and mobility costs, operation & maintenance and pavement rehabilitation costs also represent a significant cost factor associated with both the Signal and Roundabout alternatives Operation & Maintenance Cost The maintenance and operation cost for a traffic signal is estimated to be about $6,000 per year per signal. The Roundabout alternative would incur minor maintenance cost Landscape Maintenance Cost It is difficult to quantify the landscape maintenance cost at this level since the maintenance cost is directly proportional to the area covered by the landscape. Roundabouts typically have a central island covered by landscaping, in addition to other landscaping features and buffers not typical for a signalized intersection. The landscape maintenance cost is projected to be 50% greater or more for the Roundabout alternative compare to the Signal alternative Pavement Rehabilitation Based on the concept-level preliminary project cost estimates (Appendix G), construction cost would be higher for the Roundabout alternative since the footprint is almost twice as big as the Signal alternative. The Signal alternative also maintains much of the existing intersection layout. Consistent with the cost estimate for pavement cost, the pavement rehabilitation costs for the Roundabout alternative are projected to be at least twice as much the Signal alternative. Final State Route 1/State Route 41 /Main Street Intersection Control Evaluation (ICE) - Step 2 Page 32 City of Morro Bay R1881RPT008
40 9.5. Service Life Both the Signal and Roundabout alternatives are projected to provide acceptable service for both the interim design year (2030) and the ultimate design year (2040). 10. Summary of Findings Table 13 summarizes and compares the performance for both the roundabout and signal alternatives. TABLE 13 ALTERNATIVE PERFORMANCE COMPARISON Performance Measures Signal Roundabout Design Features Guide Signing xx x Truck Accommodation x x Pedestrian/ Bike Accommodation x xx Non-Conforming Features x Year 2030 Operations Overall Delay x xx Overall 95 th Percentile Queue x Year 2040 Operations Overall Delay x xx Overall 95 th Percentile Queue x Life-Cycle Analysis Safety-CRF x Safety-Performances (conflict area, reduced speed) x Collision Cost x Mobility Cost x Environmental Cost x Other Cost - O&M Cost x Other Cost - Landscape Cost x Other Cost - Pavement Rehabilitation x Service Life x x Initial Cost x Overall Costs x Total Performance Measure Points Recommendations As shown in Table 13, 16 performance measure points were assigned to the roundabout alternative, as compared to 13 for the signal alternative. Based on these results, the City of Morro Bay should recommend that the Roundabout alternative represents the preferred alternative for the SR 1/SR 41/ Main Street intersections. Final State Route 1/State Route 41 /Main Street Intersection Control Evaluation (ICE) - Step 2 Page 33 City of Morro Bay R1881RPT008
41 Appendix APPENDIX A TRAFFIC VOLUMES APPENDIX B - TRUCK TURN EXHIBITS APPENDIX C EAST SR 41 ACCESS EXHIBIT APPENDIX D LEVEL OF SERVICE (LOS) CRITERIA APPENDIX E - SYNCHRO/ SIM TRAFFIC OUTPUTS APPENDIX F - SIDRA OUTPUTS APPENDIX G - COST ESTIMATES APPENDIX H RESPONSE TO COMMENTS DESIGN MEMORANDUM
42 APPENDIX A TRAFFIC VOLUMES
43 Opening Yr 2020 AM DATE TIME INTID NBL NBT NBR SBL SBT SBR EBL EBT EBR WBL WBT WBR 9/24/ /24/ Opening Yr 2020 PM DATE TIME INTID NBL NBT NBR SBL SBT SBR EBL EBT EBR WBL WBT WBR 9/24/ /24/ LEG ROUNDABOUT NB OFF RAMP AM WB 41 ON RAMP NB MAIN EB 41 SB MAIN EBL EBT EBR AM PM WBL WBT WBR MAIN ST NB WB 41 ON RAMP NB MAIN EB 41 PM AM EBL EBT EBR PM WBL WBT WBR WB SB MAIN WB 41 ON RAMP NB MAIN AM PM MAIN ST SB EB 41 SB MAIN WB 41 ON RAMP AM PM EB 41 ON RAMP NB MAIN EB 41 SB MAIN AM PM RDBT COUPLET AM NBL NBT NBR SBL SBT SBR EBL EBT EBR UTURN WBT WBR RAMPS SUNSET PM NBL NBT NBR SBL SBT SBR EBL EBT EBR UTURN WBT WBR RAMPS SUNSET
44 Design Yr 2030 AM DATE TIME INTID NBL NBT NBR SBL SBT SBR EBL EBT EBR WBL WBT WBR 9/24/ /24/ Design Yr 2030 PM DATE TIME INTID NBL NBT NBR SBL SBT SBR EBL EBT EBR WBL WBT WBR 9/24/ /24/ LEG ROUNDABOUT NB OFF RAMP AM WB 41 ON RAMP NB MAIN EB 41 SB MAIN EBL EBT EBR AM PM WBL WBT WBR MAIN ST NB WB 41 ON RAMP NB MAIN EB 41 PM AM EBL EBT EBR PM WBL WBT WBR WB SB MAIN WB 41 ON RAMP NB MAIN AM PM MAIN ST SB EB 41 SB MAIN WB 41 ON RAMP AM PM EB 41 ON RAMP NB MAIN EB 41 SB MAIN AM PM RDBT COUPLET AM NBL NBT NBR SBL SBT SBR EBL EBT EBR UTURN WBT WBR RAMPS SUNSET PM NBL NBT NBR SBL SBT SBR EBL EBT EBR UTURN WBT WBR RAMPS SUNSET
45 Design Yr 2040 AM DATE TIME INTID NBL NBT NBR SBL SBT SBR EBL EBT EBR WBL WBT WBR 9/24/ /24/ Design Yr 2040 PM DATE TIME INTID NBL NBT NBR SBL SBT SBR EBL EBT EBR WBL WBT WBR 9/24/ /24/ LEG ROUNDABOUT NB OFF RAMP AM WB 41 ON RAMP NB MAIN EB 41 SB MAIN EBL EBT EBR AM PM WBL WBT WBR MAIN ST NB WB 41 ON RAMP NB MAIN EB 41 PM AM EBL EBT EBR PM WBL WBT WBR WB SB MAIN WB 41 ON RAMP NB MAIN AM PM MAIN ST SB EB 41 SB MAIN WB 41 ON RAMP AM PM EB 41 ON RAMP NB MAIN EB 41 SB MAIN AM PM RDBT COUPLET AM NBL NBT NBR SBL SBT SBR EBL EBT EBR UTURN WBT WBR RAMPS SUNSET PM NBL NBT NBR SBL SBT SBR EBL EBT EBR UTURN WBT WBR RAMPS SUNSET
46 APPENDIX B - TRUCK TURN EXHIBITS
47
48
49
50
51
52
53
54
55
56
57
58
59
60 APPENDIX C EAST SR 41 ACCESS EXHIBIT
61
62 APPENDIX D - LEVEL OF SERVICE (LOS) CRITERIA

63 Level of Service A B C Flow Type Stable Flow Stable Flow Stable Flow Level-of-Service (LOS) Criteria Delay Very slight delay. Progression is very favorable, with most vehicles arriving during the green phase not stopping at all. Good progression and/or short cycle lengths. More vehicles stop than for LOS A, causing higher levels of average delay. Maneuverability Turning movements are easily made, and nearly all drivers find freedom of operation. Vehicle platoons are formed. Many drivers begin to feel somewhat restricted within groups of vehicles. Higher delays resulting from fair progression and/or longer cycle Back-ups may lengths. Individual cycle failures may develop behind begin to appear at this level. The turning vehicles. number of vehicles stopping is Most drivers feel significant, although many still pass somewhat through the intersection without restricted stopping. Stopped Delay/Vehicle Signalized Un signalized All- Way Stop < 10.0 < 10.0 < 10.0 >10.0 and < 20.0 >20.0 and < 35.0 >10.0 and < 15.0 >15.0 and < 25.0 >10.0 and < 15.0 >15.0 and < 25.0 D E F Approaching Unstable Flow Forced Flow Unstable Flow The influence of congestion becomes more noticeable. Longer delays may result from some Maneuverability is combination of unfavorable severely limited progression, long cycle lengths, or during short periods high volume-to-capacity ratios. due to temporary Many vehicles stop, and the back-ups. proportion of vehicles not stopping declines. Individual cycle failures are noticeable. Generally considered to be the limit of acceptable delay. Indicative of poor progression, long cycle lengths, and high volume-tocapacity ratios. Individual cycle failures are frequent occurrences. Generally considered to be unacceptable to most drivers. Often occurs with over saturation. May also occur at high volume-tocapacity ratios. There are many individual cycle failures. Poor progression and long cycle lengths may also be major contributing factors. There are typically long queues of vehicles waiting upstream of the intersection. Jammed conditions. Backups from other locations restrict or prevent movement. Volumes may vary widely, depending principally on the downstream backup conditions. >35.0 and < 55.0 >55.0 and < 80.0 >25.0 and < 35.0 >35.0 and < 50.0 >25.0 and < 35.0 >35.0 and < 50.0 > 80.0 > 50.0 > 50.0
64 APPENDIX E - SYNCHRO/ SIM TRAFFIC OUTPUTS
65 HCM Unsignalized Intersection Capacity Analysis Exisiting Condition- AM 1: SR 1 NB Ramps & SR 41 10/2/2014 Movement EBL EBT EBR WBL WBT WBR NBL NBT NBR SBL SBT SBR Lane Configurations Volume (veh/h) Sign Control Free Free Stop Stop Grade 0% 0% 0% 0% Peak Hour Factor Hourly flow rate (vph) Pedestrians Lane Width (ft) Walking Speed (ft/s) Percent Blockage Right turn flare (veh) 9 Median type None None Median storage veh) Upstream signal (ft) 219 px, platoon unblocked vc, conflicting volume vc1, stage 1 conf vol vc2, stage 2 conf vol vcu, unblocked vol tc, single (s) tc, 2 stage (s) tf (s) p0 queue free % cm capacity (veh/h) Direction, Lane # EB 1 WB 1 NB 1 Volume Total Volume Left Volume Right csh Volume to Capacity Queue Length 95th (ft) Control Delay (s) Lane LOS A C Approach Delay (s) Approach LOS C Intersection Summary Average Delay 8.7 Intersection Capacity Utilization 55.0% ICU Level of Service A Analysis Period (min) 15 Omni-Means Synchro 8 Report Page 1
66 HCM Unsignalized Intersection Capacity Analysis Exisiting Condition- AM 2: Main St & SR 41 10/2/2014 Movement EBL EBT EBR WBL WBT WBR NBL NBT NBR SBL SBT SBR Lane Configurations Sign Control Stop Stop Stop Stop Volume (vph) Peak Hour Factor Hourly flow rate (vph) Direction, Lane # EB 1 WB 1 WB 2 NB 1 NB 2 SB 1 SB 2 Volume Total (vph) Volume Left (vph) Volume Right (vph) Hadj (s) Departure Headway (s) Degree Utilization, x Capacity (veh/h) Control Delay (s) Approach Delay (s) Approach LOS C B B B Intersection Summary Delay 13.6 Level of Service B Intersection Capacity Utilization 53.4% ICU Level of Service A Analysis Period (min) 15 Omni-Means Synchro 8 Report Page 2
67 HCM Unsignalized Intersection Capacity Analysis Existing Condition-PM 1: SR 1 NB Ramps & SR 41 10/2/2014 Movement EBL EBT EBR WBL WBT WBR NBL NBT NBR SBL SBT SBR Lane Configurations Volume (veh/h) Sign Control Free Free Stop Stop Grade 0% 0% 0% 0% Peak Hour Factor Hourly flow rate (vph) Pedestrians Lane Width (ft) Walking Speed (ft/s) Percent Blockage Right turn flare (veh) 9 Median type None None Median storage veh) Upstream signal (ft) 219 px, platoon unblocked vc, conflicting volume vc1, stage 1 conf vol vc2, stage 2 conf vol vcu, unblocked vol tc, single (s) tc, 2 stage (s) tf (s) p0 queue free % cm capacity (veh/h) Direction, Lane # EB 1 WB 1 NB 1 Volume Total Volume Left Volume Right csh Volume to Capacity Queue Length 95th (ft) Control Delay (s) Lane LOS A B Approach Delay (s) Approach LOS B Intersection Summary Average Delay 3.8 Intersection Capacity Utilization 43.0% ICU Level of Service A Analysis Period (min) 15 Omni-Means Synchro 8 Report Page 1
68 HCM Unsignalized Intersection Capacity Analysis Existing Condition-PM 2: Main St & SR 41 10/2/2014 Movement EBL EBT EBR WBL WBT WBR NBL NBT NBR SBL SBT SBR Lane Configurations Sign Control Stop Stop Stop Stop Volume (vph) Peak Hour Factor Hourly flow rate (vph) Direction, Lane # EB 1 WB 1 WB 2 NB 1 NB 2 SB 1 SB 2 Volume Total (vph) Volume Left (vph) Volume Right (vph) Hadj (s) Departure Headway (s) Degree Utilization, x Capacity (veh/h) Control Delay (s) Approach Delay (s) Approach LOS C B C B Intersection Summary Delay 15.3 Level of Service C Intersection Capacity Utilization 60.1% ICU Level of Service B Analysis Period (min) 15 Omni-Means Synchro 8 Report Page 2
69 HCM Signalized Intersection Capacity Analysis 1: SR 1 NB Ramps & SR 41 10/1/2014 Movement EBL EBT EBR WBL WBT WBR NBL NBT NBR SBL SBT SBR Lane Configurations Volume (vph) Ideal Flow (vphpl) Total Lost time (s) Lane Util. Factor Frt Flt Protected Satd. Flow (prot) Flt Permitted Satd. Flow (perm) Peak-hour factor, PHF Adj. Flow (vph) RTOR Reduction (vph) Lane Group Flow (vph) Heavy Vehicles (%) 5% 5% 5% 5% 5% 5% 5% 5% 5% 5% 5% 5% Turn Type Prot NA NA Perm Perm Perm Protected Phases Permitted Phases Actuated Green, G (s) Effective Green, g (s) Actuated g/c Ratio Clearance Time (s) Vehicle Extension (s) Lane Grp Cap (vph) v/s Ratio Prot 0.03 c0.08 c0.29 v/s Ratio Perm 0.03 c v/c Ratio Uniform Delay, d Progression Factor Incremental Delay, d Delay (s) Level of Service C C A A D C Approach Delay (s) Approach LOS C A C A Intersection Summary HCM 2000 Control Delay 17.8 HCM 2000 Level of Service B HCM 2000 Volume to Capacity ratio 0.64 Actuated Cycle Length (s) 77.7 Sum of lost time (s) 20.0 Intersection Capacity Utilization 51.4% ICU Level of Service A Analysis Period (min) 15 c Critical Lane Group Opening Yr 2020 AM_signal 5:00 pm 9/24/2014 Baseline Synchro 8 Report Page 1
70 HCM Signalized Intersection Capacity Analysis 2: Main St & SR 41 10/1/2014 Movement EBL EBT EBR WBL WBT WBR NBL NBT NBR SBL SBT SBR Lane Configurations Volume (vph) Ideal Flow (vphpl) Total Lost time (s) Lane Util. Factor Frt Flt Protected Satd. Flow (prot) Flt Permitted Satd. Flow (perm) Peak-hour factor, PHF Adj. Flow (vph) RTOR Reduction (vph) Lane Group Flow (vph) Heavy Vehicles (%) 3% 3% 3% 3% 3% 3% 3% 3% 3% 3% 3% 3% Turn Type Prot NA Prot NA Prot NA Prot NA Perm Protected Phases Permitted Phases 10 Actuated Green, G (s) Effective Green, g (s) Actuated g/c Ratio Clearance Time (s) Vehicle Extension (s) Lane Grp Cap (vph) v/s Ratio Prot 0.05 c c0.18 c0.07 c v/s Ratio Perm 0.01 v/c Ratio Uniform Delay, d Progression Factor Incremental Delay, d Delay (s) Level of Service B A D C D D C C C Approach Delay (s) Approach LOS A D D C Intersection Summary HCM 2000 Control Delay 29.8 HCM 2000 Level of Service C HCM 2000 Volume to Capacity ratio 0.56 Actuated Cycle Length (s) 77.7 Sum of lost time (s) 20.0 Intersection Capacity Utilization 45.7% ICU Level of Service A Analysis Period (min) 15 c Critical Lane Group Opening Yr 2020 AM_signal 5:00 pm 9/24/2014 Baseline Synchro 8 Report Page 2
71 HCM Signalized Intersection Capacity Analysis 1: SR 1 NB Ramps & SR 41 10/1/2014 Movement EBL EBT EBR WBL WBT WBR NBL NBT NBR SBL SBT SBR Lane Configurations Volume (vph) Ideal Flow (vphpl) Total Lost time (s) Lane Util. Factor Frt Flt Protected Satd. Flow (prot) Flt Permitted Satd. Flow (perm) Peak-hour factor, PHF Adj. Flow (vph) RTOR Reduction (vph) Lane Group Flow (vph) Heavy Vehicles (%) 5% 5% 5% 5% 5% 5% 5% 5% 5% 5% 5% 5% Turn Type Prot NA NA Perm Perm Perm Protected Phases Permitted Phases Actuated Green, G (s) Effective Green, g (s) Actuated g/c Ratio Clearance Time (s) Vehicle Extension (s) Lane Grp Cap (vph) v/s Ratio Prot 0.04 c0.09 c0.35 v/s Ratio Perm 0.03 c v/c Ratio Uniform Delay, d Progression Factor Incremental Delay, d Delay (s) Level of Service D C A A E C Approach Delay (s) Approach LOS D A D A Intersection Summary HCM 2000 Control Delay 24.7 HCM 2000 Level of Service C HCM 2000 Volume to Capacity ratio 0.70 Actuated Cycle Length (s) 94.9 Sum of lost time (s) 20.0 Intersection Capacity Utilization 58.5% ICU Level of Service B Analysis Period (min) 15 c Critical Lane Group Opening Yr 2030 AM_signal 5:00 pm 9/24/2014 Baseline Synchro 8 Report Page 1
72 HCM Signalized Intersection Capacity Analysis 2: Main St & SR 41 10/1/2014 Movement EBL EBT EBR WBL WBT WBR NBL NBT NBR SBL SBT SBR Lane Configurations Volume (vph) Ideal Flow (vphpl) Total Lost time (s) Lane Util. Factor Frt Flt Protected Satd. Flow (prot) Flt Permitted Satd. Flow (perm) Peak-hour factor, PHF Adj. Flow (vph) RTOR Reduction (vph) Lane Group Flow (vph) Heavy Vehicles (%) 3% 3% 3% 3% 3% 3% 3% 3% 3% 3% 3% 3% Turn Type Prot NA Prot NA Prot NA Prot NA Perm Protected Phases Permitted Phases 10 Actuated Green, G (s) Effective Green, g (s) Actuated g/c Ratio Clearance Time (s) Vehicle Extension (s) Lane Grp Cap (vph) v/s Ratio Prot 0.06 c c0.21 c0.08 c v/s Ratio Perm 0.02 v/c Ratio Uniform Delay, d Progression Factor Incremental Delay, d Delay (s) Level of Service C A D D E D D D C Approach Delay (s) Approach LOS B D D D Intersection Summary HCM 2000 Control Delay 35.1 HCM 2000 Level of Service D HCM 2000 Volume to Capacity ratio 0.63 Actuated Cycle Length (s) 94.9 Sum of lost time (s) 20.0 Intersection Capacity Utilization 50.9% ICU Level of Service A Analysis Period (min) 15 c Critical Lane Group Opening Yr 2030 AM_signal 5:00 pm 9/24/2014 Baseline Synchro 8 Report Page 2
73 HCM Signalized Intersection Capacity Analysis 1: SR 1 NB Ramps & SR 41 10/1/2014 Movement EBL EBT EBR WBL WBT WBR NBL NBT NBR SBL SBT SBR Lane Configurations Volume (vph) Ideal Flow (vphpl) Total Lost time (s) Lane Util. Factor Frt Flt Protected Satd. Flow (prot) Flt Permitted Satd. Flow (perm) Peak-hour factor, PHF Adj. Flow (vph) RTOR Reduction (vph) Lane Group Flow (vph) Heavy Vehicles (%) 5% 5% 5% 5% 5% 5% 5% 5% 5% 5% 5% 5% Turn Type Prot NA NA Perm Perm Perm Protected Phases Permitted Phases Actuated Green, G (s) Effective Green, g (s) Actuated g/c Ratio Clearance Time (s) Vehicle Extension (s) Lane Grp Cap (vph) v/s Ratio Prot c c0.38 v/s Ratio Perm 0.04 c v/c Ratio Uniform Delay, d Progression Factor Incremental Delay, d Delay (s) Level of Service E D A A E C Approach Delay (s) Approach LOS D A E A Intersection Summary HCM 2000 Control Delay 29.6 HCM 2000 Level of Service C HCM 2000 Volume to Capacity ratio 0.77 Actuated Cycle Length (s) 98.1 Sum of lost time (s) 20.0 Intersection Capacity Utilization 63.6% ICU Level of Service B Analysis Period (min) 15 c Critical Lane Group Opening Yr 2040 AM_signal 5:00 pm 9/24/2014 Baseline Synchro 8 Report Page 1
74 HCM Signalized Intersection Capacity Analysis 2: Main St & SR 41 10/1/2014 Movement EBL EBT EBR WBL WBT WBR NBL NBT NBR SBL SBT SBR Lane Configurations Volume (vph) Ideal Flow (vphpl) Total Lost time (s) Lane Util. Factor Frt Flt Protected Satd. Flow (prot) Flt Permitted Satd. Flow (perm) Peak-hour factor, PHF Adj. Flow (vph) RTOR Reduction (vph) Lane Group Flow (vph) Heavy Vehicles (%) 3% 3% 3% 3% 3% 3% 3% 3% 3% 3% 3% 3% Turn Type Prot NA Prot NA Prot NA Prot NA Perm Protected Phases Permitted Phases 10 Actuated Green, G (s) Effective Green, g (s) Actuated g/c Ratio Clearance Time (s) Vehicle Extension (s) Lane Grp Cap (vph) v/s Ratio Prot 0.07 c c0.24 c0.09 c v/s Ratio Perm 0.02 v/c Ratio Uniform Delay, d Progression Factor Incremental Delay, d Delay (s) Level of Service C B D D E D D D D Approach Delay (s) Approach LOS B D E D Intersection Summary HCM 2000 Control Delay 39.7 HCM 2000 Level of Service D HCM 2000 Volume to Capacity ratio 0.70 Actuated Cycle Length (s) 98.1 Sum of lost time (s) 20.0 Intersection Capacity Utilization 55.3% ICU Level of Service B Analysis Period (min) 15 c Critical Lane Group Opening Yr 2040 AM_signal 5:00 pm 9/24/2014 Baseline Synchro 8 Report Page 2
75 HCM Signalized Intersection Capacity Analysis 1: SR 1 NB Ramps & SR 41 10/1/2014 Movement EBL EBT EBR WBL WBT WBR NBL NBT NBR SBL SBT SBR Lane Configurations Volume (vph) Ideal Flow (vphpl) Total Lost time (s) Lane Util. Factor Frt Flt Protected Satd. Flow (prot) Flt Permitted Satd. Flow (perm) Peak-hour factor, PHF Adj. Flow (vph) RTOR Reduction (vph) Lane Group Flow (vph) Turn Type Prot NA NA Perm Perm Perm Protected Phases Permitted Phases Actuated Green, G (s) Effective Green, g (s) Actuated g/c Ratio Clearance Time (s) Vehicle Extension (s) Lane Grp Cap (vph) v/s Ratio Prot 0.02 c0.07 c0.22 v/s Ratio Perm 0.04 c v/c Ratio Uniform Delay, d Progression Factor Incremental Delay, d Delay (s) Level of Service C B A A C C Approach Delay (s) Approach LOS C A C A Intersection Summary HCM 2000 Control Delay 14.4 HCM 2000 Level of Service B HCM 2000 Volume to Capacity ratio 0.42 Actuated Cycle Length (s) 69.9 Sum of lost time (s) 20.0 Intersection Capacity Utilization 36.9% ICU Level of Service A Analysis Period (min) 15 c Critical Lane Group Opening Yr 2020 PM_signal 5:00 pm 9/24/2014 Baseline Synchro 8 Report Page 1
76 HCM Signalized Intersection Capacity Analysis 2: Main St & SR 41 10/1/2014 Movement EBL EBT EBR WBL WBT WBR NBL NBT NBR SBL SBT SBR Lane Configurations Volume (vph) Ideal Flow (vphpl) Total Lost time (s) Lane Util. Factor Frt Flt Protected Satd. Flow (prot) Flt Permitted Satd. Flow (perm) Peak-hour factor, PHF Adj. Flow (vph) RTOR Reduction (vph) Lane Group Flow (vph) Turn Type Prot NA Prot NA Prot NA Prot NA Perm Protected Phases Permitted Phases 10 Actuated Green, G (s) Effective Green, g (s) Actuated g/c Ratio Clearance Time (s) Vehicle Extension (s) Lane Grp Cap (vph) v/s Ratio Prot c0.07 c c0.14 c0.05 c v/s Ratio Perm 0.03 v/c Ratio Uniform Delay, d Progression Factor Incremental Delay, d Delay (s) Level of Service C A D C E D D C C Approach Delay (s) Approach LOS B C D C Intersection Summary HCM 2000 Control Delay 29.6 HCM 2000 Level of Service C HCM 2000 Volume to Capacity ratio 0.65 Actuated Cycle Length (s) 69.9 Sum of lost time (s) 20.0 Intersection Capacity Utilization 55.3% ICU Level of Service B Analysis Period (min) 15 c Critical Lane Group Opening Yr 2020 PM_signal 5:00 pm 9/24/2014 Baseline Synchro 8 Report Page 2
77 HCM Signalized Intersection Capacity Analysis 1: SR 1 NB Ramps & SR 41 10/1/2014 Movement EBL EBT EBR WBL WBT WBR NBL NBT NBR SBL SBT SBR Lane Configurations Volume (vph) Ideal Flow (vphpl) Total Lost time (s) Lane Util. Factor Frt Flt Protected Satd. Flow (prot) Flt Permitted Satd. Flow (perm) Peak-hour factor, PHF Adj. Flow (vph) RTOR Reduction (vph) Lane Group Flow (vph) Turn Type Prot NA NA Perm Perm Perm Protected Phases Permitted Phases Actuated Green, G (s) Effective Green, g (s) Actuated g/c Ratio Clearance Time (s) Vehicle Extension (s) Lane Grp Cap (vph) v/s Ratio Prot 0.03 c0.08 c0.26 v/s Ratio Perm 0.06 c v/c Ratio Uniform Delay, d Progression Factor Incremental Delay, d Delay (s) Level of Service D C A A D D Approach Delay (s) Approach LOS C A D A Intersection Summary HCM 2000 Control Delay 19.9 HCM 2000 Level of Service B HCM 2000 Volume to Capacity ratio 0.44 Actuated Cycle Length (s) 98.7 Sum of lost time (s) 20.0 Intersection Capacity Utilization 41.5% ICU Level of Service A Analysis Period (min) 15 c Critical Lane Group Opening Yr 2030 PM_signal 5:00 pm 9/24/2014 Baseline Synchro 8 Report Page 1
78 HCM Signalized Intersection Capacity Analysis 2: Main St & SR 41 10/1/2014 Movement EBL EBT EBR WBL WBT WBR NBL NBT NBR SBL SBT SBR Lane Configurations Volume (vph) Ideal Flow (vphpl) Total Lost time (s) Lane Util. Factor Frt Flt Protected Satd. Flow (prot) Flt Permitted Satd. Flow (perm) Peak-hour factor, PHF Adj. Flow (vph) RTOR Reduction (vph) Lane Group Flow (vph) Turn Type Prot NA Prot NA Prot NA Prot NA Perm Protected Phases Permitted Phases 10 Actuated Green, G (s) Effective Green, g (s) Actuated g/c Ratio Clearance Time (s) Vehicle Extension (s) Lane Grp Cap (vph) v/s Ratio Prot c0.09 c c0.17 c0.06 c v/s Ratio Perm 0.04 v/c Ratio Uniform Delay, d Progression Factor Incremental Delay, d Delay (s) Level of Service C B D D E D D C C Approach Delay (s) Approach LOS B D D C Intersection Summary HCM 2000 Control Delay 37.6 HCM 2000 Level of Service D HCM 2000 Volume to Capacity ratio 0.71 Actuated Cycle Length (s) 98.7 Sum of lost time (s) 20.0 Intersection Capacity Utilization 62.7% ICU Level of Service B Analysis Period (min) 15 c Critical Lane Group Opening Yr 2030 PM_signal 5:00 pm 9/24/2014 Baseline Synchro 8 Report Page 2
79 HCM Signalized Intersection Capacity Analysis 1: SR 1 NB Ramps & SR 41 10/2/2014 Movement EBL EBT EBR WBL WBT WBR NBL NBT NBR SBL SBT SBR Lane Configurations Volume (vph) Ideal Flow (vphpl) Total Lost time (s) Lane Util. Factor Frt Flt Protected Satd. Flow (prot) Flt Permitted Satd. Flow (perm) Peak-hour factor, PHF Adj. Flow (vph) RTOR Reduction (vph) Lane Group Flow (vph) Turn Type Prot NA NA Perm Perm Perm Protected Phases Permitted Phases Actuated Green, G (s) Effective Green, g (s) Actuated g/c Ratio Clearance Time (s) Vehicle Extension (s) Lane Grp Cap (vph) v/s Ratio Prot 0.03 c0.09 c0.29 v/s Ratio Perm 0.07 c v/c Ratio Uniform Delay, d Progression Factor Incremental Delay, d Delay (s) Level of Service D C A A E D Approach Delay (s) Approach LOS C A D A Intersection Summary HCM 2000 Control Delay 21.5 HCM 2000 Level of Service C HCM 2000 Volume to Capacity ratio 0.48 Actuated Cycle Length (s) Sum of lost time (s) 20.0 Intersection Capacity Utilization 44.4% ICU Level of Service A Analysis Period (min) 15 c Critical Lane Group Opening Yr 2040 PM_signal 5:00 pm 9/24/2014 Baseline Synchro 8 Report Page 1
80 HCM Signalized Intersection Capacity Analysis 2: Main St & SR 41 10/2/2014 Movement EBL EBT EBR WBL WBT WBR NBL NBT NBR SBL SBT SBR Lane Configurations Volume (vph) Ideal Flow (vphpl) Total Lost time (s) Lane Util. Factor Frt Flt Protected Satd. Flow (prot) Flt Permitted Satd. Flow (perm) Peak-hour factor, PHF Adj. Flow (vph) RTOR Reduction (vph) Lane Group Flow (vph) Turn Type Prot NA Prot NA Prot NA Prot NA Perm Protected Phases Permitted Phases 10 Actuated Green, G (s) Effective Green, g (s) Actuated g/c Ratio Clearance Time (s) Vehicle Extension (s) Lane Grp Cap (vph) v/s Ratio Prot c0.09 c c0.18 c0.07 c v/s Ratio Perm 0.05 v/c Ratio Uniform Delay, d Progression Factor Incremental Delay, d Delay (s) Level of Service C B D D F E D C C Approach Delay (s) Approach LOS B D E C Intersection Summary HCM 2000 Control Delay 41.8 HCM 2000 Level of Service D HCM 2000 Volume to Capacity ratio 0.78 Actuated Cycle Length (s) Sum of lost time (s) 20.0 Intersection Capacity Utilization 67.7% ICU Level of Service C Analysis Period (min) 15 c Critical Lane Group Opening Yr 2040 PM_signal 5:00 pm 9/24/2014 Baseline Synchro 8 Report Page 2
81 HCM Unsignalized Intersection Capacity Analysis OPENING YR 2020-AM 1: SR 1 NB Ramps & SR 41 10/2/2014 Movement EBL EBT EBR WBL WBT WBR NBL NBT NBR SBL SBT SBR Lane Configurations Volume (veh/h) Sign Control Free Free Stop Stop Grade 0% 0% 0% 0% Peak Hour Factor Hourly flow rate (vph) Pedestrians Lane Width (ft) Walking Speed (ft/s) Percent Blockage Right turn flare (veh) 9 Median type None None Median storage veh) Upstream signal (ft) 219 px, platoon unblocked vc, conflicting volume vc1, stage 1 conf vol vc2, stage 2 conf vol vcu, unblocked vol tc, single (s) tc, 2 stage (s) tf (s) p0 queue free % cm capacity (veh/h) Direction, Lane # EB 1 WB 1 NB 1 Volume Total Volume Left Volume Right csh Volume to Capacity Queue Length 95th (ft) Control Delay (s) Lane LOS A E Approach Delay (s) Approach LOS E Intersection Summary Average Delay 15.1 Intersection Capacity Utilization 62.0% ICU Level of Service B Analysis Period (min) 15 Omni-Means Synchro 8 Report Page 1
82 HCM Unsignalized Intersection Capacity Analysis OPENING YR 2020-AM 2: Main St & SR 41 10/2/2014 Movement EBL EBT EBR WBL WBT WBR NBL NBT NBR SBL SBT SBR Lane Configurations Sign Control Stop Stop Stop Stop Volume (vph) Peak Hour Factor Hourly flow rate (vph) Direction, Lane # EB 1 WB 1 WB 2 NB 1 NB 2 SB 1 SB 2 Volume Total (vph) Volume Left (vph) Volume Right (vph) Hadj (s) Departure Headway (s) Degree Utilization, x Capacity (veh/h) Control Delay (s) Approach Delay (s) Approach LOS C C B B Intersection Summary Delay 17.7 Level of Service C Intersection Capacity Utilization 59.3% ICU Level of Service B Analysis Period (min) 15 Omni-Means Synchro 8 Report Page 2
83 HCM Unsignalized Intersection Capacity Analysis OPENING YR 2020-PM 1: SR 1 NB Ramps & SR 41 10/2/2014 Movement EBL EBT EBR WBL WBT WBR NBL NBT NBR SBL SBT SBR Lane Configurations Volume (veh/h) Sign Control Free Free Stop Stop Grade 0% 0% 0% 0% Peak Hour Factor Hourly flow rate (vph) Pedestrians Lane Width (ft) Walking Speed (ft/s) Percent Blockage Right turn flare (veh) 9 Median type None None Median storage veh) Upstream signal (ft) 219 px, platoon unblocked vc, conflicting volume vc1, stage 1 conf vol vc2, stage 2 conf vol vcu, unblocked vol tc, single (s) tc, 2 stage (s) tf (s) p0 queue free % cm capacity (veh/h) Direction, Lane # EB 1 WB 1 NB 1 Volume Total Volume Left Volume Right csh Volume to Capacity Queue Length 95th (ft) Control Delay (s) Lane LOS A B Approach Delay (s) Approach LOS B Intersection Summary Average Delay 4.1 Intersection Capacity Utilization 48.2% ICU Level of Service A Analysis Period (min) 15 Omni-Means Synchro 8 Report Page 1
84 HCM Unsignalized Intersection Capacity Analysis OPENING YR 2020-PM 2: Main St & SR 41 10/2/2014 Movement EBL EBT EBR WBL WBT WBR NBL NBT NBR SBL SBT SBR Lane Configurations Sign Control Stop Stop Stop Stop Volume (vph) Peak Hour Factor Hourly flow rate (vph) Direction, Lane # EB 1 WB 1 WB 2 NB 1 NB 2 SB 1 SB 2 Volume Total (vph) Volume Left (vph) Volume Right (vph) Hadj (s) Departure Headway (s) Degree Utilization, x Capacity (veh/h) Control Delay (s) Approach Delay (s) Approach LOS D C C B Intersection Summary Delay 21.0 Level of Service C Intersection Capacity Utilization 67.0% ICU Level of Service C Analysis Period (min) 15 Omni-Means Synchro 8 Report Page 2
85 HCM Unsignalized Intersection Capacity Analysis Year 2030-AM 1: SR 1 NB Ramps & SR 41 10/2/2014 Movement EBL EBT EBR WBL WBT WBR NBL NBT NBR SBL SBT SBR Lane Configurations Volume (veh/h) Sign Control Free Free Stop Stop Grade 0% 0% 0% 0% Peak Hour Factor Hourly flow rate (vph) Pedestrians Lane Width (ft) Walking Speed (ft/s) Percent Blockage Right turn flare (veh) 9 Median type None None Median storage veh) Upstream signal (ft) 219 px, platoon unblocked vc, conflicting volume vc1, stage 1 conf vol vc2, stage 2 conf vol vcu, unblocked vol tc, single (s) tc, 2 stage (s) tf (s) p0 queue free % cm capacity (veh/h) Direction, Lane # EB 1 WB 1 NB 1 Volume Total Volume Left Volume Right csh Volume to Capacity Queue Length 95th (ft) Control Delay (s) Lane LOS A F Approach Delay (s) Approach LOS F Intersection Summary Average Delay 93.3 Intersection Capacity Utilization 72.1% ICU Level of Service C Analysis Period (min) 15 Omni-Means Synchro 8 Report Page 1
86 HCM Unsignalized Intersection Capacity Analysis Year 2030-AM 2: Main St & SR 41 10/2/2014 Movement EBL EBT EBR WBL WBT WBR NBL NBT NBR SBL SBT SBR Lane Configurations Sign Control Stop Stop Stop Stop Volume (vph) Peak Hour Factor Hourly flow rate (vph) Direction, Lane # EB 1 WB 1 WB 2 NB 1 NB 2 SB 1 SB 2 Volume Total (vph) Volume Left (vph) Volume Right (vph) Hadj (s) Departure Headway (s) Degree Utilization, x Capacity (veh/h) Control Delay (s) Approach Delay (s) Approach LOS E E C C Intersection Summary Delay 31.6 Level of Service D Intersection Capacity Utilization 67.3% ICU Level of Service C Analysis Period (min) 15 Omni-Means Synchro 8 Report Page 2
87 HCM Unsignalized Intersection Capacity Analysis Year 2030-PM 1: SR 1 NB Ramps & SR 41 10/2/2014 Movement EBL EBT EBR WBL WBT WBR NBL NBT NBR SBL SBT SBR Lane Configurations Volume (veh/h) Sign Control Free Free Stop Stop Grade 0% 0% 0% 0% Peak Hour Factor Hourly flow rate (vph) Pedestrians Lane Width (ft) Walking Speed (ft/s) Percent Blockage Right turn flare (veh) 9 Median type None None Median storage veh) Upstream signal (ft) 219 px, platoon unblocked vc, conflicting volume vc1, stage 1 conf vol vc2, stage 2 conf vol vcu, unblocked vol tc, single (s) tc, 2 stage (s) tf (s) p0 queue free % cm capacity (veh/h) Direction, Lane # EB 1 WB 1 NB 1 Volume Total Volume Left Volume Right csh Volume to Capacity Queue Length 95th (ft) Control Delay (s) Lane LOS A B Approach Delay (s) Approach LOS B Intersection Summary Average Delay 4.7 Intersection Capacity Utilization 55.4% ICU Level of Service B Analysis Period (min) 15 Omni-Means Synchro 8 Report Page 1
88 HCM Unsignalized Intersection Capacity Analysis Year 2030-PM 2: Main St & SR 41 10/2/2014 Movement EBL EBT EBR WBL WBT WBR NBL NBT NBR SBL SBT SBR Lane Configurations Sign Control Stop Stop Stop Stop Volume (vph) Peak Hour Factor Hourly flow rate (vph) Direction, Lane # EB 1 WB 1 WB 2 NB 1 NB 2 SB 1 SB 2 Volume Total (vph) Volume Left (vph) Volume Right (vph) Hadj (s) Departure Headway (s) Degree Utilization, x Capacity (veh/h) Control Delay (s) Approach Delay (s) Approach LOS F D E C Intersection Summary Delay 41.4 Level of Service E Intersection Capacity Utilization 77.5% ICU Level of Service D Analysis Period (min) 15 Omni-Means Synchro 8 Report Page 2
89 HCM Unsignalized Intersection Capacity Analysis Year 2040-AM 1: SR 1 NB Ramps & SR 41 10/2/2014 Movement EBL EBT EBR WBL WBT WBR NBL NBT NBR SBL SBT SBR Lane Configurations Volume (veh/h) Sign Control Free Free Stop Stop Grade 0% 0% 0% 0% Peak Hour Factor Hourly flow rate (vph) Pedestrians Lane Width (ft) Walking Speed (ft/s) Percent Blockage Right turn flare (veh) 9 Median type None None Median storage veh) Upstream signal (ft) 219 px, platoon unblocked vc, conflicting volume vc1, stage 1 conf vol vc2, stage 2 conf vol vcu, unblocked vol tc, single (s) tc, 2 stage (s) tf (s) p0 queue free % cm capacity (veh/h) Direction, Lane # EB 1 WB 1 NB 1 Volume Total Volume Left Volume Right csh Volume to Capacity Queue Length 95th (ft) Control Delay (s) Lane LOS A F Approach Delay (s) Approach LOS F Intersection Summary Average Delay Intersection Capacity Utilization 79.2% ICU Level of Service D Analysis Period (min) 15 Omni-Means Synchro 8 Report Page 1
90 HCM Unsignalized Intersection Capacity Analysis Year 2040-AM 2: Main St & SR 41 10/2/2014 Movement EBL EBT EBR WBL WBT WBR NBL NBT NBR SBL SBT SBR Lane Configurations Sign Control Stop Stop Stop Stop Volume (vph) Peak Hour Factor Hourly flow rate (vph) Direction, Lane # EB 1 WB 1 WB 2 NB 1 NB 2 SB 1 SB 2 Volume Total (vph) Volume Left (vph) Volume Right (vph) Hadj (s) Departure Headway (s) Degree Utilization, x Capacity (veh/h) Control Delay (s) Approach Delay (s) Approach LOS F F D C Intersection Summary Delay 50.4 Level of Service F Intersection Capacity Utilization 73.3% ICU Level of Service D Analysis Period (min) 15 Omni-Means Synchro 8 Report Page 2
91 HCM Unsignalized Intersection Capacity Analysis Year 2040-PM Signalized 1: SR 1 NB Ramps & SR 41 10/2/2014 Movement EBL EBT EBR WBL WBT WBR NBL NBT NBR SBL SBT SBR Lane Configurations Volume (veh/h) Sign Control Free Free Stop Stop Grade 0% 0% 0% 0% Peak Hour Factor Hourly flow rate (vph) Pedestrians Lane Width (ft) Walking Speed (ft/s) Percent Blockage Right turn flare (veh) 9 Median type None None Median storage veh) Upstream signal (ft) 219 px, platoon unblocked vc, conflicting volume vc1, stage 1 conf vol vc2, stage 2 conf vol vcu, unblocked vol tc, single (s) tc, 2 stage (s) tf (s) p0 queue free % cm capacity (veh/h) Direction, Lane # EB 1 WB 1 NB 1 Volume Total Volume Left Volume Right csh Volume to Capacity Queue Length 95th (ft) Control Delay (s) Lane LOS A C Approach Delay (s) Approach LOS C Intersection Summary Average Delay 5.3 Intersection Capacity Utilization 60.8% ICU Level of Service B Analysis Period (min) 15 Omni-Means Synchro 8 Report Page 1
92 HCM Unsignalized Intersection Capacity Analysis Year 2040-PM Signalized 2: Main St & SR 41 10/2/2014 Movement EBL EBT EBR WBL WBT WBR NBL NBT NBR SBL SBT SBR Lane Configurations Sign Control Stop Stop Stop Stop Volume (vph) Peak Hour Factor Hourly flow rate (vph) Direction, Lane # EB 1 WB 1 WB 2 NB 1 NB 2 SB 1 SB 2 Volume Total (vph) Volume Left (vph) Volume Right (vph) Hadj (s) Departure Headway (s) Degree Utilization, x Capacity (veh/h) Control Delay (s) Approach Delay (s) Approach LOS F E F C Intersection Summary Delay 65.0 Level of Service F Intersection Capacity Utilization 85.2% ICU Level of Service E Analysis Period (min) 15 Omni-Means Synchro 8 Report Page 2
93 SimTraffic Performance Report Baseline 10/1/2014 1: SR 1 NB Ramps & SR 41 Performance by movement Movement EBL EBT WBT WBR NBL NBR All Denied Delay (hr) Denied Del/Veh (s) Total Delay (hr) Total Del/Veh (s) Vehicles Entered Vehicles Exited Hourly Exit Rate Input Volume % of Volume : Main St & SR 41 Performance by movement Movement EBL EBT EBR WBL WBT WBR NBL NBT NBR SBL SBT SBR Denied Delay (hr) Denied Del/Veh (s) Total Delay (hr) Total Del/Veh (s) Vehicles Entered Vehicles Exited Hourly Exit Rate Input Volume % of Volume : Main St & SR 41 Performance by movement Movement All Denied Delay (hr) 0.4 Denied Del/Veh (s) 1.1 Total Delay (hr) 8.1 Total Del/Veh (s) 23.7 Vehicles Entered 1221 Vehicles Exited 1221 Hourly Exit Rate 1221 Input Volume 1240 % of Volume 98 Opening Yr 2020 AM_signal SimTraffic Report Page 1
94 SimTraffic Performance Report Baseline 10/1/2014 Total Network Performance Denied Delay (hr) 0.7 Denied Del/Veh (s) 1.7 Total Delay (hr) 13.7 Total Del/Veh (s) 32.0 Vehicles Entered 1511 Vehicles Exited 1511 Hourly Exit Rate 1511 Input Volume 4561 % of Volume 33 Opening Yr 2020 AM_signal SimTraffic Report Page 2
95 Queuing and Blocking Report Baseline 10/1/2014 Intersection: 1: SR 1 NB Ramps & SR 41 Movement EB EB WB WB NB NB Directions Served L TR T R L R Maximum Queue (ft) Average Queue (ft) th Queue (ft) Link Distance (ft) Upstream Blk Time (%) 21 2 Queuing Penalty (veh) 58 4 Storage Bay Dist (ft) Storage Blk Time (%) 3 30 Queuing Penalty (veh) 4 15 Intersection: 2: Main St & SR 41 Movement EB EB WB WB B12 NB NB SB SB SB Directions Served L TR L TR T L TR L T R Maximum Queue (ft) Average Queue (ft) th Queue (ft) Link Distance (ft) Upstream Blk Time (%) Queuing Penalty (veh) Storage Bay Dist (ft) Storage Blk Time (%) Queuing Penalty (veh) Network Summary Network wide Queuing Penalty: 141 Opening Yr 2020 AM_signal SimTraffic Report Page 3
96 SimTraffic Performance Report Baseline 10/1/2014 1: SR 1 NB Ramps & SR 41 Performance by movement Movement EBL EBT WBT WBR NBL NBR All Denied Delay (hr) Denied Del/Veh (s) Total Delay (hr) Total Del/Veh (s) Vehicles Entered Vehicles Exited Hourly Exit Rate Input Volume % of Volume : Main St & SR 41 Performance by movement Movement EBL EBT EBR WBL WBT WBR NBL NBT NBR SBL SBT SBR Denied Delay (hr) Denied Del/Veh (s) Total Delay (hr) Total Del/Veh (s) Vehicles Entered Vehicles Exited Hourly Exit Rate Input Volume % of Volume : Main St & SR 41 Performance by movement Movement All Denied Delay (hr) 0.4 Denied Del/Veh (s) 1.1 Total Delay (hr) 7.4 Total Del/Veh (s) 19.7 Vehicles Entered 1332 Vehicles Exited 1331 Hourly Exit Rate 1331 Input Volume 1353 % of Volume 98 Opening Yr 2020 PM_signal SimTraffic Report Page 1
97 SimTraffic Performance Report Baseline 10/1/2014 Total Network Performance Denied Delay (hr) 0.5 Denied Del/Veh (s) 1.4 Total Delay (hr) 10.6 Total Del/Veh (s) 26.2 Vehicles Entered 1435 Vehicles Exited 1440 Hourly Exit Rate 1440 Input Volume 4297 % of Volume 34 Opening Yr 2020 PM_signal SimTraffic Report Page 2
98 Queuing and Blocking Report Baseline 10/1/2014 Intersection: 1: SR 1 NB Ramps & SR 41 Movement EB EB WB WB NB NB Directions Served L TR T R L R Maximum Queue (ft) Average Queue (ft) th Queue (ft) Link Distance (ft) Upstream Blk Time (%) 11 2 Queuing Penalty (veh) 28 4 Storage Bay Dist (ft) Storage Blk Time (%) 1 19 Queuing Penalty (veh) 1 8 Intersection: 2: Main St & SR 41 Movement EB EB WB WB NB NB SB SB SB Directions Served L TR L TR L TR L T R Maximum Queue (ft) Average Queue (ft) th Queue (ft) Link Distance (ft) Upstream Blk Time (%) Queuing Penalty (veh) Storage Bay Dist (ft) Storage Blk Time (%) Queuing Penalty (veh) Network Summary Network wide Queuing Penalty: 122 Opening Yr 2020 PM_signal SimTraffic Report Page 3
99 SimTraffic Performance Report Baseline 10/1/2014 1: SR 1 NB Ramps & SR 41 Performance by movement Movement EBL EBT WBT WBR NBL NBR All Denied Delay (hr) Denied Del/Veh (s) Total Delay (hr) Total Del/Veh (s) Vehicles Entered Vehicles Exited Hourly Exit Rate Input Volume % of Volume : Main St & SR 41 Performance by movement Movement EBL EBT EBR WBL WBT WBR NBL NBT NBR SBL SBT SBR Denied Delay (hr) Denied Del/Veh (s) Total Delay (hr) Total Del/Veh (s) Vehicles Entered Vehicles Exited Hourly Exit Rate Input Volume % of Volume : Main St & SR 41 Performance by movement Movement All Denied Delay (hr) 0.4 Denied Del/Veh (s) 1.1 Total Delay (hr) 12.3 Total Del/Veh (s) 29.8 Vehicles Entered 1477 Vehicles Exited 1477 Hourly Exit Rate 1477 Input Volume 1477 % of Volume 100 Opening Yr 2030 AM_signal SimTraffic Report Page 1
100 SimTraffic Performance Report Baseline 10/1/2014 Total Network Performance Denied Delay (hr) 0.9 Denied Del/Veh (s) 1.8 Total Delay (hr) 23.8 Total Del/Veh (s) 46.1 Vehicles Entered 1818 Vehicles Exited 1818 Hourly Exit Rate 1818 Input Volume 5430 % of Volume 33 Opening Yr 2030 AM_signal SimTraffic Report Page 2
101 Queuing and Blocking Report Baseline 10/1/2014 Intersection: 1: SR 1 NB Ramps & SR 41 Movement EB EB WB WB NB NB Directions Served L TR T R L R Maximum Queue (ft) Average Queue (ft) th Queue (ft) Link Distance (ft) Upstream Blk Time (%) Queuing Penalty (veh) Storage Bay Dist (ft) Storage Blk Time (%) Queuing Penalty (veh) Intersection: 2: Main St & SR 41 Movement EB EB WB WB B12 NB NB SB SB SB Directions Served L TR L TR T L TR L T R Maximum Queue (ft) Average Queue (ft) th Queue (ft) Link Distance (ft) Upstream Blk Time (%) Queuing Penalty (veh) Storage Bay Dist (ft) Storage Blk Time (%) Queuing Penalty (veh) Network Summary Network wide Queuing Penalty: 270 Opening Yr 2030 AM_signal SimTraffic Report Page 3
102 SimTraffic Performance Report Baseline 10/1/2014 1: SR 1 NB Ramps & SR 41 Performance by movement Movement EBL EBT WBT WBR NBL NBR All Denied Delay (hr) Denied Del/Veh (s) Total Delay (hr) Total Del/Veh (s) Vehicles Entered Vehicles Exited Hourly Exit Rate Input Volume % of Volume : Main St & SR 41 Performance by movement Movement EBL EBT EBR WBL WBT WBR NBL NBT NBR SBL SBT SBR Denied Delay (hr) Denied Del/Veh (s) Total Delay (hr) Total Del/Veh (s) Vehicles Entered Vehicles Exited Hourly Exit Rate Input Volume % of Volume : Main St & SR 41 Performance by movement Movement All Denied Delay (hr) 0.5 Denied Del/Veh (s) 1.1 Total Delay (hr) 12.7 Total Del/Veh (s) 28.0 Vehicles Entered 1615 Vehicles Exited 1615 Hourly Exit Rate 1615 Input Volume 1610 % of Volume 100 Opening Yr 2030 PM_signal SimTraffic Report Page 1
103 SimTraffic Performance Report Baseline 10/1/2014 Total Network Performance Denied Delay (hr) 0.7 Denied Del/Veh (s) 1.5 Total Delay (hr) 20.6 Total Del/Veh (s) 41.9 Vehicles Entered 1739 Vehicles Exited 1744 Hourly Exit Rate 1744 Input Volume 5121 % of Volume 34 Opening Yr 2030 PM_signal SimTraffic Report Page 2
104 Queuing and Blocking Report Baseline 10/1/2014 Intersection: 1: SR 1 NB Ramps & SR 41 Movement EB EB WB WB NB NB Directions Served L TR T R L R Maximum Queue (ft) Average Queue (ft) th Queue (ft) Link Distance (ft) Upstream Blk Time (%) 13 1 Queuing Penalty (veh) 39 4 Storage Bay Dist (ft) Storage Blk Time (%) Queuing Penalty (veh) Intersection: 2: Main St & SR 41 Movement EB EB WB WB B12 NB NB SB SB SB Directions Served L TR L TR T L TR L T R Maximum Queue (ft) Average Queue (ft) th Queue (ft) Link Distance (ft) Upstream Blk Time (%) Queuing Penalty (veh) Storage Bay Dist (ft) Storage Blk Time (%) Queuing Penalty (veh) Network Summary Network wide Queuing Penalty: 249 Opening Yr 2030 PM_signal SimTraffic Report Page 3
105 SimTraffic Performance Report Baseline 10/1/2014 1: SR 1 NB Ramps & SR 41 Performance by movement Movement EBL EBT WBT WBR NBL NBR All Denied Delay (hr) Denied Del/Veh (s) Total Delay (hr) Total Del/Veh (s) Vehicles Entered Vehicles Exited Hourly Exit Rate Input Volume % of Volume : Main St & SR 41 Performance by movement Movement EBL EBT EBR WBL WBT WBR NBL NBT NBR SBL SBT SBR Denied Delay (hr) Denied Del/Veh (s) Total Delay (hr) Total Del/Veh (s) Vehicles Entered Vehicles Exited Hourly Exit Rate Input Volume % of Volume : Main St & SR 41 Performance by movement Movement All Denied Delay (hr) 0.5 Denied Del/Veh (s) 1.1 Total Delay (hr) 15.8 Total Del/Veh (s) 34.6 Vehicles Entered 1629 Vehicles Exited 1632 Hourly Exit Rate 1632 Input Volume 1648 % of Volume 99 Opening Yr 2040 AM_signal SimTraffic Report Page 1
106 SimTraffic Performance Report Baseline 10/1/2014 Total Network Performance Denied Delay (hr) 1.0 Denied Del/Veh (s) 1.8 Total Delay (hr) 30.5 Total Del/Veh (s) 53.4 Vehicles Entered 2013 Vehicles Exited 2015 Hourly Exit Rate 2015 Input Volume 6063 % of Volume 33 Opening Yr 2040 AM_signal SimTraffic Report Page 2
107 Queuing and Blocking Report Baseline 10/1/2014 Intersection: 1: SR 1 NB Ramps & SR 41 Movement EB EB WB WB NB NB Directions Served L TR T R L R Maximum Queue (ft) Average Queue (ft) th Queue (ft) Link Distance (ft) Upstream Blk Time (%) Queuing Penalty (veh) Storage Bay Dist (ft) Storage Blk Time (%) Queuing Penalty (veh) Intersection: 2: Main St & SR 41 Movement EB EB WB WB B12 NB NB SB SB SB Directions Served L TR L TR T L TR L T R Maximum Queue (ft) Average Queue (ft) th Queue (ft) Link Distance (ft) Upstream Blk Time (%) Queuing Penalty (veh) Storage Bay Dist (ft) Storage Blk Time (%) Queuing Penalty (veh) Network Summary Network wide Queuing Penalty: 378 Opening Yr 2040 AM_signal SimTraffic Report Page 3
108 SimTraffic Performance Report Baseline 10/1/2014 1: SR 1 NB Ramps & SR 41 Performance by movement Movement EBL EBT WBT WBR NBL NBR All Denied Delay (hr) Denied Del/Veh (s) Total Delay (hr) Total Del/Veh (s) Vehicles Entered Vehicles Exited Hourly Exit Rate Input Volume % of Volume : Main St & SR 41 Performance by movement Movement EBL EBT EBR WBL WBT WBR NBL NBT NBR SBL SBT SBR Denied Delay (hr) Denied Del/Veh (s) Total Delay (hr) Total Del/Veh (s) Vehicles Entered Vehicles Exited Hourly Exit Rate Input Volume % of Volume : Main St & SR 41 Performance by movement Movement All Denied Delay (hr) 0.8 Denied Del/Veh (s) 1.6 Total Delay (hr) 17.1 Total Del/Veh (s) 34.2 Vehicles Entered 1781 Vehicles Exited 1777 Hourly Exit Rate 1777 Input Volume 1806 % of Volume 98 Opening Yr 2040 PM_signal SimTraffic Report Page 1
109 SimTraffic Performance Report Baseline 10/1/2014 Total Network Performance Denied Delay (hr) 1.0 Denied Del/Veh (s) 1.9 Total Delay (hr) 34.5 Total Del/Veh (s) 62.3 Vehicles Entered 1939 Vehicles Exited 1925 Hourly Exit Rate 1925 Input Volume 5731 % of Volume 34 Opening Yr 2040 PM_signal SimTraffic Report Page 2
110 Queuing and Blocking Report Baseline 10/1/2014 Intersection: 1: SR 1 NB Ramps & SR 41 Movement EB EB WB WB NB NB Directions Served L TR T R L R Maximum Queue (ft) Average Queue (ft) th Queue (ft) Link Distance (ft) Upstream Blk Time (%) 15 2 Queuing Penalty (veh) 47 7 Storage Bay Dist (ft) Storage Blk Time (%) Queuing Penalty (veh) Intersection: 2: Main St & SR 41 Movement EB EB WB WB B12 NB NB SB SB SB Directions Served L TR L TR T L TR L T R Maximum Queue (ft) Average Queue (ft) th Queue (ft) Link Distance (ft) Upstream Blk Time (%) Queuing Penalty (veh) Storage Bay Dist (ft) Storage Blk Time (%) Queuing Penalty (veh) Network Summary Network wide Queuing Penalty: 372 Opening Yr 2040 PM_signal SimTraffic Report Page 3
111 HCM Unsignalized Intersection Capacity Analysis Exisiting Condition- AM 1: SR 1 NB Ramps & SR 41 10/2/2014 Movement EBL EBT EBR WBL WBT WBR NBL NBT NBR SBL SBT SBR Lane Configurations Volume (veh/h) Sign Control Free Free Stop Stop Grade 0% 0% 0% 0% Peak Hour Factor Hourly flow rate (vph) Pedestrians Lane Width (ft) Walking Speed (ft/s) Percent Blockage Right turn flare (veh) 9 Median type None None Median storage veh) Upstream signal (ft) 219 px, platoon unblocked vc, conflicting volume vc1, stage 1 conf vol vc2, stage 2 conf vol vcu, unblocked vol tc, single (s) tc, 2 stage (s) tf (s) p0 queue free % cm capacity (veh/h) Direction, Lane # EB 1 WB 1 NB 1 Volume Total Volume Left Volume Right csh Volume to Capacity Queue Length 95th (ft) Control Delay (s) Lane LOS A C Approach Delay (s) Approach LOS C Intersection Summary Average Delay 8.7 Intersection Capacity Utilization 55.0% ICU Level of Service A Analysis Period (min) 15 Omni-Means Synchro 8 Report Page 1
112 HCM Unsignalized Intersection Capacity Analysis Exisiting Condition- AM 2: Main St & SR 41 10/2/2014 Movement EBL EBT EBR WBL WBT WBR NBL NBT NBR SBL SBT SBR Lane Configurations Sign Control Stop Stop Stop Stop Volume (vph) Peak Hour Factor Hourly flow rate (vph) Direction, Lane # EB 1 WB 1 WB 2 NB 1 NB 2 SB 1 SB 2 Volume Total (vph) Volume Left (vph) Volume Right (vph) Hadj (s) Departure Headway (s) Degree Utilization, x Capacity (veh/h) Control Delay (s) Approach Delay (s) Approach LOS C B B B Intersection Summary Delay 13.6 Level of Service B Intersection Capacity Utilization 53.4% ICU Level of Service A Analysis Period (min) 15 Omni-Means Synchro 8 Report Page 2
113 HCM Unsignalized Intersection Capacity Analysis Existing Condition-PM 1: SR 1 NB Ramps & SR 41 10/2/2014 Movement EBL EBT EBR WBL WBT WBR NBL NBT NBR SBL SBT SBR Lane Configurations Volume (veh/h) Sign Control Free Free Stop Stop Grade 0% 0% 0% 0% Peak Hour Factor Hourly flow rate (vph) Pedestrians Lane Width (ft) Walking Speed (ft/s) Percent Blockage Right turn flare (veh) 9 Median type None None Median storage veh) Upstream signal (ft) 219 px, platoon unblocked vc, conflicting volume vc1, stage 1 conf vol vc2, stage 2 conf vol vcu, unblocked vol tc, single (s) tc, 2 stage (s) tf (s) p0 queue free % cm capacity (veh/h) Direction, Lane # EB 1 WB 1 NB 1 Volume Total Volume Left Volume Right csh Volume to Capacity Queue Length 95th (ft) Control Delay (s) Lane LOS A B Approach Delay (s) Approach LOS B Intersection Summary Average Delay 3.8 Intersection Capacity Utilization 43.0% ICU Level of Service A Analysis Period (min) 15 Omni-Means Synchro 8 Report Page 1
114 HCM Unsignalized Intersection Capacity Analysis Existing Condition-PM 2: Main St & SR 41 10/2/2014 Movement EBL EBT EBR WBL WBT WBR NBL NBT NBR SBL SBT SBR Lane Configurations Sign Control Stop Stop Stop Stop Volume (vph) Peak Hour Factor Hourly flow rate (vph) Direction, Lane # EB 1 WB 1 WB 2 NB 1 NB 2 SB 1 SB 2 Volume Total (vph) Volume Left (vph) Volume Right (vph) Hadj (s) Departure Headway (s) Degree Utilization, x Capacity (veh/h) Control Delay (s) Approach Delay (s) Approach LOS C B C B Intersection Summary Delay 15.3 Level of Service C Intersection Capacity Utilization 60.1% ICU Level of Service B Analysis Period (min) 15 Omni-Means Synchro 8 Report Page 2
115 HCM Unsignalized Intersection Capacity Analysis OPENING YR 2020-AM 1: SR 1 NB Ramps & SR 41 10/2/2014 Movement EBL EBT EBR WBL WBT WBR NBL NBT NBR SBL SBT SBR Lane Configurations Volume (veh/h) Sign Control Free Free Stop Stop Grade 0% 0% 0% 0% Peak Hour Factor Hourly flow rate (vph) Pedestrians Lane Width (ft) Walking Speed (ft/s) Percent Blockage Right turn flare (veh) 9 Median type None None Median storage veh) Upstream signal (ft) 219 px, platoon unblocked vc, conflicting volume vc1, stage 1 conf vol vc2, stage 2 conf vol vcu, unblocked vol tc, single (s) tc, 2 stage (s) tf (s) p0 queue free % cm capacity (veh/h) Direction, Lane # EB 1 WB 1 NB 1 Volume Total Volume Left Volume Right csh Volume to Capacity Queue Length 95th (ft) Control Delay (s) Lane LOS A E Approach Delay (s) Approach LOS E Intersection Summary Average Delay 15.1 Intersection Capacity Utilization 62.0% ICU Level of Service B Analysis Period (min) 15 Omni-Means Synchro 8 Report Page 1
116 HCM Unsignalized Intersection Capacity Analysis OPENING YR 2020-AM 2: Main St & SR 41 10/2/2014 Movement EBL EBT EBR WBL WBT WBR NBL NBT NBR SBL SBT SBR Lane Configurations Sign Control Stop Stop Stop Stop Volume (vph) Peak Hour Factor Hourly flow rate (vph) Direction, Lane # EB 1 WB 1 WB 2 NB 1 NB 2 SB 1 SB 2 Volume Total (vph) Volume Left (vph) Volume Right (vph) Hadj (s) Departure Headway (s) Degree Utilization, x Capacity (veh/h) Control Delay (s) Approach Delay (s) Approach LOS C C B B Intersection Summary Delay 17.7 Level of Service C Intersection Capacity Utilization 59.3% ICU Level of Service B Analysis Period (min) 15 Omni-Means Synchro 8 Report Page 2
117 HCM Unsignalized Intersection Capacity Analysis OPENING YR 2020-PM 1: SR 1 NB Ramps & SR 41 10/2/2014 Movement EBL EBT EBR WBL WBT WBR NBL NBT NBR SBL SBT SBR Lane Configurations Volume (veh/h) Sign Control Free Free Stop Stop Grade 0% 0% 0% 0% Peak Hour Factor Hourly flow rate (vph) Pedestrians Lane Width (ft) Walking Speed (ft/s) Percent Blockage Right turn flare (veh) 9 Median type None None Median storage veh) Upstream signal (ft) 219 px, platoon unblocked vc, conflicting volume vc1, stage 1 conf vol vc2, stage 2 conf vol vcu, unblocked vol tc, single (s) tc, 2 stage (s) tf (s) p0 queue free % cm capacity (veh/h) Direction, Lane # EB 1 WB 1 NB 1 Volume Total Volume Left Volume Right csh Volume to Capacity Queue Length 95th (ft) Control Delay (s) Lane LOS A B Approach Delay (s) Approach LOS B Intersection Summary Average Delay 4.1 Intersection Capacity Utilization 48.2% ICU Level of Service A Analysis Period (min) 15 Omni-Means Synchro 8 Report Page 1
118 HCM Unsignalized Intersection Capacity Analysis OPENING YR 2020-PM 2: Main St & SR 41 10/2/2014 Movement EBL EBT EBR WBL WBT WBR NBL NBT NBR SBL SBT SBR Lane Configurations Sign Control Stop Stop Stop Stop Volume (vph) Peak Hour Factor Hourly flow rate (vph) Direction, Lane # EB 1 WB 1 WB 2 NB 1 NB 2 SB 1 SB 2 Volume Total (vph) Volume Left (vph) Volume Right (vph) Hadj (s) Departure Headway (s) Degree Utilization, x Capacity (veh/h) Control Delay (s) Approach Delay (s) Approach LOS D C C B Intersection Summary Delay 21.0 Level of Service C Intersection Capacity Utilization 67.0% ICU Level of Service C Analysis Period (min) 15 Omni-Means Synchro 8 Report Page 2
119 HCM Unsignalized Intersection Capacity Analysis Year 2030-AM 1: SR 1 NB Ramps & SR 41 10/2/2014 Movement EBL EBT EBR WBL WBT WBR NBL NBT NBR SBL SBT SBR Lane Configurations Volume (veh/h) Sign Control Free Free Stop Stop Grade 0% 0% 0% 0% Peak Hour Factor Hourly flow rate (vph) Pedestrians Lane Width (ft) Walking Speed (ft/s) Percent Blockage Right turn flare (veh) 9 Median type None None Median storage veh) Upstream signal (ft) 219 px, platoon unblocked vc, conflicting volume vc1, stage 1 conf vol vc2, stage 2 conf vol vcu, unblocked vol tc, single (s) tc, 2 stage (s) tf (s) p0 queue free % cm capacity (veh/h) Direction, Lane # EB 1 WB 1 NB 1 Volume Total Volume Left Volume Right csh Volume to Capacity Queue Length 95th (ft) Control Delay (s) Lane LOS A F Approach Delay (s) Approach LOS F Intersection Summary Average Delay 93.3 Intersection Capacity Utilization 72.1% ICU Level of Service C Analysis Period (min) 15 Omni-Means Synchro 8 Report Page 1
120 HCM Unsignalized Intersection Capacity Analysis Year 2030-AM 2: Main St & SR 41 10/2/2014 Movement EBL EBT EBR WBL WBT WBR NBL NBT NBR SBL SBT SBR Lane Configurations Sign Control Stop Stop Stop Stop Volume (vph) Peak Hour Factor Hourly flow rate (vph) Direction, Lane # EB 1 WB 1 WB 2 NB 1 NB 2 SB 1 SB 2 Volume Total (vph) Volume Left (vph) Volume Right (vph) Hadj (s) Departure Headway (s) Degree Utilization, x Capacity (veh/h) Control Delay (s) Approach Delay (s) Approach LOS E E C C Intersection Summary Delay 31.6 Level of Service D Intersection Capacity Utilization 67.3% ICU Level of Service C Analysis Period (min) 15 Omni-Means Synchro 8 Report Page 2
121 HCM Unsignalized Intersection Capacity Analysis Year 2030-PM 1: SR 1 NB Ramps & SR 41 10/2/2014 Movement EBL EBT EBR WBL WBT WBR NBL NBT NBR SBL SBT SBR Lane Configurations Volume (veh/h) Sign Control Free Free Stop Stop Grade 0% 0% 0% 0% Peak Hour Factor Hourly flow rate (vph) Pedestrians Lane Width (ft) Walking Speed (ft/s) Percent Blockage Right turn flare (veh) 9 Median type None None Median storage veh) Upstream signal (ft) 219 px, platoon unblocked vc, conflicting volume vc1, stage 1 conf vol vc2, stage 2 conf vol vcu, unblocked vol tc, single (s) tc, 2 stage (s) tf (s) p0 queue free % cm capacity (veh/h) Direction, Lane # EB 1 WB 1 NB 1 Volume Total Volume Left Volume Right csh Volume to Capacity Queue Length 95th (ft) Control Delay (s) Lane LOS A B Approach Delay (s) Approach LOS B Intersection Summary Average Delay 4.7 Intersection Capacity Utilization 55.4% ICU Level of Service B Analysis Period (min) 15 Omni-Means Synchro 8 Report Page 1
122 HCM Unsignalized Intersection Capacity Analysis Year 2030-PM 2: Main St & SR 41 10/2/2014 Movement EBL EBT EBR WBL WBT WBR NBL NBT NBR SBL SBT SBR Lane Configurations Sign Control Stop Stop Stop Stop Volume (vph) Peak Hour Factor Hourly flow rate (vph) Direction, Lane # EB 1 WB 1 WB 2 NB 1 NB 2 SB 1 SB 2 Volume Total (vph) Volume Left (vph) Volume Right (vph) Hadj (s) Departure Headway (s) Degree Utilization, x Capacity (veh/h) Control Delay (s) Approach Delay (s) Approach LOS F D E C Intersection Summary Delay 41.4 Level of Service E Intersection Capacity Utilization 77.5% ICU Level of Service D Analysis Period (min) 15 Omni-Means Synchro 8 Report Page 2
123 HCM Unsignalized Intersection Capacity Analysis Year 2040-AM 1: SR 1 NB Ramps & SR 41 10/2/2014 Movement EBL EBT EBR WBL WBT WBR NBL NBT NBR SBL SBT SBR Lane Configurations Volume (veh/h) Sign Control Free Free Stop Stop Grade 0% 0% 0% 0% Peak Hour Factor Hourly flow rate (vph) Pedestrians Lane Width (ft) Walking Speed (ft/s) Percent Blockage Right turn flare (veh) 9 Median type None None Median storage veh) Upstream signal (ft) 219 px, platoon unblocked vc, conflicting volume vc1, stage 1 conf vol vc2, stage 2 conf vol vcu, unblocked vol tc, single (s) tc, 2 stage (s) tf (s) p0 queue free % cm capacity (veh/h) Direction, Lane # EB 1 WB 1 NB 1 Volume Total Volume Left Volume Right csh Volume to Capacity Queue Length 95th (ft) Control Delay (s) Lane LOS A F Approach Delay (s) Approach LOS F Intersection Summary Average Delay Intersection Capacity Utilization 79.2% ICU Level of Service D Analysis Period (min) 15 Omni-Means Synchro 8 Report Page 1
124 HCM Unsignalized Intersection Capacity Analysis Year 2040-AM 2: Main St & SR 41 10/2/2014 Movement EBL EBT EBR WBL WBT WBR NBL NBT NBR SBL SBT SBR Lane Configurations Sign Control Stop Stop Stop Stop Volume (vph) Peak Hour Factor Hourly flow rate (vph) Direction, Lane # EB 1 WB 1 WB 2 NB 1 NB 2 SB 1 SB 2 Volume Total (vph) Volume Left (vph) Volume Right (vph) Hadj (s) Departure Headway (s) Degree Utilization, x Capacity (veh/h) Control Delay (s) Approach Delay (s) Approach LOS F F D C Intersection Summary Delay 50.4 Level of Service F Intersection Capacity Utilization 73.3% ICU Level of Service D Analysis Period (min) 15 Omni-Means Synchro 8 Report Page 2
125 HCM Unsignalized Intersection Capacity Analysis Year 2040-PM Signalized 1: SR 1 NB Ramps & SR 41 10/2/2014 Movement EBL EBT EBR WBL WBT WBR NBL NBT NBR SBL SBT SBR Lane Configurations Volume (veh/h) Sign Control Free Free Stop Stop Grade 0% 0% 0% 0% Peak Hour Factor Hourly flow rate (vph) Pedestrians Lane Width (ft) Walking Speed (ft/s) Percent Blockage Right turn flare (veh) 9 Median type None None Median storage veh) Upstream signal (ft) 219 px, platoon unblocked vc, conflicting volume vc1, stage 1 conf vol vc2, stage 2 conf vol vcu, unblocked vol tc, single (s) tc, 2 stage (s) tf (s) p0 queue free % cm capacity (veh/h) Direction, Lane # EB 1 WB 1 NB 1 Volume Total Volume Left Volume Right csh Volume to Capacity Queue Length 95th (ft) Control Delay (s) Lane LOS A C Approach Delay (s) Approach LOS C Intersection Summary Average Delay 5.3 Intersection Capacity Utilization 60.8% ICU Level of Service B Analysis Period (min) 15 Omni-Means Synchro 8 Report Page 1
126 HCM Unsignalized Intersection Capacity Analysis Year 2040-PM Signalized 2: Main St & SR 41 10/2/2014 Movement EBL EBT EBR WBL WBT WBR NBL NBT NBR SBL SBT SBR Lane Configurations Sign Control Stop Stop Stop Stop Volume (vph) Peak Hour Factor Hourly flow rate (vph) Direction, Lane # EB 1 WB 1 WB 2 NB 1 NB 2 SB 1 SB 2 Volume Total (vph) Volume Left (vph) Volume Right (vph) Hadj (s) Departure Headway (s) Degree Utilization, x Capacity (veh/h) Control Delay (s) Approach Delay (s) Approach LOS F E F C Intersection Summary Delay 65.0 Level of Service F Intersection Capacity Utilization 85.2% ICU Level of Service E Analysis Period (min) 15 Omni-Means Synchro 8 Report Page 2
127 HCM Signalized Intersection Capacity Analysis 1: SR 1 NB Ramps & SR 41 10/1/2014 Movement EBL EBT EBR WBL WBT WBR NBL NBT NBR SBL SBT SBR Lane Configurations Volume (vph) Ideal Flow (vphpl) Total Lost time (s) Lane Util. Factor Frt Flt Protected Satd. Flow (prot) Flt Permitted Satd. Flow (perm) Peak-hour factor, PHF Adj. Flow (vph) RTOR Reduction (vph) Lane Group Flow (vph) Heavy Vehicles (%) 5% 5% 5% 5% 5% 5% 5% 5% 5% 5% 5% 5% Turn Type Prot NA NA Perm Perm Perm Protected Phases Permitted Phases Actuated Green, G (s) Effective Green, g (s) Actuated g/c Ratio Clearance Time (s) Vehicle Extension (s) Lane Grp Cap (vph) v/s Ratio Prot 0.03 c0.08 c0.29 v/s Ratio Perm 0.03 c v/c Ratio Uniform Delay, d Progression Factor Incremental Delay, d Delay (s) Level of Service C C A A D C Approach Delay (s) Approach LOS C A C A Intersection Summary HCM 2000 Control Delay 17.8 HCM 2000 Level of Service B HCM 2000 Volume to Capacity ratio 0.64 Actuated Cycle Length (s) 77.7 Sum of lost time (s) 20.0 Intersection Capacity Utilization 51.4% ICU Level of Service A Analysis Period (min) 15 c Critical Lane Group Opening Yr 2020 AM_signal 5:00 pm 9/24/2014 Baseline Synchro 8 Report Page 1
128 HCM Signalized Intersection Capacity Analysis 2: Main St & SR 41 10/1/2014 Movement EBL EBT EBR WBL WBT WBR NBL NBT NBR SBL SBT SBR Lane Configurations Volume (vph) Ideal Flow (vphpl) Total Lost time (s) Lane Util. Factor Frt Flt Protected Satd. Flow (prot) Flt Permitted Satd. Flow (perm) Peak-hour factor, PHF Adj. Flow (vph) RTOR Reduction (vph) Lane Group Flow (vph) Heavy Vehicles (%) 3% 3% 3% 3% 3% 3% 3% 3% 3% 3% 3% 3% Turn Type Prot NA Prot NA Prot NA Prot NA Perm Protected Phases Permitted Phases 10 Actuated Green, G (s) Effective Green, g (s) Actuated g/c Ratio Clearance Time (s) Vehicle Extension (s) Lane Grp Cap (vph) v/s Ratio Prot 0.05 c c0.18 c0.07 c v/s Ratio Perm 0.01 v/c Ratio Uniform Delay, d Progression Factor Incremental Delay, d Delay (s) Level of Service B A D C D D C C C Approach Delay (s) Approach LOS A D D C Intersection Summary HCM 2000 Control Delay 29.8 HCM 2000 Level of Service C HCM 2000 Volume to Capacity ratio 0.56 Actuated Cycle Length (s) 77.7 Sum of lost time (s) 20.0 Intersection Capacity Utilization 45.7% ICU Level of Service A Analysis Period (min) 15 c Critical Lane Group Opening Yr 2020 AM_signal 5:00 pm 9/24/2014 Baseline Synchro 8 Report Page 2
129 HCM Signalized Intersection Capacity Analysis 1: SR 1 NB Ramps & SR 41 10/1/2014 Movement EBL EBT EBR WBL WBT WBR NBL NBT NBR SBL SBT SBR Lane Configurations Volume (vph) Ideal Flow (vphpl) Total Lost time (s) Lane Util. Factor Frt Flt Protected Satd. Flow (prot) Flt Permitted Satd. Flow (perm) Peak-hour factor, PHF Adj. Flow (vph) RTOR Reduction (vph) Lane Group Flow (vph) Turn Type Prot NA NA Perm Perm Perm Protected Phases Permitted Phases Actuated Green, G (s) Effective Green, g (s) Actuated g/c Ratio Clearance Time (s) Vehicle Extension (s) Lane Grp Cap (vph) v/s Ratio Prot 0.02 c0.07 c0.22 v/s Ratio Perm 0.04 c v/c Ratio Uniform Delay, d Progression Factor Incremental Delay, d Delay (s) Level of Service C B A A C C Approach Delay (s) Approach LOS C A C A Intersection Summary HCM 2000 Control Delay 14.4 HCM 2000 Level of Service B HCM 2000 Volume to Capacity ratio 0.42 Actuated Cycle Length (s) 69.9 Sum of lost time (s) 20.0 Intersection Capacity Utilization 36.9% ICU Level of Service A Analysis Period (min) 15 c Critical Lane Group Opening Yr 2020 PM_signal 5:00 pm 9/24/2014 Baseline Synchro 8 Report Page 1
130 HCM Signalized Intersection Capacity Analysis 2: Main St & SR 41 10/1/2014 Movement EBL EBT EBR WBL WBT WBR NBL NBT NBR SBL SBT SBR Lane Configurations Volume (vph) Ideal Flow (vphpl) Total Lost time (s) Lane Util. Factor Frt Flt Protected Satd. Flow (prot) Flt Permitted Satd. Flow (perm) Peak-hour factor, PHF Adj. Flow (vph) RTOR Reduction (vph) Lane Group Flow (vph) Turn Type Prot NA Prot NA Prot NA Prot NA Perm Protected Phases Permitted Phases 10 Actuated Green, G (s) Effective Green, g (s) Actuated g/c Ratio Clearance Time (s) Vehicle Extension (s) Lane Grp Cap (vph) v/s Ratio Prot c0.07 c c0.14 c0.05 c v/s Ratio Perm 0.03 v/c Ratio Uniform Delay, d Progression Factor Incremental Delay, d Delay (s) Level of Service C A D C E D D C C Approach Delay (s) Approach LOS B C D C Intersection Summary HCM 2000 Control Delay 29.6 HCM 2000 Level of Service C HCM 2000 Volume to Capacity ratio 0.65 Actuated Cycle Length (s) 69.9 Sum of lost time (s) 20.0 Intersection Capacity Utilization 55.3% ICU Level of Service B Analysis Period (min) 15 c Critical Lane Group Opening Yr 2020 PM_signal 5:00 pm 9/24/2014 Baseline Synchro 8 Report Page 2
131 HCM Signalized Intersection Capacity Analysis 1: SR 1 NB Ramps & SR 41 10/1/2014 Movement EBL EBT EBR WBL WBT WBR NBL NBT NBR SBL SBT SBR Lane Configurations Volume (vph) Ideal Flow (vphpl) Total Lost time (s) Lane Util. Factor Frt Flt Protected Satd. Flow (prot) Flt Permitted Satd. Flow (perm) Peak-hour factor, PHF Adj. Flow (vph) RTOR Reduction (vph) Lane Group Flow (vph) Heavy Vehicles (%) 5% 5% 5% 5% 5% 5% 5% 5% 5% 5% 5% 5% Turn Type Prot NA NA Perm Perm Perm Protected Phases Permitted Phases Actuated Green, G (s) Effective Green, g (s) Actuated g/c Ratio Clearance Time (s) Vehicle Extension (s) Lane Grp Cap (vph) v/s Ratio Prot 0.04 c0.09 c0.35 v/s Ratio Perm 0.03 c v/c Ratio Uniform Delay, d Progression Factor Incremental Delay, d Delay (s) Level of Service D C A A E C Approach Delay (s) Approach LOS D A D A Intersection Summary HCM 2000 Control Delay 24.7 HCM 2000 Level of Service C HCM 2000 Volume to Capacity ratio 0.70 Actuated Cycle Length (s) 94.9 Sum of lost time (s) 20.0 Intersection Capacity Utilization 58.5% ICU Level of Service B Analysis Period (min) 15 c Critical Lane Group Opening Yr 2030 AM_signal 5:00 pm 9/24/2014 Baseline Synchro 8 Report Page 1
132 HCM Signalized Intersection Capacity Analysis 2: Main St & SR 41 10/1/2014 Movement EBL EBT EBR WBL WBT WBR NBL NBT NBR SBL SBT SBR Lane Configurations Volume (vph) Ideal Flow (vphpl) Total Lost time (s) Lane Util. Factor Frt Flt Protected Satd. Flow (prot) Flt Permitted Satd. Flow (perm) Peak-hour factor, PHF Adj. Flow (vph) RTOR Reduction (vph) Lane Group Flow (vph) Heavy Vehicles (%) 3% 3% 3% 3% 3% 3% 3% 3% 3% 3% 3% 3% Turn Type Prot NA Prot NA Prot NA Prot NA Perm Protected Phases Permitted Phases 10 Actuated Green, G (s) Effective Green, g (s) Actuated g/c Ratio Clearance Time (s) Vehicle Extension (s) Lane Grp Cap (vph) v/s Ratio Prot 0.06 c c0.21 c0.08 c v/s Ratio Perm 0.02 v/c Ratio Uniform Delay, d Progression Factor Incremental Delay, d Delay (s) Level of Service C A D D E D D D C Approach Delay (s) Approach LOS B D D D Intersection Summary HCM 2000 Control Delay 35.1 HCM 2000 Level of Service D HCM 2000 Volume to Capacity ratio 0.63 Actuated Cycle Length (s) 94.9 Sum of lost time (s) 20.0 Intersection Capacity Utilization 50.9% ICU Level of Service A Analysis Period (min) 15 c Critical Lane Group Opening Yr 2030 AM_signal 5:00 pm 9/24/2014 Baseline Synchro 8 Report Page 2
133 HCM Signalized Intersection Capacity Analysis 1: SR 1 NB Ramps & SR 41 10/1/2014 Movement EBL EBT EBR WBL WBT WBR NBL NBT NBR SBL SBT SBR Lane Configurations Volume (vph) Ideal Flow (vphpl) Total Lost time (s) Lane Util. Factor Frt Flt Protected Satd. Flow (prot) Flt Permitted Satd. Flow (perm) Peak-hour factor, PHF Adj. Flow (vph) RTOR Reduction (vph) Lane Group Flow (vph) Turn Type Prot NA NA Perm Perm Perm Protected Phases Permitted Phases Actuated Green, G (s) Effective Green, g (s) Actuated g/c Ratio Clearance Time (s) Vehicle Extension (s) Lane Grp Cap (vph) v/s Ratio Prot 0.03 c0.08 c0.26 v/s Ratio Perm 0.06 c v/c Ratio Uniform Delay, d Progression Factor Incremental Delay, d Delay (s) Level of Service D C A A D D Approach Delay (s) Approach LOS C A D A Intersection Summary HCM 2000 Control Delay 19.9 HCM 2000 Level of Service B HCM 2000 Volume to Capacity ratio 0.44 Actuated Cycle Length (s) 98.7 Sum of lost time (s) 20.0 Intersection Capacity Utilization 41.5% ICU Level of Service A Analysis Period (min) 15 c Critical Lane Group Opening Yr 2030 PM_signal 5:00 pm 9/24/2014 Baseline Synchro 8 Report Page 1
134 HCM Signalized Intersection Capacity Analysis 2: Main St & SR 41 10/1/2014 Movement EBL EBT EBR WBL WBT WBR NBL NBT NBR SBL SBT SBR Lane Configurations Volume (vph) Ideal Flow (vphpl) Total Lost time (s) Lane Util. Factor Frt Flt Protected Satd. Flow (prot) Flt Permitted Satd. Flow (perm) Peak-hour factor, PHF Adj. Flow (vph) RTOR Reduction (vph) Lane Group Flow (vph) Turn Type Prot NA Prot NA Prot NA Prot NA Perm Protected Phases Permitted Phases 10 Actuated Green, G (s) Effective Green, g (s) Actuated g/c Ratio Clearance Time (s) Vehicle Extension (s) Lane Grp Cap (vph) v/s Ratio Prot c0.09 c c0.17 c0.06 c v/s Ratio Perm 0.04 v/c Ratio Uniform Delay, d Progression Factor Incremental Delay, d Delay (s) Level of Service C B D D E D D C C Approach Delay (s) Approach LOS B D D C Intersection Summary HCM 2000 Control Delay 37.6 HCM 2000 Level of Service D HCM 2000 Volume to Capacity ratio 0.71 Actuated Cycle Length (s) 98.7 Sum of lost time (s) 20.0 Intersection Capacity Utilization 62.7% ICU Level of Service B Analysis Period (min) 15 c Critical Lane Group Opening Yr 2030 PM_signal 5:00 pm 9/24/2014 Baseline Synchro 8 Report Page 2
135 HCM Signalized Intersection Capacity Analysis 1: SR 1 NB Ramps & SR 41 10/1/2014 Movement EBL EBT EBR WBL WBT WBR NBL NBT NBR SBL SBT SBR Lane Configurations Volume (vph) Ideal Flow (vphpl) Total Lost time (s) Lane Util. Factor Frt Flt Protected Satd. Flow (prot) Flt Permitted Satd. Flow (perm) Peak-hour factor, PHF Adj. Flow (vph) RTOR Reduction (vph) Lane Group Flow (vph) Heavy Vehicles (%) 5% 5% 5% 5% 5% 5% 5% 5% 5% 5% 5% 5% Turn Type Prot NA NA Perm Perm Perm Protected Phases Permitted Phases Actuated Green, G (s) Effective Green, g (s) Actuated g/c Ratio Clearance Time (s) Vehicle Extension (s) Lane Grp Cap (vph) v/s Ratio Prot c c0.38 v/s Ratio Perm 0.04 c v/c Ratio Uniform Delay, d Progression Factor Incremental Delay, d Delay (s) Level of Service E D A A E C Approach Delay (s) Approach LOS D A E A Intersection Summary HCM 2000 Control Delay 29.6 HCM 2000 Level of Service C HCM 2000 Volume to Capacity ratio 0.77 Actuated Cycle Length (s) 98.1 Sum of lost time (s) 20.0 Intersection Capacity Utilization 63.6% ICU Level of Service B Analysis Period (min) 15 c Critical Lane Group Opening Yr 2040 AM_signal 5:00 pm 9/24/2014 Baseline Synchro 8 Report Page 1
136 HCM Signalized Intersection Capacity Analysis 2: Main St & SR 41 10/1/2014 Movement EBL EBT EBR WBL WBT WBR NBL NBT NBR SBL SBT SBR Lane Configurations Volume (vph) Ideal Flow (vphpl) Total Lost time (s) Lane Util. Factor Frt Flt Protected Satd. Flow (prot) Flt Permitted Satd. Flow (perm) Peak-hour factor, PHF Adj. Flow (vph) RTOR Reduction (vph) Lane Group Flow (vph) Heavy Vehicles (%) 3% 3% 3% 3% 3% 3% 3% 3% 3% 3% 3% 3% Turn Type Prot NA Prot NA Prot NA Prot NA Perm Protected Phases Permitted Phases 10 Actuated Green, G (s) Effective Green, g (s) Actuated g/c Ratio Clearance Time (s) Vehicle Extension (s) Lane Grp Cap (vph) v/s Ratio Prot 0.07 c c0.24 c0.09 c v/s Ratio Perm 0.02 v/c Ratio Uniform Delay, d Progression Factor Incremental Delay, d Delay (s) Level of Service C B D D E D D D D Approach Delay (s) Approach LOS B D E D Intersection Summary HCM 2000 Control Delay 39.7 HCM 2000 Level of Service D HCM 2000 Volume to Capacity ratio 0.70 Actuated Cycle Length (s) 98.1 Sum of lost time (s) 20.0 Intersection Capacity Utilization 55.3% ICU Level of Service B Analysis Period (min) 15 c Critical Lane Group Opening Yr 2040 AM_signal 5:00 pm 9/24/2014 Baseline Synchro 8 Report Page 2
137 HCM Signalized Intersection Capacity Analysis 1: SR 1 NB Ramps & SR 41 10/2/2014 Movement EBL EBT EBR WBL WBT WBR NBL NBT NBR SBL SBT SBR Lane Configurations Volume (vph) Ideal Flow (vphpl) Total Lost time (s) Lane Util. Factor Frt Flt Protected Satd. Flow (prot) Flt Permitted Satd. Flow (perm) Peak-hour factor, PHF Adj. Flow (vph) RTOR Reduction (vph) Lane Group Flow (vph) Turn Type Prot NA NA Perm Perm Perm Protected Phases Permitted Phases Actuated Green, G (s) Effective Green, g (s) Actuated g/c Ratio Clearance Time (s) Vehicle Extension (s) Lane Grp Cap (vph) v/s Ratio Prot 0.03 c0.09 c0.29 v/s Ratio Perm 0.07 c v/c Ratio Uniform Delay, d Progression Factor Incremental Delay, d Delay (s) Level of Service D C A A E D Approach Delay (s) Approach LOS C A D A Intersection Summary HCM 2000 Control Delay 21.5 HCM 2000 Level of Service C HCM 2000 Volume to Capacity ratio 0.48 Actuated Cycle Length (s) Sum of lost time (s) 20.0 Intersection Capacity Utilization 44.4% ICU Level of Service A Analysis Period (min) 15 c Critical Lane Group Opening Yr 2040 PM_signal 5:00 pm 9/24/2014 Baseline Synchro 8 Report Page 1
138 HCM Signalized Intersection Capacity Analysis 2: Main St & SR 41 10/2/2014 Movement EBL EBT EBR WBL WBT WBR NBL NBT NBR SBL SBT SBR Lane Configurations Volume (vph) Ideal Flow (vphpl) Total Lost time (s) Lane Util. Factor Frt Flt Protected Satd. Flow (prot) Flt Permitted Satd. Flow (perm) Peak-hour factor, PHF Adj. Flow (vph) RTOR Reduction (vph) Lane Group Flow (vph) Turn Type Prot NA Prot NA Prot NA Prot NA Perm Protected Phases Permitted Phases 10 Actuated Green, G (s) Effective Green, g (s) Actuated g/c Ratio Clearance Time (s) Vehicle Extension (s) Lane Grp Cap (vph) v/s Ratio Prot c0.09 c c0.18 c0.07 c v/s Ratio Perm 0.05 v/c Ratio Uniform Delay, d Progression Factor Incremental Delay, d Delay (s) Level of Service C B D D F E D C C Approach Delay (s) Approach LOS B D E C Intersection Summary HCM 2000 Control Delay 41.8 HCM 2000 Level of Service D HCM 2000 Volume to Capacity ratio 0.78 Actuated Cycle Length (s) Sum of lost time (s) 20.0 Intersection Capacity Utilization 67.7% ICU Level of Service C Analysis Period (min) 15 c Critical Lane Group Opening Yr 2040 PM_signal 5:00 pm 9/24/2014 Baseline Synchro 8 Report Page 2
139 APPENDIX F - SIDRA OUTPUTS
140 INTERSECTION SUMMARY Site: 2040 Main Street PM New Site Signals - Pretimed Cycle Time = 110 seconds (User-Given Phase Times) Variable Sequence Analysis applied. The results are given for the selected output sequence. Intersection Performance - Hourly Values Performance Measure Vehicles Pedestrians Persons Travel Speed (Average) 21.4 mph 1.2 mph 21.3 mph Travel Distance (Total) veh-mi/h 0.5 ped-mi/h pers-mi/h Travel Time (Total) 56.6 veh-h/h 0.4 ped-h/h 68.3 pers-h/h Demand Flows (Total) 1962 veh/h 22 ped/h 2354 pers/h Percent Heavy Vehicles (Demand) 2.0 % Degree of Saturation Practical Spare Capacity -6.8 % Effective Intersection Capacity 2031 veh/h Control Delay (Total) veh-h/h 0.22 ped-h/h pers-h/h Control Delay (Average) 44.0 sec 37.3 sec 44.4 sec Control Delay (Worst Lane) 95.7 sec Control Delay (Worst Movement) 95.7 sec 38.5 sec 95.7 sec Geometric Delay (Average) 0.0 sec Stop-Line Delay (Average) 44.0 sec Idling Time (Average) 39.0 sec Intersection Level of Service (LOS) LOS D LOS D 95% Back of Queue - Vehicles (Worst Lane) 33.1 veh 95% Back of Queue - Distance (Worst Lane) ft Queue Storage Ratio (Worst Lane) 1.06 Total Effective Stops 1621 veh/h 18 ped/h 1963 pers/h Effective Stop Rate 0.83 per veh 0.82 per ped 0.83 per pers Proportion Queued Performance Index Cost (Total) $/h 3.72 $/h $/h Fuel Consumption (Total) 56.5 gal/h Carbon Dioxide (Total) kg/h Hydrocarbons (Total) kg/h Carbon Monoxide (Total) kg/h NOx (Total) kg/h Level of Service (LOS) Method: Delay & v/c (HCM 2010). Intersection LOS value for Vehicles is based on average delay for all vehicle movements. Intersection LOS value for Pedestrians is based on average delay for all pedestrian movements. HCM Delay Formula option is used. Control Delay does not include Geometric Delay since Exclude Geometric Delay option applies. Intersection Performance - Annual Values Performance Measure Vehicles Pedestrians Persons Demand Flows (Total) 941,739 veh/y 10,435 ped/y 1,130,087 pers/y Delay 11,518 veh-h/y 108 ped-h/y 13,930 pers-h/y Effective Stops 778,194 veh/y 8,589 ped/y 942,421 pers/y Travel Distance 580,750 veh-mi/y 228 ped-mi/y 697,128 pers-mi/y Travel Time 27,163 veh-h/y 186 ped-h/y 32,782 pers-h/y Cost 432,105 $/y 1,784 $/y 433,889 $/y Fuel Consumption 27,103 gal/y Carbon Dioxide 242,266 kg/y Hydrocarbons 23 kg/y Carbon Monoxide 291 kg/y NOx 272 kg/y Processed: Friday, June 19, :05:35 AM Copyright Akcelik and Associates Pty Ltd SIDRA INTERSECTION Project: \\ \data\Common\PRJ\1881\T1881\T1881SIGNAL.sip6
141 LANE SUMMARY Site: 2040 Main Street PM New Site Signals - Pretimed Cycle Time = 110 seconds (User-Given Phase Times) Variable Sequence Analysis applied. The results are given for the selected output sequence. Lane Use and Performance Demand Flows Deg. Lane Average Level of 95% Back of Queue Lane Lane Cap. Prob. Total HV Cap. Satn Util. Delay Service Veh Dist Config Length Adj. Block. veh/h % veh/h v/c % sec ft ft % % South: RoadName Lane LOS F Short Lane LOS E Full Approach LOS E East: RoadName Lane LOS D Short Lane LOS D Full Approach LOS D North: RoadName Lane LOS D Short Lane LOS C Full Lane LOS A Short Approach LOS B West: RoadName Lane LOS C Short Lane LOS C Full Approach LOS C Intersection LOS D Level of Service (LOS) Method: Delay & v/c (HCM 2010). Lane LOS values are based on average delay and v/c ratio (degree of saturation) per lane. LOS F will result if v/c > irrespective of lane delay value (does not apply for approaches and intersection). Intersection and Approach LOS values are based on average delay for all lanes (v/c not used as specified in HCM 2010). HCM Delay Formula option is used. Control Delay does not include Geometric Delay since Exclude Geometric Delay option applies. Gap-Acceptance Capacity: Traditional M1. HV (%) values are calculated for All Movement Classes of All Heavy Vehicle Model Designation. Processed: Friday, June 19, :05:35 AM Copyright Akcelik and Associates Pty Ltd SIDRA INTERSECTION Project: \\ \data\Common\PRJ\1881\T1881\T1881SIGNAL.sip , , OMNI-MEANS LTD, PLUS / Floating
142 TIMING ANALYSIS Site: 2040 Main Street PM New Site Signals - Pretimed Cycle Time = 110 seconds (User-Given Phase Times) Variable Sequence Analysis applied. The results are given for the selected output sequence. Phase times specified by the user Sequence: Variable Phasing Input Sequence: A, B1, C, D, F Output Sequence: A, B1, C, D, F Movement Timing Information Mov Mov Mov PHASE MATRIX Lost Time ReqMovTime Eff Green ID Class Type First Green Second Green 1st 2nd 1st 2nd 1st 2nd [ From To Oppd Priority Und ] [ From To Oppd Priority Und ] Green Green Green Green Green Green (sec) (sec) (sec) (sec) (sec) (sec) South RoadName 3 # *D F # F A # A F Yes F A East RoadName 1 # A B # C D # *C D *D C Yes North RoadName 7 # D F # F A # A F Yes F A West RoadName 5 # *A C # B1 D # B1 D D B1 Yes Pedestrian Movements 8P Ped F A P Ped F A # Combined timing results are shown for all Movement Classes except any listed separately. * Critical Movement/Green Period Phase Information Phase Ref. Change Starting Green Displayed Green Terminating Phase Phase Phase Time Intergreen Start Green End Intergreen Time Split (sec) (sec) (sec) (sec) (sec) (sec) (sec) % A Yes B1 No C No D No F No Processed: Friday, June 19, :05:35 AM Copyright Akcelik and Associates Pty Ltd SIDRA INTERSECTION Project: \\ \data\Common\PRJ\1881\T1881\T1881SIGNAL.sip , , OMNI-MEANS LTD, PLUS / Floating
143 INTERSECTION SUMMARY Site: 2040 NB Ramps PM New Site Signals - Pretimed Cycle Time = 110 seconds (User-Given Phase Times) Variable Sequence Analysis applied. The results are given for the selected output sequence. Intersection Performance - Hourly Values Performance Measure Vehicles Persons Travel Speed (Average) 29.4 mph 29.4 mph Travel Distance (Total) veh-mi/h pers-mi/h Travel Time (Total) 27.6 veh-h/h 33.1 pers-h/h Demand Flows (Total) 1322 veh/h 1586 pers/h Percent Heavy Vehicles (Demand) 2.0 % Degree of Saturation Practical Spare Capacity 54.6 % Effective Intersection Capacity 2271 veh/h Control Delay (Total) 5.88 veh-h/h 7.06 pers-h/h Control Delay (Average) 16.0 sec 16.0 sec Control Delay (Worst Lane) 51.4 sec Control Delay (Worst Movement) 51.4 sec 51.4 sec Geometric Delay (Average) 0.0 sec Stop-Line Delay (Average) 16.0 sec Idling Time (Average) 13.2 sec Intersection Level of Service (LOS) LOS B 95% Back of Queue - Vehicles (Worst Lane) 11.4 veh 95% Back of Queue - Distance (Worst Lane) ft Queue Storage Ratio (Worst Lane) 0.36 Total Effective Stops 695 veh/h 834 pers/h Effective Stop Rate 0.53 per veh 0.53 per pers Proportion Queued Performance Index Cost (Total) $/h $/h Fuel Consumption (Total) 32.6 gal/h Carbon Dioxide (Total) kg/h Hydrocarbons (Total) kg/h Carbon Monoxide (Total) kg/h NOx (Total) kg/h Level of Service (LOS) Method: Delay & v/c (HCM 2010). Intersection LOS value for Vehicles is based on average delay for all vehicle movements. HCM Delay Formula option is used. Control Delay does not include Geometric Delay since Exclude Geometric Delay option applies. Intersection Performance - Annual Values Performance Measure Vehicles Persons Demand Flows (Total) 634,435 veh/y 761,322 pers/y Delay 2,824 veh-h/y 3,389 pers-h/y Effective Stops 333,453 veh/y 400,143 pers/y Travel Distance 389,525 veh-mi/y 467,430 pers-mi/y Travel Time 13,256 veh-h/y 15,907 pers-h/y Cost 208,251 $/y 208,251 $/y Fuel Consumption 15,646 gal/y Carbon Dioxide 139,910 kg/y Hydrocarbons 13 kg/y Carbon Monoxide 178 kg/y NOx 159 kg/y Processed: Friday, June 19, :09:10 AM Copyright Akcelik and Associates Pty Ltd SIDRA INTERSECTION Project: \\ \data\Common\PRJ\1881\T1881\T1881SIGNAL.sip , , OMNI-MEANS LTD, PLUS / Floating
144 LANE SUMMARY Site: 2040 NB Ramps PM New Site Signals - Pretimed Cycle Time = 110 seconds (User-Given Phase Times) Variable Sequence Analysis applied. The results are given for the selected output sequence. Lane Use and Performance Demand Flows Deg. Lane Average Level of 95% Back of Queue Lane Lane Cap. Prob. Total HV Cap. Satn Util. Delay Service Veh Dist Config Length Adj. Block. veh/h % veh/h v/c % sec ft ft % % South: RoadName Lane LOS D Short Lane LOS A Full Approach LOS B East: RoadName Lane LOS A Full Lane LOS B Full Approach LOS B West: RoadName Lane LOS D Short Lane LOS C Full Approach LOS C Intersection LOS B Level of Service (LOS) Method: Delay & v/c (HCM 2010). Lane LOS values are based on average delay and v/c ratio (degree of saturation) per lane. LOS F will result if v/c > irrespective of lane delay value (does not apply for approaches and intersection). Intersection and Approach LOS values are based on average delay for all lanes (v/c not used as specified in HCM 2010). HCM Delay Formula option is used. Control Delay does not include Geometric Delay since Exclude Geometric Delay option applies. Gap-Acceptance Capacity: Traditional M1. HV (%) values are calculated for All Movement Classes of All Heavy Vehicle Model Designation. 1 Reduced capacity due to a short lane effect Processed: Friday, June 19, :09:10 AM Copyright Akcelik and Associates Pty Ltd SIDRA INTERSECTION Project: \\ \data\Common\PRJ\1881\T1881\T1881SIGNAL.sip , , OMNI-MEANS LTD, PLUS / Floating
145 TIMING ANALYSIS Site: 2040 NB Ramps PM New Site Signals - Pretimed Cycle Time = 110 seconds (User-Given Phase Times) Variable Sequence Analysis applied. The results are given for the selected output sequence. Phase times specified by the user Sequence: Variable Phasing Input Sequence: B1, C, D, G Output Sequence: B1, C, D, G Movement Timing Information Mov Mov Mov PHASE MATRIX Lost Time ReqMovTime Eff Green ID Class Type First Green Second Green 1st 2nd 1st 2nd 1st 2nd [ From To Oppd Priority Und ] [ From To Oppd Priority Und ] Green Green Green Green Green Green (sec) (sec) (sec) (sec) (sec) (sec) South RoadName 3 # D G # *D G # D G G D Yes East RoadName 6 # *C D *G B # C D D C Yes West RoadName 5 # *B1 C # B1 D # Combined timing results are shown for all Movement Classes except any listed separately. * Critical Movement/Green Period Phase Information Phase Ref. Change Starting Green Displayed Green Terminating Phase Phase Phase Time Intergreen Start Green End Intergreen Time Split (sec) (sec) (sec) (sec) (sec) (sec) (sec) % B1 No C Yes D No G No Processed: Friday, June 19, :09:10 AM Copyright Akcelik and Associates Pty Ltd SIDRA INTERSECTION Project: \\ \data\Common\PRJ\1881\T1881\T1881SIGNAL.sip , , OMNI-MEANS LTD, PLUS / Floating
146 Scenario 1
147 INTERSECTION SUMMARY Site: 6 LEG 2020 AM (NB U-Turn) ROUTE 1 NB RAMPS / ROUTE 41 3%-5% HV Roundabout Intersection Performance - Hourly Values Performance Measure Vehicles Persons Travel Speed (Average) 34.0 mph 34.0 mph Travel Distance (Total) veh-mi/h pers-mi/h Travel Time (Total) 32.2 veh-h/h 38.6 pers-h/h Demand Flows (Total) 1714 veh/h 2057 pers/h Percent Heavy Vehicles (Demand) 3.7 % Degree of Saturation Practical Spare Capacity 79.4 % Effective Intersection Capacity 3618 veh/h Control Delay (Total) 5.15 veh-h/h 6.19 pers-h/h Control Delay (Average) 10.8 sec 10.8 sec Control Delay (Worst Lane) 14.4 sec Control Delay (Worst Movement) 17.8 sec 17.8 sec Geometric Delay (Average) 6.4 sec Stop-Line Delay (Average) 4.4 sec Idling Time (Average) 0.9 sec Intersection Level of Service (LOS) LOS B 95% Back of Queue - Vehicles (Worst Lane) 3.5 veh 95% Back of Queue - Distance (Worst Lane) 90.9 ft Queue Storage Ratio (Worst Lane) 0.07 Total Effective Stops 1390 veh/h 1668 pers/h Effective Stop Rate 0.81 per veh 0.81 per pers Proportion Queued Performance Index Cost (Total) $/h $/h Fuel Consumption (Total) 49.1 gal/h Carbon Dioxide (Total) kg/h Hydrocarbons (Total) kg/h Carbon Monoxide (Total) kg/h NOx (Total) kg/h Level of Service (LOS) Method: Delay & v/c (HCM 2010). Roundabout LOS Method: Same as Signalised Intersections. Intersection LOS value for Vehicles is based on average delay for all vehicle movements. Roundabout Capacity Model: SIDRA Standard. SIDRA Standard Delay Model is used. Control Delay includes Geometric Delay. Intersection Performance - Annual Values Performance Measure Vehicles Persons Demand Flows (Total) 822,782 veh/y 987,339 pers/y Delay 2,474 veh-h/y 2,969 pers-h/y Effective Stops 667,130 veh/y 800,556 pers/y Travel Distance 525,221 veh-mi/y 630,265 pers-mi/y Travel Time 15,441 veh-h/y 18,530 pers-h/y Cost 286,195 $/y 286,195 $/y Fuel Consumption 23,545 gal/y Carbon Dioxide 211,334 kg/y Hydrocarbons 18 kg/y Carbon Monoxide 251 kg/y NOx 382 kg/y SIDRA INTERSECTION 6.1 Copyright Akcelik and Associates Pty Ltd sidrasolutions.com Organisation: OMNI-MEANS LTD Processed: Tuesday, March 29, :08:14 AM
148 LANE SUMMARY Site: 6 LEG 2020 AM (NB U-Turn) ROUTE 1 NB RAMPS / ROUTE 41 3%-5% HV Roundabout Lane Use and Performance Demand Flows Deg. Lane Average Level of 95% Back of Queue Lane Lane Cap. Prob. Total HV Cap. Satn Util. Delay Service Veh Dist Config Length Adj. Block. veh/h % veh/h v/c % sec ft ft % % South: MAIN ST NB Lane 1 d LOS B Full Approach LOS B East: ROUTE 41 WB Lane LOS B Short NA Lane 2 d LOS A Full Approach LOS A North: MAIN ST SB Lane 1 d LOS B Full Approach LOS B West: ROUTE 41 EB Lane 1 d LOS A Full Approach LOS A SouthWest: ROUTE 1 NB OFF RAMP Lane 1 d LOS B Full Approach LOS B Intersection LOS B Level of Service (LOS) Method: Delay & v/c (HCM 2010). Roundabout LOS Method: Same as Signalised Intersections. Lane LOS values are based on average delay and v/c ratio (degree of saturation) per lane. LOS F will result if v/c > irrespective of lane delay value (does not apply for approaches and intersection). Intersection and Approach LOS values are based on average delay for all lanes (v/c not used as specified in HCM 2010). Roundabout Capacity Model: SIDRA Standard. SIDRA Standard Delay Model is used. Control Delay includes Geometric Delay. Gap-Acceptance Capacity: SIDRA Standard (Akçelik M3D). HV (%) values are calculated for All Movement Classes of All Heavy Vehicle Model Designation. d Dominant lane on roundabout approach SIDRA INTERSECTION 6.1 Copyright Akcelik and Associates Pty Ltd sidrasolutions.com Organisation: OMNI-MEANS LTD Processed: Tuesday, March 29, :08:14 AM Project: K:\PRJ\1881\T1881\T1881SIDRA_6LEGa.sip6
149 LEVEL OF SERVICE Site: 6 LEG 2020 AM (NB U-Turn) ROUTE 1 NB RAMPS / ROUTE 41 3%-5% HV Roundabout All Movement Classes South East North West Southwest Intersection LOS B A B A B B Level of Service (LOS) Method: Delay & v/c (HCM 2010). Roundabout LOS Method: Same as Signalised Intersections. Lane LOS values are based on average delay and v/c ratio (degree of saturation) per lane. LOS F will result if v/c > irrespective of lane delay value (does not apply for approaches and intersection). Intersection and Approach LOS values are based on average delay for all lanes (v/c not used as specified in HCM 2010). SIDRA Standard Delay Model is used. Control Delay includes Geometric Delay. SIDRA INTERSECTION 6.1 Copyright Akcelik and Associates Pty Ltd sidrasolutions.com Organisation: OMNI-MEANS LTD Processed: Tuesday, March 29, :08:14 AM Project: K:\PRJ\1881\T1881\T1881SIDRA_6LEGa.sip6
150 INTERSECTION SUMMARY Site: 6 LEG 2020 PM (NB U-Turn) ROUTE 1 NB RAMPS / ROUTE 41 3%-5% HV Roundabout Intersection Performance - Hourly Values Performance Measure Vehicles Persons Travel Speed (Average) 34.7 mph 34.7 mph Travel Distance (Total) veh-mi/h pers-mi/h Travel Time (Total) 29.0 veh-h/h 34.8 pers-h/h Demand Flows (Total) 1588 veh/h 1906 pers/h Percent Heavy Vehicles (Demand) 3.4 % Degree of Saturation Practical Spare Capacity 51.3 % Effective Intersection Capacity 2827 veh/h Control Delay (Total) 3.99 veh-h/h 4.79 pers-h/h Control Delay (Average) 9.1 sec 9.1 sec Control Delay (Worst Lane) 14.3 sec Control Delay (Worst Movement) 16.3 sec 16.3 sec Geometric Delay (Average) 5.7 sec Stop-Line Delay (Average) 3.3 sec Idling Time (Average) 0.4 sec Intersection Level of Service (LOS) LOS A 95% Back of Queue - Vehicles (Worst Lane) 4.9 veh 95% Back of Queue - Distance (Worst Lane) ft Queue Storage Ratio (Worst Lane) 0.10 Total Effective Stops 1193 veh/h 1432 pers/h Effective Stop Rate 0.75 per veh 0.75 per pers Proportion Queued Performance Index Cost (Total) $/h $/h Fuel Consumption (Total) 43.3 gal/h Carbon Dioxide (Total) kg/h Hydrocarbons (Total) kg/h Carbon Monoxide (Total) kg/h NOx (Total) kg/h Level of Service (LOS) Method: Delay & v/c (HCM 2010). Roundabout LOS Method: Same as Signalised Intersections. Intersection LOS value for Vehicles is based on average delay for all vehicle movements. Roundabout Capacity Model: SIDRA Standard. SIDRA Standard Delay Model is used. Control Delay includes Geometric Delay. Intersection Performance - Annual Values Performance Measure Vehicles Persons Demand Flows (Total) 762,261 veh/y 914,713 pers/y Delay 1,916 veh-h/y 2,300 pers-h/y Effective Stops 572,634 veh/y 687,161 pers/y Travel Distance 483,331 veh-mi/y 579,997 pers-mi/y Travel Time 13,926 veh-h/y 16,712 pers-h/y Cost 248,429 $/y 248,429 $/y Fuel Consumption 20,781 gal/y Carbon Dioxide 186,413 kg/y Hydrocarbons 16 kg/y Carbon Monoxide 226 kg/y NOx 316 kg/y SIDRA INTERSECTION 6.1 Copyright Akcelik and Associates Pty Ltd sidrasolutions.com Organisation: OMNI-MEANS LTD Processed: Tuesday, March 29, :08:13 AM
151 LANE SUMMARY Site: 6 LEG 2020 PM (NB U-Turn) ROUTE 1 NB RAMPS / ROUTE 41 3%-5% HV Roundabout Lane Use and Performance Demand Flows Deg. Lane Average Level of 95% Back of Queue Lane Lane Cap. Prob. Total HV Cap. Satn Util. Delay Service Veh Dist Config Length Adj. Block. veh/h % veh/h v/c % sec ft ft % % South: MAIN ST NB Lane 1 d LOS B Full Approach LOS B East: ROUTE 41 WB Lane LOS B Short NA Lane 2 d LOS A Full Approach LOS A North: MAIN ST SB Lane 1 d LOS A Full Approach LOS A West: ROUTE 41 EB Lane 1 d LOS A Full Approach LOS A SouthWest: ROUTE 1 NB OFF RAMP Lane 1 d LOS B Full Approach LOS B Intersection LOS A Level of Service (LOS) Method: Delay & v/c (HCM 2010). Roundabout LOS Method: Same as Signalised Intersections. Lane LOS values are based on average delay and v/c ratio (degree of saturation) per lane. LOS F will result if v/c > irrespective of lane delay value (does not apply for approaches and intersection). Intersection and Approach LOS values are based on average delay for all lanes (v/c not used as specified in HCM 2010). Roundabout Capacity Model: SIDRA Standard. SIDRA Standard Delay Model is used. Control Delay includes Geometric Delay. Gap-Acceptance Capacity: SIDRA Standard (Akçelik M3D). HV (%) values are calculated for All Movement Classes of All Heavy Vehicle Model Designation. d Dominant lane on roundabout approach SIDRA INTERSECTION 6.1 Copyright Akcelik and Associates Pty Ltd sidrasolutions.com Organisation: OMNI-MEANS LTD Processed: Tuesday, March 29, :08:13 AM Project: K:\PRJ\1881\T1881\T1881SIDRA_6LEGa.sip6
152 LEVEL OF SERVICE Site: 6 LEG 2020 PM (NB U-Turn) ROUTE 1 NB RAMPS / ROUTE 41 3%-5% HV Roundabout All Movement Classes South East North West Southwest Intersection LOS B A A A B A Level of Service (LOS) Method: Delay & v/c (HCM 2010). Roundabout LOS Method: Same as Signalised Intersections. Lane LOS values are based on average delay and v/c ratio (degree of saturation) per lane. LOS F will result if v/c > irrespective of lane delay value (does not apply for approaches and intersection). Intersection and Approach LOS values are based on average delay for all lanes (v/c not used as specified in HCM 2010). SIDRA Standard Delay Model is used. Control Delay includes Geometric Delay. SIDRA INTERSECTION 6.1 Copyright Akcelik and Associates Pty Ltd sidrasolutions.com Organisation: OMNI-MEANS LTD Processed: Tuesday, March 29, :08:13 AM Project: K:\PRJ\1881\T1881\T1881SIDRA_6LEGa.sip6
153 INTERSECTION SUMMARY Site: 6 LEG 2030 AM (NB U-Turn) ROUTE 1 NB RAMPS / ROUTE 41 3%-5% HV Roundabout Intersection Performance - Hourly Values Performance Measure Vehicles Persons Travel Speed (Average) 32.9 mph 32.9 mph Travel Distance (Total) veh-mi/h pers-mi/h Travel Time (Total) 37.9 veh-h/h 45.5 pers-h/h Demand Flows (Total) 1951 veh/h 2341 pers/h Percent Heavy Vehicles (Demand) 3.7 % Degree of Saturation Practical Spare Capacity 35.5 % Effective Intersection Capacity 3110 veh/h Control Delay (Total) 7.27 veh-h/h 8.73 pers-h/h Control Delay (Average) 13.4 sec 13.4 sec Control Delay (Worst Lane) 15.8 sec Control Delay (Worst Movement) 20.7 sec 20.7 sec Geometric Delay (Average) 6.6 sec Stop-Line Delay (Average) 6.8 sec Idling Time (Average) 1.9 sec Intersection Level of Service (LOS) LOS B 95% Back of Queue - Vehicles (Worst Lane) 5.0 veh 95% Back of Queue - Distance (Worst Lane) ft Queue Storage Ratio (Worst Lane) 0.11 Total Effective Stops 1808 veh/h 2169 pers/h Effective Stop Rate 0.93 per veh 0.93 per pers Proportion Queued Performance Index Cost (Total) $/h $/h Fuel Consumption (Total) 57.1 gal/h Carbon Dioxide (Total) kg/h Hydrocarbons (Total) kg/h Carbon Monoxide (Total) kg/h NOx (Total) kg/h Level of Service (LOS) Method: Delay & v/c (HCM 2010). Roundabout LOS Method: Same as Signalised Intersections. Intersection LOS value for Vehicles is based on average delay for all vehicle movements. Roundabout Capacity Model: SIDRA Standard. SIDRA Standard Delay Model is used. Control Delay includes Geometric Delay. Intersection Performance - Annual Values Performance Measure Vehicles Persons Demand Flows (Total) 936,522 veh/y 1,123,826 pers/y Delay 3,491 veh-h/y 4,189 pers-h/y Effective Stops 867,778 veh/y 1,041,334 pers/y Travel Distance 598,230 veh-mi/y 717,877 pers-mi/y Travel Time 18,193 veh-h/y 21,831 pers-h/y Cost 340,505 $/y 340,505 $/y Fuel Consumption 27,419 gal/y Carbon Dioxide 246,051 kg/y Hydrocarbons 22 kg/y Carbon Monoxide 291 kg/y NOx 439 kg/y SIDRA INTERSECTION 6.1 Copyright Akcelik and Associates Pty Ltd sidrasolutions.com Organisation: OMNI-MEANS LTD Processed: Tuesday, March 29, :08:12 AM
154 LANE SUMMARY Site: 6 LEG 2030 AM (NB U-Turn) ROUTE 1 NB RAMPS / ROUTE 41 3%-5% HV Roundabout Lane Use and Performance Demand Flows Deg. Lane Average Level of 95% Back of Queue Lane Lane Cap. Prob. Total HV Cap. Satn Util. Delay Service Veh Dist Config Length Adj. Block. veh/h % veh/h v/c % sec ft ft % % South: MAIN ST NB Lane 1 d LOS B Full Approach LOS B East: ROUTE 41 WB Lane LOS B Short NA Lane 2 d LOS A Full Approach LOS B North: MAIN ST SB Lane 1 d LOS B Full Approach LOS B West: ROUTE 41 EB Lane 1 d LOS A Full Approach LOS A SouthWest: ROUTE 1 NB OFF RAMP Lane 1 d LOS B Full Approach LOS B Intersection LOS B Level of Service (LOS) Method: Delay & v/c (HCM 2010). Roundabout LOS Method: Same as Signalised Intersections. Lane LOS values are based on average delay and v/c ratio (degree of saturation) per lane. LOS F will result if v/c > irrespective of lane delay value (does not apply for approaches and intersection). Intersection and Approach LOS values are based on average delay for all lanes (v/c not used as specified in HCM 2010). Roundabout Capacity Model: SIDRA Standard. SIDRA Standard Delay Model is used. Control Delay includes Geometric Delay. Gap-Acceptance Capacity: SIDRA Standard (Akçelik M3D). HV (%) values are calculated for All Movement Classes of All Heavy Vehicle Model Designation. d Dominant lane on roundabout approach SIDRA INTERSECTION 6.1 Copyright Akcelik and Associates Pty Ltd sidrasolutions.com Organisation: OMNI-MEANS LTD Processed: Tuesday, March 29, :08:12 AM Project: K:\PRJ\1881\T1881\T1881SIDRA_6LEGa.sip6
155 LEVEL OF SERVICE Site: 6 LEG 2030 AM (NB U-Turn) ROUTE 1 NB RAMPS / ROUTE 41 3%-5% HV Roundabout All Movement Classes South East North West Southwest Intersection LOS B B B A B B Level of Service (LOS) Method: Delay & v/c (HCM 2010). Roundabout LOS Method: Same as Signalised Intersections. Lane LOS values are based on average delay and v/c ratio (degree of saturation) per lane. LOS F will result if v/c > irrespective of lane delay value (does not apply for approaches and intersection). Intersection and Approach LOS values are based on average delay for all lanes (v/c not used as specified in HCM 2010). SIDRA Standard Delay Model is used. Control Delay includes Geometric Delay. SIDRA INTERSECTION 6.1 Copyright Akcelik and Associates Pty Ltd sidrasolutions.com Organisation: OMNI-MEANS LTD Processed: Tuesday, March 29, :08:12 AM Project: K:\PRJ\1881\T1881\T1881SIDRA_6LEGa.sip6
156 INTERSECTION SUMMARY Site: 6 LEG 2030 PM (NB U-Turn) ROUTE 1 NB RAMPS / ROUTE 41 3%-5% HV Roundabout Intersection Performance - Hourly Values Performance Measure Vehicles Persons Travel Speed (Average) 33.7 mph 33.7 mph Travel Distance (Total) veh-mi/h pers-mi/h Travel Time (Total) 35.3 veh-h/h 42.4 pers-h/h Demand Flows (Total) 1879 veh/h 2255 pers/h Percent Heavy Vehicles (Demand) 3.4 % Degree of Saturation Practical Spare Capacity 18.6 % Effective Intersection Capacity 2622 veh/h Control Delay (Total) 5.85 veh-h/h 7.03 pers-h/h Control Delay (Average) 11.2 sec 11.2 sec Control Delay (Worst Lane) 15.5 sec Control Delay (Worst Movement) 20.4 sec 20.4 sec Geometric Delay (Average) 5.7 sec Stop-Line Delay (Average) 5.5 sec Idling Time (Average) 1.0 sec Intersection Level of Service (LOS) LOS B 95% Back of Queue - Vehicles (Worst Lane) 8.8 veh 95% Back of Queue - Distance (Worst Lane) ft Queue Storage Ratio (Worst Lane) 0.19 Total Effective Stops 1661 veh/h 1993 pers/h Effective Stop Rate 0.88 per veh 0.88 per pers Proportion Queued Performance Index Cost (Total) $/h $/h Fuel Consumption (Total) 52.4 gal/h Carbon Dioxide (Total) kg/h Hydrocarbons (Total) kg/h Carbon Monoxide (Total) kg/h NOx (Total) kg/h Level of Service (LOS) Method: Delay & v/c (HCM 2010). Roundabout LOS Method: Same as Signalised Intersections. Intersection LOS value for Vehicles is based on average delay for all vehicle movements. Roundabout Capacity Model: SIDRA Standard. SIDRA Standard Delay Model is used. Control Delay includes Geometric Delay. Intersection Performance - Annual Values Performance Measure Vehicles Persons Demand Flows (Total) 902,087 veh/y 1,082,504 pers/y Delay 2,810 veh-h/y 3,372 pers-h/y Effective Stops 797,353 veh/y 956,824 pers/y Travel Distance 572,075 veh-mi/y 686,490 pers-mi/y Travel Time 16,963 veh-h/y 20,355 pers-h/y Cost 305,915 $/y 305,915 $/y Fuel Consumption 25,161 gal/y Carbon Dioxide 225,681 kg/y Hydrocarbons 20 kg/y Carbon Monoxide 272 kg/y NOx 383 kg/y SIDRA INTERSECTION 6.1 Copyright Akcelik and Associates Pty Ltd sidrasolutions.com Organisation: OMNI-MEANS LTD Processed: Tuesday, March 29, :08:11 AM
157 LANE SUMMARY Site: 6 LEG 2030 PM (NB U-Turn) ROUTE 1 NB RAMPS / ROUTE 41 3%-5% HV Roundabout Lane Use and Performance Demand Flows Deg. Lane Average Level of 95% Back of Queue Lane Lane Cap. Prob. Total HV Cap. Satn Util. Delay Service Veh Dist Config Length Adj. Block. veh/h % veh/h v/c % sec ft ft % % South: MAIN ST NB Lane 1 d LOS B Full Approach LOS B East: ROUTE 41 WB Lane LOS B Short NA Lane 2 d LOS A Full Approach LOS A North: MAIN ST SB Lane 1 d LOS A Full Approach LOS A West: ROUTE 41 EB Lane 1 d LOS A Full Approach LOS A SouthWest: ROUTE 1 NB OFF RAMP Lane 1 d LOS B Full Approach LOS B Intersection LOS B Level of Service (LOS) Method: Delay & v/c (HCM 2010). Roundabout LOS Method: Same as Signalised Intersections. Lane LOS values are based on average delay and v/c ratio (degree of saturation) per lane. LOS F will result if v/c > irrespective of lane delay value (does not apply for approaches and intersection). Intersection and Approach LOS values are based on average delay for all lanes (v/c not used as specified in HCM 2010). Roundabout Capacity Model: SIDRA Standard. SIDRA Standard Delay Model is used. Control Delay includes Geometric Delay. Gap-Acceptance Capacity: SIDRA Standard (Akçelik M3D). HV (%) values are calculated for All Movement Classes of All Heavy Vehicle Model Designation. d Dominant lane on roundabout approach SIDRA INTERSECTION 6.1 Copyright Akcelik and Associates Pty Ltd sidrasolutions.com Organisation: OMNI-MEANS LTD Processed: Tuesday, March 29, :08:11 AM Project: K:\PRJ\1881\T1881\T1881SIDRA_6LEGa.sip6
158 LEVEL OF SERVICE Site: 6 LEG 2030 PM (NB U-Turn) ROUTE 1 NB RAMPS / ROUTE 41 3%-5% HV Roundabout All Movement Classes South East North West Southwest Intersection LOS B A A A B B Level of Service (LOS) Method: Delay & v/c (HCM 2010). Roundabout LOS Method: Same as Signalised Intersections. Lane LOS values are based on average delay and v/c ratio (degree of saturation) per lane. LOS F will result if v/c > irrespective of lane delay value (does not apply for approaches and intersection). Intersection and Approach LOS values are based on average delay for all lanes (v/c not used as specified in HCM 2010). SIDRA Standard Delay Model is used. Control Delay includes Geometric Delay. SIDRA INTERSECTION 6.1 Copyright Akcelik and Associates Pty Ltd sidrasolutions.com Organisation: OMNI-MEANS LTD Processed: Tuesday, March 29, :08:11 AM Project: K:\PRJ\1881\T1881\T1881SIDRA_6LEGa.sip6
159 INTERSECTION SUMMARY Site: 6 LEG 2040 AM (NB U-Turn) ROUTE 1 NB RAMPS / ROUTE 41 3%-5% HV Roundabout Intersection Performance - Hourly Values Performance Measure Vehicles Persons Travel Speed (Average) 30.8 mph 30.8 mph Travel Distance (Total) veh-mi/h pers-mi/h Travel Time (Total) 45.3 veh-h/h 54.3 pers-h/h Demand Flows (Total) 2185 veh/h 2622 pers/h Percent Heavy Vehicles (Demand) 3.7 % Degree of Saturation Practical Spare Capacity 7.8 % Effective Intersection Capacity 2772 veh/h Control Delay (Total) veh-h/h pers-h/h Control Delay (Average) 18.1 sec 18.1 sec Control Delay (Worst Lane) 24.1 sec Control Delay (Worst Movement) 29.3 sec 29.3 sec Geometric Delay (Average) 6.6 sec Stop-Line Delay (Average) 11.6 sec Idling Time (Average) 4.7 sec Intersection Level of Service (LOS) LOS B 95% Back of Queue - Vehicles (Worst Lane) 8.5 veh 95% Back of Queue - Distance (Worst Lane) ft Queue Storage Ratio (Worst Lane) 0.18 Total Effective Stops 2334 veh/h 2800 pers/h Effective Stop Rate 1.07 per veh 1.07 per pers Proportion Queued Performance Index Cost (Total) $/h $/h Fuel Consumption (Total) 65.9 gal/h Carbon Dioxide (Total) kg/h Hydrocarbons (Total) kg/h Carbon Monoxide (Total) kg/h NOx (Total) kg/h Level of Service (LOS) Method: Delay & v/c (HCM 2010). Roundabout LOS Method: Same as Signalised Intersections. Intersection LOS value for Vehicles is based on average delay for all vehicle movements. Roundabout Capacity Model: SIDRA Standard. SIDRA Standard Delay Model is used. Control Delay includes Geometric Delay. Intersection Performance - Annual Values Performance Measure Vehicles Persons Demand Flows (Total) 1,048,696 veh/y 1,258,435 pers/y Delay 5,284 veh-h/y 6,341 pers-h/y Effective Stops 1,120,154 veh/y 1,344,185 pers/y Travel Distance 669,825 veh-mi/y 803,790 pers-mi/y Travel Time 21,735 veh-h/y 26,082 pers-h/y Cost 406,852 $/y 406,852 $/y Fuel Consumption 31,638 gal/y Carbon Dioxide 283,870 kg/y Hydrocarbons 25 kg/y Carbon Monoxide 333 kg/y NOx 505 kg/y SIDRA INTERSECTION 6.1 Copyright Akcelik and Associates Pty Ltd sidrasolutions.com Organisation: OMNI-MEANS LTD Processed: Tuesday, March 29, :08:09 AM
160 LANE SUMMARY Site: 6 LEG 2040 AM (NB U-Turn) ROUTE 1 NB RAMPS / ROUTE 41 3%-5% HV Roundabout Lane Use and Performance Demand Flows Deg. Lane Average Level of 95% Back of Queue Lane Lane Cap. Prob. Total HV Cap. Satn Util. Delay Service Veh Dist Config Length Adj. Block. veh/h % veh/h v/c % sec ft ft % % South: MAIN ST NB Lane 1 d LOS C Full Approach LOS C East: ROUTE 41 WB Lane LOS B Short NA Lane 2 d LOS B Full Approach LOS B North: MAIN ST SB Lane 1 d LOS C Full Approach LOS C West: ROUTE 41 EB Lane 1 d LOS A Full Approach LOS A SouthWest: ROUTE 1 NB OFF RAMP Lane 1 d LOS B Full Approach LOS B Intersection LOS B Level of Service (LOS) Method: Delay & v/c (HCM 2010). Roundabout LOS Method: Same as Signalised Intersections. Lane LOS values are based on average delay and v/c ratio (degree of saturation) per lane. LOS F will result if v/c > irrespective of lane delay value (does not apply for approaches and intersection). Intersection and Approach LOS values are based on average delay for all lanes (v/c not used as specified in HCM 2010). Roundabout Capacity Model: SIDRA Standard. SIDRA Standard Delay Model is used. Control Delay includes Geometric Delay. Gap-Acceptance Capacity: SIDRA Standard (Akçelik M3D). HV (%) values are calculated for All Movement Classes of All Heavy Vehicle Model Designation. d Dominant lane on roundabout approach SIDRA INTERSECTION 6.1 Copyright Akcelik and Associates Pty Ltd sidrasolutions.com Organisation: OMNI-MEANS LTD Processed: Tuesday, March 29, :08:09 AM Project: K:\PRJ\1881\T1881\T1881SIDRA_6LEGa.sip6
161 LEVEL OF SERVICE Site: 6 LEG 2040 AM (NB U-Turn) ROUTE 1 NB RAMPS / ROUTE 41 3%-5% HV Roundabout All Movement Classes South East North West Southwest Intersection LOS C B C A B B Level of Service (LOS) Method: Delay & v/c (HCM 2010). Roundabout LOS Method: Same as Signalised Intersections. Lane LOS values are based on average delay and v/c ratio (degree of saturation) per lane. LOS F will result if v/c > irrespective of lane delay value (does not apply for approaches and intersection). Intersection and Approach LOS values are based on average delay for all lanes (v/c not used as specified in HCM 2010). SIDRA Standard Delay Model is used. Control Delay includes Geometric Delay. SIDRA INTERSECTION 6.1 Copyright Akcelik and Associates Pty Ltd sidrasolutions.com Organisation: OMNI-MEANS LTD Processed: Tuesday, March 29, :08:09 AM Project: K:\PRJ\1881\T1881\T1881SIDRA_6LEGa.sip6
162 INTERSECTION SUMMARY Site: 6 LEG 2040 PM (NB U-Turn) ROUTE 1 NB RAMPS / ROUTE 41 3%-5% HV Roundabout Intersection Performance - Hourly Values Performance Measure Vehicles Persons Travel Speed (Average) 32.2 mph 32.2 mph Travel Distance (Total) veh-mi/h pers-mi/h Travel Time (Total) 41.6 veh-h/h 49.9 pers-h/h Demand Flows (Total) 2114 veh/h 2537 pers/h Percent Heavy Vehicles (Demand) 3.4 % Degree of Saturation Practical Spare Capacity 0.3 % Effective Intersection Capacity 2495 veh/h Control Delay (Total) 8.54 veh-h/h pers-h/h Control Delay (Average) 14.5 sec 14.5 sec Control Delay (Worst Lane) 21.1 sec Control Delay (Worst Movement) 27.3 sec 27.3 sec Geometric Delay (Average) 5.7 sec Stop-Line Delay (Average) 8.8 sec Idling Time (Average) 2.4 sec Intersection Level of Service (LOS) LOS B 95% Back of Queue - Vehicles (Worst Lane) 14.8 veh 95% Back of Queue - Distance (Worst Lane) ft Queue Storage Ratio (Worst Lane) 0.31 Total Effective Stops 2145 veh/h 2574 pers/h Effective Stop Rate 1.01 per veh 1.01 per pers Proportion Queued Performance Index Cost (Total) $/h $/h Fuel Consumption (Total) 60.4 gal/h Carbon Dioxide (Total) kg/h Hydrocarbons (Total) kg/h Carbon Monoxide (Total) kg/h NOx (Total) kg/h Level of Service (LOS) Method: Delay & v/c (HCM 2010). Roundabout LOS Method: Same as Signalised Intersections. Intersection LOS value for Vehicles is based on average delay for all vehicle movements. Roundabout Capacity Model: SIDRA Standard. SIDRA Standard Delay Model is used. Control Delay includes Geometric Delay. Intersection Performance - Annual Values Performance Measure Vehicles Persons Demand Flows (Total) 1,014,782 veh/y 1,217,739 pers/y Delay 4,098 veh-h/y 4,918 pers-h/y Effective Stops 1,029,770 veh/y 1,235,724 pers/y Travel Distance 643,577 veh-mi/y 772,292 pers-mi/y Travel Time 19,976 veh-h/y 23,971 pers-h/y Cost 361,957 $/y 361,957 $/y Fuel Consumption 29,012 gal/y Carbon Dioxide 260,188 kg/y Hydrocarbons 23 kg/y Carbon Monoxide 311 kg/y NOx 440 kg/y SIDRA INTERSECTION 6.1 Copyright Akcelik and Associates Pty Ltd sidrasolutions.com Organisation: OMNI-MEANS LTD Processed: Tuesday, March 29, :08:09 AM
163 LANE SUMMARY Site: 6 LEG 2040 PM (NB U-Turn) ROUTE 1 NB RAMPS / ROUTE 41 3%-5% HV Roundabout Lane Use and Performance Demand Flows Deg. Lane Average Level of 95% Back of Queue Lane Lane Cap. Prob. Total HV Cap. Satn Util. Delay Service Veh Dist Config Length Adj. Block. veh/h % veh/h v/c % sec ft ft % % South: MAIN ST NB Lane 1 d LOS C Full Approach LOS C East: ROUTE 41 WB Lane LOS B Short NA Lane 2 d LOS B Full Approach LOS B North: MAIN ST SB Lane 1 d LOS B Full Approach LOS B West: ROUTE 41 EB Lane 1 d LOS A Full Approach LOS A SouthWest: ROUTE 1 NB OFF RAMP Lane 1 d LOS B Full Approach LOS B Intersection LOS B Level of Service (LOS) Method: Delay & v/c (HCM 2010). Roundabout LOS Method: Same as Signalised Intersections. Lane LOS values are based on average delay and v/c ratio (degree of saturation) per lane. LOS F will result if v/c > irrespective of lane delay value (does not apply for approaches and intersection). Intersection and Approach LOS values are based on average delay for all lanes (v/c not used as specified in HCM 2010). Roundabout Capacity Model: SIDRA Standard. SIDRA Standard Delay Model is used. Control Delay includes Geometric Delay. Gap-Acceptance Capacity: SIDRA Standard (Akçelik M3D). HV (%) values are calculated for All Movement Classes of All Heavy Vehicle Model Designation. d Dominant lane on roundabout approach SIDRA INTERSECTION 6.1 Copyright Akcelik and Associates Pty Ltd sidrasolutions.com Organisation: OMNI-MEANS LTD Processed: Tuesday, March 29, :08:09 AM Project: K:\PRJ\1881\T1881\T1881SIDRA_6LEGa.sip6
164 LEVEL OF SERVICE Site: 6 LEG 2040 PM (NB U-Turn) ROUTE 1 NB RAMPS / ROUTE 41 3%-5% HV Roundabout All Movement Classes South East North West Southwest Intersection LOS C B B A B B Level of Service (LOS) Method: Delay & v/c (HCM 2010). Roundabout LOS Method: Same as Signalised Intersections. Lane LOS values are based on average delay and v/c ratio (degree of saturation) per lane. LOS F will result if v/c > irrespective of lane delay value (does not apply for approaches and intersection). Intersection and Approach LOS values are based on average delay for all lanes (v/c not used as specified in HCM 2010). SIDRA Standard Delay Model is used. Control Delay includes Geometric Delay. SIDRA INTERSECTION 6.1 Copyright Akcelik and Associates Pty Ltd sidrasolutions.com Organisation: OMNI-MEANS LTD Processed: Tuesday, March 29, :08:09 AM Project: K:\PRJ\1881\T1881\T1881SIDRA_6LEGa.sip6
165 Scenario 2
166 INTERSECTION SUMMARY Site: 6 LEG 2020 AM (NW U-Turn) ROUTE 1 NB RAMPS / ROUTE 41 3%-5% HV Roundabout Intersection Performance - Hourly Values Performance Measure Vehicles Persons Travel Speed (Average) 34.2 mph 34.2 mph Travel Distance (Total) veh-mi/h pers-mi/h Travel Time (Total) 30.6 veh-h/h 36.8 pers-h/h Demand Flows (Total) 1639 veh/h 1967 pers/h Percent Heavy Vehicles (Demand) 3.7 % Degree of Saturation Practical Spare Capacity 84.5 % Effective Intersection Capacity 3557 veh/h Control Delay (Total) 4.78 veh-h/h 5.74 pers-h/h Control Delay (Average) 10.5 sec 10.5 sec Control Delay (Worst Lane) 14.4 sec Control Delay (Worst Movement) 15.7 sec 15.7 sec Geometric Delay (Average) 6.6 sec Stop-Line Delay (Average) 4.0 sec Idling Time (Average) 0.7 sec Intersection Level of Service (LOS) LOS B 95% Back of Queue - Vehicles (Worst Lane) 3.2 veh 95% Back of Queue - Distance (Worst Lane) 81.9 ft Queue Storage Ratio (Worst Lane) 0.07 Total Effective Stops 1298 veh/h 1558 pers/h Effective Stop Rate 0.79 per veh 0.79 per pers Proportion Queued Performance Index Cost (Total) $/h $/h Fuel Consumption (Total) 46.7 gal/h Carbon Dioxide (Total) kg/h Hydrocarbons (Total) kg/h Carbon Monoxide (Total) kg/h NOx (Total) kg/h Level of Service (LOS) Method: Delay & v/c (HCM 2010). Roundabout LOS Method: Same as Signalised Intersections. Intersection LOS value for Vehicles is based on average delay for all vehicle movements. Roundabout Capacity Model: SIDRA Standard. SIDRA Standard Delay Model is used. Control Delay includes Geometric Delay. Intersection Performance - Annual Values Performance Measure Vehicles Persons Demand Flows (Total) 786,782 veh/y 944,139 pers/y Delay 2,296 veh-h/y 2,755 pers-h/y Effective Stops 623,092 veh/y 747,711 pers/y Travel Distance 502,496 veh-mi/y 602,996 pers-mi/y Travel Time 14,702 veh-h/y 17,642 pers-h/y Cost 272,272 $/y 272,272 $/y Fuel Consumption 22,421 gal/y Carbon Dioxide 201,227 kg/y Hydrocarbons 18 kg/y Carbon Monoxide 240 kg/y NOx 360 kg/y SIDRA INTERSECTION 6.1 Copyright Akcelik and Associates Pty Ltd sidrasolutions.com Organisation: OMNI-MEANS LTD Processed: Tuesday, March 29, :14:38 AM
167 LANE SUMMARY Site: 6 LEG 2020 AM (NW U-Turn) ROUTE 1 NB RAMPS / ROUTE 41 3%-5% HV Roundabout Lane Use and Performance Demand Flows Deg. Lane Average Level of 95% Back of Queue Lane Lane Cap. Prob. Total HV Cap. Satn Util. Delay Service Veh Dist Config Length Adj. Block. veh/h % veh/h v/c % sec ft ft % % South: MAIN ST NB Lane 1 d LOS B Full Approach LOS B East: ROUTE 41 WB Lane LOS B Short NA Lane 2 d LOS A Full Approach LOS A North: MAIN ST SB Lane 1 d LOS B Full Approach LOS B West: ROUTE 41 EB Lane 1 d LOS A Full Approach LOS A SouthWest: ROUTE 1 NB OFF RAMP Lane 1 d LOS B Full Approach LOS B Intersection LOS B Level of Service (LOS) Method: Delay & v/c (HCM 2010). Roundabout LOS Method: Same as Signalised Intersections. Lane LOS values are based on average delay and v/c ratio (degree of saturation) per lane. LOS F will result if v/c > irrespective of lane delay value (does not apply for approaches and intersection). Intersection and Approach LOS values are based on average delay for all lanes (v/c not used as specified in HCM 2010). Roundabout Capacity Model: SIDRA Standard. SIDRA Standard Delay Model is used. Control Delay includes Geometric Delay. Gap-Acceptance Capacity: SIDRA Standard (Akçelik M3D). HV (%) values are calculated for All Movement Classes of All Heavy Vehicle Model Designation. d Dominant lane on roundabout approach SIDRA INTERSECTION 6.1 Copyright Akcelik and Associates Pty Ltd sidrasolutions.com Organisation: OMNI-MEANS LTD Processed: Tuesday, March 29, :14:38 AM Project: K:\PRJ\1881\T1881\T1881SIDRA_6LEGb.sip6
168 LEVEL OF SERVICE Site: 6 LEG 2020 AM (NW U-Turn) ROUTE 1 NB RAMPS / ROUTE 41 3%-5% HV Roundabout All Movement Classes South East North West Southwest Intersection LOS B A B A B B Level of Service (LOS) Method: Delay & v/c (HCM 2010). Roundabout LOS Method: Same as Signalised Intersections. Lane LOS values are based on average delay and v/c ratio (degree of saturation) per lane. LOS F will result if v/c > irrespective of lane delay value (does not apply for approaches and intersection). Intersection and Approach LOS values are based on average delay for all lanes (v/c not used as specified in HCM 2010). SIDRA Standard Delay Model is used. Control Delay includes Geometric Delay. SIDRA INTERSECTION 6.1 Copyright Akcelik and Associates Pty Ltd sidrasolutions.com Organisation: OMNI-MEANS LTD Processed: Tuesday, March 29, :14:38 AM Project: K:\PRJ\1881\T1881\T1881SIDRA_6LEGb.sip6
169 INTERSECTION SUMMARY Site: 6 LEG 2020 PM (NW U-Turn) ROUTE 1 NB RAMPS / ROUTE 41 3%-5% HV Roundabout Intersection Performance - Hourly Values Performance Measure Vehicles Persons Travel Speed (Average) 34.8 mph 34.8 mph Travel Distance (Total) veh-mi/h pers-mi/h Travel Time (Total) 29.0 veh-h/h 34.8 pers-h/h Demand Flows (Total) 1588 veh/h 1906 pers/h Percent Heavy Vehicles (Demand) 3.4 % Degree of Saturation Practical Spare Capacity 61.5 % Effective Intersection Capacity 3017 veh/h Control Delay (Total) 3.96 veh-h/h 4.75 pers-h/h Control Delay (Average) 9.0 sec 9.0 sec Control Delay (Worst Lane) 14.3 sec Control Delay (Worst Movement) 14.4 sec 14.4 sec Geometric Delay (Average) 5.7 sec Stop-Line Delay (Average) 3.3 sec Idling Time (Average) 0.3 sec Intersection Level of Service (LOS) LOS A 95% Back of Queue - Vehicles (Worst Lane) 4.3 veh 95% Back of Queue - Distance (Worst Lane) ft Queue Storage Ratio (Worst Lane) 0.09 Total Effective Stops 1189 veh/h 1427 pers/h Effective Stop Rate 0.75 per veh 0.75 per pers Proportion Queued Performance Index Cost (Total) $/h $/h Fuel Consumption (Total) 43.2 gal/h Carbon Dioxide (Total) kg/h Hydrocarbons (Total) kg/h Carbon Monoxide (Total) kg/h NOx (Total) kg/h Level of Service (LOS) Method: Delay & v/c (HCM 2010). Roundabout LOS Method: Same as Signalised Intersections. Intersection LOS value for Vehicles is based on average delay for all vehicle movements. Roundabout Capacity Model: SIDRA Standard. SIDRA Standard Delay Model is used. Control Delay includes Geometric Delay. Intersection Performance - Annual Values Performance Measure Vehicles Persons Demand Flows (Total) 762,261 veh/y 914,713 pers/y Delay 1,901 veh-h/y 2,281 pers-h/y Effective Stops 570,936 veh/y 685,124 pers/y Travel Distance 483,333 veh-mi/y 579,999 pers-mi/y Travel Time 13,907 veh-h/y 16,688 pers-h/y Cost 247,745 $/y 247,745 $/y Fuel Consumption 20,737 gal/y Carbon Dioxide 186,023 kg/y Hydrocarbons 16 kg/y Carbon Monoxide 225 kg/y NOx 316 kg/y SIDRA INTERSECTION 6.1 Copyright Akcelik and Associates Pty Ltd sidrasolutions.com Organisation: OMNI-MEANS LTD Processed: Tuesday, March 29, :14:39 AM
170 LANE SUMMARY Site: 6 LEG 2020 PM (NW U-Turn) ROUTE 1 NB RAMPS / ROUTE 41 3%-5% HV Roundabout Lane Use and Performance Demand Flows Deg. Lane Average Level of 95% Back of Queue Lane Lane Cap. Prob. Total HV Cap. Satn Util. Delay Service Veh Dist Config Length Adj. Block. veh/h % veh/h v/c % sec ft ft % % South: MAIN ST NB Lane 1 d LOS A Full Approach LOS A East: ROUTE 41 WB Lane LOS B Short NA Lane 2 d LOS A Full Approach LOS A North: MAIN ST SB Lane 1 d LOS A Full Approach LOS A West: ROUTE 41 EB Lane 1 d LOS A Full Approach LOS A SouthWest: ROUTE 1 NB OFF RAMP Lane 1 d LOS B Full Approach LOS B Intersection LOS A Level of Service (LOS) Method: Delay & v/c (HCM 2010). Roundabout LOS Method: Same as Signalised Intersections. Lane LOS values are based on average delay and v/c ratio (degree of saturation) per lane. LOS F will result if v/c > irrespective of lane delay value (does not apply for approaches and intersection). Intersection and Approach LOS values are based on average delay for all lanes (v/c not used as specified in HCM 2010). Roundabout Capacity Model: SIDRA Standard. SIDRA Standard Delay Model is used. Control Delay includes Geometric Delay. Gap-Acceptance Capacity: SIDRA Standard (Akçelik M3D). HV (%) values are calculated for All Movement Classes of All Heavy Vehicle Model Designation. d Dominant lane on roundabout approach SIDRA INTERSECTION 6.1 Copyright Akcelik and Associates Pty Ltd sidrasolutions.com Organisation: OMNI-MEANS LTD Processed: Tuesday, March 29, :14:39 AM Project: K:\PRJ\1881\T1881\T1881SIDRA_6LEGb.sip6
171 LEVEL OF SERVICE Site: 6 LEG 2020 PM (NW U-Turn) ROUTE 1 NB RAMPS / ROUTE 41 3%-5% HV Roundabout All Movement Classes South East North West Southwest Intersection LOS A A A A B A Level of Service (LOS) Method: Delay & v/c (HCM 2010). Roundabout LOS Method: Same as Signalised Intersections. Lane LOS values are based on average delay and v/c ratio (degree of saturation) per lane. LOS F will result if v/c > irrespective of lane delay value (does not apply for approaches and intersection). Intersection and Approach LOS values are based on average delay for all lanes (v/c not used as specified in HCM 2010). SIDRA Standard Delay Model is used. Control Delay includes Geometric Delay. SIDRA INTERSECTION 6.1 Copyright Akcelik and Associates Pty Ltd sidrasolutions.com Organisation: OMNI-MEANS LTD Processed: Tuesday, March 29, :14:39 AM Project: K:\PRJ\1881\T1881\T1881SIDRA_6LEGb.sip6
172 INTERSECTION SUMMARY Site: 6 LEG 2030 AM (NW U-Turn) ROUTE 1 NB RAMPS / ROUTE 41 3%-5% HV Roundabout Intersection Performance - Hourly Values Performance Measure Vehicles Persons Travel Speed (Average) 32.9 mph 32.9 mph Travel Distance (Total) veh-mi/h pers-mi/h Travel Time (Total) 37.9 veh-h/h 45.5 pers-h/h Demand Flows (Total) 1951 veh/h 2341 pers/h Percent Heavy Vehicles (Demand) 3.7 % Degree of Saturation Practical Spare Capacity 35.3 % Effective Intersection Capacity 3105 veh/h Control Delay (Total) 7.25 veh-h/h 8.70 pers-h/h Control Delay (Average) 13.4 sec 13.4 sec Control Delay (Worst Lane) 15.8 sec Control Delay (Worst Movement) 20.5 sec 20.5 sec Geometric Delay (Average) 6.6 sec Stop-Line Delay (Average) 6.8 sec Idling Time (Average) 1.9 sec Intersection Level of Service (LOS) LOS B 95% Back of Queue - Vehicles (Worst Lane) 5.5 veh 95% Back of Queue - Distance (Worst Lane) ft Queue Storage Ratio (Worst Lane) 0.12 Total Effective Stops 1805 veh/h 2166 pers/h Effective Stop Rate 0.93 per veh 0.93 per pers Proportion Queued Performance Index Cost (Total) $/h $/h Fuel Consumption (Total) 57.1 gal/h Carbon Dioxide (Total) kg/h Hydrocarbons (Total) kg/h Carbon Monoxide (Total) kg/h NOx (Total) kg/h Level of Service (LOS) Method: Delay & v/c (HCM 2010). Roundabout LOS Method: Same as Signalised Intersections. Intersection LOS value for Vehicles is based on average delay for all vehicle movements. Roundabout Capacity Model: SIDRA Standard. SIDRA Standard Delay Model is used. Control Delay includes Geometric Delay. Intersection Performance - Annual Values Performance Measure Vehicles Persons Demand Flows (Total) 936,522 veh/y 1,123,826 pers/y Delay 3,479 veh-h/y 4,175 pers-h/y Effective Stops 866,374 veh/y 1,039,649 pers/y Travel Distance 598,231 veh-mi/y 717,877 pers-mi/y Travel Time 18,180 veh-h/y 21,817 pers-h/y Cost 340,402 $/y 340,402 $/y Fuel Consumption 27,418 gal/y Carbon Dioxide 246,037 kg/y Hydrocarbons 22 kg/y Carbon Monoxide 291 kg/y NOx 440 kg/y SIDRA INTERSECTION 6.1 Copyright Akcelik and Associates Pty Ltd sidrasolutions.com Organisation: OMNI-MEANS LTD Processed: Tuesday, March 29, :14:40 AM
173 LANE SUMMARY Site: 6 LEG 2030 AM (NW U-Turn) ROUTE 1 NB RAMPS / ROUTE 41 3%-5% HV Roundabout Lane Use and Performance Demand Flows Deg. Lane Average Level of 95% Back of Queue Lane Lane Cap. Prob. Total HV Cap. Satn Util. Delay Service Veh Dist Config Length Adj. Block. veh/h % veh/h v/c % sec ft ft % % South: MAIN ST NB Lane 1 d LOS B Full Approach LOS B East: ROUTE 41 WB Lane LOS B Short NA Lane 2 d LOS A Full Approach LOS B North: MAIN ST SB Lane 1 d LOS B Full Approach LOS B West: ROUTE 41 EB Lane 1 d LOS A Full Approach LOS A SouthWest: ROUTE 1 NB OFF RAMP Lane 1 d LOS B Full Approach LOS B Intersection LOS B Level of Service (LOS) Method: Delay & v/c (HCM 2010). Roundabout LOS Method: Same as Signalised Intersections. Lane LOS values are based on average delay and v/c ratio (degree of saturation) per lane. LOS F will result if v/c > irrespective of lane delay value (does not apply for approaches and intersection). Intersection and Approach LOS values are based on average delay for all lanes (v/c not used as specified in HCM 2010). Roundabout Capacity Model: SIDRA Standard. SIDRA Standard Delay Model is used. Control Delay includes Geometric Delay. Gap-Acceptance Capacity: SIDRA Standard (Akçelik M3D). HV (%) values are calculated for All Movement Classes of All Heavy Vehicle Model Designation. d Dominant lane on roundabout approach SIDRA INTERSECTION 6.1 Copyright Akcelik and Associates Pty Ltd sidrasolutions.com Organisation: OMNI-MEANS LTD Processed: Tuesday, March 29, :14:40 AM Project: K:\PRJ\1881\T1881\T1881SIDRA_6LEGb.sip6
174 LEVEL OF SERVICE Site: 6 LEG 2030 AM (NW U-Turn) ROUTE 1 NB RAMPS / ROUTE 41 3%-5% HV Roundabout All Movement Classes South East North West Southwest Intersection LOS B B B A B B Level of Service (LOS) Method: Delay & v/c (HCM 2010). Roundabout LOS Method: Same as Signalised Intersections. Lane LOS values are based on average delay and v/c ratio (degree of saturation) per lane. LOS F will result if v/c > irrespective of lane delay value (does not apply for approaches and intersection). Intersection and Approach LOS values are based on average delay for all lanes (v/c not used as specified in HCM 2010). SIDRA Standard Delay Model is used. Control Delay includes Geometric Delay. SIDRA INTERSECTION 6.1 Copyright Akcelik and Associates Pty Ltd sidrasolutions.com Organisation: OMNI-MEANS LTD Processed: Tuesday, March 29, :14:40 AM Project: K:\PRJ\1881\T1881\T1881SIDRA_6LEGb.sip6
175 INTERSECTION SUMMARY Site: 6 LEG 2030 PM (NW U-Turn) ROUTE 1 NB RAMPS / ROUTE 41 3%-5% HV Roundabout Intersection Performance - Hourly Values Performance Measure Vehicles Persons Travel Speed (Average) 33.8 mph 33.8 mph Travel Distance (Total) veh-mi/h pers-mi/h Travel Time (Total) 35.2 veh-h/h 42.3 pers-h/h Demand Flows (Total) 1879 veh/h 2255 pers/h Percent Heavy Vehicles (Demand) 3.4 % Degree of Saturation Practical Spare Capacity 24.6 % Effective Intersection Capacity 2756 veh/h Control Delay (Total) 5.73 veh-h/h 6.88 pers-h/h Control Delay (Average) 11.0 sec 11.0 sec Control Delay (Worst Lane) 15.5 sec Control Delay (Worst Movement) 18.6 sec 18.6 sec Geometric Delay (Average) 5.7 sec Stop-Line Delay (Average) 5.2 sec Idling Time (Average) 0.9 sec Intersection Level of Service (LOS) LOS B 95% Back of Queue - Vehicles (Worst Lane) 7.8 veh 95% Back of Queue - Distance (Worst Lane) ft Queue Storage Ratio (Worst Lane) 0.16 Total Effective Stops 1639 veh/h 1967 pers/h Effective Stop Rate 0.87 per veh 0.87 per pers Proportion Queued Performance Index Cost (Total) $/h $/h Fuel Consumption (Total) 52.2 gal/h Carbon Dioxide (Total) kg/h Hydrocarbons (Total) kg/h Carbon Monoxide (Total) kg/h NOx (Total) kg/h Level of Service (LOS) Method: Delay & v/c (HCM 2010). Roundabout LOS Method: Same as Signalised Intersections. Intersection LOS value for Vehicles is based on average delay for all vehicle movements. Roundabout Capacity Model: SIDRA Standard. SIDRA Standard Delay Model is used. Control Delay includes Geometric Delay. Intersection Performance - Annual Values Performance Measure Vehicles Persons Demand Flows (Total) 902,087 veh/y 1,082,504 pers/y Delay 2,750 veh-h/y 3,301 pers-h/y Effective Stops 786,906 veh/y 944,287 pers/y Travel Distance 572,077 veh-mi/y 686,492 pers-mi/y Travel Time 16,906 veh-h/y 20,288 pers-h/y Cost 304,182 $/y 304,182 $/y Fuel Consumption 25,062 gal/y Carbon Dioxide 224,794 kg/y Hydrocarbons 20 kg/y Carbon Monoxide 271 kg/y NOx 382 kg/y SIDRA INTERSECTION 6.1 Copyright Akcelik and Associates Pty Ltd sidrasolutions.com Organisation: OMNI-MEANS LTD Processed: Tuesday, March 29, :14:41 AM
176 LANE SUMMARY Site: 6 LEG 2030 PM (NW U-Turn) ROUTE 1 NB RAMPS / ROUTE 41 3%-5% HV Roundabout Lane Use and Performance Demand Flows Deg. Lane Average Level of 95% Back of Queue Lane Lane Cap. Prob. Total HV Cap. Satn Util. Delay Service Veh Dist Config Length Adj. Block. veh/h % veh/h v/c % sec ft ft % % South: MAIN ST NB Lane 1 d LOS B Full Approach LOS B East: ROUTE 41 WB Lane LOS B Short NA Lane 2 d LOS A Full Approach LOS A North: MAIN ST SB Lane 1 d LOS A Full Approach LOS A West: ROUTE 41 EB Lane 1 d LOS A Full Approach LOS A SouthWest: ROUTE 1 NB OFF RAMP Lane 1 d LOS B Full Approach LOS B Intersection LOS B Level of Service (LOS) Method: Delay & v/c (HCM 2010). Roundabout LOS Method: Same as Signalised Intersections. Lane LOS values are based on average delay and v/c ratio (degree of saturation) per lane. LOS F will result if v/c > irrespective of lane delay value (does not apply for approaches and intersection). Intersection and Approach LOS values are based on average delay for all lanes (v/c not used as specified in HCM 2010). Roundabout Capacity Model: SIDRA Standard. SIDRA Standard Delay Model is used. Control Delay includes Geometric Delay. Gap-Acceptance Capacity: SIDRA Standard (Akçelik M3D). HV (%) values are calculated for All Movement Classes of All Heavy Vehicle Model Designation. d Dominant lane on roundabout approach SIDRA INTERSECTION 6.1 Copyright Akcelik and Associates Pty Ltd sidrasolutions.com Organisation: OMNI-MEANS LTD Processed: Tuesday, March 29, :14:41 AM Project: K:\PRJ\1881\T1881\T1881SIDRA_6LEGb.sip6
177 LEVEL OF SERVICE Site: 6 LEG 2030 PM (NW U-Turn) ROUTE 1 NB RAMPS / ROUTE 41 3%-5% HV Roundabout All Movement Classes South East North West Southwest Intersection LOS B A A A B B Level of Service (LOS) Method: Delay & v/c (HCM 2010). Roundabout LOS Method: Same as Signalised Intersections. Lane LOS values are based on average delay and v/c ratio (degree of saturation) per lane. LOS F will result if v/c > irrespective of lane delay value (does not apply for approaches and intersection). Intersection and Approach LOS values are based on average delay for all lanes (v/c not used as specified in HCM 2010). SIDRA Standard Delay Model is used. Control Delay includes Geometric Delay. SIDRA INTERSECTION 6.1 Copyright Akcelik and Associates Pty Ltd sidrasolutions.com Organisation: OMNI-MEANS LTD Processed: Tuesday, March 29, :14:41 AM Project: K:\PRJ\1881\T1881\T1881SIDRA_6LEGb.sip6
178 INTERSECTION SUMMARY Site: 6 LEG 2040 AM (NW U-Turn) ROUTE 1 NB RAMPS / ROUTE 41 3%-5% HV Roundabout Intersection Performance - Hourly Values Performance Measure Vehicles Persons Travel Speed (Average) 30.8 mph 30.8 mph Travel Distance (Total) veh-mi/h pers-mi/h Travel Time (Total) 45.3 veh-h/h 54.3 pers-h/h Demand Flows (Total) 2185 veh/h 2622 pers/h Percent Heavy Vehicles (Demand) 3.7 % Degree of Saturation Practical Spare Capacity 7.6 % Effective Intersection Capacity 2765 veh/h Control Delay (Total) veh-h/h pers-h/h Control Delay (Average) 18.1 sec 18.1 sec Control Delay (Worst Lane) 24.2 sec Control Delay (Worst Movement) 29.4 sec 29.4 sec Geometric Delay (Average) 6.6 sec Stop-Line Delay (Average) 11.5 sec Idling Time (Average) 4.6 sec Intersection Level of Service (LOS) LOS B 95% Back of Queue - Vehicles (Worst Lane) 8.2 veh 95% Back of Queue - Distance (Worst Lane) ft Queue Storage Ratio (Worst Lane) 0.18 Total Effective Stops 2329 veh/h 2795 pers/h Effective Stop Rate 1.07 per veh 1.07 per pers Proportion Queued Performance Index Cost (Total) $/h $/h Fuel Consumption (Total) 65.9 gal/h Carbon Dioxide (Total) kg/h Hydrocarbons (Total) kg/h Carbon Monoxide (Total) kg/h NOx (Total) kg/h Level of Service (LOS) Method: Delay & v/c (HCM 2010). Roundabout LOS Method: Same as Signalised Intersections. Intersection LOS value for Vehicles is based on average delay for all vehicle movements. Roundabout Capacity Model: SIDRA Standard. SIDRA Standard Delay Model is used. Control Delay includes Geometric Delay. Intersection Performance - Annual Values Performance Measure Vehicles Persons Demand Flows (Total) 1,048,696 veh/y 1,258,435 pers/y Delay 5,271 veh-h/y 6,326 pers-h/y Effective Stops 1,118,006 veh/y 1,341,608 pers/y Travel Distance 669,826 veh-mi/y 803,791 pers-mi/y Travel Time 21,722 veh-h/y 26,067 pers-h/y Cost 406,941 $/y 406,941 $/y Fuel Consumption 31,649 gal/y Carbon Dioxide 283,972 kg/y Hydrocarbons 25 kg/y Carbon Monoxide 333 kg/y NOx 505 kg/y SIDRA INTERSECTION 6.1 Copyright Akcelik and Associates Pty Ltd sidrasolutions.com Organisation: OMNI-MEANS LTD Processed: Tuesday, March 29, :14:43 AM
179 LANE SUMMARY Site: 6 LEG 2040 AM (NW U-Turn) ROUTE 1 NB RAMPS / ROUTE 41 3%-5% HV Roundabout Lane Use and Performance Demand Flows Deg. Lane Average Level of 95% Back of Queue Lane Lane Cap. Prob. Total HV Cap. Satn Util. Delay Service Veh Dist Config Length Adj. Block. veh/h % veh/h v/c % sec ft ft % % South: MAIN ST NB Lane 1 d LOS C Full Approach LOS C East: ROUTE 41 WB Lane LOS B Short NA Lane 2 d LOS B Full Approach LOS B North: MAIN ST SB Lane 1 d LOS C Full Approach LOS C West: ROUTE 41 EB Lane 1 d LOS A Full Approach LOS A SouthWest: ROUTE 1 NB OFF RAMP Lane 1 d LOS B Full Approach LOS B Intersection LOS B Level of Service (LOS) Method: Delay & v/c (HCM 2010). Roundabout LOS Method: Same as Signalised Intersections. Lane LOS values are based on average delay and v/c ratio (degree of saturation) per lane. LOS F will result if v/c > irrespective of lane delay value (does not apply for approaches and intersection). Intersection and Approach LOS values are based on average delay for all lanes (v/c not used as specified in HCM 2010). Roundabout Capacity Model: SIDRA Standard. SIDRA Standard Delay Model is used. Control Delay includes Geometric Delay. Gap-Acceptance Capacity: SIDRA Standard (Akçelik M3D). HV (%) values are calculated for All Movement Classes of All Heavy Vehicle Model Designation. d Dominant lane on roundabout approach SIDRA INTERSECTION 6.1 Copyright Akcelik and Associates Pty Ltd sidrasolutions.com Organisation: OMNI-MEANS LTD Processed: Tuesday, March 29, :14:43 AM Project: K:\PRJ\1881\T1881\T1881SIDRA_6LEGb.sip6
180 LEVEL OF SERVICE Site: 6 LEG 2040 AM (NW U-Turn) ROUTE 1 NB RAMPS / ROUTE 41 3%-5% HV Roundabout All Movement Classes South East North West Southwest Intersection LOS C B C A B B Level of Service (LOS) Method: Delay & v/c (HCM 2010). Roundabout LOS Method: Same as Signalised Intersections. Lane LOS values are based on average delay and v/c ratio (degree of saturation) per lane. LOS F will result if v/c > irrespective of lane delay value (does not apply for approaches and intersection). Intersection and Approach LOS values are based on average delay for all lanes (v/c not used as specified in HCM 2010). SIDRA Standard Delay Model is used. Control Delay includes Geometric Delay. SIDRA INTERSECTION 6.1 Copyright Akcelik and Associates Pty Ltd sidrasolutions.com Organisation: OMNI-MEANS LTD Processed: Tuesday, March 29, :14:43 AM Project: K:\PRJ\1881\T1881\T1881SIDRA_6LEGb.sip6
181 INTERSECTION SUMMARY Site: 6 LEG 2040 PM (NW U-Turn) ROUTE 1 NB RAMPS / ROUTE 41 3%-5% HV Roundabout Intersection Performance - Hourly Values Performance Measure Vehicles Persons Travel Speed (Average) 32.5 mph 32.5 mph Travel Distance (Total) veh-mi/h pers-mi/h Travel Time (Total) 41.3 veh-h/h 49.6 pers-h/h Demand Flows (Total) 2114 veh/h 2537 pers/h Percent Heavy Vehicles (Demand) 3.4 % Degree of Saturation Practical Spare Capacity 3.9 % Effective Intersection Capacity 2584 veh/h Control Delay (Total) 8.21 veh-h/h 9.85 pers-h/h Control Delay (Average) 14.0 sec 14.0 sec Control Delay (Worst Lane) 20.7 sec Control Delay (Worst Movement) 25.6 sec 25.6 sec Geometric Delay (Average) 5.7 sec Stop-Line Delay (Average) 8.2 sec Idling Time (Average) 2.3 sec Intersection Level of Service (LOS) LOS B 95% Back of Queue - Vehicles (Worst Lane) 12.9 veh 95% Back of Queue - Distance (Worst Lane) ft Queue Storage Ratio (Worst Lane) 0.27 Total Effective Stops 2097 veh/h 2517 pers/h Effective Stop Rate 0.99 per veh 0.99 per pers Proportion Queued Performance Index Cost (Total) $/h $/h Fuel Consumption (Total) 60.1 gal/h Carbon Dioxide (Total) kg/h Hydrocarbons (Total) kg/h Carbon Monoxide (Total) kg/h NOx (Total) kg/h Level of Service (LOS) Method: Delay & v/c (HCM 2010). Roundabout LOS Method: Same as Signalised Intersections. Intersection LOS value for Vehicles is based on average delay for all vehicle movements. Roundabout Capacity Model: SIDRA Standard. SIDRA Standard Delay Model is used. Control Delay includes Geometric Delay. Intersection Performance - Annual Values Performance Measure Vehicles Persons Demand Flows (Total) 1,014,783 veh/y 1,217,739 pers/y Delay 3,939 veh-h/y 4,727 pers-h/y Effective Stops 1,006,699 veh/y 1,208,039 pers/y Travel Distance 643,579 veh-mi/y 772,294 pers-mi/y Travel Time 19,820 veh-h/y 23,784 pers-h/y Cost 358,295 $/y 358,295 $/y Fuel Consumption 28,833 gal/y Carbon Dioxide 258,592 kg/y Hydrocarbons 23 kg/y Carbon Monoxide 309 kg/y NOx 438 kg/y SIDRA INTERSECTION 6.1 Copyright Akcelik and Associates Pty Ltd sidrasolutions.com Organisation: OMNI-MEANS LTD Processed: Tuesday, March 29, :14:37 AM
182 LANE SUMMARY Site: 6 LEG 2040 PM (NW U-Turn) ROUTE 1 NB RAMPS / ROUTE 41 3%-5% HV Roundabout Lane Use and Performance Demand Flows Deg. Lane Average Level of 95% Back of Queue Lane Lane Cap. Prob. Total HV Cap. Satn Util. Delay Service Veh Dist Config Length Adj. Block. veh/h % veh/h v/c % sec ft ft % % South: MAIN ST NB Lane 1 d LOS C Full Approach LOS C East: ROUTE 41 WB Lane LOS B Short NA Lane 2 d LOS B Full Approach LOS B North: MAIN ST SB Lane 1 d LOS B Full Approach LOS B West: ROUTE 41 EB Lane 1 d LOS A Full Approach LOS A SouthWest: ROUTE 1 NB OFF RAMP Lane 1 d LOS B Full Approach LOS B Intersection LOS B Level of Service (LOS) Method: Delay & v/c (HCM 2010). Roundabout LOS Method: Same as Signalised Intersections. Lane LOS values are based on average delay and v/c ratio (degree of saturation) per lane. LOS F will result if v/c > irrespective of lane delay value (does not apply for approaches and intersection). Intersection and Approach LOS values are based on average delay for all lanes (v/c not used as specified in HCM 2010). Roundabout Capacity Model: SIDRA Standard. SIDRA Standard Delay Model is used. Control Delay includes Geometric Delay. Gap-Acceptance Capacity: SIDRA Standard (Akçelik M3D). HV (%) values are calculated for All Movement Classes of All Heavy Vehicle Model Designation. d Dominant lane on roundabout approach SIDRA INTERSECTION 6.1 Copyright Akcelik and Associates Pty Ltd sidrasolutions.com Organisation: OMNI-MEANS LTD Processed: Tuesday, March 29, :14:37 AM Project: K:\PRJ\1881\T1881\T1881SIDRA_6LEGb.sip6
183 LEVEL OF SERVICE Site: 6 LEG 2040 PM (NW U-Turn) ROUTE 1 NB RAMPS / ROUTE 41 3%-5% HV Roundabout All Movement Classes South East North West Southwest Intersection LOS C B B A B B Level of Service (LOS) Method: Delay & v/c (HCM 2010). Roundabout LOS Method: Same as Signalised Intersections. Lane LOS values are based on average delay and v/c ratio (degree of saturation) per lane. LOS F will result if v/c > irrespective of lane delay value (does not apply for approaches and intersection). Intersection and Approach LOS values are based on average delay for all lanes (v/c not used as specified in HCM 2010). SIDRA Standard Delay Model is used. Control Delay includes Geometric Delay. SIDRA INTERSECTION 6.1 Copyright Akcelik and Associates Pty Ltd sidrasolutions.com Organisation: OMNI-MEANS LTD Processed: Tuesday, March 29, :14:37 AM Project: K:\PRJ\1881\T1881\T1881SIDRA_6LEGb.sip6
184 APPENDIX G - COST ESTIMATES
185 PRELIMINARY PROJECT COST ESTIMATE Preliminary Cost Estimate Project ID: , EA 0F670 Type of Estimate : Program Code : Project Limits : Description: Scope : Alternative : Draft PR (ICE Step II Document) On Rte 41 (PM 0.0 to 0.1) from Rte 1 Interchange to 500' west of Main St, in Morro Upgrade capacity and intersection control for the existing, closely spaced, intersections on Route 41 (Atascadero Rd) at Route 1 NB Ramps and Main Street. Pavement widening and signal installation Signal Alternative Current Cost Escalated Cost ROADWAY ITEMS $ 2,352,600 $ 2,649,410 STRUCTURE ITEMS $ - $ - SUBTOTAL CONSTRUCTION COST $ 2,352,600 $ 2,649,410 RIGHT OF WAY $ 125,000 $ 125,000 TOTAL CAPITAL OUTLAY COST $ 2,478,000 $ 2,775,000 PR/ED SUPPORT $ 225,000 $ 225,000 PS&E SUPPORT $ 375,000 $ 375,000 RIGHT OF WAY SUPPORT $ 75,000 $ 75,000 CONSTRUCTION SUPPORT $ 275,000 $ 275,000 OTAL CAPITAL OUTLAY SUPPORT COST* $ 950,000 $ 950,000 TOTAL PROJECT COST $ 3,450,000 $ 3,750,000 If Project has been programmed enter Programmed Amount Date of Estimate (Month/Year) Estimated Date of Construction Start (Month/Year) Number of Working Days Estimated Mid-Point of Construction (Month/Year) Number of Plant Establishment Days $ Month / Year June / 2015 June / Working Days Month / Year Days - Estimated Project Schedule PID Approval PA/ED Approval PS&E RTL Begin Construction Approved by Project Manager (916) Project Manager Date Phone R1881CST001.xlsx 1 of 11 6/24/2015 8:51 AM
186 PRELIMINARY PROJECT COST ESTIMATE I. ROADWAY ITEMS SUMMARY Section Cost 1 Earthwork $ 151,700 2 Pavement Structural Section $ 504,100 3 Drainage $ 36,900 4 Specialty Items $ 235,900 5 Environmental $ 51,900 6 Traffic Items $ 573,700 7 Detours $ - 8 Minor Items $ 124,400 9 Roadway Mobilization $ 167, Supplemental Work $ 84, State Furnished $ 30, Contingencies $ 392, Overhead $ - TOTAL ROADWAY ITEMS $ 2,352,600 Estimate Prepared By Daniel Kehrer PE, Project Engineer 6/24/2015 (916) Name and Title Date Phone Estimate Reviewed By Name and Title Date (916) Phone By signing this estimate you are attesting that you have discussed your project with all functional units and have incorporated all their comments or have discussed with them why they will not be incorporated. 2 of 11 6/24/2015 8:51 AM
187 PRELIMINARY PROJECT COST ESTIMATE SECTION 1: EARTHWORK Item code Unit Quantity Unit Price ($) Cost Clearing & Grubbing LS 1 x 1, = $ 1, Develop Water Supply LS x = $ Roadway Excavation CY 3,585 x = $ 125, Roadway Excavation (Type Y) ADL CY x = $ Roadway Excavation (Type Z-2) ADL CY x = $ Structure Excavation (Retaining Wall) CY 300 x = $ 9, Structure Backfill (Retaining Wall) CY 225 x = $ 13, Pervious Backfill Material (Retaining Wall) CY x = $ Ditch Excavation CY x = $ Impored Borrow CY 100 x = $ 1, Imported Material (Shoulder Backing) TON x = $ - TOTAL EARTHWORK SECTION ITEMS $ 151,700 SECTION 2: PAVEMENT STRUCTURAL SECTION Item code Unit Quantity Unit Price ($) Cost Remove Asphalt Concrete Dike LF 650 x 5.00 = $ 3, Remove Base and Surfacing CY x = $ Cold Plane Asphalt Concrete Pavement SQYD x = $ Remove Concrete (Curb, Gutter, and CY 105 x = $ 45, Class 4 Aggregate Subbase CY x = $ Class 2 Aggregate Base CY 3,264 x = $ 179, Asphalt Treated Permeable Base CY x = $ Sand Cover TON x = $ Asphaltic Emulsion (Fog Seal Coat) TON x = $ Asphaltic Emulsion (Polymer Modified) TON x = $ XX Screenings (Type XX) TON x = $ Slurry Seal TON x = $ Replace Asphalt Concrete Surfacing CY x = $ Hot Mix Asphalt (Type A) TON 2,111 x = $ 189, Minor Hot Mix Asphalt TON x = $ Rubberized Hot Mix Asphalt (Gap Graded) TON x = $ Geosynthetic Pavement Interlayer SQYD x = $ X Shoulder Rumber Strip (HMA, Type XX Inden STA x = $ Place Hot Mix Asphalt Dike LF 150 x 4.00 = $ Place Hot Mix Asphalt (Misc. Area) SQYD x = $ Tack Coat TON x = $ Concrete Pavement CY x = $ Replace Concrete Pavement (Rapid Strength CY x = $ Seal Pavement Joint LF x = $ Seal Longitudinal Isolation Joint LF x = $ A Repair Spalled Joints (Polyester Grout) SQYD x = $ Seal Existing Concrete Pavement Joint LF x = $ Minor Concrete (Curb) CY 70 x = $ 63, Minor Concrete (Misc. Const) CY x = $ Minor Concrete (Island Paving) CY x = $ Minor Concrete (Sidewalk) CY 30 x = $ 22,500 TOTAL STRUCTURAL SECTION ITEMS $ 504,100 3 of 11 6/24/2015 8:51 AM
188 PRELIMINARY PROJECT COST ESTIMATE SECTION 3: DRAINAGE Item code Unit Quantity Unit Price ($) Cost Abandon Culvert LF x = $ Remove Culvert LF 50 x = $ 3, Remove Inlet EA 2 x 1, = $ 2, Adjust Inlet LF x = $ Cap Inlet EA x = $ Sand Backfill CY x = $ Minor Concrete (Minor Structure) CY 6 x 1, = $ 9, Minor Concrete (Box Culvert) CY x = $ - 62XXXX XXX" APC Pipe LF x = $ - 64XXXX XXX" Plastic Pipe LF x = $ " RCP Pipe LF 100 x = $ 9,700 66XXXX XXX" CSP Pipe LF x = $ - 68XXXX Edge Drain LF x = $ - 69XXXX XXX" Pipe Downdrain LF x = $ - 70XXXX XXX" Pipe Inlet LF x = $ - 70XXXX XXX" Pipe Riser LF x = $ - 70XXXX XXX" Flared End Section EA x = $ Grated Line Drain LF x = $ - 72XXXX Rock Slope Protection (Type and Method) CY x = $ Concrete (Ditch Lining) CY x = $ Concrete (Channel Lining) CY x = $ Rock Slope Protection Fabric SQYD x = $ Miscellaneous Iron and Steel LB 1,156 x 2.50 = $ 2,890 XXXXXX Additional Drainage LS 1 x 10, = $ 10,000 SECTION 4: SPECIALTY ITEMS TOTAL DRAINAGE ITEMS $ 36,900 Item code Unit Quantity Unit Price ($) Cost Progress Schedule (Critical Path Method) LS x = $ Remove Fence LF 600 x 9.00 = $ 5, Remove Terminal Systems EA x = $ XX Remove Barrier (Insert Type) LF x = $ Remove Sound Wall SQFT x = $ Lead Compliance Plan LS x = $ - 49XXXX CIDH Concrete Piling (Insert Diameter) LF x = $ Structural Concrete (Retaining Wall) CY 245 x = $ 140, Class 2 Concrete (Retaining Wall) CY x = $ Minor Concrete (Sound Wall) CY x = $ XX Architectural Treatment (Insert Type) SQFT x = $ Apply Anti-Graffiti Coating SQFT x = $ XX Reinforced Concrete Crib Wall (Insert Type) SQFT x = $ Sound Wall (Masonry Block) SQFT x = $ Bar Reinf. Steel (Retaining Wall) LB 44,550 x 1.00 = $ 44, Chain Link Fence (Type CL-6) LF 200 x = $ 5, Metal Beam Guard Railing LF x = $ Double Thrie Beam Barrier LF x = $ Cable Railing LF x = $ X Transition Railing (Insert Type) EA x = $ XX Terminal System (Type CAT) EA x = $ XX Alternative Flared Terminal System EA x = $ XX End Anchor Assembly (Insert Type ) EA x = $ Rail Tensioning Assembly EA x = $ Crash Cushion (Type TAU-II)) EA 2 x 20, = $ 40,000 83XXXX Concrete Barrier (Insert Type) LF x = $ - TOTAL SPECIALTY ITEMS $ 235,900 4 of 11 6/24/2015 8:51 AM
189 PRELIMINARY PROJECT COST ESTIMATE SECTION 5: ENVIRONMENTAL 5A - ENVIRONMENTAL MITIGATION Item code Unit Quantity Unit Price ($) Cost Biological Mitigation LS x = $ TEMPORARY REINFORCED SILT FENCE LF x = $ Temporary Fence (Type ESA) LF 600 x 6.00 = $ 3,600 Subtotal Environmental $ 3,600 5B - LANDSCAPE AND IRRIGATION Item code Unit Quantity Unit Price ($) Cost Highway Planting LS x = $ - 20XXXX XXX" (Insert Type ) Conduit (Use for LF x = $ - 20XXXX Extend XXX" (Insert Type) Conduit LF x = $ Imported Topsoil CY x = $ Erosion Control (Hydroseed) Type 1 SQFT 15,000 x 0.20 = $ 3, Fiber Rolls LF x = $ Move In/ Move Out (Erosion Control) EA 2 x 3, = $ 6, Plant Establishment Work LS x = $ Extend Plant Establishment (X Years) LS x = $ Irrigation System LS x = $ Water Meter EA x = $ Maintenance Vehicle Pullout EA x = $ - Subtotal Landscape and Irrigation $ 9,000 5C - NPDES Item code Unit Quantity Unit Price ($) Cost Construction Site Management LS 1 x 10, = $ 10, Prepare WPCP LS 1 x 5, = $ 5, Prepare SWPPP LS 1 x 10, = $ 10, Temporary Erosion Control SQYD x = $ Temporary Erosion Control Blanket SQYD x = $ Temporary Fiber Roll LF 600 x 4.50 = $ 2, Temporary Concrete Washout Facility EA 1 x 1, = $ 1, Temporary Construction Entrance EA 1 x 1, = $ 1, Temporary Check Dam LF 240 x = $ 2, Move In/ Move Out (Temporary Erosion Con EA x = $ Temp. Drainage Inlet Protection EA 6 x = $ 1, Street Sweeping LS 1 x 5, = $ 5, Temporary Concrete Washout (Portable) LS x = $ - Supplemental Work for NPDES (These costs are not accounted in total here but under Supplemental Work on sheet 7 of 11) Water Pollution Control Maintenance Sharing LS x = $ Additional Water Pollution Control** LS x = $ Storm Water Sampling and Analysis*** LS x = $ - *Applies to all SWPPPs and those WPCPs with sediment control or soil stabilization BMPs. **Applies to both SWPPPs and WPCP projects. *** Applies only to project with SWPPPs. Subtotal NPDES (Without Supplemental Work) $ 39,280 TOTAL ENVIRONMENTAL $ 51,900 5 of 11 6/24/2015 8:51 AM
190 PRELIMINARY PROJECT COST ESTIMATE SECTION 6: TRAFFIC ITEMS 6A - Traffic Electrical Item code Unit Quantity Unit Price ($) Cost Remove Sign Structure EA x = $ Reconstruct Sign Structure EA x = $ Modify Sign Structure EA x = $ XX Furnish Sign Structure LB x = $ XX Install Sign Structure LB x = $ - 56XXXX XXX" CIDHC Pile (Sign Foundation) LF x = $ Maintain Existing Traffic Management LS x = $ Inductive Loop Detectors EA x = $ X Lighting & Sign Illumination LS x = $ XX Interconnection Facilities LS x = $ XX Traffic Monitoring Stations LS x = $ - 860XXX Signals & Lighting LS 1 x 350, = $ 350, XX Ramp Metering System (Location X) LS x = $ XX Ramp Metering System (Location X) LS x = $ - 86XXXX Fiber Optic Conduit System LS x = $ - Subtotal Traffic Electrical $ 350,000 6B - Traffic Signing and Striping Item code Unit Quantity Unit Price ($) Cost Construction Area Signs LS 1 x 10, = $ 10, Remove Yellow Painted Traffic Stripe LF x = $ Remove Thermoplastic Traffic Stripe LF 6,150 x 1.00 = $ 6, Remove Thermoplastic Pavement Marking SQFT 1,565 x 4.00 = $ 6, Remove Roadside Sign EA 6 x = $ Reset Roadside Sign EA x = $ Relocate Roadside Sign EA 19 x = $ 4, Roadside Sign (One Post) EA 5 x = $ 1, Roadside Sign (Two Post) EA x = $ - 560XXX Furnish Sign Panels SQFT 50 x = $ Install Sign Panels SQFT x = $ " Thermoplastic Traffic Stripe LF 8,600 x 1.25 = $ 10, Thermoplastic Pavement Marking SQFT 2,250 x 6.50 = $ 14,625 Subtotal Traffic Signing and Striping $ 55,375 6C - Stage Construction and Traffic Handling Item code Unit Quantity Unit Price ($) Cost Traffic Control System LS 1 x 80, = $ 80, Type III Barricade EA 10 x = $ 1, Temporary Pavement Delineation LF x = $ X Channelizer EA x = $ Portable Changeable Message Signs LS 1 x 10, = $ 10, Temporary Railing (Type K) LF 3,100 x = $ 74, Temp. Crash Cushion Module EA 132 x = $ 2, A Traffic Plastic Drum EA x = $ A Temporary Crash Cushion (ADIEM) EA x = $ - Subtotal Stage Construction and Traffic Handling $ 168,304 TOTAL TRAFFIC ITEMS $ 573,700 6 of 11 6/24/2015 8:51 AM
191 PRELIMINARY PROJECT COST ESTIMATE SECTION 7: DETOURS Include constructing, maintaining, and removal Item code Unit Quantity Unit Price ($) Cost 0713XX Temporary Fence (Type X) LF x = $ - 07XXXX Temporary Drainage LS x = $ Temporary Pavement Delineation LF x = $ XX Temporary Signals EA x = $ Temporary Railing (Type K) LF x = $ Roadway Excavation CY x = $ Imported Borrow CY x = $ Embankment CY x = $ Class 4 Aggregate Subbase CY x = $ Class 2 Aggregate Base CY x = $ Hot Mix Asphalt (Type A) TON x = $ - TOTAL DETOURS $ - SUBTOTAL SECTIONS 1-7 $ 1,554,200 SECTION 8: MINOR ITEMS 8A - Americans with Disabilities Act Items ADA Items 2.0% $ 31,084 8B - Bike Path Items Bike Path Items 1.0% $ 15,542 8C - Other Minor Items Other Minor Items 5.0% $ 77,710 Total of Section 1-7 $ 1,554,200 x 8.0% = $ 124,336 SECTIONS 9: MOBILIZATION TOTAL MINOR ITEMS $ 124,400 Item d Total Section 1-8 $ 1,678,600 x 10% = $ 167,860 SECTION 10: SUPPLEMENTAL WORK TOTAL MOBILIZATION $ 167,900 Item code Unit Quantity Unit Price ($) Cost Federal Trainee Program LS x = $ Traffic Management Plan - Public Informatio LS x = $ Maintain Traffic LS x = $ Value Analysis LS x = $ Remove Rock & Debris LS x = $ Locate Existing Cross-Over LS x = $ Payment Adjustments For Price Index Fluct LS x = $ Partnering LS x = $ Operation of Existing Traffic Management S LS x = $ Dispute Review Board LS x = $ - XXXXXX Some Item x = $ - Cost of NPDES Supplemental Work specified in Section 5C = $ - Total Section 1-8 $ 1,678,600 5% = $ 83,930 TOTAL SUPPLEMENTAL WORK $ 84,000 7 of 11 6/24/2015 8:51 AM
192 PRELIMINARY PROJECT COST ESTIMATE SECTION 11: STATE FURNISHED MATERIALS AND EXPENSES Item code Unit Quantity Unit Price ($) Cost Public Information LS x = $ RE Office LS 1 x 30, = $30, Padlocks LS x = $ Reflective Numbers and Edge Sealer LS x = $ Water Expenses LS x = $ A COZEEP Expenses LS x = $ X Ramp Meter Controller Assembly LS x = $ X TMS Controller Assembly LS x = $ X Traffic Signal Controller Assembly LS x = $0 Total Section 1-8 $ 1,678,600 0% = $ - TOTAL STATE FURNISHED $30,000 SECTION 12: TIME-RELATED OVERHEAD Estiamted Time-Releated Overhead (TRO) Percentage (0% to 10%) = 5% Item code Unit Quantity Unit Price ($) Cost Time-Related Overhead WD 200 X 2300 = $0 TOTAL TIME-RELATED OVERHEAD $0 SECTION 13: CONTINGENCY (Pre-PSR 30%-50%, PSR 25%, Draft PR 20%, PR 15%, after PR approval 10%, Final PS&E 5%) Total Section 1-11 $ 1,960,500 x 20% = $392,100 TOTAL CONTINGENCY $392,100 8 of 11 6/24/2015 8:51 AM
193 PRELIMINARY PROJECT COST ESTIMATE II. STRUCTURE ITEMS DATE OF ESTIMATE 00/00/00 00/00/00 00/00/00 Name xxxxxxxxxxxxxxxxxxx xxxxxxxxxxxxxxxxxxx xxxxxxxxxxxxxxxxxxx Bridge Number 57-XXX 57-XXX 57-XXX Structure Type xxxxxxxxxxxxxxxxxxx xxxxxxxxxxxxxxxxxxx xxxxxxxxxxxxxxxxxxx Width (Feet) [out to out] 0.00 LF 0.00 LF 0.00 LF Total Length (Feet) 0.00 LF 0.00 LF 0.00 LF Total Area (Square Feet) 0 SQFT 0 SQFT 0 SQFT Structure Depth (Feet) 0.00 LF 0.00 LF 0.00 LF Footing Type (pile or spread) xxxxxxxxxxxxxxxxxxx xxxxxxxxxxxxxxxxxxx xxxxxxxxxxxxxxxxxxx Cost Per Square Foot $0.00 $0.00 $0.00 COST OF EACH STRUCTURE $0.00 $0.00 $0.00 DATE OF ESTIMATE 00/00/00 00/00/00 00/00/00 Name xxxxxxxxxxxxxxxxxxx xxxxxxxxxxxxxxxxxxx xxxxxxxxxxxxxxxxxxx Bridge Number 57-XXX 57-XXX 57-XXX Structure Type xxxxxxxxxxxxxxxxxxx xxxxxxxxxxxxxxxxxxx xxxxxxxxxxxxxxxxxxx Width (Feet) [out to out] 0.00 LF 0.00 LF 0.00 LF Total Length (Feet) 0.00 LF 0.00 LF 0.00 LF Total Area (Square Feet) 0 SQFT 0.00 SQFT 0.0 SQFT Structure Depth (Feet) 0.00 LF 0.00 LF 0.00 LF Footing Type (pile or spread) xxxxxxxxxxxxxxxxxxx xxxxxxxxxxxxxxxxxxx xxxxxxxxxxxxxxxxxxx Cost Per Square Foot $0.00 $0.00 $0.00 COST OF EACH STRUCTURE $0.00 $0.00 $0.00 TOTAL COST OF BRIDGES TOTAL COST OF BUILDINGS $0.00 $0.00 TOTAL COST OF STRUCTURES 1 $0.00 Estimate Prepared By: XXXXXXXXXXXXXXXXX Division of Structures Date 1 Structure's Estimate includes Overhead and Mobilization. Add more sheets if needed. Call them 9a, 9b, 9c,, etc 9 of 11 6/24/2015 8:51 AM
194 PRELIMINARY PROJECT COST ESTIMATE DO NOT PRINT THIS SHEET AS PART OF COST ESTIMATE ATTACHMENT TO PROJECT INITIATION OR APPROVAL DOCUMENTS. III. RIGHT OF WAY Fill in all of the available information from the Right of Way data sheet. A) A1) Acquisition, including Excess Land Purchases, Damages & Goodwill, $ 0 A2) SB-1210 $ 0 B) Acquisition of Offsite Mitigation $ 0 C) C1) Utility Relocation (State Share) $ 15,000 C2) Potholing (Design Phase) $ 20,000 D) Railroad Acquisition $ 0 E) Clearance / Demolition $ 0 F) Relocation Assistance (RAP and/or Last Resort Housing Costs) $ 0 G) Title and Escrow $ 0 H) Environmental Review $ 0 I) Condemnation Settlements 0% $ 0 (Items G & H applied to items A + B) J) Design Appreciation Factor 0% $ 0 K) Utility Relocation (Construction Cost) $ 20,000 L) (Excluding Item #8 - Hazardous Waste) TOTAL RIGHT OF WAY ESTIMATE $125,000 M) TOTAL R/W ESTIMATE: Escalated $125,000 N) Right of Way Support $ 75,000 Support Cost Estimate Prepared By Project Coordinator 1 Phone Utility Estimate Prepared By Utiliy Coordinator 2 Phone R/W Acquistion Estimate Prepared By Right of Way Estimator 3 Phone 1 When estimate has Support Costs only 2 When estimate has Utility Relocation 3 When R/W Acquisition is required 10 of 11 6/24/2015 8:51 AM
195 PRELIMINARY PROJECT COST ESTIMATE DO NOT PRINT THIS SHEET AS PART OF COST ESTIMATE ATTACHMENT TO PROJECT INITIATION OR APPROVAL DOCUMENTS. IV. SUPPORT COST ESTIMATE SUMMARY Please obtain a P3 report (CL#3) from PPM to fill in the support cost for these categories. SB-45 CATEGORY SUPPORT COST PREVIOUS FY 10/11 FY 11/12 FY 12/13 FY 13/14 FY 14/15 FY 15/16 FY 16/17 FY 17/18 FUTURE P3 Total Support Ratio PR/ED (PD,PE,PM) $ 225,000 $ 225, % PS&E (PS) $ 375,000 $ 375, % R/W (RW) $ 75,000 $ 75, % CONSTRUCTION (CM) $ 275,000 $ 275, % Total Support $ 675,000 $ - $ - $ - $ - $ - $ - $ - $ - $ 950,000 Cost: 38.34% Note: It is assumed that the Support Costs are already escalated by Programming to the year of expenditure. Use project Programming Sheet data Total Capital Cost: Total Capital Outlay Support Cost: Overall Percent Support Cost: $2,478,000 $950, % V. ESCALATED CONSTRUCTION COST ESTIMATE SUMMARY Note: Right of way escalated cost are accounted for on sheet 10 of 11. Month / Year Date of Estimate (Month/Year) June / 2015 Estimated Date of Construction Start (Month/Year) June / 2020 Number of Working Days 200 WD Estimated Mid-Point of Construction (Month/Year) 0 / 0 YEAR FUTURE FORECASTED ESCALATION 2.0% 2.0% 2.0% 2.0% 2.0% 2.0% ESCALATED CONSTRUCTION COSTS FUTURE TOTAL ESCALATED COSTS ROADWAY ITEMS $ 2,399,652 $ 2,447,645 $ 2,496,598 $ 2,546,530 $ 2,597,460 $ 2,649,410 $ 2,649,410 $ 2,649,410 $ 2,649,410 $ 2,649,410 $ 2,649,410 $ 2,649,410 STRUCTURE ITEMS $ - $ - $ - $ - $ - $ - $ - $ - $ - $ - $ - $ - SUBTOTAL $ 2,399,652 $ 2,447,645 $ 2,496,598 $ 2,546,530 $ 2,597,460 $ 2,649,410 $ 2,649,410 $ 2,649,410 $ 2,649,410 $ 2,649,410 $ 2,649,410 $ 2,649,410 Approved by: Project Control Engineer Date 11 of 11 6/24/2015 8:51 AM
196 PRELIMINARY PROJECT COST ESTIMATE Preliminary Cost Estimate Project ID: , EA 0F670 Type of Estimate : Program Code : Project Limits : Description: Scope : Alternative : Draft PR(ICE Step II Document) On Rte 41 (PM 0.0 to 0.1) from Rte 1 Interchange to 500' west of Main St, in Morro Upgrade capacity and intersection control for the existing, closely spaced, intersections on Route 41 (Atascadero Rd) at Route 1 NB Ramps and Main Street. Construct a 6-Leg Roundabout to combine existing closeley spaced intersections. Roundabout Alternative Current Cost Escalated Cost ROADWAY ITEMS $ 3,417,500 $ 3,848,660 STRUCTURE ITEMS $ - $ - SUBTOTAL CONSTRUCTION COST $ 3,417,500 $ 3,848,660 RIGHT OF WAY $ 125,000 $ 125,000 TOTAL CAPITAL OUTLAY COST $ 3,543,000 $ 3,974,000 PR/ED SUPPORT $ 225,000 $ 225,000 PS&E SUPPORT $ 375,000 $ 375,000 RIGHT OF WAY SUPPORT $ 75,000 $ 75,000 CONSTRUCTION SUPPORT $ 370,000 $ 370,000 OTAL CAPITAL OUTLAY SUPPORT COST* $ 1,045,000 $ 1,045,000 TOTAL PROJECT COST $ 4,600,000 $ 5,050,000 If Project has been programmed enter Programmed Amount Date of Estimate (Month/Year) Estimated Date of Construction Start (Month/Year) Number of Working Days Estimated Mid-Point of Construction (Month/Year) Number of Plant Establishment Days $ Month / Year July / 2015 July / Working Days Month / Year Days - Estimated Project Schedule PID Approval PA/ED Approval PS&E RTL Begin Construction Approved by Project Manager (916) Project Manager Date Phone 1 of 11 6/24/2015 8:45 AM
197 PRELIMINARY PROJECT COST ESTIMATE I. ROADWAY ITEMS SUMMARY Section Cost 1 Earthwork $ 299,900 2 Pavement Structural Section $ 929,800 3 Drainage $ 197,700 4 Specialty Items $ 249,000 5 Environmental $ 208,200 6 Traffic Items $ 377,700 7 Detours $ - 8 Minor Items $ 181,000 9 Roadway Mobilization $ 244, Supplemental Work $ 122, State Furnished $ 38, Contingencies $ 569, Overhead $ - TOTAL ROADWAY ITEMS $ 3,417,500 Estimate Prepared By Daniel Kehrer PE, Project Engineer 6/24/2015 (916) Name and Title Date Phone Estimate Reviewed By Name and Title Date (916) Phone By signing this estimate you are attesting that you have discussed your project with all functional units and have incorporated all their comments or have discussed with them why they will not be incorporated. 2 of 11 6/24/2015 8:45 AM
198 PRELIMINARY PROJECT COST ESTIMATE SECTION 1: EARTHWORK Item code Unit Quantity Unit Price ($) Cost Clearing & Grubbing LS 1 x 2, = $ 2, Develop Water Supply LS x = $ Roadway Excavation CY 7,678 x = $ 268, Roadway Excavation (Type Y) ADL CY x = $ Roadway Excavation (Type Z-2) ADL CY x = $ Structure Excavation (Retaining Wall) CY 350 x = $ 11, Structure Backfill (Retaining Wall) CY 260 x = $ 15, Pervious Backfill Material (Retaining Wall) CY x = $ Ditch Excavation CY x = $ Impored Borrow CY 100 x = $ 1, Imported Material (Shoulder Backing) TON x = $ - TOTAL EARTHWORK SECTION ITEMS $ 299,900 SECTION 2: PAVEMENT STRUCTURAL SECTION Item code Unit Quantity Unit Price ($) Cost Remove Asphalt Concrete Dike LF 880 x 5.00 = $ 4, Remove Base and Surfacing CY x = $ Cold Plane Asphalt Concrete Pavement SQYD x = $ Remove Concrete (Curb, Gutter, and CY 70 x = $ 30, Class 4 Aggregate Subbase CY x = $ Class 2 Aggregate Base CY 5,049 x = $ 277, Asphalt Treated Permeable Base CY x = $ Sand Cover TON x = $ Asphaltic Emulsion (Fog Seal Coat) TON x = $ Asphaltic Emulsion (Polymer Modified) TON x = $ XX Screenings (Type XX) TON x = $ Slurry Seal TON x = $ Replace Asphalt Concrete Surfacing CY x = $ Hot Mix Asphalt (Type A) TON 3,131 x = $ 281, Minor Hot Mix Asphalt TON x = $ Rubberized Hot Mix Asphalt (Gap Graded) TON x = $ Geosynthetic Pavement Interlayer SQYD x = $ X Shoulder Rumber Strip (HMA, Type XX Inden STA x = $ Place Hot Mix Asphalt Dike LF 200 x 4.00 = $ Place Hot Mix Asphalt (Misc. Area) SQYD x = $ Tack Coat TON x = $ Concrete Pavement CY x = $ Replace Concrete Pavement (Rapid Strength CY x = $ Seal Pavement Joint LF x = $ Seal Longitudinal Isolation Joint LF x = $ A Repair Spalled Joints (Polyester Grout) SQYD x = $ Seal Existing Concrete Pavement Joint LF x = $ Minor Concrete (Curb) CY 225 x = $ 202, Minor Concrete (Misc. Const) CY 100 x = $ 65, Minor Concrete (Island Paving) CY 45 x = $ 22, Minor Concrete (Sidewalk) CY 60 x = $ 45,000 TOTAL STRUCTURAL SECTION ITEMS $ 929,800 3 of 11 6/24/2015 8:45 AM
199 PRELIMINARY PROJECT COST ESTIMATE SECTION 3: DRAINAGE Item code Unit Quantity Unit Price ($) Cost Abandon Culvert LF x = $ Remove Culvert LF 300 x = $ 19, Remove Inlet EA 8 x 1, = $ 8, Adjust Inlet LF x = $ Cap Inlet EA x = $ Sand Backfill CY x = $ Minor Concrete (Minor Structure) CY 30 x 1, = $ 45, Minor Concrete (Box Culvert) CY x = $ - 62XXXX XXX" APC Pipe LF x = $ - 64XXXX XXX" Plastic Pipe LF x = $ " RCP Pipe LF 960 x = $ 93,120 66XXXX XXX" CSP Pipe LF x = $ - 68XXXX Edge Drain LF x = $ - 69XXXX XXX" Pipe Downdrain LF x = $ - 70XXXX XXX" Pipe Inlet LF x = $ - 70XXXX XXX" Pipe Riser LF x = $ - 70XXXX XXX" Flared End Section EA x = $ Grated Line Drain LF x = $ - 72XXXX Rock Slope Protection (Type and Method) CY x = $ Concrete (Ditch Lining) CY x = $ Concrete (Channel Lining) CY x = $ Rock Slope Protection Fabric SQYD x = $ Miscellaneous Iron and Steel LB 4,800 x 2.50 = $ 12,000 XXXXXX Additional Drainage LS 1 x 20, = $ 20,000 SECTION 4: SPECIALTY ITEMS TOTAL DRAINAGE ITEMS $ 197,700 Item code Unit Quantity Unit Price ($) Cost Progress Schedule (Critical Path Method) LS x = $ Remove Fence LF 250 x 9.00 = $ 2, Remove Terminal Systems EA x = $ XX Remove Barrier (Insert Type) LF x = $ Remove Sound Wall SQFT x = $ Lead Compliance Plan LS x = $ - 49XXXX CIDH Concrete Piling (Insert Diameter) LF x = $ Structural Concrete (Retaining Wall) CY 270 x = $ 155, Class 2 Concrete (Retaining Wall) CY x = $ Minor Concrete (Sound Wall) CY x = $ XX Architectural Treatment (Insert Type) SQFT x = $ Apply Anti-Graffiti Coating SQFT x = $ XX Reinforced Concrete Crib Wall (Insert Type) SQFT x = $ Sound Wall (Masonry Block) SQFT x = $ Bar Reinf. Steel (Retaining Wall) LB 49,000 x 1.00 = $ 49, Chain Link Fence (Type CL-6) LF 100 x = $ 2, Metal Beam Guard Railing LF x = $ Double Thrie Beam Barrier LF x = $ Cable Railing LF x = $ X Transition Railing (Insert Type) EA x = $ XX Terminal System (Type CAT) EA x = $ XX Alternative Flared Terminal System EA x = $ XX End Anchor Assembly (Insert Type ) EA x = $ Rail Tensioning Assembly EA x = $ Crash Cushion (Type TAU-II)) EA 2 x 20, = $ 40,000 83XXXX Concrete Barrier (Insert Type) LF x = $ - TOTAL SPECIALTY ITEMS $ 249,000 4 of 11 6/24/2015 8:45 AM
200 PRELIMINARY PROJECT COST ESTIMATE SECTION 5: ENVIRONMENTAL 5A - ENVIRONMENTAL MITIGATION Item code Unit Quantity Unit Price ($) Cost Biological Mitigation LS x = $ TEMPORARY REINFORCED SILT FENCE LF x = $ Temporary Fence (Type ESA) LF 600 x 6.00 = $ 3,600 Subtotal Environmental $ 3,600 5B - LANDSCAPE AND IRRIGATION Item code Unit Quantity Unit Price ($) Cost Highway Planting LS 1 x 40, = $ 40, " Corrugated HDPE Conduit (Irrigation x- LF 650 x = $ 42,250 20XXXX Extend XXX" (Insert Type) Conduit LF x = $ Imported Topsoil CY 600 x = $ 36, Erosion Control (Hydroseed) Type 1 SQFT 10,000 x 0.20 = $ 2, Fiber Rolls LF x = $ Move In/ Move Out (Erosion Control) EA 2 x 3, = $ 6, Plant Establishment Work LS 1 x 25, = $ 25, Extend Plant Establishment (X Years) LS x = $ Irrigation System LS 1 x 10, = $ 10, Water Meter EA 1 x 4, = $ 4, Maintenance Vehicle Pullout EA x = $ - Subtotal Landscape and Irrigation $ 165,250 5C - NPDES Item code Unit Quantity Unit Price ($) Cost Construction Site Management LS 1 x 10, = $ 10, Prepare WPCP LS 1 x 5, = $ 5, Prepare SWPPP LS 1 x 10, = $ 10, Temporary Erosion Control SQYD x = $ Temporary Erosion Control Blanket SQYD x = $ Temporary Fiber Roll LF 600 x 4.50 = $ 2, Temporary Concrete Washout Facility EA 1 x 1, = $ 1, Temporary Construction Entrance EA 1 x 1, = $ 1, Temporary Check Dam LF 240 x = $ 2, Move In/ Move Out (Temporary Erosion Con EA x = $ Temp. Drainage Inlet Protection EA 6 x = $ 1, Street Sweeping LS 1 x 5, = $ 5, Temporary Concrete Washout (Portable) LS x = $ - Supplemental Work for NPDES (These costs are not accounted in total here but under Supplemental Work on sheet 7 of 11) Water Pollution Control Maintenance Sharing LS x = $ Additional Water Pollution Control** LS x = $ Storm Water Sampling and Analysis*** LS x = $ - *Applies to all SWPPPs and those WPCPs with sediment control or soil stabilization BMPs. **Applies to both SWPPPs and WPCP projects. *** Applies only to project with SWPPPs. Subtotal NPDES (Without Supplemental Work) $ 39,280 TOTAL ENVIRONMENTAL $ 208,200 5 of 11 6/24/2015 8:45 AM
201 PRELIMINARY PROJECT COST ESTIMATE SECTION 6: TRAFFIC ITEMS 6A - Traffic Electrical Item code Unit Quantity Unit Price ($) Cost Remove Sign Structure EA x = $ Reconstruct Sign Structure EA x = $ Modify Sign Structure EA x = $ XX Furnish Sign Structure LB x = $ XX Install Sign Structure LB x = $ - 56XXXX XXX" CIDHC Pile (Sign Foundation) LF x = $ Maintain Existing Traffic Management LS x = $ Inductive Loop Detectors EA x = $ X Lighting & Sign Illumination LS x = $ XX Interconnection Facilities LS x = $ XX Traffic Monitoring Stations LS x = $ Lighting & Sign Illumination LS 1 x 100, = $ 100, XX Ramp Metering System (Location X) LS x = $ XX Ramp Metering System (Location X) LS x = $ - 86XXXX Fiber Optic Conduit System LS x = $ - Subtotal Traffic Electrical $ 100,000 6B - Traffic Signing and Striping Item code Unit Quantity Unit Price ($) Cost Construction Area Signs LS 1 x 10, = $ 10, Remove Yellow Painted Traffic Stripe LF x = $ Remove Thermoplastic Traffic Stripe LF 6,500 x 1.00 = $ 6, Remove Thermoplastic Pavement Marking SQFT 1,565 x 4.00 = $ 6, Remove Roadside Sign EA 6 x = $ Reset Roadside Sign EA x = $ Relocate Roadside Sign EA 28 x = $ 7, Roadside Sign (One Post) EA 35 x = $ 10, Roadside Sign (Two Post) EA x = $ - 560XXX Furnish Sign Panels SQFT 350 x = $ 5, Install Sign Panels SQFT x = $ " Thermoplastic Traffic Stripe LF 6,800 x 1.25 = $ 8, Thermoplastic Pavement Marking SQFT 1,400 x 6.50 = $ 9,100 Subtotal Traffic Signing and Striping $ 64,000 6C - Stage Construction and Traffic Handling Item code Unit Quantity Unit Price ($) Cost Traffic Control System LS 1 x 120, = $ 120, Type III Barricade EA 15 x = $ 1, Temporary Pavement Delineation LF x = $ X Channelizer EA x = $ Portable Changeable Message Signs LS 1 x 10, = $ 10, Temporary Railing (Type K) LF 3,300 x = $ 79, Temp. Crash Cushion Module EA 132 x = $ 2, A Traffic Plastic Drum EA x = $ A Temporary Crash Cushion (ADIEM) EA x = $ - Subtotal Stage Construction and Traffic Handling $ 213,604 TOTAL TRAFFIC ITEMS $ 377,700 6 of 11 6/24/2015 8:45 AM
202 PRELIMINARY PROJECT COST ESTIMATE SECTION 7: DETOURS Include constructing, maintaining, and removal Item code Unit Quantity Unit Price ($) Cost 0713XX Temporary Fence (Type X) LF x = $ - 07XXXX Temporary Drainage LS x = $ Temporary Pavement Delineation LF x = $ XX Temporary Signals EA x = $ Temporary Railing (Type K) LF x = $ Roadway Excavation CY x = $ Imported Borrow CY x = $ Embankment CY x = $ Class 4 Aggregate Subbase CY x = $ Class 2 Aggregate Base CY x = $ Hot Mix Asphalt (Type A) TON x = $ - TOTAL DETOURS $ - SUBTOTAL SECTIONS 1-7 $ 2,262,300 SECTION 8: MINOR ITEMS 8A - Americans with Disabilities Act Items ADA Items 2.0% $ 45,246 8B - Bike Path Items Bike Path Items 1.0% $ 22,623 8C - Other Minor Items Other Minor Items 5.0% $ 113,115 Total of Section 1-7 $ 2,262,300 x 8.0% = $ 180,984 SECTIONS 9: MOBILIZATION TOTAL MINOR ITEMS $ 181,000 Item d Total Section 1-8 $ 2,443,300 x 10% = $ 244,330 SECTION 10: SUPPLEMENTAL WORK TOTAL MOBILIZATION $ 244,400 Item code Unit Quantity Unit Price ($) Cost Federal Trainee Program LS x = $ Traffic Management Plan - Public Informatio LS x = $ Maintain Traffic LS x = $ Value Analysis LS x = $ Remove Rock & Debris LS x = $ Locate Existing Cross-Over LS x = $ Payment Adjustments For Price Index Fluct LS x = $ Partnering LS x = $ Operation of Existing Traffic Management S LS x = $ Dispute Review Board LS x = $ - XXXXXX Some Item x = $ - Cost of NPDES Supplemental Work specified in Section 5C = $ - Total Section 1-8 $ 2,443,300 5% = $ 122,165 TOTAL SUPPLEMENTAL WORK $ 122,200 7 of 11 6/24/2015 8:45 AM
203 PRELIMINARY PROJECT COST ESTIMATE SECTION 11: STATE FURNISHED MATERIALS AND EXPENSES Item code Unit Quantity Unit Price ($) Cost Public Information LS x = $ RE Office LS 1 x 38, = $38, Padlocks LS x = $ Reflective Numbers and Edge Sealer LS x = $ Water Expenses LS x = $ A COZEEP Expenses LS x = $ X Ramp Meter Controller Assembly LS x = $ X TMS Controller Assembly LS x = $ X Traffic Signal Controller Assembly LS x = $0 Total Section 1-8 $ 2,443,300 0% = $ - TOTAL STATE FURNISHED $38,000 SECTION 12: TIME-RELATED OVERHEAD Estiamted Time-Releated Overhead (TRO) Percentage (0% to 10%) = 5% Item code Unit Quantity Unit Price ($) Cost Time-Related Overhead WD 220 X 2300 = $0 220 TOTAL TIME-RELATED OVERHEAD $0 SECTION 13: CONTINGENCY (Pre-PSR 30%-50%, PSR 25%, Draft PR 20%, PR 15%, after PR approval 10%, Final PS&E 5%) Total Section 1-11 $ 2,847,900 x 20% = $569,580 TOTAL CONTINGENCY $569,600 8 of 11 6/24/2015 8:45 AM
204 PRELIMINARY PROJECT COST ESTIMATE II. STRUCTURE ITEMS DATE OF ESTIMATE 00/00/00 00/00/00 00/00/00 Name xxxxxxxxxxxxxxxxxxx xxxxxxxxxxxxxxxxxxx xxxxxxxxxxxxxxxxxxx Bridge Number 57-XXX 57-XXX 57-XXX Structure Type xxxxxxxxxxxxxxxxxxx xxxxxxxxxxxxxxxxxxx xxxxxxxxxxxxxxxxxxx Width (Feet) [out to out] 0.00 LF 0.00 LF 0.00 LF Total Length (Feet) 0.00 LF 0.00 LF 0.00 LF Total Area (Square Feet) 0 SQFT 0 SQFT 0 SQFT Structure Depth (Feet) 0.00 LF 0.00 LF 0.00 LF Footing Type (pile or spread) xxxxxxxxxxxxxxxxxxx xxxxxxxxxxxxxxxxxxx xxxxxxxxxxxxxxxxxxx Cost Per Square Foot $0.00 $0.00 $0.00 COST OF EACH STRUCTURE $0.00 $0.00 $0.00 DATE OF ESTIMATE 00/00/00 00/00/00 00/00/00 Name xxxxxxxxxxxxxxxxxxx xxxxxxxxxxxxxxxxxxx xxxxxxxxxxxxxxxxxxx Bridge Number 57-XXX 57-XXX 57-XXX Structure Type xxxxxxxxxxxxxxxxxxx xxxxxxxxxxxxxxxxxxx xxxxxxxxxxxxxxxxxxx Width (Feet) [out to out] 0.00 LF 0.00 LF 0.00 LF Total Length (Feet) 0.00 LF 0.00 LF 0.00 LF Total Area (Square Feet) 0 SQFT 0.00 SQFT 0.0 SQFT Structure Depth (Feet) 0.00 LF 0.00 LF 0.00 LF Footing Type (pile or spread) xxxxxxxxxxxxxxxxxxx xxxxxxxxxxxxxxxxxxx xxxxxxxxxxxxxxxxxxx Cost Per Square Foot $0.00 $0.00 $0.00 COST OF EACH STRUCTURE $0.00 $0.00 $0.00 TOTAL COST OF BRIDGES TOTAL COST OF BUILDINGS $0.00 $0.00 TOTAL COST OF STRUCTURES 1 $0.00 Estimate Prepared By: XXXXXXXXXXXXXXXXX Division of Structures Date 1 Structure's Estimate includes Overhead and Mobilization. Add more sheets if needed. Call them 9a, 9b, 9c,, etc 9 of 11 6/24/2015 8:45 AM
205 PRELIMINARY PROJECT COST ESTIMATE DO NOT PRINT THIS SHEET AS PART OF COST ESTIMATE ATTACHMENT TO PROJECT INITIATION OR APPROVAL DOCUMENTS. III. RIGHT OF WAY Fill in all of the available information from the Right of Way data sheet. A) A1) Acquisition, including Excess Land Purchases, Damages & Goodwill, $ 50,000 A2) SB-1210 $ 0 B) Acquisition of Offsite Mitigation $ 0 C) C1) Utility Relocation (State Share) $ 15,000 C2) Potholing (Design Phase) $ 25,000 D) Railroad Acquisition $ 0 E) Clearance / Demolition $ 0 F) Relocation Assistance (RAP and/or Last Resort Housing Costs) $ 0 G) Title and Escrow $ 10,000 H) Environmental Review $ 0 I) Condemnation Settlements 0% $ 0 (Items G & H applied to items A + B) J) Design Appreciation Factor 0% $ 0 K) Utility Relocation (Construction Cost) $ 45,000 L) (Excluding Item #8 - Hazardous Waste) TOTAL RIGHT OF WAY ESTIMATE $125,000 M) TOTAL R/W ESTIMATE: Escalated $125,000 N) Right of Way Support $ 75,000 Support Cost Estimate Prepared By Project Coordinator 1 Phone Utility Estimate Prepared By Utiliy Coordinator 2 Phone R/W Acquistion Estimate Prepared By Right of Way Estimator 3 Phone 1 When estimate has Support Costs only 2 When estimate has Utility Relocation 3 When R/W Acquisition is required 10 of 11 6/24/2015 8:45 AM
206 PRELIMINARY PROJECT COST ESTIMATE DO NOT PRINT THIS SHEET AS PART OF COST ESTIMATE ATTACHMENT TO PROJECT INITIATION OR APPROVAL DOCUMENTS. IV. SUPPORT COST ESTIMATE SUMMARY Please obtain a P3 report (CL#3) from PPM to fill in the support cost for these categories. SB-45 CATEGORY SUPPORT COST PREVIOUS FY 10/11 FY 11/12 FY 12/13 FY 13/14 FY 14/15 FY 15/16 FY 16/17 FY 17/18 FUTURE P3 Total Support Ratio PR/ED (PD,PE,PM) $ 225,000 $ 225, % PS&E (PS) $ 375,000 $ 375, % R/W (RW) $ 75,000 $ 75, % CONSTRUCTION (CM) $ 370,000 $ 370, % Total Support $ 675,000 $ - $ - $ - $ - $ - $ - $ - $ - $ 1,045,000 Cost: 29.49% Note: It is assumed that the Support Costs are already escalated by Programming to the year of expenditure. Use project Programming Sheet data Total Capital Cost: Total Capital Outlay Support Cost: Overall Percent Support Cost: $3,543,000 $1,045, % V. ESCALATED CONSTRUCTION COST ESTIMATE SUMMARY Note: Right of way escalated cost are accounted for on sheet 10 of 11. Month / Year Date of Estimate (Month/Year) July / 2015 Estimated Date of Construction Start (Month/Year) July / 2020 Number of Working Days 220 WD Estimated Mid-Point of Construction (Month/Year) 0 / 0 YEAR FUTURE FORECASTED ESCALATION 2.0% 2.0% 2.0% 2.0% 2.0% 2.0% ESCALATED CONSTRUCTION COSTS FUTURE TOTAL ESCALATED COSTS ROADWAY ITEMS $ 3,485,850 $ 3,555,567 $ 3,626,678 $ 3,699,212 $ 3,773,196 $ 3,848,660 $ 3,848,660 $ 3,848,660 $ 3,848,660 $ 3,848,660 $ 3,848,660 $ 3,848,660 STRUCTURE ITEMS $ - $ - $ - $ - $ - $ - $ - $ - $ - $ - $ - $ - SUBTOTAL $ 3,485,850 $ 3,555,567 $ 3,626,678 $ 3,699,212 $ 3,773,196 $ 3,848,660 $ 3,848,660 $ 3,848,660 $ 3,848,660 $ 3,848,660 $ 3,848,660 $ 3,848,660 Approved by: Project Control Engineer Date 11 of 11 6/24/2015 8:45 AM
207 APPENDIX H RESPONSE TO COMMENTS DESIGN MEMORANDUM

208 Memorandum To: Department of Transportation Date: March 21, 2016 Revised - May 5, 2016 Attn: Paul McClintic Project: SR 1/SR 41/ Main Street From: Sarah Huffman, P.E. Intersection Re: ICE Step 2 Response to Comments Job No.: Design Memorandum File No.: C1881MEM004.DOCX CC: Rick Sauerwein and Rob Livick, City of Morro Bay; John Fouche, Sam Toh and Joe Erwin, Caltrans; Joe Weiland and Rich Krumholz, Omni-Means Omni-Means has prepared this Design Memorandum to provide responses to the action items brought forth during the meeting held on January 14, 2016 regarding comments provided by Caltrans on the Draft ICE (Step 2) Report. A copy of the final meeting record is provided in Appendix A. The three comments discussed during the meeting included the following: 1. Intersection sight distance for the NB off-ramp movement 2. Truck access to Main Street from the NB off-ramp 3. Access control east of Main Street A draft Design Memorandum was submitted on March 21, 2016 that provided Omni-Means' initial response to each of the above comments based on direction provided during the meeting and documented in the meeting record. Additional comments were then provided by Caltrans on April 14, 2016 following their review of the draft Design Memorandum with a copy of the provided comments including Omni-Means responses provided in Appendix B. Comments that required revisions to the draft Design Memorandum have also been incorporated. 1. Intersection Sight Distance: NB Off-Ramp Movement During the ICE Step 2 analysis, it was identified that the required intersection sight distance (ISD) could not be provided from the NB off-ramp to EB SR 41 due to the existing SR 1 structure (see Figure 1). ISD is calculated using a critical headway between 4.5 and 6.5 seconds. The ISD diagrams presented in the Draft ICE Step 2 report were based on a critical headway of 6.5 seconds. It was decided during the meeting that a critical headway of 5.0 seconds would be acceptable to use in calculating ISD. FIGURE 1: ISD FROM DRAFT STEP 2 REPORT 669 Pacific Street l Suite A l San Luis Obispo, CA l p l omnimeans.com Napa l Redding l Roseville l San Luis Obispo l Visalia l Walnut Creek
209 SR 1/ SR 41/ Main Street ICE Step II Comments Review Design Memo In addition, it was recommended to look at modifications to the roundabout that would reduce the fast path entry and circulating speed on eastbound SR 41 which would also reduce the required ISD from the NB off-ramp back along EB SR 41. Finally, there was discussion whether the right-turn movement from the NB off-ramp to SB Main Street could be prohibited. Prohibiting this movement would allow the separate right-turn lane on the off-ramp to be eliminated at the entrance to the roundabout and a reduction in the entry width at this location from what is currently shown. Table 1 presents the forecasted right turn volumes for this movement as provided in Appendix A in the current version (December 2015) of the ICE Step 2 report. Roundabout Movement TABLE 1: FORECASTED RIGHT-TURN VOLUMES SR 1 NB OFF-RAMP TO SB MAIN STREET AM Peak Hour Opening Year (2020) PM Peak Hour Interim Design Year (2030) AM Peak Hour PM Peak Hour AM Peak Hour Design Year (2040) PM Peak Hour NB SR 1 Off-ramp Right Turns to SB Main With right-turns prohibited from the NB off-ramp, Omni-Means utilized the SIDRA traffic model to analyze how the addition of these vehicles to the circulatory roadway would affect the capacity, delay, LOS, and queue lengths. Because of the configuration of the roundabout, SIDRA cannot specifically model redirecting the right-turn volumes completely around the roundabout to the entrance to SB Main Street. For a u-turn movement, the model looks for the last exit prior to the entrance, while the u-turn movement required for this analysis brings the traffic back past the NB off-ramp exit. With this model limitation, Omni-Means performed two different analyses and averaged the results in order to approximately simulate this movement. The first analysis (scenario 1) removed the NB off-ramp right-turns and reallocated these trips to the NB Main Street u-turn movement. The second analysis (scenario 2) added an outbound lane to the NB off-ramp and reallocated the right-turning trips to a u-turn movement from the off-ramp. In this scenario, the only vehicles using the off-ramp as an exit are those making a u-turn movement. The SIDRA results for both scenarios are provided in Appendix C with the resulting averages shown in the following tables. As shown in the tables, the projected intersection LOS for all scenarios is LOS C or better. TABLE 2A: OPENING YEAR (2020) AM PEAK HOUR Roundabout Alternative Int. # Intersection/Approach V/C Ratio Delay (sec) Level Of Service 95 th Percentile Queue (ft) 1 Main St/ SR 1 NB Ramps & SR B - Eastbound A 35 Westbound A 60 Northbound B 75 Southbound B 70 Northbound Ramp B Traffic Operation outputs calculated using SIDRA 6 methodology for Roundabouts. 2. Worst lane movement (of the approach) value stated. 2
210 Int. # SR 1/ SR 41/ Main Street ICE Step II Comments Review Design Memo TABLE 2B: OPENING YEAR (2020) PM PEAK HOUR Roundabout Alternative Intersection/Approach V/C Ratio Delay (sec) Level Of Service 95 th Percentile Queue (ft) 1 Main St/ SR 1 NB Ramps & SR A - Eastbound A 25 Westbound A 45 Northbound A 115 Southbound A 60 Northbound Ramp B Traffic Operation outputs calculated using SIDRA 6 methodology for Roundabouts. 2. Worst lane movement (of the approach) value stated. TABLE 3A: INTERIM DESIGN YEAR (2030) AM PEAK HOUR Int. # Roundabout Alternative Intersection/Approach V/C Ratio Delay (sec) Level Of Service 95 th Percentile Queue (ft) 1 Main St/ SR 1 NB Ramps & SR B - Eastbound A 35 Westbound B 95 Northbound B 125 Southbound B 125 Northbound Ramp B Traffic Operation outputs calculated using SIDRA 6 methodology for Roundabouts. 2. Worst lane movement (of the approach) value stated. Int. # TABLE 3B: INTERIM DESIGN YEAR (2030) PM PEAK HOUR Roundabout Alternative Intersection/Approach V/C Ratio Delay (sec) Level Of Service 95 th Percentile Queue (ft) 1 Main St/ SR 1 NB Ramps & SR B - Eastbound A 30 Westbound A 70 Northbound B 210 Southbound A 90 Northbound Ramp B Traffic Operation outputs calculated using SIDRA 6 methodology for Roundabouts. 2. Worst lane movement (of the approach) value stated. 3
211 SR 1/ SR 41/ Main Street ICE Step II Comments Review Design Memo Int. # TABLE 4A: ULTIMATE DESIGN YEAR (2040) AM PEAK HOUR Roundabout Alternative Intersection/Approach V/C Ratio Delay (sec) Level Of Service 95 th Percentile Queue (ft) 1 Main St/ SR 1 NB Ramps & SR B - Eastbound A 40 Westbound B 155 Northbound C 205 Southbound C 205 Northbound Ramp B Traffic Operation outputs calculated using SIDRA 6 methodology for Roundabouts. 2. Worst lane movement (of the approach) value stated. TABLE 4B: ULTIMATE DESIGN YEAR (2040) PM PEAK HOUR Int. # Roundabout Alternative Intersection/Approach V/C Ratio Delay (sec) Level Of Service 95 th Percentile Queue (ft) 1 Main St/ SR 1 NB Ramps & SR B - Eastbound A 35 Westbound B 100 Northbound C 355 Southbound B 130 Northbound Ramp B Traffic Operation outputs calculated using SIDRA 6 methodology for Roundabouts. 2. Worst lane movement (of the approach) value stated. Based on the preceding adjustments and modifications, Omni-Means modified the roundabout design as follows. Adjusted design based on calculated intersection sight distance and sight distance clear viewing areas established using a critical headway of 5.0 seconds. The central island was rotated counterclockwise to reduce the EB SR 41 entering and circulating radii to reduce the fastest path speeds for this approach. The entry width at the NB off-ramp entry was reduced by eliminating the separate rightturn lane. The preliminary geometrics for the modified roundabout are shown on Figure 2. As shown on Figure 2, the roundabout has been shifted into the northeast quadrant away from the obstructing structure. Although the roundabout has rotated and shifted, the improvements still remain within the proposed right-of-way footprint previously identified for this alternative. The resulting intersection sight distance exhibit is shown on Figure 3. Additional roundabout design criteria exhibits including truck turns are provided in Appendix D. 4
212
213 APPROACH CONFLICTING SPEED (MPH) SIGHT TRIANGLE LENGTH (FT) EASTBOUND SR 41 ENTERING LEG (D1) CIRCULATING LEG (D2) WESTBOUND SR 41 ENTERING LEG (D1) CIRCULATING LEG (D2) SOUTHBOUND MAIN STREET ENTERING LEG (D1) CIRCULATING LEG (D2) NORTHBOUND SR 1 OFF-RAMP ENTERING LEG-SR 41 (D1) ENTERING LEG-MAIN STREET (D1) CIRCULATING LEG (D2) NORTHBOUND MAIN STREET ENTERING LEG-SR 1 NB OFF-RAMP (D1) ENTERING LEG-SR 41 (D1) CIRCULATING LEG (D2)

214 SR 1/ SR 41/ Main Street ICE Step II Comments Review Design Memo During the meeting it was also requested to verify the angle of visibility for the driver on the NB off-ramp as part of the intersection sight distance evaluation. The NCHRP Report 672 Roundabouts: An Informational Guide recommends using 75 as a minimum intersection angle. As shown on Figure 4, the angle a driver would need to turn their head in order to see along the intersection sight distance sight line is Main Street Truck Access FIGURE 4: ISD VIEW ANGLE The radius between the NB Off-Ramp to SB Main Street is too tight to accommodate right turning heavy vehicles. As identified in the ICE Step 2 analysis, a right-turning truck would be required to access SB Main Street by making a u-turn movement through the roundabout. Truck drivers could be alerted to this through the use of custom signage. It was also suggested to redirect northbound trucks on SR 1 to use the Main Street exit for access to any destinations to the south of SR Access Control East of Main Street The final discussion point at the meeting was access control east of Main Street, particularly related to access from eastbound SR 41 to Sunset Street. During the meeting, Omni-Means was directed to modify the design to restrict left-turns from EB SR 41 to Sunset Street. This was completed by extending the length of the splitter island past the return of Sunset Street. This change is also depicted in Figure 2. Caltrans has subsequently provided a comment regarding possibly improving access to parcels on the south side of SR 41. See Appendix B, comment #11 and the provided response. 7
215 Conclusion SR 1/ SR 41/ Main Street ICE Step II Comments Review Design Memo After re-evaluating the traffic operations and modifying the roundabout geometrics, the roundabout concept still functions at acceptable levels of service in the design year peak hours. The geometric footprint remains relatively similar to the previous designs. Appendix APPENDIX A: FINAL MEETING RECORD APPENDIX B: RESPONSES TO CALTRANS APRIL 14, 2016 COMMENTS APPENDIX C: SIDRA REPORTS APPENDIX D: ROUNDABOUT EXHIBITS 8
216 Appendix A
217 Meeting Record Record No.: 4 Project: SR 1/SR 41/ Main Street Re: ICE Step II Comments Intersection Meeting Date: January 14, 2016 Job No.: Location: Caltrans DO, TMC Conference Room 50 Higuera Street San Luis Obispo, CA File No: C1881PRD004.DOCX Recorded Omni-Means By: Participants: (See attached List of Attendees) CC: Participants Record Date: Draft: January 20, 2016 Final: February 1, 2016 The following is Omni-Means understanding of the discussions and decisions for the above referenced meeting. Please notify Omni-Means immediately of any discrepancies in the information recorded. This meeting record has been prepared to serve as documentation for the meeting regarding the ICE Step II comments of January 14, This record consists of discussion points and action items and generally follows the meeting agenda. Introductions were made and a sign in sheet was routed. See attendees list at the end of these minutes. Discussion Points - Draft ICE Step II Report Review Joe: Purpose of this meeting is to discuss the 2nd draft of the ICE Step II document. Omni-Means received comments back just before Christmas. There are three main design issues that he wanted to discuss, and he'd like to have direction for each one. Paul gave some background on the process to set a tone for the rest of the meeting: o o o In the past, Caltrans would require a conceptual approval report, which would result in about 70% plans, for a roundabout to be considered. There has since been a change in the Department. Caltrans sees the safety benefits of roundabouts and now welcomes them as a type of intersection control. Caltrans now requires the ICE process, in which multiple types of intersection controls are evaluated. The process consists of two steps: Step 1 is an overview phase and a "common sense" type of document. During this step, fatal flaws and critical issues are identified and evaluated. Traffic is analyzed to the extent to determine how many lanes will be needed, how operations and delay are affected by the different control types etc. At this point, some alternatives can be thrown out. 669 Pacific Street l Suite A l San Luis Obispo, CA l p l omnimeans.com Napa l Redding l Roseville l San Luis Obispo l Visalia l Walnut Creek
218 SR 1/ SR 41/ Main Street ICE Step II Comments Review Meeting Step 2 is closer to a Project Approval/Environmental Document level analysis. During this step, the alternatives are studied in more detail, and that is typically when design issues, such as those we are going to discuss in this meeting, shake out. A. Intersection Sight Distance - NB Off- Movement Joe passed out handouts illustrating different restrictive conditions that would be affected by intersection sight distance issues. The abutment of the existing SR 1 structure over SR 41 has vertical walls, which restricts sight distance. To correct this restrictive condition would require constructing a new structure with a span length between feet. The cost would be significant, because the construction would be complicated (phasing, raising the profile of the structure). The cost of a new structure would likely double the cost of the project. Moving the roundabout footprint east approximately 60 feet would also significantly impact the properties on the east side of Main Street: Sonic Drive-In, Chevron, and Taco Bell. The cost of acquiring these parcels would also likely double the cost of the project. An exhibit detailing sight distance triangles for varying critical headway values was then reviewed. Joe explained that Omni-Means originally calculated the sight distances by using a critical headway of 6.5 seconds. However, on two other projects (1st & 2nd Street Roundabouts in Napa and the Main Street/ SR 49 Roundabout in Plymouth) in California, a critical headway of 5 seconds was used and accepted by Caltrans (D-4 and D-10 respectively). Five seconds is also in conformance with the default value provided in NCHRP Report 672 Roundabouts: An Informational Guide. This document also includes a range of headways from seconds. o o o o o o Sam stated that 5 seconds is reasonable, and he believes he used that value on another project. The group looked at the view angle exhibit to confirm that the view angle for the NB off-ramp at the yield line was within standards. John was concerned about the angle from the driver on the NB off-ramp looking back along the ISD being greater than 15-degrees. It was agreed that this angle would be checked and verified. Paul said that 4.5 seconds is getting rocky. He'd like to see the eastbound entry radius tightened up, in order to reduce the R1 & R2 speeds. He suggested that this may be possible by modifying the circulatory roadway. He also pointed out that the eastbound exit speed is relatively fast (31 mph), and he thought that regular users of the roundabout would become used to that fact and begin cheating the fast path. He reiterated that he felt 4.5 seconds of critical headway is too low. Sam said that drivers would need to be aggressive. John pointed out that a number of users of this intersection are high school students. 2
219 SR 1/ SR 41/ Main Street ICE Step II Comments Review Meeting Paul mentioned that this is a significant issue that might bring the signal alternative back to the table. John was concerned about having an off-ramp from a Caltrans facility with a sight distance issue. Paul acknowledged that there is varying critical headways accepted state to state. John was concerned that a driver exiting the freeway might not realize that there is a roundabout at the terminus. o o o o Joe (referencing the exhibit packet) reminded the group that there is sufficient stopping sight distance, and SSD on the ramp was pro-rated based on the speeds at the gore and terminus. Sam asked if users would be able to know/ see if there is a roundabout coming up. Joe said this could be done with advance signage. Sam thought that the ramp was coming down a vertical grade, but Joe said that the area is fairly flat. Sam pointed out that the eastbound entry speed (E1) was 23 mph, and Paul wanted to reduce that speed to be much lower. o Joe said he thinks it can work with a critical headway of 5 seconds and by adjusting the entry radius. Paul asked Rob if the City of Morro Bay would be comfortable assuming responsibility for this issue, if Caltrans relinquished this portion of SR 41 to the City. o o It's a liability issue on who owns the sight distance. Rob said that he agreed that he'd like to see the roundabout design refined using a critical headway of 5 seconds. Paul stated that 5 seconds for critical headway is acceptable. o o o Rich asked if 4.5 second is off the table. John said that he thought so. Paul said he has a few contacts he could speak to about this issue before completely ruling out further reducing the critical headway to 4.5 seconds Rich stated that every person in the room is transportation professional, and we all have a priority focus on safety, regardless of who owns the facility. Joe said that the Omni-Means team will re-work the design to see if it can work with a critical headway of 5 seconds. He reminded the group that tweaking one piece might 3
220 SR 1/ SR 41/ Main Street ICE Step II Comments Review Meeting affect other design checks. Rob asked if there was any way to modify the existing abutment wall slightly to provide sight distance. o John said that it would be very difficult. Action Item: Omni-Means will revise the roundabout design using a critical headway of 5 seconds. Modifications will also consider view angle for ISD and revisions to the eastbound entry radius. Paul will verify if a further reduction in the critical headway would be acceptable. B. Main Street Truck Access Joe reminded the group that, with the current design, trucks will not be able to make a right turn from the NB off-ramp to SB Main Street. Instead, trucks will have to make a u- turn around the roundabout in order to go south. He distributed a packet of aerials that showed the Main Street ramps to the south of the project. Joe gave two options: Option 1 is to provide signage to alert trucks to use the Main Street off-ramp to the south. Option 2 is to create a unique sign for the intersection to instruct trucks to make a u-turn through the roundabout to access SB Main Street. Sam stated that if Option 1 is chosen, we'd likely need to provide Option 2 as well for those trucks that still get off at SR 41. Paul said he would talk to some of his contacts, because this issue of right turning trucks has come up or will likely come up on future roundabout projects. Paul recommended that an additional alternative be looked at that would restrict northbound off-ramp traffic from making the quick right onto southbound Main street. Paul also requested to see the resulting traffic operations using SIDRA with this change in access. o o Joe said that prohibiting right-turns would eliminate one of the entry lanes which might help to improve the ISD from the off-ramp. Rob stated that he does not believe the volume of right turning vehicles at this location is significant. Action Item: Omni-Means to re-evaluate roundabout operations with NB off-ramp rightturns to SB Main Street prohibited. Modify roundabout design to eliminate 2 nd entry lane from the NB off-ramp if this change results in acceptable traffic operations C. Access Control East of Main Street Joe noted that this issue is related to access from eastbound SR 41 to Sunset Street. Paul reminded the group that the EB exit speed from the roundabout is approximately 30 4
221 SR 1/ SR 41/ Main Street ICE Step II Comments Review Meeting mph, and that the distance is too short to come to a stop if a vehicle is waiting in the through lane to turn left onto Sunset Street. o o o He would like to see either: left-turn channelization or an extension of the splitter island to restrict access to right-in/right-out only. He stressed that the developer would need to be told that their access would be restricted at this location. Paul also recommended that Omni-Means submit concepts to Caltrans for the improvements for them to review. He recommended that left-turns to Sunset be restricted at a minimum. Rob said that they had previously looked at placing a left turn pocket at this location, but it did not fit. He also said that the developer has talked about moving their main point of access east on SR 41. Action Item: Omni-Means will change design to restrict left turns into sunset from eastbound SR 41. The City of Morro Bay will work with developer on access expectations. D. Other Comments Paul made it clear that he would like to see a roundabout at this location. He doesn't want a signal unless it is absolutely necessary. He also reassured everyone that an ICE Step II document is equal to about 30% design. This is not wasted effort. As the project moves further into PA/ED, there is real clarity as to viable alternatives to be considered. 5
222 SR 1/ SR 41/ Main Street ICE Step II Comments Review Meeting List of Attendees Attendee Representing Phone No. City of Morro Bay Rob Livick City of Morro Bay Jarrod Whelan City of Morro Bay Caltrans Paul McClintic Caltrans Traffic Operations Sam Toh Caltrans Traffic Operations John Fouche Caltrans Design Omni-Means Rich Krumholz Omni-Means Joe Weiland Omni-Means Sarah Huffman Omni-Means
223 Appendix B
 Job No.: 25-1783-01 Step 2 Design Memo File No.: R1881RSP004.")
224 Response to Comments To: Department of Transportation Date: May 5, 2016 Attn: Sam Toh Project: State Route 1/State Route 41/Main Street Intersection Analysis From: Sarah Huffman, P.E. Joe Weiland Re: Comments on Draft State Route 1/State Route 41/Main Street Intersection Control Evaluation (ICE) Job No.: Step 2 Design Memo File No.: R1881RSP004.DOCX CC: Rick Sauerwein and Rob Livick, City of Morro Bay; Paul McClintic and Joe Erwin, Caltrans; Rich Krumholz, Omni-Means Omni-Means has prepared this document to provide response to comments on the Draft ICE (Step 2) Design Memorandum provided by Caltrans (Sam Toh) by on April 14, Copies of the comments as provided by Caltrans are attached. # Page Comment Responses Reviewer: Sam Toh, Traffic Operations 1. 2 Modified SIDRA methodology Due to SIDRA model limitation. The proposed modified methodology devised to analyze the right turn prohibition from the NB Off-ramp to south Main Street appears to be reasonable and sound. By averaging the added circulating traffic effects of Scenario 1 & 2 had sufficiently demonstrated that the roundabout studied will still operates effectively and maintain a LOS B or better in year That s a bang for the buck! Minor Correction in SIDRA model inputs An error was discovered in the inscribed circle radius input and the WB circulating number of lanes. It has been corrected since 03/29/2016 by Omni-Means and a new SIDRA outputs has been provided by Omni-Means. With this correction, the year 2040 worst approach performance was improved from LOS D to LOS C and the overall intersection performance from LOS C to LOS B. The 2040 PM 95 th percentile queue (longest) estimated was also reduced from 590 feet to 350 feet at the Main Street northbound approach. The Consultant will need to update these results in Tables 2A, 2B, 3A, Comment noted. Comment noted. Referenced tables have been updated in the ICE Step 2 Response to Comments Design Memorandum. 669 Pacific Street l Suite A l San Luis Obispo, CA l p l omnimeans.com Napa l Redding l Roseville l San Luis Obispo l Visalia l Walnut Creek

225 May 5, B, 4A & 4B and on any other information pertaining to this correction accordingly. Please resubmit this technical memo not excluding any other comments from Caltrans Design for file records. The roundabout alternative at this location is obviously far more superior then the signal alternative in terms of operations, emissions and safety benefits. 3. Figure 2 Preliminary Geometrics The roundabout was shifted slightly to the NE quadrant from the previous geometrics iteration. The right-turn lane on the NB Off-ramp was removed as recommended. The splitter island has been lengthened as recommended. The entry angle at all approaches looks fairly good at first look but requires Caltrans Design to verify. Move both the straight and left-turn arrow in the roundabout further back (as shown in the markups) so that the drivers will be able to see well ahead and make better decision when they are making the U-turn move from SB Off-ramp to south Main Street. (See attached mark up of Figure #2 (Layout Comments.pdf). See the last comment by Design, they are related. 4. Figure 3 Intersection Sight Distance It also appears that by shifting the roundabout slightly to the NE quadrant and by removing the right-turn lane on the NB Off-ramp with an agreed 5.0 seconds critical headways, a safe sight distance was achievable. 5. Figure 4 ISD View Angle The view angle at all approaches requires Caltrans Design to verify with actual CAD files Main Street Truck Access It s been understood that due to the tight radius between Main Street and NB Off-ramp, right turn trucks would be required to access Main Street by making U-turn movement through the roundabout. It has also been Traffic Operations recommendation that at this particular entry all vehicles are required to make U-turn movement to access southbound Main Street. Therefore, a custom signage will be required to alert all drivers (not just truck drivers). Comment noted. Comment noted. Comment noted. Arrows have been moved back as requested. See updated Figure 2 in the Design Memorandum. Comment noted. CAD file was sent to Caltrans Design as requested. Comment noted. An example of an applicable custom sign is shown here. Additional evaluation of custom signage will be required during future project phases. 2
226 May 5, 2016 Also, want to point out that this special U-turn move for trucks will also occur at the southbound Main Street to NB On-ramp movement. What kind of design vehicles can make this turn except trucks? Can a bus or RV trailer make it since Morro Bay is a tourist destination? Main Street southbound approach will need another custom signage. Small vehicles can make the direct right turn from SB Main Street to SR 1 NB on-ramp, such as cars and motor homes (30 design vehicle). The HDM standard BUS-45 and larger vehicles cannot navigate this turn. See attached Exhibit A illustrating this turning movement Access Control East of Main Street The splitter island has been lengthened as recommended by Traffic Operations. Very good. Comment noted. See updated Figure 2 in the Design Memorandum. Reviewer: Joe Erwin, Design 8. App. C Per HDM, stopping sight distance within a roundabout is based on a 6 object height. This should not affect the diagrams too much as they are two dimensional, but it will affect grading adjacent to NB off-ramp from HWY 1 and a minor impact to SB Main St. Additionally, show stopping sight distance calculation for circulating traffic within the circulatory roadway. Adjust notes and callouts within Appendix C Is a completely separate bypass lane feasible? Not the slip lane that was previously shown but a separate lane that connects near the southern end of the splitter island near the Chevron and Taco Bell. Trucks and other traffic tend to not make the 360 movement and will try and make the right turn even if it s signed to restrict it. End result will be busted curb shortly after opening day. There appears to be adequate right of way south of the intersection for a dedicated bypass lane Bike facilities appear to be included on some legs but not others. If showing them on one, place them on all With extended splitter island, access to the liquor store adjacent to Chevron will be impacted. No longer have ability to turn onto WB on Route 41 and back to town. Consideration should be made to improving access on the east side of the building to allow for that movement. Stopping sight distance on the circulatory roadway is now depicted on Figure 3 provided in Appendix D in the Design Memorandum. Notes and callouts have been adjusted to specify a 6" object height. Comment noted. A right-turn bypass lane from the NB off-ramp to SB Main will be evaluated during the PA&ED project phase. Bike lanes and ramps are now shown on all non-ramp legs of the roundabout. See updated Figure 2 in the Design Memorandum. There is a secondary access provided to the liquor store via the driveway to the east. See attached Exhibit B showing access for this business. The City is also currently trying to clarify ownership between the various parcels along the south side of SR 41 which will be further addressed during PA&ED. 3
227 May 5, App. C Identify truck speed on figure showing truck turning. HDM states 10 MPH design speed for truck turning diagrams. 13. App. C Truck making the 360 movement will have load shift when rear tire of the trailer slip on and off the truck apron. Redesign truck apron/central island to avoid this scenario. Per the HDM 404.2, "The longer radius templates are more conservative. The longer radius templates develop less swept width and leave a margin of error for the truck driver. The longer radius templates should be used for conditions where the vehicle may not be required to stop before entering the intersection. The minimum radius template can be used if the longer radius template does not clear all obstacles. The minimum radius templates demonstrate the tightest turn that the vehicles can navigate, assuming a speed of less than 10 miles per hour." The longer radii templates were used on the truck turning diagrams, and a note has been added to each sheet. See truck turn exhibits provided in Appendix D in the Design Memorandum. The only template requiring a smaller radius is the STAA trucks making a 360 from SB Main Street and NB off-ramp. The radii to the outside wheel has been identified on this truck template exhibit. In this instance, the minimum radius was used. See Appendix D, Figure 6 in the Design Memorandum. Redesigned truck apron to allow back tires to remain on apron for the full turn. Modified the curb to be less abrupt. See updated Figure 2 in the Design Memorandum. 4
228 EXHIBIT A SB Main Street to NB on-ramp Exhibit
229
230 Exhibit B East SR 41 Access Exhibit

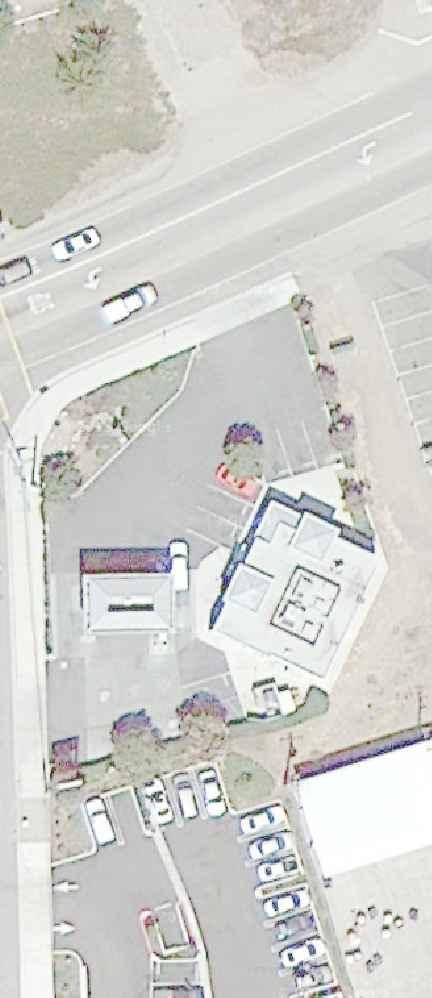
231
232 Exhibit C Truck turn speed Exhibit
233
234 Comments Provided by Caltrans
235 Comment Sheet Project: State Route 1/41/Main St. ICE (Step 2) Report # C1881MEM003.docx Reviewed By Date Sam Toh 04/06/2016 Joe Erwin 04/11/2016 Page Comments on Draft ICE (Step 2) Report Response 2 Modified SIDRA methodology Due to SIDRA model limitation. The proposed modified methodology devised to analyze the right turn prohibition from the NB Off-ramp to south Main Street appears to be reasonable and sound. By averaging the added circulating traffic effects of Scenario 1 & 2 had sufficiently demonstrated that the roundabout studied will still operates effectively and maintain a LOS B or better in year That s a bang for the buck! 2-4 Minor Correction in SIDRA model inputs Figure #2 An error was discovered in the inscribed circle radius input and the WB circulating number of lanes. It has been corrected since 03/29/2016 by Omni-Means and a new SIDRA outputs has been provided by Omni-Means. With this correction, the year 2040 worst approach performance was improved from LOS D to LOS C and the overall intersection performance from LOS C to LOS B. The 2040 PM 95 th percentile queue (longest) estimated was also reduced from 590 feet to 350 feet at the Main Street northbound approach. The Consultant will need to update these results in Tables 2A, 2B, 3A, 3B, 4A & 4B and on any other information pertaining to this correction accordingly. Please resubmit this technical memo not excluding any other comments from Caltrans Design for file records. The roundabout alternative at this location is obviously far more superior then the signal alternative in terms of operations, emissions and safety benefits. Preliminary Geometrics The roundabout was shifted slightly to the NE quadrant from the previous geometrics iteration. The right-turn lane on the NB Off-ramp was removed as recommended. The splitter island has been lengthen as recommended. The entry angle at all approaches looks fairly good at first look but requires Caltrans Design to verify. Move both the straight and left-turn arrow in the roundabout further back (as shown in the mark-ups) so that the drivers will be able to see well ahead and make better decision when they are making the U-turn move from SB Off-ramp to south Main Street. (See attached mark up of Figure #2 (Layout Comments.pdf). See the last comment by Design, they are related.
236 Figure #3 Figure #4 Intersection Sight Distance It also appears that by shifting the roundabout slightly to the NE quadrant and by removing the right-turn lane on the NB Offramp with an agreed 5.0 seconds critical headways, a safe sight distance was achievable. ISD View Angle The view angle at all approaches requires Caltrans Design to verify with actual CAD files. 7 Main Street Truck Access It s been understood that due to the tight radius between Main Street and NB Off-ramp, right turn trucks would be required to access Main Street by making U-turn movement through the roundabout. It has also been Traffic Operations recommendation that at this particular entry all vehicles are required to make U- turn movement to access southbound Main Street. Therefore, a custom signage will be required to alert all drivers (not just truck drivers). Also, want to point out that this special U-turn move for trucks will also occur at the southbound Main Street to NB On-ramp movement. What kind of design vehicles can make this turn except trucks? Can a bus or RV trailer make it since Morro Bay is a tourist destination? Main Street southbound approach will need another custom signage. 7 Access Control East of Main Street The splitter island has been lengthen as recommended by Traffic Operations. Very good.

237 Page Comments on Draft ICE (Step 2) Report Response These comments are in addition to Sam s comments. App. C Per HDM, stopping sight distance within a roundabout is based on a 6 object height. This should not affect the diagrams too much as they are two dimensional, but it will affect grading adjacent to NB off-ramp from HWY 1 and a minor impact to SB Main St. Additionally, show stopping sight distance calculation for circulating traffic within the circulatory roadway. Adjust notes and callouts within Appendix C. 7 Is a completely separate bypass lane feasible? Not the slip lane that was previously shown but a separate lane that connects near the southern end of the splitter island near the Chevron and Taco Bell. Trucks and other traffic tend to not make the 360 movement and will try and make the right turn even if it s signed to restrict it. End result will be busted curb shortly after opening day. There appears to be adequate right of way south of the intersection for a dedicated bypass lane. 5 Bike facilities appear to be included on some legs but not others. If showing them on one, place them on all. 5 With extended splitter island, access to the liquor store adjacent to Chevron will be impacted. No longer have ability to turn onto WB on Route 41 and back to town. Consideration should be made to improving access on the east side of the building to allow for that movement. App. C Identify truck speed on figure showing truck turning. HDM states 10 MPH design speed for truck turning diagrams. App. C Truck making the 360 movement will have load shift when rear tire of the trailer slip on and off the truck apron. Redesign truck apron/central island to avoid this scenario.
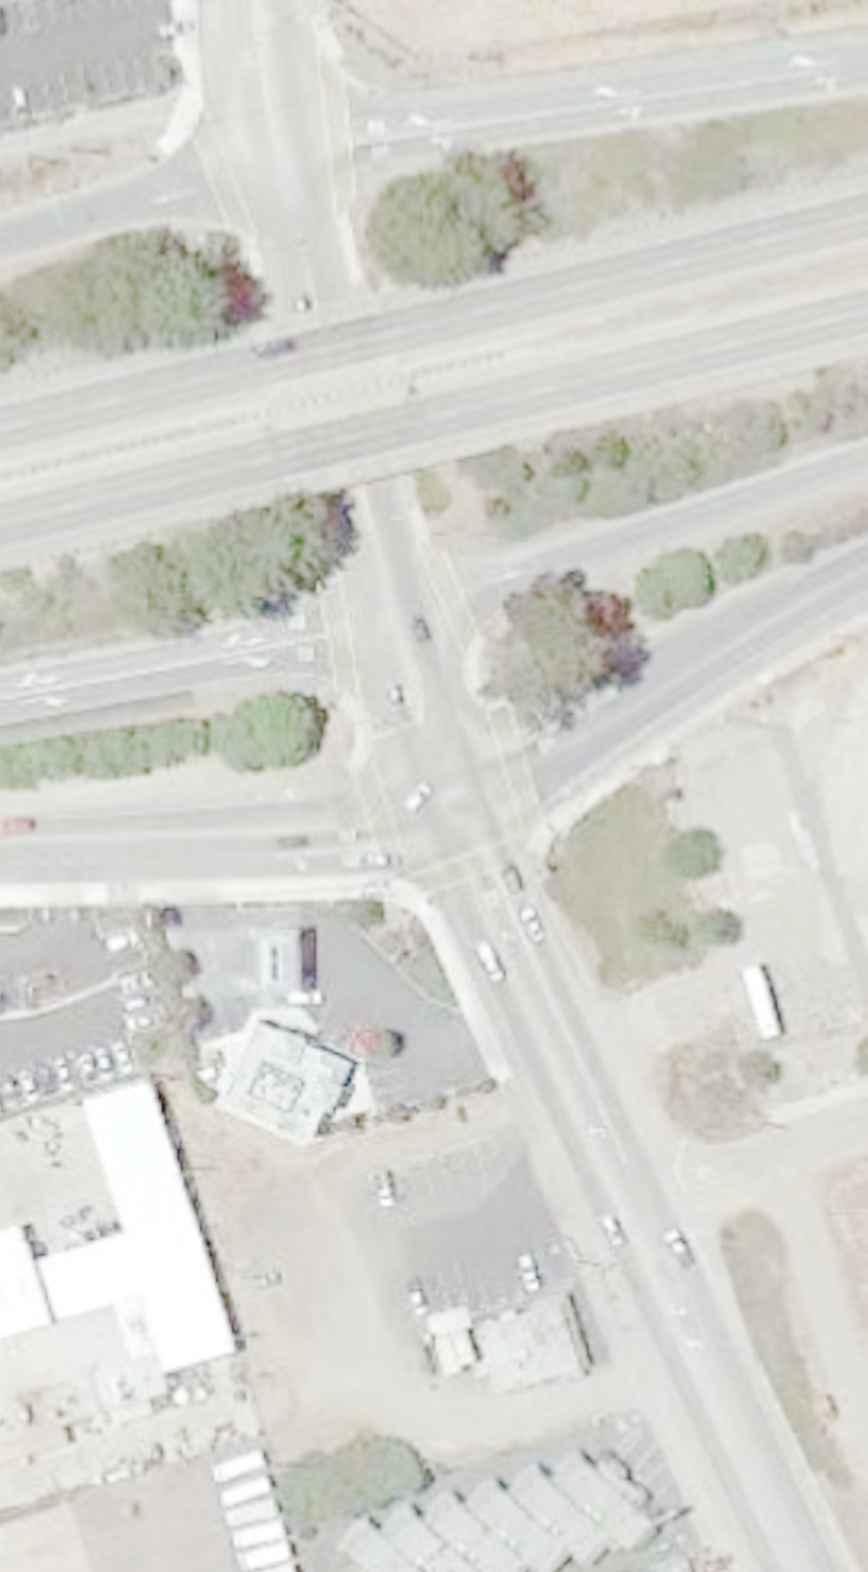
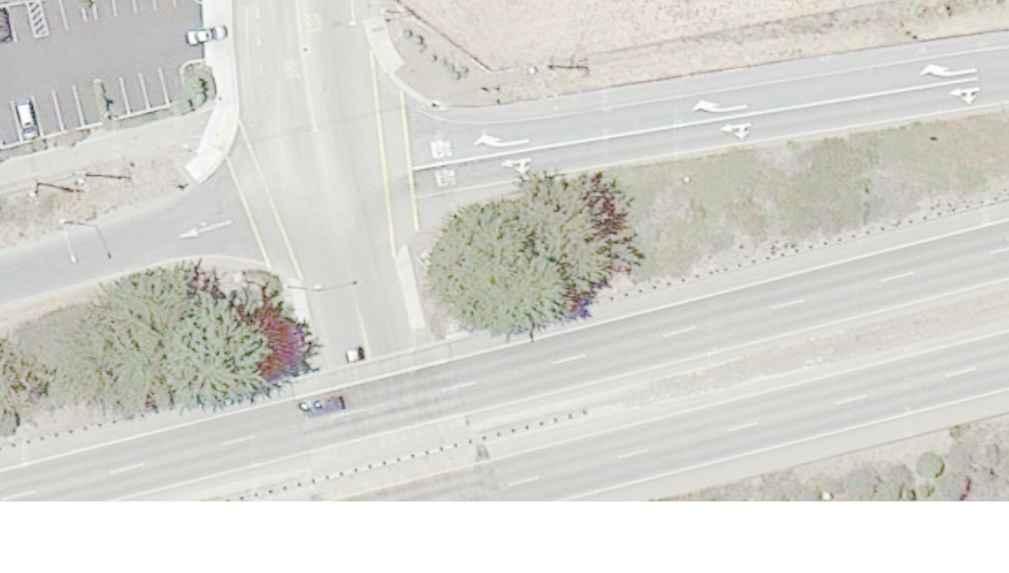

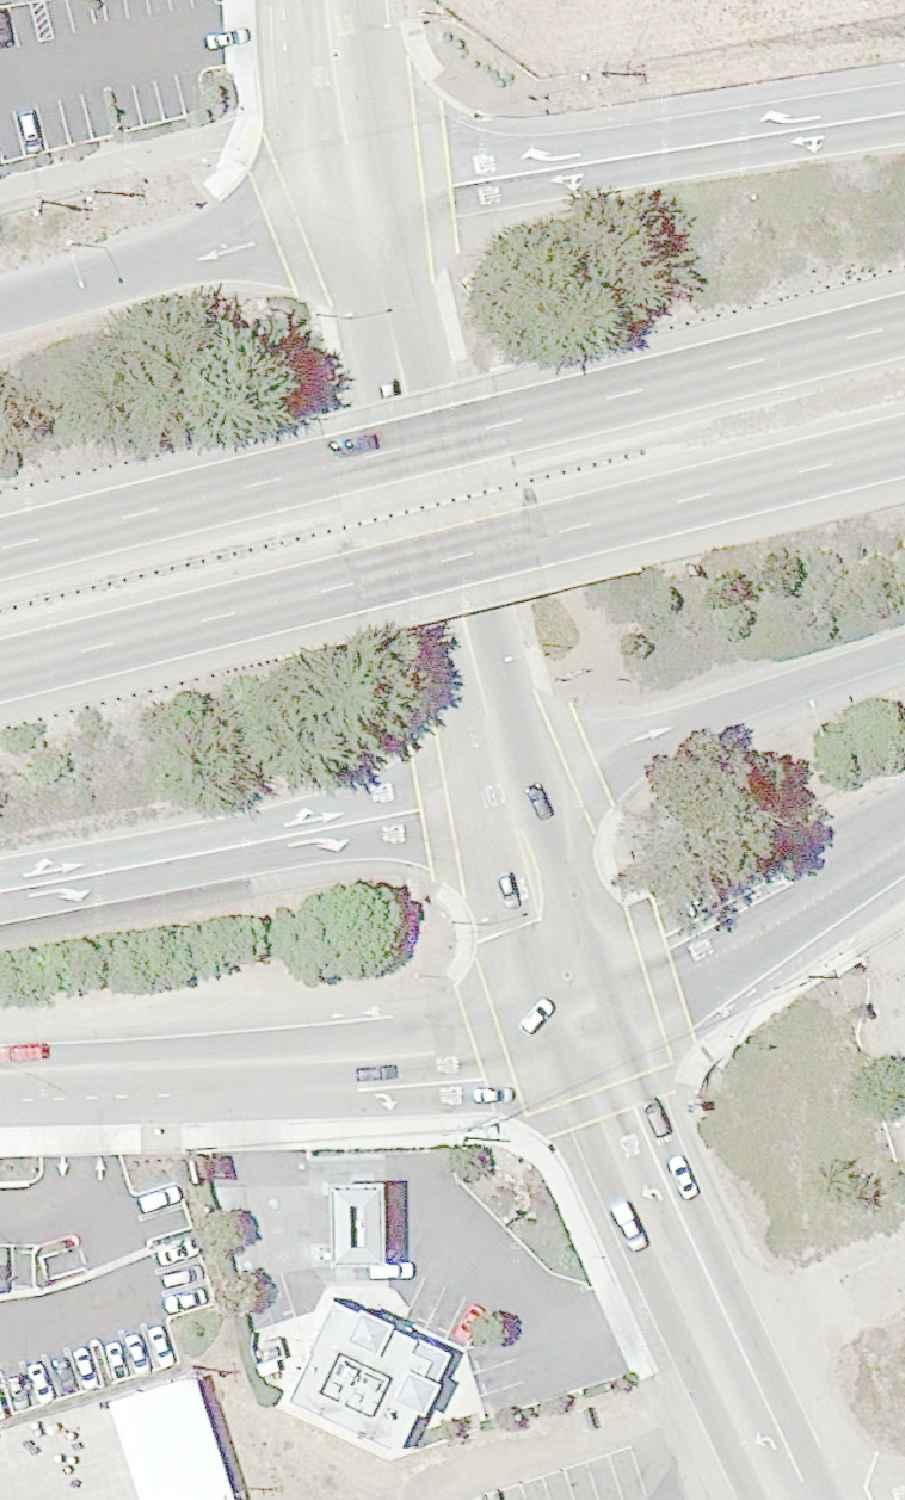
238
LAWRENCE TRANSIT CENTER LOCATION ANALYSIS 9 TH STREET & ROCKLEDGE ROAD / 21 ST STREET & IOWA STREET LAWRENCE, KANSAS
 LAWRENCE TRANSIT CENTER LOCATION ANALYSIS 9 TH STREET & ROCKLEDGE ROAD / 21 ST STREET & IOWA STREET LAWRENCE, KANSAS TRAFFIC IMPACT STUDY FEBRUARY 214 OA Project No. 213-542 TABLE OF CONTENTS 1. INTRODUCTION...
APPENDIX C1 TRAFFIC ANALYSIS DESIGN YEAR TRAFFIC ANALYSIS
 APPENDIX C1 TRAFFIC ANALYSIS DESIGN YEAR TRAFFIC ANALYSIS DESIGN YEAR TRAFFIC ANALYSIS February 2018 Highway & Bridge Project PIN 6754.12 Route 13 Connector Road Chemung County February 2018 Appendix
Date: February 7, 2017 John Doyle, Z-Best Products Robert Del Rio. T.E. Z-Best Traffic Operations and Site Access Analysis
 Memorandum Date: February 7, 07 To: From: Subject: John Doyle, Z-Best Products Robert Del Rio. T.E. Z-Best Traffic Operations and Site Access Analysis Introduction Hexagon Transportation Consultants, Inc.
EXECUTIVE SUMMARY. The following is an outline of the traffic analysis performed by Hales Engineering for the traffic conditions of this project.
 EXECUTIVE SUMMARY This study addresses the traffic impacts associated with the proposed Shopko redevelopment located in Sugarhouse, Utah. The Shopko redevelopment project is located between 1300 East and
City of Marina. Regional Roundabout Study Utilizing Caltrans Intersection Control Evaluation Section 4: Transportation Agency for Monterey County
 Regional Roundabout Study Utilizing Caltrans Intersection Control Evaluation Section 4: City of Marina Study Intersections: RESERVATION ROAD AT BEACH ROAD RESERVATION ROAD AT DEFOREST ROAD CARDOZA AVENUE
Traffic Engineering Study
 Traffic Engineering Study Bellaire Boulevard Prepared For: International Management District Technical Services, Inc. Texas Registered Engineering Firm F-3580 November 2009 Executive Summary has been requested
TRAFFIC IMPACT ANALYSIS
 TRAFFIC IMPACT ANALYSIS Emerald Isle Commercial Development Prepared by SEPI Engineering & Construction Prepared for Ark Consulting Group, PLLC March 2016 I. Executive Summary A. Site Location The Emerald
APPENDIX E. Traffic Analysis Report
 APPENDIX E Traffic Analysis Report THIS PAGE INTENTIONALLY BLANK EAGLE RIVER TRAFFIC MITIGATION PHASE I OLD GLENN HIGHWAY/EAGLE RIVER ROAD INTERSECTION IMPROVEMENTS TRAFFIC ANALYSIS Eagle River, Alaska
MEMORANDUM. Figure 1. Roundabout Interchange under Alternative D
 MEMORANDUM Date: To: Liz Diamond, Dokken Engineering From: Subject: Dave Stanek, Fehr & Peers Western Placerville Interchanges 2045 Analysis RS08-2639 Fehr & Peers has completed a transportation analysis
City of Pacific Grove
 Regional Study Utilizing Caltrans Intersection Evaluation Section 7: City of Pacific Grove s: FIRST STREET AT CENTRAL AVENUE Transportation Agency for Monterey County Prepared by Transportation Agency
King County Metro. Columbia Street Transit Priority Improvements Alternative Analysis. Downtown Southend Transit Study. May 2014.
 King County Metro Columbia Street Transit Priority Improvements Alternative Analysis Downtown Southend Transit Study May 2014 Parametrix Table of Contents Introduction... 1 Methodology... 1 Study Area...
The major roadways in the study area are State Route 166 and State Route 33, which are shown on Figure 1-1 and described below:
 3.5 TRAFFIC AND CIRCULATION 3.5.1 Existing Conditions 3.5.1.1 Street Network DRAFT ENVIRONMENTAL IMPACT REPORT The major roadways in the study area are State Route 166 and State Route 33, which are shown
Roundabout Feasibility Study SR 44 at Grand Avenue TABLE OF CONTENTS
 Roundabout Feasibility Study SR 44 at Grand Avenue TABLE OF CONTENTS Introduction and Executive Summary... 1 Existing Conditions... 3 Intersection Volume Conditions... 5 Intersection Operations... 9 Safety
Craig Scheffler, P.E., PTOE HNTB North Carolina, P.C. HNTB Project File: Subject
 TECHNICAL MEMORANDUM To Kumar Neppalli Traffic Engineering Manager Town of Chapel Hill From Craig Scheffler, P.E., PTOE HNTB North Carolina, P.C. Cc HNTB Project File: 38435 Subject Obey Creek TIS 2022
TRAFFIC IMPACT STUDY DERRY GREEN CORPORATE BUSINESS PARK MILTON SECONDARY PLAN MODIFICATION
 TRAFFIC IMPACT STUDY DERRY GREEN CORPORATE BUSINESS PARK MILTON SECONDARY PLAN MODIFICATION TRAFFIC IMPACT STUDY DERRY GREEN CORPORATE BUSINESS PARK MILTON SECONDARY PLAN MODIFICATION DECEMBER 24 UPDATED
Traffic Impact Statement (TIS)
") Traffic Impact Statement (TIS) Vincentian PUDA Collier County, FL 10/18/2013 Prepared for: Global Properties of Naples Prepared by: Trebilcock Consulting Solutions, PA 2614 Tamiami Trail N, Suite 615 1205
Traffic Impact Statement (TIS) Vincentian PUDA Collier County, FL 10/18/2013 Prepared for: Global Properties of Naples Prepared by: Trebilcock Consulting Solutions, PA 2614 Tamiami Trail N, Suite 615 1205
King Soopers #116 Thornton, Colorado
 Traffic Impact Study King Soopers #116 Thornton, Colorado Prepared for: Galloway & Company, Inc. T R A F F I C I M P A C T S T U D Y King Soopers #116 Thornton, Colorado Prepared for Galloway & Company
To: File From: Adrian Soo, P. Eng. Markham, ON File: Date: August 18, 2015
 Memo To: From: Adrian Soo, P. Eng. Markham, ON : 165620021 Date: Reference: E.C. Row Expressway, Dominion Boulevard Interchange, Dougall Avenue Interchange, and Howard 1. Review of Interchange Geometry
2.0 Development Driveways. Movin Out June 2017
 Movin Out June 2017 1.0 Introduction The proposed Movin Out development is a mixed use development in the northeast quadrant of the intersection of West Broadway and Fayette Avenue in the City of Madison.
IMPROVEMENT CONCEPTS
 IMPROVEMENT CONCEPTS for the South Novato Transit Hub Study Prepared by: January 11, 2010 DKS Associates With Wilbur Smith Associates IMPROVEMENT CONCEPTS Chapter 1: Introduction 1. INTRODUCTION The strategic
TIMBERVINE TRANSPORTATION IMPACT STUDY FORT COLLINS, COLORADO JANUARY Prepared for:
 TIMBERVINE TRANSPORTATION IMPACT STUDY FORT COLLINS, COLORADO JANUARY 2014 Prepared for: Hartford Companies 1218 W. Ash Street Suite A Windsor, Co 80550 Prepared by: DELICH ASSOCIATES 2272 Glen Haven Drive
TRAFFIC IMPACT STUDY FOR SONIC DRIVE-IN RESTAURANT. Vallejo, CA. Prepared For:
 TRAFFIC IMPACT STUDY FOR SONIC DRIVE-IN RESTAURANT Vallejo, CA Prepared For: ELITE DRIVE-INS, INC. 2190 Meridian Park Blvd, Suite G Concord, CA 94520 Prepared By: KD Anderson & Associates 3853 Taylor Road,
TRAFFIC SIGNAL DESIGN REPORT KING OF PRUSSIA ROAD & RAIDER ROAD RADNOR TOWNSHIP PENNSYLVANIA
 TRAFFIC SIGNAL DESIGN REPORT KING OF PRUSSIA ROAD & RAIDER ROAD RADNOR TOWNSHIP PENNSYLVANIA PREPARED FOR: UNIVERSITY OF PENNSYLVANIA HEALTH SYSTEM 34 CIVIC CENTER BOULEVARD PHILADELPHIA, PA 1987 (61)
Transit City Etobicoke - Finch West LRT
 Delcan Corporation Transit City Etobicoke - Finch West LRT APPENDIX D Microsimulation Traffic Modeling Report March 2010 March 2010 Appendix D CONTENTS 1.0 STUDY CONTEXT... 2 Figure 1 Study Limits... 2
County State Aid Highway 30 (Diffley Road) and Dodd Road Intersection Study
 and Dodd Road Intersection Study") County State Aid Highway 30 (Diffley Road) and Dodd Road Intersection Study City of Eagan, Dakota County, Minnesota Date: March 2012 Project No. 14957.000 444 Cedar Street, Suite 1500 Saint Paul, MN 55101
County State Aid Highway 30 (Diffley Road) and Dodd Road Intersection Study City of Eagan, Dakota County, Minnesota Date: March 2012 Project No. 14957.000 444 Cedar Street, Suite 1500 Saint Paul, MN 55101
BROWARD BOULEVARD CORRIDOR TRANSIT STUDY
 BROWARD BOULEVARD CORRIDOR TRANSIT STUDY FM # 42802411201 EXECUTIVE SUMMARY July 2012 GOBROWARD Broward Boulevard Corridor Transit Study FM # 42802411201 Executive Summary Prepared For: Ms. Khalilah Ffrench,
MONTEREY BAY AQUARIUM RESEARCH INSTITUTE (MBARI) MASTER PLAN UPDATE MOSS LANDING, CALIFORNIA
 MASTER PLAN UPDATE MOSS LANDING, CALIFORNIA") MONTEREY BAY AQUARIUM RESEARCH INSTITUTE (MBARI) MASTER PLAN UPDATE MOSS LANDING, CALIFORNIA TRAFFIC IMPACT ANALYSIS Administrative Draft Report Prepared For Monterey Bay Aquarium Research Institute Moss
MONTEREY BAY AQUARIUM RESEARCH INSTITUTE (MBARI) MASTER PLAN UPDATE MOSS LANDING, CALIFORNIA TRAFFIC IMPACT ANALYSIS Administrative Draft Report Prepared For Monterey Bay Aquarium Research Institute Moss
RICHMOND OAKS HEALTH CENTRE 6265 PERTH STREET OTTAWA, ONTARIO TRANSPORTATION BRIEF. Prepared for: Guycoki (Eastern) Limited.
 Limited.") RICHMOND OAKS HEALTH CENTRE 6265 PERTH STREET OTTAWA, ONTARIO TRANSPORTATION BRIEF Prepared for: Guycoki (Eastern) Limited June 16, 2016 116-638 Brief_1.doc D. J. Halpenny & Associates Ltd. Consulting
RICHMOND OAKS HEALTH CENTRE 6265 PERTH STREET OTTAWA, ONTARIO TRANSPORTATION BRIEF Prepared for: Guycoki (Eastern) Limited June 16, 2016 116-638 Brief_1.doc D. J. Halpenny & Associates Ltd. Consulting
Bennett Pit. Traffic Impact Study. J&T Consulting, Inc. Weld County, Colorado. March 3, 2017
 Bennett Pit Traffic Impact Study J&T Consulting, Inc. Weld County, Colorado March 3, 217 Prepared By: Sustainable Traffic Solutions, Inc. http://www.sustainabletrafficsolutions.com/ Joseph L. Henderson,
Alpine Highway to North County Boulevard Connector Study
 Alpine Highway to North County Boulevard Connector Study prepared by Avenue Consultants March 16, 2017 North County Boulevard Connector Study March 16, 2017 Table of Contents 1 Summary of Findings... 1
BARRHAVEN FELLOWSHIP CRC 3058 JOCKVALE ROAD OTTAWA, ONTARIO TRANSPORTATION BRIEF. Prepared for:
 BARRHAVEN FELLOWSHIP CRC 3058 JOCKVALE ROAD OTTAWA, ONTARIO TRANSPORTATION BRIEF Prepared for: Barrhaven Fellowship CRC 3058 Jockvale Road Ottawa, ON K2J 2W7 December 7, 2016 116-649 Report_1.doc D. J.
V. DEVELOPMENT OF CONCEPTS
 Martin Luther King, Jr. Drive Extension FINAL Feasibility Study Page 9 V. DEVELOPMENT OF CONCEPTS Throughout the study process several alternative alignments were developed and eliminated. Initial discussion
TRAFFIC IMPACT ANALYSIS FOR. McDONALD S RESTAURANT IN CARMICAEL Sacramento County, CA. Prepared For:
 TRAFFIC IMPACT ANALYSIS FOR McDONALD S RESTAURANT IN CARMICAEL Sacramento County, CA Prepared For: McDonald s USA, LLC Pacific Sierra Region 2999 Oak Road, Suite 900 Walnut Creek, CA 94597 Prepared By:
INDUSTRIAL DEVELOPMENT
 INDUSTRIAL DEVELOPMENT Traffic Impact Study Plainfield, Illinois August 2018 Prepared for: Seefried Industrial Properties, Inc. TABLE OF CONTENTS Executive Summary 2 Introduction 3 Existing Conditions
Section 5.0 Traffic Information
 Section 5.0 Traffic Information 10.0 TRANSPORTATION MDM Transportation Consultants, Inc. (MDM) has prepared an evaluation of transportation impacts for the proposed evaluation for the expansion of the
MERIVALE PRIORITY SQUARE 2852 MERIVALE ROAD CITY OF OTTAWA TRANSPORTATION BRIEF. Prepared for: ONT Inc. 25 Winding Way Nepean, Ontario K2C 3H1
 MERIVALE PRIORITY SQUARE 2852 MERIVALE ROAD CITY OF OTTAWA TRANSPORTATION BRIEF Prepared for: 2190986ONT Inc. 25 Winding Way Nepean, Ontario K2C 3H1 October 6, 2010 110-502 Report_1.doc D. J. Halpenny
Interstate Operations Study: Fargo-Moorhead Metropolitan Area Simulation Results
 NDSU Dept #2880 PO Box 6050 Fargo, ND 58108-6050 Tel 701-231-8058 Fax 701-231-6265 www.ugpti.org www.atacenter.org Interstate Operations Study: Fargo-Moorhead Metropolitan Area 2025 Simulation Results
Traffic Impact Analysis 5742 BEACH BOULEVARD MIXED USE PROJECT
 Traffic Impact Analysis 5742 BEACH BOULEVARD MIXED USE PROJECT CITY OF BUENA PARK Prepared by Project No. 14139 000 April 17 th, 2015 DKS Associates Jeffrey Heald, P.E. Rohit Itadkar, T.E. 2677 North Main
Evaluation Considerations and Geometric Nuances of Reduced Conflict U-Turn Intersections (RCUTs)
") Evaluation Considerations and Geometric Nuances of Reduced Conflict U-Turn Intersections (RCUTs) 26 th Annual Transportation Research Conference Saint Paul RiverCentre May 20, 2015 Presentation Outline
Evaluation Considerations and Geometric Nuances of Reduced Conflict U-Turn Intersections (RCUTs) 26 th Annual Transportation Research Conference Saint Paul RiverCentre May 20, 2015 Presentation Outline
4.14 TRANSPORTATION AND CIRCULATION
 4.14 TRANSPORTATION AND CIRCULATION 4.14.1 Summary Table 4.14-1 summarizes the identified environmental impacts, proposed mitigation measures, and residual impacts of the proposed project with regard to
GASOLINE SERVICE STATION 1618, 1622 ROGER STEVENS DRIVE OTTAWA, ONTARIO TRANSPORTATION IMPACT ASSESSMENT. Prepared for:
 GASOLINE SERVICE STATION 1618, 1622 ROGER STEVENS DRIVE OTTAWA, ONTARIO TRANSPORTATION IMPACT ASSESSMENT Prepared for: Invecta Development (Ottawa) Corporation 758 Shanks Height Milton, ON L9T 7P7 May
Downtown One Way Street Conversion Technical Feasibility Report
 Downtown One Way Street Conversion Technical Feasibility Report As part of the City s Transportation Master Plan, this report reviews the technical feasibility of the proposed conversion of the current
RE: A Traffic Impact Statement for a proposed development on Quinpool Road
 James J. Copeland, P.Eng. GRIFFIN transportation group inc. 30 Bonny View Drive Fall River, NS B2T 1R2 May 31, 2018 Ellen O Hara, P.Eng. Project Engineer DesignPoint Engineering & Surveying Ltd. 200 Waterfront
Quantitative analyses of weekday a.m. and p.m. commuter hour conditions have been conducted for the following five scenarios:
 6.1 TRANSPORTATION AND CIRCULATION 6.1.1 INTRODUCTION This section of the EIR presents the results of TJKM s traffic impact analysis of the proposed Greenbriar Development. The analysis includes consideration
Lacey Gateway Residential Phase 1
 Lacey Gateway Residential Phase Transportation Impact Study April 23, 203 Prepared for: Gateway 850 LLC 5 Lake Bellevue Drive Suite 02 Bellevue, WA 98005 Prepared by: TENW Transportation Engineering West
INTERSECTION CONTROL EVALUATION
 INTERSECTION CONTROL EVALUATION Trunk Highway 22 and CSAH 21 (E Hill Street/Shanaska Creek Road) Kasota, Le Sueur County, Minnesota November 2018 Trunk Highway 22 and Le Sueur CSAH 21 (E Hill Street/Shanaska
Existing Traffic Conditions
 May 14, 2014 Ms. Lorraine Weiss City of San Mateo 330 West 20 th Avenue San Mateo, CA 94403 Subject: Traffic Operational Study for the Proposed Tilton Avenue Residential Development in San Mateo, California
Clean Harbors Canada, Inc.
 Clean Harbors Canada, Inc. Proposed Lambton Landfill Expansion Environmental Assessment Terms of Reference Transportation Assessment St. Clair Township, Ontario September 2009 itrans Consulting Inc. 260
West Hills Shopping Centre Lowe s Expansion Traffic Impact Study
 West Hills Shopping Centre Lowe s Expansion Traffic Impact Study Prepared for: Armel Corporation January 2015 Paradigm Transportation Solutions Ltd. 22 King Street South, Suite 300 Waterloo ON N2J 1N8
Traffic Impact Analysis. Alliance Cole Avenue Residential Site Dallas, Texas. Kimley-Horn and Associates, Inc. Dallas, Texas.
 Traffic Impact Analysis Alliance Cole Avenue Residential Site Dallas, Texas February 15, 2018 Kimley-Horn and Associates, Inc. Dallas, Texas Project #064524900 Registered Firm F-928 Traffic Impact Analysis
Technical Feasibility Report
 Prepared For: Bow Concord I-93 Improvements Project Bow and Concord, NH Prepared By: 53 Regional Drive Concord, NH 03301 NHDOT Project # 13742 Federal Project #T-A000(018) September 2018 TABLE OF CONTENTS
Interstate Operations Study: Fargo-Moorhead Metropolitan Area Simulation Output
 NDSU Dept #2880 PO Box 6050 Fargo, ND 58108-6050 Tel 701-231-8058 Fax 701-231-6265 www.ugpti.org www.atacenter.org Interstate Operations Study: Fargo-Moorhead Metropolitan Area 2015 Simulation Output Technical
Table Existing Traffic Conditions for Arterial Segments along Construction Access Route. Daily
 5.8 TRAFFIC, ACCESS, AND CIRCULATION This section describes existing traffic conditions in the project area; summarizes applicable regulations; and analyzes the potential traffic, access, and circulation
TRAFFIC AND TRANSPORTATION TECHNICAL MEMORANDUM
 TRAFFIC AND TRANSPORTATION TECHNICAL MEMORANDUM for ENVIRONMENTAL ASSESSMENT US 460 Bypass Interchange and Southgate Drive Relocation State Project No.: 0460-150-204, P101, R201, C501, B601; UPC 99425
CHAPTER 9: VEHICULAR ACCESS CONTROL Introduction and Goals Administration Standards
 9.00 Introduction and Goals 9.01 Administration 9.02 Standards 9.1 9.00 INTRODUCTION AND GOALS City streets serve two purposes that are often in conflict moving traffic and accessing property. The higher
I-820 (East) Project Description. Fort Worth District. Reconstruct Southern I-820/SH 121 Interchange
 Project Description. Fort Worth District. Reconstruct Southern I-820/SH 121 Interchange") I-820 (East) Project Description Fort Worth District Reconstruct Southern I-820/SH 121 Interchange I-820 from approximately 2,000 feet north of Pipeline Road/Glenview Drive to approximately 3,200 feet
I-820 (East) Project Description Fort Worth District Reconstruct Southern I-820/SH 121 Interchange I-820 from approximately 2,000 feet north of Pipeline Road/Glenview Drive to approximately 3,200 feet
Ryan Coyne, PE City Engineer City of Rye 1051 Boston Post Road Rye, NY Boston Post Road Realignment and Roundabout Design Report
 March 6, 2015 Ryan Coyne, PE City Engineer City of Rye 1051 Boston Post Road Rye, NY 10580 RE: JMC Project 14108 Boston Post Road Roundabout Boston Post Road and Parsons Street City of Rye, NY Dear Ryan:
PROJECT: Wilkinson Road Corridor Improvement Traffic Management Planning Project SUBJECT: Traffic Analysis
 TECHNICAL MEMORANDUM DATE: September 10, 2014 PROJECT 5861.03 NO: PROJECT: Wilkinson Road Corridor Improvement Traffic Management Planning Project SUBJECT: Traffic Analysis TO: Steve Holroyd - District
Traffic Impact Study for Proposed Olive Boulevard Development
 Traffic Impact Study for Proposed 11330 Olive Boulevard Development Creve Coeur, Missouri July 7, 2017 Prepared For: 11330 Olive Boulevard Development 11330 Olive Boulevard Creve Coeur, Missouri 63141
APPENDIX B Traffic Analysis
 APPENDIX B Traffic Analysis Rim of the World Unified School District Reconfiguration Prepared for: Rim of the World School District 27315 North Bay Road, Blue Jay, CA 92317 Prepared by: 400 Oceangate,
DRAFT TRANSPORTATION IMPACT STUDY CASTILIAN REDEVELOPMENT PROJECT
 DRAFT TRANSPORTATION IMPACT STUDY CASTILIAN REDEVELOPMENT PROJECT Prepared for: Submitted by: 299 Lava Ridge Ct. Suite 2 Roseville, CA. 95661 June 212 TABLE OF CONTENTS 1. Introduction... 1 Project Location
Proposed location of Camp Parkway Commerce Center. Vicinity map of Camp Parkway Commerce Center Southampton County, VA
 Proposed location of Camp Parkway Commerce Center Vicinity map of Camp Parkway Commerce Center Southampton County, VA Camp Parkway Commerce Center is a proposed distribution and industrial center to be
INTERCHANGE OPERTIONS STUDY Interstate 77 / Wallings Road Interchange
 INTERCHANGE OPERTIONS STUDY Interstate 77 / Wallings Road Interchange City of Broadview Heights, Cuyahoga County, Ohio Prepared For: City of Broadview Heights Department of Engineering 9543 Broadview Road
Traffic Impact Study Speedway Gas Station Redevelopment
 Traffic Impact Study Speedway Gas Station Redevelopment Warrenville, Illinois Prepared For: Prepared By: April 11, 2018 Table of Contents 1. Introduction... 1 2. Existing Conditions... 4 Site Location...
The key roadways in the project vicinity are described below. Exhibit displays the existing number of lanes on the study roadways.
 4.2 TRAFFIC AND CIRCULATION This section presents the key assumptions, methods, and results of analysis for the transportation and circulation impacts of the proposed project. This section is based on
Harlem Avenue between 63 rd and 65 th
 Harlem Avenue between 63 rd and 65 th Community Advisory Group Meeting #3 December 1, 2017 Bedford Park Public Library 1 Meeting Agenda 1. Welcome/Introductions (3 mins) 2. Project Overview and Re-Cap
Shirk Road at State Route 198 Interchange Analysis Tulare County, California
 Shirk Road at State Route 198 Interchange Analysis Tulare County, California DRAFT REPORT Prepared By Tulare County Association of Governments (TCAG) April 2013 Table of Contents Introduction:... 3 Project
County State Aid Highway 32 (Cliff Road) and Dodd Road Intersection Study
 and Dodd Road Intersection Study") County State Aid Highway 32 (Cliff Road) and Dodd Road Intersection Study City of Eagan, Dakota County, Minnesota Date: March 2012 Project No. 14957.000 444 Cedar Street, Suite 1500 Saint Paul, MN 55101
County State Aid Highway 32 (Cliff Road) and Dodd Road Intersection Study City of Eagan, Dakota County, Minnesota Date: March 2012 Project No. 14957.000 444 Cedar Street, Suite 1500 Saint Paul, MN 55101
ZINFANDEL LANE / SILVERADO TRAIL INTERSECTION TRAFFIC ANALYSIS
 ZINFANDEL LANE / SILVERADO TRAIL INTERSECTION TRAFFIC ANALYSIS UPDATED TRAFFIC STUDY FOR THE PROPOSED RAYMOND VINEYARDS WINERY USE PERMIT MODIFICATION #P11-00156 AUGUST 5, 2014 PREPARED BY: OMNI-MEANS,
Traffic Impact Analysis West Street Garden Plots Improvements and DuPage River Park Garden Plots Development Naperville, Illinois
 Traffic Impact Analysis West Street Garden Plots Improvements and DuPage River Park Garden Plots Development Naperville, Illinois Submitted by April 9, 2009 Introduction Kenig, Lindgren, O Hara, Aboona,
Appendix C-5: Proposed Refinements Rail Operations and Maintenance Facility (ROMF) Traffic Impact Analysis. Durham-Orange Light Rail Transit Project
 Traffic Impact Analysis. Durham-Orange Light Rail Transit Project") Appendix C-5: Proposed Refinements Rail Operations and Maintenance Facility (ROMF) Traffic Impact Analysis Durham-Orange Light Rail Transit Project July 25, 218 ROMF Transportation Impact Analysis Version
Appendix C-5: Proposed Refinements Rail Operations and Maintenance Facility (ROMF) Traffic Impact Analysis Durham-Orange Light Rail Transit Project July 25, 218 ROMF Transportation Impact Analysis Version
L1TILE BEARS DAY CARE TRANSPORTATION IMPACT STUDY FORT COLLINS, COLORADO MAY Prepared for:
 L1TILE BEARS DAY CARE TRANSPORTATION IMPACT STUDY FORT COLLINS, COLORADO MAY 2012 Prepared for: Hillside Construction, Inc. 216 Hemlock Street, Suite B Fort Collins, CO 80534 Prepared by: DELICH ASSOCIATES
Access Management Standards
 Access Management Standards This section replaces Access Control Standards on Page number 300-4 of the Engineering Standards passed February 11, 2002 and is an abridged version of the Access Management
Traffic Analysis for Bon Air Bridge Mitigation Magnolia Storm Water Quality Project
 Memo To: Paul DiDonato, ATI Architects and Engineers From: David Parisi, PE and Ashley Tam, EIT Date: February 23, 216 Subject: Traffic Analysis for Bon Air Bridge Mitigation Magnolia Storm Water Quality
TALMONT TOWNHOMES MADISON KENNETH SPA TRAFFIC IMPACT STUDY. Sacramento, CA. Prepared For: MBK Homes. Prepared By:
 TALMONT TOWNHOMES MADISON KENNETH SPA TRAFFIC IMPACT STUDY Sacramento, CA Prepared For: MBK Homes Prepared By: KD Anderson & Associates 3853 Taylor Road, Suite G Loomis, California 95650 (916) 660-1555
The Design-Builder shall meet local road criteria provided by the local governing agencies.
 11 ROADWAYS 11.1 General The -Builder shall conduct all Work necessary to meet the requirements of roadways. Roadway classifications include mainline, acceleration lanes, deceleration lanes, auxiliary
FINAL. Sound Transit Long-Range Plan Update. Issue Paper S.1: Tacoma Link Integration with Central Link. Prepared for: Sound Transit
 Sound Transit Long-Range Plan Update Issue Paper S.1: Tacoma Link Integration with Central Link Prepared for: Sound Transit Prepared by: Quade & Douglas, Inc. FINAL March 2005 Foreword This issue paper
TRANSPORTATION REVIEW
 TRANSPORTATION REVIEW - PROPOSED MIX OF LAND USES IS CONSISTENT WITH THE CITY S UNDER THE GRANVILLE BRIDGE POLICIES THAT AIM TO MEET NEIGHBOURING RESIDENTS SHOPPING NEEDS AND REDUCE RELIANCE ON AUTOMOBILE
Escondido Marriott Hotel and Mixed-Use Condominium Project TRAFFIC IMPACT ANALYSIS REPORT
 Escondido Marriott Hotel and Mixed-Use Condominium Project TRAFFIC IMPACT ANALYSIS REPORT Prepared for Phelps Program Management 420 Sixth Avenue, Greeley, CO 80632 Prepared by 5050 Avenida Encinas, Suite
Task 5.1: Existing Conditions Review and Analysis
 City of Oceanside Coast Highway Corridor Task 5.1: Existing Conditions Review and Analysis Technical Memorandum August 2014 DOCUMENT CONTROL Client: Project Name: Report Title: City of Oceanside City of
Table of Contents INTRODUCTION... 3 PROJECT STUDY AREA Figure 1 Vicinity Map Study Area... 4 EXISTING CONDITIONS... 5 TRAFFIC OPERATIONS...
 Crosshaven Drive Corridor Study City of Vestavia Hills, Alabama Table of Contents INTRODUCTION... 3 PROJECT STUDY AREA... 3 Figure 1 Vicinity Map Study Area... 4 EXISTING CONDITIONS... 5 TRAFFIC OPERATIONS...
Table 1 - Land Use Comparisons - Proposed King s Wharf Development. Retail (SF) Office (SF) 354 6,000 10, Land Uses 1
 Office (SF) 354 6,000 10, Land Uses 1") Ref. No. 171-6694 Phase 2 November 23, 217 Mr. David Quilichini, Vice President Fares & Co. Developments Inc. 31 Place Keelson Sales Centre DARTMOUTH NS B2Y C1 Sent Via Email to David@faresinc.com RE:
Ref. No. 171-6694 Phase 2 November 23, 217 Mr. David Quilichini, Vice President Fares & Co. Developments Inc. 31 Place Keelson Sales Centre DARTMOUTH NS B2Y C1 Sent Via Email to David@faresinc.com RE:
Letter of Transmittal
 Letter of Transmittal To: Chris Lovell City of Richmond Hill Date: 5/2/6 Job 2582 Re: Richmond Hill-South Bryan County Transportation STudy WE ARE SENDING YOU THE FOLLOWING ITEMS ( attached) ( under separate
MILLERSVILLE PARK TRAFFIC IMPACT ANALYSIS ANNE ARUNDEL COUNTY, MARYLAND
 MILLERSVILLE PARK TRAFFIC IMPACT ANALYSIS ANNE ARUNDEL COUNTY, MARYLAND Prepared for: Department of Public Works Anne Arundel County Prepared by: URS Corporation 4 North Park Drive, Suite 3 Hunt Valley,
Table of Contents. Traffic Impact Analysis Capital One Building at Schilling Place
 Traffic Impact Analysis Capital One Building at Schilling Place Table of Contents Executive Summary... 1 1. Introduction... 4 2. Project Description... 4 3. Background Information... 4 4. Study Scope...
Traffic Impact Study Proposed Residential Development (Watson Parkway North - Starwood Drive Node, City of Guelph)
") Traffic Impact Study Proposed Residential Development (Watson Parkway North - Starwood Drive Node, City of Guelph) Prepared By: 332 Lorne Avenue East Stratford ON N5A 6S4 Prepared for: Paul Kemper, President
Traffic Impact Study Proposed Residential Development (Watson Parkway North - Starwood Drive Node, City of Guelph) Prepared By: 332 Lorne Avenue East Stratford ON N5A 6S4 Prepared for: Paul Kemper, President
Section 5.8 Transportation and Traffic
 Section 5.8 Transportation and Traffic 5.8 TRANSPORTATION AND TRAFFIC Generous This Section is based on the Topgolf Specific Plan Traffic Impact Analysis (RK Engineering Group, Inc., October 31, 2016);
Transportation & Traffic Engineering
 Transportation & Traffic Engineering 1) Project Description This report presents a summary of findings for a Traffic Impact Analysis (TIA) performed by A+ Engineering, Inc. for the Hill Country Family
Proposed Inn at Bellefield Traffic Impact Assessment
 Proposed Inn at Bellefield Traffic Impact Assessment Town of Hyde Park Dutchess County, New York Prepared for: T-Rex Hyde Park Owner LLC 500 Mamroneck Avenue, Suite 300 Harrison, NY 10528 June 21, 2017
TABLE OF CONTENTS SECTION PAGE. Executive Summary... xii
 TABLE OF CONTENTS SECTION PAGE Executive Summary... xii 1.0 Introduction... 1 1.1 Study Area... 2 1.2 Traffic Impact Analysis Scenarios... 4 1.3 Study Area - City of Orange... 4 2.0 Project Description
Appendix 5. Haymeadow Interim Traffic Analysis
 Appendix 5 Haymeadow Interim Traffic Analysis 20 MEMORANDUM To: From: Rick Pylman Gary Brooks Bill Fox Date: September 15, 2016 Project: Subject: Haymeadow Evaluation of interim access configuration Currently
Oakbrook Village Plaza City of Laguna Hills
 Oakbrook Village Plaza City of Laguna Hills Traffic Impact Analysis Prepared by: HDR Engineering 3230 El Camino Real, Suite 200 Irvine, CA 92602 October 2012 Revision 3 D-1 Oakbrook Village Plaza Laguna
LCPS Valley Service Center
 Traffic Impact Study LCPS Valley Service Center Loudoun County, Virginia November 4, 2015 Prepared For: Loudoun County Public Schools 21000 Education Court Ashburn, VA 20148 Prepared by: 1140 Connecticut
South Lexington Transportation Study Lexington, Massachusetts
 South Lexington Transportation Study Lexington, Massachusetts Preliminary Findings and Options for Consideration Businesses Meeting 10/10/13 Town of Lexington Engineering and Planning Departments Meeting
RTE. 1 at RTE. 637 & RTE. 639
 INTERSECTION SAFETY STUDY Prepared for: Virginia Department of Transportation Central Region Operations Traffic Engineering (UPC #81378, TO 12-092) DAVENPORT Project Number: 13-368 / /2014 RTE. 1 at RTE.
One Harbor Point Residential
 Residential Gig Harbor, WA Transportation Impact Analysis January 23, 2017 Prepared for: Neil Walter Company PO Box 2181 Tacoma, WA 98401 Prepared by: TENW Transportation Engineering NorthWest 11400 SE
TRAFFIC IMPACT ANALYSIS FOR. STERLING FIFTH STREET APARTMENTS PROJECT Davis, CA. Prepared For:
 TRAFFIC IMPACT ANALYSIS FOR STERLING FIFTH STREET APARTMENTS PROJECT Davis, CA Prepared For: Din/Cal 3, Inc. 3411 Richmond Avenue, Suite 200 Houston, Texas 77046 Prepared By: KD Anderson & Associates,
Functional Design Report
 Presented to: City of Beverly MassDOT Highway Division Rte 128 Exit 19 Interchange Improvements Project Beverly, MA Functional Design Report May 30, 2014 Submitted by: Jacobs 343 Congress Street Boston,
LATSON INTERCHANGE DEVELOPMENT TRAFFIC STUDIES. Genoa Township, Livingston County, MI
 LATSON INTERCHANGE DEVELOPMENT TRAFFIC STUDIES Genoa Township, Livingston County, MI DRAFT TRAFFIC STUDY FOR I-96 AT LATSON RD INTERCHANGE Livingston County CS 47065 JN 101622C Submitted to: Michigan Department
SANTA BARBARA COUNTY ASSOCIATION OF GOVERNMENTS GOLETA RAMP METERING STUDY MAY 8, 2018 FINAL REPORT
 SANTA BARBARA COUNTY ASSOCIATION OF GOVERNMENTS GOLETA RAMP METERING STUDY MAY 8, 2018 FINAL REPORT May 8, 2018 Page i TABLE OF CONTENTS Table of Contents... i 1. Introduction... 1 1.1 Summary... 1 2.