700 Hunt Club Road. Transportation Impact Study. Submitted by:
|
|
|
- Betty Morris
- 5 years ago
- Views:
Transcription


1 700 Hunt Club Road Transportation Impact Study Submitted by: December 2012
2 700 Hunt Club Road Transportation Impact Study prepared for: Lone Star Group of Companies 472 Morden Road Unit 101 Oakville, ON L6K 3W4 prepared by: 1223 Michael Street Suite 100 Ottawa, ON K1J 7T2 December 18, 2012 TO3112TOR00
3 700 Hunt Club Road Transportation Impact Study December 2012 TABLE OF CONTENTS 1. Introduction Existing Conditions Study Area Area Road Network Pedestrian/Cycling Network Transit Network Existing Study Area Intersections Existing Study Area Intersections Existing Intersection Operations Existing Road Safety Conditions Demand Forecasting Planned Study Area Transportation Network Changes Other Area Development Background Traffic Growth Site Trip Generation Vehicle Traffic Distribution and Assignment Future Traffic Operations Projected 2014 Conditions at Full Site Development Projected 2019 Conditions at Five Years beyond Site Build Out Neighbourhood Impacts Site Plan Review Transportation Demand Management Findings and Recommendations List of Figures Figure 1: Local Context... 1 Figure 2: Proposed Site Plan/Landscape Plan... 2 Figure 3: Area Transit Network... 4 Figure 4: Existing Peak Hour Traffic Volumes... 7 Figure 5: Projected 2014 Baseline Traffic Volumes Figure 6: Projected 2019 Baseline Traffic Volumes Figure 7: New Site-Generated Traffic Volumes Figure 8: Site-Generated Pass-by Traffic Volumes Figure 9: Total Projected 2014 Peak Hour Traffic Volumes Figure 10: Total Projected 2019 Peak Hour Traffic Volumes... 17
4 700 Hunt Club Road Transportation Impact Study December 2012 List of Tables Table 1: Existing Performance at Study Area Intersections... 8 Table 2: Hunt Club/Paul Anka Historical Background Growth ( ) Table 3: ITE Trip Generation Rates Table 4: Modified Person Trip Generation Table 5: Hotel Modal Site Trip Generation Table 6: Medical/Retail Building Modal Site Trip Generation Table 7: Sit-Down Restaurant Modal Site Trip Generation Table 8: Restaurant with Drive-Thru Modal Site Trip Generation Table 9: Total Site Vehicle Trip Generation Table 10: Projected 2014 Performance of Study Area Intersections Table 11: Projected 2019 Performance of Study Area Intersections Appendices Appendix A Current Peak Hour Volumes Appendix B SYNCHRO Capacity Analysis: Existing Conditions Appendix C Collision Data and Analysis Appendix D Background Traffic Growth Analysis Appendix E SYNCHRO Capacity Analysis: 2014 Projected Conditions Appendix F SYNCHRO Capacity Analysis: 2019 Projected Conditions Appendix G Turn Lane Warrant Analysis Appendix H SYNCHRO Capacity Analysis: Hunt Club Widening

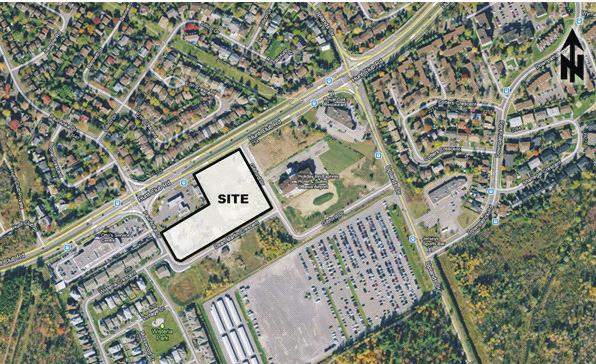
5 700 Hunt Club Road Transportation Impact Study December INTRODUCTION From the information provided, the proponent is applying for a Zoning By-law Amendment and a Site Plan Control Application for the construction of an approximate 74 room hotel, a 15,000 ft 2 medical/retail building, a 7,500 ft 2 sit-down restaurant and a 3,000 ft 2 fast food restaurant on the subject site. The site is located in the southwest quadrant of the Hunt Club/Gibford intersection, which is municipally known as 700 Hunt Club Road. The local context of the site is provided as Figure 1 and the Site Plan is provided as Figure 2. Figure 1: Local Context As part of the Site Plan Approval process, the City of Ottawa requires submission of a formal Transportation Impact Assessment (TIA) consistent with their guidelines dated October With respect to these guidelines for this level of development, a Transportation Impact Study (TIS) is the appropriate type of study for the subject applications. For the purpose of this assessment, horizon years will be analyzed for the year 2014 representing full occupancy, and at the year 2019, which is 5-years beyond full build-out. At the preconsultation meeting, it was agreed with City Staff that the signalized intersections along Hunt Club Road from North Bowesville Road east to the Airport Parkway would be assessed. 1

6 Figure 2: Proposed Site Plan
7 700 Hunt Club Road Transportation Impact Study December EXISTING CONDITIONS 2.1 Study Area The site is located on the south side of Hunt Club Road between Paul Anka Drive and Gibford Drive. The Hunt Club/Paul Anka intersection is currently traffic signal controlled and the Hunt Club/Gibford intersection is restricted to right in/right out with STOP control on the minor approach. The study area limits include the signalized Hunt Club/North Bowesville, Hunt Club/Paul Anka, Hunt Club/Uplands, Hunt Club/McCarthy and the Hunt Club/Airport Parkway intersections. Also included in the following analysis, are the unsignalized Gibford/Hunt Club and Gibford/Uplands intersections. As depicted in Figure 2, the site will be accessed by three full-movement connections; one to Paul Anka Drive, one to Dean Martin Crescent and one to Gibford Drive. 2.2 Area Road Network Hunt Club Road is an east-west arterial, which extends from Hawthorne Road in the east to Old Richmond Road in the west. Within the study area, Hunt Club Road has a four-lane cross section and auxiliary turn lanes are provided at major intersections. The posted speed limit within the study area is 60 km/h, which increases to 80 km/h approximately 600 m west of the Hunt Club/Paul Anka intersection. Airport Parkway is a north-south arterial, which extends from the Ottawa International Airport in the south to Heron Road in the north, where it continues north as Bronson Avenue. Within the study area, the Airport Parkway has a two-lane cross section and is grade separated from Hunt Club Road. Access between the Airport Parkway and Hunt Club Road is provided by on/off ramps, which are signalized at Hunt Club Road. The posted speed limit along the Airport Parkway is 80 km/h. McCarthy Road is a major north-south collector, which extends from Walkley Road in the north to Hunt Club Road in the south where it continues as Downpatrick Road. Within the study area, McCarthy Road has a two-lane cross section and auxiliary turn lanes are provided at major intersections. The posted speed limit north of Hunt Club Road is 50 km/h and south of Hunt Club Road, the speed limit changes to 40 km/h. Uplands Drive is a collector roadway, with a two-lane cross section and auxiliary turn lanes are provided at major intersections. The posted speed limit on Uplands Drive is 50 km/h. Paul Anka Drive is a collector roadway north of Hunt Club Road and south of Hunt Club Road, it is classified as a local roadway. Within the study area, Paul Anka has a two-lane cross section and auxiliary turn lanes are provided at major intersections. The posted speed limit is noted as 50 km/h. Gibford Drive and Dean Martin Crescent are local roadways with two-lane cross sections. The unposted speed limits are understood to be 50 km/h. 3

8 700 Hunt Club Road Transportation Impact Study December Pedestrian/Cycling Network Sidewalk facilities in the vicinity of the proposed site are provided along both sides of Hunt Club Road, along the west side of Paul Anka Drive and along the east side of Gibford Drive north of Dean Martin Crescent. Bicycle lanes are currently provided in both directions along Hunt Club Road and the Airport Parkway has paved shoulders to serve cyclists along both sides of these roadways. According to the City s 2008 Official Cycling Plan (OCP), Hunt Club Road, Airport Parkway, McCarthy Road and Downpatrick Road are classified as spine or City-wide cycling routes. Bike lanes are proposed on McCarthy Road and Downpatrick Road, which are planned to be implemented by Transit Network Transit service within the vicinity of the site is currently provided by OC Transpo Routes #87, 97, 116, 147, 189 and 199. Bus stops for Routes #116, 147, 189 and 199 are located along Hunt Club Road, approximately 50 to 120 meters north of the proposed development. Bus stops for Routes #87 and 97 are located along Uplands Drive approximately 300 metres east of the proposed development. Figure 3: Area Transit Network Black Routes #87, 116 and 147 provide frequent all-day service and Red Routes #189 and 199 provide weekday morning and afternoon peak hour service only. Regular Route #97 provides service along Uplands Drive after 10pm. 4


9 700 Hunt Club Road Transportation Impact Study December Existing Study Area Intersections Hunt Club/North Bowesville The Hunt Club/North Bowesville intersection is a signalized four-legged intersection. The eastbound approach consists of single left and right-turn lanes and two through lanes. The westbound approach consists of a single left-turn lane, a through lane and a shared through/right-turn lane. The northbound approach consists of a channelized rightturn lane and a shared through/left-turn lane. The southbound approach consists of a single all-movement lane. All movements are permitted at this location. Hunt Club/Paul Anka The Hunt Club/Paul Anka intersection is a signalized four-legged intersection. The west and eastbound approaches both consist of single left and channelized rightturn lanes with two through lanes. The northbound approach consists of a single left-turn lane, a single through lane and a channelized right-turn lane. The southbound approach consists of a single left-turn lane and a shared through/rightturn lane. All movements are permitted at this location. Hunt Club/Uplands The Hunt Club/Uplands intersection is a signalized four-legged intersection. The west and eastbound approaches both consist of two through lanes, single leftturn lanes and single channelized right-turn lanes. The northbound approach consists of single left and right-turn lanes and a single through lane. The southbound approach consists of a single left-turn lane and a shared through/right-turn lane. All movements are permitted at this location. 5


10 700 Hunt Club Road Transportation Impact Study December 2012 Hunt Club/McCarthy The Hunt Club/McCarthy intersection is a signalized four-legged intersection. The west and eastbound approaches both consist of two through lanes, single leftturn lanes and single channelized right-turn lanes. The northbound approach consists of a single left-turn lane and a shared through/right-turn lane. The southbound approach consists of a single left-turn lane, a single through lane and a channelized right-turn lane. All movements are permitted at this location. Hunt Club/Airport Parkway The Hunt Club/Airport Parkway intersection is a signalized four-legged intersection. The west and eastbound approaches both consist of single left-turn lanes, single through lanes and single shared through/channelized right-turn lanes. The northbound approach consists of a single left-turn lane and a channelized right-turn lane. The southbound approach consists of two left-turn lanes and a channelized STOP controlled right-turn lane. Northbound and southbound through movements are not permitted. Hunt Club/Gibford The Hunt Club/Gibford intersection is a right-in/right-out unsignalized T intersection with STOP control on the minor northbound approach only. The eastbound approach consists of a through lane and a shared through/right-turn lane. The westbound approach consists of two through lanes. The northbound approach consists of a single right-turn lane. The westbound left-turn movement is not permitted as no median break is provided at this location. 6

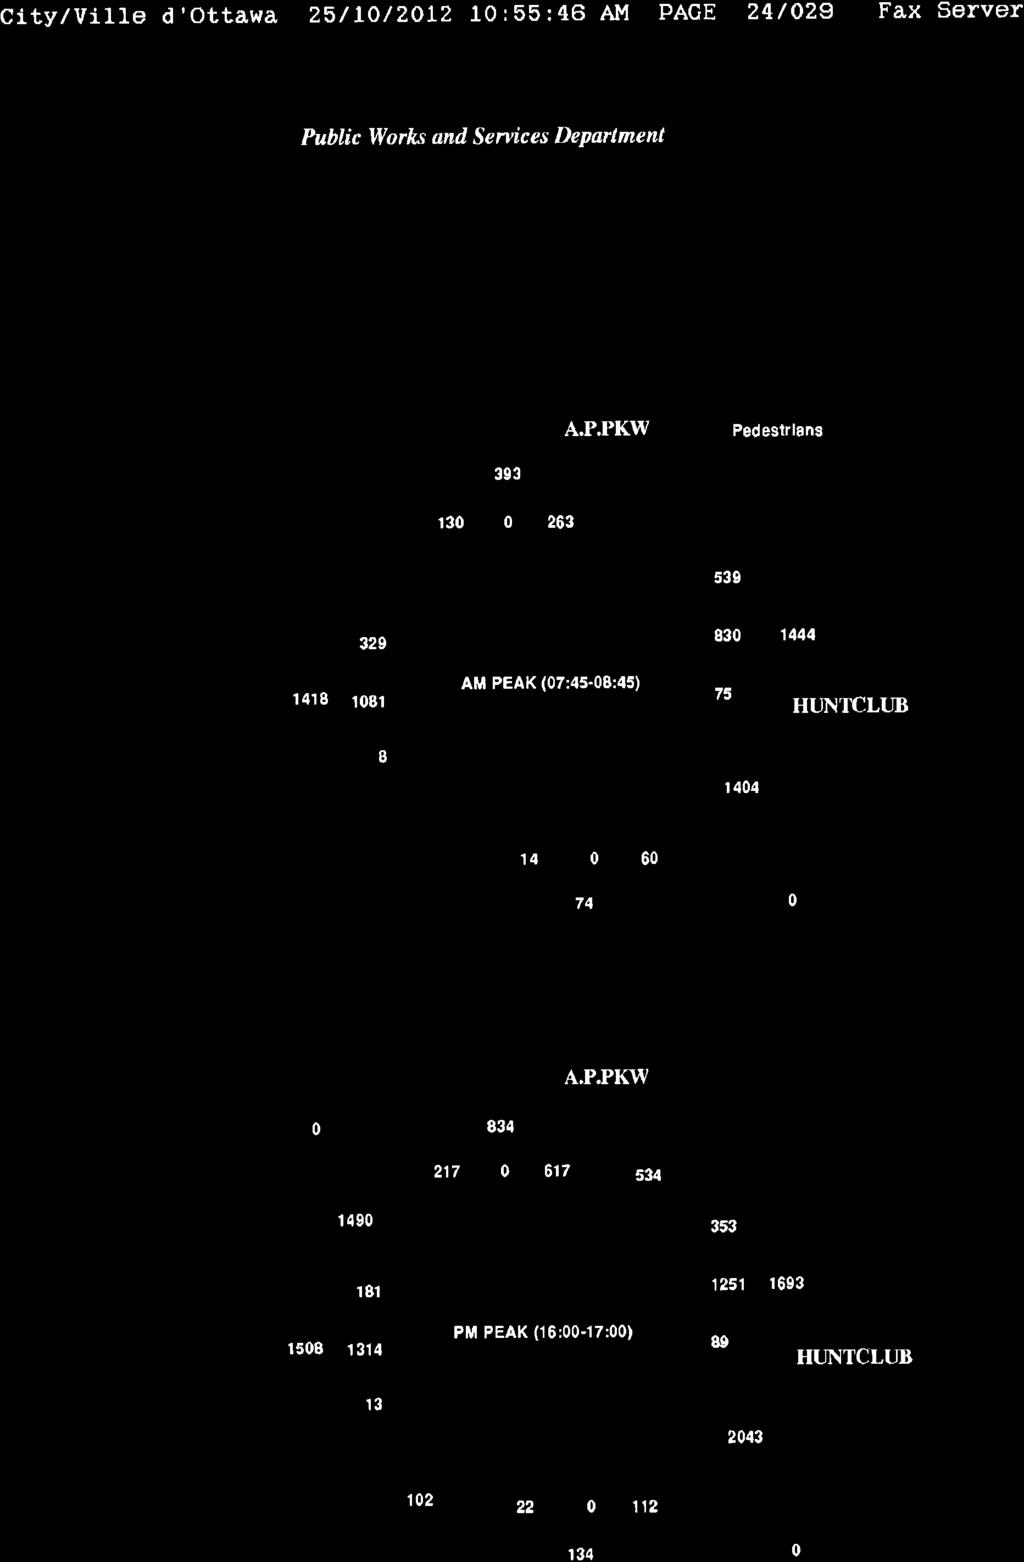
11 STOP STOP 700 Hunt Club Road Transportation Impact Study December 2012 Uplands/Gibford The Uplands/Gibford intersection is an unsignalized T intersection with STOP control on the minor eastbound approach only. A single lane approach is provided for each leg of this intersection with all movements permitted. 2.6 Existing Study Area Intersections Illustrated in Figure 3, are the most recent weekday morning and afternoon peak hour traffic volumes obtained from the City of Ottawa for the Hunt Club/North Bowesville, Hunt Club/Paul Anka, Hunt Club/Uplands, Hunt Club/McCarthy and Hunt Club/Airport Parkway intersections. Existing weekday morning and afternoon peak hour traffic volumes, also illustrated in Figure 3, were collected by Delcan in the month of November 2012 at the Gibford/Uplands and Gibford/Hunt Club intersections. These peak hour traffic volumes are included as Appendix A. Figure 4: Existing Peak Hour Traffic Volumes McCarthy 2(14) 5(3) 2(11) 18(18) 1185(1213) 236(104) 2(7) 1022(981) 85(7) 36(23) 7(15) 27(6) 34(44) 1122(1209) 49(50) 111(171) 53(54) 21(17) 52(19) 13(17) 1111(1161) 55(106) 1201(1234) 10(11) Site 10(11) 10(7) 1179(1284) 25(4) 18(18) 49(43) 18(32) 969(1070) 194(242) 224(246) 63(51) 35(37) 8(11) 728(898) 11(24) 33(32) 17(34) 232(238) 40(44) 1126(1206) 19(15) 26(10) 27(15) 107(49) 133(309) 807(1058) 56(134) 130(217) 263(617) 329(181) 1081(1314) 8(13) 14(22) 60(112) 539(353) 830(1251) 75(89) Hunt Club 126(90) 31(42) 10(7) 7(13) 223(266) 20(34) Gibford 3(1) 17(33) 24(29) 322(334) xx (yy) AM Peak Hour Volumes PM Peak Hour Volumes 2.7 Existing Intersection Operations Table 1 provides a summary of existing traffic operations at study area intersections based on the SYNCHRO (V8) traffic analysis software. The subject intersections were assessed in terms of the volume-to-capacity (v/c) ratio and the corresponding Level of Service (LoS) for the critical movement(s). The subject intersections as a whole were assessed based 7
12 700 Hunt Club Road Transportation Impact Study December 2012 on a weighted v/c ratio and the Synchro model output of existing conditions is provided within Appendix B. Table 1: Existing Performance at Study Area Intersections Weekday AM Peak (PM Peak) Critical Movement Intersection as a Whole Intersection max. v/c or LoS avg. delay Movement Delay (s) LoS v/c (s) Hunt Club/N. Bowesville C(F) 0.76(1.42) NBT(NBT) 21.4(51.8) B(D) 0.68(0.84) Hunt Club/Paul Anka A(C) 0.53(0.71) EBT(EBT) 13.1(16.9) A(B) 0.50(0.66) Hunt Club/Gibford A(A) 9.3(9.8) NBR(NBR) 0.0(0.0) - - Gibford/Uplands B(B) 10.2(10.2) EBL(EBL) 0.8(1.0) - - Hunt Club/Uplands C(C) 0.75(0.78) NBL(NBL) 12.9(15.0) A(B) 0.54(0.63) Hunt Club/McCarthy C(D) 0.78(0.88) SBL(EBT) 20.3(23.8) B(D) 0.67(0.81) Hunt Club/Airport Pkwy F(F) 1.05(1.07) WBT(WBT) 45.9(54.8) E(F) 0.94(1.00) Note: Analysis of signalized intersections assumes a PHF of 0.95 and a saturation flow rate of 1800 veh/h/lane. As shown in Table 1, with the exception of the Hunt Club/Airport Pkwy intersection, the signalized study area intersections, as a whole, are currently operating at an acceptable LoS D or better during both peak hours, with respect to the City of Ottawa operating standards of LoS D or better (0.90 > v/c > 0.00). The Hunt Club/Airport Parkway intersection is currently operating at capacity (LoS E ) during the weekday morning peak hour and failing (LoS F ) during the afternoon peak hour. With regard to critical movements at study area intersections, the northbound left-turn at the Hunt Club/North Bowesville intersection is currently failing during the afternoon peak hour. The westbound left-turn at the Hunt Club/Airport Parkway intersection is currently failing in both the morning and afternoon peak hours. All other critical movements at study area intersections are currently operating at an acceptable LoS D or better during peak hours. Field observations at study area intersections confirm these findings. It is noteworthy that particularly during the afternoon peak hour, there are lengthy westbound queues on Hunt Club Road extending from the Hunt Club/Riverside intersection east back through the Hunt Club/North Bowesville intersection. These queues effect the operation of the Hunt Club/North Bowesville intersection, but the issue is not the capacity of this intersection but the failure of the Hunt Club/Riverside intersection. Improved operations are expected at the Hunt Club/Riverside intersection in 2013 with the planned opening of the Strandherd- Armstrong Bridge. 2.8 Existing Road Safety Conditions Collision history for study area roads (2008 to 2011) was obtained from the City of Ottawa. Most collisions (79%) involved only property damage, indicating low impact speeds and 21% were reported as non-fatal. The primary causes of collisions cited by police include 8
13 700 Hunt Club Road Transportation Impact Study December 2012 rear end (56%), turning movement (15%), single vehicle (9%) and angle (9%) type collisions. At intersections within the study area, collisions take place at a rate of 0.51, 0.52, 1.29, 1.03, and 0.85 per million entering vehicles at the Hunt Club/North Bowesville, Hunt Club/Paul Anka, Hunt Club/Uplands, Hunt Club/McCarthy and Hunt Club/Airport Parkway intersections, respectively. Based on the available data, there does not appear to be any safety issues and the roadways within the study area are relatively level and straight sections. The source collision data as provided by the City of Ottawa and the analysis is provided as Appendix C. 3. DEMAND FORECASTING 3.1 Planned Study Area Transportation Network Changes Within the study area, notable transportation network changes include; Strandherd Armstrong Bridge A new Rideau River crossing, linking Strandherd Drive to Earl Armstrong Road is scheduled for completion by 2013 as a Phase 1 project within the City of Ottawa s Transportation Master Plan (TMP). This new crossing will provide much needed relief to the existing Rideau River crossings, such as Hunt Club Road. Airport Parkway Widening The widening of the Airport Parkway from 2 to 4 lanes is scheduled to be implemented in as a Phase 2 City project. The widening of the Airport Parkway will occur from Brookfield Drive in the north to the Ottawa International Airport in the south. Hunt Club Road Widening The widening of Hunt Club Road from 4 to 6 lanes is scheduled to be implemented in as a Phase 3 City project. The widening of Hunt Club Road will occur from Riverside Drive in the west to Bank Street in the east. Bus Rapid Transit To be completed as a Phase 1 City Project, within the vicinity of the site, is the O-Train extension to Riverside South along the existing north-south transitway, with a key transfer station at the South Keys Station. 3.2 Other Area Development Based on the City of Ottawa s Development Application Search tool, there are currently no applications for other area developments in the area of the proposed site. 3.3 Background Traffic Growth Background traffic growth through the immediate study area was determined from the available historical count data (years 2006, 2009 and 2011) provided by the City of Ottawa 9
14 STO P STO P 700 Hunt Club Road Transportation Impact Study December 2012 at the Hunt Club/Paul Anka intersection. Average annual background growth is summarized in Table 2 and detailed analysis is attached as Appendix D. Table 2: Hunt Club/Paul Anka Historical Background Growth ( ) Time Period Percent Annual Change North Leg South Leg East Leg West Leg Overall 8 hrs 1.02% 7.93% 2.98% 3.11% 3.19% AM Peak 5.09% 6.12% 3.12% 2.80% 3.15% PM Peak -0.41% 12.09% 1.72% 1.60% 2.06% As show in Table 2, the Hunt Club/Paul Anka intersection has experienced an approximate overall (weighted average) 3% annual growth in traffic volume in past years. Therefore, for the purpose of this study, the subsequent analysis of future conditions will assume a 3% annual growth rate to account for area development along Hunt Club Road. The resulting future background traffic for the year 2014 (when the site is expected to be fully occupied) and for the horizon year 2019 (5 years after build-out) are depicted in Figures 5 and 6, respectively. Figure 5: Projected 2014 Baseline Traffic Volumes McCarthy 2(14) 5(3) 2(11) 18(18) 1257(1287) 236(104) 2(7) 1084(1041) 85(7) 36(23) 7(15) 27(6) 34(44) 1190(1283) 49(50) 111(171) 53(54) 21(17) 52(19) 13(17) 1179(1232) 55(106) 1274(1309) 10(11) Site 10(11) 10(7) 1251(1362) 25(4) 18(18) 49(43) 18(32) 1028(1135) 194(242) 224(246) 63(51) 35(37) 8(11) 772(953) 11(24) 33(32) 17(34) 232(238) 40(44) 1195(1279) 19(15) 26(10) 27(15) 107(49) 133(309) 856(1122) 56(134) 130(217) 263(617) 329(181) 1147(1394) 8(13) 14(22) 60(112) 539(353) 881(1327) 75(89) Hunt Club 126(90) 31(42) 10(7) 7(13) 223(266) 20(34) Gibford 3(1) 17(33) 24(29) 322(334) xx (yy) AM Peak Hour Volumes PM Peak Hour Volumes 10
15 STO P STO P 700 Hunt Club Road Transportation Impact Study December 2012 Figure 6: Projected 2019 Baseline Traffic Volumes 2(14) 5(3) 2(11) McCarthy 18(18) 1457(1492) 236(104) 2(7) 1257(1207) 85(7) 36(23) 7(15) 27(6) 34(44) 1380(1487) 49(50) 111(171) 53(54) 21(17) 52(19) 13(17) 1366(1428) 55(106) 1477(1518) 10(11) Site 10(11) 10(7) 1450(1579) 25(4) 18(18) 49(43) 18(32) 1192(1316) 194(242) 224(246) 63(51) 35(37) 8(11) 895(1104) 11(24) 33(32) 17(34) 232(238) 40(44) 1385(1483) 19(15) 26(10) 27(15) 107(49) 133(309) 993(1301) 56(134) 130(217) 263(617) 329(181) 1329(1616) 8(13) 14(22) 60(112) 539(353) 1021(1539) 75(89) Hunt Club 126(90) 31(42) 10(7) 7(13) 223(266) 20(34) Gibford 3(1) 17(33) 24(29) 322(334) xx (yy) AM Peak Hour Volumes PM Peak Hour Volumes 3.4 Site Trip Generation The proposed development consists of an approximate 74 room hotel, a 15,000 ft 2 medical/retail building, a 7,500 ft 2 sit-down restaurant and a 3,000 ft 2 fast food restaurant. Appropriate trip generation rates for potential land uses were obtained from the 8 th Edition of the Institute of Transportation Engineers (ITE) Trip Generation Manual and are summarized in Table 3. Table 3: ITE Trip Generation Rates Land Use Hotel Medical Building Specialty Retail Sit-Down Restaurant Restaurant with Drive-Thru Data Source ITE 310 ITE 720 ITE 814 ITE 931 ITE 934 AM Peak T = 0.56(du); ln(t) = 1.24 ln(du) 2.00 T = 2.30(X); T = 1.36(X); T = 1.20(X) n/a; T = 49.35(X); Notes: T = Average Vehicle Trip Ends X = 1000 ft 2 Gross Floor Area du = dwelling units Specialty Retail AM Peak is assumed to be 50% of the PM Peak Trip Rates PM Peak T = 0.59(du); T = 3.46(X); ln(t) = 0.88 ln(x) T = 2.71(X); T = 2.40(X) T = 7.49(X); T = 33.84(X); As ITE trip generation surveys only record vehicle trips and typically reflect highly suburban locations (with little to no access by travel modes other than private automobiles), adjustment factors appropriate to the more urban study area context were applied to attain estimates of person trips for the proposed development. This approach is considered appropriate within the industry for urban infill developments. 11
16 700 Hunt Club Road Transportation Impact Study December 2012 To convert ITE vehicle trip rates to person trips, an auto occupancy factor and a non-auto trip factor were applied to the ITE vehicle trip rates. Our review of available literature suggests that a combined factor of approximately 1.3 is considered reasonable to account for typical North American auto occupancy values of approximately 1.15 and combined transit and non-motorized modal shares of less than 10%. As such, the person trip generation for the proposed site is summarized in Table 4. Table 4: Modified Person Trip Generation AM Peak (persons/h) PM Peak (persons/h) Land Use Area In Out Total In Out Total Hotel 74 du Medical Building 7,500 ft² Specialty Retail 7,500 ft² Sit-Down Restaurant Restaurant with Drive-Thru 7,500 ft² ,000 ft² Total Person Trips Note: 1.3 factor to account for typical North American auto occupancy values of approximately 1.15 and combined transit and non-motorized modal shares of less than 10% The person trips shown in Table 4 for the proposed site were then reduced by modal share values, including a reduction for pass-by trips based on the site s location and proximity to adjacent communities, employment, other shopping uses and transit availability. Modal share and pass-by values for hotel, medical/retail and restaurants land uses within the proposed development are summarized in Tables 5, 6, 7 and 8, respectively, with the total site vehicle trip generation summarized in Table 9. Table 5: Hotel Modal Site Trip Generation Mode AM Peak (persons/h) PM Peak (persons/h) Travel Mode Share In Out Total In Out Total Auto Driver 60% Auto Passenger 25% Transit 10% Non-motorized 5% Total Person Trips 100% Total New Auto Trips
17 700 Hunt Club Road Transportation Impact Study December 2012 Table 6: Medical/Retail Building Modal Site Trip Generation Travel Mode Mode Share AM Peak (persons/h) PM Peak (persons/h) In Out Total In Out Total Auto Driver 55% Auto Passenger 20% Transit 20% Non-motorized 5% Total Person Trips 100% Less Retail 30% Pass-By Total New Auto Trips Table 7: Sit-Down Restaurant Modal Site Trip Generation Travel Mode Mode Share AM Peak (persons/h) PM Peak (persons/h) In Out Total In Out Total Auto Driver 60% Auto Passenger 30% Transit 5% Non-motorized 5% Total Person Trips 100% Less 10% Pass-By Total New Auto Trips Table 8: Restaurant with Drive-Thru Modal Site Trip Generation Mode AM Peak (persons/h) PM Peak (persons/h) Travel Mode Share In Out Total In Out Total Auto Driver 70% Auto Passenger 20% Transit 0% Non-motorized 10% Total Person Trips 100% Less 60% Pass-By Total New Auto Trips
18 700 Hunt Club Road Transportation Impact Study December 2012 The following is a summary of potential two-way vehicle trips to/from the proposed development. Table 9: Total Site Vehicle Trip Generation Land Use AM Peak (veh/h) PM Peak (veh/h) In Out Total In Out Total Hotel Medical/Retail Sit-Down Restaurant Restaurant with Drive-Thru Retail Pass-By (30%) Restaurant Pass-By (10%) Fast Food Restaurant Pass-By (60%) Total New Auto Trips As shown in Table 9, the resulting number of potential new two-way vehicle trips for the proposed development is 100 and 157 veh/h during the weekday morning and afternoon peak hours, respectively. This amounts to an approximate 1% to 5% in increased traffic volumes at the study area intersections. 3.5 Vehicle Traffic Distribution and Assignment Traffic distribution was based on existing volume splits at study area intersections and our knowledge of the surrounding area. The resultant distribution is outlined as follows: 40% to/from the north via Paul Anka Drive, Uplands Drive, McCarthy Road, the Airport Parkway and Riverside Drive; 30% to/from the south via Uplands Drive, the Airport Parkway and Riverside Drive; 15% to/from the east via Hunt Club Road; and 15% to/from the west via Hunt Club Road. 100% New site-generated trips are illustrated in Figure 7 and the site-generated Pass-By trips are illustrated in Figure 8. 14
19 STO P STO P STOP STO P STOP STO P STO P STOP STO P STOP 700 Hunt Club Road Transportation Impact Study December 2012 Figure 7: New Site-Generated Traffic Volumes McCarthy 20(28) 15(27) 11(16) 9(12) 3(4) 9(12) 29(41) 15(27) 2(3) 4(8) 26(37) 15(27) 4(8) 11(16) Site 11(16) 15(26) 2(4) 17(30) 3(4) 23(33) 4(7) 13(23) 6(9) 17(24) 4(8) 6(11) 3(4) 6(8) 3(4) 8(12) Hunt Club 6(11) 6(11) 4(8) 15(26) 3(4) 5(8) 3(4) 9(12) Gibford 7(12) 8(12) xx (yy) AM Peak Hour Volumes PM Peak Hour Volumes Figure 8: Site-Generated Pass-by Traffic Volumes McCarthy -8(-6) 8(6) 8(6) 22(17) 22(17) 4(3) -22(-17) 22(17) 17(13) -17(-13) 13(10) Site 13(10) 17(13) Hunt Club 9(7) 9(7) 17(13) 8(6) Gibford xx (yy) AM Peak Hour Volumes PM Peak Hour Volumes 15
20 STO P STOP STOP STO P STO P 700 Hunt Club Road Transportation Impact Study December FUTURE TRAFFIC OPERATIONS 4.1 Projected 2014 Conditions at Full Site Development Total projected 2014 volumes associated with the proposed development are illustrated in Figure 9. They were derived by superimposing new site-generated volumes (Figure 7) and site-generated pass-by volumes (Figure 8) onto projected 2014 baseline traffic volumes (Figure 5). Figure 9: Total Projected 2014 Peak Hour Traffic Volumes 2(14) 5(3) 2(11) McCarthy 18(18) 1277(1315) 236(104) 2(7) 1099(1068) 85(7) 36(23) 10(19) 27(6) 34(44) 1193(1293) 66(68) 128(189) 51(58) 90(98) 23(20) 60(30) 13(17) 1157(1215) 103(160) 32(40) 1261(1304) 34(37) Site 24(26) 10(11) 42(46) 1251(1362) 28(8) 18(18) 49(43) 20(36) 1045(1165) 194(242) 224(246) 63(51) 35(37) 8(11) 795(986) 11(24) 39(41) 17(34) 232(238) 44(51) 1208(1302) 19(15) 26(10) 27(15) 107(49) 133(309) 873(1146) 56(134) 136(225) 263(617) 333(189) 1153(1405) 11(17) 17(26) 60(112) 539(353) 889(1339) 75(89) Hunt Club 141(108) 15(18) 4(8) 32(39) 3(4) 5(8) 31(42) 3(4) 10(7) 7(13) 223(266) 17(18) 20(34) Gibford 3(1) 24(45) 32(41) 322(334) xx (yy) AM Peak Hour Volumes PM Peak Hour Volumes Table 10 provides a summary of projected 2014 performances of study area intersections at full site build-out. The SYNCHRO model output of projected conditions are provided within Appendix E. Table 10: Projected 2014 Performance of Study Area Intersections Weekday AM Peak (PM Peak) Critical Movement Intersection as a Whole Intersection max. v/c or LoS avg. delay Movement Delay (s) LoS v/c (s) Hunt Club/N. Bowesville C(F) 0.76(1.42) NBT(NBT) 22.3(50.7) C(D) 0.73(0.86) Hunt Club/Paul Anka C(E) 0.72(0.93) EBT(EBT) 17.8(24.4) B(D) 0.67(0.83) Hunt Club/Gibford B(B) 10.1(10.8) NBR(NBR) 0.2(0.2) - - Site/Paul Anka A(A) 9.2(9.0) WBR(WBR) 2.0(2.2) - - Site/Dean Martin A(A) 8.7(8.8) SBL(SBL) 3.2(2.9) - - Site/Gibford A(A) 8.8(8.9) EBL(EBL) 4.0(4.5) - - Gibford/Uplands B(B) 10.1(10.2) EBL(EBL) 1.0(1.3) - - Hunt Club/Uplands C(C) 0.75(0.78) NBL(NBL) 9.6(11.3) A(B) 0.58(0.68) Hunt Club/McCarthy C(E) 0.78(0.95) SBL(EBT) 21.6(26.8) C(D) 0.71(0.87) Hunt Club/Airport Pkwy F(F) 1.12(1.13) WBT(WBT) 56.2(64.4) E(F) 0.99(1.05) Note: Analysis of signalized intersections assumes a PHF of 0.95 and a saturation flow rate of 1800 veh/h/lane. 16
21 STO P STOP STOP STO P STO P 700 Hunt Club Road Transportation Impact Study December 2012 As shown in Table 10, with no signal timing plan modifications, the signalized study area intersections, as a whole, are projected to operate at an acceptable LoS D or better during both peak hours, with the exception of the Hunt Club/Airport Parkway intersection. This is similar to existing conditions summarized in Table 1. With regard to the critical movements at study area intersections during the peak hours, they are also projected to operate similar to existing conditions, with the exception of the Hunt Club/McCarthy and the Hunt Club/Paul Anka eastbound through movements during the afternoon peak hour, which are projected to operate at LoS E. 4.2 Projected 2019 Conditions at Five Years beyond Site Build-Out Total projected 2019 volumes associated with the proposed development are illustrated in Figure 10. They were derived by superimposing new site-generated volumes (Figure 7) and site-generated pass-by volumes (Figure 8) onto projected 2019 baseline traffic volumes (Figure 6). Figure 10: Total Projected 2019 Peak Hour Traffic Volumes 2(14) 5(3) 2(11) McCarthy 18(18) 1477(1520) 236(104) 2(7) 1272(1234) 85(7) 36(23) 10(19) 27(6) 34(44) 1383(1497) 66(68) 128(189) 51(58) 90(98) 23(20) 60(30) 13(17) 1344(1411) 103(160) 32(40) 1464(1513) 34(37) Site 24(26) 10(11) 42(46) 1450(1579) 28(8) 18(18) 49(43) 20(36) 1209(1346) 194(242) 224(246) 63(51) 35(37) 8(11) 918(1137) 11(24) 39(41) 17(34) 232(238) 44(51) 1398(1506) 19(15) 26(10) 27(15) 107(49) 133(309) 1010(1325) 56(134) 136(225) 263(617) 333(189) 1335(1627) 11(17) 17(26) 60(112) 539(353) 1029(1551) 75(89) Hunt Club 141(108) 15(18) 4(8) 32(39) 3(4) 5(8) 31(42) 3(4) 10(7) 7(13) 223(266) 17(18) 20(34) Gibford 3(1) 24(45) 32(41) 322(334) xx (yy) AM Peak Hour Volumes PM Peak Hour Volumes Table 11 provides a summary of projected 2019 performances of study area intersections at 5-years beyond full site build-out. The SYNCHRO model output of projected conditions are provided within Appendix F. 17
22 700 Hunt Club Road Transportation Impact Study December 2012 Table 11: Projected 2019 Performance of Study Area Intersections Weekday AM Peak (PM Peak) Critical Movement Intersection as a Whole Intersection max. v/c or LoS avg. delay Movement Delay (s) LoS v/c (s) Hunt Club/N. Bowesville D(F) 0.87(1.42) EBT(NBT) 25.2(49.7) D(E) 0.84(0.93) Hunt Club/Paul Anka D(F) 0.83(1.07) EBT(EBT) 20.4(40.7) C(E) 0.77(0.96) Hunt Club/Gibford B(B) 10.9(10.9) NBR(NBR) 0.2(0.2) - - Site/Paul Anka A(A) 9.2(9.0) WBR(WBR) 2.0(2.2) - - Site/Dean Martin A(A) 8.7(8.8) SBL(SBL) 3.2(2.9) - - Site/Gibford A(A) 8.8(8.9) EBL(EBL) 4.0(4.5) - - Gibford/Uplands B(B) 10.1(10.2) EBL(EBL) 1.0(1.3) - - Hunt Club/Uplands C(C) 0.75(0.78) NBL(EBT) 10.1(12.8) B(C) 0.64(0.76) Hunt Club/McCarthy D(F) 0.88(1.10) EBT(EBT) 24.8(45.8) D(E) 0.81(0.99) Hunt Club/Airport Pkwy F(F) 1.24(1.27) WBT(WBT) 77.0(93.7) F(F) 1.09(1.15) Note: Analysis of signalized intersections assumes a PHF of 0.95 and a saturation flow rate of 1800 veh/h/lane. As shown in Table 11, with no signal timing plan modifications, the subject area intersections as a whole are projected to operate at LoS D or better, with the exception of the Hunt Club/Airport Parkway intersection during the morning peak hour. However, during the afternoon peak hour, with the exception of the Hunt Club/Uplands intersection, the subject area intersections as a whole are operating at LoS E to LoS F. With regards to critical movements at study area intersections, they are noted as operating similar to existing conditions, with the exception of the eastbound through movements at the Hunt Club/McCarthy and Hunt Club/Paul Anka intersections, which are both projected to operate at LoS D and Los F during the morning and afternoon peak hours, respectively. It should be noted that the 2019 background traffic growth on Hunt Club Road equates to an approximate increase of 250 veh/h during the peak hours in both the east and westbound directions. The site-generated traffic on Hunt Club Road equates to an approximate increase of 30 veh/h during the peak hours in both the east and westbound directions. As the increase due to background traffic growth is approximately 8 times greater than the increase due to site-generated traffic, the primary cause of the projected decrease in Levels of Service at the study area intersections is background traffic growth not site-generated traffic. As for the site driveway connections, they are projected to operate with acceptable delays of 2 to 5 seconds during peak hours with 95 th percentile queues of 1 meter (no more than 1 vehicle in queue) on site. It should also be noted that the Hunt Club/Paul Anka intersection is located approximately 60 m north of the site s driveway connection to Paul Anka Drive. The projected 95 th 18
23 700 Hunt Club Road Transportation Impact Study December 2012 percentile southbound queues entering the site on Paul Anka Drive are approximately 1 m in the morning and afternoon peak hours and the projected 95 th percentile northbound queues at the Hunt Club/Paul Anka intersection are approximately 26 m and 28 m during the morning and afternoon peak hours, respectively. Therefore, queues are not projected to spill back/block either intersection. Auxiliary turn lane warrant analysis was performed for the southbound left-turn and eastbound right-turn movements at the Paul Anka/Site and Hunt Club/Gibford intersections, respectively. Based on the projected low traffic volumes entering the site, auxiliary turn lanes are not warranted at either location. Turn lane warrant analysis is included as Appendix G. As previously mentioned, the proposed widening of Hunt Club Road from 4 to 6 lanes within the study area should be implemented by It is projected that this increase in lane capacity will result in acceptable Levels of Service at all study area intersections, with the exception of the critical movements at the Hunt Club/North Bowesville and Hunt Club/Airport Parkway intersections during the afternoon peak hour (LoS F and LoS E, respectively). The Synchro analysis for the widening of Hunt Club Road is included as Appendix H. It should also be noted, the completion of the Strandherd-Armstrong Bridge across the Rideau River will change study area travel patterns and will provide relief along Hunt Club Road, which will ultimately improve the Levels of Service at study area intersections. Possible mitigative measures to improve the Level of Service for the northbound left-turn movement at the Hunt Club/North Bowesville intersection include two fully protected leftturn lanes and a shared through/right turn lane on Canadair Private. This will improve the delays for this critical movement, however, it will still operate at LoS F due to high turning/opposing volumes during the afternoon peak hour. It is recommended that no modifications be undertaken, however, until the effects of the opening of the Strandherd- Armstrong Bridge are assessed. 4.3 Neighbourhood Impacts The additional projected site-generated traffic travelling through the community north of the proposed development on Paul Anka Drive, Uplands Drive and McCarthy Road is expected to be negligible as it equates to approximately 1 additional vehicle every 3 to 5 minutes. The site is also not projected to add traffic to other potential cut-through routes because other routes are either not intuitive, circuitous or they do not offer any significant travel time benefit. With respect to neighbourhood transit, the site is projected to generate an approximate total of 14 and 27 new two-way person transit trips during the weekday morning and afternoon peak hours, respectively. This amount of person traffic is not significant and adjacent local transit services can easily accommodate this increase in person traffic. 19
24 700 Hunt Club Road Transportation Impact Study December SITE PLAN REVIEW This section provides an overview of site access, parking requirements, pedestrian circulation and transit accessibility. The proposed Site Plan was previously illustrated in Figure 2. Parking As discussed with City staff (October 12 th ), the medical/retail building and the two restaurant land uses are to be considered as a shopping centre use for the purpose of calculating minimum required parking spaces. As such, the proposed 223 parking spaces for a 74 room hotel and an approximate 2,369 m 2 shopping centre are sufficient with respect to the City s Zoning By-Law requirements for Area C, identified in Schedule 1 of the City s Zoning By-Law. Site Circulation With regard to on-site circulation, the proposed parking lot is laid out effectively, such that two-way traffic can be efficiently accommodated. The proposed drive aisle widths are noted as 6.7 m, which meets the City s By-Law requirements and the proposed parking space dimensioning are also noted as meeting By-Law requirements. With regard to the proposed restaurant drive-through, approximately 7 queuing spaces are identified on the Figure 2 Site Plan. This amount of queuing spaces meets the City s By- Law minimum requirement of 4 queuing spaces for a restaurant drive-through with no order board, but does not meet the minimum requirement of 11 queuing spaces for a restaurant drive-through with an order board. At this time it is unknown whether the restaurant will require an order board at the drive-through. As per the City Urban Design Guidelines for Drive-Through Facilities, the location of the drive-through is such that queued vehicles will not obstruct vehicles along adjacent roadways. Therefore, should the end-user restaurant ultimately require an order board at the drive-through, the proponent may wish to seek a By-Law variance for the number of queuing space required. As for heavy vehicles, sufficient turning radii on-site and at the site driveway connections is provided for fire, garbage and delivery truck circulation. In addition, Molok garbage enclosures are provided at locations that can be accessed by specialized Molok garbage trucks. Access Requirements Based on projected volumes and proximity to adjacent intersections, additional traffic control/auxiliary turn lanes are not warranted or required at the proposed driveway connections. The proposed site driveway connections to Gibford Drive and Dean Martin Crescent meet the City s Private Approach By-Law in terms of their location and dimensioning. It should be noted that the proposed site driveway to Paul Anka Drive meets By-Law requirements in terms of dimensioning, but its location of 1.5 m from the property line does not satisfy the City s minimum requirement of 3.0 m. However, the driveway is relatively flat, which 20
25 700 Hunt Club Road Transportation Impact Study December 2012 provides good visibility for drivers entering/exiting the site. The visibility between the proposed site driveway and the adjacent properties driveway (separated by approximately 18 m) is unobstructed, allowing drivers to safely enter/exit both sites. Therefore, it is recommended that this driveway location is both safe and acceptable. Pedestrians/Transit To connect pedestrians to transit service and other nearby employment, shopping and recreation opportunities, sidewalks are currently provided along both sides of Hunt Club Road, along the west side of Paul Anka Drive, and along the east side of Gibford Drive, north of Dean Martin Crescent. With the construction of the proposed development, sidewalks fronting the site are proposed on Paul Anka Drive, Dean Martin Crescent and Gibford Drive. OC Transpo bus stops for Routes #116, 147, 189 and 199 are located along Hunt Club Road, approximately meters north of the proposed development. Bus stops for Routes #87 and 97 are located on Uplands Drive, approximately 300 m west of the proposed development. Bicycles A total of 7 bicycle parking spaces are proposed to serve the development, which is sufficient with respect to the City s By-Law requirements for a 74 room hotel and an approximate 2,369 m 2 shopping centre. The location of bicycle parking is not identified on the attached Site Plan. However, according to City By-Law requirements, bicycle parking should be located close to the main entrance of buildings and be in well-lit areas. 6. TRANSPORTATION DEMAND MANAGEMENT Depending on the nature of a development, Transportation Demand Management (TDM) strategies have the potential to be an integral part of a planned development in order to address and support the City of Ottawa policies with regard to TDM. For this particular site, its proximity to the existing transit service is considered very advantageous in lessening the reliance on the private automobile. A number of TDM measures could also be considered, including: improving the quality and safety of pedestrian facilities, such as enhanced sidewalks/lighting; improving bicycle facilities, such as provision of secure on-site bicycle storage; and provide change area for any on-site staff. These are important TDM strategies to encourage active modes of transportation to/from the site. 21
26 700 Hunt Club Road Transportation Impact Study December FINDINGS AND RECOMMENDATIONS Based on the foregoing analysis of the proposed development, the following transportation-related conclusions are offered: EXISTING CONDITIONS The study area intersections adjacent to the site are currently operating as a whole with an overall LoS D or better during the weekday morning and afternoon peak hours, with the exception on the Hunt Club/Airport Parkway intersection; With regard to critical movements at study area intersections, they are also operating at an acceptable LoS D or better during the peak hours, with the exception of the failing northbound left-turn at the Hunt Club/North Bowesville intersection and the failing westbound left-turn at the Hunt Club/Airport Parkway intersection; During the afternoon peak hour, there are lengthy westbound queues on Hunt Club Road extending from the Hunt Club/Riverside intersection east back through the Hunt Club/North Bowesville intersection. These queues effect the operation of the Hunt Club/North Bowesville intersection, but the issue is not the capacity of this intersection but the failure of the Hunt Club/Riverside intersection. Improved operations are expected at the Hunt Club/Riverside intersection in 2013 with the planned opening of the Strandherd-Armstrong Bridge. Based on the available data, there does not appear to be any safety issues on Hunt Club Road adjacent to the proposed site; PROJECTED CONDITIONS Based on historic counts at the Hunt Club/Paul Anka intersection, Hunt Club Road has experienced an approximate 3% annual growth in traffic volume in past years. This equates to an approximate increase in two-way vehicle volumes of veh/h each year or 250 veh/h per direction by the horizon year. This rate of traffic growth may not be achievable as the Hunt Club/Riverside intersection cannot process additional volume; The proposed development is projected to generate new two-way vehicle volumes of approximately 100 and 157 veh/h during the weekday morning and afternoon peak hours, respectively; The impact of site-generated traffic amounts to a 1% to 5% increase in volumes at the study area intersections, which is not considered significant as it will have a negligible effect on their overall level of service. The impact of background traffic 22
27 700 Hunt Club Road Transportation Impact Study December 2012 growth, however, equates to an approximate 20-25% increase in volumes by the horizon year, which is significant with regard to future intersection operation. At full occupancy (year 2014), study area intersections, with no signal timing plan modifications, are projected to operate similar to existing conditions. At 5-years beyond site build-out, with the exception of the Hunt Club/Uplands intersection (LoS C ), study area intersections as a whole, with no signal timing plan modifications, are projected to operate at LoS E or LoS F during the afternoon peak hour due primarily to background growth assumptions, not sitegenerated traffic; The proposed widening of Hunt Club Road will achieve acceptable Levels of Service at all study area intersections, with the exception of the critical movements at the Hunt Club/North Bowesville and Hunt Club/Airport Parkway during the afternoon peak hour (LoS F and LoS E, respectively). Providing two fully protected northbound left-turn lanes and a shared through/rightturn lane at the Hunt Club/North Bowesville intersection will improve the operations at this location, however, its critical movement s v/c is projected to improve from 1.42 to 1.02 which is still LoS F. It is recommended that no modifications be undertaken until the effects of opening the Strandherd-Armstrong Bridge are assessed; Traffic signal control and auxiliary turn lanes are not warranted at the proposed driveway connections, based on projected volumes and proximity to adjacent signalized intersections; SITE PLAN The proposed site s parking layout is well arranged and meets By-Law requirements; With the exception of the proposed location of the site driveway connection to Paul Anka Drive, the site driveways meet the City s Private Approach By-Law requirements; o The driveway connection to Paul Anka Drive provides good visibility and is located at a safe distance from the adjacent property s driveway. As such, the proposed driveway s location of 1.5 m from the property line is considered safe and is recommended; The proposed vehicle/bicycle parking supply and the dimensions of the vehicle parking stalls meet the City s By-Law requirements. Based on the foregoing, the proposed development fits well into the context of the surrounding area, and its location and design serves to promote use of walking, cycling, 23

28 700 Hunt Club Road Transportation Impact Study December 2012 and transit modes, thus supporting City of Ottawa policies, goals and objectives with respect to redevelopment, intensification and modal share. Therefore, the proposed 700 Hunt Club development is recommended from a transportation perspective. Prepared By: Reviewed By: André Jane Sponder, B.A.Sc. Analyst, Transportation Division Ottawa Operations Ronald M. Jack, P.Eng. Vice President Transportation Manager Ottawa Operations 18 Dec
29 Appendix A Current Peak Hour Volumes
30
31
32 DIRECTIONAL TRAFFIC FLOW Intersection: Gibford at Hunt Club DATE: Day: 20 Month: November Year: 2012 Day of Week: Tuesday Observer: André Sponder Weather: Dry Chkd by: Date: Street Name: Hunt Club TIME PERIOD: From: 8 : 00 To: 9 : 00 Instructions: 1) Use tally marks to indicate vehicles. 2) Use one sheet for each 15-minute period. Pass. Vehicles Trks Bus Street Name: DNE N Bus Trks Pass. Vehicles 10 Pass. Vehicles Street Name: Hunt Club Trks Bus Street Name: Gibford Bus Trks Pass. Vehicles 10
33 DIRECTIONAL TRAFFIC FLOW Intersection: Gibford at Hunt Club DATE: Day: 20 Month: November Year: 2012 Day of Week: Tuesday Observer: André Sponder Weather: Dry Chkd by: Date: Street Name: Hunt Club TIME PERIOD: From: 4 : 00 To: 5 : 00 Instructions: 1) Use tally marks to indicate vehicles. 2) Use one sheet for each 15-minute period. Pass. Vehicles Trks Bus Street Name: DNE N Bus Trks Pass. Vehicles 11 Pass. Vehicles Street Name: Hunt Club Trks Bus Street Name: Gibford Bus Trks Pass. Vehicles 7
34
35
36
37 DIRECTIONAL TRAFFIC FLOW Intersection: Uplands at Gibford DATE: Day: 13 Month: November Year: 2012 Day of Week: Tuesday Observer: André Sponder Weather: Dry Chkd by: Date: Street Name: Gibford TIME PERIOD: From: 8 : 00 To: 9 : 00 Instructions: 1) Use tally marks to indicate vehicles. 2) Use one sheet for each 15-minute period. 7 Pass. Vehicles Trks Bus Street Name: Uplands N Bus Trks Pass. Vehicles 3 17 Pass. Vehicles Street Name: DNE Trks Bus Street Name: Uplands Bus Trks Pass. Vehicles 24
38 DIRECTIONAL TRAFFIC FLOW Intersection: Uplands at Gibford DATE: Day: 15 Month: November Year: 2012 Day of Week: Thursday Observer: André Sponder Weather: Dry Chkd by: Date: Street Name: Gibford TIME PERIOD: From: 4 : 00 To: 5 : 00 Instructions: 1) Use tally marks to indicate vehicles. 2) Use one sheet for each 15-minute period. 13 Pass. Vehicles Trks Bus Street Name: Uplands N Bus Trks Pass. Vehicles 1 33 Pass. Vehicles Street Name: DNE Trks Bus Street Name: Uplands Bus Trks Pass. Vehicles 29
39 Appendix B SYNCHRO Capacity Analysis: Existing Conditions
40 Existing AM 1: Canadair/Bowesville & Hunt Club Lane Group EBL EBT EBR WBL WBT NBL NBT NBR SBL SBT Volume (vph) Lane Group Flow (vph) Turn Type Prot NA Perm Prot NA Perm NA Perm Perm NA Protected Phases Permitted Phases Detector Phase Switch Phase Minimum Initial (s) Minimum Split (s) Total Split (s) Total Split (%) 10.4% 56.5% 56.5% 10.4% 56.5% 33.0% 33.0% 33.0% 33.0% 33.0% Yellow Time (s) All-Red Time (s) Lost Time Adjust (s) Total Lost Time (s) Lead/Lag Lead Lag Lag Lead Lag Lead-Lag Optimize? Yes Yes Yes Yes Yes Recall Mode None C-Max C-Max None C-Max None None None None None Act Effct Green (s) Actuated g/c Ratio v/c Ratio Control Delay Queue Delay Total Delay LOS E C A E B E A C Approach Delay Approach LOS C B D C Queue Length 50th (m) Queue Length 95th (m) # Internal Link Dist (m) Turn Bay Length (m) Base Capacity (vph) Starvation Cap Reductn Spillback Cap Reductn Storage Cap Reductn Reduced v/c Ratio Cycle Length: 115 Actuated Cycle Length: 115 Offset: 0 (0%), Referenced to phase 2:EBT and 6:WBT, Start of Green Natural Cycle: 90 Control Type: Actuated-Coordinated Maximum v/c Ratio: 0.76 Intersection Signal Delay: 21.4 Intersection Capacity Utilization 75.5% # 95th percentile volume exceeds capacity, queue may be longer. Queue shown is maximum after two cycles. Intersection LOS: C ICU Level of Service D Splits and Phases: 1: Canadair/Bowesville & Hunt Club
41 Existing AM 2: Paul Anka & Hunt Club Lane Group EBL EBT EBR WBL WBT WBR NBL NBT NBR SBL SBT Volume (vph) Lane Group Flow (vph) Turn Type Prot NA Perm Prot NA Perm Perm NA Perm Perm NA Protected Phases Permitted Phases Detector Phase Switch Phase Minimum Initial (s) Minimum Split (s) Total Split (s) Total Split (%) 13.8% 45.0% 45.0% 13.8% 45.0% 45.0% 41.3% 41.3% 41.3% 41.3% 41.3% Yellow Time (s) All-Red Time (s) Lost Time Adjust (s) Total Lost Time (s) Lead/Lag Lead Lag Lag Lead Lag Lag Lead-Lag Optimize? Yes Yes Yes Yes Yes Yes Recall Mode None C-Max C-Max None C-Max C-Max None None None None None Act Effct Green (s) Actuated g/c Ratio v/c Ratio Control Delay Queue Delay Total Delay LOS D B A D B A D C A C B Approach Delay Approach LOS B B C C Queue Length 50th (m) Queue Length 95th (m) m m Internal Link Dist (m) Turn Bay Length (m) Base Capacity (vph) Starvation Cap Reductn Spillback Cap Reductn Storage Cap Reductn Reduced v/c Ratio Cycle Length: 80 Actuated Cycle Length: 80 Offset: 11 (14%), Referenced to phase 2:EBT and 6:WBT, Start of Green Natural Cycle: 80 Control Type: Actuated-Coordinated Maximum v/c Ratio: 0.53 Intersection Signal Delay: 12.9 Intersection Capacity Utilization 67.1% m Volume for 95th percentile queue is metered by upstream signal. Intersection LOS: B ICU Level of Service C Splits and Phases: 2: Paul Anka & Hunt Club
42 Existing AM 4: Uplands & Hunt Club Lane Group EBL EBT EBR WBL WBT WBR NBL NBT NBR SBL SBT Volume (vph) Lane Group Flow (vph) Turn Type pm+pt NA Perm pm+pt NA Perm Perm NA Perm Perm NA Protected Phases Permitted Phases Detector Phase Switch Phase Minimum Initial (s) Minimum Split (s) Total Split (s) Total Split (%) 13.8% 45.0% 45.0% 13.8% 45.0% 45.0% 41.3% 41.3% 41.3% 41.3% 41.3% Yellow Time (s) All-Red Time (s) Lost Time Adjust (s) Total Lost Time (s) Lead/Lag Lead Lag Lag Lead Lag Lag Lead-Lag Optimize? Yes Yes Yes Yes Yes Yes Recall Mode None C-Max C-Max None C-Max C-Max None None None None None Act Effct Green (s) Actuated g/c Ratio v/c Ratio Control Delay Queue Delay Total Delay LOS A A A A A A D C A C B Approach Delay Approach LOS A A C B Queue Length 50th (m) Queue Length 95th (m) m m m Internal Link Dist (m) Turn Bay Length (m) Base Capacity (vph) Starvation Cap Reductn Spillback Cap Reductn Storage Cap Reductn Reduced v/c Ratio Cycle Length: 80 Actuated Cycle Length: 80 Offset: 48 (60%), Referenced to phase 2:EBTL and 6:WBTL, Start of Green Natural Cycle: 80 Control Type: Actuated-Coordinated Maximum v/c Ratio: 0.75 Intersection Signal Delay: 11.2 Intersection Capacity Utilization 61.9% m Volume for 95th percentile queue is metered by upstream signal. Intersection LOS: B ICU Level of Service B Splits and Phases: 4: Uplands & Hunt Club
43 Existing AM 5: Downpatrick/McCarthy & Hunt Club Lane Group EBL EBT EBR WBL WBT WBR NBL NBT SBL SBT SBR Volume (vph) Lane Group Flow (vph) Turn Type pm+pt NA Perm pm+pt NA Perm Perm NA Perm NA Perm Protected Phases Permitted Phases Detector Phase Switch Phase Minimum Initial (s) Minimum Split (s) Total Split (s) Total Split (%) 13.8% 43.8% 43.8% 13.8% 43.8% 43.8% 42.5% 42.5% 42.5% 42.5% 42.5% Yellow Time (s) All-Red Time (s) Lost Time Adjust (s) Total Lost Time (s) Lead/Lag Lead Lag Lag Lead Lag Lag Lead-Lag Optimize? Yes Yes Yes Yes Yes Yes Recall Mode None C-Max C-Max None C-Max C-Max None None None None None Act Effct Green (s) Actuated g/c Ratio v/c Ratio Control Delay Queue Delay Total Delay LOS A C A B B A C A D B A Approach Delay Approach LOS C B A D Queue Length 50th (m) Queue Length 95th (m) m1.0 #138.8 m Internal Link Dist (m) Turn Bay Length (m) Base Capacity (vph) Starvation Cap Reductn Spillback Cap Reductn Storage Cap Reductn Reduced v/c Ratio Cycle Length: 80 Actuated Cycle Length: 80 Offset: 11 (14%), Referenced to phase 2:EBTL and 6:WBTL, Start of Green Natural Cycle: 80 Control Type: Actuated-Coordinated Maximum v/c Ratio: 0.78 Intersection Signal Delay: 20.7 Intersection Capacity Utilization 79.8% # 95th percentile volume exceeds capacity, queue may be longer. Queue shown is maximum after two cycles. m Volume for 95th percentile queue is metered by upstream signal. Intersection LOS: C ICU Level of Service D Splits and Phases: 5: Downpatrick/McCarthy & Hunt Club
44 Existing AM 6: Airport Parkway & Hunt Club Lane Group EBL EBT WBL WBT NBL NBR SBL SBR ø4 Volume (vph) Lane Group Flow (vph) Turn Type Prot NA Prot NA Prot Free Prot Free Protected Phases Permitted Phases Free Free Detector Phase Switch Phase Minimum Initial (s) Minimum Split (s) Total Split (s) Total Split (%) 25.8% 40.0% 25.8% 40.0% 14.2% 34.2% 20% Yellow Time (s) All-Red Time (s) Lost Time Adjust (s) Total Lost Time (s) Lead/Lag Lead Lag Lead Lag Lag Lead Lead-Lag Optimize? Yes Yes Yes Yes Yes Yes Recall Mode None C-Max None C-Max None None None Act Effct Green (s) Actuated g/c Ratio v/c Ratio Control Delay Queue Delay Total Delay LOS D B E E D A E A Approach Delay Approach LOS C E Queue Length 50th (m) ~ Queue Length 95th (m) # Internal Link Dist (m) Turn Bay Length (m) Base Capacity (vph) Starvation Cap Reductn Spillback Cap Reductn Storage Cap Reductn Reduced v/c Ratio Cycle Length: 120 Actuated Cycle Length: 120 Offset: 1 (1%), Referenced to phase 2:EBT and 6:WBT, Start of Green Natural Cycle: 115 Control Type: Actuated-Coordinated Maximum v/c Ratio: 1.05 Intersection Signal Delay: 45.9 Intersection Capacity Utilization 87.9% ~ Volume exceeds capacity, queue is theoretically infinite. Queue shown is maximum after two cycles. # 95th percentile volume exceeds capacity, queue may be longer. Queue shown is maximum after two cycles. Intersection LOS: D ICU Level of Service E Splits and Phases: 6: Airport Parkway & Hunt Club
45 Existing AM 3: Gibford & Hunt Club Movement EBT EBR WBL WBT NBL NBR Volume (veh/h) Sign Control Free Free Stop Grade 0% 0% 0% Peak Hour Factor Hourly flow rate (vph) Pedestrians Lane Width (m) Walking Speed (m/s) Percent Blockage Right turn flare (veh) Median type None None Median storage veh) Upstream signal (m) px, platoon unblocked vc, conflicting volume vc1, stage 1 conf vol vc2, stage 2 conf vol vcu, unblocked vol tc, single (s) tc, 2 stage (s) tf (s) p0 queue free % cm capacity (veh/h) Direction, Lane # EB 1 EB 2 WB 1 WB 2 NB 1 Volume Total Volume Left Volume Right csh Volume to Capacity Queue Length 95th (m) Control Delay (s) Lane LOS A Approach Delay (s) Approach LOS A Average Delay 0.0 Intersection Capacity Utilization 45.4% ICU Level of Service A
46 Existing AM 7: Uplands & Gibford Movement EBL EBR NBL NBT SBT SBR Volume (veh/h) Sign Control Stop Free Free Grade 0% 0% 0% Peak Hour Factor Hourly flow rate (vph) Pedestrians Lane Width (m) Walking Speed (m/s) Percent Blockage Right turn flare (veh) Median type None None Median storage veh) Upstream signal (m) 211 px, platoon unblocked vc, conflicting volume vc1, stage 1 conf vol vc2, stage 2 conf vol vcu, unblocked vol tc, single (s) tc, 2 stage (s) tf (s) p0 queue free % cm capacity (veh/h) Direction, Lane # EB 1 NB 1 SB 1 Volume Total Volume Left Volume Right csh Volume to Capacity Queue Length 95th (m) Control Delay (s) Lane LOS B A Approach Delay (s) Approach LOS B Average Delay 0.8 Intersection Capacity Utilization 45.5% ICU Level of Service A
47 PM Existing 1: Canadair/Bowesville & Hunt Club Lane Group EBL EBT EBR WBL WBT NBL NBT NBR SBL SBT Volume (vph) Lane Group Flow (vph) Turn Type Prot NA Perm Prot NA Perm NA Perm Perm NA Protected Phases Permitted Phases Detector Phase Switch Phase Minimum Initial (s) Minimum Split (s) Total Split (s) Total Split (%) 10.4% 56.5% 56.5% 10.4% 56.5% 33.0% 33.0% 33.0% 33.0% 33.0% Yellow Time (s) All-Red Time (s) Lost Time Adjust (s) Total Lost Time (s) Lead/Lag Lead Lag Lag Lead Lag Lead-Lag Optimize? Yes Yes Yes Yes Yes Recall Mode None C-Max C-Max None C-Max None None None None None Act Effct Green (s) Actuated g/c Ratio v/c Ratio Control Delay Queue Delay Total Delay LOS E B A E B F B C Approach Delay Approach LOS B B F C Queue Length 50th (m) ~ Queue Length 95th (m) # Internal Link Dist (m) Turn Bay Length (m) Base Capacity (vph) Starvation Cap Reductn Spillback Cap Reductn Storage Cap Reductn Reduced v/c Ratio Cycle Length: 115 Actuated Cycle Length: 115 Offset: 0 (0%), Referenced to phase 2:EBT and 6:WBT, Start of Green Natural Cycle: 110 Control Type: Actuated-Coordinated Maximum v/c Ratio: 1.42 Intersection Signal Delay: 51.8 Intersection Capacity Utilization 80.1% ~ Volume exceeds capacity, queue is theoretically infinite. Queue shown is maximum after two cycles. # 95th percentile volume exceeds capacity, queue may be longer. Queue shown is maximum after two cycles. Intersection LOS: D ICU Level of Service D Splits and Phases: 1: Canadair/Bowesville & Hunt Club
48 PM Existing 2: Paul Anka & Hunt Club Lane Group EBL EBT EBR WBL WBT WBR NBL NBT NBR SBL SBT Volume (vph) Lane Group Flow (vph) Turn Type Prot NA Perm Prot NA Perm Perm NA Perm Perm NA Protected Phases Permitted Phases Detector Phase Switch Phase Minimum Initial (s) Minimum Split (s) Total Split (s) Total Split (%) 13.8% 45.0% 45.0% 13.8% 45.0% 45.0% 41.3% 41.3% 41.3% 41.3% 41.3% Yellow Time (s) All-Red Time (s) Lost Time Adjust (s) Total Lost Time (s) Lead/Lag Lead Lag Lag Lead Lag Lag Lead-Lag Optimize? Yes Yes Yes Yes Yes Yes Recall Mode None C-Max C-Max None C-Max C-Max None None None None None Act Effct Green (s) Actuated g/c Ratio v/c Ratio Control Delay Queue Delay Total Delay LOS D B A D A A D C A C B Approach Delay Approach LOS B B C C Queue Length 50th (m) Queue Length 95th (m) 15.7 # m m Internal Link Dist (m) Turn Bay Length (m) Base Capacity (vph) Starvation Cap Reductn Spillback Cap Reductn Storage Cap Reductn Reduced v/c Ratio Cycle Length: 80 Actuated Cycle Length: 80 Offset: 11 (14%), Referenced to phase 2:EBT and 6:WBT, Start of Green Natural Cycle: 90 Control Type: Actuated-Coordinated Maximum v/c Ratio: 0.71 Intersection Signal Delay: 16.2 Intersection Capacity Utilization 70.7% # 95th percentile volume exceeds capacity, queue may be longer. Queue shown is maximum after two cycles. m Volume for 95th percentile queue is metered by upstream signal. Intersection LOS: B ICU Level of Service C Splits and Phases: 2: Paul Anka & Hunt Club
49 PM Existing 4: Uplands & Hunt Club Lane Group EBL EBT EBR WBL WBT WBR NBL NBT NBR SBL SBT Volume (vph) Lane Group Flow (vph) Turn Type pm+pt NA Perm pm+pt NA Perm Perm NA Perm Perm NA Protected Phases Permitted Phases Detector Phase Switch Phase Minimum Initial (s) Minimum Split (s) Total Split (s) Total Split (%) 13.8% 45.0% 45.0% 13.8% 45.0% 45.0% 41.3% 41.3% 41.3% 41.3% 41.3% Yellow Time (s) All-Red Time (s) Lost Time Adjust (s) Total Lost Time (s) Lead/Lag Lead Lag Lag Lead Lag Lag Lead-Lag Optimize? Yes Yes Yes Yes Yes Yes Recall Mode None C-Max C-Max None C-Max C-Max None None None None None Act Effct Green (s) Actuated g/c Ratio v/c Ratio Control Delay Queue Delay Total Delay LOS A B A A A A D C A C B Approach Delay Approach LOS A A C C Queue Length 50th (m) Queue Length 95th (m) m0.4 #125.0 m14.6 m m Internal Link Dist (m) Turn Bay Length (m) Base Capacity (vph) Starvation Cap Reductn Spillback Cap Reductn Storage Cap Reductn Reduced v/c Ratio Cycle Length: 80 Actuated Cycle Length: 80 Offset: 48 (60%), Referenced to phase 2:EBTL and 6:WBTL, Start of Green Natural Cycle: 80 Control Type: Actuated-Coordinated Maximum v/c Ratio: 0.78 Intersection Signal Delay: 11.9 Intersection Capacity Utilization 63.6% # 95th percentile volume exceeds capacity, queue may be longer. Queue shown is maximum after two cycles. m Volume for 95th percentile queue is metered by upstream signal. Intersection LOS: B ICU Level of Service B Splits and Phases: 4: Uplands & Hunt Club
50 PM Existing 5: Downpatrick/McCarthy & Hunt Club Lane Group EBL EBT EBR WBL WBT WBR NBL NBT SBL SBT SBR Volume (vph) Lane Group Flow (vph) Turn Type pm+pt NA Perm pm+pt NA Perm Perm NA Perm NA Perm Protected Phases Permitted Phases Detector Phase Switch Phase Minimum Initial (s) Minimum Split (s) Total Split (s) Total Split (%) 13.8% 43.8% 43.8% 13.8% 43.8% 43.8% 42.5% 42.5% 42.5% 42.5% 42.5% Yellow Time (s) All-Red Time (s) Lost Time Adjust (s) Total Lost Time (s) Lead/Lag Lead Lag Lag Lead Lag Lag Lead-Lag Optimize? Yes Yes Yes Yes Yes Yes Recall Mode None C-Max C-Max None C-Max C-Max None None None None None Act Effct Green (s) Actuated g/c Ratio v/c Ratio Control Delay Queue Delay Total Delay LOS A C A C C A B A D C A Approach Delay Approach LOS C B B D Queue Length 50th (m) Queue Length 95th (m) m0.8 #154.2 m0.0 #37.7 # Internal Link Dist (m) Turn Bay Length (m) Base Capacity (vph) Starvation Cap Reductn Spillback Cap Reductn Storage Cap Reductn Reduced v/c Ratio Cycle Length: 80 Actuated Cycle Length: 80 Offset: 11 (14%), Referenced to phase 2:EBTL and 6:WBTL, Start of Green Natural Cycle: 80 Control Type: Actuated-Coordinated Maximum v/c Ratio: 0.88 Intersection Signal Delay: 23.8 Intersection Capacity Utilization 78.7% # 95th percentile volume exceeds capacity, queue may be longer. Queue shown is maximum after two cycles. m Volume for 95th percentile queue is metered by upstream signal. Intersection LOS: C ICU Level of Service D Splits and Phases: 5: Downpatrick/McCarthy & Hunt Club
51 PM Existing 6: Airport Parkway & Hunt Club Lane Group EBL EBT WBL WBT NBL NBR SBL SBR ø4 Volume (vph) Lane Group Flow (vph) Turn Type Prot NA Prot NA Prot Free Prot Free Protected Phases Permitted Phases Free Free Detector Phase Switch Phase Minimum Initial (s) Minimum Split (s) Total Split (s) Total Split (%) 15.4% 53.1% 15.4% 53.1% 13.1% 31.5% 18% Yellow Time (s) All-Red Time (s) Lost Time Adjust (s) Total Lost Time (s) Lead/Lag Lead Lag Lead Lag Lag Lead Lead-Lag Optimize? Yes Yes Yes Yes Yes Yes Recall Mode None C-Min None C-Max None None None Act Effct Green (s) Actuated g/c Ratio v/c Ratio Control Delay Queue Delay Total Delay LOS F C E E D A E A Approach Delay Approach LOS D E Queue Length 50th (m) ~ Queue Length 95th (m) # # Internal Link Dist (m) Turn Bay Length (m) Base Capacity (vph) Starvation Cap Reductn Spillback Cap Reductn Storage Cap Reductn Reduced v/c Ratio Cycle Length: 130 Actuated Cycle Length: 130 Offset: 98 (75%), Referenced to phase 2:EBT and 6:WBT, Start of Green Natural Cycle: 115 Control Type: Actuated-Coordinated Maximum v/c Ratio: 1.07 Intersection Signal Delay: 54.8 Intersection Capacity Utilization 95.8% ~ Volume exceeds capacity, queue is theoretically infinite. Queue shown is maximum after two cycles. # 95th percentile volume exceeds capacity, queue may be longer. Queue shown is maximum after two cycles. Intersection LOS: D ICU Level of Service F Splits and Phases: 6: Airport Parkway & Hunt Club
52 PM Existing 3: Gibford & Hunt Club Movement EBT EBR WBL WBT NBL NBR Volume (veh/h) Sign Control Free Free Stop Grade 0% 0% 0% Peak Hour Factor Hourly flow rate (vph) Pedestrians Lane Width (m) Walking Speed (m/s) Percent Blockage Right turn flare (veh) Median type None None Median storage veh) Upstream signal (m) px, platoon unblocked vc, conflicting volume vc1, stage 1 conf vol vc2, stage 2 conf vol vcu, unblocked vol tc, single (s) tc, 2 stage (s) tf (s) p0 queue free % cm capacity (veh/h) Direction, Lane # EB 1 EB 2 WB 1 WB 2 NB 1 Volume Total Volume Left Volume Right csh Volume to Capacity Queue Length 95th (m) Control Delay (s) Lane LOS A Approach Delay (s) Approach LOS A Average Delay 0.0 Intersection Capacity Utilization 46.4% ICU Level of Service A
53 PM Existing 7: Uplands & Gibford Movement EBL EBR NBL NBT SBT SBR Volume (veh/h) Sign Control Stop Free Free Grade 0% 0% 0% Peak Hour Factor Hourly flow rate (vph) Pedestrians Lane Width (m) Walking Speed (m/s) Percent Blockage Right turn flare (veh) Median type None None Median storage veh) Upstream signal (m) 223 px, platoon unblocked vc, conflicting volume vc1, stage 1 conf vol vc2, stage 2 conf vol vcu, unblocked vol tc, single (s) tc, 2 stage (s) tf (s) p0 queue free % cm capacity (veh/h) Direction, Lane # EB 1 NB 1 SB 1 Volume Total Volume Left Volume Right csh Volume to Capacity Queue Length 95th (m) Control Delay (s) Lane LOS B A Approach Delay (s) Approach LOS B Average Delay 1.0 Intersection Capacity Utilization 49.2% ICU Level of Service A
54 Appendix C Collision Data and Analysis
55 Collision Main Detail Summary OnTRAC Reporting System FROM: 2009/01/01 TO: 2012/01/01 AIRPORT PKWY & HUNT CLUB RD Former Municipality: Ottawa Traffic Control: Traffic signal Number of Collisions: 40 COLLISION IMPACT TYPE SURFACE VEHICLE DRIVER No. ID DATE DAY TIME ENV LIGHT CLASS DIR COND'N MANOEUVRE VEHICLE TYPE FIRST EVENT ACTION PED /01/15 Thu 06:45 Clear Dark Rear end P.D. only V1 W Ice Turning right Automobile, station Other motor vehicle 0 V2 W Ice Turning right Automobile, station Other motor vehicle /01/16 Frid 06:50 Clear Dark Rear end P.D. only V1 W Ice Going ahead Automobile, station Other motor vehicle 0 V2 W Ice Going ahead Automobile, station Other motor vehicle /01/16 Frid 08:45 Snow Daylight Rear end P.D. only V1 E Ice Slowing or Pick-up truck Skidding/Sliding 0 V2 E Ice Slowing or Pick-up truck Other motor vehicle /01/18 Sun 11:20 Snow Daylight Sideswipe P.D. only V1 S Loose snow Turning left Automobile, station Other motor vehicle 0 V2 S Loose snow Turning left Automobile, station Other motor vehicle /02/02 Mo 12:45 Clear Daylight Rear end P.D. only V1 W Wet Going ahead Pick-up truck Other motor vehicle 0 V2 W Wet Stopped Pick-up truck Other motor vehicle /02/03 Tue 16:40 Clear Daylight Sideswipe P.D. only V1 S Wet Going ahead Automobile, station Other motor vehicle 0 V2 S Wet Going ahead Automobile, station Other motor vehicle /02/08 Sun 15:16 Clear Daylight Rear end P.D. only V1 W Dry Going ahead Automobile, station Other motor vehicle 0 V2 W Dry Slowing or Automobile, station Other motor vehicle /02/25 We 08:11 Clear Daylight Rear end P.D. only V1 W Dry Going ahead Automobile, station Other motor vehicle 0 V2 W Dry Stopped Automobile, station Other motor vehicle /03/11 We 18:36 Clear Dusk Rear end Non-fatal V1 W Wet Slowing or Truck - tractor Other motor vehicle 0 V2 W Wet Stopped Automobile, station Other motor vehicle /03/12 Thu 13:30 Clear Daylight Rear end P.D. only V1 E Dry Slowing or Pick-up truck Other motor vehicle 0 V2 E Dry Stopped Automobile, station Other motor vehicle /04/03 Frid 11:00 Rain Daylight Rear end P.D. only V1 E Wet Going ahead Automobile, station Other motor vehicle 0 V2 E Wet Slowing or Automobile, station Other motor vehicle /04/13 Mo 18:00 Clear Daylight Rear end Non-fatal V1 E Dry Turning left Automobile, station Other motor vehicle 0 V2 E Dry Turning left Automobile, station Other motor vehicle /06/25 Thu 08:27 Clear Daylight Single vehicle P.D. only V1 W Dry Turning left Pick-up truck Pole (utility, tower) /06/28 Sun 16:05 Clear Daylight Rear end P.D. only V1 E Dry Going ahead Automobile, station Other motor vehicle 0 V2 E Dry Slowing or Automobile, station Other motor vehicle /07/17 Frid 18:14 Clear Daylight Rear end P.D. only V1 W Dry Slowing or Automobile, station Other motor vehicle 0 V2 W Dry Slowing or Automobile, station Other motor vehicle V3 W Dry Stopped Automobile, station Other motor vehicle (Note: Time of Day = "00:00" represents unknown collision time November 13, 2012 Page 1 of 12
56 Collision Main Detail Summary OnTRAC Reporting System FROM: 2009/01/01 TO: 2012/01/ /11/20 Frid 18:32 Rain Dark Rear end P.D. only V1 E Wet Going ahead Passenger van Other motor vehicle 0 V2 E Wet Slowing or Pick-up truck Other motor vehicle /02/02 Tue 18:00 Clear Dark Rear end P.D. only V1 W Dry Slowing or Passenger van Other motor vehicle 0 V2 W Dry Changing lanes Automobile, station Other motor vehicle /02/25 Thu 19:25 Snow Dark Rear end P.D. only V1 W Slush Slowing or Pick-up truck Skidding/Sliding 0 V2 W Slush Slowing or Passenger van Other motor vehicle /02/25 Thu 18:40 Snow Dark Rear end P.D. only V1 E Packed snow Slowing or Automobile, station Skidding/Sliding 0 V2 E Packed snow Slowing or Automobile, station Other motor vehicle V3 E Packed snow Slowing or Pick-up truck Other motor vehicle V4 E Packed snow Slowing or Automobile, station Other motor vehicle /02/25 Thu 12:51 Rain Daylight Rear end P.D. only V1 W Wet Slowing or Delivery van Skidding/Sliding 0 V2 W Wet Slowing or Automobile, station Other motor vehicle V3 W Wet Slowing or Automobile, station Other motor vehicle /04/13 Tue 06:10 Clear Daylight Rear end P.D. only V1 W Dry Going ahead Automobile, station Other motor vehicle 0 V2 W Dry Stopped Automobile, station Other motor vehicle /05/31 Mo 18:00 Clear Daylight Rear end P.D. only V1 E Dry Going ahead Pick-up truck Other motor vehicle 0 V2 E Dry Stopped Passenger van Other motor vehicle V3 E Dry Unknown Pick-up truck Other motor vehicle /06/06 Sun 16:20 Rain Daylight Rear end P.D. only V1 E Wet Slowing or Automobile, station Other motor vehicle 0 V2 E Wet Stopped Automobile, station Other motor vehicle V3 E Wet Stopped Automobile, station Other motor vehicle /07/19 Mo 09:47 Rain Daylight Rear end P.D. only V1 E Wet Slowing or Automobile, station Skidding/Sliding 0 V2 E Wet Slowing or Pick-up truck Other motor vehicle /08/01 Sun 09:56 Clear Daylight Rear end P.D. only V1 E Dry Going ahead Automobile, station Other motor vehicle 0 V2 E Dry Stopped Automobile, station Other motor vehicle /10/14 Thu 20:30 Clear Dark Single vehicle P.D. only V1 S Dry Turning right Truck and trailer Fence / Noise barrier /10/15 Frid 10:55 Clear Daylight Rear end P.D. only V1 W Wet Slowing or Automobile, station Other motor vehicle 0 V2 W Wet Stopped Automobile, station Other motor vehicle /02/02 We 19:56 Snow Dark Rear end P.D. only V1 N Packed snow Slowing or Automobile, station Other motor vehicle 0 V2 N Packed snow Slowing or Automobile, station Other motor vehicle /03/06 Sun 20:53 Clear Dark Rear end P.D. only V1 E Packed snow Turning left Automobile, station Other motor vehicle 0 V2 E Packed snow Turning left Passenger van Other motor vehicle /03/11 Frid 11:30 Rain Daylight Sideswipe P.D. only V1 W Wet Going ahead Automobile, station Other motor vehicle 0 V2 W Wet Changing lanes Passenger van Other motor vehicle (Note: Time of Day = "00:00" represents unknown collision time November 13, 2012 Page 2 of 12
57 Collision Main Detail Summary OnTRAC Reporting System FROM: 2009/01/01 TO: 2012/01/ /03/11 Frid 11:11 Rain Daylight Rear end P.D. only V1 W Wet Going ahead Automobile, station Other motor vehicle 0 V2 W Wet Slowing or Automobile, station Other motor vehicle /05/12 Thu 16:56 Clear Daylight Rear end Non-fatal V1 E Dry Going ahead Automobile, station Other motor vehicle 0 V2 E Dry Stopped Automobile, station Other motor vehicle V3 E Dry Stopped Pick-up truck Other motor vehicle /05/22 Sun 16:25 Clear Daylight Sideswipe P.D. only V1 S Dry Going ahead Pick-up truck Other motor vehicle 0 V2 S Dry Changing lanes Automobile, station Other motor vehicle /07/05 Tue 17:07 Clear Daylight Sideswipe P.D. only V1 S Dry Stopped Pick-up truck Cyclist 0 V2 S Dry Going ahead Bicycle Other motor vehicle /08/18 Thu 12:02 Clear Daylight Rear end P.D. only V1 W Dry Going ahead Passenger van Other motor vehicle 0 V2 W Dry Slowing or Automobile, station Other motor vehicle /08/31 We 21:31 Clear Dark Rear end P.D. only V1 W Dry Slowing or Delivery van Other motor vehicle 0 V2 W Dry Stopped Pick-up truck Other motor vehicle /09/08 Thu 18:04 Clear Daylight Rear end P.D. only V1 W Dry Slowing or Pick-up truck Other motor vehicle 0 V2 W Dry Slowing or Passenger van Other motor vehicle /09/23 Frid 16:00 Clear Daylight Rear end P.D. only V1 E Dry Going ahead Automobile, station Other motor vehicle 0 V2 E Dry Stopped Pick-up truck Other motor vehicle /12/08 Thu 08:25 Clear Daylight Single vehicle P.D. only V1 W Wet Going ahead Automobile, station Bridge support /12/25 Sun 13:35 Snow Daylight Rear end Non-fatal V1 S Packed snow Slowing or Automobile, station Other motor vehicle 0 V2 S Packed snow Stopped Automobile, station Other motor vehicle DEAN MARTIN CRES & HUNT CLUB RD Former Municipality: Ottawa Traffic Control: Traffic signal Number of Collisions: 18 COLLISION IMPACT TYPE SURFACE VEHICLE DRIVER No. ID DATE DAY TIME ENV LIGHT CLASS DIR COND'N MANOEUVRE VEHICLE TYPE FIRST EVENT ACTION PED /01/15 Thu 15:55 Clear Daylight Turning P.D. only V1 E Dry Going ahead Automobile, station Other motor vehicle 0 V2 W Dry Turning left Automobile, station Other motor vehicle /01/24 Sat 09:53 Clear Daylight Sideswipe P.D. only V1 W Dry Going ahead Police vehicle Other motor vehicle 0 V2 W Dry Slowing or Automobile, station Other motor vehicle /02/27 Frid 16:00 Rain Daylight Single vehicle P.D. only V1 E Wet Going ahead Automobile, station Pole (utility, tower) /02/28 Sat 15:30 Clear Daylight Rear end P.D. only V1 W Dry Going ahead Automobile, station Other motor vehicle 0 V2 W Dry Going ahead Pick-up truck Other motor vehicle (Note: Time of Day = "00:00" represents unknown collision time November 13, 2012 Page 3 of 12
58 Collision Main Detail Summary OnTRAC Reporting System FROM: 2009/01/01 TO: 2012/01/ /05/02 Sat 15:46 Clear Daylight Turning P.D. only V1 E Dry Turning left Pick-up truck Other motor vehicle 0 V2 W Dry Going ahead Passenger van Other motor vehicle /05/23 Sat 15:42 Clear Daylight Rear end Non-fatal V1 W Dry Going ahead Automobile, station Other motor vehicle 0 V2 W Dry Stopped Automobile, station Other motor vehicle /10/14 We 18:31 Clear Dark Rear end Non-fatal V1 N Dry Turning right Automobile, station Other motor vehicle 0 V2 N Dry Turning right Automobile, station Other motor vehicle /10/31 Sat 17:19 Clear Dusk Rear end P.D. only V1 W Dry Going ahead Automobile, station Other motor vehicle 0 V2 W Dry Slowing or Automobile, station Other motor vehicle /11/23 Mo 17:55 Fog, Dark Rear end P.D. only V1 E Dry Going ahead Automobile, station Other motor vehicle 0 V2 E Dry Slowing or Automobile, station Other motor vehicle /12/31 Thu 15:56 Snow Daylight Turning P.D. only V1 E Ice Turning left Automobile, station Other motor vehicle 0 V2 W Ice Going ahead Pick-up truck Other motor vehicle /01/15 Frid 18:55 Clear Dark Rear end P.D. only V1 W Wet Slowing or Passenger van Skidding/Sliding 0 V2 W Wet Stopped Passenger van Other motor vehicle /03/24 We 13:30 Clear Daylight Rear end P.D. only V1 E Dry Going ahead Automobile, station Other motor vehicle 0 V2 E Dry Slowing or Pick-up truck Other motor vehicle /06/16 We 17:13 Rain Daylight Rear end P.D. only V1 W Wet Slowing or Automobile, station Other motor vehicle 0 V2 W Wet Stopped Automobile, station Other motor vehicle /10/17 Sun 12:45 Clear Daylight Rear end P.D. only V1 W Dry Going ahead Automobile, station Other motor vehicle 0 V2 W Dry Slowing or Automobile, station Other motor vehicle /11/11 Thu 08:40 Unknow Daylight Rear end P.D. only V1 E Dry Slowing or Automobile, station Other motor vehicle 0 V2 E Dry Stopped Unknown Other motor vehicle /03/04 Frid 17:46 Clear Daylight Other P.D. only V1 N Dry Reversing Automobile, station Other motor vehicle 0 V2 S Dry Slowing or Automobile, station Other motor vehicle /06/14 Tue 15:18 Clear Daylight Rear end Non-fatal V1 N Dry Turning left Automobile, station Other motor vehicle 0 V2 N Dry Turning left Automobile, station Other motor vehicle /09/21 We 01:26 Clear Dark Turning P.D. only V1 E Dry Going ahead Automobile, station Other motor vehicle 0 V2 W Dry Turning left Automobile, station Other motor vehicle (Note: Time of Day = "00:00" represents unknown collision time November 13, 2012 Page 4 of 12
59 Collision Main Detail Summary OnTRAC Reporting System FROM: 2009/01/01 TO: 2012/01/01 DOWNPATRICK RD & HUNT CLUB RD Former Municipality: Ottawa Traffic Control: Traffic signal Number of Collisions: 34 COLLISION IMPACT TYPE SURFACE VEHICLE DRIVER No. ID DATE DAY TIME ENV LIGHT CLASS DIR COND'N MANOEUVRE VEHICLE TYPE FIRST EVENT ACTION PED /01/11 Sun 13:41 Clear Daylight Angle Non-fatal V1 E Dry Going ahead Automobile, station Other motor vehicle 0 V2 S Dry Turning left Automobile, station Other motor vehicle V3 N Dry Turning right Automobile, station Other motor vehicle /01/29 Thu 17:35 Snow Dusk Turning Non-fatal V1 E Loose snow Going ahead Pick-up truck Other motor vehicle 0 V2 W Loose snow Turning left Automobile, station Other motor vehicle /05/20 We 13:20 Clear Daylight Rear end P.D. only V1 W Dry Going ahead Pick-up truck Other motor vehicle 0 V2 W Dry Slowing or Pick-up truck Other motor vehicle V3 W Dry Stopped Automobile, station Other motor vehicle /07/25 Sat 23:00 Rain Dark Turning P.D. only V1 E Wet Going ahead Automobile, station Other motor vehicle 0 V2 W Wet Turning left Automobile, station Other motor vehicle /08/11 Tue 15:00 Clear Daylight Angle P.D. only V1 S Dry Unknown Bicycle Other motor vehicle 0 V2 W Dry Going ahead Automobile, station Cyclist /08/12 We 22:20 Clear Dark Rear end P.D. only V1 W Dry Slowing or Automobile, station Other motor vehicle 0 V2 W Dry Going ahead Automobile, station Other motor vehicle /08/21 Frid 19:35 Clear Dusk Rear end P.D. only V1 W Dry Going ahead Automobile, station Other motor vehicle 0 V2 W Dry Stopped Automobile, station Other motor vehicle /09/24 Thu 18:40 Clear Daylight Rear end Non-fatal V1 W Dry Turning left Passenger van Other motor vehicle 0 V2 W Dry Turning left Pick-up truck Other motor vehicle V3 W Dry Turning left Automobile, station Other motor vehicle /10/09 Frid 13:41 Rain Daylight Rear end P.D. only V1 W Wet Turning right Automobile, station Other motor vehicle 0 V2 W Wet Turning right Automobile, station Other motor vehicle /11/05 Thu 17:45 Rain Dark Turning P.D. only V1 W Wet Turning left Automobile, station Other motor vehicle 0 V2 E Wet Going ahead Automobile, station Other motor vehicle /11/20 Frid 23:15 Rain Dark Rear end P.D. only V1 W Wet Slowing or Automobile, station Other motor vehicle 0 V2 W Wet Stopped Automobile, station Other motor vehicle (Note: Time of Day = "00:00" represents unknown collision time November 13, 2012 Page 5 of 12
60 Collision Main Detail Summary OnTRAC Reporting System FROM: 2009/01/01 TO: 2012/01/ /12/01 Tue 15:04 Clear Daylight Turning Non-fatal V1 W Dry Going ahead Automobile, station Other motor vehicle 0 V2 E Dry Turning left Automobile, station Other motor vehicle /01/15 Frid 07:15 Rain Dawn Single vehicle Non-fatal V1 S Wet Turning left Automobile, station Pedestrian /01/29 Frid 16:49 Clear Dusk Turning P.D. only V1 W Dry Going ahead Delivery van Other motor vehicle 0 V2 E Dry Turning left Automobile, station Other motor vehicle /05/13 Thu 13:00 Clear Daylight Rear end Non-fatal V1 E Dry Slowing or Pick-up truck Other motor vehicle 0 V2 E Dry Stopped Automobile, station Other motor vehicle /06/03 Thu 13:22 Clear Daylight Angle P.D. only V1 W Dry Going ahead Automobile, station Other motor vehicle 0 V2 S Dry Going ahead Automobile, station Other motor vehicle /06/21 Mo 23:54 Clear Dark Rear end P.D. only V1 S Dry Turning left Automobile, station Other motor vehicle 0 V2 S Dry Turning left Automobile, station Other motor vehicle /06/22 Tue 21:38 Rain Dark Turning Non-fatal V1 W Wet Going ahead Automobile, station Other motor vehicle 0 V2 E Wet Turning left Unknown Other motor vehicle /06/30 We 19:10 Rain Daylight Turning P.D. only V1 W Wet Going ahead Automobile, station Other motor vehicle 0 V2 E Wet Turning left Automobile, station Other motor vehicle /10/24 Sun 14:30 Rain Daylight Turning P.D. only V1 E Wet Turning left Automobile, station Other motor vehicle 0 V2 W Wet Going ahead Automobile, station Other motor vehicle /12/13 Mo 17:17 Clear Dark Rear end P.D. only V1 W Wet Going ahead Automobile, station Other motor vehicle 0 V2 W Wet Slowing or Automobile, station Other motor vehicle /12/20 Mo 11:53 Clear Daylight Rear end P.D. only V1 E Wet Going ahead Automobile, station Other motor vehicle 0 V2 E Wet Slowing or Automobile, station Other motor vehicle /02/09 We 22:51 Clear Dark Turning P.D. only V1 W Wet Going ahead Passenger van Other motor vehicle 0 V2 E Packed snow Turning left Automobile, station Other motor vehicle /04/11 Mo 15:45 Clear Daylight Rear end P.D. only V1 E Dry Going ahead Automobile, station Other motor vehicle 0 V2 E Dry Stopped Automobile, station Other motor vehicle /04/12 Tue 17:50 Unknow Daylight Rear end P.D. only V1 S Unknown Changing lanes Automobile, station Other motor vehicle 0 V2 S Unknown Stopped Automobile, station Other motor vehicle (Note: Time of Day = "00:00" represents unknown collision time November 13, 2012 Page 6 of 12
61 Collision Main Detail Summary OnTRAC Reporting System FROM: 2009/01/01 TO: 2012/01/ /06/07 Tue 15:21 Clear Daylight Rear end P.D. only V1 W Dry Going ahead Automobile, station Other motor vehicle 0 V2 W Dry Slowing or Passenger van Other motor vehicle V3 W Dry Stopped Passenger van Other motor vehicle /06/28 Tue 15:03 Clear Daylight Rear end P.D. only V1 W Dry Slowing or Automobile, station Other motor vehicle 0 V2 W Dry Going ahead Automobile, station Other motor vehicle /07/04 Mo 09:40 Clear Daylight Angle P.D. only V1 W Dry Turning right Automobile, station Other motor vehicle 0 V2 N Dry Going ahead Automobile, station Other motor vehicle /07/17 Sun 17:45 Clear Daylight Rear end P.D. only V1 W Dry Going ahead Automobile, station Other motor vehicle 0 V2 W Dry Stopped Automobile, station Other motor vehicle /09/10 Sat 10:30 Clear Daylight Rear end Non-fatal V1 W Dry Going ahead Automobile, station Other motor vehicle 0 V2 W Dry Stopped Automobile, station Other motor vehicle /11/04 Frid 09:28 Clear Daylight Single vehicle Non-fatal V1 S Dry Turning left Automobile, station Pedestrian /12/22 Thu 20:39 Clear Dark Turning P.D. only V1 E Wet Turning left Automobile, station Other motor vehicle 0 V2 W Wet Going ahead Automobile, station Other motor vehicle /12/24 Sat 11:35 Clear Daylight Rear end P.D. only V1 W Dry Going ahead Automobile, station Other motor vehicle 0 V2 W Dry Slowing or Pick-up truck Other motor vehicle /12/28 We 10:53 Snow Daylight Single vehicle P.D. only V1 N Ice Turning left Automobile, station Curb 0 HUNT CLUB RD & NORTH BOWESVILLE RD Former Municipality: Ottawa Traffic Control: Traffic signal Number of Collisions: 18 COLLISION IMPACT TYPE SURFACE VEHICLE DRIVER No. ID DATE DAY TIME ENV LIGHT CLASS DIR COND'N MANOEUVRE VEHICLE TYPE FIRST EVENT ACTION PED /01/02 Frid 12:12 Snow Daylight Other P.D. only V1 W Loose snow Slowing or Delivery van Curb 0 V2 E Loose snow Going ahead Delivery van Other motor vehicle V3 E Loose snow Going ahead Passenger van Other motor vehicle /01/18 Sun 11:40 Snow Daylight Single vehicle Non-fatal V1 W Loose snow Slowing or Automobile, station Pole (utility, tower) /04/01 We 14:30 Rain Daylight Rear end P.D. only V1 N Wet Going ahead Pick-up truck Other motor vehicle 0 V2 N Wet Turning left Truck - tank Other motor vehicle (Note: Time of Day = "00:00" represents unknown collision time November 13, 2012 Page 7 of 12
62 Collision Main Detail Summary OnTRAC Reporting System FROM: 2009/01/01 TO: 2012/01/ /08/21 Frid 14:20 Rain Daylight Angle P.D. only V1 E Wet Reversing Truck - open Other motor vehicle 0 V2 S Wet Turning right Automobile, station Other motor vehicle /11/30 Mo 09:36 Snow Daylight Rear end Non-fatal V1 W Wet Going ahead Pick-up truck Other motor vehicle 0 V2 W Wet Slowing or Automobile, station Other motor vehicle /02/09 Tue 07:25 Clear Daylight Rear end Non-fatal V1 N Dry Turning right Pick-up truck Other motor vehicle 0 V2 N Dry Turning right Automobile, station Other motor vehicle /07/10 Sat 16:00 Clear Daylight Rear end P.D. only V1 E Dry Going ahead Automobile, station Other motor vehicle 0 V2 E Dry Stopped Automobile, station Other motor vehicle /07/27 Tue 11:46 Clear Daylight Angle P.D. only V1 W Dry Going ahead Motorcycle Other motor vehicle 0 V2 S Dry Turning right Pick-up truck Other motor vehicle /10/19 Tue 22:10 Clear Dark Rear end P.D. only V1 N Dry Turning right Automobile, station Other motor vehicle 0 V2 N Dry Turning right Pick-up truck Other motor vehicle /10/21 Thu 12:45 Clear Daylight Angle P.D. only V1 N Dry Reversing Automobile, station Other motor vehicle 0 V2 E Dry Stopped Automobile, station Other motor vehicle /10/23 Sat 20:14 Clear Dark Rear end P.D. only V1 E Dry Going ahead Automobile, station Other motor vehicle 0 V2 E Dry Slowing or Automobile, station Other motor vehicle /10/27 We 09:15 Clear Daylight Angle P.D. only V1 E Dry Turning right Automobile, station Other motor vehicle 0 V2 N Dry Turning left Automobile, station Other motor vehicle /02/05 Sat 15:55 Clear Daylight Rear end P.D. only V1 E Dry Slowing or Automobile, station Other motor vehicle 0 V2 E Dry Stopped Automobile, station Other motor vehicle /02/07 Mo 20:55 Snow Dark Angle P.D. only V1 E Packed snow Turning right Automobile, station Other motor vehicle 0 V2 N Packed snow Turning left Automobile, station Other motor vehicle (Note: Time of Day = "00:00" represents unknown collision time November 13, 2012 Page 8 of 12
63 Collision Main Detail Summary OnTRAC Reporting System FROM: 2009/01/01 TO: 2012/01/ /02/17 Thu 01:55 Clear Dark Approaching P.D. only V1 W Dry Going ahead Delivery van Other motor vehicle 0 V2 E Dry Stopped Construction Other motor vehicle /04/21 Thu 18:55 Clear Daylight Rear end P.D. only V1 W Dry Going ahead Automobile, station Other motor vehicle 0 V2 W Dry Stopped Automobile, station Other motor vehicle /08/19 Frid 13:10 Clear Daylight Sideswipe P.D. only V1 E Dry Changing lanes Pick-up truck Other motor vehicle 0 V2 E Dry Going ahead Automobile, station Other motor vehicle /09/15 Thu 07:29 Rain Daylight Rear end P.D. only V1 W Wet Going ahead Automobile, station Other motor vehicle 0 V2 W Wet Going ahead Pick-up truck Other motor vehicle HUNT CLUB RD & UPLANDS DR Former Municipality: Ottawa Traffic Control: Traffic signal Number of Collisions: 40 COLLISION IMPACT TYPE SURFACE VEHICLE DRIVER No. ID DATE DAY TIME ENV LIGHT CLASS DIR COND'N MANOEUVRE VEHICLE TYPE FIRST EVENT ACTION PED /01/15 Thu 12:39 Clear Daylight Rear end Non-fatal V1 E Ice Changing lanes Automobile, station Other motor vehicle 0 V2 E Ice Going ahead Automobile, station Other motor vehicle /01/28 We 19:57 Snow Dark Single vehicle P.D. only V1 E Loose snow Going ahead Pick-up truck Skidding/Sliding /02/19 Thu 06:51 Snow Dawn Sideswipe P.D. only V1 E Ice Turning right Automobile, station Skidding/Sliding 0 V2 E Ice Stopped Automobile, station Pole (sign, parking /02/19 Thu 08:00 Snow Daylight Single vehicle P.D. only V1 E Ice Turning right Automobile, station Skidding/Sliding /02/19 Thu 06:58 Snow Dawn Single vehicle P.D. only V1 E Ice Turning right Automobile, station Skidding/Sliding /04/20 Mo 19:03 Rain Dark Turning Non-fatal V1 E Wet Going ahead Automobile, station Other motor vehicle 0 V2 W Wet Turning left Automobile, station Other motor vehicle /06/01 Mo 21:39 Clear Dark Turning Non-fatal V1 W Wet Turning left Automobile, station Other motor vehicle 0 V2 E Wet Going ahead Automobile, station Other motor vehicle /06/12 Frid 20:58 Clear Dusk Angle P.D. only V1 S Dry Turning left Automobile, station Other motor vehicle 0 V2 E Dry Going ahead Automobile, station Other motor vehicle /06/22 Mo 17:55 Clear Daylight Single vehicle Non-fatal V1 N Dry Turning left Automobile, station Pedestrian 1 (Note: Time of Day = "00:00" represents unknown collision time November 13, 2012 Page 9 of 12
64 Collision Main Detail Summary OnTRAC Reporting System FROM: 2009/01/01 TO: 2012/01/ /07/03 Frid 16:50 Clear Daylight Rear end Non-fatal V1 E Wet Slowing or Automobile, station Other motor vehicle 0 V2 E Wet Stopped Automobile, station Other motor vehicle /07/24 Frid 15:15 Clear Daylight Rear end P.D. only V1 N Dry Slowing or Automobile, station Other motor vehicle 0 V2 N Dry Going ahead Automobile, station Other motor vehicle /07/24 Frid 11:20 Clear Daylight Angle P.D. only V1 S Dry Going ahead Automobile, station Other motor vehicle 0 V2 E Dry Going ahead Automobile, station Other motor vehicle /08/26 We 17:00 Clear Daylight Other P.D. only V1 N Dry Reversing Passenger van Other motor vehicle 0 V2 S Dry Stopped Passenger van Other motor vehicle /09/03 Thu 19:30 Clear Dark Sideswipe P.D. only V1 N Dry Turning left Truck and trailer Other motor vehicle 0 V2 N Dry Turning left Automobile, station Other motor vehicle /09/14 Mo 17:36 Rain Daylight Turning P.D. only V1 E Wet Going ahead Automobile, station Other motor vehicle 0 V2 W Wet Turning left Automobile, station Other motor vehicle /11/01 Sun 17:57 Clear Dark Turning P.D. only V1 E Dry Going ahead Pick-up truck Other motor vehicle 0 V2 W Dry Turning left Automobile, station Other motor vehicle /11/15 Sun 16:27 Rain Dusk Other P.D. only V1 N Wet Turning left Pick-up truck Skidding/Sliding 0 V2 E Wet Turning left Automobile, station Other motor vehicle /11/30 Mo 12:45 Clear Daylight Rear end P.D. only V1 N Dry Turning left Truck - dump Other motor vehicle 0 V2 N Dry Turning left Automobile, station Other motor vehicle /02/02 Tue 00:25 Clear Dark Rear end P.D. only V1 N Dry Turning left Pick-up truck Other motor vehicle 0 V2 N Dry Turning left Passenger van Other motor vehicle /02/04 Thu 14:15 Clear Daylight Angle P.D. only V1 N Dry Going ahead Pick-up truck Other motor vehicle 0 V2 W Dry Turning left Ambulance Other motor vehicle /02/23 Tue 06:30 Snow Dawn Angle Non-fatal V1 E Slush Slowing or Automobile, station Skidding/Sliding 0 V2 N Slush Stopped Automobile, station Other motor vehicle /04/16 Frid 07:06 Rain Daylight Angle P.D. only V1 N Wet Going ahead Pick-up truck Other motor vehicle 0 V2 E Wet Going ahead Municipal transit bus Other motor vehicle (Note: Time of Day = "00:00" represents unknown collision time November 13, 2012 Page 10 of 12
65 Collision Main Detail Summary OnTRAC Reporting System FROM: 2009/01/01 TO: 2012/01/ /04/18 Sun 12:14 Clear Daylight Rear end Non-fatal V1 E Dry Going ahead Automobile, station Other motor vehicle 0 V2 E Dry Stopped Automobile, station Other motor vehicle V3 E Dry Stopped Automobile, station Other motor vehicle /07/30 Frid 17:00 Clear Daylight Rear end P.D. only V1 E Dry Going ahead Automobile, station Other motor vehicle 0 V2 E Dry Stopped Passenger van Other motor vehicle /09/01 We 18:05 Clear Daylight Sideswipe Non-fatal V1 E Dry Turning right Automobile, station Other motor vehicle 0 V2 E Dry Turning right Motorcycle Other motor vehicle /09/03 Frid 21:49 Rain Dark Rear end P.D. only V1 E Wet Turning right Automobile, station Other motor vehicle 0 V2 E Wet Turning right Pick-up truck Other motor vehicle /12/23 Thu 22:50 Clear Dark Rear end Non-fatal V1 E Dry Turning right Automobile, station Other motor vehicle 0 V2 E Dry Turning right Automobile, station Other motor vehicle /01/23 Sun 16:26 Clear Daylight Turning Non-fatal V1 N Dry Turning left Passenger van Other motor vehicle 0 V2 S Dry Going ahead Automobile, station Other motor vehicle /02/02 We 19:36 Snow Dark Turning P.D. only V1 W Packed snow Turning left Pick-up truck Other motor vehicle 0 V2 E Packed snow Going ahead Automobile, station Other motor vehicle /02/14 Mo 01:51 Rain Dark Single vehicle P.D. only V1 E Loose snow Turning right Automobile, station Pole (sign, parking /02/27 Sun 09:00 Clear Daylight Rear end Non-fatal V1 E Wet Going ahead Automobile, station Other motor vehicle 0 V2 E Wet Stopped Automobile, station Other motor vehicle /04/04 Mo 13:53 Rain Daylight Turning P.D. only V1 S Wet Turning left Automobile, station Other motor vehicle 0 V2 S Wet Turning left Automobile, station Other motor vehicle /04/21 Thu 09:50 Clear Daylight Rear end P.D. only V1 E Dry Going ahead Delivery van Other motor vehicle 0 V2 E Dry Stopped Automobile, station Other motor vehicle /04/30 Sat 12:37 Clear Daylight Turning P.D. only V1 N Dry Turning left Pick-up truck Other motor vehicle 0 V2 S Dry Going ahead Automobile, station Other motor vehicle /05/20 Frid 09:33 Clear Daylight Rear end P.D. only V1 W Dry Going ahead Municipal transit bus Other motor vehicle 0 V2 W Dry Stopped Automobile, station Other motor vehicle V3 W Dry Stopped Pick-up truck Other motor vehicle /05/30 Mo 17:00 Clear Daylight Rear end P.D. only V1 E Dry Turning right Automobile, station Other motor vehicle 0 V2 E Dry Turning right Automobile, station Other motor vehicle (Note: Time of Day = "00:00" represents unknown collision time November 13, 2012 Page 11 of 12
66 Collision Main Detail Summary OnTRAC Reporting System FROM: 2009/01/01 TO: 2012/01/ /07/06 We 14:15 Clear Daylight Rear end P.D. only V1 E Dry Turning right Pick-up truck Other motor vehicle 0 V2 E Dry Turning right Automobile, station Other motor vehicle /07/16 Sat 15:50 Clear Daylight Rear end P.D. only V1 W Dry Slowing or Automobile, station Other motor vehicle 0 V2 W Dry Stopped Passenger van Other motor vehicle /12/13 Tue 06:24 Clear Dark Turning Non-fatal V1 N Wet Turning left Passenger van Other motor vehicle 0 V2 S Wet Going ahead Automobile, station Other motor vehicle /12/15 Thu 19:00 Rain Dark Sideswipe P.D. only V1 W Wet Turning right Automobile, station Other motor vehicle 0 V2 W Wet Turning right Automobile, station Other motor vehicle (Note: Time of Day = "00:00" represents unknown collision time November 13, 2012 Page 12 of 12
67 Total Area Single vehicle Classification of Turning Single Vehicle Rear End Sideswipe Angle Approaching (Unattended Accident Movement (other) vehicle) Other Total P.D. only % Non-fatal injury % Non reportable % Total % 15% 7% 9% 1% 9% 0% 3% AIRPORT HUNT CLUB RD Total # 24 Hr AADT Years Days Collisions/MEV Collisions Veh Volume , Classification of Accident Rear End Turning Movement Sideswipe Angle Approaching Single Vehicle (other) Single vehicle (Unattended vehicle) P.D. only % Non-fatal injury % Non reportable % Total % 0% 13% 0% 0% 8% 0% 0% Other Total DEAN MARTIN HUNT CLUB RD Total # 24 Hr AADT Years Days Collisions/MEV Collisions Veh Volume , Classification of Accident Rear End Turning Movement Sideswipe Angle Approaching Single Vehicle (other) Single vehicle (Unattended vehicle) P.D. only % Non-fatal injury % Non reportable % Total % 22% 6% 0% 0% 6% 0% 6% Other Total HUNT CLUB RD Total # 24 Hr AADT Years Days Collisions/MEV Collisions Veh Volume , Classification of Accident Rear End Turning Movement Sideswipe Angle Approaching Single Vehicle (other) Single vehicle (Unattended vehicle) P.D. only % Non-fatal injury % Non reportable % Total % 29% 0% 12% 0% 9% 0% 0% Other Total HUNT CLUB UPLANDS DR Total # 24 Hr AADT Years Days Collisions/MEV Collisions Veh Volume , Classification of Accident Rear End Turning Movement Sideswipe Angle Approaching Single Vehicle (other) Single vehicle (Unattended vehicle) P.D. only % Non-fatal injury % Non reportable % Total % 23% 10% 13% 0% 13% 0% 5% Other Total HUNT CLUB NORTH BOWESVILLE RD Total # 24 Hr AADT Years Days Collisions/MEV Collisions Veh Volume , Classification of Accident Rear End Turning Movement Sideswipe Angle Approaching Single Vehicle (other) Single vehicle (Unattended vehicle) P.D. only % Non-fatal injury % Non reportable % Total % 0% 6% 28% 6% 6% 0% 6% Other Total
68 Appendix D Background Traffic Growth Analysis
69 Hunt Club/Paul Anka 8 hrs Year Date North Leg South Leg East Leg West Leg SB NB NB SB WB EB EB WB Total 2006 Monday 24 July Tuesday 23 June Wednesday 15 June Counts % Change Year North Leg NB SB NB+SB INT NB SB NB+SB INT % 2.9% 20.5% 23.6% % -10.5% -14.5% -6.4% Regression Estimate Regression Estimate Average Annual Change 2.63% -1.38% 1.02% Counts % Change Year West Leg EB WB EB+WB INT EB WB EB+WB INT % 6.6% 24.2% 23.6% % 2.6% -7.3% -6.4% Regression Estimate Regression Estimate Average Annual Change 4.26% 1.81% 3.11% Counts % Change Year East Leg EB WB EB+WB INT EB WB EB+WB INT % 6.2% 23.0% 23.6% % 3.0% -6.9% -6.4% Regression Estimate Regression Estimate Average Annual Change 4.06% 1.82% 2.98% Counts % Change Year South Leg NB SB NB+SB INT NB SB NB+SB INT % 24.6% 25.6% 23.6% % 16.1% 16.6% -6.4% Regression Estimate Regression Estimate Average Annual Change 8.31% 7.65% 7.93%
70 Hunt Club/Paul Anka AM Peak Year Date North Leg South Leg East Leg West Leg SB NB NB SB WB EB EB WB Total 2006 Monday 24 July Tuesday 23 June Wednesday 15 June Counts % Change Year North Leg NB SB NB+SB INT NB SB NB+SB INT % -10.8% 23.1% 24.0% % 20.7% 3.8% -7.0% Regression Estimate Regression Estimate Average Annual Change 9.49% 1.15% 5.09% Counts % Change Year West Leg EB WB EB+WB INT EB WB EB+WB INT % 8.5% 23.6% 24.0% % -0.4% -8.3% -7.0% Regression Estimate Regression Estimate Average Annual Change 3.95% 1.63% 2.80% Counts % Change Year East Leg EB WB EB+WB INT EB WB EB+WB INT % 9.2% 24.9% 24.0% % -1.4% -7.8% -7.0% Regression Estimate Regression Estimate Average Annual Change 4.65% 1.58% 3.12% Counts % Change Year South Leg NB SB NB+SB INT NB SB NB+SB INT % -2.7% 18.8% 24.0% % 2.8% 13.4% -7.0% Regression Estimate Regression Estimate Average Annual Change 14.17% -0.07% 6.12%
71 Hunt Club/Paul Anka PM Peak Year Date North Leg South Leg East Leg West Leg SB NB NB SB WB EB EB WB Total 2006 Monday 24 July Tuesday 23 June Wednesday 15 June Counts % Change Year North Leg NB SB NB+SB INT NB SB NB+SB INT % 0.0% -4.0% 20.1% % 37.5% 2.5% -9.6% Regression Estimate Regression Estimate Average Annual Change -3.10% 6.45% -0.41% Counts % Change Year West Leg EB WB EB+WB INT EB WB EB+WB INT % 0.0% 21.5% 20.1% % 12.6% -12.5% -9.6% Regression Estimate Regression Estimate Average Annual Change 1.08% 2.27% 1.60% Counts % Change Year East Leg EB WB EB+WB INT EB WB EB+WB INT % 0.1% 19.9% 20.1% % 14.7% -10.6% -9.6% Regression Estimate Regression Estimate Average Annual Change 0.93% 2.66% 1.72% Counts % Change Year South Leg NB SB NB+SB INT NB SB NB+SB INT % 50.0% 20.1% 20.1% % 35.7% 45.8% -9.6% Regression Estimate Regression Estimate Average Annual Change 6.51% 15.48% 12.09%
72 Appendix E SYNCHRO Capacity Analysis: 2014 Projected Conditions
73 AM Projected : Canadair/Bowesville & Hunt Club Lane Group EBL EBT EBR WBL WBT NBL NBT NBR SBL SBT Volume (vph) Lane Group Flow (vph) Turn Type Prot NA Perm Prot NA Perm NA Perm Perm NA Protected Phases Permitted Phases Detector Phase Switch Phase Minimum Initial (s) Minimum Split (s) Total Split (s) Total Split (%) 10.4% 56.5% 56.5% 10.4% 56.5% 33.0% 33.0% 33.0% 33.0% 33.0% Yellow Time (s) All-Red Time (s) Lost Time Adjust (s) Total Lost Time (s) Lead/Lag Lead Lag Lag Lead Lag Lead-Lag Optimize? Yes Yes Yes Yes Yes Recall Mode None C-Max C-Max None C-Max None None None None None Act Effct Green (s) Actuated g/c Ratio v/c Ratio Control Delay Queue Delay Total Delay LOS E C A E B E A C Approach Delay Approach LOS C B D C Queue Length 50th (m) Queue Length 95th (m) # Internal Link Dist (m) Turn Bay Length (m) Base Capacity (vph) Starvation Cap Reductn Spillback Cap Reductn Storage Cap Reductn Reduced v/c Ratio Cycle Length: 115 Actuated Cycle Length: 115 Offset: 0 (0%), Referenced to phase 2:EBT and 6:WBT, Start of Green Natural Cycle: 90 Control Type: Actuated-Coordinated Maximum v/c Ratio: 0.76 Intersection Signal Delay: 22.3 Intersection Capacity Utilization 78.2% # 95th percentile volume exceeds capacity, queue may be longer. Queue shown is maximum after two cycles. Intersection LOS: C ICU Level of Service D Splits and Phases: 1: Canadair/Bowesville & Hunt Club
74 AM Projected : Paul Anka & Hunt Club Lane Group EBL EBT EBR WBL WBT WBR NBL NBT NBR SBL SBT Volume (vph) Lane Group Flow (vph) Turn Type Prot NA Perm Prot NA Perm Perm NA Perm Perm NA Protected Phases Permitted Phases Detector Phase Switch Phase Minimum Initial (s) Minimum Split (s) Total Split (s) Total Split (%) 13.8% 45.0% 45.0% 13.8% 45.0% 45.0% 41.3% 41.3% 41.3% 41.3% 41.3% Yellow Time (s) All-Red Time (s) Lost Time Adjust (s) Total Lost Time (s) Lead/Lag Lead Lag Lag Lead Lag Lag Lead-Lag Optimize? Yes Yes Yes Yes Yes Yes Recall Mode None C-Max C-Max None C-Max C-Max None None None None None Act Effct Green (s) Actuated g/c Ratio v/c Ratio Control Delay Queue Delay Total Delay LOS D C A D B A D C A C B Approach Delay Approach LOS C B C B Queue Length 50th (m) Queue Length 95th (m) 13.3 # m m Internal Link Dist (m) Turn Bay Length (m) Base Capacity (vph) Starvation Cap Reductn Spillback Cap Reductn Storage Cap Reductn Reduced v/c Ratio Cycle Length: 80 Actuated Cycle Length: 80 Offset: 11 (14%), Referenced to phase 2:EBT and 6:WBT, Start of Green Natural Cycle: 90 Control Type: Actuated-Coordinated Maximum v/c Ratio: 0.72 Intersection Signal Delay: 17.8 Intersection Capacity Utilization 69.2% # 95th percentile volume exceeds capacity, queue may be longer. Queue shown is maximum after two cycles. m Volume for 95th percentile queue is metered by upstream signal. Intersection LOS: B ICU Level of Service C Splits and Phases: 2: Paul Anka & Hunt Club
75 AM Projected : Uplands & Hunt Club Lane Group EBL EBT EBR WBL WBT WBR NBL NBT NBR SBL SBT Volume (vph) Lane Group Flow (vph) Turn Type pm+pt NA Perm pm+pt NA Perm Perm NA Perm Perm NA Protected Phases Permitted Phases Detector Phase Switch Phase Minimum Initial (s) Minimum Split (s) Total Split (s) Total Split (%) 13.8% 45.0% 45.0% 13.8% 45.0% 45.0% 41.3% 41.3% 41.3% 41.3% 41.3% Yellow Time (s) All-Red Time (s) Lost Time Adjust (s) Total Lost Time (s) Lead/Lag Lead Lag Lag Lead Lag Lag Lead-Lag Optimize? Yes Yes Yes Yes Yes Yes Recall Mode None C-Max C-Max None C-Max C-Max None None None None None Act Effct Green (s) Actuated g/c Ratio v/c Ratio Control Delay Queue Delay Total Delay LOS A A A A A A D C A C B Approach Delay Approach LOS A A C B Queue Length 50th (m) Queue Length 95th (m) m0.3 #118.3 m8.3 m m Internal Link Dist (m) Turn Bay Length (m) Base Capacity (vph) Starvation Cap Reductn Spillback Cap Reductn Storage Cap Reductn Reduced v/c Ratio Cycle Length: 80 Actuated Cycle Length: 80 Offset: 48 (60%), Referenced to phase 2:EBTL and 6:WBTL, Start of Green Natural Cycle: 80 Control Type: Actuated-Coordinated Maximum v/c Ratio: 0.75 Intersection Signal Delay: 9.6 Intersection Capacity Utilization 64.1% # 95th percentile volume exceeds capacity, queue may be longer. Queue shown is maximum after two cycles. m Volume for 95th percentile queue is metered by upstream signal. Intersection LOS: A ICU Level of Service C Splits and Phases: 4: Uplands & Hunt Club
76 AM Projected : Downpatrick/McCarthy & Hunt Club Lane Group EBL EBT EBR WBL WBT WBR NBL NBT SBL SBT SBR Volume (vph) Lane Group Flow (vph) Turn Type pm+pt NA Perm pm+pt NA Perm Perm NA Perm NA Perm Protected Phases Permitted Phases Detector Phase Switch Phase Minimum Initial (s) Minimum Split (s) Total Split (s) Total Split (%) 13.8% 43.8% 43.8% 13.8% 43.8% 43.8% 42.5% 42.5% 42.5% 42.5% 42.5% Yellow Time (s) All-Red Time (s) Lost Time Adjust (s) Total Lost Time (s) Lead/Lag Lead Lag Lag Lead Lag Lag Lead-Lag Optimize? Yes Yes Yes Yes Yes Yes Recall Mode None C-Max C-Max None C-Max C-Max None None None None None Act Effct Green (s) Actuated g/c Ratio v/c Ratio Control Delay Queue Delay Total Delay LOS A C A B B A C A D B A Approach Delay Approach LOS C B A D Queue Length 50th (m) Queue Length 95th (m) m1.0 #154.8 m Internal Link Dist (m) Turn Bay Length (m) Base Capacity (vph) Starvation Cap Reductn Spillback Cap Reductn Storage Cap Reductn Reduced v/c Ratio Cycle Length: 80 Actuated Cycle Length: 80 Offset: 11 (14%), Referenced to phase 2:EBTL and 6:WBTL, Start of Green Natural Cycle: 80 Control Type: Actuated-Coordinated Maximum v/c Ratio: 0.78 Intersection Signal Delay: 21.6 Intersection Capacity Utilization 82.2% # 95th percentile volume exceeds capacity, queue may be longer. Queue shown is maximum after two cycles. m Volume for 95th percentile queue is metered by upstream signal. Intersection LOS: C ICU Level of Service E Splits and Phases: 5: Downpatrick/McCarthy & Hunt Club
77 AM Projected : Airport Parkway & Hunt Club Lane Group EBL EBT WBL WBT NBL NBR SBL SBR ø4 Volume (vph) Lane Group Flow (vph) Turn Type Prot NA Prot NA Prot Free Prot Free Protected Phases Permitted Phases Free Free Detector Phase Switch Phase Minimum Initial (s) Minimum Split (s) Total Split (s) Total Split (%) 25.8% 40.0% 25.8% 40.0% 14.2% 34.2% 20% Yellow Time (s) All-Red Time (s) Lost Time Adjust (s) Total Lost Time (s) Lead/Lag Lead Lag Lead Lag Lag Lead Lead-Lag Optimize? Yes Yes Yes Yes Yes Yes Recall Mode None C-Max None C-Max None None None Act Effct Green (s) Actuated g/c Ratio v/c Ratio Control Delay Queue Delay Total Delay LOS D B E F D A E A Approach Delay Approach LOS C F Queue Length 50th (m) ~ Queue Length 95th (m) # Internal Link Dist (m) Turn Bay Length (m) Base Capacity (vph) Starvation Cap Reductn Spillback Cap Reductn Storage Cap Reductn Reduced v/c Ratio Cycle Length: 120 Actuated Cycle Length: 120 Offset: 1 (1%), Referenced to phase 2:EBT and 6:WBT, Start of Green Natural Cycle: 120 Control Type: Actuated-Coordinated Maximum v/c Ratio: 1.12 Intersection Signal Delay: 56.2 Intersection Capacity Utilization 89.8% ~ Volume exceeds capacity, queue is theoretically infinite. Queue shown is maximum after two cycles. # 95th percentile volume exceeds capacity, queue may be longer. Queue shown is maximum after two cycles. Intersection LOS: E ICU Level of Service E Splits and Phases: 6: Airport Parkway & Hunt Club
78 AM Projected : Gibford & Hunt Club Movement EBT EBR WBL WBT NBL NBR Volume (veh/h) Sign Control Free Free Stop Grade 0% 0% 0% Peak Hour Factor Hourly flow rate (vph) Pedestrians Lane Width (m) Walking Speed (m/s) Percent Blockage Right turn flare (veh) Median type None None Median storage veh) Upstream signal (m) px, platoon unblocked vc, conflicting volume vc1, stage 1 conf vol vc2, stage 2 conf vol vcu, unblocked vol tc, single (s) tc, 2 stage (s) tf (s) p0 queue free % cm capacity (veh/h) Direction, Lane # EB 1 EB 2 WB 1 WB 2 NB 1 Volume Total Volume Left Volume Right csh Volume to Capacity Queue Length 95th (m) Control Delay (s) Lane LOS B Approach Delay (s) Approach LOS B Average Delay 0.2 Intersection Capacity Utilization 47.9% ICU Level of Service A
79 AM Projected : Uplands & Gibford Movement EBL EBR NBL NBT SBT SBR Volume (veh/h) Sign Control Stop Free Free Grade 0% 0% 0% Peak Hour Factor Hourly flow rate (vph) Pedestrians Lane Width (m) Walking Speed (m/s) Percent Blockage Right turn flare (veh) Median type None None Median storage veh) Upstream signal (m) 211 px, platoon unblocked vc, conflicting volume vc1, stage 1 conf vol vc2, stage 2 conf vol vcu, unblocked vol tc, single (s) tc, 2 stage (s) tf (s) p0 queue free % cm capacity (veh/h) Direction, Lane # EB 1 NB 1 SB 1 Volume Total Volume Left Volume Right csh Volume to Capacity Queue Length 95th (m) Control Delay (s) Lane LOS B A Approach Delay (s) Approach LOS B Average Delay 1.0 Intersection Capacity Utilization 45.9% ICU Level of Service A
80 AM Projected : Paul Anka & Site Movement WBL WBR NBT NBR SBL SBT Volume (veh/h) Sign Control Stop Free Free Grade 0% 0% 0% Peak Hour Factor Hourly flow rate (vph) Pedestrians Lane Width (m) Walking Speed (m/s) Percent Blockage Right turn flare (veh) Median type None None Median storage veh) Upstream signal (m) 80 px, platoon unblocked vc, conflicting volume vc1, stage 1 conf vol vc2, stage 2 conf vol vcu, unblocked vol tc, single (s) tc, 2 stage (s) tf (s) p0 queue free % cm capacity (veh/h) Direction, Lane # WB 1 NB 1 SB 1 Volume Total Volume Left Volume Right csh Volume to Capacity Queue Length 95th (m) Control Delay (s) Lane LOS A A Approach Delay (s) Approach LOS A Average Delay 2.0 Intersection Capacity Utilization 31.3% ICU Level of Service A
81 AM Projected : Dean Martin & Site Movement EBL EBT WBT WBR SBL SBR Volume (veh/h) Sign Control Free Free Stop Grade 0% 0% 0% Peak Hour Factor Hourly flow rate (vph) Pedestrians Lane Width (m) Walking Speed (m/s) Percent Blockage Right turn flare (veh) Median type None None Median storage veh) Upstream signal (m) 241 px, platoon unblocked vc, conflicting volume vc1, stage 1 conf vol vc2, stage 2 conf vol vcu, unblocked vol tc, single (s) tc, 2 stage (s) tf (s) p0 queue free % cm capacity (veh/h) Direction, Lane # EB 1 WB 1 SB 1 Volume Total Volume Left Volume Right csh Volume to Capacity Queue Length 95th (m) Control Delay (s) Lane LOS A A Approach Delay (s) Approach LOS A Average Delay 3.2 Intersection Capacity Utilization 18.8% ICU Level of Service A
82 AM Projected : Gibford & Site Movement EBL EBR NBL NBT SBT SBR Volume (veh/h) Sign Control Stop Free Free Grade 0% 0% 0% Peak Hour Factor Hourly flow rate (vph) Pedestrians Lane Width (m) Walking Speed (m/s) Percent Blockage Right turn flare (veh) Median type None None Median storage veh) Upstream signal (m) px, platoon unblocked vc, conflicting volume vc1, stage 1 conf vol vc2, stage 2 conf vol vcu, unblocked vol tc, single (s) tc, 2 stage (s) tf (s) p0 queue free % cm capacity (veh/h) Direction, Lane # EB 1 NB 1 SB 1 Volume Total Volume Left Volume Right csh Volume to Capacity Queue Length 95th (m) Control Delay (s) Lane LOS A A Approach Delay (s) Approach LOS A Average Delay 4.0 Intersection Capacity Utilization 13.3% ICU Level of Service A
83 PM Projected : Canadair/Bowesville & Hunt Club Lane Group EBL EBT EBR WBL WBT NBL NBT NBR SBL SBT Volume (vph) Lane Group Flow (vph) Turn Type Prot NA Perm Prot NA Perm NA Perm Perm NA Protected Phases Permitted Phases Detector Phase Switch Phase Minimum Initial (s) Minimum Split (s) Total Split (s) Total Split (%) 10.4% 56.5% 56.5% 10.4% 56.5% 33.0% 33.0% 33.0% 33.0% 33.0% Yellow Time (s) All-Red Time (s) Lost Time Adjust (s) Total Lost Time (s) Lead/Lag Lead Lag Lag Lead Lag Lead-Lag Optimize? Yes Yes Yes Yes Yes Recall Mode None C-Max C-Max None C-Max None None None None None Act Effct Green (s) Actuated g/c Ratio v/c Ratio Control Delay Queue Delay Total Delay LOS E B A E B F B C Approach Delay Approach LOS B B F C Queue Length 50th (m) ~ Queue Length 95th (m) # Internal Link Dist (m) Turn Bay Length (m) Base Capacity (vph) Starvation Cap Reductn Spillback Cap Reductn Storage Cap Reductn Reduced v/c Ratio Cycle Length: 115 Actuated Cycle Length: 115 Offset: 0 (0%), Referenced to phase 2:EBT and 6:WBT, Start of Green Natural Cycle: 120 Control Type: Actuated-Coordinated Maximum v/c Ratio: 1.42 Intersection Signal Delay: 50.7 Intersection Capacity Utilization 83.1% ~ Volume exceeds capacity, queue is theoretically infinite. Queue shown is maximum after two cycles. # 95th percentile volume exceeds capacity, queue may be longer. Queue shown is maximum after two cycles. Intersection LOS: D ICU Level of Service E Splits and Phases: 1: Canadair/Bowesville & Hunt Club
84 PM Projected : Paul Anka & Hunt Club Lane Group EBL EBT EBR WBL WBT WBR NBL NBT NBR SBL SBT Volume (vph) Lane Group Flow (vph) Turn Type Prot NA Perm Prot NA Perm Perm NA Perm Perm NA Protected Phases Permitted Phases Detector Phase Switch Phase Minimum Initial (s) Minimum Split (s) Total Split (s) Total Split (%) 13.8% 45.0% 45.0% 13.8% 45.0% 45.0% 41.3% 41.3% 41.3% 41.3% 41.3% Yellow Time (s) All-Red Time (s) Lost Time Adjust (s) Total Lost Time (s) Lead/Lag Lead Lag Lag Lead Lag Lag Lead-Lag Optimize? Yes Yes Yes Yes Yes Yes Recall Mode None C-Max C-Max None C-Max C-Max None None None None None Act Effct Green (s) Actuated g/c Ratio v/c Ratio Control Delay Queue Delay Total Delay LOS D D A C B A D C A C B Approach Delay Approach LOS C B C B Queue Length 50th (m) Queue Length 95th (m) 15.7 # m35.0 #132.0 m Internal Link Dist (m) Turn Bay Length (m) Base Capacity (vph) Starvation Cap Reductn Spillback Cap Reductn Storage Cap Reductn Reduced v/c Ratio Cycle Length: 80 Actuated Cycle Length: 80 Offset: 11 (14%), Referenced to phase 2:EBT and 6:WBT, Start of Green Natural Cycle: 90 Control Type: Actuated-Coordinated Maximum v/c Ratio: 0.93 Intersection Signal Delay: 24.4 Intersection Capacity Utilization 76.6% # 95th percentile volume exceeds capacity, queue may be longer. Queue shown is maximum after two cycles. m Volume for 95th percentile queue is metered by upstream signal. Intersection LOS: C ICU Level of Service D Splits and Phases: 2: Paul Anka & Hunt Club
85 PM Projected : Uplands & Hunt Club Lane Group EBL EBT EBR WBL WBT WBR NBL NBT NBR SBL SBT Volume (vph) Lane Group Flow (vph) Turn Type pm+pt NA Perm pm+pt NA Perm Perm NA Perm Perm NA Protected Phases Permitted Phases Detector Phase Switch Phase Minimum Initial (s) Minimum Split (s) Total Split (s) Total Split (%) 13.8% 45.0% 45.0% 13.8% 45.0% 45.0% 41.3% 41.3% 41.3% 41.3% 41.3% Yellow Time (s) All-Red Time (s) Lost Time Adjust (s) Total Lost Time (s) Lead/Lag Lead Lag Lag Lead Lag Lag Lead-Lag Optimize? Yes Yes Yes Yes Yes Yes Recall Mode None C-Max C-Max None C-Max C-Max None None None None None Act Effct Green (s) Actuated g/c Ratio v/c Ratio Control Delay Queue Delay Total Delay LOS A A A A A A D C A C B Approach Delay Approach LOS A A D B Queue Length 50th (m) Queue Length 95th (m) m0.4 m#123.9 m5.3 m m Internal Link Dist (m) Turn Bay Length (m) Base Capacity (vph) Starvation Cap Reductn Spillback Cap Reductn Storage Cap Reductn Reduced v/c Ratio Cycle Length: 80 Actuated Cycle Length: 80 Offset: 48 (60%), Referenced to phase 2:EBTL and 6:WBTL, Start of Green Natural Cycle: 80 Control Type: Actuated-Coordinated Maximum v/c Ratio: 0.78 Intersection Signal Delay: 11.3 Intersection Capacity Utilization 66.3% # 95th percentile volume exceeds capacity, queue may be longer. Queue shown is maximum after two cycles. m Volume for 95th percentile queue is metered by upstream signal. Intersection LOS: B ICU Level of Service C Splits and Phases: 4: Uplands & Hunt Club
86 PM Projected : Downpatrick/McCarthy & Hunt Club Lane Group EBL EBT EBR WBL WBT WBR NBL NBT SBL SBT SBR Volume (vph) Lane Group Flow (vph) Turn Type pm+pt NA Perm pm+pt NA Perm Perm NA Perm NA Perm Protected Phases Permitted Phases Detector Phase Switch Phase Minimum Initial (s) Minimum Split (s) Total Split (s) Total Split (%) 13.8% 43.8% 43.8% 13.8% 43.8% 43.8% 42.5% 42.5% 42.5% 42.5% 42.5% Yellow Time (s) All-Red Time (s) Lost Time Adjust (s) Total Lost Time (s) Lead/Lag Lead Lag Lag Lead Lag Lag Lead-Lag Optimize? Yes Yes Yes Yes Yes Yes Recall Mode None C-Max C-Max None C-Max C-Max None None None None None Act Effct Green (s) Actuated g/c Ratio v/c Ratio Control Delay Queue Delay Total Delay LOS A D A C C A B A D C A Approach Delay Approach LOS C B B C Queue Length 50th (m) 1.9 ~ Queue Length 95th (m) m0.8 #172.8 m0.0 #37.7 # Internal Link Dist (m) Turn Bay Length (m) Base Capacity (vph) Starvation Cap Reductn Spillback Cap Reductn Storage Cap Reductn Reduced v/c Ratio Cycle Length: 80 Actuated Cycle Length: 80 Offset: 11 (14%), Referenced to phase 2:EBTL and 6:WBTL, Start of Green Natural Cycle: 90 Control Type: Actuated-Coordinated Maximum v/c Ratio: 0.95 Intersection Signal Delay: 26.8 Intersection Capacity Utilization 81.5% ~ Volume exceeds capacity, queue is theoretically infinite. Queue shown is maximum after two cycles. # 95th percentile volume exceeds capacity, queue may be longer. Queue shown is maximum after two cycles. m Volume for 95th percentile queue is metered by upstream signal. Intersection LOS: C ICU Level of Service D Splits and Phases: 5: Downpatrick/McCarthy & Hunt Club
87 PM Projected : Airport Parkway & Hunt Club Lane Group EBL EBT WBL WBT NBL NBR SBL SBR ø4 Volume (vph) Lane Group Flow (vph) Turn Type Prot NA Prot NA Prot Free Prot Free Protected Phases Permitted Phases Free Free Detector Phase Switch Phase Minimum Initial (s) Minimum Split (s) Total Split (s) Total Split (%) 15.4% 53.1% 15.4% 53.1% 13.1% 31.5% 18% Yellow Time (s) All-Red Time (s) Lost Time Adjust (s) Total Lost Time (s) Lead/Lag Lead Lag Lead Lag Lag Lead Lead-Lag Optimize? Yes Yes Yes Yes Yes Yes Recall Mode None C-Min None C-Max None None None Act Effct Green (s) Actuated g/c Ratio v/c Ratio Control Delay Queue Delay Total Delay LOS F C E F D A E A Approach Delay Approach LOS D F Queue Length 50th (m) ~ Queue Length 95th (m) #109.8 # # Internal Link Dist (m) Turn Bay Length (m) Base Capacity (vph) Starvation Cap Reductn Spillback Cap Reductn Storage Cap Reductn Reduced v/c Ratio Cycle Length: 130 Actuated Cycle Length: 130 Offset: 98 (75%), Referenced to phase 2:EBT and 6:WBT, Start of Green Natural Cycle: 120 Control Type: Actuated-Coordinated Maximum v/c Ratio: 1.13 Intersection Signal Delay: 64.4 Intersection Capacity Utilization 98.8% ~ Volume exceeds capacity, queue is theoretically infinite. Queue shown is maximum after two cycles. # 95th percentile volume exceeds capacity, queue may be longer. Queue shown is maximum after two cycles. Intersection LOS: E ICU Level of Service F Splits and Phases: 6: Airport Parkway & Hunt Club
88 PM Projected : Gibford & Hunt Club Movement EBT EBR WBL WBT NBL NBR Volume (veh/h) Sign Control Free Free Stop Grade 0% 0% 0% Peak Hour Factor Hourly flow rate (vph) Pedestrians Lane Width (m) Walking Speed (m/s) Percent Blockage Right turn flare (veh) Median type None None Median storage veh) Upstream signal (m) px, platoon unblocked vc, conflicting volume vc1, stage 1 conf vol vc2, stage 2 conf vol vcu, unblocked vol tc, single (s) tc, 2 stage (s) tf (s) p0 queue free % cm capacity (veh/h) Direction, Lane # EB 1 EB 2 WB 1 WB 2 NB 1 Volume Total Volume Left Volume Right csh Volume to Capacity Queue Length 95th (m) Control Delay (s) Lane LOS B Approach Delay (s) Approach LOS B Average Delay 0.2 Intersection Capacity Utilization 49.3% ICU Level of Service A
89 PM Projected : Uplands & Gibford Movement EBL EBR NBL NBT SBT SBR Volume (veh/h) Sign Control Stop Free Free Grade 0% 0% 0% Peak Hour Factor Hourly flow rate (vph) Pedestrians Lane Width (m) Walking Speed (m/s) Percent Blockage Right turn flare (veh) Median type None None Median storage veh) Upstream signal (m) 223 px, platoon unblocked vc, conflicting volume vc1, stage 1 conf vol vc2, stage 2 conf vol vcu, unblocked vol tc, single (s) tc, 2 stage (s) tf (s) p0 queue free % cm capacity (veh/h) Direction, Lane # EB 1 NB 1 SB 1 Volume Total Volume Left Volume Right csh Volume to Capacity Queue Length 95th (m) Control Delay (s) Lane LOS B A Approach Delay (s) Approach LOS B Average Delay 1.3 Intersection Capacity Utilization 49.9% ICU Level of Service A
90 PM Projected : Paul Anka & Site Movement WBL WBR NBT NBR SBL SBT Volume (veh/h) Sign Control Stop Free Free Grade 0% 0% 0% Peak Hour Factor Hourly flow rate (vph) Pedestrians Lane Width (m) Walking Speed (m/s) Percent Blockage Right turn flare (veh) Median type None None Median storage veh) Upstream signal (m) 99 px, platoon unblocked vc, conflicting volume vc1, stage 1 conf vol vc2, stage 2 conf vol vcu, unblocked vol tc, single (s) tc, 2 stage (s) tf (s) p0 queue free % cm capacity (veh/h) Direction, Lane # WB 1 NB 1 SB 1 Volume Total Volume Left Volume Right csh Volume to Capacity Queue Length 95th (m) Control Delay (s) Lane LOS A A Approach Delay (s) Approach LOS A Average Delay 2.2 Intersection Capacity Utilization 30.6% ICU Level of Service A
91 PM Projected : Dean Martin & Site Movement EBL EBT WBT WBR SBL SBR Volume (veh/h) Sign Control Free Free Stop Grade 0% 0% 0% Peak Hour Factor Hourly flow rate (vph) Pedestrians Lane Width (m) Walking Speed (m/s) Percent Blockage Right turn flare (veh) Median type None None Median storage veh) Upstream signal (m) 273 px, platoon unblocked vc, conflicting volume vc1, stage 1 conf vol vc2, stage 2 conf vol vcu, unblocked vol tc, single (s) tc, 2 stage (s) tf (s) p0 queue free % cm capacity (veh/h) Direction, Lane # EB 1 WB 1 SB 1 Volume Total Volume Left Volume Right csh Volume to Capacity Queue Length 95th (m) Control Delay (s) Lane LOS A A Approach Delay (s) Approach LOS A Average Delay 2.9 Intersection Capacity Utilization 19.6% ICU Level of Service A
92 PM Projected : Gibford & Site Movement EBL EBR NBL NBT SBT SBR Volume (veh/h) Sign Control Stop Free Free Grade 0% 0% 0% Peak Hour Factor Hourly flow rate (vph) Pedestrians Lane Width (m) Walking Speed (m/s) Percent Blockage Right turn flare (veh) Median type None None Median storage veh) Upstream signal (m) px, platoon unblocked vc, conflicting volume vc1, stage 1 conf vol vc2, stage 2 conf vol vcu, unblocked vol tc, single (s) tc, 2 stage (s) tf (s) p0 queue free % cm capacity (veh/h) Direction, Lane # EB 1 NB 1 SB 1 Volume Total Volume Left Volume Right csh Volume to Capacity Queue Length 95th (m) Control Delay (s) Lane LOS A A Approach Delay (s) Approach LOS A Average Delay 4.5 Intersection Capacity Utilization 14.1% ICU Level of Service A
93 Appendix F SYNCHRO Capacity Analysis: 2019 Projected Conditions
94 AM Projected : Canadair/Bowesville & Hunt Club Lane Group EBL EBT EBR WBL WBT NBL NBT NBR SBL SBT Volume (vph) Lane Group Flow (vph) Turn Type Prot NA Perm Prot NA Perm NA Perm Perm NA Protected Phases Permitted Phases Detector Phase Switch Phase Minimum Initial (s) Minimum Split (s) Total Split (s) Total Split (%) 10.4% 56.5% 56.5% 10.4% 56.5% 33.0% 33.0% 33.0% 33.0% 33.0% Yellow Time (s) All-Red Time (s) Lost Time Adjust (s) Total Lost Time (s) Lead/Lag Lead Lag Lag Lead Lag Lead-Lag Optimize? Yes Yes Yes Yes Yes Recall Mode None C-Max C-Max None C-Max None None None None None Act Effct Green (s) Actuated g/c Ratio v/c Ratio Control Delay Queue Delay Total Delay LOS E C A E B E A C Approach Delay Approach LOS C B D C Queue Length 50th (m) Queue Length 95th (m) 11.8 # # Internal Link Dist (m) Turn Bay Length (m) Base Capacity (vph) Starvation Cap Reductn Spillback Cap Reductn Storage Cap Reductn Reduced v/c Ratio Cycle Length: 115 Actuated Cycle Length: 115 Offset: 0 (0%), Referenced to phase 2:EBT and 6:WBT, Start of Green Natural Cycle: 100 Control Type: Actuated-Coordinated Maximum v/c Ratio: 0.87 Intersection Signal Delay: 25.2 Intersection Capacity Utilization 84.0% # 95th percentile volume exceeds capacity, queue may be longer. Queue shown is maximum after two cycles. Intersection LOS: C ICU Level of Service E Splits and Phases: 1: Canadair/Bowesville & Hunt Club
95 AM Projected : Paul Anka & Hunt Club Lane Group EBL EBT EBR WBL WBT WBR NBL NBT NBR SBL SBT Volume (vph) Lane Group Flow (vph) Turn Type Prot NA Perm Prot NA Perm Perm NA Perm Perm NA Protected Phases Permitted Phases Detector Phase Switch Phase Minimum Initial (s) Minimum Split (s) Total Split (s) Total Split (%) 13.8% 45.0% 45.0% 13.8% 45.0% 45.0% 41.3% 41.3% 41.3% 41.3% 41.3% Yellow Time (s) All-Red Time (s) Lost Time Adjust (s) Total Lost Time (s) Lead/Lag Lead Lag Lag Lead Lag Lag Lead-Lag Optimize? Yes Yes Yes Yes Yes Yes Recall Mode None C-Max C-Max None C-Max C-Max None None None None None Act Effct Green (s) Actuated g/c Ratio v/c Ratio Control Delay Queue Delay Total Delay LOS D C A D B A D C A C B Approach Delay Approach LOS C B C B Queue Length 50th (m) Queue Length 95th (m) 13.3 # m25.8 #150.6 m Internal Link Dist (m) Turn Bay Length (m) Base Capacity (vph) Starvation Cap Reductn Spillback Cap Reductn Storage Cap Reductn Reduced v/c Ratio Cycle Length: 80 Actuated Cycle Length: 80 Offset: 11 (14%), Referenced to phase 2:EBT and 6:WBT, Start of Green Natural Cycle: 90 Control Type: Actuated-Coordinated Maximum v/c Ratio: 0.83 Intersection Signal Delay: 20.4 Intersection Capacity Utilization 74.7% # 95th percentile volume exceeds capacity, queue may be longer. Queue shown is maximum after two cycles. m Volume for 95th percentile queue is metered by upstream signal. Intersection LOS: C ICU Level of Service D Splits and Phases: 2: Paul Anka & Hunt Club
96 AM Projected : Uplands & Hunt Club Lane Group EBL EBT EBR WBL WBT WBR NBL NBT NBR SBL SBT Volume (vph) Lane Group Flow (vph) Turn Type pm+pt NA Perm pm+pt NA Perm Perm NA Perm Perm NA Protected Phases Permitted Phases Detector Phase Switch Phase Minimum Initial (s) Minimum Split (s) Total Split (s) Total Split (%) 13.8% 45.0% 45.0% 13.8% 45.0% 45.0% 41.3% 41.3% 41.3% 41.3% 41.3% Yellow Time (s) All-Red Time (s) Lost Time Adjust (s) Total Lost Time (s) Lead/Lag Lead Lag Lag Lead Lag Lag Lead-Lag Optimize? Yes Yes Yes Yes Yes Yes Recall Mode None C-Max C-Max None C-Max C-Max None None None None None Act Effct Green (s) Actuated g/c Ratio v/c Ratio Control Delay Queue Delay Total Delay LOS A A A A A A D C A C B Approach Delay Approach LOS A A C B Queue Length 50th (m) Queue Length 95th (m) m0.3 #150.4 m6.5 m m Internal Link Dist (m) Turn Bay Length (m) Base Capacity (vph) Starvation Cap Reductn Spillback Cap Reductn Storage Cap Reductn Reduced v/c Ratio Cycle Length: 80 Actuated Cycle Length: 80 Offset: 48 (60%), Referenced to phase 2:EBTL and 6:WBTL, Start of Green Natural Cycle: 80 Control Type: Actuated-Coordinated Maximum v/c Ratio: 0.75 Intersection Signal Delay: 10.1 Intersection Capacity Utilization 68.9% # 95th percentile volume exceeds capacity, queue may be longer. Queue shown is maximum after two cycles. m Volume for 95th percentile queue is metered by upstream signal. Intersection LOS: B ICU Level of Service C Splits and Phases: 4: Uplands & Hunt Club
97 AM Projected : Downpatrick/McCarthy & Hunt Club Lane Group EBL EBT EBR WBL WBT WBR NBL NBT SBL SBT SBR Volume (vph) Lane Group Flow (vph) Turn Type pm+pt NA Perm pm+pt NA Perm Perm NA Perm NA Perm Protected Phases Permitted Phases Detector Phase Switch Phase Minimum Initial (s) Minimum Split (s) Total Split (s) Total Split (%) 13.8% 43.8% 43.8% 13.8% 43.8% 43.8% 42.5% 42.5% 42.5% 42.5% 42.5% Yellow Time (s) All-Red Time (s) Lost Time Adjust (s) Total Lost Time (s) Lead/Lag Lead Lag Lag Lead Lag Lag Lead-Lag Optimize? Yes Yes Yes Yes Yes Yes Recall Mode None C-Max C-Max None C-Max C-Max None None None None None Act Effct Green (s) Actuated g/c Ratio v/c Ratio Control Delay Queue Delay Total Delay LOS A C A B C A C A D B A Approach Delay Approach LOS C B A D Queue Length 50th (m) 2.8 ~ Queue Length 95th (m) m0.9 #191.4 m # Internal Link Dist (m) Turn Bay Length (m) Base Capacity (vph) Starvation Cap Reductn Spillback Cap Reductn Storage Cap Reductn Reduced v/c Ratio Cycle Length: 80 Actuated Cycle Length: 80 Offset: 11 (14%), Referenced to phase 2:EBTL and 6:WBTL, Start of Green Natural Cycle: 90 Control Type: Actuated-Coordinated Maximum v/c Ratio: 0.88 Intersection Signal Delay: 24.8 Intersection Capacity Utilization 87.2% ~ Volume exceeds capacity, queue is theoretically infinite. Queue shown is maximum after two cycles. # 95th percentile volume exceeds capacity, queue may be longer. Queue shown is maximum after two cycles. m Volume for 95th percentile queue is metered by upstream signal. Intersection LOS: C ICU Level of Service E Splits and Phases: 5: Downpatrick/McCarthy & Hunt Club
98 AM Projected : Airport Parkway & Hunt Club Lane Group EBL EBT WBL WBT NBL NBR SBL SBR ø4 Volume (vph) Lane Group Flow (vph) Turn Type Prot NA Prot NA Prot Free Prot Free Protected Phases Permitted Phases Free Free Detector Phase Switch Phase Minimum Initial (s) Minimum Split (s) Total Split (s) Total Split (%) 25.8% 40.0% 25.8% 40.0% 14.2% 34.2% 20% Yellow Time (s) All-Red Time (s) Lost Time Adjust (s) Total Lost Time (s) Lead/Lag Lead Lag Lead Lag Lag Lead Lead-Lag Optimize? Yes Yes Yes Yes Yes Yes Recall Mode None C-Max None C-Max None None None Act Effct Green (s) Actuated g/c Ratio v/c Ratio Control Delay Queue Delay Total Delay LOS D B E F D A E A Approach Delay Approach LOS C F Queue Length 50th (m) ~ Queue Length 95th (m) # Internal Link Dist (m) Turn Bay Length (m) Base Capacity (vph) Starvation Cap Reductn Spillback Cap Reductn Storage Cap Reductn Reduced v/c Ratio Cycle Length: 120 Actuated Cycle Length: 120 Offset: 1 (1%), Referenced to phase 2:EBT and 6:WBT, Start of Green Natural Cycle: 120 Control Type: Actuated-Coordinated Maximum v/c Ratio: 1.24 Intersection Signal Delay: 77.0 Intersection Capacity Utilization 93.9% ~ Volume exceeds capacity, queue is theoretically infinite. Queue shown is maximum after two cycles. # 95th percentile volume exceeds capacity, queue may be longer. Queue shown is maximum after two cycles. Intersection LOS: E ICU Level of Service F Splits and Phases: 6: Airport Parkway & Hunt Club
99 AM Projected : Gibford & Hunt Club Movement EBT EBR WBL WBT NBL NBR Volume (veh/h) Sign Control Free Free Stop Grade 0% 0% 0% Peak Hour Factor Hourly flow rate (vph) Pedestrians Lane Width (m) Walking Speed (m/s) Percent Blockage Right turn flare (veh) Median type None None Median storage veh) Upstream signal (m) px, platoon unblocked vc, conflicting volume vc1, stage 1 conf vol vc2, stage 2 conf vol vcu, unblocked vol tc, single (s) tc, 2 stage (s) tf (s) p0 queue free % cm capacity (veh/h) Direction, Lane # EB 1 EB 2 WB 1 WB 2 NB 1 Volume Total Volume Left Volume Right csh Volume to Capacity Queue Length 95th (m) Control Delay (s) Lane LOS B Approach Delay (s) Approach LOS B Average Delay 0.2 Intersection Capacity Utilization 53.9% ICU Level of Service A
100 AM Projected : Uplands & Gibford Movement EBL EBR NBL NBT SBT SBR Volume (veh/h) Sign Control Stop Free Free Grade 0% 0% 0% Peak Hour Factor Hourly flow rate (vph) Pedestrians Lane Width (m) Walking Speed (m/s) Percent Blockage Right turn flare (veh) Median type None None Median storage veh) Upstream signal (m) 211 px, platoon unblocked vc, conflicting volume vc1, stage 1 conf vol vc2, stage 2 conf vol vcu, unblocked vol tc, single (s) tc, 2 stage (s) tf (s) p0 queue free % cm capacity (veh/h) Direction, Lane # EB 1 NB 1 SB 1 Volume Total Volume Left Volume Right csh Volume to Capacity Queue Length 95th (m) Control Delay (s) Lane LOS B A Approach Delay (s) Approach LOS B Average Delay 1.0 Intersection Capacity Utilization 45.9% ICU Level of Service A
101 AM Projected : Paul Anka & Site Movement WBL WBR NBT NBR SBL SBT Volume (veh/h) Sign Control Stop Free Free Grade 0% 0% 0% Peak Hour Factor Hourly flow rate (vph) Pedestrians Lane Width (m) Walking Speed (m/s) Percent Blockage Right turn flare (veh) Median type None None Median storage veh) Upstream signal (m) 80 px, platoon unblocked vc, conflicting volume vc1, stage 1 conf vol vc2, stage 2 conf vol vcu, unblocked vol tc, single (s) tc, 2 stage (s) tf (s) p0 queue free % cm capacity (veh/h) Direction, Lane # WB 1 NB 1 SB 1 Volume Total Volume Left Volume Right csh Volume to Capacity Queue Length 95th (m) Control Delay (s) Lane LOS A A Approach Delay (s) Approach LOS A Average Delay 2.0 Intersection Capacity Utilization 31.3% ICU Level of Service A
102 AM Projected : Dean Martin & Site Movement EBL EBT WBT WBR SBL SBR Volume (veh/h) Sign Control Free Free Stop Grade 0% 0% 0% Peak Hour Factor Hourly flow rate (vph) Pedestrians Lane Width (m) Walking Speed (m/s) Percent Blockage Right turn flare (veh) Median type None None Median storage veh) Upstream signal (m) 241 px, platoon unblocked vc, conflicting volume vc1, stage 1 conf vol vc2, stage 2 conf vol vcu, unblocked vol tc, single (s) tc, 2 stage (s) tf (s) p0 queue free % cm capacity (veh/h) Direction, Lane # EB 1 WB 1 SB 1 Volume Total Volume Left Volume Right csh Volume to Capacity Queue Length 95th (m) Control Delay (s) Lane LOS A A Approach Delay (s) Approach LOS A Average Delay 3.2 Intersection Capacity Utilization 18.8% ICU Level of Service A
103 AM Projected : Gibford & Site Movement EBL EBR NBL NBT SBT SBR Volume (veh/h) Sign Control Stop Free Free Grade 0% 0% 0% Peak Hour Factor Hourly flow rate (vph) Pedestrians Lane Width (m) Walking Speed (m/s) Percent Blockage Right turn flare (veh) Median type None None Median storage veh) Upstream signal (m) px, platoon unblocked vc, conflicting volume vc1, stage 1 conf vol vc2, stage 2 conf vol vcu, unblocked vol tc, single (s) tc, 2 stage (s) tf (s) p0 queue free % cm capacity (veh/h) Direction, Lane # EB 1 NB 1 SB 1 Volume Total Volume Left Volume Right csh Volume to Capacity Queue Length 95th (m) Control Delay (s) Lane LOS A A Approach Delay (s) Approach LOS A Average Delay 4.0 Intersection Capacity Utilization 13.3% ICU Level of Service A
104 PM Projected : Canadair/Bowesville & Hunt Club Lane Group EBL EBT EBR WBL WBT NBL NBT NBR SBL SBT Volume (vph) Lane Group Flow (vph) Turn Type Prot NA Perm Prot NA Perm NA Perm Perm NA Protected Phases Permitted Phases Detector Phase Switch Phase Minimum Initial (s) Minimum Split (s) Total Split (s) Total Split (%) 10.4% 56.5% 56.5% 10.4% 56.5% 33.0% 33.0% 33.0% 33.0% 33.0% Yellow Time (s) All-Red Time (s) Lost Time Adjust (s) Total Lost Time (s) Lead/Lag Lead Lag Lag Lead Lag Lead-Lag Optimize? Yes Yes Yes Yes Yes Recall Mode None C-Max C-Max None C-Max None None None None None Act Effct Green (s) Actuated g/c Ratio v/c Ratio Control Delay Queue Delay Total Delay LOS E C A E C F B C Approach Delay Approach LOS C C F C Queue Length 50th (m) ~ Queue Length 95th (m) 12.0 # # Internal Link Dist (m) Turn Bay Length (m) Base Capacity (vph) Starvation Cap Reductn Spillback Cap Reductn Storage Cap Reductn Reduced v/c Ratio Cycle Length: 115 Actuated Cycle Length: 115 Offset: 0 (0%), Referenced to phase 2:EBT and 6:WBT, Start of Green Natural Cycle: 120 Control Type: Actuated-Coordinated Maximum v/c Ratio: 1.42 Intersection Signal Delay: 49.7 Intersection Capacity Utilization 89.1% ~ Volume exceeds capacity, queue is theoretically infinite. Queue shown is maximum after two cycles. # 95th percentile volume exceeds capacity, queue may be longer. Queue shown is maximum after two cycles. Intersection LOS: D ICU Level of Service E Splits and Phases: 1: Canadair/Bowesville & Hunt Club
105 PM Projected : Paul Anka & Hunt Club Lane Group EBL EBT EBR WBL WBT WBR NBL NBT NBR SBL SBT Volume (vph) Lane Group Flow (vph) Turn Type Prot NA Perm Prot NA Perm Perm NA Perm Perm NA Protected Phases Permitted Phases Detector Phase Switch Phase Minimum Initial (s) Minimum Split (s) Total Split (s) Total Split (%) 13.8% 45.0% 45.0% 13.8% 45.0% 45.0% 41.3% 41.3% 41.3% 41.3% 41.3% Yellow Time (s) All-Red Time (s) Lost Time Adjust (s) Total Lost Time (s) Lead/Lag Lead Lag Lag Lead Lag Lag Lead-Lag Optimize? Yes Yes Yes Yes Yes Yes Recall Mode None C-Max C-Max None C-Max C-Max None None None None None Act Effct Green (s) Actuated g/c Ratio v/c Ratio Control Delay Queue Delay Total Delay LOS D E A C B A D C A C B Approach Delay Approach LOS E B C B Queue Length 50th (m) 6.6 ~ Queue Length 95th (m) 15.7 # m31.2 #169.3 m Internal Link Dist (m) Turn Bay Length (m) Base Capacity (vph) Starvation Cap Reductn Spillback Cap Reductn Storage Cap Reductn Reduced v/c Ratio Cycle Length: 80 Actuated Cycle Length: 80 Offset: 11 (14%), Referenced to phase 2:EBT and 6:WBT, Start of Green Natural Cycle: 100 Control Type: Actuated-Coordinated Maximum v/c Ratio: 1.07 Intersection Signal Delay: 40.7 Intersection Capacity Utilization 82.5% ~ Volume exceeds capacity, queue is theoretically infinite. Queue shown is maximum after two cycles. # 95th percentile volume exceeds capacity, queue may be longer. Queue shown is maximum after two cycles. m Volume for 95th percentile queue is metered by upstream signal. Intersection LOS: D ICU Level of Service E Splits and Phases: 2: Paul Anka & Hunt Club
106 PM Projected : Uplands & Hunt Club Lane Group EBL EBT EBR WBL WBT WBR NBL NBT NBR SBL SBT Volume (vph) Lane Group Flow (vph) Turn Type pm+pt NA Perm pm+pt NA Perm Perm NA Perm Perm NA Protected Phases Permitted Phases Detector Phase Switch Phase Minimum Initial (s) Minimum Split (s) Total Split (s) Total Split (%) 13.8% 45.0% 45.0% 13.8% 45.0% 45.0% 41.3% 41.3% 41.3% 41.3% 41.3% Yellow Time (s) All-Red Time (s) Lost Time Adjust (s) Total Lost Time (s) Lead/Lag Lead Lag Lag Lead Lag Lag Lead-Lag Optimize? Yes Yes Yes Yes Yes Yes Recall Mode None C-Max C-Max None C-Max C-Max None None None None None Act Effct Green (s) Actuated g/c Ratio v/c Ratio Control Delay Queue Delay Total Delay LOS A B A A B A D C A C B Approach Delay Approach LOS A B D B Queue Length 50th (m) Queue Length 95th (m) m0.3 m#126.7 m4.1 m0.1 #138.7 m Internal Link Dist (m) Turn Bay Length (m) Base Capacity (vph) Starvation Cap Reductn Spillback Cap Reductn Storage Cap Reductn Reduced v/c Ratio Cycle Length: 80 Actuated Cycle Length: 80 Offset: 48 (60%), Referenced to phase 2:EBTL and 6:WBTL, Start of Green Natural Cycle: 90 Control Type: Actuated-Coordinated Maximum v/c Ratio: 0.78 Intersection Signal Delay: 12.8 Intersection Capacity Utilization 71.6% # 95th percentile volume exceeds capacity, queue may be longer. Queue shown is maximum after two cycles. m Volume for 95th percentile queue is metered by upstream signal. Intersection LOS: B ICU Level of Service C Splits and Phases: 4: Uplands & Hunt Club
107 PM Projected : Downpatrick/McCarthy & Hunt Club Lane Group EBL EBT EBR WBL WBT WBR NBL NBT SBL SBT SBR Volume (vph) Lane Group Flow (vph) Turn Type pm+pt NA Perm pm+pt NA Perm Perm NA Perm NA Perm Protected Phases Permitted Phases Detector Phase Switch Phase Minimum Initial (s) Minimum Split (s) Total Split (s) Total Split (%) 13.8% 43.8% 43.8% 13.8% 43.8% 43.8% 42.5% 42.5% 42.5% 42.5% 42.5% Yellow Time (s) All-Red Time (s) Lost Time Adjust (s) Total Lost Time (s) Lead/Lag Lead Lag Lag Lead Lag Lag Lead-Lag Optimize? Yes Yes Yes Yes Yes Yes Recall Mode None C-Max C-Max None C-Max C-Max None None None None None Act Effct Green (s) Actuated g/c Ratio v/c Ratio Control Delay Queue Delay Total Delay LOS A E A C C A B A D C A Approach Delay Approach LOS E C B C Queue Length 50th (m) 1.8 ~ Queue Length 95th (m) m0.7 #212.2 m0.0 #37.7 # Internal Link Dist (m) Turn Bay Length (m) Base Capacity (vph) Starvation Cap Reductn Spillback Cap Reductn Storage Cap Reductn Reduced v/c Ratio Cycle Length: 80 Actuated Cycle Length: 80 Offset: 11 (14%), Referenced to phase 2:EBTL and 6:WBTL, Start of Green Natural Cycle: 90 Control Type: Actuated-Coordinated Maximum v/c Ratio: 1.10 Intersection Signal Delay: 45.8 Intersection Capacity Utilization 87.4% ~ Volume exceeds capacity, queue is theoretically infinite. Queue shown is maximum after two cycles. # 95th percentile volume exceeds capacity, queue may be longer. Queue shown is maximum after two cycles. m Volume for 95th percentile queue is metered by upstream signal. Intersection LOS: D ICU Level of Service E Splits and Phases: 5: Downpatrick/McCarthy & Hunt Club
108 PM Projected : Airport Parkway & Hunt Club Lane Group EBL EBT WBL WBT NBL NBR SBL SBR ø4 Volume (vph) Lane Group Flow (vph) Turn Type Prot NA Prot NA Prot Free Prot Free Protected Phases Permitted Phases Free Free Detector Phase Switch Phase Minimum Initial (s) Minimum Split (s) Total Split (s) Total Split (%) 15.4% 53.1% 15.4% 53.1% 13.1% 31.5% 18% Yellow Time (s) All-Red Time (s) Lost Time Adjust (s) Total Lost Time (s) Lead/Lag Lead Lag Lead Lag Lag Lead Lead-Lag Optimize? Yes Yes Yes Yes Yes Yes Recall Mode None C-Min None C-Max None None None Act Effct Green (s) Actuated g/c Ratio v/c Ratio Control Delay Queue Delay Total Delay LOS F D E F D A E A Approach Delay Approach LOS E F Queue Length 50th (m) 51.6 ~ ~ Queue Length 95th (m) #109.8 # # Internal Link Dist (m) Turn Bay Length (m) Base Capacity (vph) Starvation Cap Reductn Spillback Cap Reductn Storage Cap Reductn Reduced v/c Ratio Cycle Length: 130 Actuated Cycle Length: 130 Offset: 98 (75%), Referenced to phase 2:EBT and 6:WBT, Start of Green Natural Cycle: 120 Control Type: Actuated-Coordinated Maximum v/c Ratio: 1.27 Intersection Signal Delay: 93.7 Intersection Capacity Utilization 105.0% ~ Volume exceeds capacity, queue is theoretically infinite. Queue shown is maximum after two cycles. # 95th percentile volume exceeds capacity, queue may be longer. Queue shown is maximum after two cycles. Intersection LOS: F ICU Level of Service G Splits and Phases: 6: Airport Parkway & Hunt Club
109 PM Projected : Gibford & Hunt Club Movement EBT EBR WBL WBT NBL NBR Volume (veh/h) Sign Control Free Free Stop Grade 0% 0% 0% Peak Hour Factor Hourly flow rate (vph) Pedestrians Lane Width (m) Walking Speed (m/s) Percent Blockage Right turn flare (veh) Median type None None Median storage veh) Upstream signal (m) px, platoon unblocked vc, conflicting volume vc1, stage 1 conf vol vc2, stage 2 conf vol vcu, unblocked vol tc, single (s) tc, 2 stage (s) tf (s) p0 queue free % cm capacity (veh/h) Direction, Lane # EB 1 EB 2 WB 1 WB 2 NB 1 Volume Total Volume Left Volume Right csh Volume to Capacity Queue Length 95th (m) Control Delay (s) Lane LOS B Approach Delay (s) Approach LOS B Average Delay 0.2 Intersection Capacity Utilization 55.4% ICU Level of Service B
110 PM Projected : Uplands & Gibford Movement EBL EBR NBL NBT SBT SBR Volume (veh/h) Sign Control Stop Free Free Grade 0% 0% 0% Peak Hour Factor Hourly flow rate (vph) Pedestrians Lane Width (m) Walking Speed (m/s) Percent Blockage Right turn flare (veh) Median type None None Median storage veh) Upstream signal (m) 223 px, platoon unblocked vc, conflicting volume vc1, stage 1 conf vol vc2, stage 2 conf vol vcu, unblocked vol tc, single (s) tc, 2 stage (s) tf (s) p0 queue free % cm capacity (veh/h) Direction, Lane # EB 1 NB 1 SB 1 Volume Total Volume Left Volume Right csh Volume to Capacity Queue Length 95th (m) Control Delay (s) Lane LOS B A Approach Delay (s) Approach LOS B Average Delay 1.3 Intersection Capacity Utilization 49.9% ICU Level of Service A
111 PM Projected : Paul Anka & Site Movement WBL WBR NBT NBR SBL SBT Volume (veh/h) Sign Control Stop Free Free Grade 0% 0% 0% Peak Hour Factor Hourly flow rate (vph) Pedestrians Lane Width (m) Walking Speed (m/s) Percent Blockage Right turn flare (veh) Median type None None Median storage veh) Upstream signal (m) 99 px, platoon unblocked vc, conflicting volume vc1, stage 1 conf vol vc2, stage 2 conf vol vcu, unblocked vol tc, single (s) tc, 2 stage (s) tf (s) p0 queue free % cm capacity (veh/h) Direction, Lane # WB 1 NB 1 SB 1 Volume Total Volume Left Volume Right csh Volume to Capacity Queue Length 95th (m) Control Delay (s) Lane LOS A A Approach Delay (s) Approach LOS A Average Delay 2.2 Intersection Capacity Utilization 30.6% ICU Level of Service A
112 PM Projected : Dean Martin & Site Movement EBL EBT WBT WBR SBL SBR Volume (veh/h) Sign Control Free Free Stop Grade 0% 0% 0% Peak Hour Factor Hourly flow rate (vph) Pedestrians Lane Width (m) Walking Speed (m/s) Percent Blockage Right turn flare (veh) Median type None None Median storage veh) Upstream signal (m) 273 px, platoon unblocked vc, conflicting volume vc1, stage 1 conf vol vc2, stage 2 conf vol vcu, unblocked vol tc, single (s) tc, 2 stage (s) tf (s) p0 queue free % cm capacity (veh/h) Direction, Lane # EB 1 WB 1 SB 1 Volume Total Volume Left Volume Right csh Volume to Capacity Queue Length 95th (m) Control Delay (s) Lane LOS A A Approach Delay (s) Approach LOS A Average Delay 2.9 Intersection Capacity Utilization 19.6% ICU Level of Service A
113 PM Projected : Gibford & Site Movement EBL EBR NBL NBT SBT SBR Volume (veh/h) Sign Control Stop Free Free Grade 0% 0% 0% Peak Hour Factor Hourly flow rate (vph) Pedestrians Lane Width (m) Walking Speed (m/s) Percent Blockage Right turn flare (veh) Median type None None Median storage veh) Upstream signal (m) px, platoon unblocked vc, conflicting volume vc1, stage 1 conf vol vc2, stage 2 conf vol vcu, unblocked vol tc, single (s) tc, 2 stage (s) tf (s) p0 queue free % cm capacity (veh/h) Direction, Lane # EB 1 NB 1 SB 1 Volume Total Volume Left Volume Right csh Volume to Capacity Queue Length 95th (m) Control Delay (s) Lane LOS A A Approach Delay (s) Approach LOS A Average Delay 4.5 Intersection Capacity Utilization 14.1% ICU Level of Service A
114 Appendix G Turn Lane Warrant Analysis
 % of Left Turning Traffic AM PM AM PM AM PM AM PM Warrant Left Turn Lane 60 179 247 141")

115 Existing Paul Anka/Site Design Speed Advancing Traffic Volume (V A ) Opposing Traffic Volume (V O ) Left Turn Traffic Volume (V L ) % of Left Turning Traffic AM PM AM PM AM PM AM PM Warrant Left Turn Lane % 23% No Peak NBL NBT NBR SBL SBT SBR EBL EBT EBR WBL WBT WBR Warrant? AM PM See MTO's nomo graphs AM Peak Hour Volumes PM Peak Hour Volumes 179, , 108
Re: Residential Development - Ogilvie/Cummings Transportation Overview
 1223 Michael Street, Suite 100, Ottawa, ON K1J 7T2 Tel: 613.738.4160 Fax: 613.739.7105 www.delcan.com March 28, 2012 OUR REF: TO3088TOY Barry J. Hobin & Architects 63 Pamilla Street Ottawa, ON K1S 3K7
TIS / TB/ CTS Check List
 Study Merivale Type Road Central Park Mixed-Use Development May 2011 Study TIS/CTS Name February 2011 CTS/TIS Check List TIS / TB/ CTS Check List prepared for: Ashcroft Homes 18 Antares Drive Ottawa, ON
700 Hunt Club Road. Transportation Impact Study - Addendum #1. Submitted by:
 700 Hunt Club Road Transportation Impact Study - Addendum #1 Submitted by: 14 June 2013 1223 Michael Street, Suite 100, Ottawa, ON K1J 7T2 Tel: 613.738.4160 Fax: 613.739.7105 www.delcan.com 14 June 2013
Re: Cyrville Road Car Dealership
 1223 Michael Street, Suite 100, Ottawa, ON K1J 7T2 Tel: 613.738.4160 Fax: 613.739.7105 www.delcan.com February 25, 2013 OUR REF: TO3098TOE Mark Motors of Ottawa 611 Montreal Road Ottawa, ON K1K 0T8 Attention:
1354 Carling Avenue. Community Transportation Study/ Transportation Impact Study
 354 Carling Avenue Community Transportation Study/ Transportation Impact Study prepared for: Holloway Lodging Corporation 69 Quinpool Road, th Floor Halifax, NS B3K 5J7 prepared by: 223 Michael Street
267 O Connor Street Residential Development
 M a y 2014 267 O Connor Street Residential Development Transportation Brief Google 2014 Bing 2014 Prepared for: MASTERCRAFT STARWOOD Prepared by: Study 267 O'Connor Type Street May 2014 Study Residential
April Salvation Army Barrhaven Church 102 Bill Leathem Drive Transportation Brief
 April 26 Salvation Army Barrhaven Church 2 Bill Leathem Drive Transportation Brief Salvation Army Barrhaven Church 2 Bill Leathem Drive Transportation Brief prepared for: The Salvation Army 2 Overlea Blvd.
1012 & 1024 McGarry Terrace
 December 217 112 & 124 McGarry Terrace Transportation Impact Study 112 & 124 McGarry Terrace Transportation Impact Study prepared for: Lépine Corporation 32 March Road Kanata, ON K2K 2E3 prepared by: 1223
RE: Taggart Retail Site Plan: Kanata West Proposal for Traffic Impact Study: Addendum #2
 1223 Michael Street, Suite 100, Ottawa, Ontario K1J 7T2 Tel: 613.738.4160 Fax: 613.739.7105 www.delcan.com July 9, 2014 OUR REF: TO3073TOK00 BY EMAIL: jparkes@taggart.ca/aturner@taggart.ca Taggart Commercial
Wellington Street West
 Transportation Brief prepared for: 185 Davenport Road Suite 300 Toronto, ON M5R 1J1 prepared by: 1223 Michael Street Suite 100 Ottawa, ON K1J 7T2 November 5, 2013 TO3131TOH Transportation Brief November
CitiGate Retail Development
 CitiGate Retail Development Transportation Impact Study prepared for: Trinity Development Group Inc. Sun Life Financial Centre, East Tower 3250 Bloor Street West, Suite 1000 Toronto, ON M8X 2X9 prepared
BARRHAVEN FELLOWSHIP CRC 3058 JOCKVALE ROAD OTTAWA, ONTARIO TRANSPORTATION BRIEF. Prepared for:
 BARRHAVEN FELLOWSHIP CRC 3058 JOCKVALE ROAD OTTAWA, ONTARIO TRANSPORTATION BRIEF Prepared for: Barrhaven Fellowship CRC 3058 Jockvale Road Ottawa, ON K2J 2W7 December 7, 2016 116-649 Report_1.doc D. J.
1140 Wellington Street West Transportation Brief
 1140 Wellington Street West Transportation Brief October 2013 Study 1140 Wellington Type Street West October 2013 Study Transportation Name Brief February 2011 TB Check List TIS / TB/ CTS Check List prepared
GASOLINE SERVICE STATION 1618, 1622 ROGER STEVENS DRIVE OTTAWA, ONTARIO TRANSPORTATION IMPACT ASSESSMENT. Prepared for:
 GASOLINE SERVICE STATION 1618, 1622 ROGER STEVENS DRIVE OTTAWA, ONTARIO TRANSPORTATION IMPACT ASSESSMENT Prepared for: Invecta Development (Ottawa) Corporation 758 Shanks Height Milton, ON L9T 7P7 May
RE: 3605 Paul Anka Drive Addendum #2 to the December 2012 Traffic Impact Study
 19 May 2015 BY EMAIL: asaggarwal@gmail.com Manor Park Management 231 Brittany Drive, Suite D Ottawa, ON K1K 0R8 Attention: Mr. Anand Aggarwal RE: 3605 Paul Anka Drive Addendum #2 to the December 2012 Traffic
Re: Addendum No. 4 Transportation Overview 146 Mountshannon Drive Ottawa, Ontario
 April 18 th, 2017 Mr. Kevin Yemm Vice President, Land Development Richraft Group of Companies 2280 St. Laurent Boulevard, Suite 201 Ottawa, Ontario (Tel: 613.739.7111 / e-mail: keviny@richcraft.com) Re:
DEVELOPMENT PROPERTY 1627 MAXIME STREET CITY OF OTTAWA TRANSPORTATION OVERVIEW. Prepared for: Subhas Bhargava. July 9, Overview_1.
 DEVELOPMENT PROPERTY 1627 MAXIME STREET CITY OF OTTAWA TRANSPORTATION OVERVIEW Prepared for: Subhas Bhargava July 9, 2015 115-620 Overview_1.doc D. J. Halpenny & Associates Ltd. Consulting Transportation
MERIVALE PRIORITY SQUARE 2852 MERIVALE ROAD CITY OF OTTAWA TRANSPORTATION BRIEF. Prepared for: ONT Inc. 25 Winding Way Nepean, Ontario K2C 3H1
 MERIVALE PRIORITY SQUARE 2852 MERIVALE ROAD CITY OF OTTAWA TRANSPORTATION BRIEF Prepared for: 2190986ONT Inc. 25 Winding Way Nepean, Ontario K2C 3H1 October 6, 2010 110-502 Report_1.doc D. J. Halpenny
RICHMOND OAKS HEALTH CENTRE 6265 PERTH STREET OTTAWA, ONTARIO TRANSPORTATION BRIEF. Prepared for: Guycoki (Eastern) Limited.
 Limited.") RICHMOND OAKS HEALTH CENTRE 6265 PERTH STREET OTTAWA, ONTARIO TRANSPORTATION BRIEF Prepared for: Guycoki (Eastern) Limited June 16, 2016 116-638 Brief_1.doc D. J. Halpenny & Associates Ltd. Consulting
RICHMOND OAKS HEALTH CENTRE 6265 PERTH STREET OTTAWA, ONTARIO TRANSPORTATION BRIEF Prepared for: Guycoki (Eastern) Limited June 16, 2016 116-638 Brief_1.doc D. J. Halpenny & Associates Ltd. Consulting
The Re:Queen and Sparks Traffic Brief - Addendum #2
 June 11, 2015 Ashcroft Homes 18 Antares Drive Ottawa, ON K2E 1A9 EMAIL: mpham@ashcrofthomes.com Attention: May Pham Development Planner Dear May, Re: The Re:Queen and Sparks Traffic Brief - Addendum #2
LAWRENCE TRANSIT CENTER LOCATION ANALYSIS 9 TH STREET & ROCKLEDGE ROAD / 21 ST STREET & IOWA STREET LAWRENCE, KANSAS
 LAWRENCE TRANSIT CENTER LOCATION ANALYSIS 9 TH STREET & ROCKLEDGE ROAD / 21 ST STREET & IOWA STREET LAWRENCE, KANSAS TRAFFIC IMPACT STUDY FEBRUARY 214 OA Project No. 213-542 TABLE OF CONTENTS 1. INTRODUCTION...
King Soopers #116 Thornton, Colorado
 Traffic Impact Study King Soopers #116 Thornton, Colorado Prepared for: Galloway & Company, Inc. T R A F F I C I M P A C T S T U D Y King Soopers #116 Thornton, Colorado Prepared for Galloway & Company
Re: 233 Armstrong Street Residential Condominium Traffic Brief
 1223 Michael Street, Suite 100, Ottawa, ON K1J 7T2 Tel: 613.738.4160 Fax: 613.739.7105 www.delcan.com August 8, 2008 TO3031TOP00 BY E-MAIL: gerry.lalonde@rogers.com Spencedale Properties 7 Cobb Court Ottawa,
105 Toronto Street South, Markdale Transportation Impact Study. Paradigm Transportation Solutions Limited
 105 Toronto Street South, Markdale Transportation Impact Study Paradigm Transportation Solutions Limited December 2016 Project Summary Project Number 162060 December 2016 Client Zelinka Priamo Ltd 318
886 March Road McDonald's Transportation Study
 McDonald's Restaurants of Canada Limited March 2013 886 March Road McDonald's Transportation Study Submitted by: HDR Corporation 100 York Boulevard, Suite 300 Richmond Hill, ON L4B 1J8 (905) 882-4100 www.hdrinc.com
Re: Sainte-Geneviève Elementary School (2198 Arch Street) Transportation Overview
 Transportation Overview") 2 March 2015 OUR REF: TO3205TOB00 Conseil des écoles catholiques du Centre-Est (CECCE) 4000 rue Labelle Ottawa, Ontario K1J 1A1 Attention: Maguy Eustache Dear Maguy: Re: Sainte-Geneviève Elementary School
2 March 2015 OUR REF: TO3205TOB00 Conseil des écoles catholiques du Centre-Est (CECCE) 4000 rue Labelle Ottawa, Ontario K1J 1A1 Attention: Maguy Eustache Dear Maguy: Re: Sainte-Geneviève Elementary School
TRAFFIC IMPACT ANALYSIS
 TRAFFIC IMPACT ANALYSIS Emerald Isle Commercial Development Prepared by SEPI Engineering & Construction Prepared for Ark Consulting Group, PLLC March 2016 I. Executive Summary A. Site Location The Emerald
Trafalgar Road & Lower Base Line Transportation Study Ontario Inc.
 Trafalgar Road & Lower Base Line Transportation Study 1255723 Ontario Inc. Trafalgar Road & Lower Base Line Transportation Study 1255723 Ontario Inc. 1465 Pickering Parkway Suite 200 Pickering ON L1V 7G7
Vanier Parkway and Presland Road Residential Development Transportation Impact Study
 Vanier Parkway and Presland Road Residential Development Transportation Impact Study Final Report (Revised) March 2011 Submitted to: Groupe Lépine Ottawa Project No. 09-1613 Submitted by: Groupe Lépine
2405 Mer Bleue Orleans, (Ottawa), ON Community Transportation Study Mattamy Homes. Prepared By: Stantec Consulting Ltd. Version 2
, ON Community Transportation Study Mattamy Homes. Prepared By: Stantec Consulting Ltd. Version 2") 2405 Mer Bleue Orleans, (Ottawa), ON Community Transportation Study Mattamy Homes Prepared By: Stantec Consulting Ltd. Version 2 April 2014 Stantec Consulting Ltd. 400-1331 Clyde Avenue, Ottawa ON K2C
2405 Mer Bleue Orleans, (Ottawa), ON Community Transportation Study Mattamy Homes Prepared By: Stantec Consulting Ltd. Version 2 April 2014 Stantec Consulting Ltd. 400-1331 Clyde Avenue, Ottawa ON K2C
TIMBERVINE TRANSPORTATION IMPACT STUDY FORT COLLINS, COLORADO JANUARY Prepared for:
 TIMBERVINE TRANSPORTATION IMPACT STUDY FORT COLLINS, COLORADO JANUARY 2014 Prepared for: Hartford Companies 1218 W. Ash Street Suite A Windsor, Co 80550 Prepared by: DELICH ASSOCIATES 2272 Glen Haven Drive
West Hills Shopping Centre Lowe s Expansion Traffic Impact Study
 West Hills Shopping Centre Lowe s Expansion Traffic Impact Study Prepared for: Armel Corporation January 2015 Paradigm Transportation Solutions Ltd. 22 King Street South, Suite 300 Waterloo ON N2J 1N8
Traffic Impact Study Speedway Gas Station Redevelopment
 Traffic Impact Study Speedway Gas Station Redevelopment Warrenville, Illinois Prepared For: Prepared By: April 11, 2018 Table of Contents 1. Introduction... 1 2. Existing Conditions... 4 Site Location...
L1TILE BEARS DAY CARE TRANSPORTATION IMPACT STUDY FORT COLLINS, COLORADO MAY Prepared for:
 L1TILE BEARS DAY CARE TRANSPORTATION IMPACT STUDY FORT COLLINS, COLORADO MAY 2012 Prepared for: Hillside Construction, Inc. 216 Hemlock Street, Suite B Fort Collins, CO 80534 Prepared by: DELICH ASSOCIATES
King Street & Wyman Road Transportation Impact Study & Transportation Demand Management. Paradigm Transportation Solutions Limited
 King Street & Wyman Road Transportation Impact Study & Transportation Demand Management Paradigm Transportation Solutions Limited April 28 Project Summary Project Number 822 April 28 Client RISE Commercial
RE: 67/71 Marquette Avenue Redevelopment Transportation Overview
 1223 Michael Street, Suite 100, Ottawa, Ontario K1J 7T2 Tel: 613.738.4160 Fax: 613.739.7105 www.delcan.com April 23, 2014 OUR REF: TO3157TOA00 BY EMAIL: mark.larose@urbanrisedevelopment.com Urban Rise
Traffic Impact Analysis West Street Garden Plots Improvements and DuPage River Park Garden Plots Development Naperville, Illinois
 Traffic Impact Analysis West Street Garden Plots Improvements and DuPage River Park Garden Plots Development Naperville, Illinois Submitted by April 9, 2009 Introduction Kenig, Lindgren, O Hara, Aboona,
Traffic Impact Study Proposed Residential Development (Watson Parkway North - Starwood Drive Node, City of Guelph)
") Traffic Impact Study Proposed Residential Development (Watson Parkway North - Starwood Drive Node, City of Guelph) Prepared By: 332 Lorne Avenue East Stratford ON N5A 6S4 Prepared for: Paul Kemper, President
Traffic Impact Study Proposed Residential Development (Watson Parkway North - Starwood Drive Node, City of Guelph) Prepared By: 332 Lorne Avenue East Stratford ON N5A 6S4 Prepared for: Paul Kemper, President
RE: A Traffic Impact Statement for a proposed development on Quinpool Road
 James J. Copeland, P.Eng. GRIFFIN transportation group inc. 30 Bonny View Drive Fall River, NS B2T 1R2 May 31, 2018 Ellen O Hara, P.Eng. Project Engineer DesignPoint Engineering & Surveying Ltd. 200 Waterfront
TRANSPORTATION REVIEW
 TRANSPORTATION REVIEW - PROPOSED MIX OF LAND USES IS CONSISTENT WITH THE CITY S UNDER THE GRANVILLE BRIDGE POLICIES THAT AIM TO MEET NEIGHBOURING RESIDENTS SHOPPING NEEDS AND REDUCE RELIANCE ON AUTOMOBILE
Minto Mahogany Stage 2
 Minto Mahogany Stage 2 Transportation Impact Study prepared for: Minto Developments Inc 200-180 Kent Street Ottawa, ON K1P 0B6 prepared by: 1223 Michael Street Suite 100 Ottawa, ON K1J 7T2 June 27, 2017
Provide an overview of the development proposal including projected site traffic volumes;
 December 19, 2013 File: 163600935 Attention: Troy Elliott Carl Elliott Limited 15-1831 Robertson Road PO Box 11117 Nepean, Ontario K1H 7T8 Dear Mr. Elliott, Reference: 2235 and 2265 Robertson Road Transportation
Lacey Gateway Residential Phase 1
 Lacey Gateway Residential Phase Transportation Impact Study April 23, 203 Prepared for: Gateway 850 LLC 5 Lake Bellevue Drive Suite 02 Bellevue, WA 98005 Prepared by: TENW Transportation Engineering West
TRAFFIC SIGNAL DESIGN REPORT KING OF PRUSSIA ROAD & RAIDER ROAD RADNOR TOWNSHIP PENNSYLVANIA
 TRAFFIC SIGNAL DESIGN REPORT KING OF PRUSSIA ROAD & RAIDER ROAD RADNOR TOWNSHIP PENNSYLVANIA PREPARED FOR: UNIVERSITY OF PENNSYLVANIA HEALTH SYSTEM 34 CIVIC CENTER BOULEVARD PHILADELPHIA, PA 1987 (61)
Barrhaven Honda Dealership. Dealership Drive, Ottawa, ON. Transportation Brief
 Barrhaven Honda Dealership Dealership Drive, Ottawa, ON Transportation Brief Prepared By: NOVATECH Suite 200, 240 Michael Cowpland Drive Ottawa, Ontario K2M 1P6 September, 2015 File: 115136 Ref: R-2015-152
2.0 Development Driveways. Movin Out June 2017
 Movin Out June 2017 1.0 Introduction The proposed Movin Out development is a mixed use development in the northeast quadrant of the intersection of West Broadway and Fayette Avenue in the City of Madison.
INDUSTRIAL DEVELOPMENT
 INDUSTRIAL DEVELOPMENT Traffic Impact Study Plainfield, Illinois August 2018 Prepared for: Seefried Industrial Properties, Inc. TABLE OF CONTENTS Executive Summary 2 Introduction 3 Existing Conditions
Craig Scheffler, P.E., PTOE HNTB North Carolina, P.C. HNTB Project File: Subject
 TECHNICAL MEMORANDUM To Kumar Neppalli Traffic Engineering Manager Town of Chapel Hill From Craig Scheffler, P.E., PTOE HNTB North Carolina, P.C. Cc HNTB Project File: 38435 Subject Obey Creek TIS 2022
370 Queen Elizabeth Drive Transportation Overview
 December 8, 2014 OUR REF: TO3193TOA BY EMAIL: Ashley@rocahomes.ca 2253644 Ontario Inc. c/o BassCon 24 George Street West Ottawa, ON K1S 3J2 Attention: Ashley Lepine Dear Ashley: Re: 370 Queen Elizabeth
MEMO VIA . Ms. Amy Roth DPS Director, City of Three Rivers. To:
 MEMO To: Ms. Amy Roth DPS Director, City of Three Rivers VIA EMAIL From: Michael J. Labadie, PE Julie M. Kroll, PE, PTOE Brandon Hayes, PE, P.Eng. Fleis & VandenBrink Date: January 5, 2017 Re: Proposed
Transportation & Traffic Engineering
 Transportation & Traffic Engineering 1) Project Description This report presents a summary of findings for a Traffic Impact Analysis (TIA) performed by A+ Engineering, Inc. for the Hill Country Family
TRAFFIC IMPACT STUDY DERRY GREEN CORPORATE BUSINESS PARK MILTON SECONDARY PLAN MODIFICATION
 TRAFFIC IMPACT STUDY DERRY GREEN CORPORATE BUSINESS PARK MILTON SECONDARY PLAN MODIFICATION TRAFFIC IMPACT STUDY DERRY GREEN CORPORATE BUSINESS PARK MILTON SECONDARY PLAN MODIFICATION DECEMBER 24 UPDATED
Clean Harbors Canada, Inc.
 Clean Harbors Canada, Inc. Proposed Lambton Landfill Expansion Environmental Assessment Terms of Reference Transportation Assessment St. Clair Township, Ontario September 2009 itrans Consulting Inc. 260
EXECUTIVE SUMMARY. The following is an outline of the traffic analysis performed by Hales Engineering for the traffic conditions of this project.
 EXECUTIVE SUMMARY This study addresses the traffic impacts associated with the proposed Shopko redevelopment located in Sugarhouse, Utah. The Shopko redevelopment project is located between 1300 East and
December 5, Red Bank Planning Board Municipal Building 90 Monmouth Street Red Bank, NJ 07701
 Dynamic Traffic, LLC www.dynamic-traffic.com 1904 Main Street Lake Como, NJ 07719 T. 732.681.0760 December 5, 2016 Red Bank Planning Board Municipal Building 90 Monmouth Street Red Bank, NJ 07701 Re: Traffic
MILLERSVILLE PARK TRAFFIC IMPACT ANALYSIS ANNE ARUNDEL COUNTY, MARYLAND
 MILLERSVILLE PARK TRAFFIC IMPACT ANALYSIS ANNE ARUNDEL COUNTY, MARYLAND Prepared for: Department of Public Works Anne Arundel County Prepared by: URS Corporation 4 North Park Drive, Suite 3 Hunt Valley,
Traffic Impact Statement (TIS)
") Traffic Impact Statement (TIS) Vincentian PUDA Collier County, FL 10/18/2013 Prepared for: Global Properties of Naples Prepared by: Trebilcock Consulting Solutions, PA 2614 Tamiami Trail N, Suite 615 1205
Traffic Impact Statement (TIS) Vincentian PUDA Collier County, FL 10/18/2013 Prepared for: Global Properties of Naples Prepared by: Trebilcock Consulting Solutions, PA 2614 Tamiami Trail N, Suite 615 1205
Proposed CVS/pharmacy
 Traffic Impact and Access Study Proposed CVS/pharmacy West Main Street (Route 1) at Hull Street Clinton, Connecticut PREPARED FOR Arista Development LLC 520 Providence Highway, Suite 9 Norwood, Massachusetts
TRAFFIC IMPACT ANALYSIS FOR. McDONALD S RESTAURANT IN CARMICAEL Sacramento County, CA. Prepared For:
 TRAFFIC IMPACT ANALYSIS FOR McDONALD S RESTAURANT IN CARMICAEL Sacramento County, CA Prepared For: McDonald s USA, LLC Pacific Sierra Region 2999 Oak Road, Suite 900 Walnut Creek, CA 94597 Prepared By:
APPENDIX C1 TRAFFIC ANALYSIS DESIGN YEAR TRAFFIC ANALYSIS
 APPENDIX C1 TRAFFIC ANALYSIS DESIGN YEAR TRAFFIC ANALYSIS DESIGN YEAR TRAFFIC ANALYSIS February 2018 Highway & Bridge Project PIN 6754.12 Route 13 Connector Road Chemung County February 2018 Appendix
Traffic Impact Study for Proposed Olive Boulevard Development
 Traffic Impact Study for Proposed 11330 Olive Boulevard Development Creve Coeur, Missouri July 7, 2017 Prepared For: 11330 Olive Boulevard Development 11330 Olive Boulevard Creve Coeur, Missouri 63141
APPENDIX E. Traffic Analysis Report
 APPENDIX E Traffic Analysis Report THIS PAGE INTENTIONALLY BLANK EAGLE RIVER TRAFFIC MITIGATION PHASE I OLD GLENN HIGHWAY/EAGLE RIVER ROAD INTERSECTION IMPROVEMENTS TRAFFIC ANALYSIS Eagle River, Alaska
Half Moon Bay North Apartment Block Transportation Impact Assessment. Full Report. March 15, Prepared for: Mattamy Homes.
 Half Moon Bay North Apartment Block Transportation Impact Assessment Full Report March 15, 2018 Prepared for: Mattamy Homes Prepared by: Stantec Consulting Ltd. Table of Contents 1.0 SCREENING... 1 1.1
STANDARD LIMITATIONS
 STANDARD LIMITATIONS This report was prepared by MMM Group (MMM) for the account of Spire Construction Inc. (the Client). The disclosure of any information contained in this report is the sole responsibility
TRAFFIC IMPACT STUDY. USD #497 Warehouse and Bus Site
 TRAFFIC IMPACT STUDY for USD #497 Warehouse and Bus Site Prepared by: Jason Hoskinson, PE, PTOE BG Project No. 16-12L July 8, 216 145 Wakarusa Drive Lawrence, Kansas 6649 T: 785.749.4474 F: 785.749.734
King County Metro. Columbia Street Transit Priority Improvements Alternative Analysis. Downtown Southend Transit Study. May 2014.
 King County Metro Columbia Street Transit Priority Improvements Alternative Analysis Downtown Southend Transit Study May 2014 Parametrix Table of Contents Introduction... 1 Methodology... 1 Study Area...
TRAFFIC IMPACT ANALYSIS. for MILTON SQUARE
 TRAFFIC IMPACT ANALYSIS for MILTON SQUARE US Route 7 Milton, Vermont March 5, 2008 LAMOUREUX & DICKINSON 14 Morse Drive Essex Junction, Vermont 05452 (802) 878-4450 Traffic Impact Assessment EXECUTIVE
Trim Road, Commercial Development, City of Ottawa
 HARDEN REALTIES July 2016 Trim Road, Commercial Development, City of Ottawa Transportation Impact Study Trim Road, Commercial Development, City of Ottawa Transportation Impact Study prepared for: Harden
Table of Contents INTRODUCTION... 3 PROJECT STUDY AREA Figure 1 Vicinity Map Study Area... 4 EXISTING CONDITIONS... 5 TRAFFIC OPERATIONS...
 Crosshaven Drive Corridor Study City of Vestavia Hills, Alabama Table of Contents INTRODUCTION... 3 PROJECT STUDY AREA... 3 Figure 1 Vicinity Map Study Area... 4 EXISTING CONDITIONS... 5 TRAFFIC OPERATIONS...
TRAFFIC IMPACT STUDY 3171 LAKESHORE ROAD WEST RESIDENTIAL DEVELOPMENT TOWN OF OAKVILLE, REGIONAL MUNICIPALITY OF HALTON
 TRAFFIC IMPACT STUDY 3171 LAKESHORE ROAD WEST RESIDENTIAL DEVELOPMENT TOWN OF OAKVILLE, REGIONAL MUNICIPALITY OF HALTON PREPARED FOR: VOGUE WYCLIFFE (OAKVILLE) LIMITED PREPARED BY: C.F. CROZIER & ASSOCIATES
Traffic Impact Analysis Update
 Willow Bend Traffic Impact Analysis Update TABLE OF CONTENTS Page I. INTRODUCTION -------------------------------------------------------------------------------------------- 1 II. EXISTING CONDITIONS
Traffic Impact Analysis. Alliance Cole Avenue Residential Site Dallas, Texas. Kimley-Horn and Associates, Inc. Dallas, Texas.
 Traffic Impact Analysis Alliance Cole Avenue Residential Site Dallas, Texas February 15, 2018 Kimley-Horn and Associates, Inc. Dallas, Texas Project #064524900 Registered Firm F-928 Traffic Impact Analysis
Bennett Pit. Traffic Impact Study. J&T Consulting, Inc. Weld County, Colorado. March 3, 2017
 Bennett Pit Traffic Impact Study J&T Consulting, Inc. Weld County, Colorado March 3, 217 Prepared By: Sustainable Traffic Solutions, Inc. http://www.sustainabletrafficsolutions.com/ Joseph L. Henderson,
830 Main Street Halifax Regional Municipality
 830 Main Street Halifax Regional Municipality Traffic Impact Statement Final Report Prepared by: GRIFFIN transportation group inc. 30 Bonny View Drive Fall River, NS B2T 1R2 www.griffininc.ca Prepared
Lakeside Terrace Development
 Lakeside Terrace Development City of Barrie, County of Simcoe Traffic Brief for: Type of Document: Final Report Project Number: JDE 1617 Date Submitted: April 29 th, 216 4/29/16 John Northcote, P.Eng.
Prepared For: Toronto Transit Commission 1138 Bathurst Street Toronto, Ontario M5R 3H2. Prepared By:
 TRAFFIC IMPACT STUDY FOR THE TTC MCNICOLL BUS GARAGE CITY OF TORONTO Prepared For: Toronto Transit Commission 1138 Bathurst Street Toronto, Ontario M5R 3H2 Prepared By: Canada Inc. 4th Floor, 3 Leek Crescent
Oakbrook Village Plaza City of Laguna Hills
 Oakbrook Village Plaza City of Laguna Hills Traffic Impact Analysis Prepared by: HDR Engineering 3230 El Camino Real, Suite 200 Irvine, CA 92602 October 2012 Revision 3 D-1 Oakbrook Village Plaza Laguna
Transit City Etobicoke - Finch West LRT
 Delcan Corporation Transit City Etobicoke - Finch West LRT APPENDIX D Microsimulation Traffic Modeling Report March 2010 March 2010 Appendix D CONTENTS 1.0 STUDY CONTEXT... 2 Figure 1 Study Limits... 2
Environmental Assessment Derry Road and Argentia Road Intersection
 Air and Noise Study Environmental Assessment Derry Road and Argentia Road Intersection Project 11-4295 City of Mississauga, Region of Peel October 17, 2014 1 Region of Peel Environmental Assessment for
Section 5.0 Traffic Information
 Section 5.0 Traffic Information 10.0 TRANSPORTATION MDM Transportation Consultants, Inc. (MDM) has prepared an evaluation of transportation impacts for the proposed evaluation for the expansion of the
Proposed location of Camp Parkway Commerce Center. Vicinity map of Camp Parkway Commerce Center Southampton County, VA
 Proposed location of Camp Parkway Commerce Center Vicinity map of Camp Parkway Commerce Center Southampton County, VA Camp Parkway Commerce Center is a proposed distribution and industrial center to be
Escondido Marriott Hotel and Mixed-Use Condominium Project TRAFFIC IMPACT ANALYSIS REPORT
 Escondido Marriott Hotel and Mixed-Use Condominium Project TRAFFIC IMPACT ANALYSIS REPORT Prepared for Phelps Program Management 420 Sixth Avenue, Greeley, CO 80632 Prepared by 5050 Avenida Encinas, Suite
TRANSPORTATION IMPACT STUDY ALCONA SOUTH SECONDARY PLAN SLEEPING LION DEVELOPMENT TOWN OF INNISFIL
 TRANSPORTATION IMPACT STUDY ALCONA SOUTH SECONDARY PLAN SLEEPING LION DEVELOPMENT TOWN OF INNISFIL Prepared For: 1602850 Ontario Ltd. 2800 Highway 7 Vaughan, Ontario L4K 1W8 Prepared By: URS Canada Inc.
D. J. Halpenny & Associates Ltd. Consulting Transportation Engineers
 D. J. Halpenny & Associates Ltd. Consulting Transportation Engineers August 24, 2015 File: 115-622 Mr. R. Baumann, President The RGB Group 277 Kirchoffer Avenue Ottawa, ON K2A 1Y1 RE: RESIDENTIAL DEVELOPMENT
TRAFFIC IMPACT STUDY FOR SONIC DRIVE-IN RESTAURANT. Vallejo, CA. Prepared For:
 TRAFFIC IMPACT STUDY FOR SONIC DRIVE-IN RESTAURANT Vallejo, CA Prepared For: ELITE DRIVE-INS, INC. 2190 Meridian Park Blvd, Suite G Concord, CA 94520 Prepared By: KD Anderson & Associates 3853 Taylor Road,
TRAFFIC IMPACT ANALYSIS RIZZO CONFERENCE CENTER EXPANSION FINAL REPORT
 TRAFFIC IMPACT ANALYSIS RIZZO CONFERENCE CENTER EXPANSION Chapel Hill, North Carolina FINAL REPORT Prepared for: The Town of Chapel Hill, NC Prepared by: Architects-Engineers-Planners, Inc. December 2010
Location Concept Plan Amendment Recommendation Approved 2011 Concept Plan
 Valley Line West LRT Concept Plan Recommended Amendments Lewis Farms LRT Terminus Site Location Concept Plan Amendment Recommendation Approved 2011 Concept Plan Lewis Farms LRT terminus site, 87 Avenue/West
Village of Richmond Transportation Brief
 Village of Richmond Transportation Brief GENIVAR Project Number 111-18482-00 June 21 st, 2011 www.genivar.com GENIVAR 15 Fitzgerald Road, Suite 100 Ottawa, Ontario, CANADA K2H 9G1 Telephone: 613-829-2800
TRAFFIC IMPACT ANALYSIS SHORTBREAD LOFTS 2009 MODIFICATION Chapel Hill, North Carolina
 TRAFFIC IMPACT ANALYSIS SHORTBREAD LOFTS 2009 MODIFICATION Chapel Hill, North Carolina Prepared for: The Town of Chapel Hill, NC Prepared by: Architects-Engineers-Planners, Inc. November 2009 Traffic Impact
Downtown One Way Street Conversion Technical Feasibility Report
 Downtown One Way Street Conversion Technical Feasibility Report As part of the City s Transportation Master Plan, this report reviews the technical feasibility of the proposed conversion of the current
Proposed Hotel and Restaurant Development
 Traffic Impact Study Proposed Hotel and Restaurant Development Marbledale Road Tuckahoe, NY PREPARED FOR BILLWIN DEVELOPMENT AFFILIATES, LLC 365 WHITE PLAINS ROAD EASTCHESTER, NY. 10709 PREPARED BY Engineering
One Harbor Point Residential
 Residential Gig Harbor, WA Transportation Impact Analysis January 23, 2017 Prepared for: Neil Walter Company PO Box 2181 Tacoma, WA 98401 Prepared by: TENW Transportation Engineering NorthWest 11400 SE
144&176 John St. and 200 John St. & 588 Charlotte St. Hotel and Residential Subdivision Development
 Solmar Development Corp. 144&176 John St. and 2 John St. & 588 Charlotte St. Hotel and Residential Subdivision Development TRANSPORTATION IMPACT STUDY 18145 November 217 LEA Consulting Ltd. Consulting
TRAFFIC IMPACT STUDY FOR ST. JOSEPH'S ELEMENTARY SCHOOL ADDITION
 CATHOLIC DISTRICT SCHOOL BOARD OF EASTERN ONTARIO P.O. 61992 TRAFFIC IMPACT STUDY FOR ST. JOSEPH'S ELEMENTARY SCHOOL ADDITION SEPTEMBER 5, 218 TRAFFIC IMPACT STUDY FOR ST. JOSEPH'S ELEMENTARY SCHOOL ADDITION
appendix 4: Parking Management Study, Phase II
 appendix 4: Parking Management Study, Phase II A4-1 A4-2 Eastlake Parking Management Study Final Phase 2 Report Future Parking Demand & Supply January 6, 2017 Submitted by Denver Corp Center III 7900 E.
TRANSPORTATION TECHNICAL REPORT
 TRANSPORTATION TECHNICAL REPORT for Sunrise Elementary School Replacement PREPARED FOR: Puyallup School District PREPARED BY: 6544 NE 61 st Street, Seattle, WA 98115 ph: (26) 523-3939 fx: (26) 523-4949
IV. ENVIRONMENTAL IMPACT ANALYSIS K.2. PARKING
 IV. ENVIRONMENTAL IMPACT ANALYSIS K.2. PARKING ENVIRONMENTAL SETTING The following analysis summarizes the findings and conclusions of the Traffic Analysis (Traffic Study), prepared by The Mobility Group,
770 SOMERSET STREET RESIDENTIAL DEVELOPMENT
 Downtown North York by PFHLai / CC-BY-3. September 217 77 SOMERSET STREET RESIDENTIAL DEVELOPMENT Transportation Impact Assessment 77 Somerset Street Residential Development Transportation Impact Assessment
Manotick Plaza, Manotick Main Street - Traffic Impact Brief
 March 28 th, 2013 Mr. Nicholas Caragianis Nicholas Caragianis Architect Inc. 137 Pamilla Street Ottawa, ON K1S 3K9 [Tel: 613 237-6801 ext. 222 / Fax: 613 237-8289 / E-mail: nicholas@ncarchitect.ca] Dear
TRAFFIC DATA. Existing Derousse Ave./River Rd. AM LOS Analysis Existing Derousse Ave./River Rd. PM LOS Analysis
 Appendix E NJ TRANSIT Pennsauken Junction Transit Center and Park & Ride RiverLINE and Atlantic City Line Pennsauken Township, Camden County, New Jersey TRAFFIC DATA Background Traffic Information for