Interchange Modification Justification Study. I-90/Timberline Road Interchange, Exit 402 SIOUX FALLS MPO
|
|
|
- Darrell Peters
- 5 years ago
- Views:
Transcription


1 Interchange Modification Justification Study I-90/Timberline Road Interchange, Exit 402 SIOUX FALLS MPO Technical analysis to accompany companion Environmental Assessment

2 Interchange Modification Justification Report I-90/Timberline Avenue Interchange Exit 402 Sioux Falls, South Dakota February, 2013 Updated June, 2014 Prepared for: South Dakota Department of Transportation Office of Project Development 700 East Broadway Avenue Pierre, South Dakota
3 Prepared by: HDR Engineering, Inc South Old Village Place Suite 100 Sioux Falls, SD The South Dakota Department of Transportation provides services without regard to race, color, gender, religion, national origin, age or disability, according to the provisions contained in SDCL 20-13, Title VI of the Civil Rights Act of 1964, the Rehabilitation Act of 1973, as amended, the Americans With Disabilities Act of 1990 and Executive Order 12898, Federal Actions to Address Environmental Justice in Minority Populations and Low Income Populations, To request additional information on the SDDOT's Title VI/Nondiscrimination policy or to file a discrimination complaint, please contact the Department's Civil Rights Office at
4 TABLE OF CONTENTS EXECUTIVE SUMMARY 1 INTRODUCTION 2 Background 2 Purpose 2 Project Location 2 METHODOLOGY 6 EXISTING CONDITIONS 7 Demographics 7 Existing Land Use 7 Existing Roadway Network 8 Alternative Travel Modes 9 Interchanges 9 Existing Data 10 Operational Performance 10 Existing Safety Conditions 15 Existing Environmental Constraints 17 PROJECT NEED 18 ALTERNATIVES 19 Standard Diamond Alternative 19 Tight Diamond Alternative 19 Single Point Alternative 20 FUTURE YEAR TRAFFIC 25 ALTERNATIVES ANALYSIS 32 Conformance with Transportation Plans 32 Compliance with Policies and Engineering Standards 32 Environmental Impacts 33 Preferred Alternative 33 Safety 36 Operational Performance 36 Evaluation Matrix 37 Coordination 37 FUNDING PLAN 38 RECOMMENDATIONS 39 APPENDIX I-90/Timberline Avenue Interchange Modification Report Page i
5 FIGURES AND TABLES Figure 1 Study Area Location Map 4 Figure 1A Study Area Location Map (Close-up) 5 Figure 2 Study Area Future Land Use 8 Figure ADT Volumes 11 Figure Balanced Peak Hour Volumes 12 Figure Interstate Level of Service 13 Figure Intersection Volumes and Level of Service 14 Figure 7 Alternative 1: Standard Diamond Interchange 21 Figure 8 Alternative 2: Tight Diamond Interchange 22 Figure 9 Alternative 3: Single Point Interchange 23 Figure Forecast Peak Hour Volumes 26 Figure Interstate Level of Service 27 Figure No-Build Intersection Volumes and Level of Service 28 Figure Diamond Volumes and Level of Service 29 Figure 13a 2035 Tight Diamond Volumes and Level of Service 30 Figure Single Point Volumes and Level of Service 31 Figure A6-3 Conceptual Signing Plan Alternative 3, Single-Point 41 Table 1 Summary of Long Term Impacts for Interchange Alternatives 35 Table 2 Evaluation Matrix 37 Table 3 Anticipated Funding Allocation Breakdown 38 I-90/Timberline Avenue Interchange Modification Report Page ii
6 EXECUTIVE SUMMARY This report is part of a supplement to a previously-approved Environmental Assessment and subsequent analyses of Interstate access. The documents are being supplemented to account for alignment changes to the roadway intersecting the Interstate system. The report format has also been updated to comply with the most recent guidance. The updated EA document is being prepared in conjunction with this report. The proposed action is a reconfiguration and realignment of the existing Timberline Avenue (Exit 402) interchange on Interstate 90 near Sioux Falls, SD. The action is proposed to provide appropriate operational capacity for a new regional arterial highway, referred to as the Eastside Corridor, which is currently under phased construction. The Eastside Corridor is part of local and state transportation plans to serve growth in the Sioux Falls metropolitan area. No adverse impacts to the Interstate highway system are forecast due to the proposed change. The Federal policy considerations and requirements have been addressed beginning on page 36 and summary responses to the eight requirements are provided below. 1. The proposed action is a modification of an existing interchange to correct design deficiencies and meet planned future travel needs of the metropolitan area. 2. No additional Interstate capacity or additional Interchange access points are required. The need can be met by providing updated interchange configuration and additional crossroad capacity. 3. The ramp terminal intersections will fail with the interchange no-build option, but continue to operate acceptably with build alternatives. 4. The proposed action is an update of an existing full public road interchange. 5. The proposed action is the result of land use and transportation plans prepared within the MPO process. A companion EA accompanies this report. 6. A comprehensive Interstate system study has recommended improvements at this interchange. 7. The proposed action is part of the overall planned transportation system. 8. An Environmental Assessment accompanies this report. The analysis indicates that an update of the existing interchange is necessary to address future travel demand. Previous analyses selected a single-point interchange as the preferred alternative at this location and the subsequent analysis validates this recommendation. Alternative improvements such as slight changes at adjacent interchanges, changes to the local street system, the increased use of transit, HOV/HOT lanes, etc. were deemed not to satisfy the need for an appropriate Interstate connection for the planned new regional arterial corridor. Analysis techniques included evaluation of operational capacity using Highway Capacity Manual 2010 techniques via HCS Highway Safety Manual techniques were used to the extent possible in this report. I-90/Timberline Avenue Interchange Modification Report Page 1
7 INTRODUCTION Background SDDOT is conducting a study to evaluate the design, operations, policy and funding implications of replacing the Timberline Avenue interchange (Exit 402) on I-90 east of Sioux Falls. This existing interchange will serve as the northern terminus of the planned Sioux Falls east-side regional arterial corridor. An Environmental Assessment (EA) and two Supplements to the EA have been completed for the route. An additional EA addressing environmental impacts associated with alignment shifts for the portion of the Eastside Corridor from Madison Street to I-90 is proceeding in conjunction with this document. Phased construction of portions of the corridor included in the approved environmental documents is underway with portions of the corridor constructed and open to traffic, other portions are programmed for construction, and other portions are receiving further environmental review to address small changes in the roadway alignment or configuration. The portion of the Eastside Corridor that includes the I-90 interchange is currently undergoing an EA. Interstate access justification work for this interchange was begun, but not completed or submitted to FHWA. The current study updates the previous work with recent data and seeks to meet revised guidance for preparation of Interstate access studies. This Interchange Modification Justification Report is being prepared in conjunction with the EA and will provide traffic analysis for the selection of a preferred alternative in the EA. Purpose The preliminary design for the Eastside Corridor shows the intersection of the improved crossroad will remain at the existing location at Exit 402. The change of classification of the crossroad from a county highway to a regional arterial highway brings an expected significant increase in the traffic using this interchange. This study will evaluate the operational and safety effects of several interchange configurations. Project Location The subject interchange is at mile reference marker 402 on Interstate 90, east of Sioux Falls, SD. This location is within the Sioux Falls MPO and also within the area identified for future Sioux Falls growth by local comprehensive planning. The adjacent interchanges on I-90 are I-229 (Exit 400) and South Dakota Highway 11 (SD 11) (Exit 406). Therefore, interchange spacing is approximately 2 miles to the west of the subject interchange and 4 miles to the east of the subject interchange. There are few local roadways in the vicinity of the interchange. The existing crossroad has been identified as Timberline Avenue and Minnehaha County Highway 121. It is an asphalt-paved two-lane roadway that provides local service between Sioux Falls and rural residences and businesses. Timberline Avenue is intersected by Redwood Boulevard, a low-volume gravel road, just to the south of the existing interchange. Approximately ½ mile south of the interchange, Timberline Avenue is intersected from the west by 60 th I-90/Timberline Avenue Interchange Modification Report Page 2
8 Street North. The closest intersecting roadway north of the interchange is 259 th Street, a low-volume gravel road over 1 mile away. Currently all intersections on the crossroad are controlled by stop signs. The Eastside Corridor is planned to terminate at Exit 402 and transition back to the existing County Highway north of the interchange. The roadway designated at 60 th Street North is planned to be realigned to intersect with the Eastside Corridor and Redwood Boulevard at a common signalized intersection. Access from the Eastside Corridor to Rice Street will be provided by an at-grade intersection. The study area, therefore, has been defined as Interstate 90, from MRM 400 to MRM 406, including Exits 400, 402, and 406, and Timberline Avenue including the interchange and the 60 th Street North intersection. The study area is shown in Figure 1. I-90/Timberline Avenue Interchange Modification Report Page 3
9 N I 90/TIMBERLINE AVENUE INTERCHANGE MODIFICATION REPORT MAY 2014 FIGURE 1 PROJECT LOCATION
10 N I 90/TIMBERLINE AVENUE INTERCHANGE MODIFICATION REPORT MAY 2014 FIGURE 1A STUDY AREA
11 METHODOLOGY Preparation of this report included the following work tasks: 1. Data gathering 2. Review previous Interstate access work and EA documents, including feasible alternatives and the recommended alternative. 3. Update existing and future operational characteristics of Interstate and local street facilities. 4. Estimate the safety effects of each alternative. 5. Prepare deliverable report Traffic forecasts were prepared using output from the regional travel demand model maintained by the City of Sioux Falls. Traffic operations were analyzed using Highway Capacity Manual techniques using HCS This IMJR document is organized in accordance with Section of FHWA s Interstate System Access Information Guide, August I-90/Timberline Avenue Interchange Modification Report Page 6
12 EXISTING CONDITIONS Demographics The Sioux Falls metropolitan area enjoys a robust economy and sustained measured population growth. During the period the population grew at a steady rate of between 2% and 3% per year. Even in the face of the recent recession, the population continued to grow and the 2010 Census shows the city with a population of 153,888, while the MSA had a population of 228,261 and the market area had a population of 1,043,450. (Market area is a term used in economics and human geography describing the area surrounding a central place, from which people are attracted to use the place s goods or services.) Generally, employment for the Sioux Falls area has grown at approximately the same rate as the population and unemployment remains very low in comparison to national figures. The study area is currently sparsely populated, with scattered rural residences and a few businesses near the existing interchange. The study area Traffic Analysis Zones (TAZ s) currently reflect the existing sparse population with relatively small population and employment inputs. The future-year TAZ s, however, show greatly increased population and employment inputs to reflect the planned development of regional commercial and housing activities. See the following section for more information on planned land uses. Existing Land Use The study area is currently occupied primarily by agricultural and recreation/conservation land uses, although a few scattered rural residences exist. Small commercial enterprises occupy the land on the north side of the subject interchange. They include an agricultural implement auction, a commercial campground and two fireworks vendors. The future land use for this area is shown in Figure 2. I-90/Timberline Avenue Interchange Modification Report Page 7

13 Figure 2 - Study Area Future Land Use (source Shape Sioux Falls comprehensive plan and Brandon Comprehensive Plan) Existing Roadway Network As previously identified, the existing roadways within the study area include: Interstate 90 currently two lanes in each direction Interstate 229 currently two lanes in each direction Timberline Avenue/Minnehaha County Highway 121 two lane urban collector, frequent access 60 th Street North two lane urban collector, new access controlled by City Design Standards South Dakota Highway 11 three lane minor arterial north of I-90, five lane principal arterial south of I-90, access controlled by South Dakota Administrative Rule 70:09. Township local roads, including Redwood Boulevard and 259 th Street. I-90/Timberline Avenue Interchange Modification Report Page 8
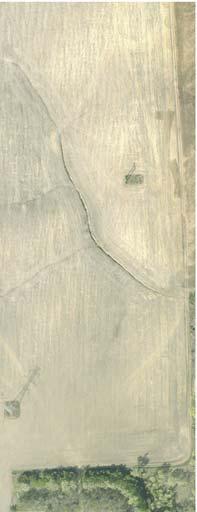
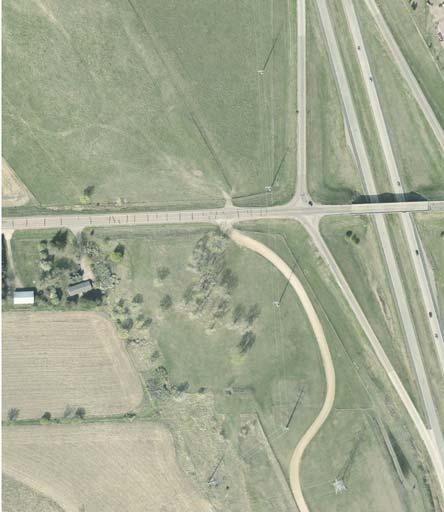
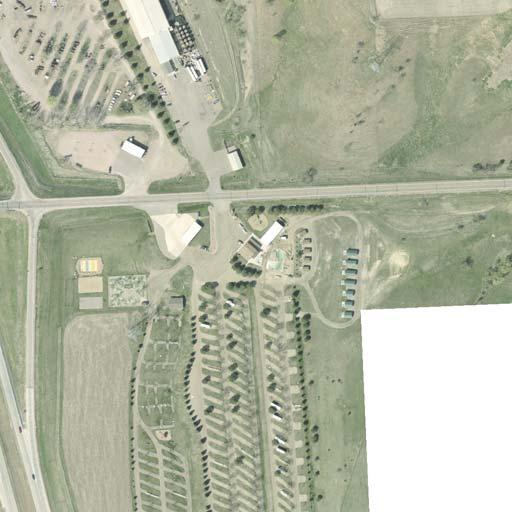
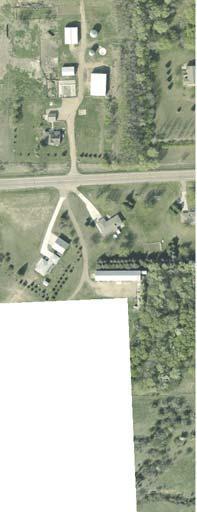
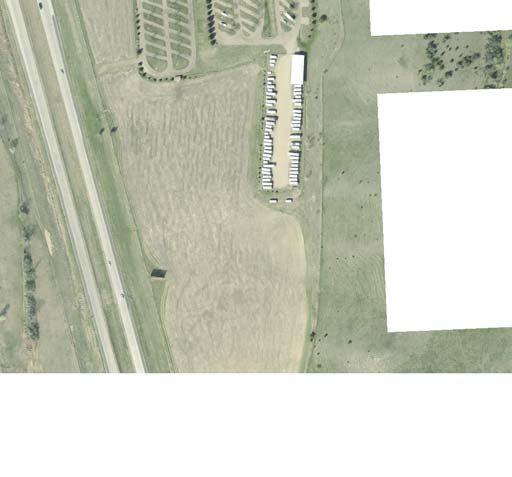
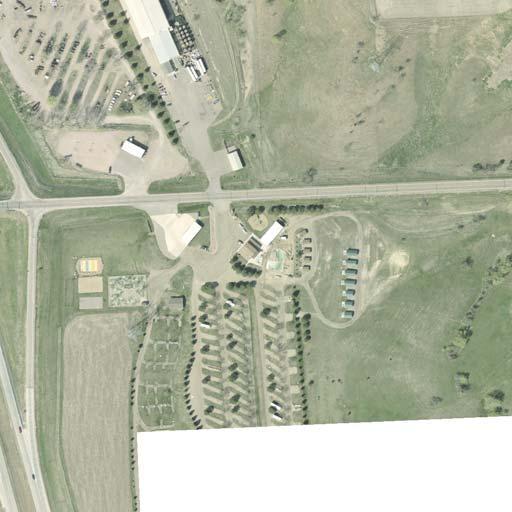
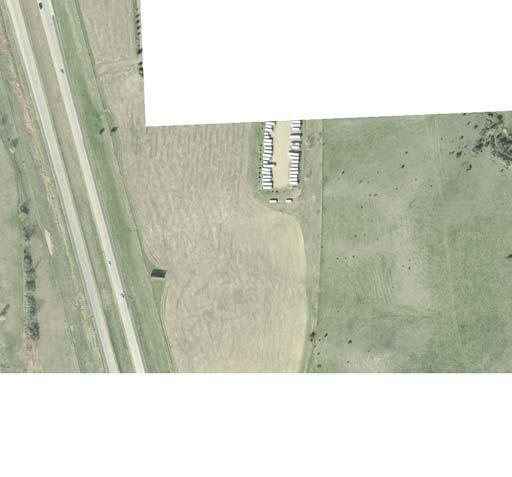
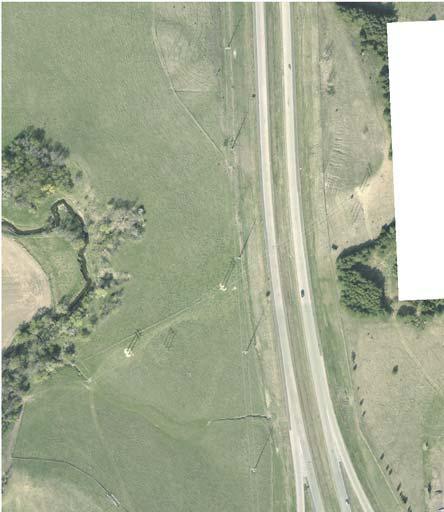
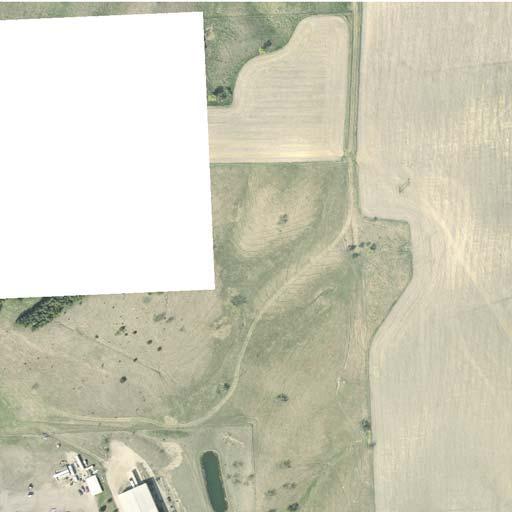
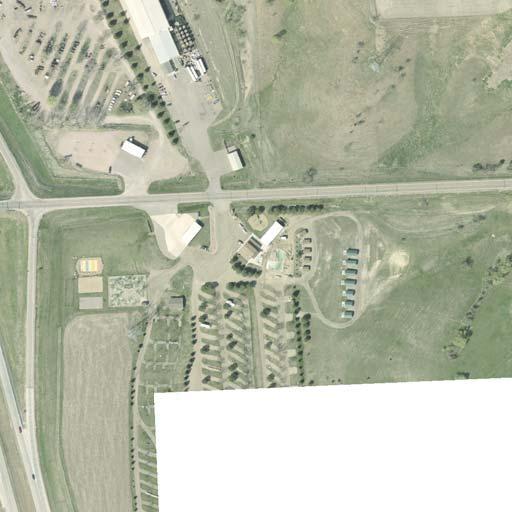
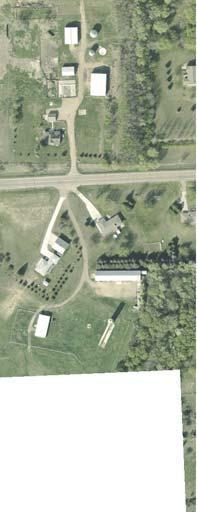
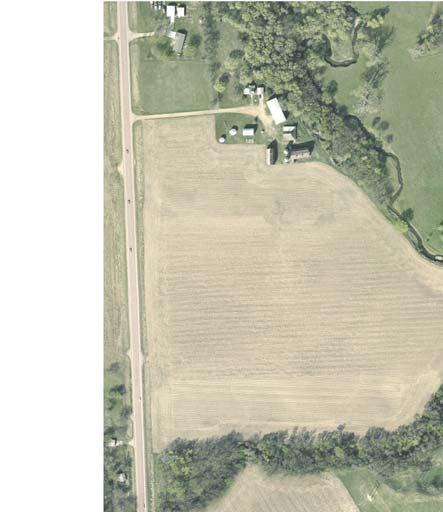
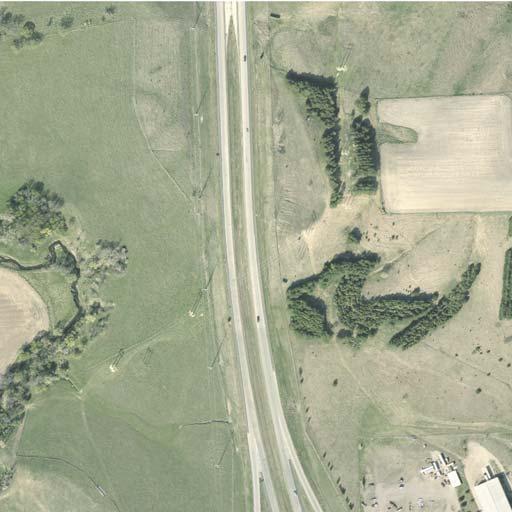
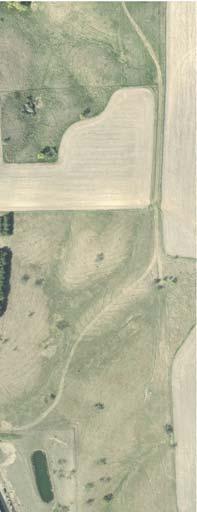
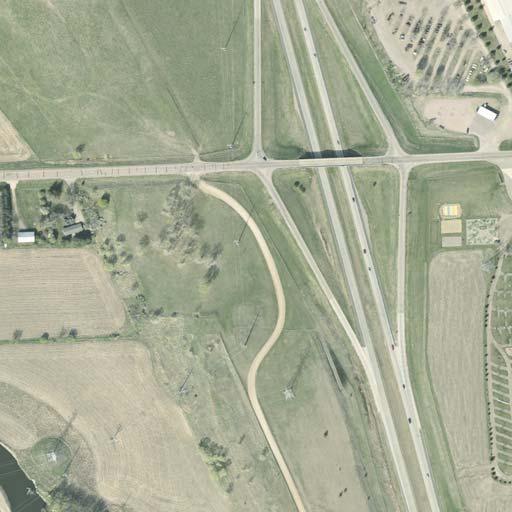
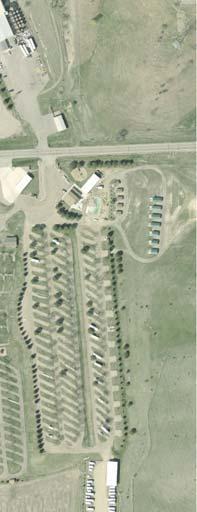
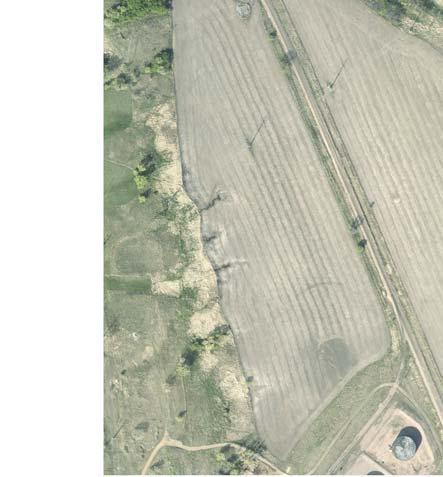
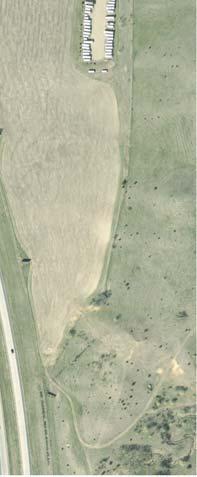
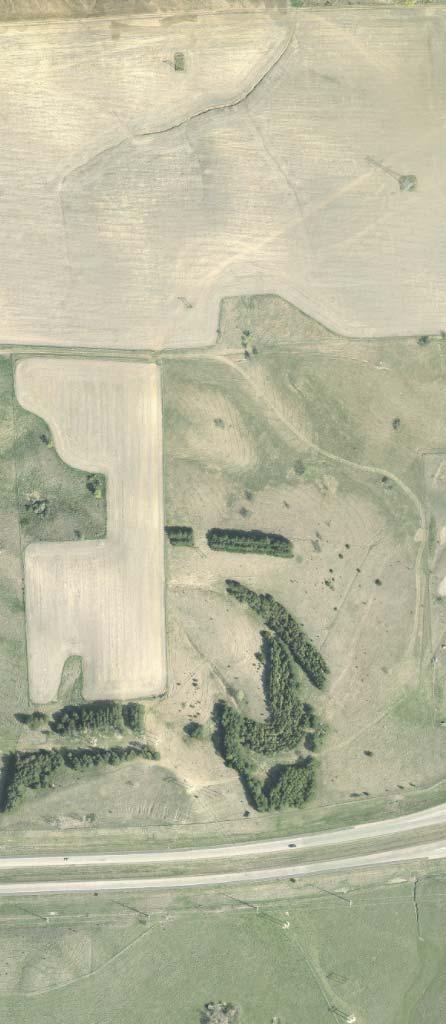
14 Alternative Travel Modes Travel within the study area is primarily by automobile. Pedestrian and bicycle modes are used mainly for recreation, although a small number of bicycle commuters use Rice Street on the fringe of the study area. The area is not currently served by municipal transit routes, although demand transit service exists in Brandon on the fringe of the study area. Interchanges Interchanges within the study area include: I-90/I-229 (Exit 400) a partial cloverleaf design with loops for westbound-tosouthbound and northbound-to-westbound movements. Currently, I-229 terminates at this location and the mainline of I-229 feeds into an existing county highway north of the interchange. SDDOT has studied alternatives (see I229-I90_Final%20Revised.pdf) for reconfiguration of this Interstate facility and although an updated interchange configuration has not been identified, the alternatives developed are not expected to have a configuration effect on the adjacent interchange at Exit 402. Also, portions of the Exit 400 interchange have recently been reconstructed with new surfacing. I-90/Timberline Avenue (Exit 402) the subject interchange is a standard diamond configuration with stop-sign controlled ramp termini. It meets current needs, but will be insufficient to carry future travel demand. Construction of the planned Eastside Corridor route would require realignment and reconfiguration of the existing interchange. The Decennial Interstate Corridor Study (SDDOT) has identified the following interchange deficiencies: o Inslope for mainline and ramp junction o Bridge section width for SD100 mainline o Super-elevation rate for ramp roadway o Grades on the ramp roadway o Lane width and right shoulder width on ramp roadway o The K value for ramp roadway o On-ramp and off-ramp taper for ramp junction I-90/SD 11 (Exit 406) a standard diamond configuration with stop-sign controlled ramp termini. Regional growth has increased the traffic load on this interchange and will likely require future reconfiguration to provide increased capacity. SDDOT has identified the need to revise the interchange in the future, but no detailed study has been completed. Planned interchange between Exit 402 and Exit 406 The Sioux Falls MPO Long Range Transportation Plan has included a new interchange at Exit 404 as a potential project need beyond the 2035 planning horizon. No funding has been assigned or detailed analysis conducted for this potential project. Aerial photos of the existing interchanges have been included in the Appendix, Part 7. I-90/Timberline Avenue Interchange Modification Report Page 9
15 Existing Data Most study data was available from the participating agencies, including counts, crash data, and raw travel demand model output. The available data was supplemented with additional counts, travel time runs, and traffic observations. The data is recent and of high quality. Operational Performance The existing study area roadways are in rural areas and performance was evaluated using techniques for Interstate highways and rural roads. Interstate 90 and Timberline Avenue both operate at acceptable levels of service under existing conditions. Traffic volumes and levels of service are summarized in Figures 3-6. Supporting analysis printouts are provided in the Appendix 1 and 2. Operational performance for intersections is related to the delay experienced by drivers, as defined by the Highway Capacity Manual. The following table further outlines intersection level of service standards: Level of Service Description SIGNALIZED Intersection Level of Service Control Delay (sec.) (sec.) UNSIGNALIZED Intersection Control Delay Intersection LOS Description A <=10.0 <=10.0 Free flow, insignificant delays. B Stable operation, minimal delays. C Stable operation, acceptable delays. D Restricted flow, regular delays. E Maximum capacity, extended delays. Volumes at or near capacity. Long queues form upstream from intersection. F >80.0 >50.0 Forced flow, excessive delays. Represents jammed conditions. Intersection operates below capacity with low volumes. Queues may block upstream intersections. Source: Highway Capacity Manual, Transportation Research Board, 2010 I-90/Timberline Avenue Interchange Modification Report Page 10
16 INTERSTATE 229 TIMBERLINE AVE. SD 11 INTERSTATE 90 N I 90/TIMBERLINE AVENUE INTERCHANGE MODIFICATION STUDY MAY 2014 FIGURE ADT VOLUMES
17 LEGEND TIMBERLINE AVE. SD 11 INTERSTATE 90 INTERSTATE = AM PEAK VOLUME (456) = PM PEAK VOLUME N I 90/TIMBERLINE AVENUE INTERCHANGE MODIFICATION STUDY MAY 2014 FIGURE BALANCED PEAK HOUR VOLUMES
18 SD 11 INTERSTATE 90 LEGEND INTERSTATE 229 TIMBERLINE AVE. X = AM LEVEL OF SERVICE (X) = PM LEVEL OF SERVICE N I 90/TIMBERLINE AVENUE INTERCHANGE MODIFICATION STUDY MAY 2014 FIGURE INTERSTATE LEVEL OF SERVICE
 N LEGEND 60TH STREET NORTH 196 145 (34) (118) 123 (456) AM/(PM) TRAFFIC VOLUMES X/X AM/PM LEVEL OF SERVICE EXISTING STOP CONTROL I 90/TIMBERLINE AVENUE INTERCHANGE MODIFICATION STUDY MAY 2014")
19 (85) (103) B/(B) 7 (5) 81 (23) (24) (124) SOUTHBOUND LANE B/B NORTHBOUND LANE C/B (107) (19) (45) 17 (118) 13 (12) (142) C/B TIMBERLINE AVENUE (56) 67 (47) 14 B/B (92) (71) N LEGEND 60TH STREET NORTH (34) (118) 123 (456) AM/(PM) TRAFFIC VOLUMES X/X AM/PM LEVEL OF SERVICE EXISTING STOP CONTROL I 90/TIMBERLINE AVENUE INTERCHANGE MODIFICATION STUDY MAY 2014 FIGURE INTERSECTION VOLUMES AND LEVEL OF SERVICE

20 Existing Safety Conditions The South Dakota Departments of Transportation and Public Safety make crash information available through GIS applications. GIS plots are used throughout this section to display the spatial distribution of crashes for a recent six-year period. The study corridor resides in an area that sees some of the highest frequencies of deer-related crashes in the state. Efforts are underway to reduce the deer herd and other measures have been studied to reduce the incidence of animal hits. N Fatality Incapacitating Injury Non-incapacitating Injury Possible Injury Property Damage Only Severity Unknown I-90, I-229 to Timberline Avenue: Potential crash trends on I-90 between the I-229 and Timberline Avenue interchange: Manner of Crash Weather Total Documented Year Related Animal Other Crashes Injury Total I-90/Timberline Avenue Interchange Modification Report Page 15

21 N Fatality Incapacitating Injury Non-incapacitating Injury Possible Injury Property Damage Only Severity Unknown I-90/Timberline Avenue: Potential crash trends at the I-90/Timberline Avenue interchange include: Manner of Crash Weather Related Animal Other Total Crashes Documented Injury Year Total An overturn accident resulted in a fatality. I-90/Timberline Avenue Interchange Modification Report Page 16

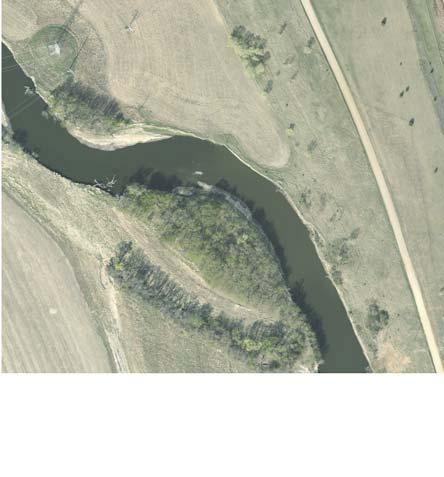
22 N Fatality Incapacitating Injury Non-incapacitating Injury Possible Injury Property Damage Only Severity Unknown I-90 Timberline Avenue to SD 11: Potential crash trends on I-90 between Timberline Avenue and the SD 11 interchanges include: 1 2 Manner of Crash Weather Related Animal Other Total Crashes Documented Injury Year Total A rear-end accident resulted in a fatality. An over-turn accident under slippery conditions resulted in a fatality. Existing Environmental Constraints Environmental constraints are being evaluated through an EA that is being prepared simultaneously with this Interstate access report. The study area includes portions of the Big Sioux River floodplain and associated riparian and wooded areas. The previous approved 2003 EA, however, found no fatal flaws with development of the Eastside Corridor. I-90/Timberline Avenue Interchange Modification Report Page 17
23 PROJECT NEED The Eastside Corridor is under development to provide regional arterial transportation service to developing areas around the east and south sides of the Sioux Falls metropolitan area. The corridor is part of extensive regional comprehensive, land use and infrastructure planning. Sections of the Eastside Corridor have been built while others are either under construction or scheduled for construction. The northern terminus of the Eastside Corridor is the I-90 Exit 402 interchange. Additional travel demand associated with the Eastside Corridor will overwhelm the capacity of the existing rural diamond interchange (Figure 12 shows that the ramp termini level of service falls to F during the peak hours). The interchange, therefore, needs to be rebuilt to provide additional capacity and configured to provide a useful terminus of the Eastside Corridor. The Decennial Interstate Corridor Study, 2010 also identified the following geometric needs at the study interchange: Inslope for mainline and ramp junction Bridge section width for SD100 mainline Super-elevation rate for ramp roadway Grades on the ramp roadway Lane width and right shoulder width on ramp roadway The K value for ramp roadway On-ramp and off-ramp taper for ramp junction I-90/Timberline Avenue Interchange Modification Report Page 18
24 ALTERNATIVES The following interchange alternatives were developed and screened through the Environmental Assessment process: Alternative 1: Standard Diamond Alternative 2: Tight Diamond Alternative 3: Single Point No-build Alternative 1: Standard Diamond Alternative (Figure 7): This option is similar to the existing diamond interchange configuration. However, the spacing of the ramp intersections at the Eastside Corridor is moved further apart to accommodate signalized intersections. Due to the need for signals, the spacing between ramp intersections should be no less than 1,300 feet. In addition to the ROW impacts to the north, environmental constraints to the south caused by the Big Sioux River flood way control how far south of the proposed interchange 60 th Street North can be constructed. The location of the SD100/60 th Street North intersection creates undesirable intersection spacing between the eastbound ramp intersection and the 60 th Street North intersection. The diamond interchange contains a diagonal one-way ramp in each quadrant allowing traffic to leave or enter the interstate at higher speeds. Advantages o Typical interchange familiarity o Lowest construction cost of options developed Disadvantages o Increased right-of-way (ROW) needs as compared to Alternatives 2 and 3. o Spacing between the interchange eastbound ramp and 60 th Street North/SD100 intersection is too close to provide adequate storage. Alternative 2: Tight Diamond Alternative (Figure 8): This type of interchange is similar to a diamond interchange in that it uses two traffic signals and typical diamond traffic movements. However, this interchange type utilizes less ROW by reducing the spacing between ramp intersections. Traffic is controlled in a similar method to a Single Point Interchange (SPI) in that the attempt is to store vehicles outside the interchange. However, two signals are utilized instead of one with a SPI. Advantages o Lowest ROW needs and business impacts when compared to Alternatives 1 and 3 o Lower construction cost when compared to a SPI Disadvantages o Reduced traffic capacity (major concern) o Difficult signal timing (major concern) o Driver familiarity is higher for a SPI as there are more SPI interchanges than tight diamond interchanges around Sioux Falls. I-90/Timberline Avenue Interchange Modification Report Page 19
25 Alternative 3: Single-Point Alternative (Figure 9): This type of interchange is best suited for areas where right-of-way availability is limited. At this location, businesses located north of the interchange are a concern for acquiring additional ROW. The Single-Point Interchange essentially combines both ramp terminals into one large intersection which accommodates all vehicular movements and is controlled by a single traffic signal. The other unique concept of the Single-Point Interchange is that opposing left turning movements are to the left of each other. Advantages o Reduced ROW needs and business impacts as compared to Alternative 1 o Increased traffic capacity compared to Alternative 2 o Driver familiarity in Sioux Falls urban area o Single traffic signal, reducing operating delay in interchange area o Increase spacing to adjacent intersections along the Eastside Corridor Disadvantages o Higher construction cost I-90/Timberline Avenue Interchange Modification Report Page 20

26

27
28
29 Improvements to adjacent interchanges and Transportation System Management alternatives were not deemed able to satisfy the need of providing an interchange with the capacity and alignment to serve the future Eastside Corridor. I-90/Timberline Avenue Interchange Modification Report Page 24
30 FUTURE YEAR TRAFFIC Traffic forecasts for the study area were prepared using the regional travel demand model maintained by the City of Sioux Falls and the Sioux Falls MPO. The model horizon year is 2035 and is based on local land use plans. Forecast traffic volumes are shown in Figures 10 through 14, along with the results of the operational analysis. Previous analysis conducted by the SDDOT identified ramp junctions operating at or below acceptable LOS (C/D) under the current four lane interstate configuration from the I-90/I-229 (Exit 400) interchange through the I-90/Timberline (Exit 402) interchange. The study 1 recommended an auxiliary lane between Exit 400 and Exit 402 which would result in significantly improved LOS for freeway operations. It should be noted that proposed I-90/I-229 interchange alternatives in conjunction with proposed I- 90/Timberline interchange alternatives do not create either configuration or operational issues to the adjacent interchange. The future year traffic analysis in this report is based on the 2035 model year, which does not meet the 20-year projection requirement from planned construction. The future 20- year traffic analysis for corridor and interchange will be reviewed by SDDOT, during final design, to confirm that the 20-year traffic projection from the planned year of construction provides an acceptable level of service established for this project using the 2040 model year. 1 The study Interstate 90/Interstate 229 Interstate Access Modification Request is located at: I90_Final%20Revised.pdf I-90/Timberline Avenue Interchange Modification Report Page 25
31 LEGEND INTERSTATE 229 TIMBERLINE AVE. SD 11 INTERSTATE = AM PEAK VOLUME (456) = PM PEAK VOLUME N I 90/TIMBERLINE AVENUE INTERCHANGE MODIFICATION STUDY MAY 2014 FIGURE FORECAST PEAK HOUR VOLUMES
32 TIMBERLINE AVE. INTERSTATE 90 SD 11 INTERSTATE 229 LEGEND X = AM LEVEL OF SERVICE (X) = PM LEVEL OF SERVICE N I 90/TIMBERLINE AVENUE INTERCHANGE MODIFICATION STUDY MAY 2014 FIGURE INTERSTATE LEVEL OF SERVICE
33 (130) (350) F/(F) (650) (800) 60 (70) 360 (300) SOUTHBOUND TWO LANE D/D NORTHBOUND TWO LANE D/D (580) (70) (230) (830) (130) (150) 130 (610) 720 F/(F) (200) 180 (70) 40 (560) 510 D/(D) (370) (1380) (220) 100 (80) 60 (50) 270 (210) TIMBERLINE AVE (1300) (360) LEGEND N 123 (456) AM (PM) TRAFFIC VOLUME 60TH STREET NORTH X/(X) AM/ (PM) LEVEL OF SERVICE TRAFFIC CONTROL I 90/TIMBERLINE AVENUE INTERCHANGE MODIFICATION STUDY MAY 2014 FIGURE NO BUILD INTERSECTION VOLUMES AND LEVEL OF SERVICE
34
35


36
37 ALTERNATIVES ANALYSIS The retained interchange improvement alternatives were analyzed and compared to determine which may be most suitable for meeting the project need. The areas of analysis and comparison are discussed in the following sections. Conformance with Transportation Plans Local (MPO and City) and State transportation plans have identified a need for construction of the Eastside Corridor, a regional arterial highway corridor around the east and south sides of the Sioux Falls metropolitan area. All interchange alternatives satisfy the existing transportation planning considerations. Compliance with Policies and Engineering Standards Each of the interchange alternatives is a standard interchange configuration. Conceptual design has used the latest guidance from AASHTO and FHWA and it appears that final design may be accomplished without conflict with geometric design standards. One potential access management conflict is posed by the signalized intersection spacing between the interchange and the planned 60 th Street North/Eastside Corridor intersection. SDDOT access management standards call for signal spacing of at least ½ mile (2,640 ) on roadways like the Eastside Corridor. Other guidelines and research recommends signalized intersections no closer than ¼ mile (1,320 ) from interchange ramp terminals. Alternative 1 (Standard Diamond) has a center to center spacing from the nearest ramp to 60 th Street of approximately 600. Alternative 2 (Tight Diamond) has a center to center spacing of approximately Alternative 3 (Single Point) has a center to center spacing from the central intersection to 60 th Street of approximately Access standards for the Eastside Corridor have been established through a cooperative planning process between the SDDOT and the Sioux Falls MPO agencies, which takes precedence over regular state and local access standards under South Dakota administrative rules. That study has accepted the concept of a signalized intersection at 60 th Street North. Previous analysis looked at queue spillback and interactions between adjacent traffic signals and concluded that the tight diamond and single point alternatives should operate acceptably. The standard diamond alternative, however, may experience queue interference between adjacent traffic signals. The existing configuration and the alternatives are affected by the close proximity of existing commercial driveways on the north side of I-90. Agreements have been made with the existing businesses and a resolution by the SDDOT Transportation Commission has addressed these driveways. A driveway will be maintained for each of the existing businesses, but no other driveways will be allowed through control of access and agreement. As a result, the property access within the vicinity of the interchange will satisfy the SDDOT Road Design Manual and the AASHTO Policy standards. I-90/Timberline Avenue Interchange Modification Report Page 32
38 Environmental Impacts The original EA recommended that the Eastside Corridor intersect with I-90 at the existing interchange; no interchange configuration was recommended, although the previous draft Interstate access report found that a slight realignment of the crossroad and a single point interchange were the best solution for the evolving design of the Eastside Corridor. Steep slopes, floodplain, and riparian areas exist adjacent to the interchange area, but it appears that no environmentally-sensitive features are being adversely impacted by interchange configuration. The EA is being prepared concurrently with this revision of the IMJR to address recent roadway alignment changes. Each of the Build Alternative Concepts along with the No-Build Alternative was presented at a Public Hearing on January 17, Following the Public Hearing, the alternatives were re-evaluated based on comments received and further analysis and as a result, Alternatives 1 and 2 were eliminated from further consideration. The following sections describe reasons for eliminating alternatives as well as the selection of the preferred alternative. Preferred Alternative Each of the alternatives developed as the potential replacement of the existing I-90 Exit 402 interchange are considered as accepted interchange configurations per the SDDOT Road Design Manual, Chapter 13. Also, except for the No-Build alternative, when performing traffic analysis, each alternative does meet acceptable traffic operations both immediately following construction and into the future. However, when comparing the alternatives to each other with respect to adjacent land impacts, long-term operations, corridor compatibility, and driver familiarity, Alternative 3 is identified as the preferred alternative. Alternative 1: The larger footprint required by the Diamond Interchange configuration creates unnecessary impacts to adjacent land including negative impacts to businesses directly north of the interchange. Impacts to the Yogi Bear s Jellystone Park would require relocation of several camp amenities located directly adjacent to the interchange and Minnehaha County Road 121. The property in the northwest quadrant would lose a significant amount of their property that is currently used for consignment auctions. The loss would be significant and may require the business to relocate. For this primary reason, it was recommended that Alternative 1 be eliminated from further consideration. Alternative 2 & 3: The smaller footprint of the Tight Diamond Interchange (TDI) and Single Point Interchange (SPI) addresses the concerns with regards to negative impacts to adjacent land and businesses. Although an accepted interchange configuration, the TDI is not prevalent in South Dakota, which is a concern with regards to driver familiarity. Another concern is traffic operation performance of the TDI. In analysis for a research paper submitted to the Transportation Research Board (TRB), it was determined that a Single Point Interchange (SPI) provides greater traffic operations than the TDI. Over the range of tests, the SPI provided higher average travel speeds, fewer phase failures, a I-90/Timberline Avenue Interchange Modification Report Page 33
39 lower percentage of stops and considerably higher capability to serve traffic. The results typically show that the TDI would reach capacity conditions when the SPI was operating at average conditions. For these reasons, the Single Point Interchange is recommended as the preferred interchange configuration for the I-90 Exit 402 location.compared to the other alternatives, Alternative 3 minimizes ROW impacts and is capable of accommodating future traffic volumes predicted to utilize this interchange. The key advantages of Alternative 3 are as follows: Reduced ROW needs and impacts to businesses Increased traffic capacity Driver familiarity, compared to tight diamond in Sioux Falls area Single traffic signal Increased spacing to adjacent intersections along the Eastside Corridor While each alternative was specifically designed to meet the Project goals, only one or two drawbacks made Alternatives 1 and 2 prohibitive to construct. Alternative 1 served future capacity needs, but additional ROW and spacing issues between the eastbound ramp intersections and 60 th Street North eliminated this alternative from further consideration. Alternative 2 also served future capacity needs within the planning horizon, but would experience capacity failure sooner than Alternative 3 in the period beyond For these reasons, Alternative 3 was considered superior to Alternatives 1 and 2. I-90/Timberline Avenue Interchange Modification Report Page 34
40 Table 1 Summary of Long Term Impacts for the Interchange Alternatives Resource Alt. 1-Diamond BUILD ALTERNATIVE OPTIONS Alt. 2-Tight Diamond Alt. 3-Single Point Air Quality No significant impact No significant impact No significant impact Water Quality No significant impact No significant impact No significant impact Public Utility Relocations Electrical Electrical Electrical power lines power lines power lines Recreational Resources No significant No significant No significant impact impact impact Visual Impacts and Aesthetics No significant No significant No significant impact impact impact Pedestrians and Bicycles No impact No impact No impact Environmental Justice No impact No impact No impact Noise No significant impact No significant impact No significant impact Threatened and Endangered Species In Agency Coordination In Agency Coordination In Agency Coordination Archaeological and Historical Resources No adverse effect No adverse effect No adverse effect Section 4(f) and 6(f) Resources No use No use No use Regulated Materials No significant impact No significant impact No significant impact Land Use Right-of-Way 20.3 acres 2.57 acres acres Future Land Use Compatible Compatible Compatible Floodway 0 acres 0 acres 0 acres Floodplain 100 year 0 acres 0 acres 0 acres 500 year 0 acres 0 acres 0 acres Economic Resources No significant impact No significant impact No significant impact Residential Relocations None None None Business Relocations 1 permanent, 1 partial 1 permanent, 1 partial 1 permanent, 1 partial Habitat, Fish, and Wildlife 1 Minor Minor Minor Wetlands and Other Waters of the U.S. 2 Wetlands acres 0 linear feet 1.24 acres 0 linear feet 1.24 acres 0 linear feet Waters of the US Notes: 1 Impacts for habitat are consistent with impacts for wetlands and other waters of the U.S. Impacted wetlands would be mitigated per Section 404 of the Clean Water Act. 2 3 Other waters of the U.S. identified within the Study Area for this Project include only stream channels with the presence of a definable bed and bank. Jurisdiction is to be determined by the U.S. Army Corps of Engineers. I-90/Timberline Avenue Interchange Modification Report Page 35
41 Safety While there are currently no Crash Modification Factors (CMF s) to directly compare the safety effects of different interchange configurations, there is an older tool, Interchange Safety Analysis Tool (ISAT), which facilitates comparison of safety in Interchanges. Therefore, ISAT was used to estimate safety performance. The results of these model runs are estimates based on general configuration geometrics and safety performance factors and should therefore be considered only as a planning-level measure of comparison between the interchange configurations. The ISAT model estimates the following total crashes over the period for the alternative interchange configurations: Standard Diamond 895 crashes Tight Diamond 848 crashes Single Point 845 crashes It appears, therefore, that the tight diamond and single point interchanges are expected to provide similar safety performance. The standard diamond configuration is expected to provide poorer safety performance than the other two configurations. The results of these model runs are estimates based on general configuration geometrics and safety performance factors and should therefore be considered only as a planning-level measure of comparison between the interchange configurations. Operational Performance The operations of the alternative interchange configurations were evaluated using appropriate level of service techniques. Performance was analyzed for forecast traffic conditions with the Eastside Corridor in place. Interstate 90 and the Eastside Corridor both operate at acceptable levels of service under future conditions with the alternative interchanges in place. Use of the existing interchange configuration, however, results in poor interchange performance. The singlepoint interchange (Alternative 3) provides preferable performance because of its single signalized intersection at the interchange and better spacing to the adjacent intersection. Traffic volumes and levels of service are summarized in Figures Supporting analysis printouts are provided in the Appendix 3 and 4. I-90/Timberline Avenue Interchange Modification Report Page 36
42 Evaluation Matrix Table 2 provides a comparison of the characteristics of each of the interchange alternatives. The table shows that the single-point interchange alternative provides the best technical solution to the transportation needs at this location, based on operational performance. Table 2 Evaluation Matrix Alternative Conformance with Plans Compliance with Standards Environmental Impacts No-Build No No Didn t satisfy project need Alt. 1 Yes Yes Extra ROW, Diamond relocation Alt. 2 Tight Diamond Alt. 3 Single Point Coordination Safety N/A Good Operational Performance Poor Good required Yes Yes Little impact Good Good Yes Yes Little impact Good Best The Eastside Corridor, including its terminal interchange at Interstate 90, has been the subject of agency coordination and public involvement as part of the environmental assessment process, including public meetings. Further details are available in the Supplement to the EA. The interchange alternatives have also been the subject of review and public hearing through the regular meetings of the MPO committees. I-90/Timberline Avenue Interchange Modification Report Page 37
43 FUNDING PLAN The Statewide Transportation Improvements Program (STIP) and the MPO Transportation Improvements Program (TIP) contain projects for the further construction of the Eastside Corridor. Construction of the interchange project is currently expected in 2017 and the STIP includes the funding allocations shown below. The inflated estimated cost for the overall 2017 project is $ Million. TABLE 3 ANTICIPATED FUNDING ALLOCATION BREAKDOWN State Funding Category Federal Funding Category Federal Funds State Funds Total Funds Interstate Funding [IM 0909(75)402] State Highway Urban Funding [NH 0100(104)420] National Highway Performance Program National Highway Performance Program $9.274 Million $1.416 Million $ Million $ Million $5.739 Million $ Million Total $ Million $7.155 Million $ Million Note: As funding is fluid, category breakdown may be different at time of project authorization. I-90/Timberline Avenue Interchange Modification Report Page 38
44 RECOMMENDATIONS The Environmental Assessment and the technical analysis contained in this Interstate access report have found that the best solution for transportation needs in the study area is to build a single point interchange, Alternative 3, connecting the new Eastside Corridor route to I-90. The proposed interchange is at the site of the existing I-90/Timberline Rd. interchange (Exit 402). The eight considerations and requirements for Interstate access are addressed below: 1) The need being addressed by the request cannot be adequately satisfied by existing interchanges to the Interstate, and/or local roads and streets in the corridor can neither provide the desired access, nor can they be reasonably improved (such as access control along surface streets, improving traffic control, modifying ramp terminals and intersections, adding turn bays or lengthening storage) to satisfactorily accommodate the design-year traffic demands. State/local planning efforts have identified the need for a new regional arterial highway to serve growth around the east and south sides of the Sioux Falls metropolitan area. That regional arterial highway, called the Eastside Corridor, is currently under phased construction and is planned to intersect with I-90 at the existing I-90/Timberline Rd. interchange (Exit 402). The existing interchange does not provide sufficient capacity to handle the traffic associated with the Eastside Corridor, but will serve adequately with changes to configuration and design. The Environmental Assessment and this report have identified a single-point interchange as providing the best solution to transportation needs in the study area. The proposed change of configuration at Exit 402 will not result in any additional access points on I-90 and only a very slight change in interchange spacing. 2) The need being addressed by the request cannot be adequately satisfied by reasonable transportation system management (such as ramp metering, mass transit, and HOV facilities), geometric design, and alternative improvements to the Interstate with the proposed change(s) in access. The preferred alternative involves changes to the geometric design of an existing interchange to meet the transportation needs in the study area. Future transportation demand will require additional lanes on the crossroad, but no additional lanes at the ramp merge/diverge areas, nor additional lanes on the Interstate mainline. Mass transit and HOV facilities are not planned for this portion of the MPO area within the study planning horizon. 3) An operational and safety analysis has concluded that the proposed change in access does not have a significant adverse impact on the safety and operation of the Interstate facility (which includes mainline lanes, existing, new, or modified I-90/Timberline Avenue Interchange Modification Report Page 39
45 ramps, ramp intersections with crossroad) or on the local street network based on both the current and the planned future traffic projections. The analysis shall, particularly in urbanized areas, include at least the first adjacent existing or proposed interchange on either side of the proposed change in access, shall be included in this analysis to the extent necessary to fully evaluate the safety and operational impacts that the proposed change in access and other transportation improvements may have on the local street network. Requests for a proposed change in access must include a description and assessment of the impacts and ability of the proposed changes to safely and efficiently collect, distribute and accommodate traffic on the Interstate facility, ramps, intersection of ramps with crossroad, and local street network. Each request must also include a conceptual plan of the type and location of the signs proposed to support each design alternative. The operational and safety analysis contained in this study shows that Interstate mainline and ramp facilities will continue to operate within operational and safety goals with any of the proposed alternatives. A safety analysis of recent crash records has been provided in the Existing Safety Analysis section on page 15. It shows that the primary crash types in the study area involve animal hits and single-vehicle crashes during inclement weather. The ramp terminal intersections, however, will fail with the No-Build alternative, but will continue to operate acceptably with the other alternatives. The conceptual signing plan for the Single Point interchange alternative is shown in Figure A6-3. Page 39. 4) The proposed access connects to a public road only and will provide for all traffic movements. Less than full interchanges may be considered on a case-by-case basis for applications requiring special access for managed lanes (e.g., transit, HOVs, HOT lanes) or park and ride lots. The proposed access will be designed to meet or exceed current standards. The proposed access is a reconfiguration of an existing interchange with a county road and includes all movements. The conceptual drawings have been prepared using current standards and design using current standards is anticipated. 5) The proposal considers and is consistent with local and regional land use and transportation plans. Prior to receiving final approval, all requests for new or revised access must be included in an adopted Metropolitan Transportation Plan, in the adopted Statewide or Metropolitan Transportation Improvement Program (STIP or TIP), and the Congestion Management Process within transportation management areas, as appropriate, and as specified. The proposal is the result of land use and transportation plans prepared within the MPO process. This Interstate Modification Justification Report supplements a previously approved EA which has resulted in construction being programmed in the 2014 STIP and TIP. I-90/Timberline Avenue Interchange Modification Report Page 40

46
47 6) In corridors where the potential exists for future multiple interchange additions, a comprehensive corridor or network study must accompany all requests for new or revised access with recommendations that address all of the proposed and desired access changes within the context of a longer-range system or network plan. SDDOT has prepared the Decennial Interstate Corridor Study (2010), which considered all proposed additions to the Interstate Highways System within the state of South Dakota. The proposed interchange reconfiguration was addressed in the Decennial study and no other interchanges were anticipated within the study area. The Sioux Falls MPO Long Range Transportation Plan has included a new interchange at Exit 404 as a potential project need beyond the 2035 planning horizon. No funding has been assigned or detailed analysis conducted for this potential project. 7) When a new or revised access point is due to a new, expanded, or substantial change in current or planned future development or land use, requests must demonstrate appropriate coordination has occurred between the development and any proposed transportation system improvements. The request must describe the commitments agreed upon to assure adequate collection and dispersion of the traffic resulting from the development with the adjoining local street network and Interstate access point. The proposed access change results not from any particular development, but from overall growth within the metropolitan area. It is part of a planned program of transportation improvements throughout the metropolitan area to address future transportation needs. 8) The proposal can be expected to be included as an alternative in the required environmental evaluation, review and processing. The proposal should include supporting information and current status of environmental processing. An original EA for the Eastside Corridor was signed on March 20, Currently, an EA for the northern segment (Madison Street north) is being prepared to address changes in alignment identified in the 2003 EA that occurred during preliminary design. I-90/Timberline Avenue Interchange Modification Report Page 42
48 APPENDIX Interstate Level of Service Crossroad Level of Service Interstate Level of Service Crossroad Level of Service 5 Crash Forecasts 6 Signing Plans 7 Interchange Area Air Photos I-90/Timberline Avenue Interchange Modification Report Page 43
49 Appendix Part Interstate Level of Service I-90/Timberline Road Interchange
50 HCS 2010: Basic Freeway Segments Release 6.50 Phone: Fax: Operational Planning Analysis Analyst: HDR Agency or Company: SDDOT Date Performed: 1/2014 Analysis Time Period: AM PEAK Freeway/Direction: From/To: I-229/TIMBERLINE Jurisdiction: MINNEHAHA CO. Analysis Year: Existing Description: I-90/SD 100 IMJR Flow Inputs and Adjustments Annual average daily traffic, AADT veh/day Peak-hour proportion of AADT, K 0.09 Peak-hour direction percent, D 60 % Volume, DDHV 1095 veh/h Peak Hour factor, PHF 0.90 Trucks and buses 11 % Recreational vehicles 0 % Terrain type: Rolling Grade - % Segment length - mi Trucks and buses PCE, ET 2.5 Recreational vehicles PCE, ER 2.0 Heavy Vehicle adjustment, fhv Driver population factor, fp 1.00 Flow rate, vp 709 pc/h/ln Speed Inputs and Adjustments Lane width 12.0 ft Right-side lateral clearance 6.0 ft Interchange density 1.20 ramps/mi Number of lanes, N 2 Free-flow speed: Base FFS or BFFS 75.4 mi/h Lane width adjustment, flw 0.0 mi/h Lateral clearance adjustment, flc 0.0 mi/h Interchange density adjustment, fid 3.8 mi/h Free-flow speed 71.6 mi/h LOS and Performance Measures Flow rate, vp 709 pc/h/ln Free-flow speed, FFS 71.6 mi/h Average passenger-car speed, S 70.0 mi/h Number of lanes, N 2
51 Density, D 10.1 pc/mi/ln Level of Service, LOS A Overall results are not computed when free-flow speed is less than 55 mph.
52 HCS 2010: Basic Freeway Segments Release 6.50 Phone: Fax: Operational Planning Analysis Analyst: HDR Agency or Company: SDDOT Date Performed: 1/2014 Analysis Time Period: PM PEAK Freeway/Direction: I-90 From/To: I-229/TIMBERLINE Jurisdiction: MINNEHAHA CO. Analysis Year: Existing Description: I-90/SD 100 IMJR Flow Inputs and Adjustments Annual average daily traffic, AADT veh/day Peak-hour proportion of AADT, K 0.10 Peak-hour direction percent, D 56 % Volume, DDHV 1135 veh/h Peak Hour factor, PHF 0.90 Trucks and buses 11 % Recreational vehicles 0 % Terrain type: Rolling Grade - % Segment length - mi Trucks and buses PCE, ET 2.5 Recreational vehicles PCE, ER 2.0 Heavy Vehicle adjustment, fhv Driver population factor, fp 1.00 Flow rate, vp 735 pc/h/ln Speed Inputs and Adjustments Lane width 12.0 ft Right-side lateral clearance 6.0 ft Interchange density 1.20 ramps/mi Number of lanes, N 2 Free-flow speed: Base FFS or BFFS 75.4 mi/h Lane width adjustment, flw 0.0 mi/h Lateral clearance adjustment, flc 0.0 mi/h Interchange density adjustment, fid 3.8 mi/h Free-flow speed 71.6 mi/h LOS and Performance Measures Flow rate, vp 735 pc/h/ln Free-flow speed, FFS 71.6 mi/h Average passenger-car speed, S 70.0 mi/h Number of lanes, N 2
53 Density, D 10.5 pc/mi/ln Level of Service, LOS A Overall results are not computed when free-flow speed is less than 55 mph.
54 HCS 2010: Basic Freeway Segments Release 6.50 Phone: Fax: Operational Planning Analysis Analyst: HDR Agency or Company: SDDOT Date Performed: 1/2014 Analysis Time Period: AM PEAK Freeway/Direction: I-90 From/To: TIMBERLINE/SD 11 Jurisdiction: MINNEHAHA CO. Analysis Year: Existing Description: I-90/SD 100 IMJR Flow Inputs and Adjustments Annual average daily traffic, AADT veh/day Peak-hour proportion of AADT, K 0.09 Peak-hour direction percent, D 60 % Volume, DDHV 948 veh/h Peak Hour factor, PHF 0.90 Trucks and buses 11 % Recreational vehicles 0 % Terrain type: Rolling Grade - % Segment length - mi Trucks and buses PCE, ET 2.5 Recreational vehicles PCE, ER 2.0 Heavy Vehicle adjustment, fhv Driver population factor, fp 1.00 Flow rate, vp 614 pc/h/ln Speed Inputs and Adjustments Lane width 12.0 ft Right-side lateral clearance 6.0 ft Interchange density 0.50 ramps/mi Number of lanes, N 2 Free-flow speed: Base FFS or BFFS 75.4 mi/h Lane width adjustment, flw 0.0 mi/h Lateral clearance adjustment, flc 0.0 mi/h Interchange density adjustment, fid 1.8 mi/h Free-flow speed 73.6 mi/h LOS and Performance Measures Flow rate, vp 614 pc/h/ln Free-flow speed, FFS 73.6 mi/h Average passenger-car speed, S 75.0 mi/h Number of lanes, N 2
55 Density, D 8.2 pc/mi/ln Level of Service, LOS A Overall results are not computed when free-flow speed is less than 55 mph.
56 HCS 2010: Basic Freeway Segments Release 6.50 Phone: Fax: Operational Planning Analysis Analyst: HDR Agency or Company: SDDOT Date Performed: 1/2014 Analysis Time Period: PM PEAK Freeway/Direction: I-90 From/To: TIMBERLINE/SD 11 Jurisdiction: MINNEHAHA CO. Analysis Year: Existing Description: I-90/SD 100 IMJR Flow Inputs and Adjustments Annual average daily traffic, AADT veh/day Peak-hour proportion of AADT, K 0.10 Peak-hour direction percent, D 56 % Volume, DDHV 983 veh/h Peak Hour factor, PHF 0.90 Trucks and buses 11 % Recreational vehicles 0 % Terrain type: Rolling Grade - % Segment length - mi Trucks and buses PCE, ET 2.5 Recreational vehicles PCE, ER 2.0 Heavy Vehicle adjustment, fhv Driver population factor, fp 1.00 Flow rate, vp 636 pc/h/ln Speed Inputs and Adjustments Lane width 12.0 ft Right-side lateral clearance 6.0 ft Interchange density 0.50 ramps/mi Number of lanes, N 2 Free-flow speed: Base FFS or BFFS 75.4 mi/h Lane width adjustment, flw 0.0 mi/h Lateral clearance adjustment, flc 0.0 mi/h Interchange density adjustment, fid 1.8 mi/h Free-flow speed 73.6 mi/h LOS and Performance Measures Flow rate, vp 636 pc/h/ln Free-flow speed, FFS 73.6 mi/h Average passenger-car speed, S 75.0 mi/h Number of lanes, N 2
57 Density, D 8.5 pc/mi/ln Level of Service, LOS A Overall results are not computed when free-flow speed is less than 55 mph.
58 HCS 2010: Freeway Merge and Diverge Segments Release 6.50 Phone: Fax: Diverge Analysis Analyst: HDR Agency/Co.: SDDOT Date performed: 1/2014 Analysis time period: AM PEAK Freeway/Dir of Travel: I-90/EB Junction: I-229 Jurisdiction: MINNEHAHA CO. Analysis Year: Existing Description: I-90/SD 100 IMJR Freeway Data Type of analysis Diverge Number of lanes in freeway 2 Free-flow speed on freeway 66.0 mph Volume on freeway 740 vph Off Ramp Data Side of freeway Right Number of lanes in ramp 1 Free-Flow speed on ramp 50.0 mph Volume on ramp 280 vph Length of first accel/decel lane 610 ft Length of second accel/decel lane ft Adjacent Ramp Data (if one exists) Does adjacent ramp exist? Yes Volume on adjacent ramp 270 vph Position of adjacent ramp Downstream Type of adjacent ramp On Distance to adjacent ramp 2930 ft Conversion to pc/h Under Base Conditions Junction Components Freeway Ramp Adjacent Ramp Volume, V (vph) vph Peak-hour factor, PHF Peak 15-min volume, v v Trucks and buses % Recreational vehicles % Terrain type: Rolling Rolling Rolling Grade 0.00 % 0.00 % 0.00 % Length 0.00 mi 0.00 mi 0.00 mi Trucks and buses PCE, ET Recreational vehicle PCE, ER
59 Heavy vehicle adjustment, fhv Driver population factor, fp Flow rate, vp pcph Estimation of V12 Diverge Areas L = (Equation or 13-13) EQ P = Using Equation 0 FD v = v + (v - v ) P = 958 pc/h 12 R F R FD Capacity Checks Actual Maximum LOS F? v = v No Fi F v = v - v No FO F R v No R v or v 0 pc/h (Equation or 13-17) 3 av34 Is v or v > 2700 pc/h? No 3 av34 Is v or v > 1.5 v /2 No 3 av34 12 If yes, v = 958 (Equation 13-15, 13-16, 13-18, or 13-19) 12A Flow Entering Diverge Influence Area Actual Max Desirable Violation? v No 12 Level of Service Determination (if not F) Density, D = v L = 7.0 pc/mi/ln R 12 D Level of service for ramp-freeway junction areas of influence A Speed Estimation Intermediate speed variable, D = S Space mean speed in ramp influence area, S = 59.7 mph R Space mean speed in outer lanes, S = N/A mph 0 Space mean speed for all vehicles, S = 59.7 mph _
60 HCS 2010: Freeway Merge and Diverge Segments Release 6.50 Phone: Fax: Diverge Analysis Analyst: HDR Agency/Co.: SDDOT Date performed: 1/2014 Analysis time period: PM PEAK Freeway/Dir of Travel: I-90/EB Junction: I-229 Jurisdiction: MINNEHAHA CO. Analysis Year: Existing Description: I-90/SD 100 IMJR Freeway Data Type of analysis Diverge Number of lanes in freeway 2 Free-flow speed on freeway 66.0 mph Volume on freeway 980 vph Off Ramp Data Side of freeway Right Number of lanes in ramp 1 Free-Flow speed on ramp 50.0 mph Volume on ramp 260 vph Length of first accel/decel lane 610 ft Length of second accel/decel lane ft Adjacent Ramp Data (if one exists) Does adjacent ramp exist? Yes Volume on adjacent ramp 300 vph Position of adjacent ramp Downstream Type of adjacent ramp On Distance to adjacent ramp 2930 ft Conversion to pc/h Under Base Conditions Junction Components Freeway Ramp Adjacent Ramp Volume, V (vph) vph Peak-hour factor, PHF Peak 15-min volume, v v Trucks and buses % Recreational vehicles % Terrain type: Rolling Rolling Rolling Grade 0.00 % 0.00 % 0.00 % Length 0.00 mi 0.00 mi 0.00 mi Trucks and buses PCE, ET Recreational vehicle PCE, ER
61 Heavy vehicle adjustment, fhv Driver population factor, fp Flow rate, vp pcph Estimation of V12 Diverge Areas L = (Equation or 13-13) EQ P = Using Equation 0 FD v = v + (v - v ) P = 1269 pc/h 12 R F R FD Capacity Checks Actual Maximum LOS F? v = v No Fi F v = v - v No FO F R v No R v or v 0 pc/h (Equation or 13-17) 3 av34 Is v or v > 2700 pc/h? No 3 av34 Is v or v > 1.5 v /2 No 3 av34 12 If yes, v = 1269 (Equation 13-15, 13-16, 13-18, or 13-19) 12A Flow Entering Diverge Influence Area Actual Max Desirable Violation? v No 12 Level of Service Determination (if not F) Density, D = v L = 9.7 pc/mi/ln R 12 D Level of service for ramp-freeway junction areas of influence A Speed Estimation Intermediate speed variable, D = S Space mean speed in ramp influence area, S = 59.7 mph R Space mean speed in outer lanes, S = N/A mph 0 Space mean speed for all vehicles, S = 59.7 mph _
62 HCS 2010: Freeway Merge and Diverge Segments Release 6.50 Phone: Fax: Merge Analysis Analyst: HDR Agency/Co.: SDDOT Date performed: 1/2014 Analysis time period: AM PEAK Freeway/Dir of Travel: I-90/EB Junction: I-229 Jurisdiction: MINNEHAHA CO. Analysis Year: Existing Description: I-90/SD 100 IMJR Freeway Data Type of analysis Merge Number of lanes in freeway 2 Free-flow speed on freeway 66.0 mph Volume on freeway 460 vph On Ramp Data Side of freeway Right Number of lanes in ramp 1 Free-flow speed on ramp 55.0 mph Volume on ramp 270 vph Length of first accel/decel lane 880 ft Length of second accel/decel lane ft Adjacent Ramp Data (if one exists) Does adjacent ramp exist? Yes Volume on adjacent Ramp 280 vph Position of adjacent Ramp Upstream Type of adjacent Ramp Off Distance to adjacent Ramp 2930 ft Conversion to pc/h Under Base Conditions Junction Components Freeway Ramp Adjacent Ramp Volume, V (vph) vph Peak-hour factor, PHF Peak 15-min volume, v v Trucks and buses % Recreational vehicles % Terrain type: Rolling Rolling Rolling Grade % % % Length mi mi mi Trucks and buses PCE, ET Recreational vehicle PCE, ER
63 Heavy vehicle adjustment, fhv Driver population factor, fp Flow rate, vp pcph Estimation of V12 Merge Areas L = (Equation 13-6 or 13-7) EQ P = Using Equation 0 FM v = v (P ) = 595 pc/h 12 F FM Capacity Checks Actual Maximum LOS F? v No FO v or v 0 pc/h (Equation or 13-17) 3 av34 Is v or v > 2700 pc/h? No 3 av34 Is v or v > 1.5 v /2 No 3 av34 12 If yes, v = 595 (Equation 13-15, 13-16, 13-18, or 13-19) 12A Flow Entering Merge Influence Area Actual Max Desirable Violation? v No R12 Level of Service Determination (if not F) Density, D = v v L = 7.0 pc/mi/ln R R 12 A Level of service for ramp-freeway junction areas of influence A Speed Estimation Intermediate speed variable, M = S Space mean speed in ramp influence area, S = 60.4 mph R Space mean speed in outer lanes, S = N/A mph 0 Space mean speed for all vehicles, S = 60.4 mph _
64 HCS 2010: Freeway Merge and Diverge Segments Release 6.50 Phone: Fax: Merge Analysis Analyst: HDR Agency/Co.: SDDOT Date performed: 1/2014 Analysis time period: PM PEAK Freeway/Dir of Travel: I-90/EB Junction: I-229 Jurisdiction: MINNEHAHA CO. Analysis Year: Existing Description: I-90/SD 100 IMJR Freeway Data Type of analysis Merge Number of lanes in freeway 2 Free-flow speed on freeway 66.0 mph Volume on freeway 720 vph On Ramp Data Side of freeway Right Number of lanes in ramp 1 Free-flow speed on ramp 55.0 mph Volume on ramp 300 vph Length of first accel/decel lane 880 ft Length of second accel/decel lane ft Adjacent Ramp Data (if one exists) Does adjacent ramp exist? Yes Volume on adjacent Ramp 260 vph Position of adjacent Ramp Upstream Type of adjacent Ramp Off Distance to adjacent Ramp 2930 ft Conversion to pc/h Under Base Conditions Junction Components Freeway Ramp Adjacent Ramp Volume, V (vph) vph Peak-hour factor, PHF Peak 15-min volume, v v Trucks and buses % Recreational vehicles % Terrain type: Rolling Rolling Rolling Grade % % % Length mi mi mi Trucks and buses PCE, ET Recreational vehicle PCE, ER
65 Heavy vehicle adjustment, fhv Driver population factor, fp Flow rate, vp pcph Estimation of V12 Merge Areas L = (Equation 13-6 or 13-7) EQ P = Using Equation 0 FM v = v (P ) = 932 pc/h 12 F FM Capacity Checks Actual Maximum LOS F? v No FO v or v 0 pc/h (Equation or 13-17) 3 av34 Is v or v > 2700 pc/h? No 3 av34 Is v or v > 1.5 v /2 No 3 av34 12 If yes, v = 932 (Equation 13-15, 13-16, 13-18, or 13-19) 12A Flow Entering Merge Influence Area Actual Max Desirable Violation? v No R12 Level of Service Determination (if not F) Density, D = v v L = 9.9 pc/mi/ln R R 12 A Level of service for ramp-freeway junction areas of influence A Speed Estimation Intermediate speed variable, M = S Space mean speed in ramp influence area, S = 60.3 mph R Space mean speed in outer lanes, S = N/A mph 0 Space mean speed for all vehicles, S = 60.3 mph _
66 HCS 2010: Freeway Merge and Diverge Segments Release 6.50 Phone: Fax: Diverge Analysis Analyst: HDR Agency/Co.: SDDOT Date performed: 1/2014 Analysis time period: AM PEAK Freeway/Dir of Travel: I-90/EB Junction: TIMBERLINE RD. Jurisdiction: MINNEHAHA CO. Analysis Year: Existing Description: I-90/SD 100 IMJR Freeway Data Type of analysis Diverge Number of lanes in freeway 2 Free-flow speed on freeway 70.0 mph Volume on freeway 730 vph Off Ramp Data Side of freeway Right Number of lanes in ramp 1 Free-Flow speed on ramp 45.0 mph Volume on ramp 80 vph Length of first accel/decel lane 340 ft Length of second accel/decel lane ft Adjacent Ramp Data (if one exists) Does adjacent ramp exist? Yes Volume on adjacent ramp 20 vph Position of adjacent ramp Downstream Type of adjacent ramp On Distance to adjacent ramp 1890 ft Conversion to pc/h Under Base Conditions Junction Components Freeway Ramp Adjacent Ramp Volume, V (vph) vph Peak-hour factor, PHF Peak 15-min volume, v v Trucks and buses % Recreational vehicles % Terrain type: Rolling Rolling Rolling Grade 0.00 % 0.00 % 0.00 % Length 0.00 mi 0.00 mi 0.00 mi Trucks and buses PCE, ET Recreational vehicle PCE, ER
67 Heavy vehicle adjustment, fhv Driver population factor, fp Flow rate, vp pcph Estimation of V12 Diverge Areas L = (Equation or 13-13) EQ P = Using Equation 0 FD v = v + (v - v ) P = 945 pc/h 12 R F R FD Capacity Checks Actual Maximum LOS F? v = v No Fi F v = v - v No FO F R v No R v or v 0 pc/h (Equation or 13-17) 3 av34 Is v or v > 2700 pc/h? No 3 av34 Is v or v > 1.5 v /2 No 3 av34 12 If yes, v = 945 (Equation 13-15, 13-16, 13-18, or 13-19) 12A Flow Entering Diverge Influence Area Actual Max Desirable Violation? v No 12 Level of Service Determination (if not F) Density, D = v L = 9.3 pc/mi/ln R 12 D Level of service for ramp-freeway junction areas of influence A Speed Estimation Intermediate speed variable, D = S Space mean speed in ramp influence area, S = 61.4 mph R Space mean speed in outer lanes, S = N/A mph 0 Space mean speed for all vehicles, S = 61.4 mph _
68 HCS 2010: Freeway Merge and Diverge Segments Release 6.50 Phone: Fax: Diverge Analysis Analyst: HDR Agency/Co.: SDDOT Date performed: 1/2014 Analysis time period: PM PEAK Freeway/Dir of Travel: I-90/EB Junction: TIMBERLINE RD. Jurisdiction: MINNEHAHA CO. Analysis Year: Existing Description: I-90/SD 100 IMJR Freeway Data Type of analysis Diverge Number of lanes in freeway 2 Free-flow speed on freeway 70.0 mph Volume on freeway 1020 vph Off Ramp Data Side of freeway Right Number of lanes in ramp 1 Free-Flow speed on ramp 45.0 mph Volume on ramp 100 vph Length of first accel/decel lane 340 ft Length of second accel/decel lane ft Adjacent Ramp Data (if one exists) Does adjacent ramp exist? Yes Volume on adjacent ramp 90 vph Position of adjacent ramp Downstream Type of adjacent ramp On Distance to adjacent ramp 1890 ft Conversion to pc/h Under Base Conditions Junction Components Freeway Ramp Adjacent Ramp Volume, V (vph) vph Peak-hour factor, PHF Peak 15-min volume, v v Trucks and buses % Recreational vehicles % Terrain type: Rolling Rolling Rolling Grade 0.00 % 0.00 % 0.00 % Length 0.00 mi 0.00 mi 0.00 mi Trucks and buses PCE, ET Recreational vehicle PCE, ER
69 Heavy vehicle adjustment, fhv Driver population factor, fp Flow rate, vp pcph Estimation of V12 Diverge Areas L = (Equation or 13-13) EQ P = Using Equation 0 FD v = v + (v - v ) P = 1320 pc/h 12 R F R FD Capacity Checks Actual Maximum LOS F? v = v No Fi F v = v - v No FO F R v No R v or v 0 pc/h (Equation or 13-17) 3 av34 Is v or v > 2700 pc/h? No 3 av34 Is v or v > 1.5 v /2 No 3 av34 12 If yes, v = 1320 (Equation 13-15, 13-16, 13-18, or 13-19) 12A Flow Entering Diverge Influence Area Actual Max Desirable Violation? v No 12 Level of Service Determination (if not F) Density, D = v L = 12.5 pc/mi/ln R 12 D Level of service for ramp-freeway junction areas of influence B Speed Estimation Intermediate speed variable, D = S Space mean speed in ramp influence area, S = 61.4 mph R Space mean speed in outer lanes, S = N/A mph 0 Space mean speed for all vehicles, S = 61.4 mph _
70 HCS 2010: Freeway Merge and Diverge Segments Release 6.50 Phone: Fax: Merge Analysis Analyst: HDR Agency/Co.: SDDOT Date performed: 1/2014 Analysis time period: AM PEAK Freeway/Dir of Travel: I-90/EB Junction: TIMBERLINE RD. Jurisdiction: MINNEHAHA CO. Analysis Year: Existing Description: I-90/SD 100 IMJR Freeway Data Type of analysis Merge Number of lanes in freeway 2 Free-flow speed on freeway 70.0 mph Volume on freeway 650 vph On Ramp Data Side of freeway Right Number of lanes in ramp 1 Free-flow speed on ramp 45.0 mph Volume on ramp 20 vph Length of first accel/decel lane 760 ft Length of second accel/decel lane ft Adjacent Ramp Data (if one exists) Does adjacent ramp exist? Yes Volume on adjacent Ramp 80 vph Position of adjacent Ramp Upstream Type of adjacent Ramp Off Distance to adjacent Ramp 1890 ft Conversion to pc/h Under Base Conditions Junction Components Freeway Ramp Adjacent Ramp Volume, V (vph) vph Peak-hour factor, PHF Peak 15-min volume, v v Trucks and buses % Recreational vehicles % Terrain type: Rolling Rolling Rolling Grade % % % Length mi mi mi Trucks and buses PCE, ET Recreational vehicle PCE, ER
71 Heavy vehicle adjustment, fhv Driver population factor, fp Flow rate, vp pcph Estimation of V12 Merge Areas L = (Equation 13-6 or 13-7) EQ P = Using Equation 0 FM v = v (P ) = 841 pc/h 12 F FM Capacity Checks Actual Maximum LOS F? v No FO v or v 0 pc/h (Equation or 13-17) 3 av34 Is v or v > 2700 pc/h? No 3 av34 Is v or v > 1.5 v /2 No 3 av34 12 If yes, v = 841 (Equation 13-15, 13-16, 13-18, or 13-19) 12A Flow Entering Merge Influence Area Actual Max Desirable Violation? v No R12 Level of Service Determination (if not F) Density, D = v v L = 7.5 pc/mi/ln R R 12 A Level of service for ramp-freeway junction areas of influence A Speed Estimation Intermediate speed variable, M = S Space mean speed in ramp influence area, S = 62.7 mph R Space mean speed in outer lanes, S = N/A mph 0 Space mean speed for all vehicles, S = 62.7 mph _
72 HCS 2010: Freeway Merge and Diverge Segments Release 6.50 Phone: Fax: Merge Analysis Analyst: HDR Agency/Co.: SDDOT Date performed: 1/2014 Analysis time period: PM PEAK Freeway/Dir of Travel: I-90/EB Junction: TIMBERLINE RD. Jurisdiction: MINNEHAHA CO. Analysis Year: Existing Description: I-90/SD 100 IMJR Freeway Data Type of analysis Merge Number of lanes in freeway 2 Free-flow speed on freeway 70.0 mph Volume on freeway 920 vph On Ramp Data Side of freeway Right Number of lanes in ramp 1 Free-flow speed on ramp 45.0 mph Volume on ramp 90 vph Length of first accel/decel lane 760 ft Length of second accel/decel lane ft Adjacent Ramp Data (if one exists) Does adjacent ramp exist? Yes Volume on adjacent Ramp 100 vph Position of adjacent Ramp Upstream Type of adjacent Ramp Off Distance to adjacent Ramp 1890 ft Conversion to pc/h Under Base Conditions Junction Components Freeway Ramp Adjacent Ramp Volume, V (vph) vph Peak-hour factor, PHF Peak 15-min volume, v v Trucks and buses % Recreational vehicles % Terrain type: Rolling Rolling Rolling Grade % % % Length mi mi mi Trucks and buses PCE, ET Recreational vehicle PCE, ER
73 Heavy vehicle adjustment, fhv Driver population factor, fp Flow rate, vp pcph Estimation of V12 Merge Areas L = (Equation 13-6 or 13-7) EQ P = Using Equation 0 FM v = v (P ) = 1191 pc/h 12 F FM Capacity Checks Actual Maximum LOS F? v No FO v or v 0 pc/h (Equation or 13-17) 3 av34 Is v or v > 2700 pc/h? No 3 av34 Is v or v > 1.5 v /2 No 3 av34 12 If yes, v = 1191 (Equation 13-15, 13-16, 13-18, or 13-19) 12A Flow Entering Merge Influence Area Actual Max Desirable Violation? v No R12 Level of Service Determination (if not F) Density, D = v v L = 10.8 pc/mi/ln R R 12 A Level of service for ramp-freeway junction areas of influence B Speed Estimation Intermediate speed variable, M = S Space mean speed in ramp influence area, S = 62.5 mph R Space mean speed in outer lanes, S = N/A mph 0 Space mean speed for all vehicles, S = 62.5 mph _
74 HCS 2010: Freeway Merge and Diverge Segments Release 6.50 Phone: Fax: Diverge Analysis Analyst: HDR Agency/Co.: SDDOT Date performed: 1/2014 Analysis time period: AM PEAK Freeway/Dir of Travel: I-90/EB Junction: SD 11 Jurisdiction: MINNEHAHA CO. Analysis Year: Existing Description: I-90/SD 100 IMJR Freeway Data Type of analysis Diverge Number of lanes in freeway 2 Free-flow speed on freeway 70.0 mph Volume on freeway 670 vph Off Ramp Data Side of freeway Right Number of lanes in ramp 1 Free-Flow speed on ramp 45.0 mph Volume on ramp 190 vph Length of first accel/decel lane 620 ft Length of second accel/decel lane ft Adjacent Ramp Data (if one exists) Does adjacent ramp exist? Yes Volume on adjacent ramp 80 vph Position of adjacent ramp Downstream Type of adjacent ramp On Distance to adjacent ramp 1960 ft Conversion to pc/h Under Base Conditions Junction Components Freeway Ramp Adjacent Ramp Volume, V (vph) vph Peak-hour factor, PHF Peak 15-min volume, v v Trucks and buses % Recreational vehicles % Terrain type: Rolling Rolling Rolling Grade 0.00 % 0.00 % 0.00 % Length 0.00 mi 0.00 mi 0.00 mi Trucks and buses PCE, ET Recreational vehicle PCE, ER
75 Heavy vehicle adjustment, fhv Driver population factor, fp Flow rate, vp pcph Estimation of V12 Diverge Areas L = (Equation or 13-13) EQ P = Using Equation 0 FD v = v + (v - v ) P = 867 pc/h 12 R F R FD Capacity Checks Actual Maximum LOS F? v = v No Fi F v = v - v No FO F R v No R v or v 0 pc/h (Equation or 13-17) 3 av34 Is v or v > 2700 pc/h? No 3 av34 Is v or v > 1.5 v /2 No 3 av34 12 If yes, v = 867 (Equation 13-15, 13-16, 13-18, or 13-19) 12A Flow Entering Diverge Influence Area Actual Max Desirable Violation? v No 12 Level of Service Determination (if not F) Density, D = v L = 6.1 pc/mi/ln R 12 D Level of service for ramp-freeway junction areas of influence A Speed Estimation Intermediate speed variable, D = S Space mean speed in ramp influence area, S = 61.1 mph R Space mean speed in outer lanes, S = N/A mph 0 Space mean speed for all vehicles, S = 61.1 mph _
76 HCS 2010: Freeway Merge and Diverge Segments Release 6.50 Phone: Fax: Diverge Analysis Analyst: HDR Agency/Co.: SDDOT Date performed: 1/2014 Analysis time period: PM PEAK Freeway/Dir of Travel: I-90/EB Junction: SD 11 Jurisdiction: MINNEHAHA CO. Analysis Year: Existing Description: I-90/SD 100 IMJR Freeway Data Type of analysis Diverge Number of lanes in freeway 2 Free-flow speed on freeway 70.0 mph Volume on freeway 1010 vph Off Ramp Data Side of freeway Right Number of lanes in ramp 1 Free-Flow speed on ramp 45.0 mph Volume on ramp 440 vph Length of first accel/decel lane 620 ft Length of second accel/decel lane ft Adjacent Ramp Data (if one exists) Does adjacent ramp exist? Yes Volume on adjacent ramp 130 vph Position of adjacent ramp Downstream Type of adjacent ramp On Distance to adjacent ramp 1960 ft Conversion to pc/h Under Base Conditions Junction Components Freeway Ramp Adjacent Ramp Volume, V (vph) vph Peak-hour factor, PHF Peak 15-min volume, v v Trucks and buses % Recreational vehicles % Terrain type: Rolling Rolling Rolling Grade 0.00 % 0.00 % 0.00 % Length 0.00 mi 0.00 mi 0.00 mi Trucks and buses PCE, ET Recreational vehicle PCE, ER
77 Heavy vehicle adjustment, fhv Driver population factor, fp Flow rate, vp pcph Estimation of V12 Diverge Areas L = (Equation or 13-13) EQ P = Using Equation 0 FD v = v + (v - v ) P = 1307 pc/h 12 R F R FD Capacity Checks Actual Maximum LOS F? v = v No Fi F v = v - v No FO F R v No R v or v 0 pc/h (Equation or 13-17) 3 av34 Is v or v > 2700 pc/h? No 3 av34 Is v or v > 1.5 v /2 No 3 av34 12 If yes, v = 1307 (Equation 13-15, 13-16, 13-18, or 13-19) 12A Flow Entering Diverge Influence Area Actual Max Desirable Violation? v No 12 Level of Service Determination (if not F) Density, D = v L = 9.9 pc/mi/ln R 12 D Level of service for ramp-freeway junction areas of influence A Speed Estimation Intermediate speed variable, D = S Space mean speed in ramp influence area, S = 60.3 mph R Space mean speed in outer lanes, S = N/A mph 0 Space mean speed for all vehicles, S = 60.3 mph _
78 HCS 2010: Freeway Merge and Diverge Segments Release 6.50 Phone: Fax: Merge Analysis Analyst: HDR Agency/Co.: SDDOT Date performed: 1/2014 Analysis time period: AM PEAK Freeway/Dir of Travel: I-90/EB Junction: SD 11 Jurisdiction: MINNEHAHA CO. Analysis Year: Existing Description: I-90/SD 100 IMJR Freeway Data Type of analysis Merge Number of lanes in freeway 2 Free-flow speed on freeway 70.0 mph Volume on freeway 480 vph On Ramp Data Side of freeway Right Number of lanes in ramp 1 Free-flow speed on ramp 45.0 mph Volume on ramp 80 vph Length of first accel/decel lane 670 ft Length of second accel/decel lane ft Adjacent Ramp Data (if one exists) Does adjacent ramp exist? Yes Volume on adjacent Ramp 190 vph Position of adjacent Ramp Upstream Type of adjacent Ramp Off Distance to adjacent Ramp 1960 ft Conversion to pc/h Under Base Conditions Junction Components Freeway Ramp Adjacent Ramp Volume, V (vph) vph Peak-hour factor, PHF Peak 15-min volume, v v Trucks and buses % Recreational vehicles % Terrain type: Rolling Rolling Rolling Grade % % % Length mi mi mi Trucks and buses PCE, ET Recreational vehicle PCE, ER
79 Heavy vehicle adjustment, fhv Driver population factor, fp Flow rate, vp pcph Estimation of V12 Merge Areas L = (Equation 13-6 or 13-7) EQ P = Using Equation 0 FM v = v (P ) = 621 pc/h 12 F FM Capacity Checks Actual Maximum LOS F? v No FO v or v 0 pc/h (Equation or 13-17) 3 av34 Is v or v > 2700 pc/h? No 3 av34 Is v or v > 1.5 v /2 No 3 av34 12 If yes, v = 621 (Equation 13-15, 13-16, 13-18, or 13-19) 12A Flow Entering Merge Influence Area Actual Max Desirable Violation? v No R12 Level of Service Determination (if not F) Density, D = v v L = 6.8 pc/mi/ln R R 12 A Level of service for ramp-freeway junction areas of influence A Speed Estimation Intermediate speed variable, M = S Space mean speed in ramp influence area, S = 62.5 mph R Space mean speed in outer lanes, S = N/A mph 0 Space mean speed for all vehicles, S = 62.5 mph _
80 HCS 2010: Freeway Merge and Diverge Segments Release 6.50 Phone: Fax: Merge Analysis Analyst: HDR Agency/Co.: SDDOT Date performed: 1/2014 Analysis time period: PM PEAK Freeway/Dir of Travel: I-90/EB Junction: SD 11 Jurisdiction: MINNEHAHA CO. Analysis Year: Existing Description: I-90/SD 100 IMJR Freeway Data Type of analysis Merge Number of lanes in freeway 2 Free-flow speed on freeway 70.0 mph Volume on freeway 570 vph On Ramp Data Side of freeway Right Number of lanes in ramp 1 Free-flow speed on ramp 45.0 mph Volume on ramp 130 vph Length of first accel/decel lane 670 ft Length of second accel/decel lane ft Adjacent Ramp Data (if one exists) Does adjacent ramp exist? Yes Volume on adjacent Ramp 440 vph Position of adjacent Ramp Upstream Type of adjacent Ramp Off Distance to adjacent Ramp 1960 ft Conversion to pc/h Under Base Conditions Junction Components Freeway Ramp Adjacent Ramp Volume, V (vph) vph Peak-hour factor, PHF Peak 15-min volume, v v Trucks and buses % Recreational vehicles % Terrain type: Rolling Rolling Rolling Grade % % % Length mi mi mi Trucks and buses PCE, ET Recreational vehicle PCE, ER
81 Heavy vehicle adjustment, fhv Driver population factor, fp Flow rate, vp pcph Estimation of V12 Merge Areas L = (Equation 13-6 or 13-7) EQ P = Using Equation 0 FM v = v (P ) = 738 pc/h 12 F FM Capacity Checks Actual Maximum LOS F? v No FO v or v 0 pc/h (Equation or 13-17) 3 av34 Is v or v > 2700 pc/h? No 3 av34 Is v or v > 1.5 v /2 No 3 av34 12 If yes, v = 738 (Equation 13-15, 13-16, 13-18, or 13-19) 12A Flow Entering Merge Influence Area Actual Max Desirable Violation? v No R12 Level of Service Determination (if not F) Density, D = v v L = 8.2 pc/mi/ln R R 12 A Level of service for ramp-freeway junction areas of influence A Speed Estimation Intermediate speed variable, M = S Space mean speed in ramp influence area, S = 62.4 mph R Space mean speed in outer lanes, S = N/A mph 0 Space mean speed for all vehicles, S = 62.4 mph _
82 HCS 2010: Freeway Merge and Diverge Segments Release 6.50 Phone: Fax: Diverge Analysis Analyst: HDR Agency/Co.: SDDOT Date performed: 1/2014 Analysis time period: AM PEAK Freeway/Dir of Travel: I-90/WB Junction: SD 11 Jurisdiction: MINNEHAHA CO. Analysis Year: Existing Description: I-90/SD 100 IMJR Freeway Data Type of analysis Diverge Number of lanes in freeway 2 Free-flow speed on freeway 70.0 mph Volume on freeway 820 vph Off Ramp Data Side of freeway Right Number of lanes in ramp 1 Free-Flow speed on ramp 45.0 mph Volume on ramp 60 vph Length of first accel/decel lane 510 ft Length of second accel/decel lane ft Adjacent Ramp Data (if one exists) Does adjacent ramp exist? Yes Volume on adjacent ramp 300 vph Position of adjacent ramp Downstream Type of adjacent ramp On Distance to adjacent ramp 1980 ft Conversion to pc/h Under Base Conditions Junction Components Freeway Ramp Adjacent Ramp Volume, V (vph) vph Peak-hour factor, PHF Peak 15-min volume, v v Trucks and buses % Recreational vehicles % Terrain type: Rolling Rolling Rolling Grade 0.00 % 0.00 % 0.00 % Length 0.00 mi 0.00 mi 0.00 mi Trucks and buses PCE, ET Recreational vehicle PCE, ER
83 Heavy vehicle adjustment, fhv Driver population factor, fp Flow rate, vp pcph Estimation of V12 Diverge Areas L = (Equation or 13-13) EQ P = Using Equation 0 FD v = v + (v - v ) P = 1061 pc/h 12 R F R FD Capacity Checks Actual Maximum LOS F? v = v No Fi F v = v - v No FO F R v No R v or v 0 pc/h (Equation or 13-17) 3 av34 Is v or v > 2700 pc/h? No 3 av34 Is v or v > 1.5 v /2 No 3 av34 12 If yes, v = 1061 (Equation 13-15, 13-16, 13-18, or 13-19) 12A Flow Entering Diverge Influence Area Actual Max Desirable Violation? v No 12 Level of Service Determination (if not F) Density, D = v L = 8.8 pc/mi/ln R 12 D Level of service for ramp-freeway junction areas of influence A Speed Estimation Intermediate speed variable, D = S Space mean speed in ramp influence area, S = 61.5 mph R Space mean speed in outer lanes, S = N/A mph 0 Space mean speed for all vehicles, S = 61.5 mph _
84 HCS 2010: Freeway Merge and Diverge Segments Release 6.50 Phone: Fax: Diverge Analysis Analyst: HDR Agency/Co.: SDDOT Date performed: 1/2014 Analysis time period: PM PEAK Freeway/Dir of Travel: I-90/WB Junction: SD 11 Jurisdiction: MINNEHAHA CO. Analysis Year: Existing Description: I-90/SD 100 IMJR Freeway Data Type of analysis Diverge Number of lanes in freeway 2 Free-flow speed on freeway 70.0 mph Volume on freeway 510 vph Off Ramp Data Side of freeway Right Number of lanes in ramp 1 Free-Flow speed on ramp 45.0 mph Volume on ramp 90 vph Length of first accel/decel lane 510 ft Length of second accel/decel lane ft Adjacent Ramp Data (if one exists) Does adjacent ramp exist? Yes Volume on adjacent ramp 290 vph Position of adjacent ramp Downstream Type of adjacent ramp On Distance to adjacent ramp 1980 ft Conversion to pc/h Under Base Conditions Junction Components Freeway Ramp Adjacent Ramp Volume, V (vph) vph Peak-hour factor, PHF Peak 15-min volume, v v Trucks and buses % Recreational vehicles % Terrain type: Rolling Rolling Rolling Grade 0.00 % 0.00 % 0.00 % Length 0.00 mi 0.00 mi 0.00 mi Trucks and buses PCE, ET Recreational vehicle PCE, ER
85 Heavy vehicle adjustment, fhv Driver population factor, fp Flow rate, vp pcph Estimation of V12 Diverge Areas L = (Equation or 13-13) EQ P = Using Equation 0 FD v = v + (v - v ) P = 660 pc/h 12 R F R FD Capacity Checks Actual Maximum LOS F? v = v No Fi F v = v - v No FO F R v No R v or v 0 pc/h (Equation or 13-17) 3 av34 Is v or v > 2700 pc/h? No 3 av34 Is v or v > 1.5 v /2 No 3 av34 12 If yes, v = 660 (Equation 13-15, 13-16, 13-18, or 13-19) 12A Flow Entering Diverge Influence Area Actual Max Desirable Violation? v No 12 Level of Service Determination (if not F) Density, D = v L = 5.3 pc/mi/ln R 12 D Level of service for ramp-freeway junction areas of influence A Speed Estimation Intermediate speed variable, D = S Space mean speed in ramp influence area, S = 61.4 mph R Space mean speed in outer lanes, S = N/A mph 0 Space mean speed for all vehicles, S = 61.4 mph _
86 HCS 2010: Freeway Merge and Diverge Segments Release 6.50 Phone: Fax: Merge Analysis Analyst: HDR Agency/Co.: SDDOT Date performed: 1/2014 Analysis time period: AM PEAK Freeway/Dir of Travel: I-90/WB Junction: SD 11 Jurisdiction: MINNEHAHA CO. Analysis Year: Existing Description: I-90/SD 100 IMJR Freeway Data Type of analysis Merge Number of lanes in freeway 2 Free-flow speed on freeway 70.0 mph Volume on freeway 760 vph On Ramp Data Side of freeway Right Number of lanes in ramp 1 Free-flow speed on ramp 45.0 mph Volume on ramp 300 vph Length of first accel/decel lane 730 ft Length of second accel/decel lane ft Adjacent Ramp Data (if one exists) Does adjacent ramp exist? Yes Volume on adjacent Ramp 60 vph Position of adjacent Ramp Upstream Type of adjacent Ramp Off Distance to adjacent Ramp 1980 ft Conversion to pc/h Under Base Conditions Junction Components Freeway Ramp Adjacent Ramp Volume, V (vph) vph Peak-hour factor, PHF Peak 15-min volume, v v Trucks and buses % Recreational vehicles % Terrain type: Rolling Rolling Rolling Grade % % % Length mi mi mi Trucks and buses PCE, ET Recreational vehicle PCE, ER
87 Heavy vehicle adjustment, fhv Driver population factor, fp Flow rate, vp pcph Estimation of V12 Merge Areas L = (Equation 13-6 or 13-7) EQ P = Using Equation 0 FM v = v (P ) = 984 pc/h 12 F FM Capacity Checks Actual Maximum LOS F? v No FO v or v 0 pc/h (Equation or 13-17) 3 av34 Is v or v > 2700 pc/h? No 3 av34 Is v or v > 1.5 v /2 No 3 av34 12 If yes, v = 984 (Equation 13-15, 13-16, 13-18, or 13-19) 12A Flow Entering Merge Influence Area Actual Max Desirable Violation? v No R12 Level of Service Determination (if not F) Density, D = v v L = 11.2 pc/mi/ln R R 12 A Level of service for ramp-freeway junction areas of influence B Speed Estimation Intermediate speed variable, M = S Space mean speed in ramp influence area, S = 62.4 mph R Space mean speed in outer lanes, S = N/A mph 0 Space mean speed for all vehicles, S = 62.4 mph _
88 HCS 2010: Freeway Merge and Diverge Segments Release 6.50 Phone: Fax: Merge Analysis Analyst: HDR Agency/Co.: SDDOT Date performed: 1/2014 Analysis time period: PM PEAK Freeway/Dir of Travel: I-90/WB Junction: SD 11 Jurisdiction: MINNEHAHA CO. Analysis Year: Existing Description: I-90/SD 100 IMJR Freeway Data Type of analysis Merge Number of lanes in freeway 2 Free-flow speed on freeway 70.0 mph Volume on freeway 420 vph On Ramp Data Side of freeway Right Number of lanes in ramp 1 Free-flow speed on ramp 45.0 mph Volume on ramp 290 vph Length of first accel/decel lane 730 ft Length of second accel/decel lane ft Adjacent Ramp Data (if one exists) Does adjacent ramp exist? Yes Volume on adjacent Ramp 90 vph Position of adjacent Ramp Upstream Type of adjacent Ramp Off Distance to adjacent Ramp 1980 ft Conversion to pc/h Under Base Conditions Junction Components Freeway Ramp Adjacent Ramp Volume, V (vph) vph Peak-hour factor, PHF Peak 15-min volume, v v Trucks and buses % Recreational vehicles % Terrain type: Rolling Rolling Rolling Grade % % % Length mi mi mi Trucks and buses PCE, ET Recreational vehicle PCE, ER
89 Heavy vehicle adjustment, fhv Driver population factor, fp Flow rate, vp pcph Estimation of V12 Merge Areas L = (Equation 13-6 or 13-7) EQ P = Using Equation 0 FM v = v (P ) = 544 pc/h 12 F FM Capacity Checks Actual Maximum LOS F? v No FO v or v 0 pc/h (Equation or 13-17) 3 av34 Is v or v > 2700 pc/h? No 3 av34 Is v or v > 1.5 v /2 No 3 av34 12 If yes, v = 544 (Equation 13-15, 13-16, 13-18, or 13-19) 12A Flow Entering Merge Influence Area Actual Max Desirable Violation? v No R12 Level of Service Determination (if not F) Density, D = v v L = 7.7 pc/mi/ln R R 12 A Level of service for ramp-freeway junction areas of influence A Speed Estimation Intermediate speed variable, M = S Space mean speed in ramp influence area, S = 62.6 mph R Space mean speed in outer lanes, S = N/A mph 0 Space mean speed for all vehicles, S = 62.6 mph _
90 HCS 2010: Freeway Merge and Diverge Segments Release 6.50 Phone: Fax: Diverge Analysis Analyst: HDR Agency/Co.: SDDOT Date performed: 1/2014 Analysis time period: AM PEAK Freeway/Dir of Travel: I-90/WB Junction: TIMBERLINE RD. Jurisdiction: MINNEHAHA CO. Analysis Year: Existing Description: I-90/SD 100 IMJR Freeway Data Type of analysis Diverge Number of lanes in freeway 2 Free-flow speed on freeway 70.0 mph Volume on freeway 1060 vph Off Ramp Data Side of freeway Right Number of lanes in ramp 1 Free-Flow speed on ramp 45.0 mph Volume on ramp 90 vph Length of first accel/decel lane 530 ft Length of second accel/decel lane ft Adjacent Ramp Data (if one exists) Does adjacent ramp exist? Yes Volume on adjacent ramp 120 vph Position of adjacent ramp Downstream Type of adjacent ramp On Distance to adjacent ramp 2020 ft Conversion to pc/h Under Base Conditions Junction Components Freeway Ramp Adjacent Ramp Volume, V (vph) vph Peak-hour factor, PHF Peak 15-min volume, v v Trucks and buses % Recreational vehicles % Terrain type: Rolling Rolling Rolling Grade 0.00 % 0.00 % 0.00 % Length 0.00 mi 0.00 mi 0.00 mi Trucks and buses PCE, ET Recreational vehicle PCE, ER
91 Heavy vehicle adjustment, fhv Driver population factor, fp Flow rate, vp pcph Estimation of V12 Diverge Areas L = (Equation or 13-13) EQ P = Using Equation 0 FD v = v + (v - v ) P = 1372 pc/h 12 R F R FD Capacity Checks Actual Maximum LOS F? v = v No Fi F v = v - v No FO F R v No R v or v 0 pc/h (Equation or 13-17) 3 av34 Is v or v > 2700 pc/h? No 3 av34 Is v or v > 1.5 v /2 No 3 av34 12 If yes, v = 1372 (Equation 13-15, 13-16, 13-18, or 13-19) 12A Flow Entering Diverge Influence Area Actual Max Desirable Violation? v No 12 Level of Service Determination (if not F) Density, D = v L = 11.3 pc/mi/ln R 12 D Level of service for ramp-freeway junction areas of influence B Speed Estimation Intermediate speed variable, D = S Space mean speed in ramp influence area, S = 61.4 mph R Space mean speed in outer lanes, S = N/A mph 0 Space mean speed for all vehicles, S = 61.4 mph _
92 HCS 2010: Freeway Merge and Diverge Segments Release 6.50 Phone: Fax: Diverge Analysis Analyst: HDR Agency/Co.: SDDOT Date performed: 1/2014 Analysis time period: PM PEAK Freeway/Dir of Travel: I-90/WB Junction: TIMBERLINE RD. Jurisdiction: MINNEHAHA CO. Analysis Year: Existing Description: I-90/SD 100 IMJR Freeway Data Type of analysis Diverge Number of lanes in freeway 2 Free-flow speed on freeway 70.0 mph Volume on freeway 710 vph Off Ramp Data Side of freeway Right Number of lanes in ramp 1 Free-Flow speed on ramp 45.0 mph Volume on ramp 30 vph Length of first accel/decel lane 530 ft Length of second accel/decel lane ft Adjacent Ramp Data (if one exists) Does adjacent ramp exist? Yes Volume on adjacent ramp 120 vph Position of adjacent ramp Downstream Type of adjacent ramp On Distance to adjacent ramp 2020 ft Conversion to pc/h Under Base Conditions Junction Components Freeway Ramp Adjacent Ramp Volume, V (vph) vph Peak-hour factor, PHF Peak 15-min volume, v v Trucks and buses % Recreational vehicles % Terrain type: Rolling Rolling Rolling Grade 0.00 % 0.00 % 0.00 % Length 0.00 mi 0.00 mi 0.00 mi Trucks and buses PCE, ET Recreational vehicle PCE, ER
93 Heavy vehicle adjustment, fhv Driver population factor, fp Flow rate, vp pcph Estimation of V12 Diverge Areas L = (Equation or 13-13) EQ P = Using Equation 0 FD v = v + (v - v ) P = 919 pc/h 12 R F R FD Capacity Checks Actual Maximum LOS F? v = v No Fi F v = v - v No FO F R v No R v or v 0 pc/h (Equation or 13-17) 3 av34 Is v or v > 2700 pc/h? No 3 av34 Is v or v > 1.5 v /2 No 3 av34 12 If yes, v = 919 (Equation 13-15, 13-16, 13-18, or 13-19) 12A Flow Entering Diverge Influence Area Actual Max Desirable Violation? v No 12 Level of Service Determination (if not F) Density, D = v L = 7.4 pc/mi/ln R 12 D Level of service for ramp-freeway junction areas of influence A Speed Estimation Intermediate speed variable, D = S Space mean speed in ramp influence area, S = 61.6 mph R Space mean speed in outer lanes, S = N/A mph 0 Space mean speed for all vehicles, S = 61.6 mph _
94 HCS 2010: Freeway Merge and Diverge Segments Release 6.50 Phone: Fax: Merge Analysis Analyst: HDR Agency/Co.: SDDOT Date performed: 1/2014 Analysis time period: AM PEAK Freeway/Dir of Travel: I-90/WB Junction: TIMBERLINE RD. Jurisdiction: MINNEHAHA CO. Analysis Year: Existing Description: I-90/SD 100 IMJR Freeway Data Type of analysis Merge Number of lanes in freeway 2 Free-flow speed on freeway 70.0 mph Volume on freeway 970 vph On Ramp Data Side of freeway Right Number of lanes in ramp 1 Free-flow speed on ramp 45.0 mph Volume on ramp 120 vph Length of first accel/decel lane 680 ft Length of second accel/decel lane ft Adjacent Ramp Data (if one exists) Does adjacent ramp exist? Yes Volume on adjacent Ramp 90 vph Position of adjacent Ramp Upstream Type of adjacent Ramp Off Distance to adjacent Ramp 2020 ft Conversion to pc/h Under Base Conditions Junction Components Freeway Ramp Adjacent Ramp Volume, V (vph) vph Peak-hour factor, PHF Peak 15-min volume, v v Trucks and buses % Recreational vehicles % Terrain type: Rolling Rolling Rolling Grade % % % Length mi mi mi Trucks and buses PCE, ET Recreational vehicle PCE, ER
95 Heavy vehicle adjustment, fhv Driver population factor, fp Flow rate, vp pcph Estimation of V12 Merge Areas L = (Equation 13-6 or 13-7) EQ P = Using Equation 0 FM v = v (P ) = 1256 pc/h 12 F FM Capacity Checks Actual Maximum LOS F? v No FO v or v 0 pc/h (Equation or 13-17) 3 av34 Is v or v > 2700 pc/h? No 3 av34 Is v or v > 1.5 v /2 No 3 av34 12 If yes, v = 1256 (Equation 13-15, 13-16, 13-18, or 13-19) 12A Flow Entering Merge Influence Area Actual Max Desirable Violation? v No R12 Level of Service Determination (if not F) Density, D = v v L = 12.0 pc/mi/ln R R 12 A Level of service for ramp-freeway junction areas of influence B Speed Estimation Intermediate speed variable, M = S Space mean speed in ramp influence area, S = 62.3 mph R Space mean speed in outer lanes, S = N/A mph 0 Space mean speed for all vehicles, S = 62.3 mph _
96 HCS 2010: Freeway Merge and Diverge Segments Release 6.50 Phone: Fax: Merge Analysis Analyst: HDR Agency/Co.: SDDOT Date performed: 1/2014 Analysis time period: PM PEAK Freeway/Dir of Travel: I-90/WB Junction: TIMBERLINE RD. Jurisdiction: MINNEHAHA CO. Analysis Year: Existing Description: I-90/SD 100 IMJR Freeway Data Type of analysis Merge Number of lanes in freeway 2 Free-flow speed on freeway 70.0 mph Volume on freeway 680 vph On Ramp Data Side of freeway Right Number of lanes in ramp 1 Free-flow speed on ramp 45.0 mph Volume on ramp 120 vph Length of first accel/decel lane 680 ft Length of second accel/decel lane ft Adjacent Ramp Data (if one exists) Does adjacent ramp exist? Yes Volume on adjacent Ramp 30 vph Position of adjacent Ramp Upstream Type of adjacent Ramp Off Distance to adjacent Ramp 2020 ft Conversion to pc/h Under Base Conditions Junction Components Freeway Ramp Adjacent Ramp Volume, V (vph) vph Peak-hour factor, PHF Peak 15-min volume, v v Trucks and buses % Recreational vehicles % Terrain type: Rolling Rolling Rolling Grade % % % Length mi mi mi Trucks and buses PCE, ET Recreational vehicle PCE, ER
97 Heavy vehicle adjustment, fhv Driver population factor, fp Flow rate, vp pcph Estimation of V12 Merge Areas L = (Equation 13-6 or 13-7) EQ P = Using Equation 0 FM v = v (P ) = 880 pc/h 12 F FM Capacity Checks Actual Maximum LOS F? v No FO v or v 0 pc/h (Equation or 13-17) 3 av34 Is v or v > 2700 pc/h? No 3 av34 Is v or v > 1.5 v /2 No 3 av34 12 If yes, v = 880 (Equation 13-15, 13-16, 13-18, or 13-19) 12A Flow Entering Merge Influence Area Actual Max Desirable Violation? v No R12 Level of Service Determination (if not F) Density, D = v v L = 9.1 pc/mi/ln R R 12 A Level of service for ramp-freeway junction areas of influence A Speed Estimation Intermediate speed variable, M = S Space mean speed in ramp influence area, S = 62.4 mph R Space mean speed in outer lanes, S = N/A mph 0 Space mean speed for all vehicles, S = 62.4 mph _
98 HCS 2010: Freeway Merge and Diverge Segments Release 6.50 Phone: Fax: Merge Analysis Analyst: HDR Agency/Co.: SDDOT Date performed: 1/2014 Analysis time period: AM PEAK Freeway/Dir of Travel: I-90/WB Junction: I-229 Jurisdiction: MINNEHAHA CO. Analysis Year: Existing Description: I-90/SD 100 IMJR Freeway Data Type of analysis Merge Number of lanes in freeway 2 Free-flow speed on freeway 66.0 mph Volume on freeway 1090 vph On Ramp Data Side of freeway Right Number of lanes in ramp 1 Free-flow speed on ramp 35.0 mph Volume on ramp 180 vph Length of first accel/decel lane 740 ft Length of second accel/decel lane ft Adjacent Ramp Data (if one exists) Does adjacent ramp exist? Yes Volume on adjacent Ramp 300 vph Position of adjacent Ramp Downstream Type of adjacent Ramp Off Distance to adjacent Ramp 740 ft Conversion to pc/h Under Base Conditions Junction Components Freeway Ramp Adjacent Ramp Volume, V (vph) vph Peak-hour factor, PHF Peak 15-min volume, v v Trucks and buses % Recreational vehicles % Terrain type: Rolling Rolling Rolling Grade % % % Length mi mi mi Trucks and buses PCE, ET Recreational vehicle PCE, ER
99 Heavy vehicle adjustment, fhv Driver population factor, fp Flow rate, vp pcph Estimation of V12 Merge Areas L = (Equation 13-6 or 13-7) EQ P = Using Equation 0 FM v = v (P ) = 1411 pc/h 12 F FM Capacity Checks Actual Maximum LOS F? v No FO v or v 0 pc/h (Equation or 13-17) 3 av34 Is v or v > 2700 pc/h? No 3 av34 Is v or v > 1.5 v /2 No 3 av34 12 If yes, v = 1411 (Equation 13-15, 13-16, 13-18, or 13-19) 12A Flow Entering Merge Influence Area Actual Max Desirable Violation? v No R12 Level of Service Determination (if not F) Density, D = v v L = 13.4 pc/mi/ln R R 12 A Level of service for ramp-freeway junction areas of influence B Speed Estimation Intermediate speed variable, M = S Space mean speed in ramp influence area, S = 59.1 mph R Space mean speed in outer lanes, S = N/A mph 0 Space mean speed for all vehicles, S = 59.1 mph _
100 HCS 2010: Freeway Merge and Diverge Segments Release 6.50 Phone: Fax: Merge Analysis Analyst: HDR Agency/Co.: SDDOT Date performed: 1/2014 Analysis time period: PM PEAK Freeway/Dir of Travel: I-90/WB Junction: I-229 Jurisdiction: MINNEHAHA CO. Analysis Year: Existing Description: I-90/SD 100 IMJR Freeway Data Type of analysis Merge Number of lanes in freeway 2 Free-flow speed on freeway 66.0 mph Volume on freeway 800 vph On Ramp Data Side of freeway Right Number of lanes in ramp 1 Free-flow speed on ramp 35.0 mph Volume on ramp 160 vph Length of first accel/decel lane 740 ft Length of second accel/decel lane ft Adjacent Ramp Data (if one exists) Does adjacent ramp exist? Yes Volume on adjacent Ramp 260 vph Position of adjacent Ramp Downstream Type of adjacent Ramp Off Distance to adjacent Ramp 740 ft Conversion to pc/h Under Base Conditions Junction Components Freeway Ramp Adjacent Ramp Volume, V (vph) vph Peak-hour factor, PHF Peak 15-min volume, v v Trucks and buses % Recreational vehicles % Terrain type: Rolling Rolling Rolling Grade % % % Length mi mi mi Trucks and buses PCE, ET Recreational vehicle PCE, ER
101 Heavy vehicle adjustment, fhv Driver population factor, fp Flow rate, vp pcph Estimation of V12 Merge Areas L = (Equation 13-6 or 13-7) EQ P = Using Equation 0 FM v = v (P ) = 1036 pc/h 12 F FM Capacity Checks Actual Maximum LOS F? v No FO v or v 0 pc/h (Equation or 13-17) 3 av34 Is v or v > 2700 pc/h? No 3 av34 Is v or v > 1.5 v /2 No 3 av34 12 If yes, v = 1036 (Equation 13-15, 13-16, 13-18, or 13-19) 12A Flow Entering Merge Influence Area Actual Max Desirable Violation? v No R12 Level of Service Determination (if not F) Density, D = v v L = 10.3 pc/mi/ln R R 12 A Level of service for ramp-freeway junction areas of influence B Speed Estimation Intermediate speed variable, M = S Space mean speed in ramp influence area, S = 59.2 mph R Space mean speed in outer lanes, S = N/A mph 0 Space mean speed for all vehicles, S = 59.2 mph _
102 Phone: HCS 2010: Freeway Weaving Release 6.50 Fax: Operational Analysis Analyst: HDR Agency/Co.: SDDOT Date Performed: 1/2014 Analysis Time Period: AM PEAK Freeway/Dir of Travel: I-90/WB Weaving Location: I-229 ON TO I-229 OFF Analysis Year: Existing Description: I-90/SD 100 IMJR Inputs Segment Type Freeway Weaving configuration One-Sided Number of lanes, N 3 ln Weaving segment length, LS 740 ft Freeway free-flow speed, FFS 66 mi/h Minimum segment speed, SMIN 40 mi/h Freeway maximum capacity, cifl 2350 pc/h/ln Terrain type Rolling Grade 0.00 % Length 0.00 mi Conversion to pc/h Under Base Conditions Volume Components VFF VRF VFR VRR Volume, V veh/h Peak hour factor, PHF Peak 15-min volume, v Trucks and buses % Recreational vehicles % Trucks and buses PCE, ET Recreational vehicle PCE, ER Heavy vehicle adjustment, fhv Driver population adjustment, fp Flow rate, v pc/h Volume ratio, VR Configuration Characteristics Number of maneuver lanes, NWL 2 ln Interchange density, ID 0.5 int/mi Minimum RF lane changes, LCRF 1 lc/pc Minimum FR lane changes, LCFR 1 lc/pc Minimum RR lane changes, LCRR lc/pc Minimum weaving lane changes, LCMIN 581 lc/h Weaving lane changes, LCW 683 lc/h Non-weaving vehicle index, INW 38 Non-weaving lane change, LCNW 34 lc/h Total lane changes, LCALL 717 lc/h Weaving and Non-Weaving Speeds Weaving intensity factor, W 0.220
103 Average weaving speed, SW 61.3 mi/h Average non-weaving speed, SNW 59.3 mi/h Weaving Segment Speed, Density, Level of Service and Capacity Weaving segment speed, S 60.0 mi/h Weaving segment density, D 8.9 pc/mi/ln Level of service, LOS A Weaving segment v/c ratio Weaving segment flow rate, v 1377 veh/h Weaving segment capacity, cw 4965 veh/h Limitations on Weaving Segments If limit reached, see note. Minimum Maximum Actual Note Weaving length (ft) a,b Maximum Analyzed Density-based capacty, c ciwl (pc/h/ln) Maximum Analyzed v/c ratio d Notes: a. In weaving segments shorter than 300 ft, weaving vehicles are assumed to make only necessary lane changes. b. Weaving segments longer than the calculated maximum length should be treated as isolated merge and diverge areas using the procedures of Chapter 13, "Freeway Merge and Diverge Segments." c. The density-based capacity exceeds the capacity of a basic freeway segment, under equivalent ideal conditions. d. Volumes exceed the weaving segment capacity. The level of service is F.
104 Phone: HCS 2010: Freeway Weaving Release 6.50 Fax: Operational Analysis Analyst: HDR Agency/Co.: SDDOT Date Performed: 1/2014 Analysis Time Period: PM PEAK Freeway/Dir of Travel: I-90/WB Weaving Location: I-229 ON TO I-229 OFF Analysis Year: Existing Description: I-90/SD 100 IMJR Inputs Segment Type Freeway Weaving configuration One-Sided Number of lanes, N 3 ln Weaving segment length, LS 740 ft Freeway free-flow speed, FFS 66 mi/h Minimum segment speed, SMIN 40 mi/h Freeway maximum capacity, cifl 2350 pc/h/ln Terrain type Rolling Grade 0.00 % Length 0.00 mi Conversion to pc/h Under Base Conditions Volume Components VFF VRF VFR VRR Volume, V veh/h Peak hour factor, PHF Peak 15-min volume, v Trucks and buses % Recreational vehicles % Trucks and buses PCE, ET Recreational vehicle PCE, ER Heavy vehicle adjustment, fhv Driver population adjustment, fp Flow rate, v pc/h Volume ratio, VR Configuration Characteristics Number of maneuver lanes, NWL 2 ln Interchange density, ID 0.5 int/mi Minimum RF lane changes, LCRF 1 lc/pc Minimum FR lane changes, LCFR 1 lc/pc Minimum RR lane changes, LCRR lc/pc Minimum weaving lane changes, LCMIN 509 lc/h Weaving lane changes, LCW 611 lc/h Non-weaving vehicle index, INW 26 Non-weaving lane change, LCNW 0 lc/h Total lane changes, LCALL 611 lc/h Weaving and Non-Weaving Speeds Weaving intensity factor, W 0.194
105 Average weaving speed, SW 61.8 mi/h Average non-weaving speed, SNW 60.4 mi/h Weaving Segment Speed, Density, Level of Service and Capacity Weaving segment speed, S 61.0 mi/h Weaving segment density, D 6.6 pc/mi/ln Level of service, LOS A Weaving segment v/c ratio Weaving segment flow rate, v 1037 veh/h Weaving segment capacity, cw 4833 veh/h Limitations on Weaving Segments If limit reached, see note. Minimum Maximum Actual Note Weaving length (ft) a,b Maximum Analyzed Density-based capacty, c ciwl (pc/h/ln) Maximum Analyzed v/c ratio d Notes: a. In weaving segments shorter than 300 ft, weaving vehicles are assumed to make only necessary lane changes. b. Weaving segments longer than the calculated maximum length should be treated as isolated merge and diverge areas using the procedures of Chapter 13, "Freeway Merge and Diverge Segments." c. The density-based capacity exceeds the capacity of a basic freeway segment, under equivalent ideal conditions. d. Volumes exceed the weaving segment capacity. The level of service is F.
106 HCS 2010: Freeway Merge and Diverge Segments Release 6.50 Phone: Fax: Diverge Analysis Analyst: HDR Agency/Co.: SDDOT Date performed: 1/2014 Analysis time period: AM PEAK Freeway/Dir of Travel: I-90/WB Junction: I-229 Jurisdiction: MINNEHAHA CO. Analysis Year: Existing Description: I-90/SD 100 IMJR Freeway Data Type of analysis Diverge Number of lanes in freeway 2 Free-flow speed on freeway 66.0 mph Volume on freeway 1270 vph Off Ramp Data Side of freeway Right Number of lanes in ramp 1 Free-Flow speed on ramp 35.0 mph Volume on ramp 300 vph Length of first accel/decel lane 740 ft Length of second accel/decel lane ft Adjacent Ramp Data (if one exists) Does adjacent ramp exist? Yes Volume on adjacent ramp 180 vph Position of adjacent ramp Upstream Type of adjacent ramp On Distance to adjacent ramp 740 ft Conversion to pc/h Under Base Conditions Junction Components Freeway Ramp Adjacent Ramp Volume, V (vph) vph Peak-hour factor, PHF Peak 15-min volume, v v Trucks and buses % Recreational vehicles % Terrain type: Rolling Rolling Rolling Grade 0.00 % 0.00 % 0.00 % Length 0.00 mi 0.00 mi 0.00 mi Trucks and buses PCE, ET Recreational vehicle PCE, ER
107 Heavy vehicle adjustment, fhv Driver population factor, fp Flow rate, vp pcph Estimation of V12 Diverge Areas L = (Equation or 13-13) EQ P = Using Equation 0 FD v = v + (v - v ) P = 1644 pc/h 12 R F R FD Capacity Checks Actual Maximum LOS F? v = v No Fi F v = v - v No FO F R v No R v or v 0 pc/h (Equation or 13-17) 3 av34 Is v or v > 2700 pc/h? No 3 av34 Is v or v > 1.5 v /2 No 3 av34 12 If yes, v = 1644 (Equation 13-15, 13-16, 13-18, or 13-19) 12A Flow Entering Diverge Influence Area Actual Max Desirable Violation? v No 12 Level of Service Determination (if not F) Density, D = v L = 11.7 pc/mi/ln R 12 D Level of service for ramp-freeway junction areas of influence B Speed Estimation Intermediate speed variable, D = S Space mean speed in ramp influence area, S = 54.9 mph R Space mean speed in outer lanes, S = N/A mph 0 Space mean speed for all vehicles, S = 54.9 mph _
108 HCS 2010: Freeway Merge and Diverge Segments Release 6.50 Phone: Fax: Diverge Analysis Analyst: HDR Agency/Co.: SDDOT Date performed: 1/2014 Analysis time period: PM PEAK Freeway/Dir of Travel: I-90/WB Junction: I-229 Jurisdiction: MINNEHAHA CO. Analysis Year: Existing Description: I-90/SD 100 IMJR Freeway Data Type of analysis Diverge Number of lanes in freeway 2 Free-flow speed on freeway 66.0 mph Volume on freeway 960 vph Off Ramp Data Side of freeway Right Number of lanes in ramp 1 Free-Flow speed on ramp 35.0 mph Volume on ramp 260 vph Length of first accel/decel lane 740 ft Length of second accel/decel lane ft Adjacent Ramp Data (if one exists) Does adjacent ramp exist? Yes Volume on adjacent ramp 160 vph Position of adjacent ramp Upstream Type of adjacent ramp On Distance to adjacent ramp 740 ft Conversion to pc/h Under Base Conditions Junction Components Freeway Ramp Adjacent Ramp Volume, V (vph) vph Peak-hour factor, PHF Peak 15-min volume, v v Trucks and buses % Recreational vehicles % Terrain type: Rolling Rolling Rolling Grade 0.00 % 0.00 % 0.00 % Length 0.00 mi 0.00 mi 0.00 mi Trucks and buses PCE, ET Recreational vehicle PCE, ER
109 Heavy vehicle adjustment, fhv Driver population factor, fp Flow rate, vp pcph Estimation of V12 Diverge Areas L = (Equation or 13-13) EQ P = Using Equation 0 FD v = v + (v - v ) P = 1243 pc/h 12 R F R FD Capacity Checks Actual Maximum LOS F? v = v No Fi F v = v - v No FO F R v No R v or v 0 pc/h (Equation or 13-17) 3 av34 Is v or v > 2700 pc/h? No 3 av34 Is v or v > 1.5 v /2 No 3 av34 12 If yes, v = 1243 (Equation 13-15, 13-16, 13-18, or 13-19) 12A Flow Entering Diverge Influence Area Actual Max Desirable Violation? v No 12 Level of Service Determination (if not F) Density, D = v L = 8.3 pc/mi/ln R 12 D Level of service for ramp-freeway junction areas of influence A Speed Estimation Intermediate speed variable, D = S Space mean speed in ramp influence area, S = 55.0 mph R Space mean speed in outer lanes, S = N/A mph 0 Space mean speed for all vehicles, S = 55.0 mph _
110 Appendix Part Crossroad Level of Service I-90/Timberline Road Interchange
111 HCS+: Unsignalized Intersections Release 5.6 TWO-WAY STOP CONTROL SUMMARY Analyst: HDR Agency/Co.: SDDOT Date Performed: 1/2014 Analysis Time Period: AM PEAK Intersection: TIMBERLINE RD. Jurisdiction: MINNEHAHA CO. Units: U. S. Customary Analysis Year: Existing Project ID: East/West Street: 60TH ST. N. North/South Street: TIMBERLINE RD. Intersection Orientation: NS Study period (hrs): 1.00 Vehicle Volumes and Adjustments Major Street: Approach Northbound Southbound Movement L T R L T R Volume Peak-Hour Factor, PHF Hourly Flow Rate, HFR Percent Heavy Vehicles Median Type/Storage Undivided / RT Channelized? Lanes Configuration LT TR Upstream Signal? No No Minor Street: Approach Westbound Eastbound Movement L T R L T R Volume Peak Hour Factor, PHF Hourly Flow Rate, HFR Percent Heavy Vehicles 4 4 Percent Grade (%) 2 0 Flared Approach: Exists?/Storage / No / Lanes 0 0 Configuration LR Delay, Queue Length, and Level of Service Approach NB SB Westbound Eastbound Movement Lane Config LT LR v (vph) C(m) (vph) v/c % queue length Control Delay LOS A C Approach Delay 16.6 Approach LOS C
112 HCS+: Unsignalized Intersections Release 5.6 Phone: Fax: TWO-WAY STOP CONTROL(TWSC) ANALYSIS Analyst: HDR Agency/Co.: SDDOT Date Performed: 1/2014 Analysis Time Period: AM PEAK Intersection: TIMBERLINE RD. Jurisdiction: MINNEHAHA CO. Units: U. S. Customary Analysis Year: Existing Project ID: East/West Street: 60TH ST. N. North/South Street: TIMBERLINE RD. Intersection Orientation: NS Study period (hrs): 1.00 Vehicle Volumes and Adjustments Major Street Movements L T R L T R Volume Peak-Hour Factor, PHF Peak-15 Minute Volume Hourly Flow Rate, HFR Percent Heavy Vehicles Median Type/Storage Undivided / RT Channelized? Lanes Configuration LT TR Upstream Signal? No No Minor Street Movements L T R L T R Volume Peak Hour Factor, PHF Peak-15 Minute Volume 5 4 Hourly Flow Rate, HFR Percent Heavy Vehicles 4 4 Percent Grade (%) 2 0 Flared Approach: Exists?/Storage / No / RT Channelized? Lanes 0 0 Configuration LR Pedestrian Volumes and Adjustments Movements Flow (ped/hr)
113 Lane Width (ft) Walking Speed (ft/sec) Percent Blockage Upstream Signal Data Prog. Sat Arrival Green Cycle Prog. Distance Flow Flow Type Time Length Speed to Signal vph vph sec sec mph feet S2 Left-Turn Through S5 Left-Turn Through Worksheet 3-Data for Computing Effect of Delay to Major Street Vehicles Movement 2 Movement 5 Shared ln volume, major th vehicles: 213 Shared ln volume, major rt vehicles: 0 Sat flow rate, major th vehicles: 1700 Sat flow rate, major rt vehicles: 1700 Number of major street through lanes: 1 Worksheet 4-Critical Gap and Follow-up Time Calculation Critical Gap Calculation Movement L L L T R L T R t(c,base) t(c,hv) P(hv) t(c,g) Percent Grade t(3,lt) t(c,t): 1-stage stage t(c) 1-stage stage Follow-Up Time Calculations Movement L L L T R L T R t(f,base) t(f,hv) P(HV) t(f) Worksheet 5-Effect of Upstream Signals Computation 1-Queue Clearance Time at Upstream Signal Movement 2 Movement 5 V(t) V(l,prot) V(t) V(l,prot) V prog
114 Total Saturation Flow Rate, s (vph) Arrival Type Effective Green, g (sec) Cycle Length, C (sec) Rp (from Exhibit 16-11) Proportion vehicles arriving on green P g(q1) g(q2) g(q) Computation 2-Proportion of TWSC Intersection Time blocked Movement 2 Movement 5 V(t) V(l,prot) V(t) V(l,prot) alpha beta Travel time, t(a) (sec) Smoothing Factor, F Proportion of conflicting flow, f Max platooned flow, V(c,max) Min platooned flow, V(c,min) Duration of blocked period, t(p) Proportion time blocked, p Computation 3-Platoon Event Periods Result p(2) p(5) p(dom) p(subo) Constrained or unconstrained? Proportion unblocked (1) (2) (3) for minor Single-stage Two-Stage Process movements, p(x) Process Stage I Stage II p(1) p(4) p(7) p(8) p(9) p(10) p(11) p(12) Computation 4 and 5 Single-Stage Process Movement L L L T R L T R V c,x s Px V c,u,x C r,x C plat,x Two-Stage Process
115 Stage1 Stage2 Stage1 Stage2 Stage1 Stage2 Stage1 Stage2 V(c,x) s 1500 P(x) V(c,u,x) C(r,x) C(plat,x) Worksheet 6-Impedance and Capacity Equations Step 1: RT from Minor St Conflicting Flows 145 Potential Capacity 897 Pedestrian Impedance Factor Movement Capacity 897 Probability of Queue free St Step 2: LT from Major St. 4 1 Conflicting Flows 188 Potential Capacity 1368 Pedestrian Impedance Factor Movement Capacity 1368 Probability of Queue free St Maj L-Shared Prob Q free St Step 3: TH from Minor St Conflicting Flows Potential Capacity Pedestrian Impedance Factor Cap. Adj. factor due to Impeding mvmnt Movement Capacity Probability of Queue free St Step 4: LT from Minor St Conflicting Flows 934 Potential Capacity 293 Pedestrian Impedance Factor Maj. L, Min T Impedance factor 0.76 Maj. L, Min T Adj. Imp Factor Cap. Adj. factor due to Impeding mvmnt Movement Capacity 231 Worksheet 7-Computation of the Effect of Two-stage Gap Acceptance Step 3: TH from Minor St Part 1 - First Stage Conflicting Flows Potential Capacity Pedestrian Impedance Factor Cap. Adj. factor due to Impeding mvmnt Movement Capacity Probability of Queue free St.
116 Part 2 - Second Stage Conflicting Flows Potential Capacity Pedestrian Impedance Factor Cap. Adj. factor due to Impeding mvmnt Movement Capacity Part 3 - Single Stage Conflicting Flows Potential Capacity Pedestrian Impedance Factor Cap. Adj. factor due to Impeding mvmnt Movement Capacity Result for 2 stage process: a y C t Probability of Queue free St Step 4: LT from Minor St Part 1 - First Stage Conflicting Flows Potential Capacity Pedestrian Impedance Factor Cap. Adj. factor due to Impeding mvmnt Movement Capacity Part 2 - Second Stage Conflicting Flows Potential Capacity Pedestrian Impedance Factor Cap. Adj. factor due to Impeding mvmnt Movement Capacity Part 3 - Single Stage Conflicting Flows 934 Potential Capacity 293 Pedestrian Impedance Factor Maj. L, Min T Impedance factor 0.76 Maj. L, Min T Adj. Imp Factor Cap. Adj. factor due to Impeding mvmnt Movement Capacity 231 Results for Two-stage process: a y C t 231 Worksheet 8-Shared Lane Calculations Movement L T R L T R Volume (vph) Movement Capacity (vph) Shared Lane Capacity (vph) 345
117 Worksheet 9-Computation of Effect of Flared Minor Street Approaches Movement L T R L T R C sep Volume Delay Q sep Q sep +1 round (Qsep +1) n max C sh 345 SUM C sep n C act Worksheet 10-Delay, Queue Length, and Level of Service Movement Lane Config LT LR v (vph) C(m) (vph) v/c % queue length Control Delay LOS A C Approach Delay 16.6 Approach LOS C Worksheet 11-Shared Major LT Impedance and Delay Movement 2 Movement 5 p(oj) v(il), Volume for stream 2 or v(i2), Volume for stream 3 or 6 0 s(il), Saturation flow rate for stream 2 or s(i2), Saturation flow rate for stream 3 or P*(oj) 0.76 d(m,lt), Delay for stream 1 or N, Number of major street through lanes 1 d(rank,1) Delay for stream 2 or 5 2.0
118 HCS+: Unsignalized Intersections Release 5.6 TWO-WAY STOP CONTROL SUMMARY Analyst: HDR Agency/Co.: SDDOT Date Performed: 1/2014 Analysis Time Period: PM PEAK Intersection: TIMBERLINE RD. Jurisdiction: MINNEHAHA CO. Units: U. S. Customary Analysis Year: Project ID: I-90/SD 100 IMJR East/West Street: 60TH ST. N. North/South Street: TIMBERLINE RD. Intersection Orientation: NS Study period (hrs): 1.00 Vehicle Volumes and Adjustments Major Street: Approach Northbound Southbound Movement L T R L T R Volume Peak-Hour Factor, PHF Hourly Flow Rate, HFR Percent Heavy Vehicles Median Type/Storage Undivided / RT Channelized? Lanes Configuration LT TR Upstream Signal? No No Minor Street: Approach Westbound Eastbound Movement L T R L T R Volume Peak Hour Factor, PHF Hourly Flow Rate, HFR Percent Heavy Vehicles 4 4 Percent Grade (%) 2 0 Flared Approach: Exists?/Storage / No / Lanes 0 0 Configuration LR Delay, Queue Length, and Level of Service Approach NB SB Westbound Eastbound Movement Lane Config LT LR v (vph) C(m) (vph) v/c % queue length Control Delay LOS A B Approach Delay 12.3 Approach LOS B
119 HCS+: Unsignalized Intersections Release 5.6 Phone: Fax: TWO-WAY STOP CONTROL(TWSC) ANALYSIS Analyst: HDR Agency/Co.: SDDOT Date Performed: 1/2014 Analysis Time Period: PM PEAK Intersection: TIMBERLINE RD. Jurisdiction: MINNEHAHA CO. Units: U. S. Customary Analysis Year: Project ID: I-90/SD 100 IMJR East/West Street: 60TH ST. N. North/South Street: TIMBERLINE RD. Intersection Orientation: NS Study period (hrs): 1.00 Vehicle Volumes and Adjustments Major Street Movements L T R L T R Volume Peak-Hour Factor, PHF Peak-15 Minute Volume Hourly Flow Rate, HFR Percent Heavy Vehicles Median Type/Storage Undivided / RT Channelized? Lanes Configuration LT TR Upstream Signal? No No Minor Street Movements L T R L T R Volume Peak Hour Factor, PHF Peak-15 Minute Volume Hourly Flow Rate, HFR Percent Heavy Vehicles 4 4 Percent Grade (%) 2 0 Flared Approach: Exists?/Storage / No / RT Channelized? Lanes 0 0 Configuration LR Pedestrian Volumes and Adjustments Movements Flow (ped/hr)
120 Lane Width (ft) Walking Speed (ft/sec) Percent Blockage Upstream Signal Data Prog. Sat Arrival Green Cycle Prog. Distance Flow Flow Type Time Length Speed to Signal vph vph sec sec mph feet S2 Left-Turn Through S5 Left-Turn Through Worksheet 3-Data for Computing Effect of Delay to Major Street Vehicles Movement 2 Movement 5 Shared ln volume, major th vehicles: 143 Shared ln volume, major rt vehicles: 0 Sat flow rate, major th vehicles: 1700 Sat flow rate, major rt vehicles: 1700 Number of major street through lanes: 1 Worksheet 4-Critical Gap and Follow-up Time Calculation Critical Gap Calculation Movement L L L T R L T R t(c,base) t(c,hv) P(hv) t(c,g) Percent Grade t(3,lt) t(c,t): 1-stage stage t(c) 1-stage stage Follow-Up Time Calculations Movement L L L T R L T R t(f,base) t(f,hv) P(HV) t(f) Worksheet 5-Effect of Upstream Signals Computation 1-Queue Clearance Time at Upstream Signal Movement 2 Movement 5 V(t) V(l,prot) V(t) V(l,prot) V prog
121 Total Saturation Flow Rate, s (vph) Arrival Type Effective Green, g (sec) Cycle Length, C (sec) Rp (from Exhibit 16-11) Proportion vehicles arriving on green P g(q1) g(q2) g(q) Computation 2-Proportion of TWSC Intersection Time blocked Movement 2 Movement 5 V(t) V(l,prot) V(t) V(l,prot) alpha beta Travel time, t(a) (sec) Smoothing Factor, F Proportion of conflicting flow, f Max platooned flow, V(c,max) Min platooned flow, V(c,min) Duration of blocked period, t(p) Proportion time blocked, p Computation 3-Platoon Event Periods Result p(2) p(5) p(dom) p(subo) Constrained or unconstrained? Proportion unblocked (1) (2) (3) for minor Single-stage Two-Stage Process movements, p(x) Process Stage I Stage II p(1) p(4) p(7) p(8) p(9) p(10) p(11) p(12) Computation 4 and 5 Single-Stage Process Movement L L L T R L T R V c,x s Px V c,u,x C r,x C plat,x Two-Stage Process
122 Stage1 Stage2 Stage1 Stage2 Stage1 Stage2 Stage1 Stage2 V(c,x) s 1500 P(x) V(c,u,x) C(r,x) C(plat,x) Worksheet 6-Impedance and Capacity Equations Step 1: RT from Minor St Conflicting Flows 182 Potential Capacity 855 Pedestrian Impedance Factor Movement Capacity 855 Probability of Queue free St Step 2: LT from Major St. 4 1 Conflicting Flows 189 Potential Capacity 1367 Pedestrian Impedance Factor Movement Capacity 1367 Probability of Queue free St Maj L-Shared Prob Q free St Step 3: TH from Minor St Conflicting Flows Potential Capacity Pedestrian Impedance Factor Cap. Adj. factor due to Impeding mvmnt Movement Capacity Probability of Queue free St Step 4: LT from Minor St Conflicting Flows 407 Potential Capacity 596 Pedestrian Impedance Factor Maj. L, Min T Impedance factor 0.97 Maj. L, Min T Adj. Imp Factor Cap. Adj. factor due to Impeding mvmnt Movement Capacity 578 Worksheet 7-Computation of the Effect of Two-stage Gap Acceptance Step 3: TH from Minor St Part 1 - First Stage Conflicting Flows Potential Capacity Pedestrian Impedance Factor Cap. Adj. factor due to Impeding mvmnt Movement Capacity Probability of Queue free St.
123 Part 2 - Second Stage Conflicting Flows Potential Capacity Pedestrian Impedance Factor Cap. Adj. factor due to Impeding mvmnt Movement Capacity Part 3 - Single Stage Conflicting Flows Potential Capacity Pedestrian Impedance Factor Cap. Adj. factor due to Impeding mvmnt Movement Capacity Result for 2 stage process: a y C t Probability of Queue free St Step 4: LT from Minor St Part 1 - First Stage Conflicting Flows Potential Capacity Pedestrian Impedance Factor Cap. Adj. factor due to Impeding mvmnt Movement Capacity Part 2 - Second Stage Conflicting Flows Potential Capacity Pedestrian Impedance Factor Cap. Adj. factor due to Impeding mvmnt Movement Capacity Part 3 - Single Stage Conflicting Flows 407 Potential Capacity 596 Pedestrian Impedance Factor Maj. L, Min T Impedance factor 0.97 Maj. L, Min T Adj. Imp Factor Cap. Adj. factor due to Impeding mvmnt Movement Capacity 578 Results for Two-stage process: a y C t 578 Worksheet 8-Shared Lane Calculations Movement L T R L T R Volume (vph) Movement Capacity (vph) Shared Lane Capacity (vph) 756
124 Worksheet 9-Computation of Effect of Flared Minor Street Approaches Movement L T R L T R C sep Volume Delay Q sep Q sep +1 round (Qsep +1) n max C sh 756 SUM C sep n C act Worksheet 10-Delay, Queue Length, and Level of Service Movement Lane Config LT LR v (vph) C(m) (vph) v/c % queue length Control Delay LOS A B Approach Delay 12.3 Approach LOS B Worksheet 11-Shared Major LT Impedance and Delay Movement 2 Movement 5 p(oj) v(il), Volume for stream 2 or v(i2), Volume for stream 3 or 6 0 s(il), Saturation flow rate for stream 2 or s(i2), Saturation flow rate for stream 3 or P*(oj) 0.97 d(m,lt), Delay for stream 1 or N, Number of major street through lanes 1 d(rank,1) Delay for stream 2 or 5 0.3
125 HCS+: Unsignalized Intersections Release 5.6 TWO-WAY STOP CONTROL SUMMARY Analyst: HDR Agency/Co.: SDDOT Date Performed: 1/2014 Analysis Time Period: AM PEAK Intersection: TIMBERLINE RD. Jurisdiction: MINNEHAHA CO. Units: U. S. Customary Analysis Year: Existing Project ID: I-90/Timberline IMJR East/West Street: I-90 EB North/South Street: TIMBERLINE RD. Intersection Orientation: NS Study period (hrs): 1.00 Vehicle Volumes and Adjustments Major Street: Approach Northbound Southbound Movement L T R L T R Volume Peak-Hour Factor, PHF Hourly Flow Rate, HFR Percent Heavy Vehicles Median Type/Storage Undivided / RT Channelized? Lanes Configuration TR LT Upstream Signal? No No Minor Street: Approach Westbound Eastbound Movement L T R L T R Volume Peak Hour Factor, PHF Hourly Flow Rate, HFR Percent Heavy Vehicles 1 1 Percent Grade (%) 2 2 Flared Approach: Exists?/Storage / No / Lanes 0 0 Configuration LR Delay, Queue Length, and Level of Service Approach NB SB Westbound Eastbound Movement Lane Config LT LR v (vph) 1 91 C(m) (vph) v/c % queue length Control Delay LOS A B Approach Delay 11.2 Approach LOS B
126 HCS+: Unsignalized Intersections Release 5.6 Phone: Fax: TWO-WAY STOP CONTROL(TWSC) ANALYSIS Analyst: HDR Agency/Co.: SDDOT Date Performed: 1/2014 Analysis Time Period: AM PEAK Intersection: TIMBERLINE RD. Jurisdiction: MINNEHAHA CO. Units: U. S. Customary Analysis Year: Existing Project ID: I-90/Timberline IMJR East/West Street: I-90 EB North/South Street: TIMBERLINE RD. Intersection Orientation: NS Study period (hrs): 1.00 Vehicle Volumes and Adjustments Major Street Movements L T R L T R Volume Peak-Hour Factor, PHF Peak-15 Minute Volume Hourly Flow Rate, HFR Percent Heavy Vehicles Median Type/Storage Undivided / RT Channelized? Lanes Configuration TR LT Upstream Signal? No No Minor Street Movements L T R L T R Volume Peak Hour Factor, PHF Peak-15 Minute Volume 19 4 Hourly Flow Rate, HFR Percent Heavy Vehicles 1 1 Percent Grade (%) 2 2 Flared Approach: Exists?/Storage / No / RT Channelized? Lanes 0 0 Configuration LR Pedestrian Volumes and Adjustments Movements Flow (ped/hr)
127 Lane Width (ft) Walking Speed (ft/sec) Percent Blockage Upstream Signal Data Prog. Sat Arrival Green Cycle Prog. Distance Flow Flow Type Time Length Speed to Signal vph vph sec sec mph feet S2 Left-Turn Through S5 Left-Turn Through Worksheet 3-Data for Computing Effect of Delay to Major Street Vehicles Movement 2 Movement 5 Shared ln volume, major th vehicles: 160 Shared ln volume, major rt vehicles: 0 Sat flow rate, major th vehicles: 1700 Sat flow rate, major rt vehicles: 1700 Number of major street through lanes: 1 Worksheet 4-Critical Gap and Follow-up Time Calculation Critical Gap Calculation Movement L L L T R L T R t(c,base) t(c,hv) P(hv) t(c,g) Percent Grade t(3,lt) t(c,t): 1-stage stage t(c) 1-stage stage Follow-Up Time Calculations Movement L L L T R L T R t(f,base) t(f,hv) P(HV) t(f) Worksheet 5-Effect of Upstream Signals Computation 1-Queue Clearance Time at Upstream Signal Movement 2 Movement 5 V(t) V(l,prot) V(t) V(l,prot) V prog
128 Total Saturation Flow Rate, s (vph) Arrival Type Effective Green, g (sec) Cycle Length, C (sec) Rp (from Exhibit 16-11) Proportion vehicles arriving on green P g(q1) g(q2) g(q) Computation 2-Proportion of TWSC Intersection Time blocked Movement 2 Movement 5 V(t) V(l,prot) V(t) V(l,prot) alpha beta Travel time, t(a) (sec) Smoothing Factor, F Proportion of conflicting flow, f Max platooned flow, V(c,max) Min platooned flow, V(c,min) Duration of blocked period, t(p) Proportion time blocked, p Computation 3-Platoon Event Periods Result p(2) p(5) p(dom) p(subo) Constrained or unconstrained? Proportion unblocked (1) (2) (3) for minor Single-stage Two-Stage Process movements, p(x) Process Stage I Stage II p(1) p(4) p(7) p(8) p(9) p(10) p(11) p(12) Computation 4 and 5 Single-Stage Process Movement L L L T R L T R V c,x s Px V c,u,x C r,x C plat,x Two-Stage Process
129 Stage1 Stage2 Stage1 Stage2 Stage1 Stage2 Stage1 Stage2 V(c,x) s 1500 P(x) V(c,u,x) C(r,x) C(plat,x) Worksheet 6-Impedance and Capacity Equations Step 1: RT from Minor St Conflicting Flows 160 Potential Capacity 880 Pedestrian Impedance Factor Movement Capacity 880 Probability of Queue free St Step 2: LT from Major St. 4 1 Conflicting Flows 179 Potential Capacity 1379 Pedestrian Impedance Factor Movement Capacity 1379 Probability of Queue free St Maj L-Shared Prob Q free St Step 3: TH from Minor St Conflicting Flows Potential Capacity Pedestrian Impedance Factor Cap. Adj. factor due to Impeding mvmnt Movement Capacity Probability of Queue free St Step 4: LT from Minor St Conflicting Flows 330 Potential Capacity 643 Pedestrian Impedance Factor Maj. L, Min T Impedance factor 1.00 Maj. L, Min T Adj. Imp Factor Cap. Adj. factor due to Impeding mvmnt Movement Capacity 643 Worksheet 7-Computation of the Effect of Two-stage Gap Acceptance Step 3: TH from Minor St Part 1 - First Stage Conflicting Flows Potential Capacity Pedestrian Impedance Factor Cap. Adj. factor due to Impeding mvmnt Movement Capacity Probability of Queue free St.
130 Part 2 - Second Stage Conflicting Flows Potential Capacity Pedestrian Impedance Factor Cap. Adj. factor due to Impeding mvmnt Movement Capacity Part 3 - Single Stage Conflicting Flows Potential Capacity Pedestrian Impedance Factor Cap. Adj. factor due to Impeding mvmnt Movement Capacity Result for 2 stage process: a y C t Probability of Queue free St Step 4: LT from Minor St Part 1 - First Stage Conflicting Flows Potential Capacity Pedestrian Impedance Factor Cap. Adj. factor due to Impeding mvmnt Movement Capacity Part 2 - Second Stage Conflicting Flows Potential Capacity Pedestrian Impedance Factor Cap. Adj. factor due to Impeding mvmnt Movement Capacity Part 3 - Single Stage Conflicting Flows 330 Potential Capacity 643 Pedestrian Impedance Factor Maj. L, Min T Impedance factor 1.00 Maj. L, Min T Adj. Imp Factor Cap. Adj. factor due to Impeding mvmnt Movement Capacity 643 Results for Two-stage process: a y C t 643 Worksheet 8-Shared Lane Calculations Movement L T R L T R Volume (vph) Movement Capacity (vph) Shared Lane Capacity (vph) 673
131 Worksheet 9-Computation of Effect of Flared Minor Street Approaches Movement L T R L T R C sep Volume Delay Q sep Q sep +1 round (Qsep +1) n max C sh 673 SUM C sep n C act Worksheet 10-Delay, Queue Length, and Level of Service Movement Lane Config LT LR v (vph) 1 91 C(m) (vph) v/c % queue length Control Delay LOS A B Approach Delay 11.2 Approach LOS B Worksheet 11-Shared Major LT Impedance and Delay Movement 2 Movement 5 p(oj) v(il), Volume for stream 2 or v(i2), Volume for stream 3 or 6 0 s(il), Saturation flow rate for stream 2 or s(i2), Saturation flow rate for stream 3 or P*(oj) 1.00 d(m,lt), Delay for stream 1 or N, Number of major street through lanes 1 d(rank,1) Delay for stream 2 or 5 0.0
132 HCS+: Unsignalized Intersections Release 5.6 TWO-WAY STOP CONTROL SUMMARY Analyst: HDR Agency/Co.: SDDOT Date Performed: 1/2014 Analysis Time Period: PM PEAK Intersection: TIMBERLINE RD. Jurisdiction: MINNEHAHA CO. Units: U. S. Customary Analysis Year: Existing Project ID: I-90/Timberline IMJR East/West Street: I-90 EB North/South Street: TIMBERLINE RD. Intersection Orientation: NS Study period (hrs): 1.00 Vehicle Volumes and Adjustments Major Street: Approach Northbound Southbound Movement L T R L T R Volume Peak-Hour Factor, PHF Hourly Flow Rate, HFR Percent Heavy Vehicles Median Type/Storage Undivided / RT Channelized? Lanes Configuration TR LT Upstream Signal? No No Minor Street: Approach Westbound Eastbound Movement L T R L T R Volume Peak Hour Factor, PHF Hourly Flow Rate, HFR Percent Heavy Vehicles 4 4 Percent Grade (%) 2 2 Flared Approach: Exists?/Storage / No / Lanes 0 0 Configuration LR Delay, Queue Length, and Level of Service Approach NB SB Westbound Eastbound Movement Lane Config LT LR v (vph) C(m) (vph) v/c % queue length Control Delay LOS A B Approach Delay 11.1 Approach LOS B
133 HCS+: Unsignalized Intersections Release 5.6 Phone: Fax: TWO-WAY STOP CONTROL(TWSC) ANALYSIS Analyst: HDR Agency/Co.: SDDOT Date Performed: 1/2014 Analysis Time Period: PM PEAK Intersection: TIMBERLINE RD. Jurisdiction: MINNEHAHA CO. Units: U. S. Customary Analysis Year: Existing Project ID: I-90/Timberline IMJR East/West Street: I-90 EB North/South Street: TIMBERLINE RD. Intersection Orientation: NS Study period (hrs): 1.00 Vehicle Volumes and Adjustments Major Street Movements L T R L T R Volume Peak-Hour Factor, PHF Peak-15 Minute Volume Hourly Flow Rate, HFR Percent Heavy Vehicles Median Type/Storage Undivided / RT Channelized? Lanes Configuration TR LT Upstream Signal? No No Minor Street Movements L T R L T R Volume Peak Hour Factor, PHF Peak-15 Minute Volume Hourly Flow Rate, HFR Percent Heavy Vehicles 4 4 Percent Grade (%) 2 2 Flared Approach: Exists?/Storage / No / RT Channelized? Lanes 0 0 Configuration LR Pedestrian Volumes and Adjustments Movements Flow (ped/hr)
134 Lane Width (ft) Walking Speed (ft/sec) Percent Blockage Upstream Signal Data Prog. Sat Arrival Green Cycle Prog. Distance Flow Flow Type Time Length Speed to Signal vph vph sec sec mph feet S2 Left-Turn Through S5 Left-Turn Through Worksheet 3-Data for Computing Effect of Delay to Major Street Vehicles Movement 2 Movement 5 Shared ln volume, major th vehicles: 128 Shared ln volume, major rt vehicles: 0 Sat flow rate, major th vehicles: 1700 Sat flow rate, major rt vehicles: 1700 Number of major street through lanes: 1 Worksheet 4-Critical Gap and Follow-up Time Calculation Critical Gap Calculation Movement L L L T R L T R t(c,base) t(c,hv) P(hv) t(c,g) Percent Grade t(3,lt) t(c,t): 1-stage stage t(c) 1-stage stage Follow-Up Time Calculations Movement L L L T R L T R t(f,base) t(f,hv) P(HV) t(f) Worksheet 5-Effect of Upstream Signals Computation 1-Queue Clearance Time at Upstream Signal Movement 2 Movement 5 V(t) V(l,prot) V(t) V(l,prot) V prog
135 Total Saturation Flow Rate, s (vph) Arrival Type Effective Green, g (sec) Cycle Length, C (sec) Rp (from Exhibit 16-11) Proportion vehicles arriving on green P g(q1) g(q2) g(q) Computation 2-Proportion of TWSC Intersection Time blocked Movement 2 Movement 5 V(t) V(l,prot) V(t) V(l,prot) alpha beta Travel time, t(a) (sec) Smoothing Factor, F Proportion of conflicting flow, f Max platooned flow, V(c,max) Min platooned flow, V(c,min) Duration of blocked period, t(p) Proportion time blocked, p Computation 3-Platoon Event Periods Result p(2) p(5) p(dom) p(subo) Constrained or unconstrained? Proportion unblocked (1) (2) (3) for minor Single-stage Two-Stage Process movements, p(x) Process Stage I Stage II p(1) p(4) p(7) p(8) p(9) p(10) p(11) p(12) Computation 4 and 5 Single-Stage Process Movement L L L T R L T R V c,x s Px V c,u,x C r,x C plat,x Two-Stage Process
136 Stage1 Stage2 Stage1 Stage2 Stage1 Stage2 Stage1 Stage2 V(c,x) s 1500 P(x) V(c,u,x) C(r,x) C(plat,x) Worksheet 6-Impedance and Capacity Equations Step 1: RT from Minor St Conflicting Flows 128 Potential Capacity 910 Pedestrian Impedance Factor Movement Capacity 910 Probability of Queue free St Step 2: LT from Major St. 4 1 Conflicting Flows 211 Potential Capacity 1342 Pedestrian Impedance Factor Movement Capacity 1342 Probability of Queue free St Maj L-Shared Prob Q free St Step 3: TH from Minor St Conflicting Flows Potential Capacity Pedestrian Impedance Factor Cap. Adj. factor due to Impeding mvmnt Movement Capacity Probability of Queue free St Step 4: LT from Minor St Conflicting Flows 337 Potential Capacity 630 Pedestrian Impedance Factor Maj. L, Min T Impedance factor 0.98 Maj. L, Min T Adj. Imp Factor Cap. Adj. factor due to Impeding mvmnt Movement Capacity 620 Worksheet 7-Computation of the Effect of Two-stage Gap Acceptance Step 3: TH from Minor St Part 1 - First Stage Conflicting Flows Potential Capacity Pedestrian Impedance Factor Cap. Adj. factor due to Impeding mvmnt Movement Capacity Probability of Queue free St.
137 Part 2 - Second Stage Conflicting Flows Potential Capacity Pedestrian Impedance Factor Cap. Adj. factor due to Impeding mvmnt Movement Capacity Part 3 - Single Stage Conflicting Flows Potential Capacity Pedestrian Impedance Factor Cap. Adj. factor due to Impeding mvmnt Movement Capacity Result for 2 stage process: a y C t Probability of Queue free St Step 4: LT from Minor St Part 1 - First Stage Conflicting Flows Potential Capacity Pedestrian Impedance Factor Cap. Adj. factor due to Impeding mvmnt Movement Capacity Part 2 - Second Stage Conflicting Flows Potential Capacity Pedestrian Impedance Factor Cap. Adj. factor due to Impeding mvmnt Movement Capacity Part 3 - Single Stage Conflicting Flows 337 Potential Capacity 630 Pedestrian Impedance Factor Maj. L, Min T Impedance factor 0.98 Maj. L, Min T Adj. Imp Factor Cap. Adj. factor due to Impeding mvmnt Movement Capacity 620 Results for Two-stage process: a y C t 620 Worksheet 8-Shared Lane Calculations Movement L T R L T R Volume (vph) Movement Capacity (vph) Shared Lane Capacity (vph) 725
138 Worksheet 9-Computation of Effect of Flared Minor Street Approaches Movement L T R L T R C sep Volume Delay Q sep Q sep +1 round (Qsep +1) n max C sh 725 SUM C sep n C act Worksheet 10-Delay, Queue Length, and Level of Service Movement Lane Config LT LR v (vph) C(m) (vph) v/c % queue length Control Delay LOS A B Approach Delay 11.1 Approach LOS B Worksheet 11-Shared Major LT Impedance and Delay Movement 2 Movement 5 p(oj) v(il), Volume for stream 2 or v(i2), Volume for stream 3 or 6 0 s(il), Saturation flow rate for stream 2 or s(i2), Saturation flow rate for stream 3 or P*(oj) 0.98 d(m,lt), Delay for stream 1 or N, Number of major street through lanes 1 d(rank,1) Delay for stream 2 or 5 0.1
139 HCS+: Unsignalized Intersections Release 5.6 TWO-WAY STOP CONTROL SUMMARY Analyst: HDR Agency/Co.: SDDOT Date Performed: 1/2014 Analysis Time Period: AM PEAK Intersection: TIMBERLINE RD. Jurisdiction: MINNEHAHA CO. Units: U. S. Customary Analysis Year: Existing Project ID: I-90/Timberline IMJR East/West Street: I-90 WB North/South Street: TIMBERLINE RD. Intersection Orientation: NS Study period (hrs): 1.00 Vehicle Volumes and Adjustments Major Street: Approach Northbound Southbound Movement L T R L T R Volume Peak-Hour Factor, PHF Hourly Flow Rate, HFR Percent Heavy Vehicles Median Type/Storage Undivided / RT Channelized? Lanes Configuration LT TR Upstream Signal? No No Minor Street: Approach Westbound Eastbound Movement L T R L T R Volume 81 7 Peak Hour Factor, PHF Hourly Flow Rate, HFR Percent Heavy Vehicles Percent Grade (%) 2 0 Flared Approach: Exists?/Storage Yes /50 / Lanes 0 0 Configuration LR Delay, Queue Length, and Level of Service Approach NB SB Westbound Eastbound Movement Lane Config LT LR v (vph) C(m) (vph) v/c % queue length Control Delay LOS A B Approach Delay 14.0 Approach LOS B
140 HCS+: Unsignalized Intersections Release 5.6 Phone: Fax: TWO-WAY STOP CONTROL(TWSC) ANALYSIS Analyst: HDR Agency/Co.: SDDOT Date Performed: 1/2014 Analysis Time Period: AM PEAK Intersection: TIMBERLINE RD. Jurisdiction: MINNEHAHA CO. Units: U. S. Customary Analysis Year: Existing Project ID: I-90/Timberline IMJR East/West Street: I-90 WB North/South Street: TIMBERLINE RD. Intersection Orientation: NS Study period (hrs): 1.00 Vehicle Volumes and Adjustments Major Street Movements L T R L T R Volume Peak-Hour Factor, PHF Peak-15 Minute Volume Hourly Flow Rate, HFR Percent Heavy Vehicles Median Type/Storage Undivided / RT Channelized? Lanes Configuration LT TR Upstream Signal? No No Minor Street Movements L T R L T R Volume 81 7 Peak Hour Factor, PHF Peak-15 Minute Volume 29 2 Hourly Flow Rate, HFR Percent Heavy Vehicles Percent Grade (%) 2 0 Flared Approach: Exists?/Storage Yes /50 / RT Channelized? Lanes 0 0 Configuration LR Pedestrian Volumes and Adjustments Movements Flow (ped/hr)
141 Lane Width (ft) Walking Speed (ft/sec) Percent Blockage Upstream Signal Data Prog. Sat Arrival Green Cycle Prog. Distance Flow Flow Type Time Length Speed to Signal vph vph sec sec mph feet S2 Left-Turn Through S5 Left-Turn Through Worksheet 3-Data for Computing Effect of Delay to Major Street Vehicles Movement 2 Movement 5 Shared ln volume, major th vehicles: 153 Shared ln volume, major rt vehicles: 0 Sat flow rate, major th vehicles: 1700 Sat flow rate, major rt vehicles: 1700 Number of major street through lanes: 1 Worksheet 4-Critical Gap and Follow-up Time Calculation Critical Gap Calculation Movement L L L T R L T R t(c,base) t(c,hv) P(hv) t(c,g) Percent Grade t(3,lt) t(c,t): 1-stage stage t(c) 1-stage stage Follow-Up Time Calculations Movement L L L T R L T R t(f,base) t(f,hv) P(HV) t(f) Worksheet 5-Effect of Upstream Signals Computation 1-Queue Clearance Time at Upstream Signal Movement 2 Movement 5 V(t) V(l,prot) V(t) V(l,prot) V prog
142 Total Saturation Flow Rate, s (vph) Arrival Type Effective Green, g (sec) Cycle Length, C (sec) Rp (from Exhibit 16-11) Proportion vehicles arriving on green P g(q1) g(q2) g(q) Computation 2-Proportion of TWSC Intersection Time blocked Movement 2 Movement 5 V(t) V(l,prot) V(t) V(l,prot) alpha beta Travel time, t(a) (sec) Smoothing Factor, F Proportion of conflicting flow, f Max platooned flow, V(c,max) Min platooned flow, V(c,min) Duration of blocked period, t(p) Proportion time blocked, p Computation 3-Platoon Event Periods Result p(2) p(5) p(dom) p(subo) Constrained or unconstrained? Proportion unblocked (1) (2) (3) for minor Single-stage Two-Stage Process movements, p(x) Process Stage I Stage II p(1) p(4) p(7) p(8) p(9) p(10) p(11) p(12) Computation 4 and 5 Single-Stage Process Movement L L L T R L T R V c,x s Px V c,u,x C r,x C plat,x Two-Stage Process
143 Stage1 Stage2 Stage1 Stage2 Stage1 Stage2 Stage1 Stage2 V(c,x) s 1500 P(x) V(c,u,x) C(r,x) C(plat,x) Worksheet 6-Impedance and Capacity Equations Step 1: RT from Minor St Conflicting Flows 153 Potential Capacity 863 Pedestrian Impedance Factor Movement Capacity 863 Probability of Queue free St Step 2: LT from Major St. 4 1 Conflicting Flows 147 Potential Capacity 1417 Pedestrian Impedance Factor Movement Capacity 1417 Probability of Queue free St Maj L-Shared Prob Q free St Step 3: TH from Minor St Conflicting Flows Potential Capacity Pedestrian Impedance Factor Cap. Adj. factor due to Impeding mvmnt Movement Capacity Probability of Queue free St Step 4: LT from Minor St Conflicting Flows 441 Potential Capacity 531 Pedestrian Impedance Factor Maj. L, Min T Impedance factor 0.93 Maj. L, Min T Adj. Imp Factor Cap. Adj. factor due to Impeding mvmnt Movement Capacity 499 Worksheet 7-Computation of the Effect of Two-stage Gap Acceptance Step 3: TH from Minor St Part 1 - First Stage Conflicting Flows Potential Capacity Pedestrian Impedance Factor Cap. Adj. factor due to Impeding mvmnt Movement Capacity Probability of Queue free St.
144 Part 2 - Second Stage Conflicting Flows Potential Capacity Pedestrian Impedance Factor Cap. Adj. factor due to Impeding mvmnt Movement Capacity Part 3 - Single Stage Conflicting Flows Potential Capacity Pedestrian Impedance Factor Cap. Adj. factor due to Impeding mvmnt Movement Capacity Result for 2 stage process: a y C t Probability of Queue free St Step 4: LT from Minor St Part 1 - First Stage Conflicting Flows Potential Capacity Pedestrian Impedance Factor Cap. Adj. factor due to Impeding mvmnt Movement Capacity Part 2 - Second Stage Conflicting Flows Potential Capacity Pedestrian Impedance Factor Cap. Adj. factor due to Impeding mvmnt Movement Capacity Part 3 - Single Stage Conflicting Flows 441 Potential Capacity 531 Pedestrian Impedance Factor Maj. L, Min T Impedance factor 0.93 Maj. L, Min T Adj. Imp Factor Cap. Adj. factor due to Impeding mvmnt Movement Capacity 499 Results for Two-stage process: a y C t 499 Worksheet 8-Shared Lane Calculations Movement L T R L T R Volume (vph) Movement Capacity (vph) Shared Lane Capacity (vph) 515
145 Worksheet 9-Computation of Effect of Flared Minor Street Approaches Movement L T R L T R C sep Volume Delay Q sep Q sep round (Qsep +1) 1 1 n max 1 C sh 515 SUM C sep 538 n 50 C act 538 Worksheet 10-Delay, Queue Length, and Level of Service Movement Lane Config LT LR v (vph) C(m) (vph) v/c % queue length Control Delay LOS A B Approach Delay 14.0 Approach LOS B Worksheet 11-Shared Major LT Impedance and Delay Movement 2 Movement 5 p(oj) v(il), Volume for stream 2 or v(i2), Volume for stream 3 or 6 0 s(il), Saturation flow rate for stream 2 or s(i2), Saturation flow rate for stream 3 or P*(oj) 0.93 d(m,lt), Delay for stream 1 or N, Number of major street through lanes 1 d(rank,1) Delay for stream 2 or 5 0.5
146 HCS+: Unsignalized Intersections Release 5.6 TWO-WAY STOP CONTROL SUMMARY Analyst: HDR Agency/Co.: SDDOT Date Performed: 1/2014 Analysis Time Period: PM PEAK Intersection: TIMBERLINE RD. Jurisdiction: MINNEHAHA CO. Units: U. S. Customary Analysis Year: Project ID: I-90/Timberline IMJR East/West Street: I-90 WB North/South Street: TIMBERLINE RD. Intersection Orientation: NS Study period (hrs): 1.00 Vehicle Volumes and Adjustments Major Street: Approach Northbound Southbound Movement L T R L T R Volume Peak-Hour Factor, PHF Hourly Flow Rate, HFR Percent Heavy Vehicles Median Type/Storage Undivided / RT Channelized? Lanes Configuration LT TR Upstream Signal? No No Minor Street: Approach Westbound Eastbound Movement L T R L T R Volume 23 5 Peak Hour Factor, PHF Hourly Flow Rate, HFR 29 6 Percent Heavy Vehicles 8 8 Percent Grade (%) 2 0 Flared Approach: Exists?/Storage Yes /50 / Lanes 0 0 Configuration LR Delay, Queue Length, and Level of Service Approach NB SB Westbound Eastbound Movement Lane Config LT LR v (vph) C(m) (vph) v/c % queue length Control Delay LOS A B Approach Delay 11.2 Approach LOS B
147 HCS+: Unsignalized Intersections Release 5.6 Phone: Fax: TWO-WAY STOP CONTROL(TWSC) ANALYSIS Analyst: HDR Agency/Co.: SDDOT Date Performed: 1/2014 Analysis Time Period: PM PEAK Intersection: TIMBERLINE RD. Jurisdiction: MINNEHAHA CO. Units: U. S. Customary Analysis Year: Project ID: I-90/Timberline IMJR East/West Street: I-90 WB North/South Street: TIMBERLINE RD. Intersection Orientation: NS Study period (hrs): 1.00 Vehicle Volumes and Adjustments Major Street Movements L T R L T R Volume Peak-Hour Factor, PHF Peak-15 Minute Volume Hourly Flow Rate, HFR Percent Heavy Vehicles Median Type/Storage Undivided / RT Channelized? Lanes Configuration LT TR Upstream Signal? No No Minor Street Movements L T R L T R Volume 23 5 Peak Hour Factor, PHF Peak-15 Minute Volume 7 2 Hourly Flow Rate, HFR 29 6 Percent Heavy Vehicles 8 8 Percent Grade (%) 2 0 Flared Approach: Exists?/Storage Yes /50 / RT Channelized? Lanes 0 0 Configuration LR Pedestrian Volumes and Adjustments Movements Flow (ped/hr)
148 Lane Width (ft) Walking Speed (ft/sec) Percent Blockage Upstream Signal Data Prog. Sat Arrival Green Cycle Prog. Distance Flow Flow Type Time Length Speed to Signal vph vph sec sec mph feet S2 Left-Turn Through S5 Left-Turn Through Worksheet 3-Data for Computing Effect of Delay to Major Street Vehicles Movement 2 Movement 5 Shared ln volume, major th vehicles: 140 Shared ln volume, major rt vehicles: 0 Sat flow rate, major th vehicles: 1700 Sat flow rate, major rt vehicles: 1700 Number of major street through lanes: 1 Worksheet 4-Critical Gap and Follow-up Time Calculation Critical Gap Calculation Movement L L L T R L T R t(c,base) t(c,hv) P(hv) t(c,g) Percent Grade t(3,lt) t(c,t): 1-stage stage t(c) 1-stage stage Follow-Up Time Calculations Movement L L L T R L T R t(f,base) t(f,hv) P(HV) t(f) Worksheet 5-Effect of Upstream Signals Computation 1-Queue Clearance Time at Upstream Signal Movement 2 Movement 5 V(t) V(l,prot) V(t) V(l,prot) V prog
149 Total Saturation Flow Rate, s (vph) Arrival Type Effective Green, g (sec) Cycle Length, C (sec) Rp (from Exhibit 16-11) Proportion vehicles arriving on green P g(q1) g(q2) g(q) Computation 2-Proportion of TWSC Intersection Time blocked Movement 2 Movement 5 V(t) V(l,prot) V(t) V(l,prot) alpha beta Travel time, t(a) (sec) Smoothing Factor, F Proportion of conflicting flow, f Max platooned flow, V(c,max) Min platooned flow, V(c,min) Duration of blocked period, t(p) Proportion time blocked, p Computation 3-Platoon Event Periods Result p(2) p(5) p(dom) p(subo) Constrained or unconstrained? Proportion unblocked (1) (2) (3) for minor Single-stage Two-Stage Process movements, p(x) Process Stage I Stage II p(1) p(4) p(7) p(8) p(9) p(10) p(11) p(12) Computation 4 and 5 Single-Stage Process Movement L L L T R L T R V c,x s Px V c,u,x C r,x C plat,x Two-Stage Process
150 Stage1 Stage2 Stage1 Stage2 Stage1 Stage2 Stage1 Stage2 V(c,x) s 1500 P(x) V(c,u,x) C(r,x) C(plat,x) Worksheet 6-Impedance and Capacity Equations Step 1: RT from Minor St Conflicting Flows 140 Potential Capacity 885 Pedestrian Impedance Factor Movement Capacity 885 Probability of Queue free St Step 2: LT from Major St. 4 1 Conflicting Flows 243 Potential Capacity 1306 Pedestrian Impedance Factor Movement Capacity 1306 Probability of Queue free St Maj L-Shared Prob Q free St Step 3: TH from Minor St Conflicting Flows Potential Capacity Pedestrian Impedance Factor Cap. Adj. factor due to Impeding mvmnt Movement Capacity Probability of Queue free St Step 4: LT from Minor St Conflicting Flows 382 Potential Capacity 584 Pedestrian Impedance Factor Maj. L, Min T Impedance factor 0.98 Maj. L, Min T Adj. Imp Factor Cap. Adj. factor due to Impeding mvmnt Movement Capacity 572 Worksheet 7-Computation of the Effect of Two-stage Gap Acceptance Step 3: TH from Minor St Part 1 - First Stage Conflicting Flows Potential Capacity Pedestrian Impedance Factor Cap. Adj. factor due to Impeding mvmnt Movement Capacity Probability of Queue free St.
151 Part 2 - Second Stage Conflicting Flows Potential Capacity Pedestrian Impedance Factor Cap. Adj. factor due to Impeding mvmnt Movement Capacity Part 3 - Single Stage Conflicting Flows Potential Capacity Pedestrian Impedance Factor Cap. Adj. factor due to Impeding mvmnt Movement Capacity Result for 2 stage process: a y C t Probability of Queue free St Step 4: LT from Minor St Part 1 - First Stage Conflicting Flows Potential Capacity Pedestrian Impedance Factor Cap. Adj. factor due to Impeding mvmnt Movement Capacity Part 2 - Second Stage Conflicting Flows Potential Capacity Pedestrian Impedance Factor Cap. Adj. factor due to Impeding mvmnt Movement Capacity Part 3 - Single Stage Conflicting Flows 382 Potential Capacity 584 Pedestrian Impedance Factor Maj. L, Min T Impedance factor 0.98 Maj. L, Min T Adj. Imp Factor Cap. Adj. factor due to Impeding mvmnt Movement Capacity 572 Results for Two-stage process: a y C t 572 Worksheet 8-Shared Lane Calculations Movement L T R L T R Volume (vph) 29 6 Movement Capacity (vph) Shared Lane Capacity (vph) 609
152 Worksheet 9-Computation of Effect of Flared Minor Street Approaches Movement L T R L T R C sep Volume 29 6 Delay Q sep Q sep round (Qsep +1) 1 1 n max 1 C sh 609 SUM C sep 690 n 50 C act 690 Worksheet 10-Delay, Queue Length, and Level of Service Movement Lane Config LT LR v (vph) C(m) (vph) v/c % queue length Control Delay LOS A B Approach Delay 11.2 Approach LOS B Worksheet 11-Shared Major LT Impedance and Delay Movement 2 Movement 5 p(oj) v(il), Volume for stream 2 or v(i2), Volume for stream 3 or 6 0 s(il), Saturation flow rate for stream 2 or s(i2), Saturation flow rate for stream 3 or P*(oj) 0.98 d(m,lt), Delay for stream 1 or N, Number of major street through lanes 1 d(rank,1) Delay for stream 2 or 5 0.2
153 HCS 2010: Two-Lane Highways Release 6.50 Phone: Fax: Directional Two-Lane Highway Segment Analysis Analyst HDR Agency/Co. SDDOT Date Performed 1/2014 Analysis Time Period AM PEAK Highway TIMBERLINE ROAD From/To NORTH OF I-90 TO SOUTH OF 60TH Jurisdiction MINNEHAHA CO. Analysis Year Existing Description I-90/Timberline IMJR Input Data Highway class Class 3 Peak hour factor, PHF 0.88 Shoulder width 6.0 ft % Trucks and buses 6 % Lane width 12.0 ft % Trucks crawling 0.0 % Segment length 1.5 mi Truck crawl speed 0.0 mi/hr Terrain type Rolling % Recreational vehicles 0 % Grade: Length - mi % No-passing zones 60 % Up/down - % Access point density 13 /mi Analysis direction volume, Vd 210 Opposing direction volume, Vo 144 veh/h veh/h Average Travel Speed Direction Analysis(d) Opposing (o) PCE for trucks, ET PCE for RVs, ER Heavy-vehicle adj. factor,(note-5) fhv Grade adj. factor,(note-1) fg Directional flow rate,(note-2) vi 328 pc/h 246 pc/h Free-Flow Speed from Field Measurement: Field measured speed,(note-3) S FM - mi/h Observed total demand,(note-3) V - veh/h Estimated Free-Flow Speed: Base free-flow speed,(note-3) BFFS 45.0 mi/h Adj. for lane and shoulder width,(note-3) fls 0.0 mi/h Adj. for access point density,(note-3) fa 3.3 mi/h Free-flow speed, FFSd 41.8 mi/h Adjustment for no-passing zones, fnp 2.8 mi/h Average travel speed, ATSd 34.4 mi/h Percent Free Flow Speed, PFFS 82.5 %
154 Percent Time-Spent-Following Direction Analysis(d) Opposing (o) PCE for trucks, ET PCE for RVs, ER Heavy-vehicle adjustment factor, fhv Grade adjustment factor,(note-1) fg Directional flow rate,(note-2) vi 303 pc/h 223 pc/h Base percent time-spent-following,(note-4) BPTSFd 31.4 % Adjustment for no-passing zones, fnp 52.2 Percent time-spent-following, PTSFd 61.5 % Level of Service and Other Performance Measures Level of service, LOS C Volume to capacity ratio, v/c 0.19 Peak 15-min vehicle-miles of travel, VMT15 89 veh-mi Peak-hour vehicle-miles of travel, VMT veh-mi Peak 15-min total travel time, TT veh-h Capacity from ATS, CdATS 1215 veh/h Capacity from PTSF, CdPTSF 1321 veh/h Directional Capacity 1215 veh/h Passing Lane Analysis Total length of analysis segment, Lt 1.5 mi Length of two-lane highway upstream of the passing lane, Lu - mi Length of passing lane including tapers, Lpl - mi Average travel speed, ATSd (from above) 34.4 mi/h Percent time-spent-following, PTSFd (from above) 61.5 Level of service, LOSd (from above) C Average Travel Speed with Passing Lane Downstream length of two-lane highway within effective length of passing lane for average travel speed, Lde - mi Length of two-lane highway downstream of effective length of the passing lane for average travel speed, Ld - mi Adj. factor for the effect of passing lane on average speed, fpl - Average travel speed including passing lane, ATSpl - Percent free flow speed including passing lane, PFFSpl 0.0 % Percent Time-Spent-Following with Passing Lane Downstream length of two-lane highway within effective length of passing lane for percent time-spent-following, Lde - mi Length of two-lane highway downstream of effective length of the passing lane for percent time-spent-following, Ld - mi Adj. factor for the effect of passing lane on percent time-spent-following, fpl - Percent time-spent-following including passing lane, PTSFpl - % Level of Service and Other Performance Measures with Passing Lane Level of service including passing lane, LOSpl E Peak 15-min total travel time, TT15 - veh-h Bicycle Level of Service
155 Posted speed limit, Sp 40 Percent of segment with occupied on-highway parking 0 Pavement rating, P 3 Flow rate in outside lane, vol Effective width of outside lane, We Effective speed factor, St 4.17 Bicycle LOS Score, BLOS 2.93 Bicycle LOS C Notes: 1. Note that the adjustment factor for level terrain is 1.00, as level terrain is one of the base conditions. For the purpose of grade adjustment, specific dewngrade segments are treated as level terrain. 2. If vi (vd or vo ) >= 1,700 pc/h, terminate analysis-the LOS is F. 3. For the analysis direction only and for v>200 veh/h. 4. For the analysis direction only. 5. Use alternative Exhibit if some trucks operate at crawl speeds on a specific downgrade.
156 HCS 2010: Two-Lane Highways Release 6.50 Phone: Fax: Directional Two-Lane Highway Segment Analysis Analyst HDR Agency/Co. SDDOT Date Performed 1/2014 Analysis Time Period AM PEAK Highway TIMBERLINE ROAD From/To NORTH OF I-90 TO SOUTH OF 60TH Jurisdiction MINNEHAHA CO. Analysis Year Existing Description I-90/Timberline IMJR Input Data Highway class Class 3 Peak hour factor, PHF 0.88 Shoulder width 6.0 ft % Trucks and buses 6 % Lane width 12.0 ft % Trucks crawling 0.0 % Segment length 1.5 mi Truck crawl speed 0.0 mi/hr Terrain type Rolling % Recreational vehicles 0 % Grade: Length - mi % No-passing zones 60 % Up/down - % Access point density 13 /mi Analysis direction volume, Vd 144 Opposing direction volume, Vo 210 veh/h veh/h Average Travel Speed Direction Analysis(d) Opposing (o) PCE for trucks, ET PCE for RVs, ER Heavy-vehicle adj. factor,(note-5) fhv Grade adj. factor,(note-1) fg Directional flow rate,(note-2) vi 246 pc/h 328 pc/h Free-Flow Speed from Field Measurement: Field measured speed,(note-3) S FM - mi/h Observed total demand,(note-3) V - veh/h Estimated Free-Flow Speed: Base free-flow speed,(note-3) BFFS 45.0 mi/h Adj. for lane and shoulder width,(note-3) fls 0.0 mi/h Adj. for access point density,(note-3) fa 3.3 mi/h Free-flow speed, FFSd 41.8 mi/h Adjustment for no-passing zones, fnp 2.4 mi/h Average travel speed, ATSd 34.9 mi/h Percent Free Flow Speed, PFFS 83.6 %
157 Percent Time-Spent-Following Direction Analysis(d) Opposing (o) PCE for trucks, ET PCE for RVs, ER Heavy-vehicle adjustment factor, fhv Grade adjustment factor,(note-1) fg Directional flow rate,(note-2) vi 223 pc/h 303 pc/h Base percent time-spent-following,(note-4) BPTSFd 26.0 % Adjustment for no-passing zones, fnp 52.2 Percent time-spent-following, PTSFd 48.1 % Level of Service and Other Performance Measures Level of service, LOS B Volume to capacity ratio, v/c 0.15 Peak 15-min vehicle-miles of travel, VMT15 61 veh-mi Peak-hour vehicle-miles of travel, VMT veh-mi Peak 15-min total travel time, TT veh-h Capacity from ATS, CdATS 1324 veh/h Capacity from PTSF, CdPTSF 1395 veh/h Directional Capacity 1324 veh/h Passing Lane Analysis Total length of analysis segment, Lt 1.5 mi Length of two-lane highway upstream of the passing lane, Lu - mi Length of passing lane including tapers, Lpl - mi Average travel speed, ATSd (from above) 34.9 mi/h Percent time-spent-following, PTSFd (from above) 48.1 Level of service, LOSd (from above) B Average Travel Speed with Passing Lane Downstream length of two-lane highway within effective length of passing lane for average travel speed, Lde - mi Length of two-lane highway downstream of effective length of the passing lane for average travel speed, Ld - mi Adj. factor for the effect of passing lane on average speed, fpl - Average travel speed including passing lane, ATSpl - Percent free flow speed including passing lane, PFFSpl 0.0 % Percent Time-Spent-Following with Passing Lane Downstream length of two-lane highway within effective length of passing lane for percent time-spent-following, Lde - mi Length of two-lane highway downstream of effective length of the passing lane for percent time-spent-following, Ld - mi Adj. factor for the effect of passing lane on percent time-spent-following, fpl - Percent time-spent-following including passing lane, PTSFpl - % Level of Service and Other Performance Measures with Passing Lane Level of service including passing lane, LOSpl E Peak 15-min total travel time, TT15 - veh-h Bicycle Level of Service
158 Posted speed limit, Sp 40 Percent of segment with occupied on-highway parking 0 Pavement rating, P 3 Flow rate in outside lane, vol Effective width of outside lane, We Effective speed factor, St 4.17 Bicycle LOS Score, BLOS 1.40 Bicycle LOS A Notes: 1. Note that the adjustment factor for level terrain is 1.00, as level terrain is one of the base conditions. For the purpose of grade adjustment, specific dewngrade segments are treated as level terrain. 2. If vi (vd or vo ) >= 1,700 pc/h, terminate analysis-the LOS is F. 3. For the analysis direction only and for v>200 veh/h. 4. For the analysis direction only. 5. Use alternative Exhibit if some trucks operate at crawl speeds on a specific downgrade.
159 HCS 2010: Two-Lane Highways Release 6.50 Phone: Fax: Directional Two-Lane Highway Segment Analysis Analyst HDR Agency/Co. SDDOT Date Performed 1/2014 Analysis Time Period PM PEAK Highway TIMBERLINE ROAD From/To NORTH OF I-90 TO SOUTH OF 60TH Jurisdiction MINNEHAHA CO. Analysis Year Existing Description I-90/Timberline IMJR Input Data Highway class Class 3 Peak hour factor, PHF 0.88 Shoulder width 6.0 ft % Trucks and buses 6 % Lane width 12.0 ft % Trucks crawling 0.0 % Segment length 1.5 mi Truck crawl speed 0.0 mi/hr Terrain type Rolling % Recreational vehicles 0 % Grade: Length - mi % No-passing zones 60 % Up/down - % Access point density 13 /mi Analysis direction volume, Vd 148 Opposing direction volume, Vo 126 veh/h veh/h Average Travel Speed Direction Analysis(d) Opposing (o) PCE for trucks, ET PCE for RVs, ER Heavy-vehicle adj. factor,(note-5) fhv Grade adj. factor,(note-1) fg Directional flow rate,(note-2) vi 253 pc/h 223 pc/h Free-Flow Speed from Field Measurement: Field measured speed,(note-3) S FM - mi/h Observed total demand,(note-3) V - veh/h Estimated Free-Flow Speed: Base free-flow speed,(note-3) BFFS 45.0 mi/h Adj. for lane and shoulder width,(note-3) fls 0.0 mi/h Adj. for access point density,(note-3) fa 3.3 mi/h Free-flow speed, FFSd 41.8 mi/h Adjustment for no-passing zones, fnp 3.0 mi/h Average travel speed, ATSd 35.1 mi/h Percent Free Flow Speed, PFFS 84.0 %
160 Percent Time-Spent-Following Direction Analysis(d) Opposing (o) PCE for trucks, ET PCE for RVs, ER Heavy-vehicle adjustment factor, fhv Grade adjustment factor,(note-1) fg Directional flow rate,(note-2) vi 226 pc/h 197 pc/h Base percent time-spent-following,(note-4) BPTSFd 23.9 % Adjustment for no-passing zones, fnp 57.6 Percent time-spent-following, PTSFd 54.7 % Level of Service and Other Performance Measures Level of service, LOS B Volume to capacity ratio, v/c 0.15 Peak 15-min vehicle-miles of travel, VMT15 63 veh-mi Peak-hour vehicle-miles of travel, VMT veh-mi Peak 15-min total travel time, TT veh-h Capacity from ATS, CdATS 1183 veh/h Capacity from PTSF, CdPTSF 1298 veh/h Directional Capacity 1183 veh/h Passing Lane Analysis Total length of analysis segment, Lt 1.5 mi Length of two-lane highway upstream of the passing lane, Lu - mi Length of passing lane including tapers, Lpl - mi Average travel speed, ATSd (from above) 35.1 mi/h Percent time-spent-following, PTSFd (from above) 54.7 Level of service, LOSd (from above) B Average Travel Speed with Passing Lane Downstream length of two-lane highway within effective length of passing lane for average travel speed, Lde - mi Length of two-lane highway downstream of effective length of the passing lane for average travel speed, Ld - mi Adj. factor for the effect of passing lane on average speed, fpl - Average travel speed including passing lane, ATSpl - Percent free flow speed including passing lane, PFFSpl 0.0 % Percent Time-Spent-Following with Passing Lane Downstream length of two-lane highway within effective length of passing lane for percent time-spent-following, Lde - mi Length of two-lane highway downstream of effective length of the passing lane for percent time-spent-following, Ld - mi Adj. factor for the effect of passing lane on percent time-spent-following, fpl - Percent time-spent-following including passing lane, PTSFpl - % Level of Service and Other Performance Measures with Passing Lane Level of service including passing lane, LOSpl E Peak 15-min total travel time, TT15 - veh-h Bicycle Level of Service
161 Posted speed limit, Sp 40 Percent of segment with occupied on-highway parking 0 Pavement rating, P 3 Flow rate in outside lane, vol Effective width of outside lane, We Effective speed factor, St 4.17 Bicycle LOS Score, BLOS 1.52 Bicycle LOS B Notes: 1. Note that the adjustment factor for level terrain is 1.00, as level terrain is one of the base conditions. For the purpose of grade adjustment, specific dewngrade segments are treated as level terrain. 2. If vi (vd or vo ) >= 1,700 pc/h, terminate analysis-the LOS is F. 3. For the analysis direction only and for v>200 veh/h. 4. For the analysis direction only. 5. Use alternative Exhibit if some trucks operate at crawl speeds on a specific downgrade.
162 HCS 2010: Two-Lane Highways Release 6.50 Phone: Fax: Directional Two-Lane Highway Segment Analysis Analyst HDR Agency/Co. SDDOT Date Performed 1/2014 Analysis Time Period PM PEAK Highway TIMBERLINE ROAD From/To NORTH OF I-90 TO SOUTH OF 60TH Jurisdiction MINNEHAHA CO. Analysis Year Existing Description I-90/Timberline IMJR Input Data Highway class Class 3 Peak hour factor, PHF 0.88 Shoulder width 6.0 ft % Trucks and buses 6 % Lane width 12.0 ft % Trucks crawling 0.0 % Segment length 1.5 mi Truck crawl speed 0.0 mi/hr Terrain type Rolling % Recreational vehicles 0 % Grade: Length - mi % No-passing zones 60 % Up/down - % Access point density 13 /mi Analysis direction volume, Vd 126 Opposing direction volume, Vo 148 veh/h veh/h Average Travel Speed Direction Analysis(d) Opposing (o) PCE for trucks, ET PCE for RVs, ER Heavy-vehicle adj. factor,(note-5) fhv Grade adj. factor,(note-1) fg Directional flow rate,(note-2) vi 223 pc/h 253 pc/h Free-Flow Speed from Field Measurement: Field measured speed,(note-3) S FM - mi/h Observed total demand,(note-3) V - veh/h Estimated Free-Flow Speed: Base free-flow speed,(note-3) BFFS 45.0 mi/h Adj. for lane and shoulder width,(note-3) fls 0.0 mi/h Adj. for access point density,(note-3) fa 3.3 mi/h Free-flow speed, FFSd 41.8 mi/h Adjustment for no-passing zones, fnp 2.8 mi/h Average travel speed, ATSd 35.2 mi/h Percent Free Flow Speed, PFFS 84.4 %
163 Percent Time-Spent-Following Direction Analysis(d) Opposing (o) PCE for trucks, ET PCE for RVs, ER Heavy-vehicle adjustment factor, fhv Grade adjustment factor,(note-1) fg Directional flow rate,(note-2) vi 197 pc/h 226 pc/h Base percent time-spent-following,(note-4) BPTSFd 21.9 % Adjustment for no-passing zones, fnp 57.6 Percent time-spent-following, PTSFd 48.7 % Level of Service and Other Performance Measures Level of service, LOS B Volume to capacity ratio, v/c 0.13 Peak 15-min vehicle-miles of travel, VMT15 54 veh-mi Peak-hour vehicle-miles of travel, VMT veh-mi Peak 15-min total travel time, TT veh-h Capacity from ATS, CdATS 1221 veh/h Capacity from PTSF, CdPTSF 1321 veh/h Directional Capacity 1221 veh/h Passing Lane Analysis Total length of analysis segment, Lt 1.5 mi Length of two-lane highway upstream of the passing lane, Lu - mi Length of passing lane including tapers, Lpl - mi Average travel speed, ATSd (from above) 35.2 mi/h Percent time-spent-following, PTSFd (from above) 48.7 Level of service, LOSd (from above) B Average Travel Speed with Passing Lane Downstream length of two-lane highway within effective length of passing lane for average travel speed, Lde - mi Length of two-lane highway downstream of effective length of the passing lane for average travel speed, Ld - mi Adj. factor for the effect of passing lane on average speed, fpl - Average travel speed including passing lane, ATSpl - Percent free flow speed including passing lane, PFFSpl 0.0 % Percent Time-Spent-Following with Passing Lane Downstream length of two-lane highway within effective length of passing lane for percent time-spent-following, Lde - mi Length of two-lane highway downstream of effective length of the passing lane for percent time-spent-following, Ld - mi Adj. factor for the effect of passing lane on percent time-spent-following, fpl - Percent time-spent-following including passing lane, PTSFpl - % Level of Service and Other Performance Measures with Passing Lane Level of service including passing lane, LOSpl E Peak 15-min total travel time, TT15 - veh-h Bicycle Level of Service
164 Posted speed limit, Sp 40 Percent of segment with occupied on-highway parking 0 Pavement rating, P 3 Flow rate in outside lane, vol Effective width of outside lane, We Effective speed factor, St 4.17 Bicycle LOS Score, BLOS 0.85 Bicycle LOS A Notes: 1. Note that the adjustment factor for level terrain is 1.00, as level terrain is one of the base conditions. For the purpose of grade adjustment, specific dewngrade segments are treated as level terrain. 2. If vi (vd or vo ) >= 1,700 pc/h, terminate analysis-the LOS is F. 3. For the analysis direction only and for v>200 veh/h. 4. For the analysis direction only. 5. Use alternative Exhibit if some trucks operate at crawl speeds on a specific downgrade.
165 Appendix Part Interstate Level of Service I-90/Timberline Road Interchange
166 HCS 2010: Basic Freeway Segments Release 6.50 Phone: Fax: Operational Planning Analysis Analyst: HDR Agency or Company: SDDOT Date Performed: 1/2014 Analysis Time Period: AM PEAK Freeway/Direction: I-90 From/To: I-229/TIMBERLINE Jurisdiction: MINNEHAHA CO. Analysis Year: 2035 Description: I-90/SD 100 IMJR Flow Inputs and Adjustments Annual average daily traffic, AADT veh/day Peak-hour proportion of AADT, K 0.09 Peak-hour direction percent, D 55 % Volume, DDHV 2421 veh/h Peak Hour factor, PHF 0.90 Trucks and buses 11 % Recreational vehicles 0 % Terrain type: Rolling Grade - % Segment length - mi Trucks and buses PCE, ET 2.5 Recreational vehicles PCE, ER 2.0 Heavy Vehicle adjustment, fhv Driver population factor, fp 1.00 Flow rate, vp 1567 pc/h/ln Speed Inputs and Adjustments Lane width 12.0 ft Right-side lateral clearance 6.0 ft Interchange density 1.20 ramps/mi Number of lanes, N 2 Free-flow speed: Base FFS or BFFS 75.4 mi/h Lane width adjustment, flw 0.0 mi/h Lateral clearance adjustment, flc 0.0 mi/h Interchange density adjustment, fid 3.8 mi/h Free-flow speed 71.6 mi/h LOS and Performance Measures Flow rate, vp 1567 pc/h/ln Free-flow speed, FFS 71.6 mi/h Average passenger-car speed, S 68.4 mi/h Number of lanes, N 2
167 Density, D 22.9 pc/mi/ln Level of Service, LOS C Overall results are not computed when free-flow speed is less than 55 mph.
168 HCS 2010: Basic Freeway Segments Release 6.50 Phone: Fax: Operational Planning Analysis Analyst: HDR Agency or Company: SDDOT Date Performed: 1/2014 Analysis Time Period: PM PEAK Freeway/Direction: I-90 From/To: I-229/TIMBERLINE Jurisdiction: MINNEHAHA CO. Analysis Year: 2035 Description: I-90/SD 100 IMJR Flow Inputs and Adjustments Annual average daily traffic, AADT veh/day Peak-hour proportion of AADT, K 0.09 Peak-hour direction percent, D 55 % Volume, DDHV 2421 veh/h Peak Hour factor, PHF 0.90 Trucks and buses 11 % Recreational vehicles 0 % Terrain type: Rolling Grade - % Segment length - mi Trucks and buses PCE, ET 2.5 Recreational vehicles PCE, ER 2.0 Heavy Vehicle adjustment, fhv Driver population factor, fp 1.00 Flow rate, vp 1567 pc/h/ln Speed Inputs and Adjustments Lane width 12.0 ft Right-side lateral clearance 6.0 ft Interchange density 1.20 ramps/mi Number of lanes, N 2 Free-flow speed: Base FFS or BFFS 75.4 mi/h Lane width adjustment, flw 0.0 mi/h Lateral clearance adjustment, flc 0.0 mi/h Interchange density adjustment, fid 3.8 mi/h Free-flow speed 71.6 mi/h LOS and Performance Measures Flow rate, vp 1567 pc/h/ln Free-flow speed, FFS 71.6 mi/h Average passenger-car speed, S 68.4 mi/h Number of lanes, N 2
169 Density, D 22.9 pc/mi/ln Level of Service, LOS C Overall results are not computed when free-flow speed is less than 55 mph.
170 HCS 2010: Basic Freeway Segments Release 6.50 Phone: Fax: Operational Planning Analysis Analyst: HDR Agency or Company: SDDOT Date Performed: 1/2014 Analysis Time Period: AM PEAK Freeway/Direction: I-90 From/To: TIMBERLINE/SD 11 Jurisdiction: MINNEHAHA CO. Analysis Year: 2035 Description: I-90/SD 100 IMJR Flow Inputs and Adjustments Annual average daily traffic, AADT veh/day Peak-hour proportion of AADT, K 0.09 Peak-hour direction percent, D 57 % Volume, DDHV 2088 veh/h Peak Hour factor, PHF 0.90 Trucks and buses 11 % Recreational vehicles 0 % Terrain type: Rolling Grade - % Segment length - mi Trucks and buses PCE, ET 2.5 Recreational vehicles PCE, ER 2.0 Heavy Vehicle adjustment, fhv Driver population factor, fp 1.00 Flow rate, vp 1351 pc/h/ln Speed Inputs and Adjustments Lane width 12.0 ft Right-side lateral clearance 6.0 ft Interchange density 0.50 ramps/mi Number of lanes, N 2 Free-flow speed: Base FFS or BFFS 75.4 mi/h Lane width adjustment, flw 0.0 mi/h Lateral clearance adjustment, flc 0.0 mi/h Interchange density adjustment, fid 1.8 mi/h Free-flow speed 73.6 mi/h LOS and Performance Measures Flow rate, vp 1351 pc/h/ln Free-flow speed, FFS 73.6 mi/h Average passenger-car speed, S 73.6 mi/h Number of lanes, N 2
171 Density, D 18.3 pc/mi/ln Level of Service, LOS C Overall results are not computed when free-flow speed is less than 55 mph.
172 HCS 2010: Basic Freeway Segments Release 6.50 Phone: Fax: Operational Planning Analysis Analyst: HDR Agency or Company: SDDOT Date Performed: 1/2014 Analysis Time Period: PM PEAK Freeway/Direction: I-90 From/To: TIMBERLINE/SD 11 Jurisdiction: MINNEHAHA CO. Analysis Year: 2035 Description: I-90/SD 100 IMJR Flow Inputs and Adjustments Annual average daily traffic, AADT veh/day Peak-hour proportion of AADT, K 0.09 Peak-hour direction percent, D 56 % Volume, DDHV 2051 veh/h Peak Hour factor, PHF 0.90 Trucks and buses 11 % Recreational vehicles 0 % Terrain type: Rolling Grade - % Segment length - mi Trucks and buses PCE, ET 2.5 Recreational vehicles PCE, ER 2.0 Heavy Vehicle adjustment, fhv Driver population factor, fp 1.00 Flow rate, vp 1327 pc/h/ln Speed Inputs and Adjustments Lane width 12.0 ft Right-side lateral clearance 6.0 ft Interchange density 0.50 ramps/mi Number of lanes, N 2 Free-flow speed: Base FFS or BFFS 75.4 mi/h Lane width adjustment, flw 0.0 mi/h Lateral clearance adjustment, flc 0.0 mi/h Interchange density adjustment, fid 1.8 mi/h Free-flow speed 73.6 mi/h LOS and Performance Measures Flow rate, vp 1327 pc/h/ln Free-flow speed, FFS 73.6 mi/h Average passenger-car speed, S 73.8 mi/h Number of lanes, N 2
173 Density, D pc/mi/ln Level of Service, LOS B Overall results are not computed when free-flow speed is less than 55 mph.
174 HCS 2010: Freeway Merge and Diverge Segments Release 6.50 Phone: Fax: Diverge Analysis Analyst: HDR Agency/Co.: SDDOT Date performed: 1/2014 Analysis time period: AM PEAK Freeway/Dir of Travel: I-90/EB Junction: I-229 Jurisdiction: MINNEHAHA CO. Analysis Year: 2035 Description: I-90/SD 100 IMJR Freeway Data Type of analysis Diverge Number of lanes in freeway 2 Free-flow speed on freeway 66.0 mph Volume on freeway 2070 vph Off Ramp Data Side of freeway Right Number of lanes in ramp 1 Free-Flow speed on ramp 50.0 mph Volume on ramp 560 vph Length of first accel/decel lane 610 ft Length of second accel/decel lane ft Adjacent Ramp Data (if one exists) Does adjacent ramp exist? Yes Volume on adjacent ramp 490 vph Position of adjacent ramp Downstream Type of adjacent ramp On Distance to adjacent ramp 2930 ft Conversion to pc/h Under Base Conditions Junction Components Freeway Ramp Adjacent Ramp Volume, V (vph) vph Peak-hour factor, PHF Peak 15-min volume, v v Trucks and buses % Recreational vehicles % Terrain type: Rolling Rolling Rolling Grade 0.00 % 0.00 % 0.00 % Length 0.00 mi 0.00 mi 0.00 mi Trucks and buses PCE, ET Recreational vehicle PCE, ER
175 Heavy vehicle adjustment, fhv Driver population factor, fp Flow rate, vp pcph Estimation of V12 Diverge Areas L = (Equation or 13-13) EQ P = Using Equation 0 FD v = v + (v - v ) P = 2680 pc/h 12 R F R FD Capacity Checks Actual Maximum LOS F? v = v No Fi F v = v - v No FO F R v No R v or v 0 pc/h (Equation or 13-17) 3 av34 Is v or v > 2700 pc/h? No 3 av34 Is v or v > 1.5 v /2 No 3 av34 12 If yes, v = 2680 (Equation 13-15, 13-16, 13-18, or 13-19) 12A Flow Entering Diverge Influence Area Actual Max Desirable Violation? v No 12 Level of Service Determination (if not F) Density, D = v L = 21.8 pc/mi/ln R 12 D Level of service for ramp-freeway junction areas of influence C Speed Estimation Intermediate speed variable, D = S Space mean speed in ramp influence area, S = 58.9 mph R Space mean speed in outer lanes, S = N/A mph 0 Space mean speed for all vehicles, S = 58.9 mph _
176 HCS 2010: Freeway Merge and Diverge Segments Release 6.50 Phone: Fax: Diverge Analysis Analyst: HDR Agency/Co.: SDDOT Date performed: 1/2014 Analysis time period: PM PEAK Freeway/Dir of Travel: I-90/EB Junction: I-229 Jurisdiction: MINNEHAHA CO. Analysis Year: 2035 Description: I-90/SD 100 IMJR Freeway Data Type of analysis Diverge Number of lanes in freeway 2 Free-flow speed on freeway 66.0 mph Volume on freeway 2380 vph Off Ramp Data Side of freeway Right Number of lanes in ramp 1 Free-Flow speed on ramp 50.0 mph Volume on ramp 520 vph Length of first accel/decel lane 610 ft Length of second accel/decel lane ft Adjacent Ramp Data (if one exists) Does adjacent ramp exist? Yes Volume on adjacent ramp 540 vph Position of adjacent ramp Downstream Type of adjacent ramp On Distance to adjacent ramp 2930 ft Conversion to pc/h Under Base Conditions Junction Components Freeway Ramp Adjacent Ramp Volume, V (vph) vph Peak-hour factor, PHF Peak 15-min volume, v v Trucks and buses % Recreational vehicles % Terrain type: Rolling Rolling Rolling Grade 0.00 % 0.00 % 0.00 % Length 0.00 mi 0.00 mi 0.00 mi Trucks and buses PCE, ET Recreational vehicle PCE, ER
177 Heavy vehicle adjustment, fhv Driver population factor, fp Flow rate, vp pcph Estimation of V12 Diverge Areas L = (Equation or 13-13) EQ P = Using Equation 0 FD v = v + (v - v ) P = 3081 pc/h 12 R F R FD Capacity Checks Actual Maximum LOS F? v = v No Fi F v = v - v No FO F R v No R v or v 0 pc/h (Equation or 13-17) 3 av34 Is v or v > 2700 pc/h? No 3 av34 Is v or v > 1.5 v /2 No 3 av34 12 If yes, v = 3081 (Equation 13-15, 13-16, 13-18, or 13-19) 12A Flow Entering Diverge Influence Area Actual Max Desirable Violation? v No 12 Level of Service Determination (if not F) Density, D = v L = 25.3 pc/mi/ln R 12 D Level of service for ramp-freeway junction areas of influence C Speed Estimation Intermediate speed variable, D = S Space mean speed in ramp influence area, S = 59.0 mph R Space mean speed in outer lanes, S = N/A mph 0 Space mean speed for all vehicles, S = 59.0 mph _
178 HCS 2010: Freeway Merge and Diverge Segments Release 6.50 Phone: Fax: Merge Analysis Analyst: HDR Agency/Co.: SDDOT Date performed: 1/2014 Analysis time period: AM PEAK Freeway/Dir of Travel: I-90/EB Junction: I-229 Jurisdiction: MINNEHAHA CO. Analysis Year: 2035 Description: I-90/SD 100 IMJR Freeway Data Type of analysis Merge Number of lanes in freeway 2 Free-flow speed on freeway 66.0 mph Volume on freeway 1510 vph On Ramp Data Side of freeway Right Number of lanes in ramp 1 Free-flow speed on ramp 55.0 mph Volume on ramp 490 vph Length of first accel/decel lane 880 ft Length of second accel/decel lane ft Adjacent Ramp Data (if one exists) Does adjacent ramp exist? Yes Volume on adjacent Ramp 560 vph Position of adjacent Ramp Upstream Type of adjacent Ramp Off Distance to adjacent Ramp 2930 ft Conversion to pc/h Under Base Conditions Junction Components Freeway Ramp Adjacent Ramp Volume, V (vph) vph Peak-hour factor, PHF Peak 15-min volume, v v Trucks and buses % Recreational vehicles % Terrain type: Rolling Rolling Rolling Grade % % % Length mi mi mi Trucks and buses PCE, ET Recreational vehicle PCE, ER
179 Heavy vehicle adjustment, fhv Driver population factor, fp Flow rate, vp pcph Estimation of V12 Merge Areas L = (Equation 13-6 or 13-7) EQ P = Using Equation 0 FM v = v (P ) = 1955 pc/h 12 F FM Capacity Checks Actual Maximum LOS F? v No FO v or v 0 pc/h (Equation or 13-17) 3 av34 Is v or v > 2700 pc/h? No 3 av34 Is v or v > 1.5 v /2 No 3 av34 12 If yes, v = 1955 (Equation 13-15, 13-16, 13-18, or 13-19) 12A Flow Entering Merge Influence Area Actual Max Desirable Violation? v No R12 Level of Service Determination (if not F) Density, D = v v L = 19.6 pc/mi/ln R R 12 A Level of service for ramp-freeway junction areas of influence B Speed Estimation Intermediate speed variable, M = S Space mean speed in ramp influence area, S = 59.4 mph R Space mean speed in outer lanes, S = N/A mph 0 Space mean speed for all vehicles, S = 59.4 mph _
180 HCS 2010: Freeway Merge and Diverge Segments Release 6.50 Phone: Fax: Merge Analysis Analyst: HDR Agency/Co.: SDDOT Date performed: 1/2014 Analysis time period: PM PEAK Freeway/Dir of Travel: I-90/EB Junction: I-229 Jurisdiction: MINNEHAHA CO. Analysis Year: 2035 Description: I-90/SD 100 IMJR Freeway Data Type of analysis Merge Number of lanes in freeway 2 Free-flow speed on freeway 66.0 mph Volume on freeway 1860 vph On Ramp Data Side of freeway Right Number of lanes in ramp 1 Free-flow speed on ramp 55.0 mph Volume on ramp 540 vph Length of first accel/decel lane 880 ft Length of second accel/decel lane ft Adjacent Ramp Data (if one exists) Does adjacent ramp exist? Yes Volume on adjacent Ramp 520 vph Position of adjacent Ramp Upstream Type of adjacent Ramp Off Distance to adjacent Ramp 2930 ft Conversion to pc/h Under Base Conditions Junction Components Freeway Ramp Adjacent Ramp Volume, V (vph) vph Peak-hour factor, PHF Peak 15-min volume, v v Trucks and buses % Recreational vehicles % Terrain type: Rolling Rolling Rolling Grade % % % Length mi mi mi Trucks and buses PCE, ET Recreational vehicle PCE, ER
181 Heavy vehicle adjustment, fhv Driver population factor, fp Flow rate, vp pcph Estimation of V12 Merge Areas L = (Equation 13-6 or 13-7) EQ P = Using Equation 0 FM v = v (P ) = 2408 pc/h 12 F FM Capacity Checks Actual Maximum LOS F? v No FO v or v 0 pc/h (Equation or 13-17) 3 av34 Is v or v > 2700 pc/h? No 3 av34 Is v or v > 1.5 v /2 No 3 av34 12 If yes, v = 2408 (Equation 13-15, 13-16, 13-18, or 13-19) 12A Flow Entering Merge Influence Area Actual Max Desirable Violation? v No R12 Level of Service Determination (if not F) Density, D = v v L = 23.5 pc/mi/ln R R 12 A Level of service for ramp-freeway junction areas of influence C Speed Estimation Intermediate speed variable, M = S Space mean speed in ramp influence area, S = 58.6 mph R Space mean speed in outer lanes, S = N/A mph 0 Space mean speed for all vehicles, S = 58.6 mph _
182 HCS 2010: Freeway Merge and Diverge Segments Release 6.50 Phone: Fax: Diverge Analysis Analyst: HDR Agency/Co.: SDDOT Date performed: 1/2014 Analysis time period: AM PEAK Freeway/Dir of Travel: I-90/EB Junction: TIMBERLINE RD. Jurisdiction: MINNEHAHA CO. Analysis Year: 2035 Description: I-90/SD 100 IMJR Freeway Data Type of analysis Diverge Number of lanes in freeway 2 Free-flow speed on freeway 70.0 mph Volume on freeway 2000 vph Off Ramp Data Side of freeway Right Number of lanes in ramp 1 Free-Flow speed on ramp 45.0 mph Volume on ramp 850 vph Length of first accel/decel lane 340 ft Length of second accel/decel lane ft Adjacent Ramp Data (if one exists) Does adjacent ramp exist? Yes Volume on adjacent ramp 350 vph Position of adjacent ramp Downstream Type of adjacent ramp On Distance to adjacent ramp 1890 ft Conversion to pc/h Under Base Conditions Junction Components Freeway Ramp Adjacent Ramp Volume, V (vph) vph Peak-hour factor, PHF Peak 15-min volume, v v Trucks and buses % Recreational vehicles % Terrain type: Rolling Rolling Rolling Grade 0.00 % 0.00 % 0.00 % Length 0.00 mi 0.00 mi 0.00 mi Trucks and buses PCE, ET Recreational vehicle PCE, ER
183 Heavy vehicle adjustment, fhv Driver population factor, fp Flow rate, vp pcph Estimation of V12 Diverge Areas L = (Equation or 13-13) EQ P = Using Equation 0 FD v = v + (v - v ) P = 2589 pc/h 12 R F R FD Capacity Checks Actual Maximum LOS F? v = v No Fi F v = v - v No FO F R v No R v or v 0 pc/h (Equation or 13-17) 3 av34 Is v or v > 2700 pc/h? No 3 av34 Is v or v > 1.5 v /2 No 3 av34 12 If yes, v = 2589 (Equation 13-15, 13-16, 13-18, or 13-19) 12A Flow Entering Diverge Influence Area Actual Max Desirable Violation? v No 12 Level of Service Determination (if not F) Density, D = v L = 23.5 pc/mi/ln R 12 D Level of service for ramp-freeway junction areas of influence C Speed Estimation Intermediate speed variable, D = S Space mean speed in ramp influence area, S = 59.2 mph R Space mean speed in outer lanes, S = N/A mph 0 Space mean speed for all vehicles, S = 59.2 mph _
184 HCS 2010: Freeway Merge and Diverge Segments Release 6.50 Phone: Fax: Diverge Analysis Analyst: HDR Agency/Co.: SDDOT Date performed: 1/2014 Analysis time period: PM PEAK Freeway/Dir of Travel: I-90/EB Junction: TIMBERLINE RD. Jurisdiction: MINNEHAHA CO. Analysis Year: 2035 Description: I-90/SD 100 IMJR Freeway Data Type of analysis Diverge Number of lanes in freeway 2 Free-flow speed on freeway 70.0 mph Volume on freeway 2400 vph Off Ramp Data Side of freeway Right Number of lanes in ramp 1 Free-Flow speed on ramp 45.0 mph Volume on ramp 760 vph Length of first accel/decel lane 340 ft Length of second accel/decel lane ft Adjacent Ramp Data (if one exists) Does adjacent ramp exist? Yes Volume on adjacent ramp 430 vph Position of adjacent ramp Downstream Type of adjacent ramp On Distance to adjacent ramp 1890 ft Conversion to pc/h Under Base Conditions Junction Components Freeway Ramp Adjacent Ramp Volume, V (vph) vph Peak-hour factor, PHF Peak 15-min volume, v v Trucks and buses % Recreational vehicles % Terrain type: Rolling Rolling Rolling Grade 0.00 % 0.00 % 0.00 % Length 0.00 mi 0.00 mi 0.00 mi Trucks and buses PCE, ET Recreational vehicle PCE, ER
185 Heavy vehicle adjustment, fhv Driver population factor, fp Flow rate, vp pcph Estimation of V12 Diverge Areas L = (Equation or 13-13) EQ P = Using Equation 0 FD v = v + (v - v ) P = 3107 pc/h 12 R F R FD Capacity Checks Actual Maximum LOS F? v = v No Fi F v = v - v No FO F R v No R v or v 0 pc/h (Equation or 13-17) 3 av34 Is v or v > 2700 pc/h? No 3 av34 Is v or v > 1.5 v /2 No 3 av34 12 If yes, v = 3107 (Equation 13-15, 13-16, 13-18, or 13-19) 12A Flow Entering Diverge Influence Area Actual Max Desirable Violation? v No 12 Level of Service Determination (if not F) Density, D = v L = 27.9 pc/mi/ln R 12 D Level of service for ramp-freeway junction areas of influence C Speed Estimation Intermediate speed variable, D = S Space mean speed in ramp influence area, S = 59.4 mph R Space mean speed in outer lanes, S = N/A mph 0 Space mean speed for all vehicles, S = 59.4 mph _
186 HCS 2010: Freeway Merge and Diverge Segments Release 6.50 Phone: Fax: Merge Analysis Analyst: HDR Agency/Co.: SDDOT Date performed: 1/2014 Analysis time period: AM PEAK Freeway/Dir of Travel: I-90/EB Junction: TIMBERLINE RD. Jurisdiction: MINNEHAHA CO. Analysis Year: 2035 Description: I-90/SD 100 IMJR Freeway Data Type of analysis Merge Number of lanes in freeway 2 Free-flow speed on freeway 70.0 mph Volume on freeway 1150 vph On Ramp Data Side of freeway Right Number of lanes in ramp 1 Free-flow speed on ramp 45.0 mph Volume on ramp 350 vph Length of first accel/decel lane 760 ft Length of second accel/decel lane ft Adjacent Ramp Data (if one exists) Does adjacent ramp exist? Yes Volume on adjacent Ramp 850 vph Position of adjacent Ramp Upstream Type of adjacent Ramp Off Distance to adjacent Ramp 1890 ft Conversion to pc/h Under Base Conditions Junction Components Freeway Ramp Adjacent Ramp Volume, V (vph) vph Peak-hour factor, PHF Peak 15-min volume, v v Trucks and buses % Recreational vehicles % Terrain type: Rolling Rolling Rolling Grade % % % Length mi mi mi Trucks and buses PCE, ET Recreational vehicle PCE, ER
187 Heavy vehicle adjustment, fhv Driver population factor, fp Flow rate, vp pcph Estimation of V12 Merge Areas L = (Equation 13-6 or 13-7) EQ P = Using Equation 0 FM v = v (P ) = 1489 pc/h 12 F FM Capacity Checks Actual Maximum LOS F? v No FO v or v 0 pc/h (Equation or 13-17) 3 av34 Is v or v > 2700 pc/h? No 3 av34 Is v or v > 1.5 v /2 No 3 av34 12 If yes, v = 1489 (Equation 13-15, 13-16, 13-18, or 13-19) 12A Flow Entering Merge Influence Area Actual Max Desirable Violation? v No R12 Level of Service Determination (if not F) Density, D = v v L = 15.6 pc/mi/ln R R 12 A Level of service for ramp-freeway junction areas of influence B Speed Estimation Intermediate speed variable, M = S Space mean speed in ramp influence area, S = 62.2 mph R Space mean speed in outer lanes, S = N/A mph 0 Space mean speed for all vehicles, S = 62.2 mph _
188 HCS 2010: Freeway Merge and Diverge Segments Release 6.50 Phone: Fax: Merge Analysis Analyst: HDR Agency/Co.: SDDOT Date performed: 1/2014 Analysis time period: PM PEAK Freeway/Dir of Travel: I-90/EB Junction: TIMBERLINE RD. Jurisdiction: MINNEHAHA CO. Analysis Year: 2035 Description: I-90/SD 100 IMJR Freeway Data Type of analysis Merge Number of lanes in freeway 2 Free-flow speed on freeway 70.0 mph Volume on freeway 1640 vph On Ramp Data Side of freeway Right Number of lanes in ramp 1 Free-flow speed on ramp 45.0 mph Volume on ramp 430 vph Length of first accel/decel lane 760 ft Length of second accel/decel lane ft Adjacent Ramp Data (if one exists) Does adjacent ramp exist? Yes Volume on adjacent Ramp 760 vph Position of adjacent Ramp Upstream Type of adjacent Ramp Off Distance to adjacent Ramp 1890 ft Conversion to pc/h Under Base Conditions Junction Components Freeway Ramp Adjacent Ramp Volume, V (vph) vph Peak-hour factor, PHF Peak 15-min volume, v v Trucks and buses % Recreational vehicles % Terrain type: Rolling Rolling Rolling Grade % % % Length mi mi mi Trucks and buses PCE, ET Recreational vehicle PCE, ER
189 Heavy vehicle adjustment, fhv Driver population factor, fp Flow rate, vp pcph Estimation of V12 Merge Areas L = (Equation 13-6 or 13-7) EQ P = Using Equation 0 FM v = v (P ) = 2123 pc/h 12 F FM Capacity Checks Actual Maximum LOS F? v No FO v or v 0 pc/h (Equation or 13-17) 3 av34 Is v or v > 2700 pc/h? No 3 av34 Is v or v > 1.5 v /2 No 3 av34 12 If yes, v = 2123 (Equation 13-15, 13-16, 13-18, or 13-19) 12A Flow Entering Merge Influence Area Actual Max Desirable Violation? v No R12 Level of Service Determination (if not F) Density, D = v v L = 21.1 pc/mi/ln R R 12 A Level of service for ramp-freeway junction areas of influence C Speed Estimation Intermediate speed variable, M = S Space mean speed in ramp influence area, S = 61.4 mph R Space mean speed in outer lanes, S = N/A mph 0 Space mean speed for all vehicles, S = 61.4 mph _
190 HCS 2010: Freeway Merge and Diverge Segments Release 6.50 Phone: Fax: Diverge Analysis Analyst: HDR Agency/Co.: SDDOT Date performed: 1/2014 Analysis time period: AM PEAK Freeway/Dir of Travel: I-90/EB Junction: SD 11 Jurisdiction: MINNEHAHA CO. Analysis Year: 2035 Description: I-90/SD 100 IMJR Freeway Data Type of analysis Diverge Number of lanes in freeway 2 Free-flow speed on freeway 70.0 mph Volume on freeway 1500 vph Off Ramp Data Side of freeway Right Number of lanes in ramp 1 Free-Flow speed on ramp 45.0 mph Volume on ramp 360 vph Length of first accel/decel lane 620 ft Length of second accel/decel lane ft Adjacent Ramp Data (if one exists) Does adjacent ramp exist? Yes Volume on adjacent ramp 150 vph Position of adjacent ramp Downstream Type of adjacent ramp On Distance to adjacent ramp 1960 ft Conversion to pc/h Under Base Conditions Junction Components Freeway Ramp Adjacent Ramp Volume, V (vph) vph Peak-hour factor, PHF Peak 15-min volume, v v Trucks and buses % Recreational vehicles % Terrain type: Rolling Rolling Rolling Grade 0.00 % 0.00 % 0.00 % Length 0.00 mi 0.00 mi 0.00 mi Trucks and buses PCE, ET Recreational vehicle PCE, ER
191 Heavy vehicle adjustment, fhv Driver population factor, fp Flow rate, vp pcph Estimation of V12 Diverge Areas L = (Equation or 13-13) EQ P = Using Equation 0 FD v = v + (v - v ) P = 1942 pc/h 12 R F R FD Capacity Checks Actual Maximum LOS F? v = v No Fi F v = v - v No FO F R v No R v or v 0 pc/h (Equation or 13-17) 3 av34 Is v or v > 2700 pc/h? No 3 av34 Is v or v > 1.5 v /2 No 3 av34 12 If yes, v = 1942 (Equation 13-15, 13-16, 13-18, or 13-19) 12A Flow Entering Diverge Influence Area Actual Max Desirable Violation? v No 12 Level of Service Determination (if not F) Density, D = v L = 15.4 pc/mi/ln R 12 D Level of service for ramp-freeway junction areas of influence B Speed Estimation Intermediate speed variable, D = S Space mean speed in ramp influence area, S = 60.6 mph R Space mean speed in outer lanes, S = N/A mph 0 Space mean speed for all vehicles, S = 60.6 mph _
192 HCS 2010: Freeway Merge and Diverge Segments Release 6.50 Phone: Fax: Diverge Analysis Analyst: HDR Agency/Co.: SDDOT Date performed: 1/2014 Analysis time period: PM PEAK Freeway/Dir of Travel: I-90/EB Junction: SD 11 Jurisdiction: MINNEHAHA CO. Analysis Year: 2035 Description: I-90/SD 100 IMJR Freeway Data Type of analysis Diverge Number of lanes in freeway 2 Free-flow speed on freeway 70.0 mph Volume on freeway 2070 vph Off Ramp Data Side of freeway Right Number of lanes in ramp 1 Free-Flow speed on ramp 45.0 mph Volume on ramp 840 vph Length of first accel/decel lane 620 ft Length of second accel/decel lane ft Adjacent Ramp Data (if one exists) Does adjacent ramp exist? Yes Volume on adjacent ramp 250 vph Position of adjacent ramp Downstream Type of adjacent ramp On Distance to adjacent ramp 1960 ft Conversion to pc/h Under Base Conditions Junction Components Freeway Ramp Adjacent Ramp Volume, V (vph) vph Peak-hour factor, PHF Peak 15-min volume, v v Trucks and buses % Recreational vehicles % Terrain type: Rolling Rolling Rolling Grade 0.00 % 0.00 % 0.00 % Length 0.00 mi 0.00 mi 0.00 mi Trucks and buses PCE, ET Recreational vehicle PCE, ER
193 Heavy vehicle adjustment, fhv Driver population factor, fp Flow rate, vp pcph Estimation of V12 Diverge Areas L = (Equation or 13-13) EQ P = Using Equation 0 FD v = v + (v - v ) P = 2680 pc/h 12 R F R FD Capacity Checks Actual Maximum LOS F? v = v No Fi F v = v - v No FO F R v No R v or v 0 pc/h (Equation or 13-17) 3 av34 Is v or v > 2700 pc/h? No 3 av34 Is v or v > 1.5 v /2 No 3 av34 12 If yes, v = 2680 (Equation 13-15, 13-16, 13-18, or 13-19) 12A Flow Entering Diverge Influence Area Actual Max Desirable Violation? v No 12 Level of Service Determination (if not F) Density, D = v L = 21.7 pc/mi/ln R 12 D Level of service for ramp-freeway junction areas of influence C Speed Estimation Intermediate speed variable, D = S Space mean speed in ramp influence area, S = 59.1 mph R Space mean speed in outer lanes, S = N/A mph 0 Space mean speed for all vehicles, S = 59.1 mph _
194 HCS 2010: Freeway Merge and Diverge Segments Release 6.50 Phone: Fax: Merge Analysis Analyst: HDR Agency/Co.: SDDOT Date performed: 1/2014 Analysis time period: AM PEAK Freeway/Dir of Travel: I-90/EB Junction: SD 11 Jurisdiction: MINNEHAHA CO. Analysis Year: 2035 Description: I-90/SD 100 IMJR Freeway Data Type of analysis Merge Number of lanes in freeway 2 Free-flow speed on freeway 70.0 mph Volume on freeway 1140 vph On Ramp Data Side of freeway Right Number of lanes in ramp 1 Free-flow speed on ramp 45.0 mph Volume on ramp 150 vph Length of first accel/decel lane 670 ft Length of second accel/decel lane ft Adjacent Ramp Data (if one exists) Does adjacent ramp exist? Yes Volume on adjacent Ramp 360 vph Position of adjacent Ramp Upstream Type of adjacent Ramp Off Distance to adjacent Ramp 1960 ft Conversion to pc/h Under Base Conditions Junction Components Freeway Ramp Adjacent Ramp Volume, V (vph) vph Peak-hour factor, PHF Peak 15-min volume, v v Trucks and buses % Recreational vehicles % Terrain type: Rolling Rolling Rolling Grade % % % Length mi mi mi Trucks and buses PCE, ET Recreational vehicle PCE, ER
195 Heavy vehicle adjustment, fhv Driver population factor, fp Flow rate, vp pcph Estimation of V12 Merge Areas L = (Equation 13-6 or 13-7) EQ P = Using Equation 0 FM v = v (P ) = 1476 pc/h 12 F FM Capacity Checks Actual Maximum LOS F? v No FO v or v 0 pc/h (Equation or 13-17) 3 av34 Is v or v > 2700 pc/h? No 3 av34 Is v or v > 1.5 v /2 No 3 av34 12 If yes, v = 1476 (Equation 13-15, 13-16, 13-18, or 13-19) 12A Flow Entering Merge Influence Area Actual Max Desirable Violation? v No R12 Level of Service Determination (if not F) Density, D = v v L = 14.1 pc/mi/ln R R 12 A Level of service for ramp-freeway junction areas of influence B Speed Estimation Intermediate speed variable, M = S Space mean speed in ramp influence area, S = 62.1 mph R Space mean speed in outer lanes, S = N/A mph 0 Space mean speed for all vehicles, S = 62.1 mph _
196 HCS 2010: Freeway Merge and Diverge Segments Release 6.50 Phone: Fax: Merge Analysis Analyst: HDR Agency/Co.: SDDOT Date performed: 1/2014 Analysis time period: PM PEAK Freeway/Dir of Travel: I-90/EB Junction: SD 11 Jurisdiction: MINNEHAHA CO. Analysis Year: 2035 Description: I-90/SD 100 IMJR Freeway Data Type of analysis Merge Number of lanes in freeway 2 Free-flow speed on freeway 70.0 mph Volume on freeway 1230 vph On Ramp Data Side of freeway Right Number of lanes in ramp 1 Free-flow speed on ramp 45.0 mph Volume on ramp 250 vph Length of first accel/decel lane 670 ft Length of second accel/decel lane ft Adjacent Ramp Data (if one exists) Does adjacent ramp exist? Yes Volume on adjacent Ramp 840 vph Position of adjacent Ramp Upstream Type of adjacent Ramp Off Distance to adjacent Ramp 1960 ft Conversion to pc/h Under Base Conditions Junction Components Freeway Ramp Adjacent Ramp Volume, V (vph) vph Peak-hour factor, PHF Peak 15-min volume, v v Trucks and buses % Recreational vehicles % Terrain type: Rolling Rolling Rolling Grade % % % Length mi mi mi Trucks and buses PCE, ET Recreational vehicle PCE, ER
197 Heavy vehicle adjustment, fhv Driver population factor, fp Flow rate, vp pcph Estimation of V12 Merge Areas L = (Equation 13-6 or 13-7) EQ P = Using Equation 0 FM v = v (P ) = 1592 pc/h 12 F FM Capacity Checks Actual Maximum LOS F? v No FO v or v 0 pc/h (Equation or 13-17) 3 av34 Is v or v > 2700 pc/h? No 3 av34 Is v or v > 1.5 v /2 No 3 av34 12 If yes, v = 1592 (Equation 13-15, 13-16, 13-18, or 13-19) 12A Flow Entering Merge Influence Area Actual Max Desirable Violation? v No R12 Level of Service Determination (if not F) Density, D = v v L = 15.9 pc/mi/ln R R 12 A Level of service for ramp-freeway junction areas of influence B Speed Estimation Intermediate speed variable, M = S Space mean speed in ramp influence area, S = 62.0 mph R Space mean speed in outer lanes, S = N/A mph 0 Space mean speed for all vehicles, S = 62.0 mph _
198 HCS 2010: Freeway Merge and Diverge Segments Release 6.50 Phone: Fax: Diverge Analysis Analyst: HDR Agency/Co.: SDDOT Date performed: 1/2014 Analysis time period: AM PEAK Freeway/Dir of Travel: I-90/WB Junction: SD 11 Jurisdiction: MINNEHAHA CO. Analysis Year: 2035 Description: I-90/SD 100 IMJR Freeway Data Type of analysis Diverge Number of lanes in freeway 2 Free-flow speed on freeway 70.0 mph Volume on freeway 1720 vph Off Ramp Data Side of freeway Right Number of lanes in ramp 1 Free-Flow speed on ramp 45.0 mph Volume on ramp 110 vph Length of first accel/decel lane 510 ft Length of second accel/decel lane ft Adjacent Ramp Data (if one exists) Does adjacent ramp exist? Yes Volume on adjacent ramp 570 vph Position of adjacent ramp Downstream Type of adjacent ramp On Distance to adjacent ramp 1980 ft Conversion to pc/h Under Base Conditions Junction Components Freeway Ramp Adjacent Ramp Volume, V (vph) vph Peak-hour factor, PHF Peak 15-min volume, v v Trucks and buses % Recreational vehicles % Terrain type: Rolling Rolling Rolling Grade 0.00 % 0.00 % 0.00 % Length 0.00 mi 0.00 mi 0.00 mi Trucks and buses PCE, ET Recreational vehicle PCE, ER
199 Heavy vehicle adjustment, fhv Driver population factor, fp Flow rate, vp pcph Estimation of V12 Diverge Areas L = (Equation or 13-13) EQ P = Using Equation 0 FD v = v + (v - v ) P = 2226 pc/h 12 R F R FD Capacity Checks Actual Maximum LOS F? v = v No Fi F v = v - v No FO F R v No R v or v 0 pc/h (Equation or 13-17) 3 av34 Is v or v > 2700 pc/h? No 3 av34 Is v or v > 1.5 v /2 No 3 av34 12 If yes, v = 2226 (Equation 13-15, 13-16, 13-18, or 13-19) 12A Flow Entering Diverge Influence Area Actual Max Desirable Violation? v No 12 Level of Service Determination (if not F) Density, D = v L = 18.8 pc/mi/ln R 12 D Level of service for ramp-freeway junction areas of influence B Speed Estimation Intermediate speed variable, D = S Space mean speed in ramp influence area, S = 61.3 mph R Space mean speed in outer lanes, S = N/A mph 0 Space mean speed for all vehicles, S = 61.3 mph _
200 HCS 2010: Freeway Merge and Diverge Segments Release 6.50 Phone: Fax: Diverge Analysis Analyst: HDR Agency/Co.: SDDOT Date performed: 1/2014 Analysis time period: PM PEAK Freeway/Dir of Travel: I-90/WB Junction: SD 11 Jurisdiction: MINNEHAHA CO. Analysis Year: 2035 Description: I-90/SD 100 IMJR Freeway Data Type of analysis Diverge Number of lanes in freeway 2 Free-flow speed on freeway 70.0 mph Volume on freeway 1210 vph Off Ramp Data Side of freeway Right Number of lanes in ramp 1 Free-Flow speed on ramp 45.0 mph Volume on ramp 170 vph Length of first accel/decel lane 510 ft Length of second accel/decel lane ft Adjacent Ramp Data (if one exists) Does adjacent ramp exist? Yes Volume on adjacent ramp 550 vph Position of adjacent ramp Downstream Type of adjacent ramp On Distance to adjacent ramp 1980 ft Conversion to pc/h Under Base Conditions Junction Components Freeway Ramp Adjacent Ramp Volume, V (vph) vph Peak-hour factor, PHF Peak 15-min volume, v v Trucks and buses % Recreational vehicles % Terrain type: Rolling Rolling Rolling Grade 0.00 % 0.00 % 0.00 % Length 0.00 mi 0.00 mi 0.00 mi Trucks and buses PCE, ET Recreational vehicle PCE, ER
201 Heavy vehicle adjustment, fhv Driver population factor, fp Flow rate, vp pcph Estimation of V12 Diverge Areas L = (Equation or 13-13) EQ P = Using Equation 0 FD v = v + (v - v ) P = 1566 pc/h 12 R F R FD Capacity Checks Actual Maximum LOS F? v = v No Fi F v = v - v No FO F R v No R v or v 0 pc/h (Equation or 13-17) 3 av34 Is v or v > 2700 pc/h? No 3 av34 Is v or v > 1.5 v /2 No 3 av34 12 If yes, v = 1566 (Equation 13-15, 13-16, 13-18, or 13-19) 12A Flow Entering Diverge Influence Area Actual Max Desirable Violation? v No 12 Level of Service Determination (if not F) Density, D = v L = 13.1 pc/mi/ln R 12 D Level of service for ramp-freeway junction areas of influence B Speed Estimation Intermediate speed variable, D = S Space mean speed in ramp influence area, S = 61.1 mph R Space mean speed in outer lanes, S = N/A mph 0 Space mean speed for all vehicles, S = 61.1 mph _
202 HCS 2010: Freeway Merge and Diverge Segments Release 6.50 Phone: Fax: Merge Analysis Analyst: HDR Agency/Co.: SDDOT Date performed: 1/2014 Analysis time period: AM PEAK Freeway/Dir of Travel: I-90/WB Junction: SD 11 Jurisdiction: MINNEHAHA CO. Analysis Year: 2035 Description: I-90/SD 100 IMJR Freeway Data Type of analysis Merge Number of lanes in freeway 2 Free-flow speed on freeway 70.0 mph Volume on freeway 1610 vph On Ramp Data Side of freeway Right Number of lanes in ramp 1 Free-flow speed on ramp 45.0 mph Volume on ramp 570 vph Length of first accel/decel lane 730 ft Length of second accel/decel lane ft Adjacent Ramp Data (if one exists) Does adjacent ramp exist? Yes Volume on adjacent Ramp 110 vph Position of adjacent Ramp Upstream Type of adjacent Ramp Off Distance to adjacent Ramp 1980 ft Conversion to pc/h Under Base Conditions Junction Components Freeway Ramp Adjacent Ramp Volume, V (vph) vph Peak-hour factor, PHF Peak 15-min volume, v v Trucks and buses % Recreational vehicles % Terrain type: Rolling Rolling Rolling Grade % % % Length mi mi mi Trucks and buses PCE, ET Recreational vehicle PCE, ER
203 Heavy vehicle adjustment, fhv Driver population factor, fp Flow rate, vp pcph Estimation of V12 Merge Areas L = (Equation 13-6 or 13-7) EQ P = Using Equation 0 FM v = v (P ) = 2084 pc/h 12 F FM Capacity Checks Actual Maximum LOS F? v No FO v or v 0 pc/h (Equation or 13-17) 3 av34 Is v or v > 2700 pc/h? No 3 av34 Is v or v > 1.5 v /2 No 3 av34 12 If yes, v = 2084 (Equation 13-15, 13-16, 13-18, or 13-19) 12A Flow Entering Merge Influence Area Actual Max Desirable Violation? v No R12 Level of Service Determination (if not F) Density, D = v v L = 22.2 pc/mi/ln R R 12 A Level of service for ramp-freeway junction areas of influence C Speed Estimation Intermediate speed variable, M = S Space mean speed in ramp influence area, S = 61.1 mph R Space mean speed in outer lanes, S = N/A mph 0 Space mean speed for all vehicles, S = 61.1 mph _
204 HCS 2010: Freeway Merge and Diverge Segments Release 6.50 Phone: Fax: Merge Analysis Analyst: HDR Agency/Co.: SDDOT Date performed: 1/2014 Analysis time period: PM PEAK Freeway/Dir of Travel: I-90/WB Junction: SD 11 Jurisdiction: MINNEHAHA CO. Analysis Year: 2035 Description: I-90/SD 100 IMJR Freeway Data Type of analysis Merge Number of lanes in freeway 2 Free-flow speed on freeway 70.0 mph Volume on freeway 1040 vph On Ramp Data Side of freeway Right Number of lanes in ramp 1 Free-flow speed on ramp 45.0 mph Volume on ramp 550 vph Length of first accel/decel lane 730 ft Length of second accel/decel lane ft Adjacent Ramp Data (if one exists) Does adjacent ramp exist? Yes Volume on adjacent Ramp 170 vph Position of adjacent Ramp Upstream Type of adjacent Ramp Off Distance to adjacent Ramp 1980 ft Conversion to pc/h Under Base Conditions Junction Components Freeway Ramp Adjacent Ramp Volume, V (vph) vph Peak-hour factor, PHF Peak 15-min volume, v v Trucks and buses % Recreational vehicles % Terrain type: Rolling Rolling Rolling Grade % % % Length mi mi mi Trucks and buses PCE, ET Recreational vehicle PCE, ER
205 Heavy vehicle adjustment, fhv Driver population factor, fp Flow rate, vp pcph Estimation of V12 Merge Areas L = (Equation 13-6 or 13-7) EQ P = Using Equation 0 FM v = v (P ) = 1346 pc/h 12 F FM Capacity Checks Actual Maximum LOS F? v No FO v or v 0 pc/h (Equation or 13-17) 3 av34 Is v or v > 2700 pc/h? No 3 av34 Is v or v > 1.5 v /2 No 3 av34 12 If yes, v = 1346 (Equation 13-15, 13-16, 13-18, or 13-19) 12A Flow Entering Merge Influence Area Actual Max Desirable Violation? v No R12 Level of Service Determination (if not F) Density, D = v v L = 16.2 pc/mi/ln R R 12 A Level of service for ramp-freeway junction areas of influence B Speed Estimation Intermediate speed variable, M = S Space mean speed in ramp influence area, S = 62.0 mph R Space mean speed in outer lanes, S = N/A mph 0 Space mean speed for all vehicles, S = 62.0 mph _
206 HCS 2010: Freeway Merge and Diverge Segments Release 6.50 Phone: Fax: Diverge Analysis Analyst: HDR Agency/Co.: SDDOT Date performed: 1/2014 Analysis time period: AM PEAK Freeway/Dir of Travel: I-90/WB Junction: TIMBERLINE RD. Jurisdiction: MINNEHAHA CO. Analysis Year: 2035 Description: I-90/SD 100 IMJR Freeway Data Type of analysis Diverge Number of lanes in freeway 2 Free-flow speed on freeway 70.0 mph Volume on freeway 2180 vph Off Ramp Data Side of freeway Right Number of lanes in ramp 1 Free-Flow speed on ramp 45.0 mph Volume on ramp 420 vph Length of first accel/decel lane 530 ft Length of second accel/decel lane ft Adjacent Ramp Data (if one exists) Does adjacent ramp exist? Yes Volume on adjacent ramp 640 vph Position of adjacent ramp Downstream Type of adjacent ramp On Distance to adjacent ramp 2020 ft Conversion to pc/h Under Base Conditions Junction Components Freeway Ramp Adjacent Ramp Volume, V (vph) vph Peak-hour factor, PHF Peak 15-min volume, v v Trucks and buses % Recreational vehicles % Terrain type: Rolling Rolling Rolling Grade 0.00 % 0.00 % 0.00 % Length 0.00 mi 0.00 mi 0.00 mi Trucks and buses PCE, ET Recreational vehicle PCE, ER
207 Heavy vehicle adjustment, fhv Driver population factor, fp Flow rate, vp pcph Estimation of V12 Diverge Areas L = (Equation or 13-13) EQ P = Using Equation 0 FD v = v + (v - v ) P = 2822 pc/h 12 R F R FD Capacity Checks Actual Maximum LOS F? v = v No Fi F v = v - v No FO F R v No R v or v 0 pc/h (Equation or 13-17) 3 av34 Is v or v > 2700 pc/h? No 3 av34 Is v or v > 1.5 v /2 No 3 av34 12 If yes, v = 2822 (Equation 13-15, 13-16, 13-18, or 13-19) 12A Flow Entering Diverge Influence Area Actual Max Desirable Violation? v No 12 Level of Service Determination (if not F) Density, D = v L = 23.8 pc/mi/ln R 12 D Level of service for ramp-freeway junction areas of influence C Speed Estimation Intermediate speed variable, D = S Space mean speed in ramp influence area, S = 60.3 mph R Space mean speed in outer lanes, S = N/A mph 0 Space mean speed for all vehicles, S = 60.3 mph _
208 HCS 2010: Freeway Merge and Diverge Segments Release 6.50 Phone: Fax: Diverge Analysis Analyst: HDR Agency/Co.: SDDOT Date performed: 1/2014 Analysis time period: PM PEAK Freeway/Dir of Travel: I-90/WB Junction: TIMBERLINE RD. Jurisdiction: MINNEHAHA CO. Analysis Year: 2035 Description: I-90/SD 100 IMJR Freeway Data Type of analysis Diverge Number of lanes in freeway 2 Free-flow speed on freeway 70.0 mph Volume on freeway 1590 vph Off Ramp Data Side of freeway Right Number of lanes in ramp 1 Free-Flow speed on ramp 45.0 mph Volume on ramp 370 vph Length of first accel/decel lane 530 ft Length of second accel/decel lane ft Adjacent Ramp Data (if one exists) Does adjacent ramp exist? Yes Volume on adjacent ramp 780 vph Position of adjacent ramp Downstream Type of adjacent ramp On Distance to adjacent ramp 2020 ft Conversion to pc/h Under Base Conditions Junction Components Freeway Ramp Adjacent Ramp Volume, V (vph) vph Peak-hour factor, PHF Peak 15-min volume, v v Trucks and buses % Recreational vehicles % Terrain type: Rolling Rolling Rolling Grade 0.00 % 0.00 % 0.00 % Length 0.00 mi 0.00 mi 0.00 mi Trucks and buses PCE, ET Recreational vehicle PCE, ER
209 Heavy vehicle adjustment, fhv Driver population factor, fp Flow rate, vp pcph Estimation of V12 Diverge Areas L = (Equation or 13-13) EQ P = Using Equation 0 FD v = v + (v - v ) P = 2058 pc/h 12 R F R FD Capacity Checks Actual Maximum LOS F? v = v No Fi F v = v - v No FO F R v No R v or v 0 pc/h (Equation or 13-17) 3 av34 Is v or v > 2700 pc/h? No 3 av34 Is v or v > 1.5 v /2 No 3 av34 12 If yes, v = 2058 (Equation 13-15, 13-16, 13-18, or 13-19) 12A Flow Entering Diverge Influence Area Actual Max Desirable Violation? v No 12 Level of Service Determination (if not F) Density, D = v L = 17.2 pc/mi/ln R 12 D Level of service for ramp-freeway junction areas of influence B Speed Estimation Intermediate speed variable, D = S Space mean speed in ramp influence area, S = 60.5 mph R Space mean speed in outer lanes, S = N/A mph 0 Space mean speed for all vehicles, S = 60.5 mph _
210 HCS 2010: Freeway Merge and Diverge Segments Release 6.50 Phone: Fax: Merge Analysis Analyst: HDR Agency/Co.: SDDOT Date performed: 1/2014 Analysis time period: AM PEAK Freeway/Dir of Travel: I-90/WB Junction: TIMBERLINE RD. Jurisdiction: MINNEHAHA CO. Analysis Year: 2035 Description: I-90/SD 100 IMJR Freeway Data Type of analysis Merge Number of lanes in freeway 2 Free-flow speed on freeway 70.0 mph Volume on freeway 1760 vph On Ramp Data Side of freeway Right Number of lanes in ramp 1 Free-flow speed on ramp 45.0 mph Volume on ramp 640 vph Length of first accel/decel lane 680 ft Length of second accel/decel lane ft Adjacent Ramp Data (if one exists) Does adjacent ramp exist? Yes Volume on adjacent Ramp 420 vph Position of adjacent Ramp Upstream Type of adjacent Ramp Off Distance to adjacent Ramp 2020 ft Conversion to pc/h Under Base Conditions Junction Components Freeway Ramp Adjacent Ramp Volume, V (vph) vph Peak-hour factor, PHF Peak 15-min volume, v v Trucks and buses % Recreational vehicles % Terrain type: Rolling Rolling Rolling Grade % % % Length mi mi mi Trucks and buses PCE, ET Recreational vehicle PCE, ER
211 Heavy vehicle adjustment, fhv Driver population factor, fp Flow rate, vp pcph Estimation of V12 Merge Areas L = (Equation 13-6 or 13-7) EQ P = Using Equation 0 FM v = v (P ) = 2278 pc/h 12 F FM Capacity Checks Actual Maximum LOS F? v No FO v or v 0 pc/h (Equation or 13-17) 3 av34 Is v or v > 2700 pc/h? No 3 av34 Is v or v > 1.5 v /2 No 3 av34 12 If yes, v = 2278 (Equation 13-15, 13-16, 13-18, or 13-19) 12A Flow Entering Merge Influence Area Actual Max Desirable Violation? v No R12 Level of Service Determination (if not F) Density, D = v v L = 24.4 pc/mi/ln R R 12 A Level of service for ramp-freeway junction areas of influence C Speed Estimation Intermediate speed variable, M = S Space mean speed in ramp influence area, S = 60.5 mph R Space mean speed in outer lanes, S = N/A mph 0 Space mean speed for all vehicles, S = 60.5 mph _
212 HCS 2010: Freeway Merge and Diverge Segments Release 6.50 Phone: Fax: Merge Analysis Analyst: HDR Agency/Co.: SDDOT Date performed: 1/2014 Analysis time period: PM PEAK Freeway/Dir of Travel: I-90/WB Junction: TIMBERLINE RD. Jurisdiction: MINNEHAHA CO. Analysis Year: 2035 Description: I-90/SD 100 IMJR Freeway Data Type of analysis Merge Number of lanes in freeway 2 Free-flow speed on freeway 70.0 mph Volume on freeway 1220 vph On Ramp Data Side of freeway Right Number of lanes in ramp 1 Free-flow speed on ramp 45.0 mph Volume on ramp 780 vph Length of first accel/decel lane 680 ft Length of second accel/decel lane ft Adjacent Ramp Data (if one exists) Does adjacent ramp exist? Yes Volume on adjacent Ramp 370 vph Position of adjacent Ramp Upstream Type of adjacent Ramp Off Distance to adjacent Ramp 2020 ft Conversion to pc/h Under Base Conditions Junction Components Freeway Ramp Adjacent Ramp Volume, V (vph) vph Peak-hour factor, PHF Peak 15-min volume, v v Trucks and buses % Recreational vehicles % Terrain type: Rolling Rolling Rolling Grade % % % Length mi mi mi Trucks and buses PCE, ET Recreational vehicle PCE, ER
213 Heavy vehicle adjustment, fhv Driver population factor, fp Flow rate, vp pcph Estimation of V12 Merge Areas L = (Equation 13-6 or 13-7) EQ P = Using Equation 0 FM v = v (P ) = 1579 pc/h 12 F FM Capacity Checks Actual Maximum LOS F? v No FO v or v 0 pc/h (Equation or 13-17) 3 av34 Is v or v > 2700 pc/h? No 3 av34 Is v or v > 1.5 v /2 No 3 av34 12 If yes, v = 1579 (Equation 13-15, 13-16, 13-18, or 13-19) 12A Flow Entering Merge Influence Area Actual Max Desirable Violation? v No R12 Level of Service Determination (if not F) Density, D = v v L = 20.3 pc/mi/ln R R 12 A Level of service for ramp-freeway junction areas of influence C Speed Estimation Intermediate speed variable, M = S Space mean speed in ramp influence area, S = 61.4 mph R Space mean speed in outer lanes, S = N/A mph 0 Space mean speed for all vehicles, S = 61.4 mph _
214 HCS 2010: Freeway Merge and Diverge Segments Release 6.50 Phone: Fax: Merge Analysis Analyst: HDR Agency/Co.: SDDOT Date performed: 1/2014 Analysis time period: AM PEAK Freeway/Dir of Travel: I-90/WB Junction: I-229 Jurisdiction: MINNEHAHA CO. Analysis Year: 2035 Description: I-90/SD 100 IMJR Freeway Data Type of analysis Merge Number of lanes in freeway 2 Free-flow speed on freeway 66.0 mph Volume on freeway 2400 vph On Ramp Data Side of freeway Right Number of lanes in ramp 1 Free-flow speed on ramp 35.0 mph Volume on ramp 290 vph Length of first accel/decel lane 740 ft Length of second accel/decel lane ft Adjacent Ramp Data (if one exists) Does adjacent ramp exist? Yes Volume on adjacent Ramp 600 vph Position of adjacent Ramp Downstream Type of adjacent Ramp Off Distance to adjacent Ramp 740 ft Conversion to pc/h Under Base Conditions Junction Components Freeway Ramp Adjacent Ramp Volume, V (vph) vph Peak-hour factor, PHF Peak 15-min volume, v v Trucks and buses % Recreational vehicles % Terrain type: Rolling Rolling Rolling Grade % % % Length mi mi mi Trucks and buses PCE, ET Recreational vehicle PCE, ER
215 Heavy vehicle adjustment, fhv Driver population factor, fp Flow rate, vp pcph Estimation of V12 Merge Areas L = (Equation 13-6 or 13-7) EQ P = Using Equation 0 FM v = v (P ) = 3107 pc/h 12 F FM Capacity Checks Actual Maximum LOS F? v No FO v or v 0 pc/h (Equation or 13-17) 3 av34 Is v or v > 2700 pc/h? No 3 av34 Is v or v > 1.5 v /2 No 3 av34 12 If yes, v = 3107 (Equation 13-15, 13-16, 13-18, or 13-19) 12A Flow Entering Merge Influence Area Actual Max Desirable Violation? v No R12 Level of Service Determination (if not F) Density, D = v v L = 27.6 pc/mi/ln R R 12 A Level of service for ramp-freeway junction areas of influence C Speed Estimation Intermediate speed variable, M = S Space mean speed in ramp influence area, S = 56.6 mph R Space mean speed in outer lanes, S = N/A mph 0 Space mean speed for all vehicles, S = 56.6 mph _
216 HCS 2010: Freeway Merge and Diverge Segments Release 6.50 Phone: Fax: Merge Analysis Analyst: HDR Agency/Co.: SDDOT Date performed: 1/2014 Analysis time period: PM PEAK Freeway/Dir of Travel: I-90/WB Junction: I-229 Jurisdiction: MINNEHAHA CO. Analysis Year: 2035 Description: I-90/SD 100 IMJR Freeway Data Type of analysis Merge Number of lanes in freeway 2 Free-flow speed on freeway 66.0 mph Volume on freeway 2000 vph On Ramp Data Side of freeway Right Number of lanes in ramp 1 Free-flow speed on ramp 35.0 mph Volume on ramp 260 vph Length of first accel/decel lane 740 ft Length of second accel/decel lane ft Adjacent Ramp Data (if one exists) Does adjacent ramp exist? Yes Volume on adjacent Ramp 520 vph Position of adjacent Ramp Downstream Type of adjacent Ramp Off Distance to adjacent Ramp 740 ft Conversion to pc/h Under Base Conditions Junction Components Freeway Ramp Adjacent Ramp Volume, V (vph) vph Peak-hour factor, PHF Peak 15-min volume, v v Trucks and buses % Recreational vehicles % Terrain type: Rolling Rolling Rolling Grade % % % Length mi mi mi Trucks and buses PCE, ET Recreational vehicle PCE, ER
217 Heavy vehicle adjustment, fhv Driver population factor, fp Flow rate, vp pcph Estimation of V12 Merge Areas L = (Equation 13-6 or 13-7) EQ P = Using Equation 0 FM v = v (P ) = 2589 pc/h 12 F FM Capacity Checks Actual Maximum LOS F? v No FO v or v 0 pc/h (Equation or 13-17) 3 av34 Is v or v > 2700 pc/h? No 3 av34 Is v or v > 1.5 v /2 No 3 av34 12 If yes, v = 2589 (Equation 13-15, 13-16, 13-18, or 13-19) 12A Flow Entering Merge Influence Area Actual Max Desirable Violation? v No R12 Level of Service Determination (if not F) Density, D = v v L = 23.3 pc/mi/ln R R 12 A Level of service for ramp-freeway junction areas of influence C Speed Estimation Intermediate speed variable, M = S Space mean speed in ramp influence area, S = 57.8 mph R Space mean speed in outer lanes, S = N/A mph 0 Space mean speed for all vehicles, S = 57.8 mph _
218 Phone: HCS 2010: Freeway Weaving Release 6.50 Fax: Operational Analysis Analyst: HDR Agency/Co.: SDDOT Date Performed: 1/2014 Analysis Time Period: AM PEAK Freeway/Dir of Travel: I-90/WB Weaving Location: I-229 ON TO I-229 OFF Analysis Year: 2035 Description: I-90/SD 100 IMJR Inputs Segment Type Freeway Weaving configuration One-Sided Number of lanes, N 3 ln Weaving segment length, LS 740 ft Freeway free-flow speed, FFS 66 mi/h Minimum segment speed, SMIN 40 mi/h Freeway maximum capacity, cifl 2350 pc/h/ln Terrain type Rolling Grade 0.00 % Length 0.00 mi Conversion to pc/h Under Base Conditions Volume Components VFF VRF VFR VRR Volume, V veh/h Peak hour factor, PHF Peak 15-min volume, v Trucks and buses % Recreational vehicles % Trucks and buses PCE, ET Recreational vehicle PCE, ER Heavy vehicle adjustment, fhv Driver population adjustment, fp Flow rate, v pc/h Volume ratio, VR Configuration Characteristics Number of maneuver lanes, NWL 2 ln Interchange density, ID 0.5 int/mi Minimum RF lane changes, LCRF 1 lc/pc Minimum FR lane changes, LCFR 1 lc/pc Minimum RR lane changes, LCRR lc/pc Minimum weaving lane changes, LCMIN 1078 lc/h Weaving lane changes, LCW 1180 lc/h Non-weaving vehicle index, INW 86 Non-weaving lane change, LCNW 303 lc/h Total lane changes, LCALL 1483 lc/h Weaving and Non-Weaving Speeds Weaving intensity factor, W 0.391
219 Average weaving speed, SW 58.7 mi/h Average non-weaving speed, SNW 52.8 mi/h Weaving Segment Speed, Density, Level of Service and Capacity Weaving segment speed, S 54.5 mi/h Weaving segment density, D 20.8 pc/mi/ln Level of service, LOS C Weaving segment v/c ratio Weaving segment flow rate, v 2926 veh/h Weaving segment capacity, cw 5063 veh/h Limitations on Weaving Segments If limit reached, see note. Minimum Maximum Actual Note Weaving length (ft) a,b Maximum Analyzed Density-based capacty, c ciwl (pc/h/ln) Maximum Analyzed v/c ratio d Notes: a. In weaving segments shorter than 300 ft, weaving vehicles are assumed to make only necessary lane changes. b. Weaving segments longer than the calculated maximum length should be treated as isolated merge and diverge areas using the procedures of Chapter 13, "Freeway Merge and Diverge Segments." c. The density-based capacity exceeds the capacity of a basic freeway segment, under equivalent ideal conditions. d. Volumes exceed the weaving segment capacity. The level of service is F.
220 Phone: HCS 2010: Freeway Weaving Release 6.50 Fax: Operational Analysis Analyst: HDR Agency/Co.: SDDOT Date Performed: 1/2014 Analysis Time Period: PM PEAK Freeway/Dir of Travel: I-90/WB Weaving Location: I-229 ON TO I-229 OFF Analysis Year: 2035 Description: I-90/SD 100 IMJR Inputs Segment Type Freeway Weaving configuration One-Sided Number of lanes, N 3 ln Weaving segment length, LS 740 ft Freeway free-flow speed, FFS 66 mi/h Minimum segment speed, SMIN 40 mi/h Freeway maximum capacity, cifl 2350 pc/h/ln Terrain type Rolling Grade 0.00 % Length 0.00 mi Conversion to pc/h Under Base Conditions Volume Components VFF VRF VFR VRR Volume, V veh/h Peak hour factor, PHF Peak 15-min volume, v Trucks and buses % Recreational vehicles % Trucks and buses PCE, ET Recreational vehicle PCE, ER Heavy vehicle adjustment, fhv Driver population adjustment, fp Flow rate, v pc/h Volume ratio, VR Configuration Characteristics Number of maneuver lanes, NWL 2 ln Interchange density, ID 0.5 int/mi Minimum RF lane changes, LCRF 1 lc/pc Minimum FR lane changes, LCFR 1 lc/pc Minimum RR lane changes, LCRR lc/pc Minimum weaving lane changes, LCMIN 945 lc/h Weaving lane changes, LCW 1047 lc/h Non-weaving vehicle index, INW 71 Non-weaving lane change, LCNW 218 lc/h Total lane changes, LCALL 1265 lc/h Weaving and Non-Weaving Speeds Weaving intensity factor, W 0.345
221 Average weaving speed, SW 59.3 mi/h Average non-weaving speed, SNW 54.6 mi/h Weaving Segment Speed, Density, Level of Service and Capacity Weaving segment speed, S 56.1 mi/h Weaving segment density, D 17.0 pc/mi/ln Level of service, LOS B Weaving segment v/c ratio Weaving segment flow rate, v 2456 veh/h Weaving segment capacity, cw 5032 veh/h Limitations on Weaving Segments If limit reached, see note. Minimum Maximum Actual Note Weaving length (ft) a,b Maximum Analyzed Density-based capacty, c ciwl (pc/h/ln) Maximum Analyzed v/c ratio d Notes: a. In weaving segments shorter than 300 ft, weaving vehicles are assumed to make only necessary lane changes. b. Weaving segments longer than the calculated maximum length should be treated as isolated merge and diverge areas using the procedures of Chapter 13, "Freeway Merge and Diverge Segments." c. The density-based capacity exceeds the capacity of a basic freeway segment, under equivalent ideal conditions. d. Volumes exceed the weaving segment capacity. The level of service is F.
222 HCS 2010: Freeway Merge and Diverge Segments Release 6.50 Phone: Fax: Diverge Analysis Analyst: HDR Agency/Co.: SDDOT Date performed: 1/2014 Analysis time period: AM PEAK Freeway/Dir of Travel: I-90/WB Junction: I-229 Jurisdiction: MINNEHAHA CO. Analysis Year: 2035 Description: I-90/SD 100 IMJR Freeway Data Type of analysis Diverge Number of lanes in freeway 2 Free-flow speed on freeway 66.0 mph Volume on freeway 2690 vph Off Ramp Data Side of freeway Right Number of lanes in ramp 1 Free-Flow speed on ramp 35.0 mph Volume on ramp 600 vph Length of first accel/decel lane 740 ft Length of second accel/decel lane ft Adjacent Ramp Data (if one exists) Does adjacent ramp exist? Yes Volume on adjacent ramp 290 vph Position of adjacent ramp Upstream Type of adjacent ramp On Distance to adjacent ramp 740 ft Conversion to pc/h Under Base Conditions Junction Components Freeway Ramp Adjacent Ramp Volume, V (vph) vph Peak-hour factor, PHF Peak 15-min volume, v v Trucks and buses % Recreational vehicles % Terrain type: Rolling Rolling Rolling Grade 0.00 % 0.00 % 0.00 % Length 0.00 mi 0.00 mi 0.00 mi Trucks and buses PCE, ET Recreational vehicle PCE, ER
223 Heavy vehicle adjustment, fhv Driver population factor, fp Flow rate, vp pcph Estimation of V12 Diverge Areas L = (Equation or 13-13) EQ P = Using Equation 0 FD v = v + (v - v ) P = 3482 pc/h 12 R F R FD Capacity Checks Actual Maximum LOS F? v = v No Fi F v = v - v No FO F R v No R v or v 0 pc/h (Equation or 13-17) 3 av34 Is v or v > 2700 pc/h? No 3 av34 Is v or v > 1.5 v /2 No 3 av34 12 If yes, v = 3482 (Equation 13-15, 13-16, 13-18, or 13-19) 12A Flow Entering Diverge Influence Area Actual Max Desirable Violation? v No 12 Level of Service Determination (if not F) Density, D = v L = 27.5 pc/mi/ln R 12 D Level of service for ramp-freeway junction areas of influence C Speed Estimation Intermediate speed variable, D = S Space mean speed in ramp influence area, S = 54.2 mph R Space mean speed in outer lanes, S = N/A mph 0 Space mean speed for all vehicles, S = 54.2 mph _
224 HCS 2010: Freeway Merge and Diverge Segments Release 6.50 Phone: Fax: Diverge Analysis Analyst: HDR Agency/Co.: SDDOT Date performed: 1/2014 Analysis time period: PM PEAK Freeway/Dir of Travel: I-90/WB Junction: I-229 Jurisdiction: MINNEHAHA CO. Analysis Year: 2035 Description: I-90/SD 100 IMJR Freeway Data Type of analysis Diverge Number of lanes in freeway 2 Free-flow speed on freeway 66.0 mph Volume on freeway 2260 vph Off Ramp Data Side of freeway Right Number of lanes in ramp 1 Free-Flow speed on ramp 35.0 mph Volume on ramp 520 vph Length of first accel/decel lane 740 ft Length of second accel/decel lane ft Adjacent Ramp Data (if one exists) Does adjacent ramp exist? Yes Volume on adjacent ramp 260 vph Position of adjacent ramp Upstream Type of adjacent ramp On Distance to adjacent ramp 740 ft Conversion to pc/h Under Base Conditions Junction Components Freeway Ramp Adjacent Ramp Volume, V (vph) vph Peak-hour factor, PHF Peak 15-min volume, v v Trucks and buses % Recreational vehicles % Terrain type: Rolling Rolling Rolling Grade 0.00 % 0.00 % 0.00 % Length 0.00 mi 0.00 mi 0.00 mi Trucks and buses PCE, ET Recreational vehicle PCE, ER
225 Heavy vehicle adjustment, fhv Driver population factor, fp Flow rate, vp pcph Estimation of V12 Diverge Areas L = (Equation or 13-13) EQ P = Using Equation 0 FD v = v + (v - v ) P = 2925 pc/h 12 R F R FD Capacity Checks Actual Maximum LOS F? v = v No Fi F v = v - v No FO F R v No R v or v 0 pc/h (Equation or 13-17) 3 av34 Is v or v > 2700 pc/h? No 3 av34 Is v or v > 1.5 v /2 No 3 av34 12 If yes, v = 2925 (Equation 13-15, 13-16, 13-18, or 13-19) 12A Flow Entering Diverge Influence Area Actual Max Desirable Violation? v No 12 Level of Service Determination (if not F) Density, D = v L = 22.7 pc/mi/ln R 12 D Level of service for ramp-freeway junction areas of influence C Speed Estimation Intermediate speed variable, D = S Space mean speed in ramp influence area, S = 54.4 mph R Space mean speed in outer lanes, S = N/A mph 0 Space mean speed for all vehicles, S = 54.4 mph _
226 Appendix Part Crossroad Level of Service I-90/Timberline Road Interchange
227 HCS 2010 Signalized Intersection Results Summary General Information Intersection Information Agency SDDOT Duration, h 1.00 Analyst HDR Analysis Date Jan 13, 2014 Area Type Other Jurisdiction MINNEHAHA CO. Time Period AM PEAK PHF 1.00 Intersection 60TH ST. N. Analysis Year 2035 Analysis Period 1> 7:00 File Name 60-TIMBER AM 2035.xus Project Description 2035 AM NO-BUILD Demand Information EB WB NB SB Approach Movement L T R L T R L T R L T R Demand (v), veh/h Signal Information Cycle, s 80.0 Reference Phase 2 Offset, s 0 Reference Point Begin Uncoordinated No Simult. Gap E/W On Force Mode Fixed Simult. Gap N/S On Green Yellow Red Timer Results EBL EBT WBL WBT NBL NBT SBL SBT Assigned Phase Case Number Phase Duration, s Change Period, (Y+Rc), s Max Allow Headway (MAH), s Queue Clearance Time (gs), s Green Extension Time (ge), s Phase Call Probability Max Out Probability Movement Group Results EB WB NB SB Approach Movement L T R L T R L T R L T R Assigned Movement Adjusted Flow Rate (v), veh/h Adjusted Saturation Flow Rate (s), veh/h/ln Queue Service Time (gs), s Cycle Queue Clearance Time (gc), s Green Ratio (g/c) Capacity (c), veh/h Volume-to-Capacity Ratio (X) Available Capacity (ca), veh/h Back of Queue (Q), veh/ln (50th percentile) Queue Storage Ratio (RQ) (50th percentile) Uniform Delay (d1), s/veh Incremental Delay (d2), s/veh Initial Queue Delay (d3), s/veh Control Delay (d), s/veh Level of Service (LOS) C C D C C E C C D C Approach Delay, s/veh / LOS 29.0 C 37.9 D 41.5 D 35.7 D Intersection Delay, s/veh / LOS 38.1 D Multimodal Results EB WB NB SB Pedestrian LOS Score / LOS 3.5 C 3.4 C 2.4 B 2.8 C Bicycle LOS Score / LOS 0.9 A 1.2 A 1.3 A 1.1 A Copyright 2014 University of Florida, All Rights Reserved. HCS 2010 Streets Version 6.50 Generated: 1/2/2014 1:26:14 PM
228 HCS 2010 Signalized Intersection Results Summary General Information Intersection Information Agency SDDOT Duration, h 1.00 Analyst HDR Analysis Date Jan 13, 2014 Area Type Other Jurisdiction MINNEHAHA CO. Time Period PM PEAK PHF 1.00 Intersection 60TH ST. N. Analysis Year 2035 Analysis Period 1> 7:00 File Name 60-TIMBER PM 2035.xus Project Description 2035 PM - NO BUILD Demand Information EB WB NB SB Approach Movement L T R L T R L T R L T R Demand (v), veh/h Signal Information Cycle, s 80.0 Reference Phase 2 Offset, s 0 Reference Point Begin Uncoordinated No Simult. Gap E/W On Force Mode Fixed Simult. Gap N/S On Green Yellow Red Timer Results EBL EBT WBL WBT NBL NBT SBL SBT Assigned Phase Case Number Phase Duration, s Change Period, (Y+Rc), s Max Allow Headway (MAH), s Queue Clearance Time (gs), s Green Extension Time (ge), s Phase Call Probability Max Out Probability Movement Group Results EB WB NB SB Approach Movement L T R L T R L T R L T R Assigned Movement Adjusted Flow Rate (v), veh/h Adjusted Saturation Flow Rate (s), veh/h/ln Queue Service Time (gs), s Cycle Queue Clearance Time (gc), s Green Ratio (g/c) Capacity (c), veh/h Volume-to-Capacity Ratio (X) Available Capacity (ca), veh/h Back of Queue (Q), veh/ln (50th percentile) Queue Storage Ratio (RQ) (50th percentile) Uniform Delay (d1), s/veh Incremental Delay (d2), s/veh Initial Queue Delay (d3), s/veh Control Delay (d), s/veh Level of Service (LOS) C C D C C D D C F C Approach Delay, s/veh / LOS 29.5 C 34.1 C 44.2 D 42.7 D Intersection Delay, s/veh / LOS 41.7 D Multimodal Results EB WB NB SB Pedestrian LOS Score / LOS 3.5 C 3.4 C 2.4 B 2.8 C Bicycle LOS Score / LOS 0.9 A 1.0 A 1.6 A 1.0 A Copyright 2014 University of Florida, All Rights Reserved. HCS 2010 Streets Version 6.60 Generated: 8/25/2014 8:50:39 AM
229 HCS+: Unsignalized Intersections Release 5.6 TWO-WAY STOP CONTROL SUMMARY Analyst: HDR Agency/Co.: SDDOT Date Performed: 1/2014 Analysis Time Period: AM PEAK Intersection: TIMBERLINE RD. Jurisdiction: MINNEHAHA CO. Units: U. S. Customary Analysis Year: 2035 Project ID: East/West Street: I-90 EB North/South Street: TIMBERLINE RD. Intersection Orientation: NS Study period (hrs): 1.00 Vehicle Volumes and Adjustments Major Street: Approach Northbound Southbound Movement L T R L T R Volume Peak-Hour Factor, PHF Hourly Flow Rate, HFR Percent Heavy Vehicles Median Type/Storage Undivided / RT Channelized? Lanes Configuration TR LT Upstream Signal? No No Minor Street: Approach Westbound Eastbound Movement L T R L T R Volume Peak Hour Factor, PHF Hourly Flow Rate, HFR Percent Heavy Vehicles 1 1 Percent Grade (%) 2 2 Flared Approach: Exists?/Storage / No / Lanes 0 0 Configuration LR Delay, Queue Length, and Level of Service Approach NB SB Westbound Eastbound Movement Lane Config LT LR v (vph) C(m) (vph) v/c % queue length Control Delay LOS B F Approach Delay Approach LOS F
230 HCS+: Unsignalized Intersections Release 5.6 Phone: Fax: TWO-WAY STOP CONTROL(TWSC) ANALYSIS Analyst: HDR Agency/Co.: SDDOT Date Performed: 1/2014 Analysis Time Period: AM PEAK Intersection: TIMBERLINE RD. Jurisdiction: MINNEHAHA CO. Units: U. S. Customary Analysis Year: 2035 Project ID: East/West Street: I-90 EB North/South Street: TIMBERLINE RD. Intersection Orientation: NS Study period (hrs): 1.00 Vehicle Volumes and Adjustments Major Street Movements L T R L T R Volume Peak-Hour Factor, PHF Peak-15 Minute Volume Hourly Flow Rate, HFR Percent Heavy Vehicles Median Type/Storage Undivided / RT Channelized? Lanes Configuration TR LT Upstream Signal? No No Minor Street Movements L T R L T R Volume Peak Hour Factor, PHF Peak-15 Minute Volume Hourly Flow Rate, HFR Percent Heavy Vehicles 1 1 Percent Grade (%) 2 2 Flared Approach: Exists?/Storage / No / RT Channelized? Lanes 0 0 Configuration LR Pedestrian Volumes and Adjustments Movements Flow (ped/hr)
231 Lane Width (ft) Walking Speed (ft/sec) Percent Blockage Upstream Signal Data Prog. Sat Arrival Green Cycle Prog. Distance Flow Flow Type Time Length Speed to Signal vph vph sec sec mph feet S2 Left-Turn Through S5 Left-Turn Through Worksheet 3-Data for Computing Effect of Delay to Major Street Vehicles Movement 2 Movement 5 Shared ln volume, major th vehicles: 933 Shared ln volume, major rt vehicles: 0 Sat flow rate, major th vehicles: 1700 Sat flow rate, major rt vehicles: 1700 Number of major street through lanes: 1 Worksheet 4-Critical Gap and Follow-up Time Calculation Critical Gap Calculation Movement L L L T R L T R t(c,base) t(c,hv) P(hv) t(c,g) Percent Grade t(3,lt) t(c,t): 1-stage stage t(c) 1-stage stage Follow-Up Time Calculations Movement L L L T R L T R t(f,base) t(f,hv) P(HV) t(f) Worksheet 5-Effect of Upstream Signals Computation 1-Queue Clearance Time at Upstream Signal Movement 2 Movement 5 V(t) V(l,prot) V(t) V(l,prot) V prog
232 Total Saturation Flow Rate, s (vph) Arrival Type Effective Green, g (sec) Cycle Length, C (sec) Rp (from Exhibit 16-11) Proportion vehicles arriving on green P g(q1) g(q2) g(q) Computation 2-Proportion of TWSC Intersection Time blocked Movement 2 Movement 5 V(t) V(l,prot) V(t) V(l,prot) alpha beta Travel time, t(a) (sec) Smoothing Factor, F Proportion of conflicting flow, f Max platooned flow, V(c,max) Min platooned flow, V(c,min) Duration of blocked period, t(p) Proportion time blocked, p Computation 3-Platoon Event Periods Result p(2) p(5) p(dom) p(subo) Constrained or unconstrained? Proportion unblocked (1) (2) (3) for minor Single-stage Two-Stage Process movements, p(x) Process Stage I Stage II p(1) p(4) p(7) p(8) p(9) p(10) p(11) p(12) Computation 4 and 5 Single-Stage Process Movement L L L T R L T R V c,x s Px V c,u,x C r,x C plat,x Two-Stage Process
233 Stage1 Stage2 Stage1 Stage2 Stage1 Stage2 Stage1 Stage2 V(c,x) s 1500 P(x) V(c,u,x) C(r,x) C(plat,x) Worksheet 6-Impedance and Capacity Equations Step 1: RT from Minor St Conflicting Flows 933 Potential Capacity 308 Pedestrian Impedance Factor Movement Capacity 308 Probability of Queue free St Step 2: LT from Major St. 4 1 Conflicting Flows 1311 Potential Capacity 518 Pedestrian Impedance Factor Movement Capacity 518 Probability of Queue free St Maj L-Shared Prob Q free St Step 3: TH from Minor St Conflicting Flows Potential Capacity Pedestrian Impedance Factor Cap. Adj. factor due to Impeding mvmnt Movement Capacity Probability of Queue free St Step 4: LT from Minor St Conflicting Flows 2243 Potential Capacity 36 Pedestrian Impedance Factor Maj. L, Min T Impedance factor 0.67 Maj. L, Min T Adj. Imp Factor Cap. Adj. factor due to Impeding mvmnt Movement Capacity 31 Worksheet 7-Computation of the Effect of Two-stage Gap Acceptance Step 3: TH from Minor St Part 1 - First Stage Conflicting Flows Potential Capacity Pedestrian Impedance Factor Cap. Adj. factor due to Impeding mvmnt Movement Capacity Probability of Queue free St.
234 Part 2 - Second Stage Conflicting Flows Potential Capacity Pedestrian Impedance Factor Cap. Adj. factor due to Impeding mvmnt Movement Capacity Part 3 - Single Stage Conflicting Flows Potential Capacity Pedestrian Impedance Factor Cap. Adj. factor due to Impeding mvmnt Movement Capacity Result for 2 stage process: a y C t Probability of Queue free St Step 4: LT from Minor St Part 1 - First Stage Conflicting Flows Potential Capacity Pedestrian Impedance Factor Cap. Adj. factor due to Impeding mvmnt Movement Capacity Part 2 - Second Stage Conflicting Flows Potential Capacity Pedestrian Impedance Factor Cap. Adj. factor due to Impeding mvmnt Movement Capacity Part 3 - Single Stage Conflicting Flows 2243 Potential Capacity 36 Pedestrian Impedance Factor Maj. L, Min T Impedance factor 0.67 Maj. L, Min T Adj. Imp Factor Cap. Adj. factor due to Impeding mvmnt Movement Capacity 31 Results for Two-stage process: a y C t 31 Worksheet 8-Shared Lane Calculations Movement L T R L T R Volume (vph) Movement Capacity (vph) Shared Lane Capacity (vph) 130
235 Worksheet 9-Computation of Effect of Flared Minor Street Approaches Movement L T R L T R C sep Volume Delay Q sep Q sep +1 round (Qsep +1) n max C sh 130 SUM C sep n C act Worksheet 10-Delay, Queue Length, and Level of Service Movement Lane Config LT LR v (vph) C(m) (vph) v/c % queue length Control Delay LOS B F Approach Delay Approach LOS F Worksheet 11-Shared Major LT Impedance and Delay Movement 2 Movement 5 p(oj) v(il), Volume for stream 2 or v(i2), Volume for stream 3 or 6 0 s(il), Saturation flow rate for stream 2 or s(i2), Saturation flow rate for stream 3 or P*(oj) 0.67 d(m,lt), Delay for stream 1 or N, Number of major street through lanes 1 d(rank,1) Delay for stream 2 or 5 4.3
236 HCS+: Unsignalized Intersections Release 5.6 TWO-WAY STOP CONTROL SUMMARY Analyst: HDR Agency/Co.: SDDOT Date Performed: Analysis Time Period: PM PEAK Intersection: TIMBERLINE RD. Jurisdiction: MINNEHAHA CO. Units: U. S. Customary Analysis Year: 2035 Project ID: I-90/Timberline IMJR East/West Street: I-90 EB North/South Street: TIMBERLINE RD. Intersection Orientation: NS Study period (hrs): 1.00 Vehicle Volumes and Adjustments Major Street: Approach Northbound Southbound Movement L T R L T R Volume Peak-Hour Factor, PHF Hourly Flow Rate, HFR Percent Heavy Vehicles Median Type/Storage Undivided / RT Channelized? Lanes Configuration TR LT Upstream Signal? No No Minor Street: Approach Westbound Eastbound Movement L T R L T R Volume Peak Hour Factor, PHF Hourly Flow Rate, HFR Percent Heavy Vehicles 1 1 Percent Grade (%) 2 2 Flared Approach: Exists?/Storage / No / Lanes 0 0 Configuration LR Delay, Queue Length, and Level of Service Approach NB SB Westbound Eastbound Movement Lane Config LT LR v (vph) C(m) (vph) v/c % queue length Control Delay LOS C F Approach Delay Approach LOS F
237 HCS+: Unsignalized Intersections Release 5.6 Phone: Fax: TWO-WAY STOP CONTROL(TWSC) ANALYSIS Analyst: HDR Agency/Co.: SDDOT Date Performed: Analysis Time Period: PM PEAK Intersection: TIMBERLINE RD. Jurisdiction: MINNEHAHA CO. Units: U. S. Customary Analysis Year: 2035 Project ID: I-90/Timberline IMJR East/West Street: I-90 EB North/South Street: TIMBERLINE RD. Intersection Orientation: NS Study period (hrs): 1.00 Vehicle Volumes and Adjustments Major Street Movements L T R L T R Volume Peak-Hour Factor, PHF Peak-15 Minute Volume Hourly Flow Rate, HFR Percent Heavy Vehicles Median Type/Storage Undivided / RT Channelized? Lanes Configuration TR LT Upstream Signal? No No Minor Street Movements L T R L T R Volume Peak Hour Factor, PHF Peak-15 Minute Volume Hourly Flow Rate, HFR Percent Heavy Vehicles 1 1 Percent Grade (%) 2 2 Flared Approach: Exists?/Storage / No / RT Channelized? Lanes 0 0 Configuration LR Pedestrian Volumes and Adjustments Movements Flow (ped/hr)
238 Lane Width (ft) Walking Speed (ft/sec) Percent Blockage Upstream Signal Data Prog. Sat Arrival Green Cycle Prog. Distance Flow Flow Type Time Length Speed to Signal vph vph sec sec mph feet S2 Left-Turn Through S5 Left-Turn Through Worksheet 3-Data for Computing Effect of Delay to Major Street Vehicles Movement 2 Movement 5 Shared ln volume, major th vehicles: 644 Shared ln volume, major rt vehicles: 0 Sat flow rate, major th vehicles: 1700 Sat flow rate, major rt vehicles: 1700 Number of major street through lanes: 1 Worksheet 4-Critical Gap and Follow-up Time Calculation Critical Gap Calculation Movement L L L T R L T R t(c,base) t(c,hv) P(hv) t(c,g) Percent Grade t(3,lt) t(c,t): 1-stage stage t(c) 1-stage stage Follow-Up Time Calculations Movement L L L T R L T R t(f,base) t(f,hv) P(HV) t(f) Worksheet 5-Effect of Upstream Signals Computation 1-Queue Clearance Time at Upstream Signal Movement 2 Movement 5 V(t) V(l,prot) V(t) V(l,prot) V prog
239 Total Saturation Flow Rate, s (vph) Arrival Type Effective Green, g (sec) Cycle Length, C (sec) Rp (from Exhibit 16-11) Proportion vehicles arriving on green P g(q1) g(q2) g(q) Computation 2-Proportion of TWSC Intersection Time blocked Movement 2 Movement 5 V(t) V(l,prot) V(t) V(l,prot) alpha beta Travel time, t(a) (sec) Smoothing Factor, F Proportion of conflicting flow, f Max platooned flow, V(c,max) Min platooned flow, V(c,min) Duration of blocked period, t(p) Proportion time blocked, p Computation 3-Platoon Event Periods Result p(2) p(5) p(dom) p(subo) Constrained or unconstrained? Proportion unblocked (1) (2) (3) for minor Single-stage Two-Stage Process movements, p(x) Process Stage I Stage II p(1) p(4) p(7) p(8) p(9) p(10) p(11) p(12) Computation 4 and 5 Single-Stage Process Movement L L L T R L T R V c,x s Px V c,u,x C r,x C plat,x Two-Stage Process
240 Stage1 Stage2 Stage1 Stage2 Stage1 Stage2 Stage1 Stage2 V(c,x) s 1500 P(x) V(c,u,x) C(r,x) C(plat,x) Worksheet 6-Impedance and Capacity Equations Step 1: RT from Minor St Conflicting Flows 644 Potential Capacity 458 Pedestrian Impedance Factor Movement Capacity 458 Probability of Queue free St Step 2: LT from Major St. 4 1 Conflicting Flows 1844 Potential Capacity 322 Pedestrian Impedance Factor Movement Capacity 322 Probability of Queue free St Maj L-Shared Prob Q free St Step 3: TH from Minor St Conflicting Flows Potential Capacity Pedestrian Impedance Factor Cap. Adj. factor due to Impeding mvmnt Movement Capacity Probability of Queue free St Step 4: LT from Minor St Conflicting Flows 2442 Potential Capacity 27 Pedestrian Impedance Factor Maj. L, Min T Impedance factor 0.62 Maj. L, Min T Adj. Imp Factor Cap. Adj. factor due to Impeding mvmnt Movement Capacity 21 Worksheet 7-Computation of the Effect of Two-stage Gap Acceptance Step 3: TH from Minor St Part 1 - First Stage Conflicting Flows Potential Capacity Pedestrian Impedance Factor Cap. Adj. factor due to Impeding mvmnt Movement Capacity Probability of Queue free St.
241 Part 2 - Second Stage Conflicting Flows Potential Capacity Pedestrian Impedance Factor Cap. Adj. factor due to Impeding mvmnt Movement Capacity Part 3 - Single Stage Conflicting Flows Potential Capacity Pedestrian Impedance Factor Cap. Adj. factor due to Impeding mvmnt Movement Capacity Result for 2 stage process: a y C t Probability of Queue free St Step 4: LT from Minor St Part 1 - First Stage Conflicting Flows Potential Capacity Pedestrian Impedance Factor Cap. Adj. factor due to Impeding mvmnt Movement Capacity Part 2 - Second Stage Conflicting Flows Potential Capacity Pedestrian Impedance Factor Cap. Adj. factor due to Impeding mvmnt Movement Capacity Part 3 - Single Stage Conflicting Flows 2442 Potential Capacity 27 Pedestrian Impedance Factor Maj. L, Min T Impedance factor 0.62 Maj. L, Min T Adj. Imp Factor Cap. Adj. factor due to Impeding mvmnt Movement Capacity 21 Results for Two-stage process: a y C t 21 Worksheet 8-Shared Lane Calculations Movement L T R L T R Volume (vph) Movement Capacity (vph) Shared Lane Capacity (vph) 90
242 Worksheet 9-Computation of Effect of Flared Minor Street Approaches Movement L T R L T R C sep Volume Delay Q sep Q sep +1 round (Qsep +1) n max C sh 90 SUM C sep n C act Worksheet 10-Delay, Queue Length, and Level of Service Movement Lane Config LT LR v (vph) C(m) (vph) v/c % queue length Control Delay LOS C F Approach Delay Approach LOS F Worksheet 11-Shared Major LT Impedance and Delay Movement 2 Movement 5 p(oj) v(il), Volume for stream 2 or v(i2), Volume for stream 3 or 6 0 s(il), Saturation flow rate for stream 2 or s(i2), Saturation flow rate for stream 3 or P*(oj) 0.62 d(m,lt), Delay for stream 1 or N, Number of major street through lanes 1 d(rank,1) Delay for stream 2 or 5 7.6
243 HCS+: Unsignalized Intersections Release 5.6 TWO-WAY STOP CONTROL SUMMARY Analyst: HDR Agency/Co.: SDDOT Date Performed: Analysis Time Period: AM PEAK Intersection: TIMBERLINE RD. Jurisdiction: MINNEHAHA CO. Units: U. S. Customary Analysis Year: 2035 Project ID: I-90/Timberline IMJR East/West Street: I-90 WB North/South Street: TIMBERLINE RD. Intersection Orientation: NS Study period (hrs): 1.00 Vehicle Volumes and Adjustments Major Street: Approach Northbound Southbound Movement L T R L T R Volume Peak-Hour Factor, PHF Hourly Flow Rate, HFR Percent Heavy Vehicles Median Type/Storage Undivided / RT Channelized? Lanes Configuration LT TR Upstream Signal? No No Minor Street: Approach Westbound Eastbound Movement L T R L T R Volume Peak Hour Factor, PHF Hourly Flow Rate, HFR Percent Heavy Vehicles Percent Grade (%) 2 0 Flared Approach: Exists?/Storage Yes /50 / Lanes 0 0 Configuration LR Delay, Queue Length, and Level of Service Approach NB SB Westbound Eastbound Movement Lane Config LT LR v (vph) C(m) (vph) v/c % queue length Control Delay LOS C F Approach Delay Approach LOS F
244 HCS+: Unsignalized Intersections Release 5.6 Phone: Fax: TWO-WAY STOP CONTROL(TWSC) ANALYSIS Analyst: HDR Agency/Co.: SDDOT Date Performed: Analysis Time Period: AM PEAK Intersection: TIMBERLINE RD. Jurisdiction: MINNEHAHA CO. Units: U. S. Customary Analysis Year: 2035 Project ID: I-90/Timberline IMJR East/West Street: I-90 WB North/South Street: TIMBERLINE RD. Intersection Orientation: NS Study period (hrs): 1.00 Vehicle Volumes and Adjustments Major Street Movements L T R L T R Volume Peak-Hour Factor, PHF Peak-15 Minute Volume Hourly Flow Rate, HFR Percent Heavy Vehicles Median Type/Storage Undivided / RT Channelized? Lanes Configuration LT TR Upstream Signal? No No Minor Street Movements L T R L T R Volume Peak Hour Factor, PHF Peak-15 Minute Volume Hourly Flow Rate, HFR Percent Heavy Vehicles Percent Grade (%) 2 0 Flared Approach: Exists?/Storage Yes /50 / RT Channelized? Lanes 0 0 Configuration LR Pedestrian Volumes and Adjustments Movements Flow (ped/hr)
245 Lane Width (ft) Walking Speed (ft/sec) Percent Blockage Upstream Signal Data Prog. Sat Arrival Green Cycle Prog. Distance Flow Flow Type Time Length Speed to Signal vph vph sec sec mph feet S2 Left-Turn Through S5 Left-Turn Through Worksheet 3-Data for Computing Effect of Delay to Major Street Vehicles Movement 2 Movement 5 Shared ln volume, major th vehicles: 600 Shared ln volume, major rt vehicles: 0 Sat flow rate, major th vehicles: 1700 Sat flow rate, major rt vehicles: 1700 Number of major street through lanes: 1 Worksheet 4-Critical Gap and Follow-up Time Calculation Critical Gap Calculation Movement L L L T R L T R t(c,base) t(c,hv) P(hv) t(c,g) Percent Grade t(3,lt) t(c,t): 1-stage stage t(c) 1-stage stage Follow-Up Time Calculations Movement L L L T R L T R t(f,base) t(f,hv) P(HV) t(f) Worksheet 5-Effect of Upstream Signals Computation 1-Queue Clearance Time at Upstream Signal Movement 2 Movement 5 V(t) V(l,prot) V(t) V(l,prot) V prog
246 Total Saturation Flow Rate, s (vph) Arrival Type Effective Green, g (sec) Cycle Length, C (sec) Rp (from Exhibit 16-11) Proportion vehicles arriving on green P g(q1) g(q2) g(q) Computation 2-Proportion of TWSC Intersection Time blocked Movement 2 Movement 5 V(t) V(l,prot) V(t) V(l,prot) alpha beta Travel time, t(a) (sec) Smoothing Factor, F Proportion of conflicting flow, f Max platooned flow, V(c,max) Min platooned flow, V(c,min) Duration of blocked period, t(p) Proportion time blocked, p Computation 3-Platoon Event Periods Result p(2) p(5) p(dom) p(subo) Constrained or unconstrained? Proportion unblocked (1) (2) (3) for minor Single-stage Two-Stage Process movements, p(x) Process Stage I Stage II p(1) p(4) p(7) p(8) p(9) p(10) p(11) p(12) Computation 4 and 5 Single-Stage Process Movement L L L T R L T R V c,x s Px V c,u,x C r,x C plat,x Two-Stage Process
247 Stage1 Stage2 Stage1 Stage2 Stage1 Stage2 Stage1 Stage2 V(c,x) s 1500 P(x) V(c,u,x) C(r,x) C(plat,x) Worksheet 6-Impedance and Capacity Equations Step 1: RT from Minor St Conflicting Flows 600 Potential Capacity 469 Pedestrian Impedance Factor Movement Capacity 469 Probability of Queue free St Step 2: LT from Major St. 4 1 Conflicting Flows 777 Potential Capacity 826 Pedestrian Impedance Factor Movement Capacity 826 Probability of Queue free St Maj L-Shared Prob Q free St Step 3: TH from Minor St Conflicting Flows Potential Capacity Pedestrian Impedance Factor Cap. Adj. factor due to Impeding mvmnt Movement Capacity Probability of Queue free St Step 4: LT from Minor St Conflicting Flows 2382 Potential Capacity 27 Pedestrian Impedance Factor Maj. L, Min T Impedance factor 0.00 Maj. L, Min T Adj. Imp Factor Cap. Adj. factor due to Impeding mvmnt Movement Capacity 9 Worksheet 7-Computation of the Effect of Two-stage Gap Acceptance Step 3: TH from Minor St Part 1 - First Stage Conflicting Flows Potential Capacity Pedestrian Impedance Factor Cap. Adj. factor due to Impeding mvmnt Movement Capacity Probability of Queue free St.
248 Part 2 - Second Stage Conflicting Flows Potential Capacity Pedestrian Impedance Factor Cap. Adj. factor due to Impeding mvmnt Movement Capacity Part 3 - Single Stage Conflicting Flows Potential Capacity Pedestrian Impedance Factor Cap. Adj. factor due to Impeding mvmnt Movement Capacity Result for 2 stage process: a y C t Probability of Queue free St Step 4: LT from Minor St Part 1 - First Stage Conflicting Flows Potential Capacity Pedestrian Impedance Factor Cap. Adj. factor due to Impeding mvmnt Movement Capacity Part 2 - Second Stage Conflicting Flows Potential Capacity Pedestrian Impedance Factor Cap. Adj. factor due to Impeding mvmnt Movement Capacity Part 3 - Single Stage Conflicting Flows 2382 Potential Capacity 27 Pedestrian Impedance Factor Maj. L, Min T Impedance factor 0.00 Maj. L, Min T Adj. Imp Factor Cap. Adj. factor due to Impeding mvmnt Movement Capacity 9 Results for Two-stage process: a y C t 9 Worksheet 8-Shared Lane Calculations Movement L T R L T R Volume (vph) Movement Capacity (vph) Shared Lane Capacity (vph) 10
249 Worksheet 9-Computation of Effect of Flared Minor Street Approaches Movement L T R L T R C sep Volume Delay Q sep Q sep round (Qsep +1) n max 8780 C sh 10 SUM C sep 10 n 50 C act 10 Worksheet 10-Delay, Queue Length, and Level of Service Movement Lane Config LT LR v (vph) C(m) (vph) v/c % queue length Control Delay LOS C F Approach Delay Approach LOS F Worksheet 11-Shared Major LT Impedance and Delay Movement 2 Movement 5 p(oj) v(il), Volume for stream 2 or v(i2), Volume for stream 3 or 6 0 s(il), Saturation flow rate for stream 2 or s(i2), Saturation flow rate for stream 3 or P*(oj) 0.00 d(m,lt), Delay for stream 1 or N, Number of major street through lanes 1 d(rank,1) Delay for stream 2 or
250 HCS+: Unsignalized Intersections Release 5.6 TWO-WAY STOP CONTROL SUMMARY Analyst: HDR Agency/Co.: SDDOT Date Performed: 1/2014 Analysis Time Period: PM PEAK Intersection: TIMBERLINE RD. Jurisdiction: MINNEHAHA CO. Units: U. S. Customary Analysis Year: 2035 Project ID: I-90/Timberline IMJR East/West Street: I-90 WB North/South Street: TIMBERLINE RD. Intersection Orientation: NS Study period (hrs): 1.00 Vehicle Volumes and Adjustments Major Street: Approach Northbound Southbound Movement L T R L T R Volume Peak-Hour Factor, PHF Hourly Flow Rate, HFR Percent Heavy Vehicles Median Type/Storage Undivided / RT Channelized? Lanes Configuration LT TR Upstream Signal? No No Minor Street: Approach Westbound Eastbound Movement L T R L T R Volume Peak Hour Factor, PHF Hourly Flow Rate, HFR Percent Heavy Vehicles Percent Grade (%) 2 0 Flared Approach: Exists?/Storage Yes /50 / Lanes 0 0 Configuration LR Delay, Queue Length, and Level of Service Approach NB SB Westbound Eastbound Movement Lane Config LT LR v (vph) C(m) (vph) v/c % queue length Control Delay 16.9 LOS C F Approach Delay Approach LOS F
251 HCS+: Unsignalized Intersections Release 5.6 Phone: Fax: TWO-WAY STOP CONTROL(TWSC) ANALYSIS Analyst: HDR Agency/Co.: SDDOT Date Performed: 1/2014 Analysis Time Period: PM PEAK Intersection: TIMBERLINE RD. Jurisdiction: MINNEHAHA CO. Units: U. S. Customary Analysis Year: 2035 Project ID: I-90/Timberline IMJR East/West Street: I-90 WB North/South Street: TIMBERLINE RD. Intersection Orientation: NS Study period (hrs): 1.00 Vehicle Volumes and Adjustments Major Street Movements L T R L T R Volume Peak-Hour Factor, PHF Peak-15 Minute Volume Hourly Flow Rate, HFR Percent Heavy Vehicles Median Type/Storage Undivided / RT Channelized? Lanes Configuration LT TR Upstream Signal? No No Minor Street Movements L T R L T R Volume Peak Hour Factor, PHF Peak-15 Minute Volume Hourly Flow Rate, HFR Percent Heavy Vehicles Percent Grade (%) 2 0 Flared Approach: Exists?/Storage Yes /50 / RT Channelized? Lanes 0 0 Configuration LR Pedestrian Volumes and Adjustments Movements Flow (ped/hr)
252 Lane Width (ft) Walking Speed (ft/sec) Percent Blockage Upstream Signal Data Prog. Sat Arrival Green Cycle Prog. Distance Flow Flow Type Time Length Speed to Signal vph vph sec sec mph feet S2 Left-Turn Through S5 Left-Turn Through Worksheet 3-Data for Computing Effect of Delay to Major Street Vehicles Movement 2 Movement 5 Shared ln volume, major th vehicles: 888 Shared ln volume, major rt vehicles: 0 Sat flow rate, major th vehicles: 1700 Sat flow rate, major rt vehicles: 1700 Number of major street through lanes: 1 Worksheet 4-Critical Gap and Follow-up Time Calculation Critical Gap Calculation Movement L L L T R L T R t(c,base) t(c,hv) P(hv) t(c,g) Percent Grade t(3,lt) t(c,t): 1-stage stage t(c) 1-stage stage Follow-Up Time Calculations Movement L L L T R L T R t(f,base) t(f,hv) P(HV) t(f) Worksheet 5-Effect of Upstream Signals Computation 1-Queue Clearance Time at Upstream Signal Movement 2 Movement 5 V(t) V(l,prot) V(t) V(l,prot) V prog
253 Total Saturation Flow Rate, s (vph) Arrival Type Effective Green, g (sec) Cycle Length, C (sec) Rp (from Exhibit 16-11) Proportion vehicles arriving on green P g(q1) g(q2) g(q) Computation 2-Proportion of TWSC Intersection Time blocked Movement 2 Movement 5 V(t) V(l,prot) V(t) V(l,prot) alpha beta Travel time, t(a) (sec) Smoothing Factor, F Proportion of conflicting flow, f Max platooned flow, V(c,max) Min platooned flow, V(c,min) Duration of blocked period, t(p) Proportion time blocked, p Computation 3-Platoon Event Periods Result p(2) p(5) p(dom) p(subo) Constrained or unconstrained? Proportion unblocked (1) (2) (3) for minor Single-stage Two-Stage Process movements, p(x) Process Stage I Stage II p(1) p(4) p(7) p(8) p(9) p(10) p(11) p(12) Computation 4 and 5 Single-Stage Process Movement L L L T R L T R V c,x s Px V c,u,x C r,x C plat,x Two-Stage Process
254 Stage1 Stage2 Stage1 Stage2 Stage1 Stage2 Stage1 Stage2 V(c,x) s 1500 P(x) V(c,u,x) C(r,x) C(plat,x) Worksheet 6-Impedance and Capacity Equations Step 1: RT from Minor St Conflicting Flows 888 Potential Capacity 314 Pedestrian Impedance Factor Movement Capacity 314 Probability of Queue free St Step 2: LT from Major St. 4 1 Conflicting Flows 532 Potential Capacity 1020 Pedestrian Impedance Factor Movement Capacity 1020 Probability of Queue free St Maj L-Shared Prob Q free St Step 3: TH from Minor St Conflicting Flows Potential Capacity Pedestrian Impedance Factor Cap. Adj. factor due to Impeding mvmnt Movement Capacity Probability of Queue free St Step 4: LT from Minor St Conflicting Flows 2792 Potential Capacity 14 Pedestrian Impedance Factor Maj. L, Min T Impedance factor 0.00 Maj. L, Min T Adj. Imp Factor Cap. Adj. factor due to Impeding mvmnt Movement Capacity 4 Worksheet 7-Computation of the Effect of Two-stage Gap Acceptance Step 3: TH from Minor St Part 1 - First Stage Conflicting Flows Potential Capacity Pedestrian Impedance Factor Cap. Adj. factor due to Impeding mvmnt Movement Capacity Probability of Queue free St.
255 Part 2 - Second Stage Conflicting Flows Potential Capacity Pedestrian Impedance Factor Cap. Adj. factor due to Impeding mvmnt Movement Capacity Part 3 - Single Stage Conflicting Flows Potential Capacity Pedestrian Impedance Factor Cap. Adj. factor due to Impeding mvmnt Movement Capacity Result for 2 stage process: a y C t Probability of Queue free St Step 4: LT from Minor St Part 1 - First Stage Conflicting Flows Potential Capacity Pedestrian Impedance Factor Cap. Adj. factor due to Impeding mvmnt Movement Capacity Part 2 - Second Stage Conflicting Flows Potential Capacity Pedestrian Impedance Factor Cap. Adj. factor due to Impeding mvmnt Movement Capacity Part 3 - Single Stage Conflicting Flows 2792 Potential Capacity 14 Pedestrian Impedance Factor Maj. L, Min T Impedance factor 0.00 Maj. L, Min T Adj. Imp Factor Cap. Adj. factor due to Impeding mvmnt Movement Capacity 4 Results for Two-stage process: a y C t 4 Worksheet 8-Shared Lane Calculations Movement L T R L T R Volume (vph) Movement Capacity (vph) Shared Lane Capacity (vph) 5
256 Worksheet 9-Computation of Effect of Flared Minor Street Approaches Movement L T R L T R C sep Volume Delay Q sep Q sep round (Qsep +1) n max C sh 5 SUM C sep 5 n 50 C act 5 Worksheet 10-Delay, Queue Length, and Level of Service Movement Lane Config LT LR v (vph) C(m) (vph) v/c % queue length Control Delay 16.9 LOS C F Approach Delay Approach LOS F Worksheet 11-Shared Major LT Impedance and Delay Movement 2 Movement 5 p(oj) v(il), Volume for stream 2 or v(i2), Volume for stream 3 or 6 0 s(il), Saturation flow rate for stream 2 or s(i2), Saturation flow rate for stream 3 or P*(oj) 0.00 d(m,lt), Delay for stream 1 or N, Number of major street through lanes 1 d(rank,1) Delay for stream 2 or
257 HCS 2010: Two-Lane Highways Release 6.50 Phone: Fax: Directional Two-Lane Highway Segment Analysis Analyst HDR Agency/Co. SDDOT Date Performed 1/2014 Analysis Time Period AM PEAK Highway TIMBERLINE ROAD From/To NORTH OF I-90 TO SOUTH OF 60TH Jurisdiction MINNEHAHA CO. Analysis Year 2035 Description I-90/Timberline IMJR Input Data Highway class Class 3 Peak hour factor, PHF 0.88 Shoulder width 6.0 ft % Trucks and buses 6 % Lane width 12.0 ft % Trucks crawling 0.0 % Segment length 1.5 mi Truck crawl speed 0.0 mi/hr Terrain type Rolling % Recreational vehicles 0 % Grade: Length - mi % No-passing zones 60 % Up/down - % Access point density 13 /mi Analysis direction volume, Vd 540 Opposing direction volume, Vo 840 veh/h veh/h Average Travel Speed Direction Analysis(d) Opposing (o) PCE for trucks, ET PCE for RVs, ER Heavy-vehicle adj. factor,(note-5) fhv Grade adj. factor,(note-1) fg Directional flow rate,(note-2) vi 659 pc/h 972 pc/h Free-Flow Speed from Field Measurement: Field measured speed,(note-3) S FM - mi/h Observed total demand,(note-3) V - veh/h Estimated Free-Flow Speed: Base free-flow speed,(note-3) BFFS 45.0 mi/h Adj. for lane and shoulder width,(note-3) fls 0.0 mi/h Adj. for access point density,(note-3) fa 3.3 mi/h Free-flow speed, FFSd 41.8 mi/h Adjustment for no-passing zones, fnp 0.6 mi/h Average travel speed, ATSd 28.5 mi/h Percent Free Flow Speed, PFFS 68.2 %
258 Percent Time-Spent-Following Direction Analysis(d) Opposing (o) PCE for trucks, ET PCE for RVs, ER Heavy-vehicle adjustment factor, fhv Grade adjustment factor,(note-1) fg Directional flow rate,(note-2) vi 633 pc/h 955 pc/h Base percent time-spent-following,(note-4) BPTSFd 63.8 % Adjustment for no-passing zones, fnp 22.1 Percent time-spent-following, PTSFd 72.6 % Level of Service and Other Performance Measures Level of service, LOS D Volume to capacity ratio, v/c 0.39 Peak 15-min vehicle-miles of travel, VMT veh-mi Peak-hour vehicle-miles of travel, VMT veh-mi Peak 15-min total travel time, TT veh-h Capacity from ATS, CdATS 1669 veh/h Capacity from PTSF, CdPTSF 1700 veh/h Directional Capacity 1669 veh/h Passing Lane Analysis Total length of analysis segment, Lt 1.5 mi Length of two-lane highway upstream of the passing lane, Lu - mi Length of passing lane including tapers, Lpl - mi Average travel speed, ATSd (from above) 28.5 mi/h Percent time-spent-following, PTSFd (from above) 72.6 Level of service, LOSd (from above) D Average Travel Speed with Passing Lane Downstream length of two-lane highway within effective length of passing lane for average travel speed, Lde - mi Length of two-lane highway downstream of effective length of the passing lane for average travel speed, Ld - mi Adj. factor for the effect of passing lane on average speed, fpl - Average travel speed including passing lane, ATSpl - Percent free flow speed including passing lane, PFFSpl 0.0 % Percent Time-Spent-Following with Passing Lane Downstream length of two-lane highway within effective length of passing lane for percent time-spent-following, Lde - mi Length of two-lane highway downstream of effective length of the passing lane for percent time-spent-following, Ld - mi Adj. factor for the effect of passing lane on percent time-spent-following, fpl - Percent time-spent-following including passing lane, PTSFpl - % Level of Service and Other Performance Measures with Passing Lane Level of service including passing lane, LOSpl E Peak 15-min total travel time, TT15 - veh-h Bicycle Level of Service
259 Posted speed limit, Sp 45 Percent of segment with occupied on-highway parking 0 Pavement rating, P 3 Flow rate in outside lane, vol Effective width of outside lane, We Effective speed factor, St 4.42 Bicycle LOS Score, BLOS 3.54 Bicycle LOS D Notes: 1. Note that the adjustment factor for level terrain is 1.00, as level terrain is one of the base conditions. For the purpose of grade adjustment, specific dewngrade segments are treated as level terrain. 2. If vi (vd or vo ) >= 1,700 pc/h, terminate analysis-the LOS is F. 3. For the analysis direction only and for v>200 veh/h. 4. For the analysis direction only. 5. Use alternative Exhibit if some trucks operate at crawl speeds on a specific downgrade.
260 HCS 2010: Two-Lane Highways Release 6.50 Phone: Fax: Directional Two-Lane Highway Segment Analysis Analyst HDR Agency/Co. SDDOT Date Performed 1/2014 Analysis Time Period PM PEAK Highway TIMBERLINE ROAD From/To NORTH OF I-90 TO SOUTH OF 60TH Jurisdiction MINNEHAHA CO. Analysis Year 2035 Description I-90/Timberline IMJR Input Data Highway class Class 3 Peak hour factor, PHF 0.88 Shoulder width 6.0 ft % Trucks and buses 6 % Lane width 12.0 ft % Trucks crawling 0.0 % Segment length 1.5 mi Truck crawl speed 0.0 mi/hr Terrain type Rolling % Recreational vehicles 0 % Grade: Length - mi % No-passing zones 60 % Up/down - % Access point density 13 /mi Analysis direction volume, Vd 800 Opposing direction volume, Vo 580 veh/h veh/h Average Travel Speed Direction Analysis(d) Opposing (o) PCE for trucks, ET PCE for RVs, ER Heavy-vehicle adj. factor,(note-5) fhv Grade adj. factor,(note-1) fg Directional flow rate,(note-2) vi 926 pc/h 697 pc/h Free-Flow Speed from Field Measurement: Field measured speed,(note-3) S FM - mi/h Observed total demand,(note-3) V - veh/h Estimated Free-Flow Speed: Base free-flow speed,(note-3) BFFS 45.0 mi/h Adj. for lane and shoulder width,(note-3) fls 0.0 mi/h Adj. for access point density,(note-3) fa 3.3 mi/h Free-flow speed, FFSd 41.8 mi/h Adjustment for no-passing zones, fnp 1.1 mi/h Average travel speed, ATSd 28.1 mi/h Percent Free Flow Speed, PFFS 67.3 %
261 Percent Time-Spent-Following Direction Analysis(d) Opposing (o) PCE for trucks, ET PCE for RVs, ER Heavy-vehicle adjustment factor, fhv Grade adjustment factor,(note-1) fg Directional flow rate,(note-2) vi 909 pc/h 673 pc/h Base percent time-spent-following,(note-4) BPTSFd 71.7 % Adjustment for no-passing zones, fnp 22.7 Percent time-spent-following, PTSFd 84.7 % Level of Service and Other Performance Measures Level of service, LOS D Volume to capacity ratio, v/c 0.54 Peak 15-min vehicle-miles of travel, VMT veh-mi Peak-hour vehicle-miles of travel, VMT veh-mi Peak 15-min total travel time, TT veh-h Capacity from ATS, CdATS 1608 veh/h Capacity from PTSF, CdPTSF 1666 veh/h Directional Capacity 1608 veh/h Passing Lane Analysis Total length of analysis segment, Lt 1.5 mi Length of two-lane highway upstream of the passing lane, Lu - mi Length of passing lane including tapers, Lpl - mi Average travel speed, ATSd (from above) 28.1 mi/h Percent time-spent-following, PTSFd (from above) 84.7 Level of service, LOSd (from above) D Average Travel Speed with Passing Lane Downstream length of two-lane highway within effective length of passing lane for average travel speed, Lde - mi Length of two-lane highway downstream of effective length of the passing lane for average travel speed, Ld - mi Adj. factor for the effect of passing lane on average speed, fpl - Average travel speed including passing lane, ATSpl - Percent free flow speed including passing lane, PFFSpl 0.0 % Percent Time-Spent-Following with Passing Lane Downstream length of two-lane highway within effective length of passing lane for percent time-spent-following, Lde - mi Length of two-lane highway downstream of effective length of the passing lane for percent time-spent-following, Ld - mi Adj. factor for the effect of passing lane on percent time-spent-following, fpl - Percent time-spent-following including passing lane, PTSFpl - % Level of Service and Other Performance Measures with Passing Lane Level of service including passing lane, LOSpl E Peak 15-min total travel time, TT15 - veh-h Bicycle Level of Service
262 Posted speed limit, Sp 45 Percent of segment with occupied on-highway parking 0 Pavement rating, P 3 Flow rate in outside lane, vol Effective width of outside lane, We Effective speed factor, St 4.42 Bicycle LOS Score, BLOS 3.74 Bicycle LOS D Notes: 1. Note that the adjustment factor for level terrain is 1.00, as level terrain is one of the base conditions. For the purpose of grade adjustment, specific dewngrade segments are treated as level terrain. 2. If vi (vd or vo ) >= 1,700 pc/h, terminate analysis-the LOS is F. 3. For the analysis direction only and for v>200 veh/h. 4. For the analysis direction only. 5. Use alternative Exhibit if some trucks operate at crawl speeds on a specific downgrade.
263 HCS 2010: Two-Lane Highways Release 6.50 Phone: Fax: Directional Two-Lane Highway Segment Analysis Analyst HDR Agency/Co. SDDOT Date Performed 1/2014 Analysis Time Period AM PEAK Highway TIMBERLINE ROAD From/To NORTH OF I-90 TO SOUTH OF 60TH Jurisdiction MINNEHAHA CO. Analysis Year 2035 Description I-90/Timberline IMJR Input Data Highway class Class 3 Peak hour factor, PHF 0.88 Shoulder width 6.0 ft % Trucks and buses 6 % Lane width 12.0 ft % Trucks crawling 0.0 % Segment length 1.5 mi Truck crawl speed 0.0 mi/hr Terrain type Rolling % Recreational vehicles 0 % Grade: Length - mi % No-passing zones 60 % Up/down - % Access point density 13 /mi Analysis direction volume, Vd 840 Opposing direction volume, Vo 540 veh/h veh/h Average Travel Speed Direction Analysis(d) Opposing (o) PCE for trucks, ET PCE for RVs, ER Heavy-vehicle adj. factor,(note-5) fhv Grade adj. factor,(note-1) fg Directional flow rate,(note-2) vi 972 pc/h 659 pc/h Free-Flow Speed from Field Measurement: Field measured speed,(note-3) S FM - mi/h Observed total demand,(note-3) V - veh/h Estimated Free-Flow Speed: Base free-flow speed,(note-3) BFFS 45.0 mi/h Adj. for lane and shoulder width,(note-3) fls 0.0 mi/h Adj. for access point density,(note-3) fa 3.3 mi/h Free-flow speed, FFSd 41.8 mi/h Adjustment for no-passing zones, fnp 1.2 mi/h Average travel speed, ATSd 27.9 mi/h Percent Free Flow Speed, PFFS 66.9 %
264 Percent Time-Spent-Following Direction Analysis(d) Opposing (o) PCE for trucks, ET PCE for RVs, ER Heavy-vehicle adjustment factor, fhv Grade adjustment factor,(note-1) fg Directional flow rate,(note-2) vi 955 pc/h 633 pc/h Base percent time-spent-following,(note-4) BPTSFd 73.1 % Adjustment for no-passing zones, fnp 22.1 Percent time-spent-following, PTSFd 86.4 % Level of Service and Other Performance Measures Level of service, LOS D Volume to capacity ratio, v/c 0.57 Peak 15-min vehicle-miles of travel, VMT veh-mi Peak-hour vehicle-miles of travel, VMT veh-mi Peak 15-min total travel time, TT veh-h Capacity from ATS, CdATS 1583 veh/h Capacity from PTSF, CdPTSF 1666 veh/h Directional Capacity 1583 veh/h Passing Lane Analysis Total length of analysis segment, Lt 1.5 mi Length of two-lane highway upstream of the passing lane, Lu - mi Length of passing lane including tapers, Lpl - mi Average travel speed, ATSd (from above) 27.9 mi/h Percent time-spent-following, PTSFd (from above) 86.4 Level of service, LOSd (from above) D Average Travel Speed with Passing Lane Downstream length of two-lane highway within effective length of passing lane for average travel speed, Lde - mi Length of two-lane highway downstream of effective length of the passing lane for average travel speed, Ld - mi Adj. factor for the effect of passing lane on average speed, fpl - Average travel speed including passing lane, ATSpl - Percent free flow speed including passing lane, PFFSpl 0.0 % Percent Time-Spent-Following with Passing Lane Downstream length of two-lane highway within effective length of passing lane for percent time-spent-following, Lde - mi Length of two-lane highway downstream of effective length of the passing lane for percent time-spent-following, Ld - mi Adj. factor for the effect of passing lane on percent time-spent-following, fpl - Percent time-spent-following including passing lane, PTSFpl - % Level of Service and Other Performance Measures with Passing Lane Level of service including passing lane, LOSpl E Peak 15-min total travel time, TT15 - veh-h Bicycle Level of Service
265 Posted speed limit, Sp 45 Percent of segment with occupied on-highway parking 0 Pavement rating, P 3 Flow rate in outside lane, vol Effective width of outside lane, We Effective speed factor, St 4.42 Bicycle LOS Score, BLOS 3.77 Bicycle LOS D Notes: 1. Note that the adjustment factor for level terrain is 1.00, as level terrain is one of the base conditions. For the purpose of grade adjustment, specific dewngrade segments are treated as level terrain. 2. If vi (vd or vo ) >= 1,700 pc/h, terminate analysis-the LOS is F. 3. For the analysis direction only and for v>200 veh/h. 4. For the analysis direction only. 5. Use alternative Exhibit if some trucks operate at crawl speeds on a specific downgrade.
266 HCS 2010: Two-Lane Highways Release 6.50 Phone: Fax: Directional Two-Lane Highway Segment Analysis Analyst HDR Agency/Co. SDDOT Date Performed 1/2014 Analysis Time Period PM PEAK Highway TIMBERLINE ROAD From/To NORTH OF I-90 TO SOUTH OF 60TH Jurisdiction MINNEHAHA CO. Analysis Year 2035 Description I-90/Timberline IMJR Input Data Highway class Class 3 Peak hour factor, PHF 0.88 Shoulder width 6.0 ft % Trucks and buses 6 % Lane width 12.0 ft % Trucks crawling 0.0 % Segment length 1.5 mi Truck crawl speed 0.0 mi/hr Terrain type Rolling % Recreational vehicles 0 % Grade: Length - mi % No-passing zones 60 % Up/down - % Access point density 13 /mi Analysis direction volume, Vd 580 Opposing direction volume, Vo 800 veh/h veh/h Average Travel Speed Direction Analysis(d) Opposing (o) PCE for trucks, ET PCE for RVs, ER Heavy-vehicle adj. factor,(note-5) fhv Grade adj. factor,(note-1) fg Directional flow rate,(note-2) vi 697 pc/h 926 pc/h Free-Flow Speed from Field Measurement: Field measured speed,(note-3) S FM - mi/h Observed total demand,(note-3) V - veh/h Estimated Free-Flow Speed: Base free-flow speed,(note-3) BFFS 45.0 mi/h Adj. for lane and shoulder width,(note-3) fls 0.0 mi/h Adj. for access point density,(note-3) fa 3.3 mi/h Free-flow speed, FFSd 41.8 mi/h Adjustment for no-passing zones, fnp 0.7 mi/h Average travel speed, ATSd 28.5 mi/h Percent Free Flow Speed, PFFS 68.2 %
267 Percent Time-Spent-Following Direction Analysis(d) Opposing (o) PCE for trucks, ET PCE for RVs, ER Heavy-vehicle adjustment factor, fhv Grade adjustment factor,(note-1) fg Directional flow rate,(note-2) vi 673 pc/h 909 pc/h Base percent time-spent-following,(note-4) BPTSFd 65.1 % Adjustment for no-passing zones, fnp 22.7 Percent time-spent-following, PTSFd 74.8 % Level of Service and Other Performance Measures Level of service, LOS D Volume to capacity ratio, v/c 0.41 Peak 15-min vehicle-miles of travel, VMT veh-mi Peak-hour vehicle-miles of travel, VMT veh-mi Peak 15-min total travel time, TT veh-h Capacity from ATS, CdATS 1669 veh/h Capacity from PTSF, CdPTSF 1700 veh/h Directional Capacity 1669 veh/h Passing Lane Analysis Total length of analysis segment, Lt 1.5 mi Length of two-lane highway upstream of the passing lane, Lu - mi Length of passing lane including tapers, Lpl - mi Average travel speed, ATSd (from above) 28.5 mi/h Percent time-spent-following, PTSFd (from above) 74.8 Level of service, LOSd (from above) D Average Travel Speed with Passing Lane Downstream length of two-lane highway within effective length of passing lane for average travel speed, Lde - mi Length of two-lane highway downstream of effective length of the passing lane for average travel speed, Ld - mi Adj. factor for the effect of passing lane on average speed, fpl - Average travel speed including passing lane, ATSpl - Percent free flow speed including passing lane, PFFSpl 0.0 % Percent Time-Spent-Following with Passing Lane Downstream length of two-lane highway within effective length of passing lane for percent time-spent-following, Lde - mi Length of two-lane highway downstream of effective length of the passing lane for percent time-spent-following, Ld - mi Adj. factor for the effect of passing lane on percent time-spent-following, fpl - Percent time-spent-following including passing lane, PTSFpl - % Level of Service and Other Performance Measures with Passing Lane Level of service including passing lane, LOSpl E Peak 15-min total travel time, TT15 - veh-h Bicycle Level of Service
268 Posted speed limit, Sp 45 Percent of segment with occupied on-highway parking 0 Pavement rating, P 3 Flow rate in outside lane, vol Effective width of outside lane, We Effective speed factor, St 4.42 Bicycle LOS Score, BLOS 3.58 Bicycle LOS D Notes: 1. Note that the adjustment factor for level terrain is 1.00, as level terrain is one of the base conditions. For the purpose of grade adjustment, specific dewngrade segments are treated as level terrain. 2. If vi (vd or vo ) >= 1,700 pc/h, terminate analysis-the LOS is F. 3. For the analysis direction only and for v>200 veh/h. 4. For the analysis direction only. 5. Use alternative Exhibit if some trucks operate at crawl speeds on a specific downgrade.
269 HCS 2010 Signalized Intersection Results Summary General Information Intersection Information Agency HDR Duration, h 1.00 Analyst RL Analysis Date 1/20/2014 Area Type Other Jurisdiction SIOUX FALLS Time Period AM PEAK PHF 1.00 Intersection 60TH ST. N. Analysis Year 2035 Analysis Period 1> 7:00 File Name 2035 AM.xus Project Description CORRIDOR TRAFFIC ANALYSIS Demand Information EB WB NB SB Approach Movement L T R L T R L T R L T R Demand (v), veh/h Signal Information Cycle, s 80.0 Reference Phase 2 Offset, s 8 Reference Point Begin Uncoordinated No Simult. Gap E/W On Force Mode Fixed Simult. Gap N/S On Green Yellow Red Timer Results EBL EBT WBL WBT NBL NBT SBL SBT Assigned Phase Case Number Phase Duration, s Change Period, (Y+Rc), s Max Allow Headway (MAH), s Queue Clearance Time (gs), s Green Extension Time (ge), s Phase Call Probability Max Out Probability Movement Group Results EB WB NB SB Approach Movement L T R L T R L T R L T R Assigned Movement Adjusted Flow Rate (v), veh/h Adjusted Saturation Flow Rate (s), veh/h/ln Queue Service Time (gs), s Cycle Queue Clearance Time (gc), s Green Ratio (g/c) Capacity (c), veh/h Volume-to-Capacity Ratio (X) Available Capacity (ca), veh/h Back of Queue (Q), veh/ln (50th percentile) Queue Storage Ratio (RQ) (50th percentile) Uniform Delay (d1), s/veh Incremental Delay (d2), s/veh Initial Queue Delay (d3), s/veh Control Delay (d), s/veh Level of Service (LOS) B C D C C C C C B C Approach Delay, s/veh / LOS 19.4 B 44.7 D 26.2 C 31.3 C Intersection Delay, s/veh / LOS 31.0 C Multimodal Results EB WB NB SB Pedestrian LOS Score / LOS 3.5 C 3.3 C 2.4 B 2.7 B Bicycle LOS Score / LOS 0.9 A 1.2 A 1.3 A 1.1 A Copyright 2014 University of Florida, All Rights Reserved. HCS 2010 Streets Version 6.60 Generated: 7/31/2014 2:39:24 PM
270 HCS 2010 Signalized Intersection Results Summary General Information Intersection Information Agency HDR Duration, h 1.00 Analyst RL Analysis Date 1/20/2014 Area Type Other Jurisdiction SIOUX FALLS Time Period PM PEAK PHF 1.00 Intersection 60TH ST. N. Analysis Year 2035 Analysis Period 1> 7:00 File Name 2035 PM.xus Project Description CORRIDOR TRAFFIC ANALYSIS Demand Information EB WB NB SB Approach Movement L T R L T R L T R L T R Demand (v), veh/h Signal Information Cycle, s 80.0 Reference Phase 2 Offset, s 5 Reference Point Begin Uncoordinated No Simult. Gap E/W On Force Mode Fixed Simult. Gap N/S On Green Yellow Red Timer Results EBL EBT WBL WBT NBL NBT SBL SBT Assigned Phase Case Number Phase Duration, s Change Period, (Y+Rc), s Max Allow Headway (MAH), s Queue Clearance Time (gs), s Green Extension Time (ge), s Phase Call Probability Max Out Probability Movement Group Results EB WB NB SB Approach Movement L T R L T R L T R L T R Assigned Movement Adjusted Flow Rate (v), veh/h Adjusted Saturation Flow Rate (s), veh/h/ln Queue Service Time (gs), s Cycle Queue Clearance Time (gc), s Green Ratio (g/c) Capacity (c), veh/h Volume-to-Capacity Ratio (X) Available Capacity (ca), veh/h Back of Queue (Q), veh/ln (50th percentile) Queue Storage Ratio (RQ) (50th percentile) Uniform Delay (d1), s/veh Incremental Delay (d2), s/veh Initial Queue Delay (d3), s/veh Control Delay (d), s/veh Level of Service (LOS) C C F C C C B C B C Approach Delay, s/veh / LOS 23.2 C 61.9 E 21.5 C 23.6 C Intersection Delay, s/veh / LOS 28.7 C Multimodal Results EB WB NB SB Pedestrian LOS Score / LOS 3.5 C 3.3 C 2.4 B 2.7 B Bicycle LOS Score / LOS 0.9 A 1.0 A 1.6 A 1.0 A Copyright 2014 University of Florida, All Rights Reserved. HCS 2010 Streets Version 6.60 Generated: 7/31/2014 2:43:52 PM
271 HCS 2010 Signalized Intersection Results Summary General Information Intersection Information Agency HDR Duration, h 1.00 Analyst RL Analysis Date 1/3/2014 Area Type Other Jurisdiction Minnehaha Co. Time Period AM PHF 1.00 Intersection I-90 Eastbound Analysis Year 2035 Analysis Period 1> 7:00 File Name timberline am 2035.xus Project Description I-90/Timberline IMJR Demand Information EB WB NB SB Approach Movement L T R L T R L T R L T R Demand (v), veh/h Signal Information Cycle, s 80.0 Reference Phase 2 Offset, s 0 Reference Point Begin Uncoordinated No Simult. Gap E/W On Force Mode Fixed Simult. Gap N/S On Green Yellow Red Timer Results EBL EBT WBL WBT NBL NBT SBL SBT Assigned Phase Case Number Phase Duration, s Change Period, (Y+Rc), s Max Allow Headway (MAH), s Queue Clearance Time (gs), s Green Extension Time (ge), s Phase Call Probability Max Out Probability Movement Group Results EB WB NB SB Approach Movement L T R L T R L T R L T R Assigned Movement Adjusted Flow Rate (v), veh/h Adjusted Saturation Flow Rate (s), veh/h/ln Queue Service Time (gs), s Cycle Queue Clearance Time (gc), s Green Ratio (g/c) Capacity (c), veh/h Volume-to-Capacity Ratio (X) Available Capacity (ca), veh/h Back of Queue (Q), veh/ln (50th percentile) Queue Storage Ratio (RQ) (50th percentile) Uniform Delay (d1), s/veh Incremental Delay (d2), s/veh Initial Queue Delay (d3), s/veh Control Delay (d), s/veh Level of Service (LOS) C A A C B Approach Delay, s/veh / LOS 27.3 C A 14.4 B Intersection Delay, s/veh / LOS 11.2 B Multimodal Results EB WB NB SB Pedestrian LOS Score / LOS 2.9 C 2.9 C 1.9 A 1.3 A Bicycle LOS Score / LOS 0.7 A 1.5 A 1.2 A Copyright 2014 University of Florida, All Rights Reserved. HCS 2010 Streets Version 6.50 Generated: 1/3/ :28:50 AM
272 HCS 2010 Signalized Intersection Results Summary General Information Intersection Information Agency HDR Duration, h 1.00 Analyst RL Analysis Date 1/3/2014 Area Type Other Jurisdiction Minnehaha Co. Time Period PM PHF 1.00 Intersection I-90 Eastbound Analysis Year 2035 Analysis Period 1> 7:00 File Name timberline pm 2035.xus Project Description I-90/Timberline IMJR Demand Information EB WB NB SB Approach Movement L T R L T R L T R L T R Demand (v), veh/h Signal Information Cycle, s 80.0 Reference Phase 2 Offset, s 0 Reference Point Begin Uncoordinated No Simult. Gap E/W On Force Mode Fixed Simult. Gap N/S On Green Yellow Red Timer Results EBL EBT WBL WBT NBL NBT SBL SBT Assigned Phase Case Number Phase Duration, s Change Period, (Y+Rc), s Max Allow Headway (MAH), s Queue Clearance Time (gs), s Green Extension Time (ge), s Phase Call Probability Max Out Probability Movement Group Results EB WB NB SB Approach Movement L T R L T R L T R L T R Assigned Movement Adjusted Flow Rate (v), veh/h Adjusted Saturation Flow Rate (s), veh/h/ln Queue Service Time (gs), s Cycle Queue Clearance Time (gc), s Green Ratio (g/c) Capacity (c), veh/h Volume-to-Capacity Ratio (X) Available Capacity (ca), veh/h Back of Queue (Q), veh/ln (50th percentile) Queue Storage Ratio (RQ) (50th percentile) Uniform Delay (d1), s/veh Incremental Delay (d2), s/veh Initial Queue Delay (d3), s/veh Control Delay (d), s/veh Level of Service (LOS) C A A D B Approach Delay, s/veh / LOS 29.6 C A 21.8 C Intersection Delay, s/veh / LOS 10.8 B Multimodal Results EB WB NB SB Pedestrian LOS Score / LOS 2.9 C 2.9 C 1.9 A 1.3 A Bicycle LOS Score / LOS 0.7 A 1.9 A 1.0 A Copyright 2014 University of Florida, All Rights Reserved. HCS 2010 Streets Version 6.50 Generated: 1/3/ :41:57 PM
273 HCS 2010 Signalized Intersection Results Summary General Information Intersection Information Agency HDR Duration, h 1.00 Analyst RL Analysis Date 1/3/2014 Area Type Other Jurisdiction Minnehaha Co. Time Period AM PHF 1.00 Intersection I-90 Westbound Analysis Year 2035 Analysis Period 1> 7:00 File Name timberline am 2035.xus Project Description I-90/Timberline IMJR Demand Information EB WB NB SB Approach Movement L T R L T R L T R L T R Demand (v), veh/h Signal Information Cycle, s 80.0 Reference Phase 2 Offset, s 0 Reference Point Begin Uncoordinated No Simult. Gap E/W On Force Mode Fixed Simult. Gap N/S On Green Yellow Red Timer Results EBL EBT WBL WBT NBL NBT SBL SBT Assigned Phase Case Number Phase Duration, s Change Period, (Y+Rc), s Max Allow Headway (MAH), s Queue Clearance Time (gs), s Green Extension Time (ge), s Phase Call Probability Max Out Probability Movement Group Results EB WB NB SB Approach Movement L T R L T R L T R L T R Assigned Movement Adjusted Flow Rate (v), veh/h Adjusted Saturation Flow Rate (s), veh/h/ln Queue Service Time (gs), s Cycle Queue Clearance Time (gc), s Green Ratio (g/c) Capacity (c), veh/h Volume-to-Capacity Ratio (X) Available Capacity (ca), veh/h Back of Queue (Q), veh/ln (50th percentile) Queue Storage Ratio (RQ) (50th percentile) Uniform Delay (d1), s/veh Incremental Delay (d2), s/veh Initial Queue Delay (d3), s/veh Control Delay (d), s/veh Level of Service (LOS) C C C A C C Approach Delay, s/veh / LOS C 18.3 B 24.5 C Intersection Delay, s/veh / LOS 22.0 C Multimodal Results EB WB NB SB Pedestrian LOS Score / LOS 3.0 C 2.9 C 1.9 A 2.4 B Bicycle LOS Score / LOS F 1.3 A 1.1 A Copyright 2014 University of Florida, All Rights Reserved. HCS 2010 Streets Version 6.50 Generated: 1/3/ :28:50 AM
274 HCS 2010 Signalized Intersection Results Summary General Information Intersection Information Agency HDR Duration, h 1.00 Analyst RL Analysis Date 1/3/2014 Area Type Other Jurisdiction Minnehaha Co. Time Period PM PHF 1.00 Intersection I-90 Westbound Analysis Year 2035 Analysis Period 1> 7:00 File Name timberline pm 2035.xus Project Description I-90/Timberline IMJR Demand Information EB WB NB SB Approach Movement L T R L T R L T R L T R Demand (v), veh/h Signal Information Cycle, s 80.0 Reference Phase 2 Offset, s 0 Reference Point Begin Uncoordinated No Simult. Gap E/W On Force Mode Fixed Simult. Gap N/S On Green Yellow Red Timer Results EBL EBT WBL WBT NBL NBT SBL SBT Assigned Phase Case Number Phase Duration, s Change Period, (Y+Rc), s Max Allow Headway (MAH), s Queue Clearance Time (gs), s Green Extension Time (ge), s Phase Call Probability Max Out Probability Movement Group Results EB WB NB SB Approach Movement L T R L T R L T R L T R Assigned Movement Adjusted Flow Rate (v), veh/h Adjusted Saturation Flow Rate (s), veh/h/ln Queue Service Time (gs), s Cycle Queue Clearance Time (gc), s Green Ratio (g/c) Capacity (c), veh/h Volume-to-Capacity Ratio (X) Available Capacity (ca), veh/h Back of Queue (Q), veh/ln (50th percentile) Queue Storage Ratio (RQ) (50th percentile) Uniform Delay (d1), s/veh Incremental Delay (d2), s/veh Initial Queue Delay (d3), s/veh Control Delay (d), s/veh Level of Service (LOS) C C C A C C Approach Delay, s/veh / LOS C 14.8 B 28.4 C Intersection Delay, s/veh / LOS 19.6 B Multimodal Results EB WB NB SB Pedestrian LOS Score / LOS 3.0 C 2.9 C 1.9 A 2.4 B Bicycle LOS Score / LOS F 1.7 A 0.9 A Copyright 2014 University of Florida, All Rights Reserved. HCS 2010 Streets Version 6.50 Generated: 1/3/ :41:57 PM
275 HCS 2010 Interchanges Results Summary General Information Interchange Information Agency HDR Interchange Type Diamond Analyst RL Analysis Date 1/3/2014 Segment Distance, ft 925 Jurisdiction Minnehaha Co. Duration,h 1.00 Freeway Direction East-West Intersection I-90 Westbound PHF 1.00 Arterial Direction North-South File Name timberline am 2035.xus Project Description I-90/Timberline IMJR Demand EBL EBT EBR WBL WBT WBR NBL NBT NBR SBL SBT SBR Intersection One Demand ( v ), veh/h Intersection Two Demand ( v ), veh/h Signal One Information Cycle, s 80.0 Offset, s 0 Uncoordinated No Force Mode Fixed Green Yellow Red Signal Two Information Cycle, s 80.0 Offset, s 0 Uncoordinated No Force Mode Fixed Green Yellow Red Interchange Results O-D O-D Demand Movements Demand (veh/h) Delay (s) LOS A WBL - WBU C B WBR B C EBR A D EBL - EBU C E NBL(INT) - EBU C F NBR(EXT) A G SBR(EXT) B H SBL(INT) - WBU D I NBT(INT) - EBL + EBU A J SBT(INT) - WBL + WBU A K WBT L EBT M WBU N EBU Signalized Intersection One Results EB WB NB SB Approach Movement L T R L T R L T R L T R Control Delay (d), s/veh Level of Service (LOS) C A A C B Approach Delay, s/veh / LOS 27.3 C A 14.4 B Intersection Delay, s/veh / LOS 11.2 B Signalized Intersection Two Results EB WB NB SB Approach Movement L T R L T R L T R L T R Control Delay (d), s/veh Level of Service (LOS) C C C A C C Approach Delay, s/veh / LOS C 18.3 B 24.5 C Intersection Delay, s/veh / LOS 22.0 C Copyright 2014 University of Florida, All Rights Reserved. HCS 2010 Streets Version 6.50 Generated: 1/3/ :32:33 AM
276 HCS 2010 Interchanges Results Summary General Information Interchange Information Agency HDR Interchange Type Diamond Analyst RL Analysis Date 1/3/2014 Segment Distance, ft 925 Jurisdiction Minnehaha Co. Duration,h 1.00 Freeway Direction East-West Intersection I-90 Westbound PHF 1.00 Arterial Direction North-South File Name timberline pm 2035.xus Project Description I-90/Timberline IMJR Demand EBL EBT EBR WBL WBT WBR NBL NBT NBR SBL SBT SBR Intersection One Demand ( v ), veh/h Intersection Two Demand ( v ), veh/h Signal One Information Cycle, s 80.0 Offset, s 0 Uncoordinated No Force Mode Fixed Green Yellow Red Signal Two Information Cycle, s 80.0 Offset, s 0 Uncoordinated No Force Mode Fixed Green Yellow Red Interchange Results O-D O-D Demand Movements Demand (veh/h) Delay (s) LOS A WBL - WBU C B WBR B C EBR A D EBL - EBU C E NBL(INT) - EBU C F NBR(EXT) A G SBR(EXT) B H SBL(INT) - WBU D I NBT(INT) - EBL + EBU A J SBT(INT) - WBL + WBU B K WBT L EBT M WBU N EBU Signalized Intersection One Results EB WB NB SB Approach Movement L T R L T R L T R L T R Control Delay (d), s/veh Level of Service (LOS) C A A D B Approach Delay, s/veh / LOS 29.6 C A 21.8 C Intersection Delay, s/veh / LOS 10.8 B Signalized Intersection Two Results EB WB NB SB Approach Movement L T R L T R L T R L T R Control Delay (d), s/veh Level of Service (LOS) C C C A C C Approach Delay, s/veh / LOS C 14.8 B 28.4 C Intersection Delay, s/veh / LOS 19.6 B Copyright 2014 University of Florida, All Rights Reserved. HCS 2010 Streets Version 6.50 Generated: 1/3/ :48:23 PM
277 HCS 2010 Signalized Intersection Results Summary General Information Intersection Information Agency HDR Duration, h 1.00 Analyst RL Analysis Date 1/20/2014 Area Type Other Jurisdiction SIOUX FALLS Time Period AM PEAK PHF 1.00 Intersection 60TH ST. N. Analysis Year 2035 Analysis Period 1> 7:00 File Name 2035 AM.xus Project Description CORRIDOR TRAFFIC ANALYSIS Demand Information EB WB NB SB Approach Movement L T R L T R L T R L T R Demand (v), veh/h Signal Information Cycle, s 80.0 Reference Phase 2 Offset, s 8 Reference Point Begin Uncoordinated No Simult. Gap E/W On Force Mode Fixed Simult. Gap N/S On Green Yellow Red Timer Results EBL EBT WBL WBT NBL NBT SBL SBT Assigned Phase Case Number Phase Duration, s Change Period, (Y+Rc), s Max Allow Headway (MAH), s Queue Clearance Time (gs), s Green Extension Time (ge), s Phase Call Probability Max Out Probability Movement Group Results EB WB NB SB Approach Movement L T R L T R L T R L T R Assigned Movement Adjusted Flow Rate (v), veh/h Adjusted Saturation Flow Rate (s), veh/h/ln Queue Service Time (gs), s Cycle Queue Clearance Time (gc), s Green Ratio (g/c) Capacity (c), veh/h Volume-to-Capacity Ratio (X) Available Capacity (ca), veh/h Back of Queue (Q), veh/ln (50th percentile) Queue Storage Ratio (RQ) (50th percentile) Uniform Delay (d1), s/veh Incremental Delay (d2), s/veh Initial Queue Delay (d3), s/veh Control Delay (d), s/veh Level of Service (LOS) B C D C C C C C B C Approach Delay, s/veh / LOS 19.4 B 44.7 D 26.2 C 31.3 C Intersection Delay, s/veh / LOS 31.0 C Multimodal Results EB WB NB SB Pedestrian LOS Score / LOS 3.5 C 3.3 C 2.4 B 2.7 B Bicycle LOS Score / LOS 0.9 A 1.2 A 1.3 A 1.1 A Copyright 2014 University of Florida, All Rights Reserved. HCS 2010 Streets Version 6.60 Generated: 7/31/2014 2:39:24 PM
278 HCS 2010 Signalized Intersection Results Summary General Information Intersection Information Agency HDR Duration, h 1.00 Analyst RL Analysis Date 1/20/2014 Area Type Other Jurisdiction SIOUX FALLS Time Period PM PEAK PHF 1.00 Intersection 60TH ST. N. Analysis Year 2035 Analysis Period 1> 7:00 File Name 2035 PM.xus Project Description CORRIDOR TRAFFIC ANALYSIS Demand Information EB WB NB SB Approach Movement L T R L T R L T R L T R Demand (v), veh/h Signal Information Cycle, s 80.0 Reference Phase 2 Offset, s 5 Reference Point Begin Uncoordinated No Simult. Gap E/W On Force Mode Fixed Simult. Gap N/S On Green Yellow Red Timer Results EBL EBT WBL WBT NBL NBT SBL SBT Assigned Phase Case Number Phase Duration, s Change Period, (Y+Rc), s Max Allow Headway (MAH), s Queue Clearance Time (gs), s Green Extension Time (ge), s Phase Call Probability Max Out Probability Movement Group Results EB WB NB SB Approach Movement L T R L T R L T R L T R Assigned Movement Adjusted Flow Rate (v), veh/h Adjusted Saturation Flow Rate (s), veh/h/ln Queue Service Time (gs), s Cycle Queue Clearance Time (gc), s Green Ratio (g/c) Capacity (c), veh/h Volume-to-Capacity Ratio (X) Available Capacity (ca), veh/h Back of Queue (Q), veh/ln (50th percentile) Queue Storage Ratio (RQ) (50th percentile) Uniform Delay (d1), s/veh Incremental Delay (d2), s/veh Initial Queue Delay (d3), s/veh Control Delay (d), s/veh Level of Service (LOS) C C F C C C B C B C Approach Delay, s/veh / LOS 23.2 C 61.9 E 21.5 C 23.6 C Intersection Delay, s/veh / LOS 28.7 C Multimodal Results EB WB NB SB Pedestrian LOS Score / LOS 3.5 C 3.3 C 2.4 B 2.7 B Bicycle LOS Score / LOS 0.9 A 1.0 A 1.6 A 1.0 A Copyright 2014 University of Florida, All Rights Reserved. HCS 2010 Streets Version 6.60 Generated: 7/31/2014 2:43:52 PM
279 HCS 2010 Signalized Intersection Results Summary General Information Intersection Information Agency HDR Duration, h 1.00 Analyst RL Analysis Date 1/3/2014 Area Type Other Jurisdiction Minnehaha Co. Time Period AM PHF 1.00 Intersection I-90 Eastbound Analysis Year 2035 Analysis Period 1> 7:00 File Name timberline am 2035.xus Project Description I-90/Timberline IMJR Demand Information EB WB NB SB Approach Movement L T R L T R L T R L T R Demand (v), veh/h Signal Information Cycle, s 80.0 Reference Phase 2 Offset, s 0 Reference Point Begin Uncoordinated No Simult. Gap E/W On Force Mode Fixed Simult. Gap N/S On Green Yellow Red Timer Results EBL EBT WBL WBT NBL NBT SBL SBT Assigned Phase Case Number Phase Duration, s Change Period, (Y+Rc), s Max Allow Headway (MAH), s Queue Clearance Time (gs), s Green Extension Time (ge), s Phase Call Probability Max Out Probability Movement Group Results EB WB NB SB Approach Movement L T R L T R L T R L T R Assigned Movement Adjusted Flow Rate (v), veh/h Adjusted Saturation Flow Rate (s), veh/h/ln Queue Service Time (gs), s Cycle Queue Clearance Time (gc), s Green Ratio (g/c) Capacity (c), veh/h Volume-to-Capacity Ratio (X) Available Capacity (ca), veh/h Back of Queue (Q), veh/ln (50th percentile) Queue Storage Ratio (RQ) (50th percentile) Uniform Delay (d1), s/veh Incremental Delay (d2), s/veh Initial Queue Delay (d3), s/veh Control Delay (d), s/veh Level of Service (LOS) C A A C C Approach Delay, s/veh / LOS 27.3 C A 21.7 C Intersection Delay, s/veh / LOS 14.6 B Multimodal Results EB WB NB SB Pedestrian LOS Score / LOS 2.9 C 2.9 C 1.9 A 1.3 A Bicycle LOS Score / LOS 0.7 A 1.5 A 1.2 A Copyright 2014 University of Florida, All Rights Reserved. HCS 2010 Streets Version 6.50 Generated: 1/3/ :50:46 PM
280 HCS 2010 Signalized Intersection Results Summary General Information Intersection Information Agency HDR Duration, h 1.00 Analyst RL Analysis Date 1/3/2014 Area Type Other Jurisdiction Minnehaha Co. Time Period PM PHF 1.00 Intersection I-90 Eastbound Analysis Year 2035 Analysis Period 1> 7:00 File Name timberline pm 2035.xus Project Description I-90/Timberline IMJR Demand Information EB WB NB SB Approach Movement L T R L T R L T R L T R Demand (v), veh/h Signal Information Cycle, s 80.0 Reference Phase 2 Offset, s 0 Reference Point Begin Uncoordinated No Simult. Gap E/W On Force Mode Fixed Simult. Gap N/S On Green Yellow Red Timer Results EBL EBT WBL WBT NBL NBT SBL SBT Assigned Phase Case Number Phase Duration, s Change Period, (Y+Rc), s Max Allow Headway (MAH), s Queue Clearance Time (gs), s Green Extension Time (ge), s Phase Call Probability Max Out Probability Movement Group Results EB WB NB SB Approach Movement L T R L T R L T R L T R Assigned Movement Adjusted Flow Rate (v), veh/h Adjusted Saturation Flow Rate (s), veh/h/ln Queue Service Time (gs), s Cycle Queue Clearance Time (gc), s Green Ratio (g/c) Capacity (c), veh/h Volume-to-Capacity Ratio (X) Available Capacity (ca), veh/h Back of Queue (Q), veh/ln (50th percentile) Queue Storage Ratio (RQ) (50th percentile) Uniform Delay (d1), s/veh Incremental Delay (d2), s/veh Initial Queue Delay (d3), s/veh Control Delay (d), s/veh Level of Service (LOS) C A A D B Approach Delay, s/veh / LOS 30.7 C A 20.6 C Intersection Delay, s/veh / LOS 13.2 B Multimodal Results EB WB NB SB Pedestrian LOS Score / LOS 2.9 C 2.9 C 1.9 A 1.3 A Bicycle LOS Score / LOS 0.7 A 1.9 A 1.0 A Copyright 2014 University of Florida, All Rights Reserved. HCS 2010 Streets Version 6.50 Generated: 1/3/2014 1:00:42 PM
281 HCS 2010 Signalized Intersection Results Summary General Information Intersection Information Agency HDR Duration, h 1.00 Analyst RL Analysis Date 1/3/2014 Area Type Other Jurisdiction Minnehaha Co. Time Period AM PHF 1.00 Intersection I-90 Westbound Analysis Year 2035 Analysis Period 1> 7:00 File Name timberline am 2035.xus Project Description I-90/Timberline IMJR Demand Information EB WB NB SB Approach Movement L T R L T R L T R L T R Demand (v), veh/h Signal Information Cycle, s 80.0 Reference Phase 2 Offset, s 0 Reference Point Begin Uncoordinated No Simult. Gap E/W On Force Mode Fixed Simult. Gap N/S On Green Yellow Red Timer Results EBL EBT WBL WBT NBL NBT SBL SBT Assigned Phase Case Number Phase Duration, s Change Period, (Y+Rc), s Max Allow Headway (MAH), s Queue Clearance Time (gs), s Green Extension Time (ge), s Phase Call Probability Max Out Probability Movement Group Results EB WB NB SB Approach Movement L T R L T R L T R L T R Assigned Movement Adjusted Flow Rate (v), veh/h Adjusted Saturation Flow Rate (s), veh/h/ln Queue Service Time (gs), s Cycle Queue Clearance Time (gc), s Green Ratio (g/c) Capacity (c), veh/h Volume-to-Capacity Ratio (X) Available Capacity (ca), veh/h Back of Queue (Q), veh/ln (50th percentile) Queue Storage Ratio (RQ) (50th percentile) Uniform Delay (d1), s/veh Incremental Delay (d2), s/veh Initial Queue Delay (d3), s/veh Control Delay (d), s/veh Level of Service (LOS) C C C A C C Approach Delay, s/veh / LOS C 15.2 B 24.4 C Intersection Delay, s/veh / LOS 20.5 C Multimodal Results EB WB NB SB Pedestrian LOS Score / LOS 3.0 C 2.9 C 1.9 A 2.4 B Bicycle LOS Score / LOS F 1.3 A 1.1 A Copyright 2014 University of Florida, All Rights Reserved. HCS 2010 Streets Version 6.50 Generated: 1/3/ :50:46 PM
282 HCS 2010 Signalized Intersection Results Summary General Information Intersection Information Agency HDR Duration, h 1.00 Analyst RL Analysis Date 1/3/2014 Area Type Other Jurisdiction Minnehaha Co. Time Period PM PHF 1.00 Intersection I-90 Westbound Analysis Year 2035 Analysis Period 1> 7:00 File Name timberline pm 2035.xus Project Description I-90/Timberline IMJR Demand Information EB WB NB SB Approach Movement L T R L T R L T R L T R Demand (v), veh/h Signal Information Cycle, s 80.0 Reference Phase 2 Offset, s 0 Reference Point Begin Uncoordinated No Simult. Gap E/W On Force Mode Fixed Simult. Gap N/S On Green Yellow Red Timer Results EBL EBT WBL WBT NBL NBT SBL SBT Assigned Phase Case Number Phase Duration, s Change Period, (Y+Rc), s Max Allow Headway (MAH), s Queue Clearance Time (gs), s Green Extension Time (ge), s Phase Call Probability Max Out Probability Movement Group Results EB WB NB SB Approach Movement L T R L T R L T R L T R Assigned Movement Adjusted Flow Rate (v), veh/h Adjusted Saturation Flow Rate (s), veh/h/ln Queue Service Time (gs), s Cycle Queue Clearance Time (gc), s Green Ratio (g/c) Capacity (c), veh/h Volume-to-Capacity Ratio (X) Available Capacity (ca), veh/h Back of Queue (Q), veh/ln (50th percentile) Queue Storage Ratio (RQ) (50th percentile) Uniform Delay (d1), s/veh Incremental Delay (d2), s/veh Initial Queue Delay (d3), s/veh Control Delay (d), s/veh Level of Service (LOS) C C B A C C Approach Delay, s/veh / LOS C 10.8 B 28.2 C Intersection Delay, s/veh / LOS 17.1 B Multimodal Results EB WB NB SB Pedestrian LOS Score / LOS 3.0 C 2.9 C 1.9 A 2.4 B Bicycle LOS Score / LOS F 1.7 A 0.9 A Copyright 2014 University of Florida, All Rights Reserved. HCS 2010 Streets Version 6.50 Generated: 1/3/2014 1:00:42 PM
283 HCS 2010 Interchanges Results Summary General Information Interchange Information Agency HDR Interchange Type Diamond Analyst RL Analysis Date 1/3/2014 Segment Distance, ft 300 Jurisdiction Minnehaha Co. Duration,h 1.00 Freeway Direction East-West Intersection I-90 Westbound PHF 1.00 Arterial Direction North-South File Name timberline am 2035.xus Project Description I-90/Timberline IMJR Demand EBL EBT EBR WBL WBT WBR NBL NBT NBR SBL SBT SBR Intersection One Demand ( v ), veh/h Intersection Two Demand ( v ), veh/h Signal One Information Cycle, s 80.0 Offset, s 0 Uncoordinated No Force Mode Fixed Green Yellow Red Signal Two Information Cycle, s 80.0 Offset, s 0 Uncoordinated No Force Mode Fixed Green Yellow Red Interchange Results O-D O-D Demand Movements Demand (veh/h) Delay (s) LOS A WBL - WBU C B WBR B C EBR A D EBL - EBU C E NBL(INT) - EBU C F NBR(EXT) A G SBR(EXT) B H SBL(INT) - WBU C I NBT(INT) - EBL + EBU A J SBT(INT) - WBL + WBU B K WBT L EBT M WBU N EBU Signalized Intersection One Results EB WB NB SB Approach Movement L T R L T R L T R L T R Control Delay (d), s/veh Level of Service (LOS) C A A C C Approach Delay, s/veh / LOS 27.3 C A 21.7 C Intersection Delay, s/veh / LOS 14.6 B Signalized Intersection Two Results EB WB NB SB Approach Movement L T R L T R L T R L T R Control Delay (d), s/veh Level of Service (LOS) C C C A C C Approach Delay, s/veh / LOS C 15.2 B 24.4 C Intersection Delay, s/veh / LOS 20.5 C Copyright 2014 University of Florida, All Rights Reserved. HCS 2010 Streets Version 6.50 Generated: 1/3/ :55:01 PM
284 HCS 2010 Interchanges Results Summary General Information Interchange Information Agency HDR Interchange Type Diamond Analyst RL Analysis Date 1/3/2014 Segment Distance, ft 300 Jurisdiction Minnehaha Co. Duration,h 1.00 Freeway Direction East-West Intersection I-90 Westbound PHF 1.00 Arterial Direction North-South File Name timberline pm 2035.xus Project Description I-90/Timberline IMJR Demand EBL EBT EBR WBL WBT WBR NBL NBT NBR SBL SBT SBR Intersection One Demand ( v ), veh/h Intersection Two Demand ( v ), veh/h Signal One Information Cycle, s 80.0 Offset, s 0 Uncoordinated No Force Mode Fixed Green Yellow Red Signal Two Information Cycle, s 80.0 Offset, s 0 Uncoordinated No Force Mode Fixed Green Yellow Red Interchange Results O-D O-D Demand Movements Demand (veh/h) Delay (s) LOS A WBL - WBU C B WBR B C EBR A D EBL - EBU C E NBL(INT) - EBU B F NBR(EXT) A G SBR(EXT) B H SBL(INT) - WBU D I NBT(INT) - EBL + EBU A J SBT(INT) - WBL + WBU B K WBT L EBT M WBU N EBU Signalized Intersection One Results EB WB NB SB Approach Movement L T R L T R L T R L T R Control Delay (d), s/veh Level of Service (LOS) C A A D B Approach Delay, s/veh / LOS 30.7 C A 20.6 C Intersection Delay, s/veh / LOS 13.2 B Signalized Intersection Two Results EB WB NB SB Approach Movement L T R L T R L T R L T R Control Delay (d), s/veh Level of Service (LOS) C C B A C C Approach Delay, s/veh / LOS C 10.8 B 28.2 C Intersection Delay, s/veh / LOS 17.1 B Copyright 2014 University of Florida, All Rights Reserved. HCS 2010 Streets Version 6.50 Generated: 1/3/2014 1:06:31 PM
285 HCS 2010 Signalized Intersection Results Summary General Information Intersection Information Agency HDR Duration, h 1.00 Analyst RL Analysis Date 1/20/2014 Area Type Other Jurisdiction SIOUX FALLS Time Period AM PEAK PHF 1.00 Intersection 60TH ST. N. Analysis Year 2035 Analysis Period 1> 7:00 File Name 2035 AM.xus Project Description CORRIDOR TRAFFIC ANALYSIS Demand Information EB WB NB SB Approach Movement L T R L T R L T R L T R Demand (v), veh/h Signal Information Cycle, s 80.0 Reference Phase 2 Offset, s 8 Reference Point Begin Uncoordinated No Simult. Gap E/W On Force Mode Fixed Simult. Gap N/S On Green Yellow Red Timer Results EBL EBT WBL WBT NBL NBT SBL SBT Assigned Phase Case Number Phase Duration, s Change Period, (Y+Rc), s Max Allow Headway (MAH), s Queue Clearance Time (gs), s Green Extension Time (ge), s Phase Call Probability Max Out Probability Movement Group Results EB WB NB SB Approach Movement L T R L T R L T R L T R Assigned Movement Adjusted Flow Rate (v), veh/h Adjusted Saturation Flow Rate (s), veh/h/ln Queue Service Time (gs), s Cycle Queue Clearance Time (gc), s Green Ratio (g/c) Capacity (c), veh/h Volume-to-Capacity Ratio (X) Available Capacity (ca), veh/h Back of Queue (Q), veh/ln (50th percentile) Queue Storage Ratio (RQ) (50th percentile) Uniform Delay (d1), s/veh Incremental Delay (d2), s/veh Initial Queue Delay (d3), s/veh Control Delay (d), s/veh Level of Service (LOS) B C D C C C C C B C Approach Delay, s/veh / LOS 19.4 B 44.7 D 26.2 C 31.3 C Intersection Delay, s/veh / LOS 31.0 C Multimodal Results EB WB NB SB Pedestrian LOS Score / LOS 3.5 C 3.3 C 2.4 B 2.7 B Bicycle LOS Score / LOS 0.9 A 1.2 A 1.3 A 1.1 A Copyright 2014 University of Florida, All Rights Reserved. HCS 2010 Streets Version 6.60 Generated: 7/31/2014 2:39:24 PM
286 HCS 2010 Signalized Intersection Results Summary General Information Intersection Information Agency HDR Duration, h 1.00 Analyst RL Analysis Date 1/20/2014 Area Type Other Jurisdiction SIOUX FALLS Time Period PM PEAK PHF 1.00 Intersection 60TH ST. N. Analysis Year 2035 Analysis Period 1> 7:00 File Name 2035 PM.xus Project Description CORRIDOR TRAFFIC ANALYSIS Demand Information EB WB NB SB Approach Movement L T R L T R L T R L T R Demand (v), veh/h Signal Information Cycle, s 80.0 Reference Phase 2 Offset, s 5 Reference Point Begin Uncoordinated No Simult. Gap E/W On Force Mode Fixed Simult. Gap N/S On Green Yellow Red Timer Results EBL EBT WBL WBT NBL NBT SBL SBT Assigned Phase Case Number Phase Duration, s Change Period, (Y+Rc), s Max Allow Headway (MAH), s Queue Clearance Time (gs), s Green Extension Time (ge), s Phase Call Probability Max Out Probability Movement Group Results EB WB NB SB Approach Movement L T R L T R L T R L T R Assigned Movement Adjusted Flow Rate (v), veh/h Adjusted Saturation Flow Rate (s), veh/h/ln Queue Service Time (gs), s Cycle Queue Clearance Time (gc), s Green Ratio (g/c) Capacity (c), veh/h Volume-to-Capacity Ratio (X) Available Capacity (ca), veh/h Back of Queue (Q), veh/ln (50th percentile) Queue Storage Ratio (RQ) (50th percentile) Uniform Delay (d1), s/veh Incremental Delay (d2), s/veh Initial Queue Delay (d3), s/veh Control Delay (d), s/veh Level of Service (LOS) C C F C C C B C B C Approach Delay, s/veh / LOS 23.2 C 61.9 E 21.5 C 23.6 C Intersection Delay, s/veh / LOS 28.7 C Multimodal Results EB WB NB SB Pedestrian LOS Score / LOS 3.5 C 3.3 C 2.4 B 2.7 B Bicycle LOS Score / LOS 0.9 A 1.0 A 1.6 A 1.0 A Copyright 2014 University of Florida, All Rights Reserved. HCS 2010 Streets Version 6.60 Generated: 7/31/2014 2:43:52 PM
287 HCS 2010 Signalized Intersection Results Summary General Information Intersection Information Agency HDR Duration, h 1.00 Analyst RL Analysis Date 1/3/2014 Area Type Other Jurisdiction Minnehaha Co. Time Period AM PHF 1.00 Intersection I-90 Eastbound Analysis Year 2035 Analysis Period 1> 7:00 File Name timberline am 2035.xus Project Description I-90/Timberline IMJR Demand Information EB WB NB SB Approach Movement L T R L T R L T R L T R Demand (v), veh/h Signal Information Cycle, s 80.0 Reference Phase 2 Offset, s 0 Reference Point Begin Uncoordinated No Simult. Gap E/W On Force Mode Fixed Simult. Gap N/S On Green Yellow Red Timer Results EBL EBT WBL WBT NBL NBT SBL SBT Assigned Phase Case Number Phase Duration, s Change Period, (Y+Rc), s Max Allow Headway (MAH), s Queue Clearance Time (gs), s Green Extension Time (ge), s Phase Call Probability Max Out Probability Movement Group Results EB WB NB SB Approach Movement L T R L T R L T R L T R Assigned Movement Adjusted Flow Rate (v), veh/h Adjusted Saturation Flow Rate (s), veh/h/ln Queue Service Time (gs), s Cycle Queue Clearance Time (gc), s Green Ratio (g/c) Capacity (c), veh/h Volume-to-Capacity Ratio (X) Available Capacity (ca), veh/h Back of Queue (Q), veh/ln (50th percentile) Queue Storage Ratio (RQ) (50th percentile) Uniform Delay (d1), s/veh Incremental Delay (d2), s/veh Initial Queue Delay (d3), s/veh Control Delay (d), s/veh Level of Service (LOS) B C D C C C Approach Delay, s/veh / LOS 19.1 B 24.5 C 32.9 C 31.6 C Intersection Delay, s/veh / LOS 30.4 C Multimodal Results EB WB NB SB Pedestrian LOS Score / LOS 2.9 C 2.8 C 2.1 B 2.6 B Bicycle LOS Score / LOS 0.7 A 1.1 A 1.2 A 0.9 A Copyright 2014 University of Florida, All Rights Reserved. HCS 2010 Streets Version 6.50 Generated: 1/3/2014 1:21:46 PM


288 HCS 2010 Signalized Intersection Results Summary General Information Intersection Information Agency HDR Duration, h 1.00 Analyst RL Analysis Date 1/3/2014 Area Type Other Jurisdiction Minnehaha Co. Time Period PM PHF 1.00 Intersection I-90 Analysis Year 2035 Analysis Period 1> 7:00 File Name timberline pm 2035.xus Project Description I-90/Timberline IMJR Demand Information EB WB NB SB Approach Movement L T R L T R L T R L T R Demand (v), veh/h Signal Information Cycle, s 80.0 Reference Phase 2 Offset, s 0 Reference Point Begin Uncoordinated No Simult. Gap E/W On Force Mode Fixed Simult. Gap N/S On Green Yellow Red Timer Results EBL EBT WBL WBT NBL NBT SBL SBT Assigned Phase Case Number Phase Duration, s Change Period, (Y+Rc), s Max Allow Headway (MAH), s Queue Clearance Time (gs), s Green Extension Time (ge), s Phase Call Probability Max Out Probability Movement Group Results EB WB NB SB Approach Movement L T R L T R L T R L T R Assigned Movement Adjusted Flow Rate (v), veh/h Adjusted Saturation Flow Rate (s), veh/h/ln Queue Service Time (gs), s Cycle Queue Clearance Time (gc), s Green Ratio (g/c) Capacity (c), veh/h Volume-to-Capacity Ratio (X) Available Capacity (ca), veh/h Back of Queue (Q), veh/ln (50th percentile) Queue Storage Ratio (RQ) (50th percentile) Uniform Delay (d1), s/veh Incremental Delay (d2), s/veh Initial Queue Delay (d3), s/veh Control Delay (d), s/veh Level of Service (LOS) C C D C C C Approach Delay, s/veh / LOS 21.6 C 25.2 C 31.3 C 30.0 C Intersection Delay, s/veh / LOS 29.8 C Multimodal Results EB WB NB SB Pedestrian LOS Score / LOS 2.9 C 2.8 C 2.1 B 2.6 B Bicycle LOS Score / LOS 0.7 A 1.0 A 1.6 A 0.8 A Copyright 2014 University of Florida, All Rights Reserved. HCS 2010 Streets Version 6.50 Generated: 1/3/2014 1:32:52 PM
289 HCS 2010 Interchanges Results Summary General Information Interchange Information Agency HDR Interchange Type SPUI Analyst RL Analysis Date 1/3/2014 Segment Distance, ft Jurisdiction Minnehaha Co. Duration,h 1.00 Freeway Direction East-West Intersection I-90 Eastbound PHF 1.00 Arterial Direction North-South File Name timberline am 2035.xus Project Description I-90/Timberline IMJR Demand EBL EBT EBR WBL WBT WBR NBL NBT NBR SBL SBT SBR Intersection Demand ( v ), veh/h Signal Information Cycle, s 80.0 Offset, s 0 Uncoordinated No Force Mode Fixed Green Yellow Red Interchange Results O-D O-D Demand Movements Demand (veh/h) Delay (s) LOS A WBL A B WBR A C EBR A D EBL A E NBL C F NBR A G SBR A H SBL C I NBT B J SBT C K WBT L EBT M N Signalized Intersection Results EB WB NB SB Approach Movement L T R L T R L T R L T R Control Delay (d), s/veh Level of Service (LOS) B C D C C C Approach Delay, s/veh / LOS 19.1 B 24.5 C 32.9 C 31.6 C Intersection Delay, s/veh / LOS 30.4 C Copyright 2014 University of Florida, All Rights Reserved. HCS 2010 Streets Version 6.50 Generated: 1/3/2014 1:26:40 PM

290 HCS 2010 Interchanges Results Summary General Information Interchange Information Agency HDR Interchange Type SPUI Analyst RL Analysis Date 1/3/2014 Segment Distance, ft Jurisdiction Minnehaha Co. Duration,h 1.00 Freeway Direction East-West Intersection I-90 PHF 1.00 Arterial Direction North-South File Name timberline pm 2035.xus Project Description I-90/Timberline IMJR Demand EBL EBT EBR WBL WBT WBR NBL NBT NBR SBL SBT SBR Intersection Demand ( v ), veh/h Signal Information Cycle, s 80.0 Offset, s 0 Uncoordinated No Force Mode Fixed Green Yellow Red Interchange Results O-D O-D Demand Movements Demand (veh/h) Delay (s) LOS A WBL A B WBR A C EBR A D EBL A E NBL C F NBR A G SBR A H SBL C I NBT B J SBT B K WBT L EBT M N Signalized Intersection Results EB WB NB SB Approach Movement L T R L T R L T R L T R Control Delay (d), s/veh Level of Service (LOS) C C D C C C Approach Delay, s/veh / LOS 21.6 C 25.2 C 31.3 C 30.0 C Intersection Delay, s/veh / LOS 29.8 C Copyright 2014 University of Florida, All Rights Reserved. HCS 2010 Streets Version 6.50 Generated: 1/3/2014 1:41:33 PM
I-190/Silver Street Study
 I-190/Silver Street Study Interchange Modification Justification Report December, 2011 Interchange Modification Justification Report I-190/Silver Street Interchange Rapid City, South Dakota December 2011
Highway 18 BNSF Railroad Overpass Feasibility Study Craighead County. Executive Summary
 Highway 18 BNSF Railroad Overpass Feasibility Study Craighead County Executive Summary October 2014 Highway 18 BNSF Railroad Overpass Feasibility Study Craighead County Executive Summary October 2014 Prepared
Interchange Justification Report
 Interchange Justification Report Interstate 29 at 85 th Street- Exit 74 Sioux Falls, SD SEH No. 132589 October 1, 2018 Prepared by: Short Elliott Hendrickson Inc. Executive Summary The Interchange Justification
I-820 (East) Project Description. Fort Worth District. Reconstruct Southern I-820/SH 121 Interchange
 Project Description. Fort Worth District. Reconstruct Southern I-820/SH 121 Interchange") I-820 (East) Project Description Fort Worth District Reconstruct Southern I-820/SH 121 Interchange I-820 from approximately 2,000 feet north of Pipeline Road/Glenview Drive to approximately 3,200 feet
I-820 (East) Project Description Fort Worth District Reconstruct Southern I-820/SH 121 Interchange I-820 from approximately 2,000 feet north of Pipeline Road/Glenview Drive to approximately 3,200 feet
LAWRENCE TRANSIT CENTER LOCATION ANALYSIS 9 TH STREET & ROCKLEDGE ROAD / 21 ST STREET & IOWA STREET LAWRENCE, KANSAS
 LAWRENCE TRANSIT CENTER LOCATION ANALYSIS 9 TH STREET & ROCKLEDGE ROAD / 21 ST STREET & IOWA STREET LAWRENCE, KANSAS TRAFFIC IMPACT STUDY FEBRUARY 214 OA Project No. 213-542 TABLE OF CONTENTS 1. INTRODUCTION...
US 81 Bypass of Chickasha Environmental Assessment Public Meeting
 US 81 Bypass of Chickasha Environmental Assessment Public Meeting March 14, 2013 Introductions ODOT FHWA SAIC Meeting Purpose Present need for bypass Provide responses to 10/04/11 public meeting comments
The major roadways in the study area are State Route 166 and State Route 33, which are shown on Figure 1-1 and described below:
 3.5 TRAFFIC AND CIRCULATION 3.5.1 Existing Conditions 3.5.1.1 Street Network DRAFT ENVIRONMENTAL IMPACT REPORT The major roadways in the study area are State Route 166 and State Route 33, which are shown
Public Information Workshop
 Public Information Workshop Charlotte County-Punta Gorda MPO - Meeting Rooms A and B March 29, 2018 Welcome to the Public Information Workshop for Harborview Road Project Development and Environment (PD&E)
Table of Contents INTRODUCTION... 3 PROJECT STUDY AREA Figure 1 Vicinity Map Study Area... 4 EXISTING CONDITIONS... 5 TRAFFIC OPERATIONS...
 Crosshaven Drive Corridor Study City of Vestavia Hills, Alabama Table of Contents INTRODUCTION... 3 PROJECT STUDY AREA... 3 Figure 1 Vicinity Map Study Area... 4 EXISTING CONDITIONS... 5 TRAFFIC OPERATIONS...
To: File From: Adrian Soo, P. Eng. Markham, ON File: Date: August 18, 2015
 Memo To: From: Adrian Soo, P. Eng. Markham, ON : 165620021 Date: Reference: E.C. Row Expressway, Dominion Boulevard Interchange, Dougall Avenue Interchange, and Howard 1. Review of Interchange Geometry
Subarea Study. Manning Avenue (CSAH 15) Corridor Management and Safety Improvement Project. Final Version 1. Washington County.
 Corridor Management and Safety Improvement Project. Final Version 1. Washington County.") Subarea Study Manning Avenue (CSAH 15) Corridor Management and Safety Improvement Project Final Version 1 Washington County June 12, 214 SRF No. 138141 Table of Contents Introduction... 1 Forecast Methodology
Subarea Study Manning Avenue (CSAH 15) Corridor Management and Safety Improvement Project Final Version 1 Washington County June 12, 214 SRF No. 138141 Table of Contents Introduction... 1 Forecast Methodology
STH 60 Northern Reliever Route Feasibility Study Report
 #233087 v3 STH 60 Northern Reliever Route Feasibility Study Report Washington County Public Works Committee Meeting September 28, 2016 1 STH 60 Northern Reliever Route Feasibility Study Hartford Area Development
MPO Staff Report Technical Advisory Committee: July 12, 2017
 MPO Staff Report Technical Advisory Committee: July 12, 2017 RECOMMENDED ACTION: 2 nd TAC Meeting with Kimley-Horn/WSB in Updating the Street/Highway Element of 2045 Metropolitan Transportation Plan. Matter
TIMBERVINE TRANSPORTATION IMPACT STUDY FORT COLLINS, COLORADO JANUARY Prepared for:
 TIMBERVINE TRANSPORTATION IMPACT STUDY FORT COLLINS, COLORADO JANUARY 2014 Prepared for: Hartford Companies 1218 W. Ash Street Suite A Windsor, Co 80550 Prepared by: DELICH ASSOCIATES 2272 Glen Haven Drive
Alpine Highway to North County Boulevard Connector Study
 Alpine Highway to North County Boulevard Connector Study prepared by Avenue Consultants March 16, 2017 North County Boulevard Connector Study March 16, 2017 Table of Contents 1 Summary of Findings... 1
Open House. Highway212. Meetings. Corridor Access Management, Safety & Phasing Plan. 5:30 to 6:30 p.m. - Southwest Corridor Transportation Coalition
 Welcome Meetings 5:30 to 6:30 p.m. - Southwest Corridor Transportation Coalition 6:30 to 8:00 p.m. - Open House Why is Highway 212 Project Important? Important Arterial Route Local Support Highway 212
Location Concept Plan Amendment Recommendation Approved 2011 Concept Plan
 Valley Line West LRT Concept Plan Recommended Amendments Lewis Farms LRT Terminus Site Location Concept Plan Amendment Recommendation Approved 2011 Concept Plan Lewis Farms LRT terminus site, 87 Avenue/West
Town of Londonderry, New Hampshire NH Route 28 Western Segment Traffic Impact Fee Methodology
 Town of Londonderry, New Hampshire NH Route 28 Western Segment Traffic Impact Fee Methodology Prepared by the Londonderry Community Development Department Planning & Economic Development Division Based
Purpose and Need Report
 Purpose and Need Report State Highway (SH) 29 From Southwestern Boulevard to SH 95 Williamson County, Texas (CSJ: 0337-02-045) Prepared by Blanton & Associates, Inc. Date: November, 2015 The environmental
Traffic Engineering Study
 Traffic Engineering Study Bellaire Boulevard Prepared For: International Management District Technical Services, Inc. Texas Registered Engineering Firm F-3580 November 2009 Executive Summary has been requested
CHAPTER 9: VEHICULAR ACCESS CONTROL Introduction and Goals Administration Standards
 9.00 Introduction and Goals 9.01 Administration 9.02 Standards 9.1 9.00 INTRODUCTION AND GOALS City streets serve two purposes that are often in conflict moving traffic and accessing property. The higher
Table Existing Traffic Conditions for Arterial Segments along Construction Access Route. Daily
 5.8 TRAFFIC, ACCESS, AND CIRCULATION This section describes existing traffic conditions in the project area; summarizes applicable regulations; and analyzes the potential traffic, access, and circulation
IH 35 FEASIBILITY STUDY
 IH 35 FEASIBILITY STUDY COOKE COUNTY, TEXAS February 1, 2007 Prepared by: Carter & Burgess, Inc. For: The Wichita Falls District of the Texas Department of Transportation INDEX I. INTRODUCTION. 3 II. PURPOSE
Technical Feasibility Report
 Prepared For: Bow Concord I-93 Improvements Project Bow and Concord, NH Prepared By: 53 Regional Drive Concord, NH 03301 NHDOT Project # 13742 Federal Project #T-A000(018) September 2018 TABLE OF CONTENTS
Parks and Transportation System Development Charge Methodology
 City of Sandy Parks and Transportation System Development Charge Methodology March, 2016 Background In order to implement a City Council goal the City of Sandy engaged FCS Group in January of 2015 to update
FREQUENTLY ASKED QUESTIONS
 THE PROJECT Last updated on 9/8/16 FREQUENTLY ASKED QUESTIONS What s happening on Highway 169? The Minnesota Department of Transportation (MnDOT) is planning to rebuild and repair the infrastructure on
Date: February 7, 2017 John Doyle, Z-Best Products Robert Del Rio. T.E. Z-Best Traffic Operations and Site Access Analysis
 Memorandum Date: February 7, 07 To: From: Subject: John Doyle, Z-Best Products Robert Del Rio. T.E. Z-Best Traffic Operations and Site Access Analysis Introduction Hexagon Transportation Consultants, Inc.
Interstate 85 Widening Phase III Interchange Modification Report Exit 106 E. Cherokee Street. Cherokee County, SC
 Interstate 85 Widening Phase III Interchange Modification Report Exit 16 E. Cherokee Street Cherokee County, SC Prepared for: South Carolina Department of Transportation Prepared by: Stantec Consulting
King Soopers #116 Thornton, Colorado
 Traffic Impact Study King Soopers #116 Thornton, Colorado Prepared for: Galloway & Company, Inc. T R A F F I C I M P A C T S T U D Y King Soopers #116 Thornton, Colorado Prepared for Galloway & Company
FREQUENTLY ASKED QUESTIONS
 THE PROJECT Last updated on 2/19/16 FREQUENTLY ASKED QUESTIONS What s happening on Highway 169? The Minnesota Department of Transportation (MnDOT) is planning to rebuild and repair the infrastructure on
ANDERSON PROPERTY SITE ANALYSIS
 ANDERSON PROPERTY SITE ANALYSIS Introduction The Montgomery County Department of Transportation (MCDOT) initiated a feasibility study in the fall of 2012 to evaluate the need for transit service expansion
EXCEPTION TO STANDARDS REPORT
 EXCEPTION TO STANDARDS REPORT PROJECT DESCRIPTION AND NEED The project is located in Section 6, Township 23 North, Range 9 East and Section 31 Township 24 North, Range 9 East, in the Town of Stockton,
INDUSTRIAL DEVELOPMENT
 INDUSTRIAL DEVELOPMENT Traffic Impact Study Plainfield, Illinois August 2018 Prepared for: Seefried Industrial Properties, Inc. TABLE OF CONTENTS Executive Summary 2 Introduction 3 Existing Conditions
APPENDIX C1 TRAFFIC ANALYSIS DESIGN YEAR TRAFFIC ANALYSIS
 APPENDIX C1 TRAFFIC ANALYSIS DESIGN YEAR TRAFFIC ANALYSIS DESIGN YEAR TRAFFIC ANALYSIS February 2018 Highway & Bridge Project PIN 6754.12 Route 13 Connector Road Chemung County February 2018 Appendix
EXECUTIVE SUMMARY. The following is an outline of the traffic analysis performed by Hales Engineering for the traffic conditions of this project.
 EXECUTIVE SUMMARY This study addresses the traffic impacts associated with the proposed Shopko redevelopment located in Sugarhouse, Utah. The Shopko redevelopment project is located between 1300 East and
Executive Summary. Draft Environmental Impact Statement/Environmental Impact Report ES-1
 Executive Summary Introduction The Eastside Transit Corridor Phase 2 Project is a vital public transit infrastructure investment that would provide a transit connection to the existing Metro Gold Line
Parking Management Element
 Parking Management Element The State Transportation Planning Rule, adopted in 1991, requires that the Metropolitan Planning Organization (MPO) area implement, through its member jurisdictions, a parking
TRAFFIC IMPACT ANALYSIS
 TRAFFIC IMPACT ANALYSIS Emerald Isle Commercial Development Prepared by SEPI Engineering & Construction Prepared for Ark Consulting Group, PLLC March 2016 I. Executive Summary A. Site Location The Emerald
Mountainland Association of Governments SPRINGVILLE-SPANISH FORK AREA TRANSPORTATION STUDY APRIL 2012
 Mountainland Association of Governments SPRINGVILLE-SPANISH FORK AREA TRANSPORTATION STUDY APRIL 2012 PLANNING FOR OUR FUTURE Planners with the Mountainland Association of Governments (MAG) have evaluated
MEMORANDUM. Figure 1. Roundabout Interchange under Alternative D
 MEMORANDUM Date: To: Liz Diamond, Dokken Engineering From: Subject: Dave Stanek, Fehr & Peers Western Placerville Interchanges 2045 Analysis RS08-2639 Fehr & Peers has completed a transportation analysis
Metropolitan Freeway System 2007 Congestion Report
 Metropolitan Freeway System 2007 Congestion Report Minnesota Department of Transportation Office of Traffic, Safety and Operations Freeway Operations Section Regional Transportation Management Center March
Traffic Impact Study Speedway Gas Station Redevelopment
 Traffic Impact Study Speedway Gas Station Redevelopment Warrenville, Illinois Prepared For: Prepared By: April 11, 2018 Table of Contents 1. Introduction... 1 2. Existing Conditions... 4 Site Location...
Transportation. Background. Transportation Planning Goals. Level of Service Analysis 5-1
 Transportation portion of the city s stormwater utility, and state road and fuel taxes. Background The transportation needs of the City of Lacey and its planning areas are met by a growing multimodal network
APPENDIX E. Traffic Analysis Report
 APPENDIX E Traffic Analysis Report THIS PAGE INTENTIONALLY BLANK EAGLE RIVER TRAFFIC MITIGATION PHASE I OLD GLENN HIGHWAY/EAGLE RIVER ROAD INTERSECTION IMPROVEMENTS TRAFFIC ANALYSIS Eagle River, Alaska
MILLERSVILLE PARK TRAFFIC IMPACT ANALYSIS ANNE ARUNDEL COUNTY, MARYLAND
 MILLERSVILLE PARK TRAFFIC IMPACT ANALYSIS ANNE ARUNDEL COUNTY, MARYLAND Prepared for: Department of Public Works Anne Arundel County Prepared by: URS Corporation 4 North Park Drive, Suite 3 Hunt Valley,
2. Valley Circle Boulevard/Andora Avenue/Baden Avenue and Lassen Street
 IV.J TRANSPORTATION 1. INTRODUCTION This section presents an overview of the existing traffic and circulation system in and surrounding the project site. This section also discusses the potential impacts
Harlem Avenue between 63 rd and 65 th
 Harlem Avenue between 63 rd and 65 th Public Meeting #2 March 13, 2018 Summit Park District Welcome to the second Public Meeting for the preliminary engineering and environmental studies of Illinois 43
BROWARD BOULEVARD CORRIDOR TRANSIT STUDY
 BROWARD BOULEVARD CORRIDOR TRANSIT STUDY FM # 42802411201 EXECUTIVE SUMMARY July 2012 GOBROWARD Broward Boulevard Corridor Transit Study FM # 42802411201 Executive Summary Prepared For: Ms. Khalilah Ffrench,
FINAL. Sound Transit Long-Range Plan Update. Issue Paper S.1: Tacoma Link Integration with Central Link. Prepared for: Sound Transit
 Sound Transit Long-Range Plan Update Issue Paper S.1: Tacoma Link Integration with Central Link Prepared for: Sound Transit Prepared by: Quade & Douglas, Inc. FINAL March 2005 Foreword This issue paper
Public Meeting. SD Highway 28 From US81 W 11 miles through Lake Norden Hamlin County PH 0028(37)329 PCN 04JY
329 PCN 04JY") Public Meeting SD Highway 28 From US81 W 11 miles through Lake Norden Hamlin County PH 0028(37)329 PCN 04JY Neil Schochenmaier, PE Road Design Engineering Supervisor March 16, 2017 Purpose of the Meeting
Public Meeting SD Highway 28 From US81 W 11 miles through Lake Norden Hamlin County PH 0028(37)329 PCN 04JY Neil Schochenmaier, PE Road Design Engineering Supervisor March 16, 2017 Purpose of the Meeting
V. DEVELOPMENT OF CONCEPTS
 Martin Luther King, Jr. Drive Extension FINAL Feasibility Study Page 9 V. DEVELOPMENT OF CONCEPTS Throughout the study process several alternative alignments were developed and eliminated. Initial discussion
Request for Design Exception (#1) S.M. Wright Phase IIB
 S.M. Wright Phase IIB") Request for Design Exception (#1) S.M. Wright Phase IIB County: Dallas CSJ s: 0092-01-059, 0092-14-088 Project Limits: From Pennsylvania Avenue to North of Al Lipscomb Way Date: June 28, 2016 Proposed
Request for Design Exception (#1) S.M. Wright Phase IIB County: Dallas CSJ s: 0092-01-059, 0092-14-088 Project Limits: From Pennsylvania Avenue to North of Al Lipscomb Way Date: June 28, 2016 Proposed
SOUTHERN GATEWAY. Transportation and Trinity River Project Committee 11 May 2015
 SOUTHERN GATEWAY Transportation and Trinity River Project Committee 11 May 2015 Southern Gateway Project History Began in 2001 as a Major Investment Study [ MIS ], Schematic, and Environmental Assessment
Craig Scheffler, P.E., PTOE HNTB North Carolina, P.C. HNTB Project File: Subject
 TECHNICAL MEMORANDUM To Kumar Neppalli Traffic Engineering Manager Town of Chapel Hill From Craig Scheffler, P.E., PTOE HNTB North Carolina, P.C. Cc HNTB Project File: 38435 Subject Obey Creek TIS 2022
2016 Congestion Report
 2016 Congestion Report Metropolitan Freeway System May 2017 2016 Congestion Report 1 Table of Contents Purpose and Need...3 Introduction...3 Methodology...4 2016 Results...5 Explanation of Percentage Miles
Dixie Transportation Planning Office
 A project must be given a yes rating on items 1 & 2 in order to be prioritized. Sponsor: St. George City Project: Pioneer Parkway Type: Road Widening and Reconstruction Rev. 9/17/2010 Dixie Transportation
Transit City Etobicoke - Finch West LRT
 Delcan Corporation Transit City Etobicoke - Finch West LRT APPENDIX D Microsimulation Traffic Modeling Report March 2010 March 2010 Appendix D CONTENTS 1.0 STUDY CONTEXT... 2 Figure 1 Study Limits... 2
I-35 Access Justification Report Kearney/Clay County
 I-35 Access Justification Report Kearney/Clay County March 2014 4435 Main Street, Suite 1000 Kansas City, MO 64111 I-35 Access Justification Report Kearney/Clay County March 2014 Prepared for: In coordination
Traffic Impact Analysis West Street Garden Plots Improvements and DuPage River Park Garden Plots Development Naperville, Illinois
 Traffic Impact Analysis West Street Garden Plots Improvements and DuPage River Park Garden Plots Development Naperville, Illinois Submitted by April 9, 2009 Introduction Kenig, Lindgren, O Hara, Aboona,
Energy Technical Memorandum
 Southeast Extension Project Lincoln Station to RidgeGate Parkway Prepared for: Federal Transit Administration Prepared by: Denver Regional Transportation District May 2014 Table of Contents Page No. Chapter
2.0 Development Driveways. Movin Out June 2017
 Movin Out June 2017 1.0 Introduction The proposed Movin Out development is a mixed use development in the northeast quadrant of the intersection of West Broadway and Fayette Avenue in the City of Madison.
The Eastern Connector Study November, 2007 planning for the future
 The Eastern Connector Study November, 2007 planning for the future In late 2006, Albemarle County and the City of Charlottesville jointly initiated the Eastern Connector Corridor Study. The Project Team
800 Access Control, R/W Use Permits and Drive Design
 Table of Contents 801 Access Control... 8-1 801.1 Access Control Directives... 8-1 801.2 Access Control Policies... 8-1 801.2.1 Interstate Limited Access... 8-1 801.2.2 Limited Access... 8-1 801.2.3 Controlled
Escondido Marriott Hotel and Mixed-Use Condominium Project TRAFFIC IMPACT ANALYSIS REPORT
 Escondido Marriott Hotel and Mixed-Use Condominium Project TRAFFIC IMPACT ANALYSIS REPORT Prepared for Phelps Program Management 420 Sixth Avenue, Greeley, CO 80632 Prepared by 5050 Avenida Encinas, Suite
Rocky Mount. Transportation Plan. Transportation Planning Division. Virginia Department of Transportation
 2020 Transportation Plan Developed by the Transportation Planning Division of the Virginia Department of Transportation in cooperation with the U.S. Department of Transportation, Federal Highway Administration
HIGHWAY 28 FUNCTIONAL DESIGN
 HIGHWAY 28 FUNCTIONAL DESIGN PUBLIC OPEN HOUSE #1 WEDNESDAY, MARCH 12, 2014 Stantec Presenters: Brad Vander Heyden, Project Engineer Neal Cormack, Project Manager Dave Parker, Project Engineer Beth Thola,
TRAFFIC IMPACT STUDY DERRY GREEN CORPORATE BUSINESS PARK MILTON SECONDARY PLAN MODIFICATION
 TRAFFIC IMPACT STUDY DERRY GREEN CORPORATE BUSINESS PARK MILTON SECONDARY PLAN MODIFICATION TRAFFIC IMPACT STUDY DERRY GREEN CORPORATE BUSINESS PARK MILTON SECONDARY PLAN MODIFICATION DECEMBER 24 UPDATED
Turnpike Mitigation Program Application
 Ohio Department of Transportation & Ohio Turnpike and Infrastructure Commission Turnpike Mitigation Program Application Please note the following eligibility criteria: 1) Projects must be sponsored by
Clean Harbors Canada, Inc.
 Clean Harbors Canada, Inc. Proposed Lambton Landfill Expansion Environmental Assessment Terms of Reference Transportation Assessment St. Clair Township, Ontario September 2009 itrans Consulting Inc. 260
Letter EL652 City of Mercer Island. Page 1. No comments n/a
 Letter EL652 City of Mercer Island Page 1 No comments n/a Page 2 Response to comment EL652 1 Section 4.5.3 of the Final EIS presents the range of potential impacts of the project. This project also lists
Interstate Operations Study: Fargo-Moorhead Metropolitan Area Simulation Output
 NDSU Dept #2880 PO Box 6050 Fargo, ND 58108-6050 Tel 701-231-8058 Fax 701-231-6265 www.ugpti.org www.atacenter.org Interstate Operations Study: Fargo-Moorhead Metropolitan Area 2015 Simulation Output Technical
Metropolitan Freeway System 2013 Congestion Report
 Metropolitan Freeway System 2013 Congestion Report Metro District Office of Operations and Maintenance Regional Transportation Management Center May 2014 Table of Contents PURPOSE AND NEED... 1 INTRODUCTION...
Interstate 85 Widening Phase III Interchange Modification Report Exit 98 Frontage Road Off-Ramp. Cherokee County, SC
 Interstate 85 Widening Phase III Interchange Modification Report Exit 98 Frontage Road Off-Ramp Cherokee County, SC Prepared for: South Carolina Department of Transportation Prepared by: Stantec Consulting
Kendall Drive Premium Transit PD&E Study Project Kick-Off Meeting SR 94/Kendall Drive/SW 88 Street Project Development and Environment (PD&E) Study
 Study") Florida Department of Transportation District Six Kendall Drive Premium Transit PD&E Study Project Kick-Off Meeting SR 94/Kendall Drive/SW 88 Street Project Development and Environment (PD&E) Study What
Florida Department of Transportation District Six Kendall Drive Premium Transit PD&E Study Project Kick-Off Meeting SR 94/Kendall Drive/SW 88 Street Project Development and Environment (PD&E) Study What
FIELD APPLICATIONS OF CORSIM: I-40 FREEWAY DESIGN EVALUATION, OKLAHOMA CITY, OK. Michelle Thomas
 Proceedings of the 1998 Winter Simulation Conference D.J. Medeiros, E.F. Watson, J.S. Carson and M.S. Manivannan, eds. FIELD APPLICATIONS OF CORSIM: I-40 FREEWAY DESIGN EVALUATION, OKLAHOMA CITY, OK Gene
Lacey Gateway Residential Phase 1
 Lacey Gateway Residential Phase Transportation Impact Study April 23, 203 Prepared for: Gateway 850 LLC 5 Lake Bellevue Drive Suite 02 Bellevue, WA 98005 Prepared by: TENW Transportation Engineering West
City of Pacific Grove
 Regional Study Utilizing Caltrans Intersection Evaluation Section 7: City of Pacific Grove s: FIRST STREET AT CENTRAL AVENUE Transportation Agency for Monterey County Prepared by Transportation Agency
New Buck O Neil (U. S. 169) Crossing Benefit-Cost Analysis. Kansas City, Missouri
 Crossing Benefit-Cost Analysis. Kansas City, Missouri") New Buck O Neil (U. S. 169) Crossing Benefit-Cost Analysis Kansas City, Missouri New Buck O Neil (U. S. 169) Crossing Benefit-Cost Analysis prepared for Kansas City, Missouri prepared by Burns & McDonnell
New Buck O Neil (U. S. 169) Crossing Benefit-Cost Analysis Kansas City, Missouri New Buck O Neil (U. S. 169) Crossing Benefit-Cost Analysis prepared for Kansas City, Missouri prepared by Burns & McDonnell
Challenges in a Post-Katrina Environment East-West Corridor Project Overview February, 2007
 EAST-WEST CORRIDOR Challenges in a Post-Katrina Environment East-West Corridor Project Overview February, 2007 Presentation Agenda Project Overview / Purpose and Need Highway Component Transit Component
Proposed location of Camp Parkway Commerce Center. Vicinity map of Camp Parkway Commerce Center Southampton County, VA
 Proposed location of Camp Parkway Commerce Center Vicinity map of Camp Parkway Commerce Center Southampton County, VA Camp Parkway Commerce Center is a proposed distribution and industrial center to be
Alberta Infrastructure HIGHWAY GEOMETRIC DESIGN GUIDE AUGUST 1999
 &+$37(5Ã)Ã Alberta Infrastructure HIGHWAY GEOMETRIC DESIGN GUIDE AUGUST 1999 &+$37(5) 52$'6,'()$&,/,7,(6 7$%/(2)&217(176 Section Subject Page Number Page Date F.1 VEHICLE INSPECTION STATIONS... F-3 April
Introduction and Background Study Purpose
 Introduction and Background The Brent Spence Bridge on I-71/75 across the Ohio River is arguably the single most important piece of transportation infrastructure the Ohio-Kentucky-Indiana (OKI) region.
IMPROVEMENT CONCEPTS
 IMPROVEMENT CONCEPTS for the South Novato Transit Hub Study Prepared by: January 11, 2010 DKS Associates With Wilbur Smith Associates IMPROVEMENT CONCEPTS Chapter 1: Introduction 1. INTRODUCTION The strategic
Roundabout Feasibility Study SR 44 at Grand Avenue TABLE OF CONTENTS
 Roundabout Feasibility Study SR 44 at Grand Avenue TABLE OF CONTENTS Introduction and Executive Summary... 1 Existing Conditions... 3 Intersection Volume Conditions... 5 Intersection Operations... 9 Safety
Sound Transit East Link: Bus/LRT System Integration Study
 Sound Transit East Link: Bus/LRT System Integration Study Prepared For: Sound Transit King County Metro Mercer Island WSDOT Prepared By: CH2M HILL July, 2014 1 SOUND TRANSIT EAST LINK: BUS/LRT SYSTEMES
RE: A Traffic Impact Statement for a proposed development on Quinpool Road
 James J. Copeland, P.Eng. GRIFFIN transportation group inc. 30 Bonny View Drive Fall River, NS B2T 1R2 May 31, 2018 Ellen O Hara, P.Eng. Project Engineer DesignPoint Engineering & Surveying Ltd. 200 Waterfront
TRAFFIC IMPACT ANALYSIS FOR. McDONALD S RESTAURANT IN CARMICAEL Sacramento County, CA. Prepared For:
 TRAFFIC IMPACT ANALYSIS FOR McDONALD S RESTAURANT IN CARMICAEL Sacramento County, CA Prepared For: McDonald s USA, LLC Pacific Sierra Region 2999 Oak Road, Suite 900 Walnut Creek, CA 94597 Prepared By:
CEDAR AVENUE TRANSITWAY Implementation Plan Update
 CEDAR AVENUE TRANSITWAY Implementation Plan Update EECUTIVE SUMMARY DECEMBER 2015 Executive Summary In 2013, the Twin Cities metropolitan area s first bus rapid transit (BRT) line, the METRO Red Line,
MEMO VIA . Ms. Amy Roth DPS Director, City of Three Rivers. To:
 MEMO To: Ms. Amy Roth DPS Director, City of Three Rivers VIA EMAIL From: Michael J. Labadie, PE Julie M. Kroll, PE, PTOE Brandon Hayes, PE, P.Eng. Fleis & VandenBrink Date: January 5, 2017 Re: Proposed
APPENDIX B Traffic Analysis
 APPENDIX B Traffic Analysis Rim of the World Unified School District Reconfiguration Prepared for: Rim of the World School District 27315 North Bay Road, Blue Jay, CA 92317 Prepared by: 400 Oceangate,
Section 5.0 Traffic Information
 Section 5.0 Traffic Information 10.0 TRANSPORTATION MDM Transportation Consultants, Inc. (MDM) has prepared an evaluation of transportation impacts for the proposed evaluation for the expansion of the
GTA West Corridor Planning and EA Study Stage 1
 GTA West Corridor Planning and EA Study Stage 1 Draft Development Strategy Presentation to Peel Goods Movement Task Force April 8 2011 Study Areas 2 Unique Approach Unprecedented two-stage EA process:
BERKELEY DOWNTOWN AREA PLAN PROGRAM ENVIRONMENTAL IMPACT REPORT TRAFFIC IMPACT ANALYSIS
 BERKELEY DOWNTOWN AREA PLAN PROGRAM ENVIRONMENTAL IMPACT REPORT TRAFFIC IMPACT ANALYSIS Prepared for: City of Berkeley Prepared by: REVISED JANUARY 9, 2009 Berkeley Downtown Area Plan Program EIR Traffic
AASHTO Policy on Geometric Design of Highways and Streets
 AASHTO Policy on Geometric Design of Highways and Streets 2001 Highlights and Major Changes Since the 1994 Edition Jim Mills, P.E. Roadway Design Office 605 Suwannee Street MS-32 Tallahassee, FL 32399-0450
Project Working Group Meeting #5
 September 17, 2013 Project Working Group Meeting #5 1 September 17, 2013 www.i-80will.com Meeting Purpose Project update Discuss Range of Alternatives Discuss next steps 2 September 17, 2013 www.i-80will.com
Interstate Operations Study: Fargo-Moorhead Metropolitan Area Simulation Results
 NDSU Dept #2880 PO Box 6050 Fargo, ND 58108-6050 Tel 701-231-8058 Fax 701-231-6265 www.ugpti.org www.atacenter.org Interstate Operations Study: Fargo-Moorhead Metropolitan Area 2025 Simulation Results
Report Addendum. Terry Keller, SDDOT. Noise Study Technical Report I-29 from Tea Interchange to Skunk Creek Sioux Falls, South Dakota
 Report Addendum To: Terry Keller, SDDOT From: HDR Project: Noise Study Technical Report I-29 from Tea Interchange to Skunk Creek Sioux Falls, South Dakota cc: file Date: May 28, 2010; rev July 16, July
Environmental Assessment Derry Road and Argentia Road Intersection
 Air and Noise Study Environmental Assessment Derry Road and Argentia Road Intersection Project 11-4295 City of Mississauga, Region of Peel October 17, 2014 1 Region of Peel Environmental Assessment for
MAP OR PHOTO. Public Meeting & Open House July 23, Project Roadway Limits From: FM 1957 To: FM 471. Counties Bexar & Medina
 Public Meeting & Open House July 23, 2013 Project Roadway Limits From: FM 1957 To: FM 471 MAP OR PHOTO Counties Bexar & Medina 1 I. Project History II. III. IV. Project Overview Project Alternatives Response
Traffic Impact Statement (TIS)
") Traffic Impact Statement (TIS) Vincentian PUDA Collier County, FL 10/18/2013 Prepared for: Global Properties of Naples Prepared by: Trebilcock Consulting Solutions, PA 2614 Tamiami Trail N, Suite 615 1205
Traffic Impact Statement (TIS) Vincentian PUDA Collier County, FL 10/18/2013 Prepared for: Global Properties of Naples Prepared by: Trebilcock Consulting Solutions, PA 2614 Tamiami Trail N, Suite 615 1205