Final Report for. Reedsport. Pedestrian Safety Study. Prepared for. Prepared by. in association with
|
|
|
- Angelina Rose
- 6 years ago
- Views:
Transcription


1 Final Report for Reedsport Pedestrian Safety Study Prepared for Prepared by in association with February 2015
2 ACKNOWLEDGEMENTS This report was prepared through the collective effort of the following people: Oregon Department of Transportation Shyam Sharma, Region 3 Traffic Manager Aaron Brooks, Region 3 Analyst Allie Coates, Region 3 Planner Ray Lapke, Region 3 Operations Brian Banta, Region 3 Roadway Rodger Gutierrez, Bike and Pedestrian Chris Hunter, District 7 Assistant Manager City of Reedsport Jonathan Wright, City Manager Charlene Lohf, Communications Supervisor Jessica Terra, Planning Assistant DKS Associates Scott Mansur, PE, PTOE, Project Manager Brad Coy, Project Engineer Jordin Ketelsen, Project Engineering Assistant Stakeholder Group Norman Floyd, Traffic Safety Chris Surina, Planning Linda R. McCollum, Councilor Debby Turner, Councilor Matt Smart, Police Department Laura Davis, Charter School Principal Acknowledgements December 2014 Page i
3 TABLE OF CONTENTS Chapter 1. Executive Summary INTRODUCTION PUBLIC INVOLVEMENT TECHNICAL ANALYSIS Pedestrian Toolbox RECOMMENDED PROJECTS Conceptual Crossing Improvements Traffic Signal Improvements Corridor-Wide Projects US 101 Lane Conversions Cost Estimates Chapter 2. Existing Conditions PEDESTRIAN AND BICYCLE FACILITIES AND ACTIVITY Pedestrian Facilities Pedestrian Activity Bicycle Facilities and Activity PEDESTRIAN CROSSING CONFLICT ANALYSIS US 101 between 22 nd Street and 20 th Street US 101 between Winchester Avenue and 13 th Street US 101 between 11 th Street and 10 th Street OR 38 between 5 th Street and 4 th Street Street Lighting Observations COLLISION ANALYSIS Safety Priority Index System (SPIS) ODOT Collision Data ODOT Pedestrian Collision Data MOTOR VEHICLE CONDITIONS Roadway Network Vehicular Volume, Speed, and Classification Analysis Intersection Turn Movement Volumes Mobility Standards Existing Intersection Performance Future Traffic Conditions Table of Contents December 2014 Page ii
4 Reedsport TSP Future Analysis Chapter 3. Crossing Treatment Toolbox MEDIAN REFUGE ISLAND AND CURB EXTENSIONS RECTANGULAR RAPID FLASHING BEACON (RRFB) PEDESTRIAN HYBRID BEACON-HIGH INTENSITY ACTIVATED CROSSWALK (HAWK) FLASHING BEACONS STREET LIGHTING IMPROVEMENTS NOT INCLUDED Chapter 4. Pedestrian Improvement Concepts IMPROVEMENT LOCATION PRIORITIZATION CROSSING IMPROVEMENT CONCEPTS US 101 and 20 th Street (Priority Location #1) US 101 and 21 st Street (Priority Location #2) US 101 and 14 th Street (Priority Location #3) OR 38 and 3 rd Street (Priority Location #4) US 101 and Juniper Avenue (Priority Location #5) TRAFFIC SIGNAL IMPROVEMENTS US 101 and OR US 101 and 22 nd Street CORRIDOR-WIDE IMPROVEMENTS Pedestrian Countdown Timers SPEED FEEDBACK SIGNS Street Lighting Access Management Chapter 5. US 101 Lane Conversion Alternatives THREE-LANE CONVERSION Land Use Collision Analysis Motor Vehicle Volume Reedsport TSP Future Analysis Available Roadway Width Lane Conversion Alternatives FIVE-LANE CONVERSION NEXT STEPS Table of Contents December 2014 Page iii
5 Chapter 6. Project Implementation PROJECT IMPLEMENTATION PROJECT PRIORITIZATION COST ESTIMATES Appendix Table of Contents December 2014 Page iv
6 LIST OF TABLES Table 2-1: US 101 and OR 38 Study Area Pedestrian Crossing Volumes Table 2-2: Conflict Analysis Summary for Selected Locations along US 101 and OR Table 2-3: US 101 and OR 38 Study Area Street Lighting Observations Table 2-4: US 101 and OR 38 Study Area Collision Data (2003 through 2013) Table 2-5: Collision Breakdown by Collision Type (2003 through 2013) Table 2-6: Collision Breakdown by Lighting Level (2003 through 2013) Table 2-7: Study Area Pedestrian Collision Data (2003 through 2013) Table 2-8: Existing Study Area Roadway Characteristics Table 2-9: US 101 and OR 38 Bi-Directional Volumes, Speeds, and Heavy Vehicle Usage a 2-17 Table 2-10: Applicable Study Intersection Mobility Standards Table 2-11: Study Intersection Performance Table 2-12: Study Intersection Projected Performance (2035) Table 2-13: Study Intersection Sensitivity Analysis using a 0.5% Growth Rate per Year Table 2-14: Study Intersection Sensitivity Analysis using a 2.25% Growth Rate per Year (45% growth over 20 years) Table 4-1: Prioritized Crossing Improvement Locations Table 5-1: Study Intersection Performance With Three-Lane Conversion Table 5-2: Study Intersection Sensitivity Analysis With Three-Lane Conversion Table 5-3: Study Intersection 45% Growth With Three-Lane Conversion Table 6-1: Prioritized Safety Improvements on the US 101 and OR 38 Corridors Table 6-2: Cost Estimates of Proposed Safety Projects Table 6-3: Cost Estimates of Proposed Safety Projects Assuming the Implementation of a Three-Lane Conversion along US 101 from 16th Street to 21st Street Table of Contents December 2014 Page v
7 LIST OF FIGURES Figure 2-1: Reedsport Pedestrian Safety Study Area Figure 2-2: Pedestrian Facilities Figure 2-3: Pedestrian Conflict Analysis Figure 2-4: Collisions by Severity (2003 through 2013) Figure 2-5: Pedestrian Collision Data ( ) Figure 2-6: Existing Cross Sections along US Figure 2-7: US Hour Direction Volumes North of 21st Street Figure 2-8: OR Hour Direction Volumes East of 3rd Street Figure 2-9: Existing Motor Vehicle Peak Hour Traffic Volumes Figure 2-10: US 101 Ten-Year Volume Growth Comparison Figure 3-1: Example Center Medians with Pedestrian Refuge Islands Figure 3-2: Example RRFB Sign Assembly and Close-Up of RRFB Flashers Figure 3-3: HAWK Signal Figure 3-4: Example Overhead Flashing Beacon Figure 3-5: Example Street Lights Figure 4-1: Priority Crossing Locations Figure 4-2: US 101/20th Street Crossing Improvement Option A (4-Lane Option with Median) Figure 4-3: US 101/20th Street Crossing Location Improvement Option B Figure 4-4: US 101/21st Street Crossing Location Improvement Figure 4-5: US 101/14th Street Crossing Improvement Location Figure 4-6: OR 38/3rd Street Crossing Improvement Concept Figure 4-7: US 101 and OR 38 Junction Intersection Improvement Needs Figure 4-8: US 101/22nd Street Signalized Intersection Improvement Needs Figure 4-9: Speed Feedback Sign and Signalized Intersection Locations Figure 5-1: Three-Lane Conversion Alternative Figure 5-2: Three-Lane Conversion Alternative Figure 5-3: US 101 and 20th Street Three-Lane Conversion Crossing Improvement Concept (Option C) Figure 5-4: Five-Lane Cross Section Example Table of Contents December 2014 Page vi


 provided feedback on all")
8 CHAPTER 1 Chapter 1. EXECUTIVE SUMMARY INTRODUCTION The US 101 and OR 38 corridors in Reedsport, Oregon are a safety concern for ODOT and City staff and well as residents in the area. Fatal and serious injury pedestrian crashes along the study corridors have led to ODOT and the City of Reedsport partnering to prepare a safety plan that will improve safety for all modes of travel. The primary emphasis for this study was to provide safe pedestrian and bicycle crossings on US 101 and OR 38. This study consisted of public involvement and technical analysis. The result was a compilation of recommended safety projects along the US 101 and OR 38 study corridors. PUBLIC INVOLVEMENT The Oregon Department of Transportation (ODOT) managed the Reedsport Pedestrian Safety Study in partnership with the City of Reedsport. Project stakeholders (including Reedsport Community Charter School, Reedsport elected officials, Reedsport Police, and two additional City of Reedsport staff members) provided feedback on all components of the study. A schematic of the study process is shown at right. Safety Study Process Primary direction and input were provided by the Technical Advisory Committee (TAC). This committee directed the study, reviewed methods and findings, and assisted in reaching consensus on project recommendations. Members of the TAC included agency staff from ODOT and the City of Reedsport. Additional public involvement included one on one stakeholder interviews and a City Council work session. These involvement opportunities allowed citizens to comment on the plan, make Executive Summary Page 1-1 December 2014


 Pedestrian Toolbox To assist in the selection of recommended conceptual crossing treatments, a toolbox of")
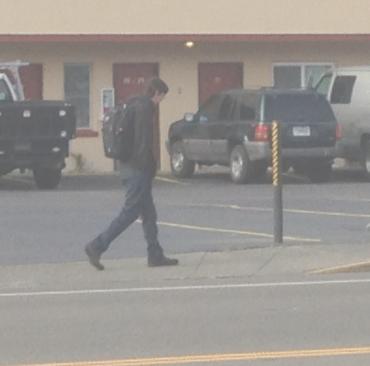
9 suggestions, voice concerns, and provide feedback. TECHNICAL ANALYSIS Technical analysis included data collection, pedestrian crossing observations, and crossing improvement location prioritization. Corridor wide analysis was also performed. The crossing observations were made at multiple locations along US 101 and OR 38, and indicated a clear need for additional pedestrian and bicycle crossing accommodations along the corridors. Pictures of some observed crossings are shown below. High vehicular speeds and volumes Wide roadway cross section Lack of center turn lanes for existing fourlane cross sections Inconsistent roadway lighting (which particularly affects nighttime safety) Absence of pedestrian crossing treatments (i.e. refuge medians, beacons and signage) Pedestrian Toolbox To assist in the selection of recommended conceptual crossing treatments, a toolbox of available pedestrian crossing treatments was prepared and refined to include only those treatments were considered feasible for the US 101 and OR 38 corridors. Two example strategies are shown below. See Chapter 3 (Pedestrian Crossing Treatment Toolbox) for the complete list of treatments. Pedestrians Crossing US 101 near 20 th Street destined for 7-Eleven OR 38 Westbound Entering Downtown Reedsport near 3 rd Street The analysis emphasized high pedestrian activity locations including businesses (primarily convenient stores), schools, and hotels. The primary factors contributing to pedestrian safety concerns include: Pedestrian Toolbox Example Treatments (on left: Overhead Flashing Beacon; on right: RRFB Sign Assembly) RECOMMENDED PROJECTS Recommended projects include conceptual unsignalized crossing and traffic signal improvements as well as corridor wide projects. Planning level cost Executive Summary Page 1-2 December 2014
: Short Term Priority 1. US 101/20 th Street 2.")
 or overhead beacons (depending on the median or curb extension")

10 estimates were also prepared for the projects. Conceptual Crossing Improvements Crossing improvement concepts were developed for four unsignalized locations (listed in order of priority): Short Term Priority 1. US 101/20 th Street 2. OR 38/3 rd Street Mid Term Priority 3. US 101/14 th Street 4. US 101/21 st Street At the first priority location, recommended improvement treatments include Rectangular Rapid Flashing Beacons (RRFB) or overhead beacons (depending on the median or curb extension treatment), pedestrian refuge medians, curb extensions, and supplemental street lighting. At the second priority location, curb extensions and supplementary lighting is recommended. At the third and fourth priority locations, supplementary street lighting is the only treatment recommended at this time. crossing improvements in greater detail. All concepts are subject to project development and the concepts may change based on additional analysis and stakeholder feedback. Traffic Signal Improvements Signalized intersection safety improvements were also considered at two key intersections along the study corridors listed below in order of priority: Short Term Priority 1. US 101/22 nd Street Mid Term Priority 2. US 101/OR 38 Junction Improvements at the first traffic signal location include supplementary lighting, left turn signal head modification, signal phasing modifications, and restriping the 22 nd Street approaches. An image of the current signal head as well as the desired left turn signal head is included below. A fifth crossing location along US 101 near Juniper Avenue was also considered. However, due to current land uses, nonconforming access spacing, connectivity challenges, and inconsistent pedestrian crossing locations, pedestrian crossing improvements were not perceived to significantly facilitate safe pedestrian activity across US 101. Chapter 4 (Pedestrian Improvement Concepts) discusses the conceptual Left: Current Signal Head Right: Desired Left-Turn Signal Head Executive Summary Page 1-3 December 2014

11 At the second priority traffic signal location, only supplementary lighting is recommended. Approximate Recommend Cross- Section Segments along the US 101 Study Corridor Corridor-Wide Projects Corridor wide safety treatments were also considered along the entire length of the study area corridors and include: Pedestrian Countdown Timers Street Lighting Speed Feedback Signs Lane Conversions No specific locations were identified for access management with the exception of the pedestrian crossing improvement locations Chapter 4 discusses the corridorwide projects in greater detail. US 101 Lane Conversions The section of US 101 south of 16 th street presents an opportunity to consider a three lane roadway conversion to increase corridor safety due to the surrounding land uses, available roadway width, collision analysis, and motor vehicle volumes. Since the land uses along US 101 north of 16 th Street may not benefit directly from a three lane conversion and the pedestrian volumes were lower in this section, a continuous five lane conversion in this portion of US 101 could be beneficial. A figure displaying the regions of the proposed three lane and five lane cross sections along US 101 is shown to the right. Details regarding potential US 101 lane conversions can be found in Chapter 5. Executive Summary Page 1-4 December 2014
12 Cost Estimates Cost estimates were prepared for the recommended projects and are provided in Chapter 6, which is reproduced to the right. As shown, the total estimated cost is between $217,000 and $337,000 for all crossing improvement locations, $45,000 for all signalized improvement locations, and $50,000 for corridor wide improvements. All projects combined are estimated to cost between $312,000 and $432,000. Cost Estimates of Recommended Safety Projects Safety Improvement Crossing Improvement Locations Total Cost US 101/20th Street (Option A) $110,000 US 101/20th Street (Option B) $230,000 US 101/21st Street $14,000 US 101/14th Street $28,000 OR 38/3rd Street $65,000 Total Crossing Location Improvements Signalized Improvement Locations $217,000 - $337,000 US 101/22nd Street $25,000 US 101/OR 38 Junction $20,000 Total Signalized Location Improvements Corridor-Wide Treatments $45,000 Pedestrian Countdown Timers $10,000 Speed Feedback Signs $40,000 Total Corridor-Wide Treatments $50,000 TOTAL $312,000 - $432,000 Cost estimates for the three lane conversion option along US 101 south of 16 th Street were also prepared and are show in the following table. Under the assumption of the three lane conversion, total costs for roadway treatments are approximately $220,000, $28,000 for crossing improvement locations, and $70,000 and the total costs for signalized and corridor wide treatments are approximately $70,000. The estimated total cost for all combined projects is $503,000. Cost Estimates Assuming a Three-Lane Conversion along US 101 from 16th Street to 21st Street Safety Improvement Total Cost Three-Lane Roadway Conversions from 16 th Street to 21 st Street Striping and Striping $100, nd Signal Modifications $50, th Signal Modifications $70,000 Total Roadway Treatments $220,000 Crossing Improvement Locations US 101/20th Street (Option C) $120,000 US 101/14th Street $28,000 OR 38/3rd Street $65,000 Total Crossing Improvements $213,000 Signalized and Corridor-Wide Treatments US 101/OR 38 Junction $20,000 Pedestrian Countdown Timers b $10,000 Speed Feedback Signs $40,000 Total Signalized and Corridor-Wide Treatments $70,000 TOTAL $503,000 Chapter 6 provides additional cost estimate and prioritization information for each project. These project implementation resources are intended to assist ODOT and the City of Reedsport, in using this study as a tool for acquiring the needed project funding. Executive Summary Page 1-5 December 2014

. The OR 38 study corridor ranges from the US 101/OR 38 Junction to 2 nd Street and is approximately 0.65 miles in length (MP 0.")

13 CHAPTER 2 Chapter 2. EXISTING CONDITIONS Existing transportation conditions were evaluated for the US 101 and OR 38 study corridors in the City of Reedsport, Oregon. The US 101 study corridor spans approximately 1.3 miles from the south end of the bridge on Umpqua River to just south of 22 nd Street (MP to MP 212.8). The OR 38 study corridor ranges from the US 101/OR 38 Junction to 2 nd Street and is approximately 0.65 miles in length (MP 0.0 to MP 0.65). Both corridors are shown as the project study area in Figure 2 1. Figure 2-1: Reedsport Pedestrian Safety Study Area The existing conditions analysis considered current pedestrian and bicycle facilities and activity, pedestrian conflict analysis, collision analysis, and motor vehicle analysis. The following sections of this chapter address each of these issues. Existing Conditions Technical Analysis Page 2-1 December 2014
 that would have higher percentages of")
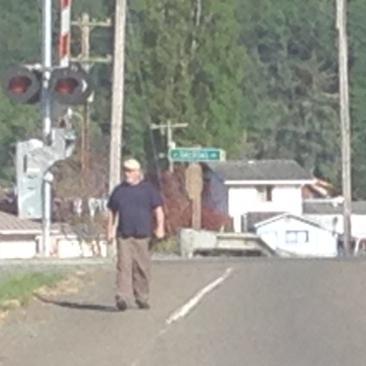
14 PEDESTRIAN AND BICYCLE FACILITIES AND ACTIVITY Pedestrian facilities and activity were observed along the US 101 and OR 38 corridors with emphasis at select locations identified by the TAC. These locations were selected based on local knowledge, 1 pedestrian generators in the area (especially businesses such as restaurants and convenience stores) that would have higher percentages of walk in users), and recent pedestrian collision information. Pedestrian Facilities A map of the pedestrian facilities is provided in Figure 2 2. Sidewalk facilities are present on the southern/eastern side of the US 101 corridor throughout the entire study area. The majority of the northern/western side of the US 101 corridor possess sidewalk facilities but there are gaps between the 10 th Street and Myrtle Avenue cross streets. There are five signalized intersections that accommodate signalized pedestrian crossings (including the US 101/OR 38 intersection) and two unsignalized intersections with marked crosswalks. Both sides of the OR 38 corridor currently have sidewalk facilities between 6 th Street and 3 rd Street. However, there are no sidewalks on either side of the OR 38 corridor between the US 101/OR38 intersection and 6 th Street. As discussed during the project kick off meeting, Reedsport City staff is currently working with the railroad to provide better pedestrian connectivity through the railroad crossing in this segment of OR 38. There are three unsignalized intersections with marked crosswalks and one signalized intersection (US 101/OR 38 intersection) along the OR 38 corridor within the study area boundary. Pedestrian walking on shoulder near Railroad crossing along OR 38 Pedestrian Activity Pedestrian crossing activity was observed for the a.m., afternoon, and p.m. peak hours along US 101 and OR 38 at four locations selected by the TAC (each location covered approximately 500 feet in each direction). These locations are shown in Figure 2 2. Pedestrian counts were taken on June 11, 2014 with the exception of US 101 between 12 th Street and 10 th Street where the counts were taken on June 5, Local knowledge was provided at a project kick-off meeting with ODOT and City of Reedsport staff as well as stakeholder interviews with the Reedsport Community Charter School, Reedsport Elected Officials, a Police Officer, and two additional City of Reedsport staff members. Existing Conditions Pedestrian and Bicycle Facilities and Activity Page 2-2 December 2014

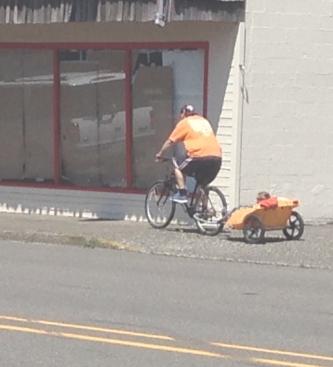
15 Both occasions were dry days and expected to have typical pedestrian activity levels. The following locations had the highest crossing activity levels: US 101/20th Street: 45 total during a.m., afternoon, and p.m. peak hours US 101/22nd Street: 38 total during a.m., afternoon, and p.m. peak hours US 101/21st Street: 17 total during a.m., afternoon, and p.m. peak hours The highest crossing volumes at these intersections occur during the afternoon peak, which is expected due to Reedsport Community Charter School s open campus lunch hour policy for high school students and the location of 7 Eleven and other lunch related uses on the opposite side of US 101. Pedestrian crossing volumes were collected from the pedestrian counts and are shown in Table 2 1 and Figure 2 2. Study Intersection (Signalized Y/N) Table 2-1: US 101 and OR 38 Study Area Pedestrian Crossing Volumes A.M. Peak Hour Pedestrian Crossings Crosswalk Mid-Block Crosswalk Afternoon Peak Hour Pedestrian Crossings Mid- Block P.M. Peak Hour Pedestrian Crossings Crosswalk US 101/22 nd Street (Y) US 101/21 st Street (N) US 101/20 th Street (N) OR 38/5 th Street (N) OR 38/4 th Street (N) OR 38/3 rd Street (N) Study Location (Approx. 500 feet) US 101/Winchester Ave & 13 th Street US 101/12 th Street & 10 th Street Mid- Block West East Total West East Total West East Total Bicycle Facilities and Activity Bicycle facilities and activity were observed at the same locations as previously discussed in the pedestrian activity section. There are currently no bicycle lanes or facilities along either the US101 or OR 38 corridors studied, and bike volumes are low in both areas. The majority of existing bicyclists observed on US 101, an Oregon Coast Bike Route, travel on the existing sidewalks. Student Crossing US 101 at the 22 nd Street Signal toward Reedsport Community Charter School Existing Conditions Pedestrian and Bicycle Facilities and Activity Page 2-3 December 2014
16 Umpqua River RIVERFRONT WY N 3RD ST N 4TH ST 2ND ST LEGEND - Signalized Pedestrian Crossing - Approximate Location of 500 ft Pedestrian Count Segment - Sidewalk Gap - Project Study Corridor AM (Afternoon 2-4pm) [PM] HIGHEST HOURLY PEDESTRIAN VOLUMES DURING PEAK MOTOR VEHICLE PERIODS No Scale Figure PEDESTRIAN FACILITIES AND VOLUMES Schofield Creek LAUREL AV N 10TH ST N 11TH ST N 12TH ST N 13TH ST N 14TH ST WINCHESTER AV 16TH ST OREGON U S N 5TH ST N 6TH ST N 18TH ST N 19TH ST N 20TH ST N 21ST ST N 22ND ST 4 (24) [7] 7 (13) [4] 7 (22) [16] 9 (3) [4] 4 (5) [5] 0 (3) [7] 1 (0) [2] 0 (7) [0] 2 (5) [7] 0 (11) [3] LONGWOOD DR
 crossing behavior in the field to better understand the safety problems identified from the collision records and to")
17 PEDESTRIAN CROSSING CONFLICT ANALYSIS Pedestrian crossing conflict analysis was performed along the US 101 and OR 38 study corridors at four locations during the a.m., afternoon, and p.m. motor vehicle peak periods. The purpose of the conflict analysis was to observe pedestrian (and bicycle) crossing behavior in the field to better understand the safety problems identified from the collision records and to identify other safety related problems along the corridor that are not easily identified from collision records alone. The selection of the four locations was performed by the TAC and considered various criteria, including high concentration of pedestrian collisions, high pedestrian crossing volumes, distance from nearest signalized crossing, and nearby pedestrian generators (including schools, markets, etc.). The four locations selected include the following listed from west to east: US 101 between 21 st Street and 20 th Street US 101 between Winchester Avenue and 13 th Street US 101 between 11 th Street and 10 th Street OR 38 between 5 th Street and 4 th Street During the observations, activity along the study corridors was also observed. A summary of the conflict analysis is provided in Table 2 2, which lists the number of crossing incidents observed during a one hour portion of each of the motor vehicle peak periods and also identifies the key crossing location(s) in the vicinity of each area. Pedestrian crossing US 101 destined for 7-Eleven At the 21 st Street through 20 th Street segment of US 101 lunchtime observations were also performed from 11:30 a.m. to 12:30 p.m. due to the proximity of Reedsport Community Charter School and the expected crossing activity from high school students to the nearby 7 Eleven and various restaurants on the opposite side of US 101. As shown in Table 2 2 at the top of the next page, each location had a unique trend in the variation of the number of pedestrian crossing volumes throughout the day. Most of the locations had one or two key crossing areas, which typically occurred at an intersection or near a key business. Existing Conditions Pedestrian Crossing Conflict Analysis Page 2-5 December 2014

18 Table 2-2: Conflict Analysis Summary for Selected Locations along US 101 and OR 38 Selected Location Crossing Incidents by Time of Day a A.M. Afternoon P.M. US 101/21 st Street US 101/20 th Street US 101/Winchester Avenue US 101/10 th Street OR 38/5 th Street OR 38/4 th Street Key Crossing Location(s) Majority of crossings occurred on east side of 21 st Street Majority of crossings occurred on the east side of 20 th Street near the 7-Eleven market Crossings were spread along the roadway section; however, key origins/destinations were hotels and the retail and supermarkets Midblock crossings between 10 th Street and 11 th Street occurred Two crossings occurred on the west side of 5 th street Crossings were spread across the study location a Crossing incidents were observed for one hour, which was within the two-hour motor vehicle peak hour period window. When multiple people crossed together, they were counted as one single incident. Details regarding the observed activity and patterns for each location are discussed in the following sections. US 101 between 22 nd Street and 20 th Street Most pedestrian crossings near the unsignalized 22 nd and 21 st Street intersections were made by children and young adults during the morning, afternoon, and end of school observation hours. It was also observed that bicycle activity was relatively low and almost all of the bicyclists traveled on the sidewalks along US 101. Bicyclists on the sidewalk present several safety issues for pedestrians and the bicyclists themselves. Pedestrians aren t always capable of responding quickly to cyclists on sidewalks, especially elderly pedestrians or those with pets or strollers creating potential to result in minor injuries. Bicyclists traveling on the sidewalks are difficult for motor vehicles to see when they are riding behind trees, parked cars and other objects. Figure 2 3 displays further conflicts that have occurred or have the potential to occur in the future along the US 101 study corridor near the intersections of 22 nd Street through 20 th Street. Bicyclist Traveling on Sidewalk Existing Conditions Pedestrian Crossing Conflict Analysis Page 2-6 December 2014


19 N 20th Street N 21st Street N 22nd Street Permissive left turns on minor streets conflict with pedestrian crossing movements. Mid-block pedestrian crossings. Trucks park along US 101 near 7-11 and block the vision of crossing pedestrians US 101 Bicyclists use pedestrian sidewalk facilities along US 101. Multiple-Threat Example Vehicles stop near crosswalks to yield for pedestrians and block the vision of crossing pedestrians for through vehicles. This is also known as a multiple-threat crash. Car B Figure LEGEND - Motor Vehicle or Pedestrian Movement - Motor Vehicle Car A - Pedestrian CONFLICT ANALYSIS DIAGRAM - Bicyclist No Scale


20 Pedestrian Crossing Signage along US 101 near 20 th Street Crossings in the morning were usually in the north to south direction across US 101 due to Reedsport Community Charter School s location on the south side of US 101 near the signalized intersection at 22 nd Street. Singular mid block crossings (crossings not at a striped cross walk location) were observed between 21 st and 20 th Street, and west of 21 st street. Two groups of two pedestrians participated in mid block crossings to the north of 20 th on a path toward Reedsport Community Charter School. Reedsport Community Charter School s open lunch period was observed to be the peak pedestrian interval. Many groups of students emerged during the start of the afternoon observation hour and crossed from the south side of US 101 toward the 7 11 and various other food options located to the north. However, north to south movements were observed toward the end of the afternoon observation period due to the children returning to Reedsport Community Charter School on the south side of US 101. The majority of unsignalized pedestrian crossings took place on the west leg of the 21 st Street intersection to and from the 7 11 during the afternoon observation period. The majority of pedestrian crossings during the PM observation hours were groups traveling south to north across US 101 as students traveled away from Reedsport Community Charter School. However, there were also small groups observed to be traveling in the opposite direction (north to south) across US 101 which is most likely due to after school activities. Due to the lack of turn lanes present in this segment of US 101, left lane vehicles that stop for pedestrians block the vison of curb lane vehicles and has the potential to cause a pedestrian conflict. Furthermore, curb lane vehicles may be accustomed to stopped vehicles in the left lane that are waiting for a gap in the oncoming traffic to turn left. This may cause curb lane vehicles to expect the left lane vehicle is waiting to turn left when the left lane vehicle is actually Semi-Truck Parked along US 101 near 20 th Street Existing Conditions Pedestrian Crossing Conflict Analysis Page 2-8 December 2014


21 stopping for a pedestrian crossing the street. This confusion could result in a vehiclepedestrian conflict with the curb lane vehicle. Although this conflict was not observed, the potential for conflict was evident and was verified in stakeholder interview discussions. US 101 between Winchester Avenue and 13 th Street Only a few pedestrian crossings across US 101 occurred during the morning, afternoon, and evening observation times. Most of the pedestrian crossing movements were performed by adults in this area of study. The majority of pedestrian crossings occurred on the western leg of the 14 th Street intersection and the eastern leg of the Winchester Avenue intersection due to the Best Western Hotel on the south side of US 101 and Safeway, coffee shops, and other food and retail sources on the north side. Bicyclists would occasionally travel along this portion of the corridor and were often observed to be riding on the sidewalks on Cross Section of US 101 near 14 both sides of US 101. th Street US 101 between 11 th Street and 10 th Street Low pedestrian crossing volumes were observed during the morning, afternoon, and evening observation periods but the highest amount of pedestrian movements in this area occurred during the morning observation. Mid block crossings across US 101 occurred between Juniper Ave and 10 th as well as Laurel Ave and OR 38. Little bicycle activity was observed along this portion of the corridor and most bicyclists were seen riding on the sidewalk. Cross Section of US 101 near 10 th Street OR 38 between 5 th Street and 4 th Street Only a few pedestrians were observed crossing this section of OR 38 during the morning, afternoon, and evening observations. Pedestrian crossings were mostly performed by adults and seen on the eastern leg of the 4 th Street intersection and the western leg of the 5 th Street intersection. The key pedestrian generators in this area are the Post Office and The Sugar Shack, a local bakery. No conflicts between vehicles, pedestrians and bicycles were observed. Existing Conditions Pedestrian Crossing Conflict Analysis Page 2-9 December 2014
22 Street Lighting Observations Street lighting observations were conducted along the US 101 and OR 38 study area corridors on June 3 rd Even though there is some existing street lighting along the majority of the US 101 and OR 38 corridors within the study area boundary, a reflection of the observed light levels indicate that additional lighting along both study corridors is recommended. 2 Table 2 3 describes in more detail the lighting observations at key locations along the US 101 and OR 38 study corridors. Table 2-3: US 101 and OR 38 Study Area Street Lighting Observations Location Comments Recommendation US 101 OR 38 to 22 nd St (Segment) US 101/OR 38 Junction Currently intermittent street lights (vary between 200 and 250 W) on wood poles. There are many locations with poor uniformity where additional lighting is needed. There are two street lights currently at the intersection that offer some light but additional lighting is needed to improve light levels and uniformity. 20 th St Only one 200 W street light on the southwest corner of the intersection is present and does not provide adequate lighting levels or uniformity for the intersection. 21 st St Only one 200 W street light is present at the intersection and does not provide adequate lighting levels or uniformity for the intersection. 22 nd St Two street lights mounted on wooden poles are present at this intersection. Additional lighting is needed to improve light levels and uniformity. OR 38 US 101 to 6 th St (Segment) 6 th St to 3 rd St (Segment) Limited lighting is currently present along this segment. Ornamental street lights currently provide adequate lighting levels and uniformity. 3 rd St Limited lighting is currently present at this intersection. Additional lights needed to meet light levels and uniformity. Additional Lighting Needed Additional Lighting Needed Additional Lighting Needed Additional Lighting Needed Additional Lighting Needed Additional Lighting Needed None Additional Lighting Needed COLLISION ANALYSIS The collision analysis for the US 101 and OR 38 corridors considered ODOT s Safety Priority Index System (SPIS) findings and the past ten years of available collision data. The intent was to identify trends as well as potentially hazardous locations in need of mitigation. Safety Priority Index System (SPIS) The Safety Priority Index System (SPIS) is a ranking system developed by ODOT to identify potential safety problems on state highways. SPIS scores are developed based upon crash 2 All lighting recommendations are based on the standards located in the Traffic Lighting Design Manual, ODOT, July Existing Conditions Collision Analysis Page 2-10 December 2014
23 frequency, severity, and rate for a 0.10 mile or variable length segment along the state highway over a rolling three year window (i.e., every year it is updated with the most recent three years). For the most current three years analyzed ( ), there are no SPIS locations in Reedsport along either the US 101 or the OR 38 corridor that are in the top 15 percent of statewide SPIS sites. ODOT Collision Data This evaluation considered the most recent ten years ( ) of collision data obtained from the ODOT Crash and Analysis Reporting Unit. Since latitude and longitude information wasn t available for the years 2003 through 2007, only key collisions (fatalities and severe injuries) from this time period were mapped in Figure 2 4, in addition to the collision data from 2007 to Table 2 4 summarizes collisions along both study corridors and includes collision severity, collisions per year, and the average collision rate for the ten year period. Overall, the yearly collision rate for the US 101 corridor is 3.01 collisions per million vehicle miles traveled and for the OR 38 corridor is 2.77 collisions per million vehicle miles traveled. The average ODOT State Highway Crash Rate for similar function classification roadways 3 is 1.48 collisions per million vehicle miles traveled. 4 Therefore, the study area corridor crash rate is 103 percent greater for the US 101 corridor and 87 percent greater for the OR 38 corridor than the state average for similar facilities. Table 2-4: US 101 and OR 38 Study Area Collision Data (2003 through 2013) Corridor (Distance) Collisions (by Severity) Fatal Injury PDO a Total Collisions per Year Collision Rate b,c US 101 (1.3 mi.) OR 38 (0.65 mi.) a PDO = Property Damage Only. b Rate Calculation = Collisions per year / (Average Daily Traffic x 365 days / 1 million vehicle-miles traveled) c An average ADT for each corridor was used to calculate the collision rate. The collision data in Table 2 4 and Figure 2 4 also shows one fatal collision along the US 101 corridor between 2003 and The fatality was a pedestrian death that occurred near 16 th Street along the US 101 corridor. Collision reports state that the pedestrian fatality occurred at night during conditions characterized as, dark with street lights also during clear and dry weather conditions. The injury A collisions at US 101/16 th Street and OR 38/W Railroad Ave were reported to have occurred under dry and clear conditions during daylight hours. The injury A collision that occurred at OR 38/Myrtle Ave was reported during rainy conditions during night hours. 3 State Highway System Rural Highway System, Rural Cities, Other Principal Arterials State Highway Crash Rate Tables, ODOT Crash Analysis and Reporting Unit, July 2012; Table IV. Existing Conditions Collision Analysis Page 2-11 December 2014


 Collision Breakdown by Collision Type Corridor (Distance) Rear- End Turn Angle Fixed Obj.")
24 Figure 2-4: Collisions by Severity (2003 through 2013) 4 Further investigation was performed for the corridor to assess whether there are any clear trends in the collision data. First, the collision data for 2003 through 2013 was broken down by the type of collision. Table 2 5 shows the collision breakdown by type for each the study corridor segments. As shown, the most prevalent collision types were rear end and turning movement collisions. Together they account for approximately 75 percent of the total collisions on both corridors, which is typical on urban highways. The majority of turning collisions are likely due to the lack of turn lanes along the US 101 corridor. 5 Table 2-5: Collision Breakdown by Collision Type (2003 through 2013) Collision Breakdown by Collision Type Corridor (Distance) Rear- End Turn Angle Fixed Obj. Bike/ Ped Side- Swipe Head On Other Total US 101 (1.3 mi.) OR 38 (0.65 mi.) Both Corridors Percent of Collisions 43.1% 30.0% 10.2% 6.1% 4.0% 3.3% 2.0% 1.3% 100% Lighting condition is an important factor in collision analysis, and is broken down in Table 2 6. As shown, the greatest number of collisions for both study corridors occurred during the daylight. 5 Injury A crash is a severe or debilitating injury B and injury C and injury C type crashes are lower level severity. Existing Conditions Collision Analysis Page 2-12 December 2014
25 This is expected due to the higher traffic volumes that occur during daylight hours. The second greatest number of collisions for the study area occurred at dusk and night time with street lighting present. All pedestrian collisions from occurred during daylight hours. Segment (Distance) Table 2-6: Collision Breakdown by Lighting Level (2003 through 2013) Daylight Collision Breakdown by Lighting Level Dusk Dark with Street Lights Dark without Street Lights US 101 (1.3 mi.) OR 38 (0.65 mi.) Entire Study Corridor Total Percent of Collisions 80.1% 6.8% 6.8% 6.2% 100% ODOT Pedestrian Collision Data Additional collision analysis with an emphasis on pedestrians was performed for the corridor using the past ten years of available ODOT collision data (i.e., 2003 through 2013). Only pedestrian collisions were considered in the analysis. No pedestrian collisions occurred on the OR 38 study corridor during these 10 years. Of the 4 pedestrian collisions on the US 101 study corridor, 1 resulted in a fatality and the remaining 3 resulted in injuries. The pedestrian collisions are shown by severity in Table 2 7 at the top of the next page from 2003 to Figure 2 5 displays a map of the pedestrian collisions along US Figure 2-5: Pedestrian Collision Data ( ) 5 6 Two injury B collisions involving pedestrian transpired at the intersection of US 101/22 nd Street and occurred in 2011 and Existing Conditions Collision Analysis Page 2-13 December 2014
26 Time Period Table 2-7: Study Area Pedestrian Collision Data (2003 through 2013) Pedestrian Collisions (by Severity) Fatal Injury Total Pedestrian Collisions per Year per VMT 2003 thru MOTOR VEHICLE CONDITIONS Existing traffic conditions for the US 101 and OR 38 study corridors were evaluated and include roadway network characteristics, vehicular volume, speed, and classification analysis, intersection turn movement counts, mobility standards, existing intersection performance, collision analysis, pedestrian crossing conflict analysis, pedestrian facilities and activity, bicycle facilities and activity, and street lighting observations. Roadway Network The transportation characteristics of the study area roadway and key cross streets are shown in Table 2 8 which include functional classification, number and direction of travel lanes, posted speeds, and the presence of sidewalks and/or bike lanes. The functional classification is an important roadway characteristic because it specifies the purpose of the facility 7 and is a determining factor of applicable cross section, access spacing, and intersection performance standards. Existing cross sections along US 101 are shown in Figure 2 6. Table 2-8: Existing Study Area Roadway Characteristics Roadway ODOT Functional Classification Travel Lanes Posted Speed Sidewalk Bike Lanes US 101 Principal Arterial Yes a No OR 38 Principal Arterial 2 25 Yes b No 22 nd Street Minor Collector 2 25 Yes No 21 st Street Minor Collector 2 25 Yes No 20 th Street Minor Collector 2 25 Yes No Winchester Ave Rural Major Collector 2 25 Yes c No 3 rd Street d Local Road 2 25 Yes No a US 101 has sidewalk gaps on the northern/eastern side between 10 th Street and Myrtle Avenue. b OR 38 has sidewalk gaps on both sides between US 101/OR 38 Junction and 6 th Street. c Sidewalks are present near US 101 intersection but includes significant sidewalk gaps on both sides of corridor. d 3 rd Street is a key crossing for the OR 38 corridor. 7 The primary purpose of an arterial is to provide mobility, whereas at the opposite end of the spectrum, a local road is primarily concerned with site access. Collector roadways provide a transition between arterials and local roads. Existing Conditions Motor Vehicle Conditions Page 2-14 December 2014
27 Umpqua River Schofield Creek LAUREL AV N 10TH ST 38 Existing Cross-Sections 2-Lane * Cross sections north of Port Dock Road do not include shoulders due to the narrowing effect of the Hwy 101 Bridge. N 12TH ST N 11TH ST * * 6.5 N 13TH ST N 14TH ST WINCHESTER AV 39 4-Lane 16TH ST N 18TH ST OREGON U S All lanes Varies between N 19TH ST 5-Lane N 20TH ST N 21ST ST N 22ND ST LONGWOOD DR All lanes Varies between No Scale LEGEND - 2-Lane Cross-Section - 4-Lane Cross-Section - 5-Lane Cross-Section Figure 2-6 EXISTING CROSS SECTIONS ALONG US 101
.")
28 US 101 and OR 38 are both classified in the Oregon Highway Plan (OHP) 8 as highways of National Level of importance. US 101 and OR 38 are also designated as freight routes in the OHP and routes for which "No reduction of vehicular capacity" applies (ORS ). That law also says trucks must be allowed a holein the air which is defined by ODOT as, the entire area (height, width and length) a truck and its load will occupy while traversing a section of roadway. Any proposed solutions that could potentially result in a Reduction of Vehicle carrying Capacity (RVC) will have to go through further processing to receive full approval. The highways in the study area have two or four lane paved cross sections with Functional Classification Hierarchy curbs and sidewalks. The Average Daily Traffic (ADT) count along US 101 for this segment ranges from 9,700 to 12,900 between 22 nd Street and OR 38 and 5,300 near the Umpqua River Bridge. Along OR 38 the ADT 9 is approximately 3,500. Key north south roadways that intersect US 101 include 22 nd Street, 21 st Street, 20 th Street, and Winchester Avenue. 3 rd Street is a key north south crossing located on the OR 38 corridor within the study area. The functional classifications of the north south roadways are also shown in Table 2 8 on the previous page. Vehicular Volume, Speed, and Classification Analysis Table 2 9 at the top of the next page presents data collected from 24 hour tube counts 10 at three select locations along the US 101 corridor and at one location along the OR 38 corridor. This data includes vehicular bi directional volumes, 85 th percentile speed, 11 and heavy vehicle traffic percentages. As shown in the table, the travel speeds range from 2 to 13 mph above the current posted speeds. This is an important finding relating higher travel speeds and impacts to pedestrians Oregon Highway Plan (as amended July 2006). 9 All Traffic Data 24-hour classification and speed counts were taken on Thursday, June 5, All Traffic Data 24-hour classification and speed counts were taken on Thursday June 5, The 85 th percentile speed is defined as the speed below which 85 percent of the vehicles are traveling. Existing Conditions Motor Vehicle Conditions Page 2-16 December 2014
29 Table 2-9: US 101 and OR 38 Bi-Directional Volumes, Speeds, and Heavy Vehicle Usage a Surveyed Data Average Daily Traffic South of 22 nd Location along US 101 OR 38 North of 21 st Street North of 11 th Street North of OR 38 East of 3 rd Street Northbound 4,900 (50%) 6,500 (51%) 4,800 (49%) 2,700 (51%) 1,700 (49%) Southbound 4,900 (50%) 6,400 (49%) 4,900 (51%) 2,600 (49%) 1,800 (51%) Total 9,800 12,900 9,700 5,300 3,500 85th Percentile Speed Northbound 34 mph 32 mph 36 mph 43 mph 38 mph Southbound 35 mph 32 mph 34 mph 38 mph 34 mph Posted Speed Both Directions 30 mph 30 mph 30 mph 30 mph 25 mph Truck Traffic Percentage b Northbound 18% 16% 18% 20% 21% Southbound 18% 16% 17% 17% 23% a All Traffic Data 24-hour classification and speed counts were taken on Thursday, June 5, b Specified as vehicles with three or more axles. To further understand the vehicular use of US 101 and OR 38 over the course of a 24 hour period, Figure 2 7 shows the vehicle movements throughout the day at the location just north of 21 st Street. This graph shows the highest traffic volume for both eastbound and westbound vehicles is during the afternoon. Figure 2-7: US Hour Direction Volumes North of 21st Street Existing Conditions Motor Vehicle Conditions Page 2-17 December 2014
30 Figure 2 8 shows the 24 hour vehicular volumes as well as the highest traffic volume for both eastbound and westbound vehicles is during the afternoon just east of 3 rd Street. Intersection Turn Movement Volumes Intersection vehicle turn movement volumes were collected at four intersections along the corridors of study. The US 101/OR 38 intersection is signalized and the remaining are unsignalized. These intersections were selected based on recommendations from the TAC and are listed below from west to east: US 101/21 st Street US 101/20 th Street US 101/OR 38 Figure 2-8: OR Hour Direction Volumes East of 3rd Street OR 38/3 rd Street The traffic volumes were counted during the a.m. (7:00 a.m. to 9:00 a.m.), afternoon (2:00 p.m. to 4:00 p.m.) and p.m. (4:00 a.m. to 6:00 p.m.) peak periods. 12 The a.m., afternoon, and p.m. peak hour traffic volumes for the four study intersections are shown in Figure 2 9. Also included in Figure 2 9 are the lane configurations and traffic control at the study intersections. The detailed two hour traffic counts are included in the appendix. Seasonal adjustment rates were provided by ODOT 13 and were applied to the study intersections. 12 All Traffic Data turn movement counts taken on Thursday Jun 11, 2014 with the exception of AM Peak Hour for the north of 21 st Street and north of OR 38 locations, Afternoon Peak Hour for the north of OR 38 location, and PM Peak Hour for the north of OR 38 and north of 21 st Street locations. 13 Seasonal adjustment factors provided by ODOT Traffic Operations Engineer, Ray Lapke, via dated June 24, Existing Conditions Motor Vehicle Conditions Page 2-18 December 2014
31 38 mph 2,600 Umpqua River Schofield Creek N 14TH ST N 12TH ST N 13TH ST 34 mph 4, , mph N 11TH ST LAUREL AV N 10TH ST 2, mph 38 RIVERFRONT WY 4 N 3RD ST 1, mph 34 mph 1,800 2ND ST 32 mph 6,400 16TH ST WINCHESTER AV N 22ND ST N 21ST ST N 20TH ST N 19TH ST N 18TH ST 35 mph 4, OREGON U S US 101/N 21st St. LONGWOOD DR 4, mph 6, mph [14] (4) 2 [1] (0) 0 [1] (3) 0 RT TH LT RT TH LT 2 (3) [11] 332 (510) [536] 17 (18) [22] [4] (3) 4 [517] (517) 368 [7] (3) 2 LT TH RT LT TH RT 9 (6) [7] 0 (0) [0] 7 (1) [4] 2. US 101/N 20th St. [17] (10) 11 [3] (4) 3 [14] (13) 5 RT TH LT [13] (13) 4 [520] (502) 370 [9] (11) 7 LT TH RT RT LT 9 (7) [16] 1 (2) [1] 0 (2) [3] TH LT TH 10 (13) [14] 345 (512) [548] 5 (14) [18] RT 3. US 101 /OR 38 /Port Dock Rd. 4. OR 38/N 3rd St. [19] (6) 6 [3] (9) 4 [55] (51) 9 RT TH LT RT LT TH TH LT RT [30] (34) 47 [170] (190) 127 [181] (189) (5) [11] 159 (187) [227] 24 (34) [35] RT 16 (43) [39] 6 (2) [3] 94 (176) [168] LT TH [4] (2) 1 [4] (2) 2 [41] (41)26 RT TH LT [35] (33) 11 [131] (141) 74 [8] (15) 13 LT TH RT RT TH LT 6 (6) [17] 4 (6) [5] 12 (15) [7] 2 (10) [11] 53 (146) [159] 1 (2) [3] LT TH RT LEGEND - Study Intersection - Project Study Corridor - Traffic Signal AM (MID) [PM] LT TH RT Left Thru 00 mph 0,000 - Lane Configuration - Peak Hour Traffic Volumes - Volume Turn Movement Right - 85% Speed and Average Daily Traffic (Not Adjusted) No Scale Figure EXISTING MOTOR VEHICLE PEAK HOUR AND DAILY TRAFFIC VOLUMES AND SPEEDS
32 Mobility Standards Agency mobility standards often require intersections to meet level of service (LOS) or volume to capacity (V/C) intersection operation thresholds. The intersection LOS is similar to a report card rating based upon average vehicle delay. Level of service A, B, and C indicate conditions where traffic moves without significant delays over periods of peak hour travel demand. Level of service D and E are progressively worse operating conditions. Level of service F represents conditions where average vehicle delay has become excessive and demand has exceeded capacity. This condition is typically evident in long queues and delays. The volume to capacity (V/C) ratio represents the level of saturation of the intersection or individual movement. It is determined by dividing the peak hour traffic volume by the maximum hourly capacity of an intersection or turn movement. When the V/C ratio approaches 0.95, operations become unstable and small disruptions can cause the traffic flow to break down, as seen by the formation of excessive queues. Both US 101 and OR 38 are Oregon Department of Transportation (ODOT) facilities classified as Statewide Highways and freight routes within the study area boundaries. According to the 1999 Oregon Highway Plan (OHP), ODOT mobility standards are given as V/C ratios and are based on the highway category. 14 The applicable mobility standards and targets for US 101 and OR 38 are shown in Table 2 10 and are the same for both signalized and unsignalized intersections. Major Roadway Table 2-10: Applicable Study Intersection Mobility Standards Jurisdiction (Classification and Designations) Mobility Standard or Target US 101 ODOT (Statewide Highway, Freight Route) V/C 0.85 City of Reedsport LOS D or better OR 38 ODOT (Statewide Highway, Freight Route) V/C 0.85 City of Reedsport LOS D or better Existing Intersection Performance The existing performance of the study intersections was evaluated using Synchro software, which employs methodology from the 2010 Highway Capacity Manual 15 for unsignalized intersections and 2000 Highway Capacity Manual 16 for signalized intersections Oregon Highway Plan, Oregon Department of Transportation, 1999; Table 6 in Policy 1F displays the maximum allowable V/C ratios for areas outside of the Portland Metropolitan Area Highway Capacity Manual, Transportation Research Board, Washington, D.C., Existing Conditions Motor Vehicle Conditions Page 2-20 December 2014
33 The traffic volumes and transportation system configurations described previously were used to determine intersection levels of service (LOS) and volume to capacity (V/C) ratios. Intersection signal timing was obtained from ODOT and also used in the analysis. The results of the intersection operations analysis are presented in Table As shown, all of the intersections currently meet ODOT V/C mobility targets. Intersection Signalized Operating Standard Table 2-11: Study Intersection Performance A.M. Peak Hour Afternoon Peak Hour P.M. Peak Hour ODOT Delay V/C Delay V/C Delay V/C US 101/OR V/C Unsignalized US 101/21 st St 0.85 V/C US 101/20 th St 0.85 V/C OR 38/3 rd St 0.85 V/C Signalized intersection: Delay = Average Intersection Delay (sec.) LOS = Level of Service V/C = Volume-to-Capacity Ratio Unsignalized intersection: Delay = Critical Movement Approach Delay (sec.) LOS = Major Street LOS/Minor Street LOS V/C = Critical Movement Volume-to-Capacity Ratio Future Traffic Conditions A 20 year growth rate was applied to the US 101 and OR 38 study area corridors in order to project transportation modeling from 2014 to 2035 and analyze future estimated traffic volumes. The 20 year growth factor was obtained with direction from ODOT that utilizes ODOT Future Volumes Table. 17 The 2032 Future Highway Volume Table (FHVT) predicts a minimal amount of growth on both the US 101 or OR 38 study corridors with a 20 year factor of 1.02 for both US 101 and OR 38 (this is only a fraction of a percent per year). Table 2 12 at the top of the next page displays the projected 2035 traffic volumes modeled from the 20 year growth rate. As shown, intersection delay, LOS, and V/C ratios hardly increase over the 20 year period Highway Capacity Manual, Transportation Research Board, Washington, D.C., The 2032 Future Highway Volume Table is created using data from the Transportation Volume Tables. The future volumes are estimates only and local growth patterns and comprehensive plans may affect the actual outcome. Existing Conditions Motor Vehicle Conditions Page 2-21 December 2014
34 Intersection Signalized Table 2-12: Study Intersection Projected Performance (2035) Operating Standard A.M. Peak Hour Afternoon Peak Hour P.M. Peak Hour ODOT Delay V/C Delay V/C Delay V/C US 101/OR V/C Unsignalized US 101/21 st St 0.85 V/C US 101/20 th St 0.85 V/C OR 38/3 rd St 0.85 V/C Signalized intersection: Delay = Average Intersection Delay (sec.) LOS = Level of Service V/C = Volume-to-Capacity Ratio Unsignalized intersection: Delay = Critical Movement Approach Delay (sec.) LOS = Major Street LOS/Minor Street LOS V/C = Critical Movement Volume-to-Capacity Ratio Even though the 20 year growth rate factor from the 2032 FHVT is the supported methodology, a sensitivity analysis was performed to experiment with higher growth rates and their impact to the study area. Table 2 13 displays the V/C ratios for four intersections along OR 38 and US 101 using a growth rate of 0.5% per year (10% over 20 years) which is five times higher than FHVT growth assumption. The half percent per year growth rate was selected by the PMT as appropriate for this sensitivity analysis. As shown in Table 2 13 below, all intersections still meet ODOT V/C ratio requirements. Table 2-13: Study Intersection Sensitivity Analysis using a 0.5% Growth Rate per Year Intersection Signalized Operating Standard A.M. Peak Hour Afternoon Peak Hour P.M. Peak Hour ODOT Delay V/C Delay V/C Delay V/C US 101/OR V/C Unsignalized US 101/21 st St 0.85 V/C US 101/20 th St 0.85 V/C OR 38/3 rd St 0.85 V/C Signalized intersection: Delay = Average Intersection Delay (sec.) LOS = Level of Service V/C = Volume-to-Capacity Ratio Unsignalized intersection: Delay = Critical Movement Approach Delay (sec.) LOS = Major Street LOS/Minor Street LOS V/C = Critical Movement Volume-to-Capacity Ratio Existing Conditions Motor Vehicle Conditions Page 2-22 December 2014


35 Reedsport TSP Future Analysis The City of Reedsport s Transportation System Plan (TSP) was completed in 2005 and utilized a growth rate of 2.25% per year (a total of 45% growth over 20 years). A comparison of traffic counts at the US 101/OR 38 Junction was evaluated between seasonally adjusted volumes used for the TSP that were counted on September 30 th, 2004 and traffic counts used in this study counted on June 5 th 2014 that are also seasonally adjusted. As shown in the Figure 2 10 below, the traffic entering and exiting US 101 south of OR 38 has actually decreased 5% over the last ten years which does not reflect the anticipated original growth assumptions from the TSP. The declining traffic growth in Reedsport is consistent with census data that has shown a declining population in and within the vicinity of the City of Reedsport. 18 Figure 2-10: US 101 Ten-Year Volume Growth Comparison 18 US Census Bureau Reports the City of Reedsport s population has declined by 1,384 people over 20 years. (1990 had a population of 6,723 people, 2000 had a population of 5,755 people, and 2010 had a population of 5,339 people.) Existing Conditions Motor Vehicle Conditions Page 2-23 December 2014
36 An analysis of the p.m. peak hour operations at study intersections under the TSP high growth assumptions was completed for consistency with the approved TSP. Table 2 14 displays p.m. peak hour intersection operations under the assumption of 45% growth over 20 years compared to 4% projected growth over 20 years which is the growth assumption used in this study. As shown, all of the study intersections meet ODOT s mobility standards. Table 2-14: Study Intersection Sensitivity Analysis using a 2.25% Growth Rate per Year (45% growth over 20 years) Intersection Signalized Operating Standard 4% Growth (P.M. Peak Hour) 45% Growth (P.M. Peak Hour) ODOT Delay V/C Delay V/C US 101/OR V/C Unsignalized US 101/21 st St 0.85 V/C US 101/20 th St 0.85 V/C > 50s 0.41 OR 38/3 rd St 0.85 V/C Signalized intersection: Delay = Average Intersection Delay (sec.) V/C = Volume-to-Capacity Ratio Unsignalized intersection: Delay = Critical Movement Approach Delay (sec.) V/C = Critical Movement Volume-to-Capacity Ratio Existing Conditions Motor Vehicle Conditions Page 2-24 December 2014
37 CHAPTER 3 Chapter 3. CROSSING TREATMENT TOOLBOX A toolbox of potential pedestrian crossing treatments at unsignalized locations along the US 101 and OR 38 study area corridors was prepared to assist in developing crossing improvement concepts for multiple priority locations. Crossing treatments are intended to improve visibility of pedestrians and reduce the potential for pedestrian crashes. This toolbox is project specific and only includes treatment alternatives considered feasible within the scope of this safety study. These treatments are also consistent with U.S. Federal Highway Administration (FHWA) recommended guidelines. 19 The toolbox includes the following treatment options: Median Refuge Islands and Curb Extensions Rectangular Rapid Flashing Beacon (RRFB) with Raised Median Pedestrian Hybrid Beacon High intensity Activated Crosswalk (HAWK) Overhead Flashing Beacons (Standard and RRFB) Street Lighting Not all of these treatments are being recommended for implementation on the US 101 and OR 38 corridors. Instead, these treatments served as a list of options to choose from when addressing specific locations (see further discussed in Chapter 4). Some of these treatments could be used in combination. For example, the median refuge island and street lighting could either be standalone improvements or could be combined with one of the flasher/beacon or pedestrian traffic signal improvements. The treatment options are described next and additional information including general costs and lists of pros and cons is provided in the appendix. At the end of this chapter, a list of treatments considered but not included in the toolbox is provided along with supporting explanations. 19 Safety Effects of Marked Versus Unmarked Crosswalks at Uncontrolled Locations: Final Report and Recommended Guidelines, US Department of Transportation, Federal Highway Administration, September Crossing Treatment Toolbox Motor Vehicle Conditions Page 3-1 December 2014


38 MEDIAN REFUGE ISLAND AND CURB EXTENSIONS Median refuge islands are raised curbs in the center of the roadway that provide a sheltered pedestrian area where pedestrians can wait for gaps in traffic. Curb extensions are protracted corner curbs that can be utilized for both signalized and unsignalized intersections. Curb extensions provide pedestrians with shorter crosswalk travel length. They also reduce vehicle lane size, thus, vehicle speeds are often reduced as well. Median refuge islands separate opposing lanes of traffic and allow two stage crossings where pedestrians clear one direction of travel movement at a time. This reduces the size of individual gaps in traffic needed for a pedestrian to make a safe crossing. Some disadvantages of raised center medians are the creation of added obstruction in the roadway, conflicts with left turn lane needs, and potential right of way constraints. Two example median refuge islands are shown in Figure 3 1. Figure 3-1: Example Center Medians with Pedestrian Refuge Islands Pedestrian refuges can have a staggered or straight pedestrian cut through or path configuration. The example refuge island shown on the right in Figure 3 1 has a staggered pedestrian cut through or path, which requires pedestrians to turn towards on coming traffic before crossing. This encourages pedestrians to take a better view of the on coming traffic. A center median with a pedestrian refuge island would be a critical component if one of the two flashing beacon systems is selected as a preferred crossing treatment. In addition, a median refuge island could also be installed as part of a pedestrian traffic signal or HAWK signal. Crossing Treatment Toolbox Median Refuge Island and Curb Extensions Page 3-2 December 2014

39 RECTANGULAR RAPID FLASHING BEACON (RRFB) The Rectangular Rapid Flashing Beacon (RRFB) is a special LED flashing device installed below a crosswalk sign and placed at marked, unsignalized crosswalk locations. The RRFB increases pedestrian visibility by attracting driver attention with the flashing beacons and making them aware of the pedestrian s presence. The LED flashing devices are located below the crosswalk sign and above the arrow sign. 20 An RRFB sign assembly and a close up of the beacons are shown in Figure 3 2. The RRFB is pedestrian actuated with either hardwired or wireless pushbuttons. It can also be solar powered, which would make for easier installation (though monetary cost would be approximately equal due to higher equipment cost). Studies to date have shown very high driver compliance rates (i.e., percents in the 80 s and 90 s). 21 Figure 3-2: Example RRFB Sign Assembly and Close-Up of RRFB Flashers 20 Source of Figure 3-2: Manual on Uniform Traffic Control Devices (MUTCD) website, 6/16/ MUTCD - Interim Approval for Optional Use of Rectangular Rapid Flashing Beacons (IA-11), FHWA, July 16, 2008 Crossing Treatment Toolbox Rectangular Rapid Flashing Beacon (RRFB) Page 3-3 December 2014
 to provide a signalized, mid block pedestrian crossing.")

40 PEDESTRIAN HYBRID BEACON-HIGH INTENSITY ACTIVATED CROSSWALK (HAWK) A pedestrian hybrid beacon high intensity activated crosswalk (commonly referred to as a HAWK) uses a yellow red lens configuration (two red lenses on top and yellow lens on bottom) to provide a signalized, mid block pedestrian crossing. The pedestrian hybrid beacon is used to warn and control traffic to assist pedestrians in crossing a street at a marked crosswalk. Unlike a full pedestrian traffic signal, the HAWK signal remains dark when not activated and will allow vehicles to proceed with caution during the pedestrian clearance interval. An example HAWK signal is shown in Figure 3 3. The five phases of a HAWK signal are also shown in Figure 3 3 (phase 6 is cycling back to phase 1). 22 As shown, when no pedestrians are present, the HAWK signal is dark (phase 1). Once a pedestrian pushes the crossing button, the pedestrian hybrid beacon first flashes yellow (phase 2) and then becomes solid yellow (phase 3). These two warning indications prepare traffic to stop for the upcoming walk stage, which is a steady red (phase 4). The next stage is the don t walk stage (phase 5), and the hybrid beacon flashes red for vehicles. Pedestrians should finish crossing the street if they have already begun, and vehicular traffic must stop but then can proceed if there are no pedestrians in the road. The beacon then goes dark again (returning to phase 1). Figure 3-3: HAWK Signal and Phases The MUTCD provides guidelines and volume thresholds for when pedestrian hybrid beacons should be installed. 23 For example, this beacon system should be installed at least 100 feet from side streets or driveways that are controlled by Stop or Yield signs. In addition, if it is installed within a signal system, it should be coordinated with the system. NCHRP Report 562 documented compliance for this type of beacon crosswalk at upwards of 90% Source of Figure 3-3 image: Boise Guardian. 23 Chapter 4F, Manual on Uniform Traffic Control Devices, 2009 Edition, Page NCHRP 562, pg. 17. Crossing Treatment Toolbox Pedestrian Hybrid Beacon-High Intensity Activated Crosswalk (HAWK) Page 3-4 December 2014


41 FLASHING BEACONS If a pedestrian traffic signal or hybrid beacon is not warranted, another alternative is to install a flashing beacon system. Flashing beacon systems are considered by NCHRP Report 562 as active devices; meaning they warn, but do not stop traffic. Pedestrian actuation is one characteristic that should be incorporated into any flashing beacon system due to its importance for improved driver compliance. Overhead flashing beacons are flashing amber beacons installed on traffic signal poles and mast arms along with overhead signs. Overhead flashers are used to increase driver awareness when approaching a marked crosswalk at an uncontrolled location. Warning signs are typically placed in advance of the marked crosswalk or on signs located adjacent to the crosswalk entry. The two flashing beacons can be programmed to either operate continuously or be pedestrian actuated. STREET LIGHTING Street lighting is another important treatment that addresses night time visibility. Street lights provide increased pedestrian and bicycle visibility during the night and the dawn/dusk periods of the day by providing contrast between the pedestrian and their surroundings. They also improve visibility of oncoming vehicles so that pedestrians and bicycles can better judge gaps in traffic. Figure 3-4: Example Overhead Flashing Beacon Street lights should be included with any selected crossing treatment and should be oriented toward pedestrian activity. Lighting levels should also satisfy applicable ODOT and City of Reedsport lighting standards. Figure 3-5: Example Street Lights Crossing Treatment Toolbox Flashing Beacons Page 3-5 December 2014
42 IMPROVEMENTS NOT INCLUDED Items which were considered but left out of the Pedestrian Toolbox include: Traffic Calming Measures: These measures (i.e. speed humps, narrow lanes) are not consistent with the arterial and truck route classifications of US 101 or OR 38 and the emergency services needs. Lowering Speed Limit: The speed limit is determined by roadway characteristics and the 85 th percentile speed of traffic. Studies show that artificially lowering the speed of a roadway is ineffective at garnering driver compliance. However, some of the other improvements median refuge islands and curb extensions may calm traffic and result in lower travel speeds. Therefore, after other projects have been implemented, future speed investigation can be performed to see if lowering the speed is justified. In Roadway Lighting: These are highly susceptible to roadway damage (especially snow plows), cost intensive for both installation and maintenance, and are discouraged by ODOT. Grade Separated Pedestrian Crossing (i.e., Pedestrian Bridge or Tunnel): This measure would be very expensive and require significant right of way to address ADA needs. In addition, such crossings are not always used by pedestrians. Pedestrian Traffic Signal: This measure does not meet the MUTCD minimum pedestrian volume thresholds Manual on Uniform Traffic Control Devices for Streets and Highways (MUTCD) ed. Washington, D.C.: U.S. Dept. of Transportation, Federal Highway Administration, Crossing Treatment Toolbox Improvements Not Included Page 3-6 December 2014
43 CHAPTER 4 Chapter 4. PEDESTRIAN IMPROVEMENT CONCEPTS Recommended pedestrian crossing improvement concepts were developed for the US 101 and OR 38 study corridors in the City of Reedsport, Oregon. This chapter describes how pedestrian crossing locations were prioritized and documents the recommended crossing improvement alternatives at five priority locations. The Technical Advisory Committee (TAC) directed the concept development. Stakeholder interviews and a City Council work session provided important local stakeholder feedback on the locations and their priority. IMPROVEMENT LOCATION PRIORITIZATION Potential crossing improvement locations along the study area corridor were prioritized based on a variety of factors. The purpose of the prioritization process was to identify where new pedestrian crossing treatments could be constructed. Therefore, the primary locations considered were those within the study area located farther than 250 feet from the nearest signalized pedestrian crossing. 26 The prioritization of potential crossing improvement locations was performed based on preselected evaluation criteria established through coordination with the TAC. Different weighting factors were applied to provide emphasis to selected criteria, especially to pedestrian and bicycle collisions. The evaluation criteria include the following (listed in order of greatest weighting): Collisions ( ) o Collisions in the vicinity o Collisions involving pedestrians and bicyclists in the vicinity Pedestrian volumes during AM, midday, and PM peak hours The presence of nearby pedestrian generators including: o Schools o Parks o Restaurants/Convenience Markets o Hotels o Post Office o Trail Crossings 26 Evaluation of Alternative Pedestrian Control Devices, SPR 721, ODOT, Pedestrian Improvement Concepts Improvement Location Prioritization Page 4-1 December 2014


44 Scores for each location were calculated by summing the applicable weighted criteria scores for each potential location. The prioritized list of the top five locations resulting from the application of the evaluation criteria is provided in Table 4 1. Table 4-1: Prioritized Crossing Improvement Locations Potential Crossing Location Weighted Score Rank US 101/20th Street 49 1 US 101/21st Street 40 2 US 101/14th Street 31 3 The Levee Trail Plan is currently under OR 38/3rd Street 12 4 development. As part of this plan, highway US 101/Juniper Ave 7 5 crossings are being examined. However, at this point, it appears that a new pedestrian crossing across 101 (between the north side of the bridge and Les Schwab) will not be possible. This crossing was not part of the detailed pedestrian crossing analysis; however, this crossing will require future study for potential crossing improvements. CROSSING IMPROVEMENT CONCEPTS Potential crossing improvement concepts were analyzed for each high priority unsignalized location. Figure 4 1 shows an overview map of the prioritized locations. Each location is discussed in the sections below from highest to lowest ranking, including detailed crossing improvement concept sketches and identification of potential street lighting improvements. Figure 4-1: Priority Crossing Locations US 101 and 20 th Street (Priority Location #1) Pedestrian improvements at 20 th Street intersection ranked as the highest priority location due to the amount of pedestrian activity, especially during afternoon hours. The high crossing volumes are due to nearby pedestrian generators including Reedsport Community Charter School two blocks to the south on 22 nd Street, Lion s Park, 7 Eleven and several other restaurants that line the north side of US 101. In addition, five collisions occurred at Pedestrian Improvement Concepts Crossing Improvement Concepts Page 4-2 December 2014
45 this intersection from 2003 to 2013 including one pedestrian injury (DKS was also made aware of a recent pedestrian crash at this location that was not included as part of the crash analysis). This location is also noted in the City of Reedsport s TSP as a location that will need marked crosswalk and additional enhancements. 27 Two crossing improvement concepts in coordination with the NCHRP Report are provided for the US 101/20 th Street intersection and are detailed below. Crossing Improvement Option A Option A (Figure 4 2 on the following page) includes a Rectangular Rapid Flashing Beacon (RRFB) or similar treatment and a raised median with pedestrian refuge. 29 The raised median allows a two stage crossing for pedestrians so each direction of traffic can be crossed separately as gaps in traffic are available. Adding the raised median requires modifying the existing striping along US 101 to accommodate the needed width of the pedestrian refuge. The addition of the median will remove the option for on street parking in the vicinity of the proposed improvements and will require coordination with the freight industry. Due to the pedestrian refuge median recommended in this alternative, one of the 7 Eleven accesses along US 101 closest to 20 th Street would likely be restricted to a right in, right out only driveway. However, 7 Eleven would still retain their existing full access driveway that is slightly further west on US 101 as well as the existing full access driveway on 20 th Street. Any access modifications would require either the consent of the property owner or agency compliance with the Senate Bill 408 process. Additionally, this concept removes the existing crosswalk striping on the east leg of the intersection and moves the southbound stop bar closer to the intersection. Removal of this crosswalk will encourage pedestrians to use the RRFB proposed on the west leg of the intersection. Striping pedestrian crossings are also recommended along the north and south stop controlled intersection legs on 20 th Street to delineate pedestrian crossings across the minor street. Lighting improvement needs include three wood pole mounted lights on existing wood poles along the south side of US 101, one additional standalone on the northwest corner of the intersection, and the rotation of existing lighting on the southwest corner of the intersection to improve lighting for the proposed pedestrian facilities. 27 Reedsport: Transportation System Plan, Table 5-3, Reedsport (Or.); DKS Associates; Winterbook Planning, February Improving Pedestrian Safety at Unsignalized Crossings, Report 562, National Cooperative Highway Research Program According to NCHRP Report 562, the minimum requirement for the US 101/20 th Street Option A alternative is a marked crosswalk. However based on public input, discussions with the City of Reedsport, and the safety history at this location, we still recommend an RRFB under this alternative. Pedestrian Improvement Concepts Crossing Improvement Concepts Page 4-3 December 2014
 to shorten the crossing distance across US 101 and 20 th Street.")
46 Figure 4-2: US 101/20th Street Crossing Improvement Option A (4-Lane Option with Median) Crossing Improvement Option B Option B (Figure 4 3 on the following page) proposes an overhead beacon coupled with sidewalk curb extensions (bulb outs) to shorten the crossing distance across US 101 and 20 th Street. This short term concept is recommended in the absence of a pedestrian refuge island due to the existing wide roadway cross section, motor vehicle volume, and 85 th percentile speed. This solution requires a mast arm and mounted beacons but less roadway and striping modification when compared to the raised median shown in Option A. Two overhead mast arm mounted beacons significantly increase the construction cost compared to the smaller pole mounted RRFB s identified in Option A. Based on recent studies, a ground mounted RRFB may also be appropriate when coupled with the sidewalk bulb outs. 30 The decision between an overhead beacon or groundmounted RRFB for this alternative should be re evaluated as part of the design process. 30 Recent studies include the Evaluation of Alternative Pedestrian Traffic Control Devices, SPR 721, ODOT, March 2012 and a case study done by Portland State University in Portland, OR entitled Evaluating Driver and Pedestrian Behaviors at Enhanced and Multi-lane Midblock Pedestrian Crossings, July Pedestrian Improvement Concepts Crossing Improvement Concepts Page 4-4 December 2014
 US 101 and 21 st Street (Priority Location #2) Even")


47 Figure 4-3: US 101/20th Street Crossing Location Improvement Option B (4-Lane Option with Curb Extensions) US 101 and 21 st Street (Priority Location #2) Even though this location received a high prioritization ranking, it is located between an existing signalized pedestrian crossing a block to the west on 22 nd street and the US 101/20 th Figure 4-4: US 101/21st Street Crossing Location Improvement Pedestrian Improvement Concepts Crossing Improvement Concepts Page 4-5 December 2014
.")
48 Street crossing discussed earlier (Priority Location #1). For these reasons, no pedestrian crossing alternatives are recommended for this location at this time. Instead, the US 101 and 21 st Street location should be further evaluated for pedestrian activity after the implementation of crossing improvements at priority location #1 (20 th Street). Therefore, it is considered a mid term priority to allow for further analysis and evaluation at a later date. Standalone street lighting is recommended on the northeast corner of the intersection and a rotation of the existing street light on the southwest corner, as shown in Figure 4 4. US 101 and 14 th Street (Priority Location #3) The US 101/14 th Street intersection does not have a significant collision history or significant pedestrian volumes at this time. This location is only 200 feet from signalized intersections in both directions and left turn movements into the Best Western establishment or onto 14 th Street would likely be prohibited if a raised median refuge was proposed. Furthermore, no crosswalk striping is recommended because existing pedestrian crossing volumes do not justify pedestrian striping as per NCHRP Report As shown in Figure 4 5, additional standalone and wood pole mounted lighting is proposed at this location. Figure 4-5: US 101/14th Street Crossing Improvement Location 31 Improving Pedestrian Safety at Unsignalized Crossings, Report 562, National Cooperative Highway Research Program Pedestrian Improvement Concepts Crossing Improvement Concepts Page 4-6 December 2014

49 OR 38 and 3 rd Street (Priority Location #4) Downtown Reedsport consists of several shops lining both sides of OR 38 but significant pedestrian generators in the area include the City s Post Office and the Sugar Shack Bakery. Figure 4 6 on the following page depicts the curb extensions, street lighting and pedestrian signage proposed for this study area location. High travel speeds are a common complaint from Reedsport residents and 85 th percentile speeds along this corridor have been observed to exceed the posted speed limits. 32 Motor vehicle speeds above the posted limit may be alleviated by narrowing OR 38 with sidewalk bulb outs which is consistent with what is proposed in this vicinity in the City of Reedsport s Waterfront and Downtown Plan but will require coordination with the freight industry due to the reduced curb to curb cross section. 33, 34 Although most street lighting in the downtown area is sufficient, three new street lights are recommended as shown in Figure 4 6. Speed feedback signs are recommended at this location in the Corridor Wide Treatments section of this memorandum to reduce travel speeds. Figure 4-6: OR 38/3rd Street Crossing Improvement Concept 32 Reedsport Pedestrian Safety Study Technical Memorandum #1: Existing Conditions Analysis, Table 9, DKS Associates, June 30, Adding medians and/or curb extensions to narrow roadway width have been documented in Federal Highway Administration reports (FHWA-HRT ) to reduce travel speeds. 34 Reedsport Waterfront and Downtown Plan, Reedsport (Or.); ODOT, April 1, Pedestrian Improvement Concepts Crossing Improvement Concepts Page 4-7 December 2014

50 US 101 and Juniper Avenue (Priority Location #5) The fifth high priority unsignalized pedestrian crossing location is the US 101/Juniper Avenue intersection, located between 11 th Street and 12 th Street on US 101. Due to current land uses, access spacing, connectivity challenges, and inconsistent pedestrian crossing locations 35, there are no evident locations for pedestrian crossing improvements that would significantly facilitate safe pedestrian activity across US 101. TRAFFIC SIGNAL IMPROVEMENTS Traffic signal improvements are another strategy that can be implemented along the study corridor to provide better pedestrian crossing accommodations. There are two signalized intersections within the study area where observed intersection safety improvements are needed; the US 101/OR 38 and US 101/22 nd Street intersections. Specific needs for each location are discussed in the following sections. US 101 and OR 38 The only observed intersection improvement need for this location is intersection lighting as shown in Figure 4 7. Figure 4-7: US 101 and OR 38 Junction Intersection Improvement Needs 35 Pedestrian crossing locations were observed on June 4 th, Pedestrian Improvement Concepts Traffic Signal Improvements Page 4-8 December 2014

51 Two new standalone street lights are recommended on the north and west corners of the intersection and rotation of the existing street light on the east corner of the intersection is also proposed. A development agreement exists between the City and developer for the surrounding area that includes signal modifications at this intersection as well as widening the OR 38 and Port Dock Road approaches for dedicated left turn lanes. US 101 and 22nd Street Safety improvements were given significant attention at the US 101/22nd Street intersection due to the nearby Reedsport Pedestrian Charter School, existing pedestrian crossing volume, and pedestrian collision history. The identified improvements for this intersection and are outlined below. Lighting One new wood pole mounted street light on the northeast corner and one new standalone street light on the southwest corner are recommended along with the rotation of two existing street lights on the northwest and southeast corners as shown in Figure 4 8. Figure 4-8: US 101/22nd Street Signalized Intersection Improvement Needs Left Turn Signal Head Modification and Signal Phasing Modifications Two pedestrian collisions at this intersection involved motor vehicles turning left and failing to yield to crossing pedestrians. In order to improve pedestrian safety, installation of flashing Pedestrian Improvement Concepts Traffic Signal Improvements December 2014 Page 4-9

52 yellow arrow left turn signal heads is recommended. A recent NCHRP report 36 concluded leftturn safety is significantly improved through the use of flashing yellow left turn heads when compared with the circular green signal that is provided on the 5 section doghouse signal head. Providing flashing yellow arrow signal heads would also allow ODOT the option of prohibiting the permissive left turn phase when conflicting pedestrian phases are activated (i.e. when pedestrian pushbutton call is placed by pedestrian). This would eliminate conflicts between permissive left turning vehicles and school children crossing the street. The existing 170 controller at this location does not allow the signal phasing flexibility necessary to operate the protected/permissive phasing required for the flashing yellow left turn arrow, or the permissive left turn prohibition during pedestrian crossings. To accommodate this functionality an upgrade to a 2070 traffic signal controller is necessary. Discussions with ODOT staff indicate the 2070 controller upgrade is already planned for this intersection. 37 The protective/permissive phasing will also require the re striping of 22 nd Street near the intersection as shown in Figure 4 8. This will provide dedicated left turn lanes necessary to support the protective/permissive phasing and will reduce minor street delays and queuing. The striping modifications will also require modification to the existing traffic signal detection. CORRIDOR-WIDE IMPROVEMENTS Corridor wide pedestrian safety treatments were also considered along the entire length of the study area corridors to improve overall pedestrian safety. Treatments include pedestrian countdown timers, speed feedback signs, street lighting, access management and a potential three lane conversion on US 101. Pedestrian Countdown Timers Pedestrian countdown timers are devices used in conjunction with standard signalized intersection infrastructure that provides information to pedestrians about how much time is left to cross the street. Studies have shown pedestrian countdown timers reduce pedestrian motor vehicle conflicts. 38 Example of a Pedestrian Countdown Timer 36 Flashing Yellow Arrow for Safer Left Turns, Report 493, National Cooperative Highway Research Program 37 Conversation with Aaron Brooks, ODOT Region 3 Traffic Analyst on July 9 th, Highway Safety Manual, Edition 1, Volume 3, 14A Pedestrian Improvement Concepts Corridor-Wide Improvements Page 4-10 December 2014

53 The installation of pedestrian countdown timers is recommended at all signalized intersections along the study corridors. All signalized intersections within the study area are displayed in Figure 4 9 and listed below: US 101/22 nd Street US 101/19 th Street US 101/Winchester Street US 101/13 th Street US 101/OR 38 Junction SPEED FEEDBACK SIGNS Speed feedback signs are low cost treatments that have been shown to reduce traffic speeds, particularly along roadways where travel speeds commonly exceed the posted speed limit. FHWA studies show that 85 th percentile motor vehicle travel speeds could be reduced by 5 to 10% in the event of a speed feedback sign installation. 39 Since stakeholders are concerned about drivers traveling too fast and 85 th percentile speeds were above the posted speed limit for both the US 101 and OR 38 study corridors 40, it is recommended that permanent speed feedback signs be placed along the corridor on both sides of the street at the following four locations shown in Figure 4 9: US 101 near 22 nd Street for eastbound traffic US 101 east of the Schofield Bridge for both east and westbound traffic West of US 101/OR 38 Junction for westbound traffic OR 38 east of 3 rd Street for westbound traffic Figure 4-9: Speed Feedback Sign and Signalized Intersection Locations 39 Engineering Countermeasures for Reducing Speeds, Federal Highway Administration, < 40 Traffic data along US 101 and OR 38 was gathered on June 5 th, Pedestrian Improvement Concepts Speed Feedback Signs Page 4-11 December 2014

54 Standalone Cobrahead Street Light (R) and Supplemental Lighting on Utility Pole (L) Street Lighting The Highway Safety Manual states that a 28% reduction in all collision types could occur when lighting is provided on roadways when there was previously no lighting present 41. Even though there is some existing street lighting along the majority of the US 101 and OR 38 corridors, observed lighting levels indicate that supplementary lighting along both study corridors is needed in addition to the lighting proposed at the specific crossing improvement locations. Supplemental street lighting is recommended along the entire corridor with street lights provided on utility poles where available. When a utility pole is not available, standalone cobrahead street lights are recommended, consistent with the overall vision of future corridor lighting. This supplemental lighting is considered a midterm priority. Coordination with the utility provider to relocate utility poles will be necessary to provide adequate light levels along the corridor. Access Management Access management refers to the use of a broad set of techniques that balance the need to provide safe, efficient, and timely travel with the ability to allow access to individual properties. Some techniques include driveway closures, consolidations with adjacent properties, and relocations. They also include roadway realignments (particularly near offset intersections), the placement of driveways onto side streets rather than onto US 101 or OR 38, and the use of medians in the roadway to limit which turn movements can be performed. Proper implementation of access management techniques along the US 101 and OR 38 study corridors is expected to reduce congestion while also increasing corridor capacity and reduce collisions approximately 25 percent 42. Access modifications necessary to implement priority projects are recommended for the short term. This would include the restriction of one of the 7 Eleven accesses along US 101 to a right in, right out only driveway under the Option A pedestrian crossing improvement at the US 101/20 th Street location. Any access modifications would require either the consent of the property owner or agency compliance with the Senate Bill 408 process.no long term access management is recommended as part of this evaluation. However, the City s TSP recommends the creation of an Access Management plan along both study corridors Highway Safety Manual, Edition 1, Volume 3, Table Highway Safety Manual, Edition 1, Volume 3, Table Reedsport: Transportation System Plan, Reedsport (Or.); DKS Associates; Winterbook Planning, February Pedestrian Improvement Concepts Speed Feedback Signs Page 4-12 December 2014

55 CHAPTER 5 Chapter 5. US 101 LANE CONVERSION ALTERNATIVES US 101 currently serves as a key connector for commercial and residential uses alike to travel across town to local schools, parks, restaurants, hotels, and other places of interest in the City of Reedsport. This presents an opportunity to consider three and five lane conversions to increase corridor safety and multi modal mobility and connectivity. The sections below contain a high level discussion regarding what a three or five lane conversion could do for separate portions of the US 101 corridor in Reedsport, Oregon. THREE-LANE CONVERSION US 101 is a two lane facility south of 22 nd Street and north of the US 101/OR 38 Junction. The roadway widens from two lanes to four lanes within the City of Reedsport which encourages through traffic to use this segment to pass slower moving vehicles. This fact has led to high travel speeds and an increase in collisions (including pedestrian collisions) along the corridor. As part of the overall transportation system, the four lane section provides additional capacity for a 1.3 mile segment, however, through traffic is still limited by the two lane roadway constraints north and south of the City. Implementing a three lane section in the southern section of US 101 between 16 th Street and 22 nd Street could provide a better transition to the 2 lane segments, improving safety for local and through traffic, but most importantly, for pedestrians and bicycles traveling along the corridor. The preliminary three lane conversion was presented to the City Council at a work session on September 8, 2015 and received positive feedback. However, the City of Reedsport s Transportation System Plan 44 recommends a five lane cross section for this section of US 101, thus, an amendment to the TSP, public involvement to receive public input, applicable policy changes, and council adoption will be needed. Southern Section of US Reedsport: Transportation System Plan, Reedsport (Or.); DKS Associates; Winterbook Planning, February US 101 Lane Conversion Alternatives Three-Lane Conversion Page 5-1 December 2014
56 Below is a high level discussion on how surrounding land uses, available roadway width, collision analysis, and motor vehicle volumes relate to the US 101 corridor from 16 th Street to 22nd Street and how a general four to three lane conversion consisting of two travel lanes and a continuous center turn lane could affect all modes of transportation within the area. Specific three lane alternatives with corresponding considerations are presented later in this section. Land Use Hotels, restaurants, schools, parks and other major pedestrian, bicycle and motor vehicle attractions line the US 101 study corridor between 16 th Street to 22 nd Street. Even though only a few residential communities are directly adjacent to US 101, residential land use is located within a block north or south of the facility. Thoughtful implementation of a four to three lane conversion in this portion of the study corridor could help create a foundation for a continuous and cohesive corridor while balancing the needs and objectives of surrounding land uses. No modification to the current pavement width would be necessary since the application of a three lane conversion would allow 26 to 29 feet of the existing roadway width to be repurposed for travel experience enhancement for all modes of travel. This space gives way for extreme flexibility; offering adequate area for buffered bike lanes, on street parking, or a combination of other roadway elements. Collision Analysis As discussed in the Existing Conditions chapter, the yearly collision rate for the entire US 101 corridor is 3.01 collisions per million vehicle miles traveled, which is almost twice the average ODOT State Highway Crash Rate for similar roadways of 1.48 collisions per million vehicle miles traveled. 45 In order to reduce the existing crash rate to desired levels, substantial changes are necessary to US 101 in the City of Reedsport to improve safety for all modes of travel. The Highway Safety Manual published a crash modification factor (CMF) of 0.71 when a four lane arterial inside the urban growth boundary is converted into a three lane facility 46. This means a three lane conversion for the southern section of the US 101 study corridor could reduce the number and severity of collisions in the section by approximately 29%. Therefore, fatal and injury A collisions in the area could also decrease by 29% State Highway Crash Rate Tables, ODOT Crash Analysis and Reporting Unit, July 2012; Table IV. 46 Highway Safety Manual, Edition 1, Volume 3, Table Key Statistic Converting US 101 to a three lane facility could reduce all collisions by 29%. US 101 Lane Conversion Alternatives Three-Lane Conversion Page 5-2 December 2014
57 Motor Vehicle Volume The average daily traffic along US 101 in the project vicinity is 9,100 vehicles which is influenced by existing land use and freight routing. A 20 year growth rate that utilizes the ODOT Future Volume Tables was applied to the US 101 study area corridor in order to project transportation modeling from 2014 to 2035 and analyze future estimated traffic volumes. 47 The 20 year growth factor predicts a minimal amount of growth on the US 101 study corridor with a 20 year factor of 1.02 for US 101 (this is only a fraction of a percent per year). This small growth rate is consistent with the US Census data showing the consistently declining population of Reedsport. 48 As shown in Table 5 1, the current four lane configuration is projected to provide adequate intersection capacity through the year 2035 along the study corridor. As shown, intersection operations at affected intersections 49 still remain adequate under the effect of a three lane conversion. Intersection Table 5-1: Study Intersection Performance With Three-Lane Conversion Operating Standard Existing Cross-Section (2035 P.M. Peak Hour) With 3-Lane Conversion (2035 P.M. Peak Hour) ODOT Delay V/C Delay V/C US 101/21 st St 0.85 V/C US 101/20 th St 0.85 V/C Signalized intersection: Delay = Average Intersection Delay (sec.) V/C = Volume-to-Capacity Ratio Unsignalized intersection: Delay = Critical Movement Approach Delay (sec.) V/C = Critical Movement Volume-to-Capacity Ratio Even though the 20 year growth rate factor from the 2032 FHVT is the supported methodology, a sensitivity analysis was performed on the capacity calculations to experiment with higher growth rates and their impact to the study area. Table 5 2 at the top of the next page displays a comparison of the current four lane configuration and the threelane conversion V/C ratios for three intersections along US 101 using a growth rate of 0.5% per year (10% over 20 years) which is five times higher than the FHVT growth assumption. As shown in the table on the following page, all intersections still meet ODOT V/C ratio requirements under the three lane road configuration. 47 The 2032 Future Highway Volume Table is created using data from the Transportation Volume Tables. The future volumes are estimates only and local growth patterns and comprehensive plans may affect the actual outcome. 48 US Census Bureau Reports the City of Reedsport s population has declined by 1,384 people over 20 years. (1990 had a population of 6,723 people, 2000 had a population of 5,755 people, and 2010 had a population of 5,339 people.) 49 The Highway 101/Highway 38 Junction is not included in the proposed three-lane portion of US 101 and is therefore not included in intersection analysis in this section. US 101 Lane Conversion Alternatives Three-Lane Conversion Page 5-3 December 2014
58 Intersection Table 5-2: Study Intersection Sensitivity Analysis With Three-Lane Conversion Operating Standard 3-Lane Conversion (2035 P.M. Peak Hour) 10% Growth 3-Lane Conversion ODOT Delay V/C Delay V/C US 101/21 st St 0.85 V/C US 101/20 th St 0.85 V/C Signalized intersection: Delay = Average Intersection Delay (sec.) V/C = Volume-to-Capacity Ratio Unsignalized intersection: Delay = Critical Movement Approach Delay (sec.) V/C = Critical Movement Volume-to-Capacity Ratio Reedsport TSP Future Analysis An analysis similar to the one discussed in the Motor Vehicle Conditions section in Chapter 2 was performed for the primary study intersections that would be affected by the three lane conversion of the southern portion of US 101. Table 5 3 displays intersection operations under the TSP assumption of 45% growth and a three lane conversion. As previously discussed this growth assumption does not reflect the last ten years of historical growth. Intersection Table 5-3: Study Intersection 45% Growth With Three-Lane Conversion Operating Standard 3-Lane Conversion (2035 P.M. Peak Hour) 45% Growth 3-Lane Conversion ODOT Delay V/C Delay V/C US 101/21 st St 0.85 V/C > 50s 0.14 US 101/20 th St 0.85 V/C > 50s 0.63 Signalized intersection: Delay = Average Intersection Delay (sec.) V/C = Volume-to-Capacity Ratio Unsignalized intersection: Delay = Critical Movement Approach Delay (sec.) V/C = Critical Movement Volume-to-Capacity Ratio Available Roadway Width The US 101 study corridor s existing roadway width ranges from 67 feet near 22 nd Street to 64 feet near 20 th Street. 50 Despite the relatively wide width of the roadway, there are no dedicated bike lanes or left turn lanes. Both of these aspects threaten traffic for bicyclists and are the leading causes in the higher than average crash rate. Implementing the threelane conversion along the US 101 study corridor could improve comfort and safety for all modes of travel with a relatively low cost as the modifications could be accommodated within the existing curb to curb space (only striping and traffic signal modifications would be required to implement the three lane conversion). 50 Roadway width measured from face of curb to face of curb. US 101 Lane Conversion Alternatives Three-Lane Conversion Page 5-4 December 2014
59 Lane Conversion Alternatives Two three Lane conversion alternatives were evaluated to increase safety, provide left turn pockets, and compliment surrounding land uses by providing dedicated parking that encourages multimodal transportation. Details about each alternative are mentioned in the sections below as well as a concept figure displaying how the three lane conversion could facilitate the pedestrian crossing improvements at 20 th Street previously discussed in Chapter 4. Lane Conversion Alternative 1: Maximum parking Alternative 1 would include one northbound through lane, one southbound through lane, a two way center left turn lane, bike lanes, and on street parking on both sides to provide the maximum parking to adjacent land uses (see Figure 5 1). Motor Vehicle Mobility Lane Conversion Alternative 1 Considerations Reduces number of travel lanes from four to three Capacity reduced and travel time increased for through-traveling vehicles 51 Maintains twelve-foot outside travel lanes On-street parking increases motor vehicle movements in the roadway and may reduce travel speeds Walkability Bicycle Facilities Freight Service Business Accessibility Cost Other Existing sidewalks remain On-street parking and bike lanes provides additional separation from motor vehicle lanes Includes six-foot bike lanes Maintains twelve-foot travel lanes and a 14-foot left turn lane for freight movements Potential conflicts with bike lanes Center turn lane improves access for turning vehicles On-street parking improves ease of access to commercial facilities Improved bicycle access Intersections and traffic signals would need to be reconfigured Center left-turn lane offers opportunities for design elements including raised median treatments (e.g., landscaping, pedestrian refuge, access management) 51 See Synchro modeling reports in the appendix. US 101 Lane Conversion Alternatives Three-Lane Conversion Page 5-5 December 2014

60 Figure 5-1: Three-Lane Conversion Alternative 1 US 101 Lane Conversion Alternatives Three-Lane Conversion Page 5-6 December 2014
61 Lane Conversion Alternative 2: Multimodal Safety Alternative 2 would include one northbound through lane, one southbound through lane, a two way center left turn lane, as well as buffered bike lanes on both sides with an on street parking option for either the northbound or southbound traffic (see Figure 5 2). Lane Conversion Alternative 2 Considerations Motor Vehicle Mobility Reduces number of travel lanes from four to three Capacity reduced and travel time increased for through-traveling vehicles Maintains twelve-foot outside travel lanes On-street parking increases motor vehicle movements in the roadway and may reduce travel speeds Walkability Existing sidewalks remain Buffered bike lanes and on-street parking provide separation from motor vehicle lanes Bicycle Facilities Includes five- to six-foot bike lanes with four-foot buffers Freight Service Maintains twelve-foot travel lanes and a 14-foot left turn lane for freight movements Potential conflicts with bike lanes Business Accessibility Center turn lane improves access for turning vehicles On-street parking improves ease of access to commercial facilities Improved bicycle access Cost Intersections and traffic signals would need to be reconfigured Other Center left-turn lane offers opportunities for design elements including raised median treatments (e.g., landscaping, pedestrian refuge, access management) US 101 Lane Conversion Alternatives Three-Lane Conversion Page 5-7 December 2014

62 Figure 5-2: Three-Lane Conversion Alternative 2 US 101 Lane Conversion Alternatives Three-Lane Conversion Page 5-8 December 2014

63 Revised 20 th Street Crossing Improvement Concept with Three Lane Conversion As previously discussed, several pedestrian crossing alternatives were shown. If the threelane conversion is advanced, the following crossing improvement at 20th Street is recommended in place of those mentioned in the Crossing Improvement Concepts section. As shown in Figure 5 3, the roadway space provided from the four to three lane conversion would allow for the combination of an RRFB or similar treatment, raised median pedestrian refuge 52 and curb extensions to provide all of the benefits mentioned in both of the short term crossing improvement concepts for the 20th Street location. 53 Figure 5-3: US 101 and 20th Street Three-Lane Conversion Crossing Improvement Concept (Option C) 52 Note: A median refuge island is a conceptual at this time and will require motor carrier coordination and approval. 53 According to NCHRP Report 562, the minimum requirement for the US 101/20 th Street Option A alternative is a marked crosswalk. However based on public input, discussions with the City of Reedsport, and the safety history at this location, we still recommend an RRFB under this alternative. US 101 Lane Conversion Alternatives Three-Lane Conversion Page 5-9 December 2014


64 FIVE-LANE CONVERSION Since the pedestrian volumes were lower in this section and discussions with City staff indicated that land uses along US 101 north of 16 th Street may not benefit directly from a three lane conversion, converting this section to a continuous five lane facility consisting of five foot bike lanes, eleven foot through lanes, and a continuous 13 foot center turn lane as shown in Figure 5 4 to the right is Figure 5-4: Five-Lane Cross Section Example recommended. Further coordination with ODOT will be necessary to gain approval for this cross section. The five lane conversion along the northern portion of US 101 is considered a mid term project and will require design exceptions to fit the proposed lane configuration within existing roadway width. NEXT STEPS The recommended alternative for the three lane conversion along the southern section of US 101 and a five lane conversion along the northern section of US 101 within the City of Reedsport will require freight mobility approval. Pedestrian crossing recommendations that include raised medians and curb extensions will also require further coordination with the freight community. The design exception process would be necessary to implement the recommended five0lane cross section along US 101 north of 16 th Street. Further coordination will be needed with property owners of the 7 Eleven to identify potential access modifications if the public decides to move forward with the Option A pedestrian crossing concept at the US 101/20 th Street location. An amendment to the City of Reedsport s Transportation System Plan is necessary in order to implement the proposed three or five lane conversion. An amendment to the TSP will require a public involvement process that allows Reedsport residents to provide feedback on the recommended changes and would require City of Reedsport City Council adoption. US 101 Lane Conversion Alternatives Five-Lane Conversion Page 5-10 December 2014
65 CHAPTER 6 Chapter 6. PROJECT IMPLEMENTATION PROJECT IMPLEMENTATION Project implementation resources were prepared for the recommended crossing improvement concepts and overall corridor treatment options, which were discussed previously in Chapters 4 and 5. The implementation resources include prioritization of the improvement projects and associated cost estimates. PROJECT PRIORITIZATION The recommended safety improvement projects for the US 101 and OR 38 corridors are listed by improvement type in Table 6 1. The projects are also classified based on whether they are short term, or mid term priority. No long term priorities are recommended in this study. Table 6-1: Prioritized Safety Improvements on the US 101 and OR 38 Corridors Improvement Type Short-Term Projects Listed by Priority Mid-Term Pedestrian Crossing Improvement Traffic Signal Improvement Street Lighting Speed Feedback Sign Access Management US 101 Lane Conversion US 101/20th Street OR 38/3rd Street Pedestrian Countdown Timers (All Traffic Signals) US 101/22nd Street At Crossing Improvement Locations US 101/22nd Street US 101 near 22nd Street West of US 101/OR 38 Junction OR 38 east of 3rd Street At US 101/20 th Street if Crossing Improvement Option A is Chosen Continue coordination with ODOT, City, and Freight Mobility to advance conversion alternatives US 101/14th Street US 101/21st Street US 101/OR 38 Junction Supplemental Lights on Utility Poles and New Stand-Alone Lights US 101 east of the Schofield Bridge It is advised that ODOT and the City of Reedsport hold off designing and constructing the US 101 pedestrian crossing improvements until the final US 101 cross section is determined. Project Implementation Project Implementation Page 6-1 December 2014
66 COST ESTIMATES Cost estimates were prepared for each of the crossing improvement locations as well as the identified signalized improvement locations and are listed in Table 6 2. A 20% engineering and construction fee and a 20% contingency were applied individually to the cost estimate for each location. The total estimated cost is between $217,000 and $337,000 for all crossing improvement locations, $45,000 for all signalized improvement locations, and $50,000 for corridor wide implementation of pedestrian countdown timers. All projects combined are estimated to cost between $312,000 and $432,000. Because funding sources are not currently identified for these recommended improvement projects, this study is intended to assist the Oregon Department of Transportation (ODOT) and the City of Reedsport in acquiring the needed project funding. Table 6-2: Cost Estimates of Proposed Safety Projects Safety Improvement Total Estimated Cost a Crossing Improvement Locations US 101/20th Street (Option A) $110,000 US 101/20th Street (Option B) $230,000 US 101/21st Street $14,000 US 101/14th Street $28,000 OR 38/3rd Street $65,000 Total Cost for Crossing Improvement Locations $217,000 - $337,000 Signalized Improvement Locations US 101/22nd Street b $25,000 US 101/OR 38 Junction $20,000 Corridor-Wide Treatments Total Cost for Signalized Improvement Locations $45,000 Pedestrian Countdown Timers c $10,000 Speed Feedback Signs $40,000 Total Cost for Corridor-Wide Treatments $50,000 Total Cost for All Improvement Locations $312,000 - $432,000 a A 20% engineering and construction fee and a 20% contingency were applied to the cost estimate for each location b 2070 controller upgrades at this location are assumed to be included in a separate ODOT project. c The recommended pedestrian countdown timers at the signalized improvement locations are already included in the location cost estimate and are not included in the corridor-wide treatment cost estimate. Project Implementation Cost Estimates Page 6-2 December 2014
67 Table 6 3 shows the cost estimates that were prepared for each improvement aspect under the assumption of the implementation of a three lane conversion along US 101 from 16 th Street to 21 st Street. The total estimated cost is approximately $220,000 for the three lane conversion modifications, $213,000 for all crossing improvement locations, and $70,000 for signalized and corridor wide improvements. All projects combined are estimated to cost approximately $503,000. Table 6-3: Cost Estimates of Proposed Safety Projects Assuming the Implementation of a Three-Lane Conversion along US 101 from 16th Street to 21st Street Safety Improvement Three-Lane Roadway Conversion from 16 th Street to 21 st Street Signing and Striping $100, nd Signal Modifications $50, th Signal Modifications $70,000 Crossing Improvement Locations Total Cost for Roadway Treatments $220,000 US 101/20th Street (Option C) $120,000 US 101/14th Street $28,000 OR 38/3rd Street $65,000 Signalized and Corridor-Wide Improvements Total Cost for Crossing Improvement Locations $213,000 US 101/OR 38 Junction $20,000 Pedestrian Countdown Timers b $10,000 Speed Feedback Signs $40,000 Total Cost for Signalized and Corridor-Wide Treatments $70,000 Total Cost for All Improvements $503,000 Total Estimated Cost a a A 70% contingency and design was applied to the three-lane roadway conversion. A 20% engineering and construction fee and a 20% contingency were applied to the cost estimate for crossing improvement, signalized, and corridor-wide improvements. b The recommended pedestrian countdown timers at the signalized improvement locations are already included in the location cost estimate and are not included in the corridor-wide treatment cost estimate. Project Implementation Cost Estimates Page 6-3 December 2014

68 Appendix 24-Hour Tube Counts Directional Volume Figures Peak Hour Turn Movement Counts Pedestrian Crossing and Gap Surveys Level of Service Descriptions HCM Intersection Analysis ODOT Collision Data NCHRP Guidelines for Pedestrian Crossing Treatment 3-Lane Conversion Capacity Reports 3-Lane Conversion Travel Time Differential Reports Cost Estimates
69 Reedsport Pedestrian Safety Study Executive Summary December Hour Tube Counts
70 Type of report: Tube Count - Volume Data Page 1 of 1 LOCATION: Fir St (OR 38) btwn N 3rd St & Riverfront Way QC JOB #: SPECIFIC LOCATION: 0 ft from DIRECTION: SB CITY/STATE: Reedsport, OR DATE: Jun Jun Mon Tue Wed Thu Fri Average Weekday Sat Sun Average Week Average Week Profile Start Time 05-Jun-14 Hourly Traffic Hourly Traffic 12:00 AM :00 AM :00 AM :00 AM :00 AM :00 AM :00 AM :00 AM :00 AM :00 AM :00 AM :00 AM :00 PM :00 PM :00 PM :00 PM :00 PM :00 PM :00 PM :00 PM :00 PM :00 PM :00 PM :00 PM Day Total % Weekday Average 100.0% % Week Average 100.0% 100.0% AM Peak 10:00 AM 10:00 AM 10:00 AM Volume PM Peak 1:00 PM 1:00 PM 1:00 PM Volume Comments: Report generated on 6/17/2014 6:17 PM SOURCE: Quality Counts, LLC (
71 Type of report: Tube Count - Vehicle Classification Data Page 1 of 2 LOCATION: Fir St (OR 38) btwn N 3rd St & Riverfront Way QC JOB #: SPECIFIC LOCATION: 0 ft from DIRECTION: SB CITY/STATE: Reedsport, OR DATE: Jun Motorcycles Trailer Long 6 Tire Single Single Double Double Double Multi Multi Multi Classified Cars & 2 Axle Buses 2 Axle 3 Axle 4 Axle <5 Axle 5 Axle >6 Axle <6 Axle 6 Axle >6 Axle Not Start Time Total 12:00 AM :00 AM :00 AM :00 AM :00 AM :00 AM :00 AM :00 AM :00 AM :00 AM :00 AM :00 AM :00 PM :00 PM :00 PM :00 PM :00 PM :00 PM :00 PM :00 PM :00 PM :00 PM :00 PM :00 PM Day Total Percent 0.6% 48.4% 22.8% 1.5% 11.6% 0.5% 0.1% 7.3% 0.2% 0.2% 1.8% 0.0% 0.1% 5.2% ADT 1765 AM Peak 11:00 AM 10:00 AM 11:00 AM 11:00 AM 9:00 AM 5:00 AM 10:00 AM 12:00 AM 11:00 AM 4:00 AM 10:00 AM 10:00 AM Volume PM Peak 2:00 PM 1:00 PM 2:00 PM 1:00 PM 1:00 PM 12:00 PM 1:00 PM 12:00 PM 6:00 PM 12:00 PM 12:00 PM 2:00 PM 1:00 PM Volume Comments: Report generated on 6/17/2014 6:17 PM SOURCE: Quality Counts, LLC (
72 Type of report: Tube Count - Vehicle Classification Data SUMMARY - Tube Count - Vehicle Classification Data Page 2 of 2 LOCATION: Fir St (OR 38) btwn N 3rd St & Riverfront Way QC JOB #: SPECIFIC LOCATION: 0 ft from DIRECTION: SB CITY/STATE: Reedsport, OR DATE: Jun Jun Motorcycles Trailer Long 6 Tire Single Single Double Double Double Multi Multi Multi Classified Cars & 2 Axle Buses 2 Axle 3 Axle 4 Axle <5 Axle 5 Axle >6 Axle <6 Axle 6 Axle >6 Axle Not Start Time Total Grand Total Percent 0.6% 48.4% 22.8% 1.5% 11.6% 0.5% 0.1% 7.3% 0.2% 0.2% 1.8% 0.0% 0.1% 5.2% ADT 1765 Comments: Report generated on 6/17/2014 6:17 PM SOURCE: Quality Counts, LLC (
73 Type of report: Tube Count - Speed Data Page 1 of 2 LOCATION: Fir St (OR 38) btwn N 3rd St & Riverfront Way QC JOB #: SPECIFIC LOCATION: 0 ft from DIRECTION: SB CITY/STATE: Reedsport, OR DATE: Jun Start Time Total Pace Speed Number in Pace 12:00 AM :00 AM :00 AM :00 AM :00 AM :00 AM :00 AM :00 AM :00 AM :00 AM :00 AM :00 AM :00 PM :00 PM :00 PM :00 PM :00 PM :00 PM :00 PM :00 PM :00 PM :00 PM :00 PM :00 PM Day Total Percent 7.7% 1.4% 8.6% 37.2% 31.4% 11.7% 1.9% 0.1% 0.0% 0.0% 0.0% 0.1% 0.0% 0.0% ADT 1765 AM Peak 11:00 AM 11:00 AM 11:00 AM 11:00 AM 10:00 AM 10:00 AM 11:00 AM 10:00 AM Volume PM Peak 2:00 PM 4:00 PM 1:00 PM 3:00 PM 4:00 PM 4:00 PM 3:00 PM 1:00 PM 1:00 PM 1:00 PM Volume Comments: Report generated on 6/17/2014 6:17 PM SOURCE: Quality Counts, LLC (
74 Type of report: Tube Count - Speed Data SUMMARY - Tube Count - Speed Data Page 2 of 2 LOCATION: Fir St (OR 38) btwn N 3rd St & Riverfront Way QC JOB #: SPECIFIC LOCATION: 0 ft from DIRECTION: SB CITY/STATE: Reedsport, OR DATE: Jun Jun Start Time Total Pace Speed Number in Pace Grand Total Percent 7.7% 1.4% 8.6% 37.2% 31.4% 11.7% 1.9% 0.1% 0.0% 0.0% 0.0% 0.1% 0.0% 0.0% Cumulative Percent 7.7% 9.1% 17.6% 54.8% 86.2% 98.0% 99.8% 99.9% 99.9% 99.9% 99.9% 100.0% 100.0% 100.0% ADT th Percentile: 34 MPH Comments: Report generated on 6/17/2014 6:17 PM Mean Speed(Average): 28 MPH Median 29 MPH Mode: 28 MPH SOURCE: Quality Counts, LLC (
75 Type of report: Tube Count - Volume Data Page 1 of 1 LOCATION: Fir St (OR 38) btwn N 3rd St & Riverfront Way QC JOB #: SPECIFIC LOCATION: 0 ft from DIRECTION: NB/SB CITY/STATE: Reedsport, OR DATE: Jun Jun Mon Tue Wed Thu Fri Average Weekday Sat Sun Average Week Average Week Profile Start Time 05-Jun-14 Hourly Traffic Hourly Traffic 12:00 AM :00 AM :00 AM :00 AM :00 AM :00 AM :00 AM :00 AM :00 AM :00 AM :00 AM :00 AM :00 PM :00 PM :00 PM :00 PM :00 PM :00 PM :00 PM :00 PM :00 PM :00 PM :00 PM :00 PM Day Total % Weekday Average 100.0% % Week Average 100.0% 100.0% AM Peak 11:00 AM 11:00 AM 11:00 AM Volume PM Peak 2:00 PM 2:00 PM 2:00 PM Volume Comments: Report generated on 6/17/2014 6:17 PM SOURCE: Quality Counts, LLC (
76 Type of report: Tube Count - Vehicle Classification Data Page 1 of 2 LOCATION: Fir St (OR 38) btwn N 3rd St & Riverfront Way QC JOB #: SPECIFIC LOCATION: 0 ft from DIRECTION: NB/SB CITY/STATE: Reedsport, OR DATE: Jun Motorcycles Trailer Long 6 Tire Single Single Double Double Double Multi Multi Multi Classified Cars & 2 Axle Buses 2 Axle 3 Axle 4 Axle <5 Axle 5 Axle >6 Axle <6 Axle 6 Axle >6 Axle Not Start Time Total 12:00 AM :00 AM :00 AM :00 AM :00 AM :00 AM :00 AM :00 AM :00 AM :00 AM :00 AM :00 AM :00 PM :00 PM :00 PM :00 PM :00 PM :00 PM :00 PM :00 PM :00 PM :00 PM :00 PM :00 PM Day Total Percent 0.6% 47.0% 23.2% 2.3% 11.3% 0.5% 0.0% 7.8% 0.2% 0.3% 1.4% 0.1% 0.0% 5.4% ADT 3415 AM Peak 11:00 AM 11:00 AM 10:00 AM 3:00 AM 9:00 AM 7:00 AM 11:00 AM 5:00 AM 5:00 AM 11:00 AM 3:00 AM 10:00 AM 11:00 AM Volume PM Peak 2:00 PM 2:00 PM 2:00 PM 2:00 PM 1:00 PM 12:00 PM 1:00 PM 12:00 PM 1:00 PM 12:00 PM 2:00 PM 12:00 PM 2:00 PM 2:00 PM Volume Comments: Report generated on 6/17/2014 6:17 PM SOURCE: Quality Counts, LLC (
77 Type of report: Tube Count - Vehicle Classification Data SUMMARY - Tube Count - Vehicle Classification Data Page 2 of 2 LOCATION: Fir St (OR 38) btwn N 3rd St & Riverfront Way QC JOB #: SPECIFIC LOCATION: 0 ft from DIRECTION: NB/SB CITY/STATE: Reedsport, OR DATE: Jun Jun Motorcycles Trailer Long 6 Tire Single Single Double Double Double Multi Multi Multi Classified Cars & 2 Axle Buses 2 Axle 3 Axle 4 Axle <5 Axle 5 Axle >6 Axle <6 Axle 6 Axle >6 Axle Not Start Time Total Grand Total Percent 0.6% 47.0% 23.2% 2.3% 11.3% 0.5% 0.0% 7.8% 0.2% 0.3% 1.4% 0.1% 0.0% 5.4% ADT 3415 Comments: Report generated on 6/17/2014 6:17 PM SOURCE: Quality Counts, LLC (
78 Type of report: Tube Count - Speed Data Page 1 of 2 LOCATION: Fir St (OR 38) btwn N 3rd St & Riverfront Way QC JOB #: SPECIFIC LOCATION: 0 ft from DIRECTION: NB/SB CITY/STATE: Reedsport, OR DATE: Jun Start Time Total Pace Speed Number in Pace 12:00 AM :00 AM :00 AM :00 AM :00 AM :00 AM :00 AM :00 AM :00 AM :00 AM :00 AM :00 AM :00 PM :00 PM :00 PM :00 PM :00 PM :00 PM :00 PM :00 PM :00 PM :00 PM :00 PM :00 PM Day Total Percent 7.3% 2.0% 6.5% 28.9% 34.1% 17.5% 3.5% 0.3% 0.0% 0.0% 0.0% 0.0% 0.0% 0.0% ADT 3415 AM Peak 11:00 AM 11:00 AM 11:00 AM 11:00 AM 11:00 AM 10:00 AM 11:00 AM 1:00 AM 11:00 AM Volume PM Peak 1:00 PM 4:00 PM 1:00 PM 3:00 PM 4:00 PM 4:00 PM 5:00 PM 2:00 PM 1:00 PM 2:00 PM Volume Comments: Report generated on 6/17/2014 6:17 PM SOURCE: Quality Counts, LLC (
79 Type of report: Tube Count - Speed Data SUMMARY - Tube Count - Speed Data Page 2 of 2 LOCATION: Fir St (OR 38) btwn N 3rd St & Riverfront Way QC JOB #: SPECIFIC LOCATION: 0 ft from DIRECTION: NB/SB CITY/STATE: Reedsport, OR DATE: Jun Jun Start Time Total Pace Speed Number in Pace Grand Total Percent 7.3% 2.0% 6.5% 28.9% 34.1% 17.5% 3.5% 0.3% 0.0% 0.0% 0.0% 0.0% 0.0% 0.0% Cumulative Percent 7.3% 9.3% 15.7% 44.7% 78.8% 96.3% 99.7% 100.0% 100.0% 100.0% 100.0% 100.0% 100.0% 100.0% ADT th Percentile: 36 MPH Comments: Report generated on 6/17/2014 6:17 PM Mean Speed(Average): 29 MPH Median 30 MPH Mode: 33 MPH SOURCE: Quality Counts, LLC (
80 Type of report: Tube Count - Volume Data Page 1 of 1 LOCATION: Fir St (OR 38) btwn N 3rd St & Riverfront Way QC JOB #: SPECIFIC LOCATION: 0 ft from DIRECTION: NB CITY/STATE: Reedsport, OR DATE: Jun Jun Mon Tue Wed Thu Fri Average Weekday Sat Sun Average Week Average Week Profile Start Time 05-Jun-14 Hourly Traffic Hourly Traffic 12:00 AM :00 AM :00 AM :00 AM :00 AM :00 AM :00 AM :00 AM :00 AM :00 AM :00 AM :00 AM :00 PM :00 PM :00 PM :00 PM :00 PM :00 PM :00 PM :00 PM :00 PM :00 PM :00 PM :00 PM Day Total % Weekday Average 100.0% % Week Average 100.0% 100.0% AM Peak 11:00 AM 11:00 AM 11:00 AM Volume PM Peak 2:00 PM 2:00 PM 2:00 PM Volume Comments: Report generated on 6/17/2014 6:17 PM SOURCE: Quality Counts, LLC (
81 Type of report: Tube Count - Vehicle Classification Data Page 1 of 2 LOCATION: Fir St (OR 38) btwn N 3rd St & Riverfront Way QC JOB #: SPECIFIC LOCATION: 0 ft from DIRECTION: NB CITY/STATE: Reedsport, OR DATE: Jun Motorcycles Trailer Long 6 Tire Single Single Double Double Double Multi Multi Multi Classified Cars & 2 Axle Buses 2 Axle 3 Axle 4 Axle <5 Axle 5 Axle >6 Axle <6 Axle 6 Axle >6 Axle Not Start Time Total 12:00 AM :00 AM :00 AM :00 AM :00 AM :00 AM :00 AM :00 AM :00 AM :00 AM :00 AM :00 AM :00 PM :00 PM :00 PM :00 PM :00 PM :00 PM :00 PM :00 PM :00 PM :00 PM :00 PM :00 PM Day Total Percent 0.5% 45.5% 23.6% 3.0% 11.0% 0.5% 0.0% 8.4% 0.2% 0.4% 1.0% 0.2% 0.0% 5.6% ADT 1650 AM Peak 11:00 AM 11:00 AM 10:00 AM 3:00 AM 11:00 AM 4:00 AM 11:00 AM 5:00 AM 5:00 AM 6:00 AM 3:00 AM 10:00 AM 11:00 AM Volume PM Peak 12:00 PM 2:00 PM 2:00 PM 2:00 PM 4:00 PM 12:00 PM 12:00 PM 1:00 PM 4:00 PM 2:00 PM 4:00 PM 2:00 PM Volume Comments: Report generated on 6/17/2014 6:17 PM SOURCE: Quality Counts, LLC (
82 Type of report: Tube Count - Vehicle Classification Data SUMMARY - Tube Count - Vehicle Classification Data Page 2 of 2 LOCATION: Fir St (OR 38) btwn N 3rd St & Riverfront Way QC JOB #: SPECIFIC LOCATION: 0 ft from DIRECTION: NB CITY/STATE: Reedsport, OR DATE: Jun Jun Motorcycles Trailer Long 6 Tire Single Single Double Double Double Multi Multi Multi Classified Cars & 2 Axle Buses 2 Axle 3 Axle 4 Axle <5 Axle 5 Axle >6 Axle <6 Axle 6 Axle >6 Axle Not Start Time Total Grand Total Percent 0.5% 45.5% 23.6% 3.0% 11.0% 0.5% 0.0% 8.4% 0.2% 0.4% 1.0% 0.2% 0.0% 5.6% ADT 1650 Comments: Report generated on 6/17/2014 6:17 PM SOURCE: Quality Counts, LLC (
83 Type of report: Tube Count - Speed Data Page 1 of 2 LOCATION: Fir St (OR 38) btwn N 3rd St & Riverfront Way QC JOB #: SPECIFIC LOCATION: 0 ft from DIRECTION: NB CITY/STATE: Reedsport, OR DATE: Jun Start Time Total Pace Speed Number in Pace 12:00 AM :00 AM :00 AM :00 AM :00 AM :00 AM :00 AM :00 AM :00 AM :00 AM :00 AM :00 AM :00 PM :00 PM :00 PM :00 PM :00 PM :00 PM :00 PM :00 PM :00 PM :00 PM :00 PM :00 PM Day Total Percent 6.8% 2.6% 4.2% 20.1% 37.1% 23.6% 5.2% 0.4% 0.0% 0.0% 0.0% 0.0% 0.0% 0.0% ADT 1650 AM Peak 10:00 AM 11:00 AM 8:00 AM 8:00 AM 11:00 AM 9:00 AM 11:00 AM 1:00 AM 11:00 AM Volume PM Peak 4:00 PM 2:00 PM 4:00 PM 12:00 PM 2:00 PM 12:00 PM 5:00 PM 2:00 PM 2:00 PM Volume Comments: Report generated on 6/17/2014 6:17 PM SOURCE: Quality Counts, LLC (
84 Type of report: Tube Count - Speed Data SUMMARY - Tube Count - Speed Data Page 2 of 2 LOCATION: Fir St (OR 38) btwn N 3rd St & Riverfront Way QC JOB #: SPECIFIC LOCATION: 0 ft from DIRECTION: NB CITY/STATE: Reedsport, OR DATE: Jun Jun Start Time Total Pace Speed Number in Pace Grand Total Percent 6.8% 2.6% 4.2% 20.1% 37.1% 23.6% 5.2% 0.4% 0.0% 0.0% 0.0% 0.0% 0.0% 0.0% Cumulative Percent 6.8% 9.5% 13.7% 33.8% 70.8% 94.4% 99.6% 100.0% 100.0% 100.0% 100.0% 100.0% 100.0% 100.0% ADT th Percentile: 38 MPH Comments: Report generated on 6/17/2014 6:17 PM Mean Speed(Average): 30 MPH Median 32 MPH Mode: 33 MPH SOURCE: Quality Counts, LLC (
85 Type of report: Tube Count - Volume Data Page 1 of 1 LOCATION: Hwy 101 north of Port Dock Rd/Umpqua Ave (OR 38) QC JOB #: SPECIFIC LOCATION: 0 ft from DIRECTION: SB CITY/STATE: Reedsport, OR DATE: Jun Jun Mon Tue Wed Thu Fri Average Weekday Sat Sun Average Week Average Week Profile Start Time 05-Jun-14 Hourly Traffic Hourly Traffic 12:00 AM :00 AM :00 AM :00 AM :00 AM :00 AM :00 AM :00 AM :00 AM :00 AM :00 AM :00 AM :00 PM :00 PM :00 PM :00 PM :00 PM :00 PM :00 PM :00 PM :00 PM :00 PM :00 PM :00 PM Day Total % Weekday Average 100.0% % Week Average 100.0% 100.0% AM Peak 11:00 AM 11:00 AM 11:00 AM Volume PM Peak 3:00 PM 3:00 PM 3:00 PM Volume Comments: Report generated on 6/17/2014 6:17 PM SOURCE: Quality Counts, LLC (
86 Type of report: Tube Count - Vehicle Classification Data Page 1 of 2 LOCATION: Hwy 101 north of Port Dock Rd/Umpqua Ave (OR 38) QC JOB #: SPECIFIC LOCATION: 0 ft from DIRECTION: SB CITY/STATE: Reedsport, OR DATE: Jun Motorcycles Trailer Long 6 Tire Single Single Double Double Double Multi Multi Multi Classified Cars & 2 Axle Buses 2 Axle 3 Axle 4 Axle <5 Axle 5 Axle >6 Axle <6 Axle 6 Axle >6 Axle Not Start Time Total 12:00 AM :00 AM :00 AM :00 AM :00 AM :00 AM :00 AM :00 AM :00 AM :00 AM :00 AM :00 AM :00 PM :00 PM :00 PM :00 PM :00 PM :00 PM :00 PM :00 PM :00 PM :00 PM :00 PM :00 PM Day Total Percent 1.0% 55.7% 22.6% 0.8% 9.1% 0.8% 0.2% 2.7% 2.0% 0.6% 0.1% 0.1% 0.3% 4.0% ADT 2574 AM Peak 11:00 AM 10:00 AM 11:00 AM 9:00 AM 7:00 AM 8:00 AM 7:00 AM 11:00 AM 4:00 AM 5:00 AM 6:00 AM 1:00 AM 7:00 AM 10:00 AM 11:00 AM Volume PM Peak 12:00 PM 4:00 PM 3:00 PM 12:00 PM 3:00 PM 12:00 PM 12:00 PM 1:00 PM 12:00 PM 1:00 PM 2:00 PM 4:00 PM 3:00 PM Volume Comments: Report generated on 6/17/2014 6:17 PM SOURCE: Quality Counts, LLC (
87 Type of report: Tube Count - Vehicle Classification Data SUMMARY - Tube Count - Vehicle Classification Data Page 2 of 2 LOCATION: Hwy 101 north of Port Dock Rd/Umpqua Ave (OR 38) QC JOB #: SPECIFIC LOCATION: 0 ft from DIRECTION: SB CITY/STATE: Reedsport, OR DATE: Jun Jun Motorcycles Trailer Long 6 Tire Single Single Double Double Double Multi Multi Multi Classified Cars & 2 Axle Buses 2 Axle 3 Axle 4 Axle <5 Axle 5 Axle >6 Axle <6 Axle 6 Axle >6 Axle Not Start Time Total Grand Total Percent 1.0% 55.7% 22.6% 0.8% 9.1% 0.8% 0.2% 2.7% 2.0% 0.6% 0.1% 0.1% 0.3% 4.0% ADT 2574 Comments: Report generated on 6/17/2014 6:17 PM SOURCE: Quality Counts, LLC (
88 Type of report: Tube Count - Speed Data Page 1 of 2 LOCATION: Hwy 101 north of Port Dock Rd/Umpqua Ave (OR 38) QC JOB #: SPECIFIC LOCATION: 0 ft from DIRECTION: SB CITY/STATE: Reedsport, OR DATE: Jun Start Time Total Pace Speed Number in Pace 12:00 AM :00 AM :00 AM :00 AM :00 AM :00 AM :00 AM :00 AM :00 AM :00 AM :00 AM :00 AM :00 PM :00 PM :00 PM :00 PM :00 PM :00 PM :00 PM :00 PM :00 PM :00 PM :00 PM :00 PM Day Total Percent 3.7% 0.9% 3.3% 17.0% 43.6% 26.8% 4.3% 0.3% 0.0% 0.0% 0.0% 0.0% 0.0% 0.0% ADT 2574 AM Peak 10:00 AM 10:00 AM 11:00 AM 10:00 AM 11:00 AM 7:00 AM 7:00 AM 7:00 AM 5:00 AM 11:00 AM Volume PM Peak 2:00 PM 2:00 PM 4:00 PM 3:00 PM 3:00 PM 3:00 PM 7:00 PM 9:00 PM 3:00 PM Volume Comments: Report generated on 6/17/2014 6:17 PM SOURCE: Quality Counts, LLC (
89 Type of report: Tube Count - Speed Data SUMMARY - Tube Count - Speed Data Page 2 of 2 LOCATION: Hwy 101 north of Port Dock Rd/Umpqua Ave (OR 38) QC JOB #: SPECIFIC LOCATION: 0 ft from DIRECTION: SB CITY/STATE: Reedsport, OR DATE: Jun Jun Start Time Total Pace Speed Number in Pace Grand Total Percent 3.7% 0.9% 3.3% 17.0% 43.6% 26.8% 4.3% 0.3% 0.0% 0.0% 0.0% 0.0% 0.0% 0.0% Cumulative Percent 3.7% 4.6% 7.9% 24.9% 68.5% 95.3% 99.7% 100.0% 100.0% 100.0% 100.0% 100.0% 100.0% 100.0% ADT th Percentile: 38 MPH Comments: Report generated on 6/17/2014 6:17 PM Mean Speed(Average): 32 MPH Median 32 MPH Mode: 33 MPH SOURCE: Quality Counts, LLC (
90 Type of report: Tube Count - Volume Data Page 1 of 1 LOCATION: Hwy 101 north of Port Dock Rd/Umpqua Ave (OR 38) QC JOB #: SPECIFIC LOCATION: 0 ft from DIRECTION: NB/SB CITY/STATE: Reedsport, OR DATE: Jun Jun Mon Tue Wed Thu Fri Average Weekday Sat Sun Average Week Average Week Profile Start Time 05-Jun-14 Hourly Traffic Hourly Traffic 12:00 AM :00 AM :00 AM :00 AM :00 AM :00 AM :00 AM :00 AM :00 AM :00 AM :00 AM :00 AM :00 PM :00 PM :00 PM :00 PM :00 PM :00 PM :00 PM :00 PM :00 PM :00 PM :00 PM :00 PM Day Total % Weekday Average 100.0% % Week Average 100.0% 100.0% AM Peak 11:00 AM 11:00 AM 11:00 AM Volume PM Peak 4:00 PM 4:00 PM 4:00 PM Volume Comments: Report generated on 6/17/2014 6:17 PM SOURCE: Quality Counts, LLC (
91 Type of report: Tube Count - Vehicle Classification Data Page 1 of 2 LOCATION: Hwy 101 north of Port Dock Rd/Umpqua Ave (OR 38) QC JOB #: SPECIFIC LOCATION: 0 ft from DIRECTION: NB/SB CITY/STATE: Reedsport, OR DATE: Jun Motorcycles Trailer Long 6 Tire Single Single Double Double Double Multi Multi Multi Classified Cars & 2 Axle Buses 2 Axle 3 Axle 4 Axle <5 Axle 5 Axle >6 Axle <6 Axle 6 Axle >6 Axle Not Start Time Total 12:00 AM :00 AM :00 AM :00 AM :00 AM :00 AM :00 AM :00 AM :00 AM :00 AM :00 AM :00 AM :00 PM :00 PM :00 PM :00 PM :00 PM :00 PM :00 PM :00 PM :00 PM :00 PM :00 PM :00 PM Day Total Percent 1.5% 53.3% 23.0% 1.2% 10.6% 0.9% 0.1% 3.0% 1.7% 0.5% 0.1% 0.1% 0.4% 3.6% ADT 5323 AM Peak 10:00 AM 11:00 AM 11:00 AM 9:00 AM 11:00 AM 8:00 AM 7:00 AM 11:00 AM 7:00 AM 6:00 AM 6:00 AM 1:00 AM 7:00 AM 10:00 AM 11:00 AM Volume PM Peak 4:00 PM 12:00 PM 3:00 PM 2:00 PM 4:00 PM 12:00 PM 12:00 PM 12:00 PM 3:00 PM 1:00 PM 12:00 PM 7:00 PM 2:00 PM 12:00 PM 4:00 PM Volume Comments: Report generated on 6/17/2014 6:17 PM SOURCE: Quality Counts, LLC (
92 Type of report: Tube Count - Vehicle Classification Data SUMMARY - Tube Count - Vehicle Classification Data Page 2 of 2 LOCATION: Hwy 101 north of Port Dock Rd/Umpqua Ave (OR 38) QC JOB #: SPECIFIC LOCATION: 0 ft from DIRECTION: NB/SB CITY/STATE: Reedsport, OR DATE: Jun Jun Motorcycles Trailer Long 6 Tire Single Single Double Double Double Multi Multi Multi Classified Cars & 2 Axle Buses 2 Axle 3 Axle 4 Axle <5 Axle 5 Axle >6 Axle <6 Axle 6 Axle >6 Axle Not Start Time Total Grand Total Percent 1.5% 53.3% 23.0% 1.2% 10.6% 0.9% 0.1% 3.0% 1.7% 0.5% 0.1% 0.1% 0.4% 3.6% ADT 5323 Comments: Report generated on 6/17/2014 6:17 PM SOURCE: Quality Counts, LLC (
93 Type of report: Tube Count - Speed Data Page 1 of 2 LOCATION: Hwy 101 north of Port Dock Rd/Umpqua Ave (OR 38) QC JOB #: SPECIFIC LOCATION: 0 ft from DIRECTION: NB/SB CITY/STATE: Reedsport, OR DATE: Jun Start Time Total Pace Speed Number in Pace 12:00 AM :00 AM :00 AM :00 AM :00 AM :00 AM :00 AM :00 AM :00 AM :00 AM :00 AM :00 AM :00 PM :00 PM :00 PM :00 PM :00 PM :00 PM :00 PM :00 PM :00 PM :00 PM :00 PM :00 PM Day Total Percent 4.0% 0.8% 2.5% 12.4% 33.6% 30.3% 12.5% 3.0% 0.6% 0.1% 0.1% 0.0% 0.0% 0.0% ADT 5323 AM Peak 9:00 AM 10:00 AM 11:00 AM 11:00 AM 11:00 AM 11:00 AM 10:00 AM 7:00 AM 4:00 AM 7:00 AM 5:00 AM 11:00 AM Volume PM Peak 12:00 PM 2:00 PM 2:00 PM 4:00 PM 1:00 PM 1:00 PM 4:00 PM 4:00 PM 1:00 PM 12:00 PM 11:00 PM 4:00 PM Volume Comments: Report generated on 6/17/2014 6:17 PM SOURCE: Quality Counts, LLC (
94 Type of report: Tube Count - Speed Data SUMMARY - Tube Count - Speed Data Page 2 of 2 LOCATION: Hwy 101 north of Port Dock Rd/Umpqua Ave (OR 38) QC JOB #: SPECIFIC LOCATION: 0 ft from DIRECTION: NB/SB CITY/STATE: Reedsport, OR DATE: Jun Jun Start Time Total Pace Speed Number in Pace Grand Total Percent 4.0% 0.8% 2.5% 12.4% 33.6% 30.3% 12.5% 3.0% 0.6% 0.1% 0.1% 0.0% 0.0% 0.0% Cumulative Percent 4.0% 4.8% 7.3% 19.7% 53.4% 83.7% 96.2% 99.2% 99.8% 99.9% 100.0% 100.0% 100.0% 100.0% ADT th Percentile: 40 MPH Comments: Report generated on 6/17/2014 6:17 PM Mean Speed(Average): 33 MPH Median 34 MPH Mode: 33 MPH SOURCE: Quality Counts, LLC (
95 Type of report: Tube Count - Volume Data Page 1 of 1 LOCATION: Hwy 101 north of Port Dock Rd/Umpqua Ave (OR 38) QC JOB #: SPECIFIC LOCATION: 0 ft from DIRECTION: NB CITY/STATE: Reedsport, OR DATE: Jun Jun Mon Tue Wed Thu Fri Average Weekday Sat Sun Average Week Average Week Profile Start Time 05-Jun-14 Hourly Traffic Hourly Traffic 12:00 AM :00 AM :00 AM :00 AM :00 AM :00 AM :00 AM :00 AM :00 AM :00 AM :00 AM :00 AM :00 PM :00 PM :00 PM :00 PM :00 PM :00 PM :00 PM :00 PM :00 PM :00 PM :00 PM :00 PM Day Total % Weekday Average 100.0% % Week Average 100.0% 100.0% AM Peak 11:00 AM 11:00 AM 11:00 AM Volume PM Peak 4:00 PM 4:00 PM 4:00 PM Volume Comments: Report generated on 6/17/2014 6:17 PM SOURCE: Quality Counts, LLC (
96 Type of report: Tube Count - Vehicle Classification Data Page 1 of 2 LOCATION: Hwy 101 north of Port Dock Rd/Umpqua Ave (OR 38) QC JOB #: SPECIFIC LOCATION: 0 ft from DIRECTION: NB CITY/STATE: Reedsport, OR DATE: Jun Motorcycles Trailer Long 6 Tire Single Single Double Double Double Multi Multi Multi Classified Cars & 2 Axle Buses 2 Axle 3 Axle 4 Axle <5 Axle 5 Axle >6 Axle <6 Axle 6 Axle >6 Axle Not Start Time Total 12:00 AM :00 AM :00 AM :00 AM :00 AM :00 AM :00 AM :00 AM :00 AM :00 AM :00 AM :00 AM :00 PM :00 PM :00 PM :00 PM :00 PM :00 PM :00 PM :00 PM :00 PM :00 PM :00 PM :00 PM Day Total Percent 2.0% 51.0% 23.3% 1.6% 11.9% 1.0% 0.0% 3.2% 1.5% 0.4% 0.1% 0.0% 0.5% 3.3% ADT 2749 AM Peak 10:00 AM 11:00 AM 11:00 AM 10:00 AM 11:00 AM 8:00 AM 11:00 AM 7:00 AM 6:00 AM 3:00 AM 9:00 AM 11:00 AM Volume PM Peak 4:00 PM 12:00 PM 4:00 PM 1:00 PM 4:00 PM 12:00 PM 6:00 PM 12:00 PM 5:00 PM 12:00 PM 12:00 PM 7:00 PM 6:00 PM 12:00 PM 4:00 PM Volume Comments: Report generated on 6/17/2014 6:17 PM SOURCE: Quality Counts, LLC (
97 Type of report: Tube Count - Vehicle Classification Data SUMMARY - Tube Count - Vehicle Classification Data Page 2 of 2 LOCATION: Hwy 101 north of Port Dock Rd/Umpqua Ave (OR 38) QC JOB #: SPECIFIC LOCATION: 0 ft from DIRECTION: NB CITY/STATE: Reedsport, OR DATE: Jun Jun Motorcycles Trailer Long 6 Tire Single Single Double Double Double Multi Multi Multi Classified Cars & 2 Axle Buses 2 Axle 3 Axle 4 Axle <5 Axle 5 Axle >6 Axle <6 Axle 6 Axle >6 Axle Not Start Time Total Grand Total Percent 2.0% 51.0% 23.3% 1.6% 11.9% 1.0% 0.0% 3.2% 1.5% 0.4% 0.1% 0.0% 0.5% 3.3% ADT 2749 Comments: Report generated on 6/17/2014 6:17 PM SOURCE: Quality Counts, LLC (
98 Type of report: Tube Count - Speed Data Page 1 of 2 LOCATION: Hwy 101 north of Port Dock Rd/Umpqua Ave (OR 38) QC JOB #: SPECIFIC LOCATION: 0 ft from DIRECTION: NB CITY/STATE: Reedsport, OR DATE: Jun Start Time Total Pace Speed Number in Pace 12:00 AM :00 AM :00 AM :00 AM :00 AM :00 AM :00 AM :00 AM :00 AM :00 AM :00 AM :00 AM :00 PM :00 PM :00 PM :00 PM :00 PM :00 PM :00 PM :00 PM :00 PM :00 PM :00 PM :00 PM Day Total Percent 4.3% 0.7% 1.8% 8.1% 24.4% 33.5% 20.1% 5.6% 1.1% 0.2% 0.1% 0.0% 0.0% 0.0% ADT 2749 AM Peak 9:00 AM 6:00 AM 10:00 AM 11:00 AM 11:00 AM 8:00 AM 11:00 AM 10:00 AM 4:00 AM 7:00 AM 5:00 AM 11:00 AM Volume PM Peak 12:00 PM 12:00 PM 12:00 PM 4:00 PM 2:00 PM 1:00 PM 4:00 PM 4:00 PM 1:00 PM 12:00 PM 11:00 PM 4:00 PM Volume Comments: Report generated on 6/17/2014 6:17 PM SOURCE: Quality Counts, LLC (
99 Type of report: Tube Count - Speed Data SUMMARY - Tube Count - Speed Data Page 2 of 2 LOCATION: Hwy 101 north of Port Dock Rd/Umpqua Ave (OR 38) QC JOB #: SPECIFIC LOCATION: 0 ft from DIRECTION: NB CITY/STATE: Reedsport, OR DATE: Jun Jun Start Time Total Pace Speed Number in Pace Grand Total Percent 4.3% 0.7% 1.8% 8.1% 24.4% 33.5% 20.1% 5.6% 1.1% 0.2% 0.1% 0.0% 0.0% 0.0% Cumulative Percent 4.3% 5.0% 6.8% 14.9% 39.3% 72.8% 92.9% 98.5% 99.6% 99.9% 100.0% 100.0% 100.0% 100.0% ADT th Percentile: 43 MPH Comments: Report generated on 6/17/2014 6:17 PM Mean Speed(Average): 35 MPH Median 36 MPH Mode: 38 MPH SOURCE: Quality Counts, LLC (
100 Type of report: Tube Count - Volume Data Page 1 of 1 LOCATION: Hwy 101 btwn Juniper Ave & 11th St QC JOB #: SPECIFIC LOCATION: 0 ft from DIRECTION: SB CITY/STATE: Reedsport, OR DATE: Jun Jun Mon Tue Wed Thu Fri Average Weekday Sat Sun Average Week Average Week Profile Start Time 05-Jun-14 Hourly Traffic Hourly Traffic 12:00 AM :00 AM :00 AM :00 AM :00 AM :00 AM :00 AM :00 AM :00 AM :00 AM :00 AM :00 AM :00 PM :00 PM :00 PM :00 PM :00 PM :00 PM :00 PM :00 PM :00 PM :00 PM :00 PM :00 PM Day Total % Weekday Average 100.0% % Week Average 100.0% 100.0% AM Peak 11:00 AM 11:00 AM 11:00 AM Volume PM Peak 3:00 PM 3:00 PM 3:00 PM Volume Comments: Report generated on 6/17/2014 6:17 PM SOURCE: Quality Counts, LLC (
101 Type of report: Tube Count - Vehicle Classification Data Page 1 of 2 LOCATION: Hwy 101 btwn Juniper Ave & 11th St QC JOB #: SPECIFIC LOCATION: 0 ft from DIRECTION: SB CITY/STATE: Reedsport, OR DATE: Jun Motorcycles Trailer Long 6 Tire Single Single Double Double Double Multi Multi Multi Classified Cars & 2 Axle Buses 2 Axle 3 Axle 4 Axle <5 Axle 5 Axle >6 Axle <6 Axle 6 Axle >6 Axle Not Start Time Total 12:00 AM :00 AM :00 AM :00 AM :00 AM :00 AM :00 AM :00 AM :00 AM :00 AM :00 AM :00 AM :00 PM :00 PM :00 PM :00 PM :00 PM :00 PM :00 PM :00 PM :00 PM :00 PM :00 PM :00 PM Day Total Percent 1.5% 55.9% 21.8% 0.6% 8.1% 1.2% 0.2% 3.2% 1.6% 0.6% 0.2% 0.1% 0.6% 4.3% ADT 4929 AM Peak 11:00 AM 10:00 AM 11:00 AM 9:00 AM 11:00 AM 8:00 AM 11:00 AM 8:00 AM 10:00 AM 6:00 AM 9:00 AM 4:00 AM 7:00 AM 11:00 AM 11:00 AM Volume PM Peak 1:00 PM 3:00 PM 3:00 PM 12:00 PM 12:00 PM 3:00 PM 1:00 PM 5:00 PM 12:00 PM 1:00 PM 1:00 PM 12:00 PM 2:00 PM 12:00 PM 3:00 PM Volume Comments: Report generated on 6/17/2014 6:17 PM SOURCE: Quality Counts, LLC (
102 Type of report: Tube Count - Vehicle Classification Data SUMMARY - Tube Count - Vehicle Classification Data Page 2 of 2 LOCATION: Hwy 101 btwn Juniper Ave & 11th St QC JOB #: SPECIFIC LOCATION: 0 ft from DIRECTION: SB CITY/STATE: Reedsport, OR DATE: Jun Jun Motorcycles Trailer Long 6 Tire Single Single Double Double Double Multi Multi Multi Classified Cars & 2 Axle Buses 2 Axle 3 Axle 4 Axle <5 Axle 5 Axle >6 Axle <6 Axle 6 Axle >6 Axle Not Start Time Total Grand Total Percent 1.5% 55.9% 21.8% 0.6% 8.1% 1.2% 0.2% 3.2% 1.6% 0.6% 0.2% 0.1% 0.6% 4.3% ADT 4929 Comments: Report generated on 6/17/2014 6:17 PM SOURCE: Quality Counts, LLC (
103 Type of report: Tube Count - Speed Data Page 1 of 2 LOCATION: Hwy 101 btwn Juniper Ave & 11th St QC JOB #: SPECIFIC LOCATION: 0 ft from DIRECTION: SB CITY/STATE: Reedsport, OR DATE: Jun Start Time Total Pace Speed Number in Pace 12:00 AM :00 AM :00 AM :00 AM :00 AM :00 AM :00 AM :00 AM :00 AM :00 AM :00 AM :00 AM :00 PM :00 PM :00 PM :00 PM :00 PM :00 PM :00 PM :00 PM :00 PM :00 PM :00 PM :00 PM Day Total Percent 3.8% 2.2% 6.2% 31.6% 43.6% 10.9% 1.3% 0.2% 0.0% 0.0% 0.0% 0.0% 0.0% 0.0% ADT 4929 AM Peak 11:00 AM 10:00 AM 11:00 AM 11:00 AM 10:00 AM 11:00 AM 9:00 AM 7:00 AM 5:00 AM 11:00 AM Volume PM Peak 1:00 PM 1:00 PM 2:00 PM 12:00 PM 3:00 PM 1:00 PM 3:00 PM 2:00 PM 3:00 PM 3:00 PM Volume Comments: Report generated on 6/17/2014 6:17 PM SOURCE: Quality Counts, LLC (
104 Type of report: Tube Count - Speed Data SUMMARY - Tube Count - Speed Data Page 2 of 2 LOCATION: Hwy 101 btwn Juniper Ave & 11th St QC JOB #: SPECIFIC LOCATION: 0 ft from DIRECTION: SB CITY/STATE: Reedsport, OR DATE: Jun Jun Start Time Total Pace Speed Number in Pace Grand Total Percent 3.8% 2.2% 6.2% 31.6% 43.6% 10.9% 1.3% 0.2% 0.0% 0.0% 0.0% 0.0% 0.0% 0.0% Cumulative Percent 3.8% 6.0% 12.3% 43.9% 87.5% 98.5% 99.8% 100.0% 100.0% 100.0% 100.0% 100.0% 100.0% 100.0% ADT th Percentile: 34 MPH Comments: Report generated on 6/17/2014 6:17 PM Mean Speed(Average): 29 MPH Median 30 MPH Mode: 33 MPH SOURCE: Quality Counts, LLC (
105 Type of report: Tube Count - Volume Data Page 1 of 1 LOCATION: Hwy 101 btwn Juniper Ave & 11th St QC JOB #: SPECIFIC LOCATION: 0 ft from DIRECTION: NB/SB CITY/STATE: Reedsport, OR DATE: Jun Jun Mon Tue Wed Thu Fri Average Weekday Sat Sun Average Week Average Week Profile Start Time 05-Jun-14 Hourly Traffic Hourly Traffic 12:00 AM :00 AM :00 AM :00 AM :00 AM :00 AM :00 AM :00 AM :00 AM :00 AM :00 AM :00 AM :00 PM :00 PM :00 PM :00 PM :00 PM :00 PM :00 PM :00 PM :00 PM :00 PM :00 PM :00 PM Day Total % Weekday Average 100.0% % Week Average 100.0% 100.0% AM Peak 11:00 AM 11:00 AM 11:00 AM Volume PM Peak 12:00 PM 12:00 PM 12:00 PM Volume Comments: Report generated on 6/17/2014 6:17 PM SOURCE: Quality Counts, LLC (
106 Type of report: Tube Count - Vehicle Classification Data Page 1 of 2 LOCATION: Hwy 101 btwn Juniper Ave & 11th St QC JOB #: SPECIFIC LOCATION: 0 ft from DIRECTION: NB/SB CITY/STATE: Reedsport, OR DATE: Jun Motorcycles Trailer Long 6 Tire Single Single Double Double Double Multi Multi Multi Classified Cars & 2 Axle Buses 2 Axle 3 Axle 4 Axle <5 Axle 5 Axle >6 Axle <6 Axle 6 Axle >6 Axle Not Start Time Total 12:00 AM :00 AM :00 AM :00 AM :00 AM :00 AM :00 AM :00 AM :00 AM :00 AM :00 AM :00 AM :00 PM :00 PM :00 PM :00 PM :00 PM :00 PM :00 PM :00 PM :00 PM :00 PM :00 PM :00 PM Day Total Percent 1.4% 55.5% 22.1% 0.8% 8.2% 1.2% 0.2% 3.3% 1.6% 0.7% 0.2% 0.1% 0.7% 4.1% ADT 9752 AM Peak 11:00 AM 11:00 AM 11:00 AM 9:00 AM 11:00 AM 8:00 AM 11:00 AM 11:00 AM 10:00 AM 6:00 AM 7:00 AM 1:00 AM 6:00 AM 11:00 AM 11:00 AM Volume PM Peak 12:00 PM 12:00 PM 4:00 PM 2:00 PM 4:00 PM 3:00 PM 1:00 PM 3:00 PM 12:00 PM 1:00 PM 4:00 PM 2:00 PM 2:00 PM 2:00 PM 12:00 PM Volume Comments: Report generated on 6/17/2014 6:17 PM SOURCE: Quality Counts, LLC (
107 Type of report: Tube Count - Vehicle Classification Data SUMMARY - Tube Count - Vehicle Classification Data Page 2 of 2 LOCATION: Hwy 101 btwn Juniper Ave & 11th St QC JOB #: SPECIFIC LOCATION: 0 ft from DIRECTION: NB/SB CITY/STATE: Reedsport, OR DATE: Jun Jun Motorcycles Trailer Long 6 Tire Single Single Double Double Double Multi Multi Multi Classified Cars & 2 Axle Buses 2 Axle 3 Axle 4 Axle <5 Axle 5 Axle >6 Axle <6 Axle 6 Axle >6 Axle Not Start Time Total Grand Total Percent 1.4% 55.5% 22.1% 0.8% 8.2% 1.2% 0.2% 3.3% 1.6% 0.7% 0.2% 0.1% 0.7% 4.1% ADT 9752 Comments: Report generated on 6/17/2014 6:17 PM SOURCE: Quality Counts, LLC (
108 Type of report: Tube Count - Speed Data Page 1 of 2 LOCATION: Hwy 101 btwn Juniper Ave & 11th St QC JOB #: SPECIFIC LOCATION: 0 ft from DIRECTION: NB/SB CITY/STATE: Reedsport, OR DATE: Jun Start Time Total Pace Speed Number in Pace 12:00 AM :00 AM :00 AM :00 AM :00 AM :00 AM :00 AM :00 AM :00 AM :00 AM :00 AM :00 AM :00 PM :00 PM :00 PM :00 PM :00 PM :00 PM :00 PM :00 PM :00 PM :00 PM :00 PM :00 PM Day Total Percent 3.6% 2.1% 5.4% 28.7% 44.7% 13.2% 1.9% 0.3% 0.1% 0.0% 0.0% 0.0% 0.0% 0.0% ADT 9752 AM Peak 11:00 AM 10:00 AM 11:00 AM 11:00 AM 11:00 AM 11:00 AM 11:00 AM 11:00 AM 5:00 AM 11:00 AM Volume PM Peak 4:00 PM 1:00 PM 2:00 PM 3:00 PM 12:00 PM 2:00 PM 5:00 PM 2:00 PM 3:00 PM 11:00 PM 12:00 PM Volume Comments: Report generated on 6/17/2014 6:17 PM SOURCE: Quality Counts, LLC (
109 Type of report: Tube Count - Speed Data SUMMARY - Tube Count - Speed Data Page 2 of 2 LOCATION: Hwy 101 btwn Juniper Ave & 11th St QC JOB #: SPECIFIC LOCATION: 0 ft from DIRECTION: NB/SB CITY/STATE: Reedsport, OR DATE: Jun Jun Start Time Total Pace Speed Number in Pace Grand Total Percent 3.6% 2.1% 5.4% 28.7% 44.7% 13.2% 1.9% 0.3% 0.1% 0.0% 0.0% 0.0% 0.0% 0.0% Cumulative Percent 3.6% 5.7% 11.1% 39.8% 84.5% 97.7% 99.6% 99.9% 100.0% 100.0% 100.0% 100.0% 100.0% 100.0% ADT th Percentile: 35 MPH Comments: Report generated on 6/17/2014 6:17 PM Mean Speed(Average): 30 MPH Median 31 MPH Mode: 33 MPH SOURCE: Quality Counts, LLC (
110 Type of report: Tube Count - Volume Data Page 1 of 1 LOCATION: Hwy 101 btwn Juniper Ave & 11th St QC JOB #: SPECIFIC LOCATION: 0 ft from DIRECTION: NB CITY/STATE: Reedsport, OR DATE: Jun Jun Mon Tue Wed Thu Fri Average Weekday Sat Sun Average Week Average Week Profile Start Time 05-Jun-14 Hourly Traffic Hourly Traffic 12:00 AM :00 AM :00 AM :00 AM :00 AM :00 AM :00 AM :00 AM :00 AM :00 AM :00 AM :00 AM :00 PM :00 PM :00 PM :00 PM :00 PM :00 PM :00 PM :00 PM :00 PM :00 PM :00 PM :00 PM Day Total % Weekday Average 100.0% % Week Average 100.0% 100.0% AM Peak 11:00 AM 11:00 AM 11:00 AM Volume PM Peak 12:00 PM 12:00 PM 12:00 PM Volume Comments: Report generated on 6/17/2014 6:17 PM SOURCE: Quality Counts, LLC (
111 Type of report: Tube Count - Vehicle Classification Data Page 1 of 2 LOCATION: Hwy 101 btwn Juniper Ave & 11th St QC JOB #: SPECIFIC LOCATION: 0 ft from DIRECTION: NB CITY/STATE: Reedsport, OR DATE: Jun Motorcycles Trailer Long 6 Tire Single Single Double Double Double Multi Multi Multi Classified Cars & 2 Axle Buses 2 Axle 3 Axle 4 Axle <5 Axle 5 Axle >6 Axle <6 Axle 6 Axle >6 Axle Not Start Time Total 12:00 AM :00 AM :00 AM :00 AM :00 AM :00 AM :00 AM :00 AM :00 AM :00 AM :00 AM :00 AM :00 PM :00 PM :00 PM :00 PM :00 PM :00 PM :00 PM :00 PM :00 PM :00 PM :00 PM :00 PM Day Total Percent 1.2% 55.2% 22.3% 1.1% 8.4% 1.3% 0.1% 3.4% 1.5% 0.7% 0.1% 0.2% 0.8% 3.9% ADT 4823 AM Peak 10:00 AM 11:00 AM 11:00 AM 9:00 AM 11:00 AM 3:00 AM 7:00 AM 11:00 AM 10:00 AM 7:00 AM 5:00 AM 1:00 AM 6:00 AM 10:00 AM 11:00 AM Volume PM Peak 12:00 PM 12:00 PM 4:00 PM 2:00 PM 4:00 PM 12:00 PM 12:00 PM 1:00 PM 12:00 PM 12:00 PM 4:00 PM 2:00 PM 6:00 PM 2:00 PM 12:00 PM Volume Comments: Report generated on 6/17/2014 6:17 PM SOURCE: Quality Counts, LLC (
112 Type of report: Tube Count - Vehicle Classification Data SUMMARY - Tube Count - Vehicle Classification Data Page 2 of 2 LOCATION: Hwy 101 btwn Juniper Ave & 11th St QC JOB #: SPECIFIC LOCATION: 0 ft from DIRECTION: NB CITY/STATE: Reedsport, OR DATE: Jun Jun Motorcycles Trailer Long 6 Tire Single Single Double Double Double Multi Multi Multi Classified Cars & 2 Axle Buses 2 Axle 3 Axle 4 Axle <5 Axle 5 Axle >6 Axle <6 Axle 6 Axle >6 Axle Not Start Time Total Grand Total Percent 1.2% 55.2% 22.3% 1.1% 8.4% 1.3% 0.1% 3.4% 1.5% 0.7% 0.1% 0.2% 0.8% 3.9% ADT 4823 Comments: Report generated on 6/17/2014 6:17 PM SOURCE: Quality Counts, LLC (
113 Type of report: Tube Count - Speed Data Page 1 of 2 LOCATION: Hwy 101 btwn Juniper Ave & 11th St QC JOB #: SPECIFIC LOCATION: 0 ft from DIRECTION: NB CITY/STATE: Reedsport, OR DATE: Jun Start Time Total Pace Speed Number in Pace 12:00 AM :00 AM :00 AM :00 AM :00 AM :00 AM :00 AM :00 AM :00 AM :00 AM :00 AM :00 AM :00 PM :00 PM :00 PM :00 PM :00 PM :00 PM :00 PM :00 PM :00 PM :00 PM :00 PM :00 PM Day Total Percent 3.4% 1.9% 4.6% 25.8% 45.7% 15.5% 2.5% 0.5% 0.1% 0.1% 0.0% 0.0% 0.0% 0.0% ADT 4823 AM Peak 10:00 AM 10:00 AM 10:00 AM 11:00 AM 11:00 AM 11:00 AM 11:00 AM 10:00 AM 9:00 AM 11:00 AM Volume PM Peak 2:00 PM 1:00 PM 2:00 PM 3:00 PM 12:00 PM 2:00 PM 4:00 PM 6:00 PM 1:00 PM 11:00 PM 12:00 PM Volume Comments: Report generated on 6/17/2014 6:17 PM SOURCE: Quality Counts, LLC (
114 Type of report: Tube Count - Speed Data SUMMARY - Tube Count - Speed Data Page 2 of 2 LOCATION: Hwy 101 btwn Juniper Ave & 11th St QC JOB #: SPECIFIC LOCATION: 0 ft from DIRECTION: NB CITY/STATE: Reedsport, OR DATE: Jun Jun Start Time Total Pace Speed Number in Pace Grand Total Percent 3.4% 1.9% 4.6% 25.8% 45.7% 15.5% 2.5% 0.5% 0.1% 0.1% 0.0% 0.0% 0.0% 0.0% Cumulative Percent 3.4% 5.3% 9.9% 35.7% 81.4% 96.9% 99.4% 99.9% 99.9% 100.0% 100.0% 100.0% 100.0% 100.0% ADT th Percentile: 36 MPH Comments: Report generated on 6/17/2014 6:17 PM Mean Speed(Average): 30 MPH Median 31 MPH Mode: 33 MPH SOURCE: Quality Counts, LLC (
115 Type of report: Tube Count - Volume Data Page 1 of 1 LOCATION: Winchester Ave (Hwy 101) btwn 20th St & 21st St QC JOB #: SPECIFIC LOCATION: 0 ft from DIRECTION: SB CITY/STATE: Reedsport, OR DATE: Jun Jun Mon Tue Wed Thu Fri Average Weekday Sat Sun Average Week Average Week Profile Start Time 05-Jun-14 Hourly Traffic Hourly Traffic 12:00 AM :00 AM :00 AM :00 AM :00 AM :00 AM :00 AM :00 AM :00 AM :00 AM :00 AM :00 AM :00 PM :00 PM :00 PM :00 PM :00 PM :00 PM :00 PM :00 PM :00 PM :00 PM :00 PM :00 PM Day Total % Weekday Average 100.0% % Week Average 100.0% 100.0% AM Peak 11:00 AM 11:00 AM 11:00 AM Volume PM Peak 5:00 PM 5:00 PM 5:00 PM Volume Comments: Report generated on 6/17/2014 6:17 PM SOURCE: Quality Counts, LLC (
116 Type of report: Tube Count - Vehicle Classification Data Page 1 of 2 LOCATION: Winchester Ave (Hwy 101) btwn 20th St & 21st St QC JOB #: SPECIFIC LOCATION: 0 ft from DIRECTION: SB CITY/STATE: Reedsport, OR DATE: Jun Motorcycles Trailer Long 6 Tire Single Single Double Double Double Multi Multi Multi Classified Cars & 2 Axle Buses 2 Axle 3 Axle 4 Axle <5 Axle 5 Axle >6 Axle <6 Axle 6 Axle >6 Axle Not Start Time Total 12:00 AM :00 AM :00 AM :00 AM :00 AM :00 AM :00 AM :00 AM :00 AM :00 AM :00 AM :00 AM :00 PM :00 PM :00 PM :00 PM :00 PM :00 PM :00 PM :00 PM :00 PM :00 PM :00 PM :00 PM Day Total Percent 1.1% 55.2% 21.8% 0.7% 8.9% 1.2% 0.2% 2.9% 1.2% 0.3% 0.2% 0.1% 0.6% 5.7% ADT 6380 AM Peak 11:00 AM 11:00 AM 11:00 AM 9:00 AM 9:00 AM 9:00 AM 7:00 AM 10:00 AM 7:00 AM 6:00 AM 9:00 AM 4:00 AM 10:00 AM 11:00 AM 11:00 AM Volume PM Peak 12:00 PM 5:00 PM 5:00 PM 1:00 PM 2:00 PM 3:00 PM 1:00 PM 1:00 PM 12:00 PM 12:00 PM 12:00 PM 12:00 PM 12:00 PM 5:00 PM 5:00 PM Volume Comments: Report generated on 6/17/2014 6:17 PM SOURCE: Quality Counts, LLC (
117 Type of report: Tube Count - Vehicle Classification Data SUMMARY - Tube Count - Vehicle Classification Data Page 2 of 2 LOCATION: Winchester Ave (Hwy 101) btwn 20th St & 21st St QC JOB #: SPECIFIC LOCATION: 0 ft from DIRECTION: SB CITY/STATE: Reedsport, OR DATE: Jun Jun Motorcycles Trailer Long 6 Tire Single Single Double Double Double Multi Multi Multi Classified Cars & 2 Axle Buses 2 Axle 3 Axle 4 Axle <5 Axle 5 Axle >6 Axle <6 Axle 6 Axle >6 Axle Not Start Time Total Grand Total Percent 1.1% 55.2% 21.8% 0.7% 8.9% 1.2% 0.2% 2.9% 1.2% 0.3% 0.2% 0.1% 0.6% 5.7% ADT 6380 Comments: Report generated on 6/17/2014 6:17 PM SOURCE: Quality Counts, LLC (
118 Type of report: Tube Count - Speed Data Page 1 of 2 LOCATION: Winchester Ave (Hwy 101) btwn 20th St & 21st St QC JOB #: SPECIFIC LOCATION: 0 ft from DIRECTION: SB CITY/STATE: Reedsport, OR DATE: Jun Start Time Total Pace Speed Number in Pace 12:00 AM :00 AM :00 AM :00 AM :00 AM :00 AM :00 AM :00 AM :00 AM :00 AM :00 AM :00 AM :00 PM :00 PM :00 PM :00 PM :00 PM :00 PM :00 PM :00 PM :00 PM :00 PM :00 PM :00 PM Day Total Percent 7.2% 4.9% 17.7% 42.1% 24.2% 3.5% 0.3% 0.1% 0.0% 0.0% 0.0% 0.0% 0.0% 0.0% ADT 6380 AM Peak 11:00 AM 11:00 AM 11:00 AM 10:00 AM 10:00 AM 6:00 AM 9:00 AM 5:00 AM 8:00 AM 11:00 AM Volume PM Peak 4:00 PM 4:00 PM 3:00 PM 12:00 PM 5:00 PM 5:00 PM 3:00 PM 3:00 PM 7:00 PM 5:00 PM Volume Comments: Report generated on 6/17/2014 6:17 PM SOURCE: Quality Counts, LLC (
119 Type of report: Tube Count - Speed Data SUMMARY - Tube Count - Speed Data Page 2 of 2 LOCATION: Winchester Ave (Hwy 101) btwn 20th St & 21st St QC JOB #: SPECIFIC LOCATION: 0 ft from DIRECTION: SB CITY/STATE: Reedsport, OR DATE: Jun Jun Start Time Total Pace Speed Number in Pace Grand Total Percent 7.2% 4.9% 17.7% 42.1% 24.2% 3.5% 0.3% 0.1% 0.0% 0.0% 0.0% 0.0% 0.0% 0.0% Cumulative Percent 7.2% 12.1% 29.8% 71.9% 96.1% 99.6% 99.9% 100.0% 100.0% 100.0% 100.0% 100.0% 100.0% 100.0% ADT th Percentile: 32 MPH Comments: Report generated on 6/17/2014 6:17 PM Mean Speed(Average): 26 MPH Median 27 MPH Mode: 28 MPH SOURCE: Quality Counts, LLC (
120 Type of report: Tube Count - Volume Data Page 1 of 1 LOCATION: Winchester Ave (Hwy 101) btwn 20th St & 21st St QC JOB #: SPECIFIC LOCATION: 0 ft from DIRECTION: NB/SB CITY/STATE: Reedsport, OR DATE: Jun Jun Mon Tue Wed Thu Fri Average Weekday Sat Sun Average Week Average Week Profile Start Time 05-Jun-14 Hourly Traffic Hourly Traffic 12:00 AM :00 AM :00 AM :00 AM :00 AM :00 AM :00 AM :00 AM :00 AM :00 AM :00 AM :00 AM :00 PM :00 PM :00 PM :00 PM :00 PM :00 PM :00 PM :00 PM :00 PM :00 PM :00 PM :00 PM Day Total % Weekday Average 100.0% % Week Average 100.0% 100.0% AM Peak 11:00 AM 11:00 AM 11:00 AM Volume PM Peak 3:00 PM 3:00 PM 3:00 PM Volume Comments: Report generated on 6/17/2014 6:17 PM SOURCE: Quality Counts, LLC (
121 Type of report: Tube Count - Vehicle Classification Data Page 1 of 2 LOCATION: Winchester Ave (Hwy 101) btwn 20th St & 21st St QC JOB #: SPECIFIC LOCATION: 0 ft from DIRECTION: NB/SB CITY/STATE: Reedsport, OR DATE: Jun Motorcycles Trailer Long 6 Tire Single Single Double Double Double Multi Multi Multi Classified Cars & 2 Axle Buses 2 Axle 3 Axle 4 Axle <5 Axle 5 Axle >6 Axle <6 Axle 6 Axle >6 Axle Not Start Time Total 12:00 AM :00 AM :00 AM :00 AM :00 AM :00 AM :00 AM :00 AM :00 AM :00 AM :00 AM :00 AM :00 PM :00 PM :00 PM :00 PM :00 PM :00 PM :00 PM :00 PM :00 PM :00 PM :00 PM :00 PM Day Total Percent 1.3% 54.9% 22.0% 0.8% 8.8% 1.3% 0.1% 2.8% 1.2% 0.5% 0.1% 0.1% 0.6% 5.6% ADT AM Peak 10:00 AM 11:00 AM 11:00 AM 9:00 AM 9:00 AM 11:00 AM 7:00 AM 10:00 AM 11:00 AM 6:00 AM 9:00 AM 1:00 AM 6:00 AM 11:00 AM 11:00 AM Volume PM Peak 2:00 PM 5:00 PM 3:00 PM 1:00 PM 1:00 PM 3:00 PM 1:00 PM 3:00 PM 12:00 PM 12:00 PM 12:00 PM 12:00 PM 2:00 PM 1:00 PM 3:00 PM Volume Comments: Report generated on 6/17/2014 6:17 PM SOURCE: Quality Counts, LLC (
122 Type of report: Tube Count - Vehicle Classification Data SUMMARY - Tube Count - Vehicle Classification Data Page 2 of 2 LOCATION: Winchester Ave (Hwy 101) btwn 20th St & 21st St QC JOB #: SPECIFIC LOCATION: 0 ft from DIRECTION: NB/SB CITY/STATE: Reedsport, OR DATE: Jun Jun Motorcycles Trailer Long 6 Tire Single Single Double Double Double Multi Multi Multi Classified Cars & 2 Axle Buses 2 Axle 3 Axle 4 Axle <5 Axle 5 Axle >6 Axle <6 Axle 6 Axle >6 Axle Not Start Time Total Grand Total Percent 1.3% 54.9% 22.0% 0.8% 8.8% 1.3% 0.1% 2.8% 1.2% 0.5% 0.1% 0.1% 0.6% 5.6% ADT Comments: Report generated on 6/17/2014 6:17 PM SOURCE: Quality Counts, LLC (
123 Type of report: Tube Count - Speed Data Page 1 of 2 LOCATION: Winchester Ave (Hwy 101) btwn 20th St & 21st St QC JOB #: SPECIFIC LOCATION: 0 ft from DIRECTION: NB/SB CITY/STATE: Reedsport, OR DATE: Jun Start Time Total Pace Speed Number in Pace 12:00 AM :00 AM :00 AM :00 AM :00 AM :00 AM :00 AM :00 AM :00 AM :00 AM :00 AM :00 AM :00 PM :00 PM :00 PM :00 PM :00 PM :00 PM :00 PM :00 PM :00 PM :00 PM :00 PM :00 PM Day Total Percent 6.5% 4.5% 17.4% 44.6% 23.4% 3.2% 0.4% 0.0% 0.0% 0.0% 0.0% 0.0% 0.0% 0.0% ADT AM Peak 11:00 AM 11:00 AM 11:00 AM 11:00 AM 9:00 AM 6:00 AM 9:00 AM 9:00 AM 8:00 AM 11:00 AM Volume PM Peak 1:00 PM 4:00 PM 3:00 PM 12:00 PM 5:00 PM 5:00 PM 3:00 PM 1:00 PM 7:00 PM 3:00 PM Volume Comments: Report generated on 6/17/2014 6:17 PM SOURCE: Quality Counts, LLC (
124 Type of report: Tube Count - Speed Data SUMMARY - Tube Count - Speed Data Page 2 of 2 LOCATION: Winchester Ave (Hwy 101) btwn 20th St & 21st St QC JOB #: SPECIFIC LOCATION: 0 ft from DIRECTION: NB/SB CITY/STATE: Reedsport, OR DATE: Jun Jun Start Time Total Pace Speed Number in Pace Grand Total Percent 6.5% 4.5% 17.4% 44.6% 23.4% 3.2% 0.4% 0.0% 0.0% 0.0% 0.0% 0.0% 0.0% 0.0% Cumulative Percent 6.5% 11.0% 28.4% 73.0% 96.4% 99.6% 99.9% 100.0% 100.0% 100.0% 100.0% 100.0% 100.0% 100.0% ADT th Percentile: 32 MPH Comments: Report generated on 6/17/2014 6:17 PM Mean Speed(Average): 26 MPH Median 27 MPH Mode: 28 MPH SOURCE: Quality Counts, LLC (
125 Type of report: Tube Count - Volume Data Page 1 of 1 LOCATION: Winchester Ave (Hwy 101) btwn 20th St & 21st St QC JOB #: SPECIFIC LOCATION: 0 ft from DIRECTION: NB CITY/STATE: Reedsport, OR DATE: Jun Jun Mon Tue Wed Thu Fri Average Weekday Sat Sun Average Week Average Week Profile Start Time 05-Jun-14 Hourly Traffic Hourly Traffic 12:00 AM :00 AM :00 AM :00 AM :00 AM :00 AM :00 AM :00 AM :00 AM :00 AM :00 AM :00 AM :00 PM :00 PM :00 PM :00 PM :00 PM :00 PM :00 PM :00 PM :00 PM :00 PM :00 PM :00 PM Day Total % Weekday Average 100.0% % Week Average 100.0% 100.0% AM Peak 11:00 AM 11:00 AM 11:00 AM Volume PM Peak 4:00 PM 4:00 PM 4:00 PM Volume Comments: Report generated on 6/17/2014 6:17 PM SOURCE: Quality Counts, LLC (
126 Type of report: Tube Count - Vehicle Classification Data Page 1 of 2 LOCATION: Winchester Ave (Hwy 101) btwn 20th St & 21st St QC JOB #: SPECIFIC LOCATION: 0 ft from DIRECTION: NB CITY/STATE: Reedsport, OR DATE: Jun Motorcycles Trailer Long 6 Tire Single Single Double Double Double Multi Multi Multi Classified Cars & 2 Axle Buses 2 Axle 3 Axle 4 Axle <5 Axle 5 Axle >6 Axle <6 Axle 6 Axle >6 Axle Not Start Time Total 12:00 AM :00 AM :00 AM :00 AM :00 AM :00 AM :00 AM :00 AM :00 AM :00 AM :00 AM :00 AM :00 PM :00 PM :00 PM :00 PM :00 PM :00 PM :00 PM :00 PM :00 PM :00 PM :00 PM :00 PM Day Total Percent 1.5% 54.6% 22.1% 1.0% 8.7% 1.3% 0.1% 2.7% 1.1% 0.6% 0.1% 0.1% 0.6% 5.5% ADT 6453 AM Peak 10:00 AM 11:00 AM 11:00 AM 9:00 AM 9:00 AM 11:00 AM 7:00 AM 11:00 AM 10:00 AM 6:00 AM 5:00 AM 1:00 AM 6:00 AM 10:00 AM 11:00 AM Volume PM Peak 2:00 PM 12:00 PM 4:00 PM 1:00 PM 1:00 PM 4:00 PM 4:00 PM 3:00 PM 12:00 PM 1:00 PM 4:00 PM 12:00 PM 2:00 PM 1:00 PM 4:00 PM Volume Comments: Report generated on 6/17/2014 6:17 PM SOURCE: Quality Counts, LLC (
127 Type of report: Tube Count - Vehicle Classification Data SUMMARY - Tube Count - Vehicle Classification Data Page 2 of 2 LOCATION: Winchester Ave (Hwy 101) btwn 20th St & 21st St QC JOB #: SPECIFIC LOCATION: 0 ft from DIRECTION: NB CITY/STATE: Reedsport, OR DATE: Jun Jun Motorcycles Trailer Long 6 Tire Single Single Double Double Double Multi Multi Multi Classified Cars & 2 Axle Buses 2 Axle 3 Axle 4 Axle <5 Axle 5 Axle >6 Axle <6 Axle 6 Axle >6 Axle Not Start Time Total Grand Total Percent 1.5% 54.6% 22.1% 1.0% 8.7% 1.3% 0.1% 2.7% 1.1% 0.6% 0.1% 0.1% 0.6% 5.5% ADT 6453 Comments: Report generated on 6/17/2014 6:17 PM SOURCE: Quality Counts, LLC (
128 Type of report: Tube Count - Speed Data Page 1 of 2 LOCATION: Winchester Ave (Hwy 101) btwn 20th St & 21st St QC JOB #: SPECIFIC LOCATION: 0 ft from DIRECTION: NB CITY/STATE: Reedsport, OR DATE: Jun Start Time Total Pace Speed Number in Pace 12:00 AM :00 AM :00 AM :00 AM :00 AM :00 AM :00 AM :00 AM :00 AM :00 AM :00 AM :00 AM :00 PM :00 PM :00 PM :00 PM :00 PM :00 PM :00 PM :00 PM :00 PM :00 PM :00 PM :00 PM Day Total Percent 5.8% 4.1% 17.1% 47.0% 22.6% 2.9% 0.4% 0.0% 0.0% 0.0% 0.0% 0.0% 0.0% 0.0% ADT 6453 AM Peak 10:00 AM 10:00 AM 11:00 AM 11:00 AM 11:00 AM 8:00 AM 9:00 AM 9:00 AM 8:00 AM 11:00 AM Volume PM Peak 2:00 PM 12:00 PM 3:00 PM 1:00 PM 5:00 PM 4:00 PM 2:00 PM 1:00 PM 4:00 PM Volume Comments: Report generated on 6/17/2014 6:17 PM SOURCE: Quality Counts, LLC (
129 Type of report: Tube Count - Speed Data SUMMARY - Tube Count - Speed Data Page 2 of 2 LOCATION: Winchester Ave (Hwy 101) btwn 20th St & 21st St QC JOB #: SPECIFIC LOCATION: 0 ft from DIRECTION: NB CITY/STATE: Reedsport, OR DATE: Jun Jun Start Time Total Pace Speed Number in Pace Grand Total Percent 5.8% 4.1% 17.1% 47.0% 22.6% 2.9% 0.4% 0.0% 0.0% 0.0% 0.0% 0.0% 0.0% 0.0% Cumulative Percent 5.8% 9.9% 27.1% 74.1% 96.7% 99.6% 100.0% 100.0% 100.0% 100.0% 100.0% 100.0% 100.0% 100.0% ADT th Percentile: 32 MPH Comments: Report generated on 6/17/2014 6:17 PM Mean Speed(Average): 26 MPH Median 27 MPH Mode: 28 MPH SOURCE: Quality Counts, LLC (
130 Type of report: Tube Count - Volume Data Page 1 of 1 LOCATION: Winchester Ave (Hwy 101) btwn Longwood Dr & 22nd St QC JOB #: SPECIFIC LOCATION: 0 ft from DIRECTION: SB CITY/STATE: Reedsport, OR DATE: Jun Jun Mon Tue Wed Thu Fri Average Weekday Sat Sun Average Week Average Week Profile Start Time 05-Jun-14 Hourly Traffic Hourly Traffic 12:00 AM :00 AM :00 AM :00 AM :00 AM :00 AM :00 AM :00 AM :00 AM :00 AM :00 AM :00 AM :00 PM :00 PM :00 PM :00 PM :00 PM :00 PM :00 PM :00 PM :00 PM :00 PM :00 PM :00 PM Day Total % Weekday Average 100.0% % Week Average 100.0% 100.0% AM Peak 11:00 AM 11:00 AM 11:00 AM Volume PM Peak 3:00 PM 3:00 PM 3:00 PM Volume Comments: Report generated on 6/17/2014 6:16 PM SOURCE: Quality Counts, LLC (
131 Type of report: Tube Count - Vehicle Classification Data Page 1 of 2 LOCATION: Winchester Ave (Hwy 101) btwn Longwood Dr & 22nd St QC JOB #: SPECIFIC LOCATION: 0 ft from DIRECTION: SB CITY/STATE: Reedsport, OR DATE: Jun Motorcycles Trailer Long 6 Tire Single Single Double Double Double Multi Multi Multi Classified Cars & 2 Axle Buses 2 Axle 3 Axle 4 Axle <5 Axle 5 Axle >6 Axle <6 Axle 6 Axle >6 Axle Not Start Time Total 12:00 AM :00 AM :00 AM :00 AM :00 AM :00 AM :00 AM :00 AM :00 AM :00 AM :00 AM :00 AM :00 PM :00 PM :00 PM :00 PM :00 PM :00 PM :00 PM :00 PM :00 PM :00 PM :00 PM :00 PM Day Total Percent 1.4% 54.6% 21.6% 0.8% 10.1% 0.9% 0.1% 3.4% 1.8% 0.5% 0.2% 0.1% 0.5% 4.0% ADT 4898 AM Peak 9:00 AM 11:00 AM 11:00 AM 9:00 AM 9:00 AM 8:00 AM 10:00 AM 9:00 AM 6:00 AM 7:00 AM 4:00 AM 11:00 AM 11:00 AM 11:00 AM Volume PM Peak 3:00 PM 5:00 PM 3:00 PM 12:00 PM 2:00 PM 3:00 PM 1:00 PM 12:00 PM 3:00 PM 12:00 PM 2:00 PM 4:00 PM 12:00 PM 3:00 PM 3:00 PM Volume Comments: Report generated on 6/17/2014 6:17 PM SOURCE: Quality Counts, LLC (
132 Type of report: Tube Count - Vehicle Classification Data SUMMARY - Tube Count - Vehicle Classification Data Page 2 of 2 LOCATION: Winchester Ave (Hwy 101) btwn Longwood Dr & 22nd St QC JOB #: SPECIFIC LOCATION: 0 ft from DIRECTION: SB CITY/STATE: Reedsport, OR DATE: Jun Jun Motorcycles Trailer Long 6 Tire Single Single Double Double Double Multi Multi Multi Classified Cars & 2 Axle Buses 2 Axle 3 Axle 4 Axle <5 Axle 5 Axle >6 Axle <6 Axle 6 Axle >6 Axle Not Start Time Total Grand Total Percent 1.4% 54.6% 21.6% 0.8% 10.1% 0.9% 0.1% 3.4% 1.8% 0.5% 0.2% 0.1% 0.5% 4.0% ADT 4898 Comments: Report generated on 6/17/2014 6:17 PM SOURCE: Quality Counts, LLC (
133 Type of report: Tube Count - Speed Data Page 1 of 2 LOCATION: Winchester Ave (Hwy 101) btwn Longwood Dr & 22nd St QC JOB #: SPECIFIC LOCATION: 0 ft from DIRECTION: SB CITY/STATE: Reedsport, OR DATE: Jun Start Time Total Pace Speed Number in Pace 12:00 AM :00 AM :00 AM :00 AM :00 AM :00 AM :00 AM :00 AM :00 AM :00 AM :00 AM :00 AM :00 PM :00 PM :00 PM :00 PM :00 PM :00 PM :00 PM :00 PM :00 PM :00 PM :00 PM :00 PM Day Total Percent 2.6% 1.5% 13.1% 33.1% 32.1% 14.3% 2.9% 0.3% 0.1% 0.0% 0.0% 0.0% 0.0% 0.0% ADT 4898 AM Peak 7:00 AM 7:00 AM 7:00 AM 11:00 AM 11:00 AM 10:00 AM 9:00 AM 8:00 AM 5:00 AM 11:00 AM Volume PM Peak 3:00 PM 3:00 PM 5:00 PM 3:00 PM 12:00 PM 2:00 PM 2:00 PM 2:00 PM 1:00 PM 5:00 PM 3:00 PM Volume Comments: Report generated on 6/17/2014 6:17 PM SOURCE: Quality Counts, LLC (
134 Type of report: Tube Count - Speed Data SUMMARY - Tube Count - Speed Data Page 2 of 2 LOCATION: Winchester Ave (Hwy 101) btwn Longwood Dr & 22nd St QC JOB #: SPECIFIC LOCATION: 0 ft from DIRECTION: SB CITY/STATE: Reedsport, OR DATE: Jun Jun Start Time Total Pace Speed Number in Pace Grand Total Percent 2.6% 1.5% 13.1% 33.1% 32.1% 14.3% 2.9% 0.3% 0.1% 0.0% 0.0% 0.0% 0.0% 0.0% Cumulative Percent 2.6% 4.1% 17.3% 50.3% 82.4% 96.7% 99.6% 99.9% 100.0% 100.0% 100.0% 100.0% 100.0% 100.0% ADT th Percentile: 35 MPH Comments: Report generated on 6/17/2014 6:17 PM Mean Speed(Average): 29 MPH Median 29 MPH Mode: 28 MPH SOURCE: Quality Counts, LLC (
135 Type of report: Tube Count - Volume Data Page 1 of 1 LOCATION: Winchester Ave (Hwy 101) btwn Longwood Dr & 22nd St QC JOB #: SPECIFIC LOCATION: 0 ft from DIRECTION: NB/SB CITY/STATE: Reedsport, OR DATE: Jun Jun Mon Tue Wed Thu Fri Average Weekday Sat Sun Average Week Average Week Profile Start Time 05-Jun-14 Hourly Traffic Hourly Traffic 12:00 AM :00 AM :00 AM :00 AM :00 AM :00 AM :00 AM :00 AM :00 AM :00 AM :00 AM :00 AM :00 PM :00 PM :00 PM :00 PM :00 PM :00 PM :00 PM :00 PM :00 PM :00 PM :00 PM :00 PM Day Total % Weekday Average 100.0% % Week Average 100.0% 100.0% AM Peak 11:00 AM 11:00 AM 11:00 AM Volume PM Peak 3:00 PM 3:00 PM 3:00 PM Volume Comments: Report generated on 6/17/2014 6:16 PM SOURCE: Quality Counts, LLC (
136 Type of report: Tube Count - Vehicle Classification Data Page 1 of 2 LOCATION: Winchester Ave (Hwy 101) btwn Longwood Dr & 22nd St QC JOB #: SPECIFIC LOCATION: 0 ft from DIRECTION: NB/SB CITY/STATE: Reedsport, OR DATE: Jun Motorcycles Trailer Long 6 Tire Single Single Double Double Double Multi Multi Multi Classified Cars & 2 Axle Buses 2 Axle 3 Axle 4 Axle <5 Axle 5 Axle >6 Axle <6 Axle 6 Axle >6 Axle Not Start Time Total 12:00 AM :00 AM :00 AM :00 AM :00 AM :00 AM :00 AM :00 AM :00 AM :00 AM :00 AM :00 AM :00 PM :00 PM :00 PM :00 PM :00 PM :00 PM :00 PM :00 PM :00 PM :00 PM :00 PM :00 PM Day Total Percent 0.9% 54.4% 22.5% 1.1% 10.1% 0.8% 0.1% 4.2% 1.0% 0.4% 0.5% 0.1% 0.3% 3.7% ADT 9795 AM Peak 11:00 AM 11:00 AM 11:00 AM 9:00 AM 7:00 AM 10:00 AM 11:00 AM 7:00 AM 6:00 AM 4:00 AM 3:00 AM 11:00 AM 10:00 AM 11:00 AM Volume PM Peak 1:00 PM 5:00 PM 3:00 PM 3:00 PM 3:00 PM 3:00 PM 2:00 PM 12:00 PM 3:00 PM 1:00 PM 2:00 PM 4:00 PM 12:00 PM 3:00 PM 3:00 PM Volume Comments: Report generated on 6/17/2014 6:17 PM SOURCE: Quality Counts, LLC (
137 Type of report: Tube Count - Vehicle Classification Data SUMMARY - Tube Count - Vehicle Classification Data Page 2 of 2 LOCATION: Winchester Ave (Hwy 101) btwn Longwood Dr & 22nd St QC JOB #: SPECIFIC LOCATION: 0 ft from DIRECTION: NB/SB CITY/STATE: Reedsport, OR DATE: Jun Jun Motorcycles Trailer Long 6 Tire Single Single Double Double Double Multi Multi Multi Classified Cars & 2 Axle Buses 2 Axle 3 Axle 4 Axle <5 Axle 5 Axle >6 Axle <6 Axle 6 Axle >6 Axle Not Start Time Total Grand Total Percent 0.9% 54.4% 22.5% 1.1% 10.1% 0.8% 0.1% 4.2% 1.0% 0.4% 0.5% 0.1% 0.3% 3.7% ADT 9795 Comments: Report generated on 6/17/2014 6:17 PM SOURCE: Quality Counts, LLC (
138 Type of report: Tube Count - Speed Data Page 1 of 2 LOCATION: Winchester Ave (Hwy 101) btwn Longwood Dr & 22nd St QC JOB #: SPECIFIC LOCATION: 0 ft from DIRECTION: NB/SB CITY/STATE: Reedsport, OR DATE: Jun Start Time Total Pace Speed Number in Pace 12:00 AM :00 AM :00 AM :00 AM :00 AM :00 AM :00 AM :00 AM :00 AM :00 AM :00 AM :00 AM :00 PM :00 PM :00 PM :00 PM :00 PM :00 PM :00 PM :00 PM :00 PM :00 PM :00 PM :00 PM Day Total Percent 9.4% 4.6% 11.1% 29.5% 30.2% 12.3% 2.6% 0.3% 0.1% 0.0% 0.0% 0.0% 0.0% 0.0% ADT 9795 AM Peak 7:00 AM 11:00 AM 11:00 AM 11:00 AM 11:00 AM 10:00 AM 10:00 AM 8:00 AM 5:00 AM 11:00 AM Volume PM Peak 3:00 PM 3:00 PM 3:00 PM 3:00 PM 12:00 PM 4:00 PM 5:00 PM 2:00 PM 1:00 PM 5:00 PM 3:00 PM Volume Comments: Report generated on 6/17/2014 6:17 PM SOURCE: Quality Counts, LLC (
139 Type of report: Tube Count - Speed Data SUMMARY - Tube Count - Speed Data Page 2 of 2 LOCATION: Winchester Ave (Hwy 101) btwn Longwood Dr & 22nd St QC JOB #: SPECIFIC LOCATION: 0 ft from DIRECTION: NB/SB CITY/STATE: Reedsport, OR DATE: Jun Jun Start Time Total Pace Speed Number in Pace Grand Total Percent 9.4% 4.6% 11.1% 29.5% 30.2% 12.3% 2.6% 0.3% 0.1% 0.0% 0.0% 0.0% 0.0% 0.0% Cumulative Percent 9.4% 14.0% 25.2% 54.7% 84.8% 97.1% 99.7% 99.9% 100.0% 100.0% 100.0% 100.0% 100.0% 100.0% ADT th Percentile: 35 MPH Comments: Report generated on 6/17/2014 6:17 PM Mean Speed(Average): 27 MPH Median 29 MPH Mode: 33 MPH SOURCE: Quality Counts, LLC (
140 Type of report: Tube Count - Volume Data Page 1 of 1 LOCATION: Winchester Ave (Hwy 101) btwn Longwood Dr & 22nd St QC JOB #: SPECIFIC LOCATION: 0 ft from DIRECTION: NB CITY/STATE: Reedsport, OR DATE: Jun Jun Mon Tue Wed Thu Fri Average Weekday Sat Sun Average Week Average Week Profile Start Time 05-Jun-14 Hourly Traffic Hourly Traffic 12:00 AM :00 AM :00 AM :00 AM :00 AM :00 AM :00 AM :00 AM :00 AM :00 AM :00 AM :00 AM :00 PM :00 PM :00 PM :00 PM :00 PM :00 PM :00 PM :00 PM :00 PM :00 PM :00 PM :00 PM Day Total % Weekday Average 100.0% % Week Average 100.0% 100.0% AM Peak 11:00 AM 11:00 AM 11:00 AM Volume PM Peak 3:00 PM 3:00 PM 3:00 PM Volume Comments: Report generated on 6/17/2014 6:16 PM SOURCE: Quality Counts, LLC (
141 Type of report: Tube Count - Vehicle Classification Data Page 1 of 2 LOCATION: Winchester Ave (Hwy 101) btwn Longwood Dr & 22nd St QC JOB #: SPECIFIC LOCATION: 0 ft from DIRECTION: NB CITY/STATE: Reedsport, OR DATE: Jun Motorcycles Trailer Long 6 Tire Single Single Double Double Double Multi Multi Multi Classified Cars & 2 Axle Buses 2 Axle 3 Axle 4 Axle <5 Axle 5 Axle >6 Axle <6 Axle 6 Axle >6 Axle Not Start Time Total 12:00 AM :00 AM :00 AM :00 AM :00 AM :00 AM :00 AM :00 AM :00 AM :00 AM :00 AM :00 AM :00 PM :00 PM :00 PM :00 PM :00 PM :00 PM :00 PM :00 PM :00 PM :00 PM :00 PM :00 PM Day Total Percent 0.4% 54.3% 23.4% 1.4% 10.1% 0.7% 0.0% 4.9% 0.3% 0.2% 0.7% 0.0% 0.1% 3.4% ADT 4897 AM Peak 7:00 AM 11:00 AM 11:00 AM 9:00 AM 8:00 AM 10:00 AM 11:00 AM 7:00 AM 5:00 AM 4:00 AM 3:00 AM 11:00 AM 10:00 AM 11:00 AM Volume PM Peak 1:00 PM 3:00 PM 12:00 PM 2:00 PM 3:00 PM 4:00 PM 12:00 PM 12:00 PM 6:00 PM 1:00 PM 4:00 PM 4:00 PM 4:00 PM 3:00 PM Volume Comments: Report generated on 6/17/2014 6:17 PM SOURCE: Quality Counts, LLC (
142 Type of report: Tube Count - Vehicle Classification Data SUMMARY - Tube Count - Vehicle Classification Data Page 2 of 2 LOCATION: Winchester Ave (Hwy 101) btwn Longwood Dr & 22nd St QC JOB #: SPECIFIC LOCATION: 0 ft from DIRECTION: NB CITY/STATE: Reedsport, OR DATE: Jun Jun Motorcycles Trailer Long 6 Tire Single Single Double Double Double Multi Multi Multi Classified Cars & 2 Axle Buses 2 Axle 3 Axle 4 Axle <5 Axle 5 Axle >6 Axle <6 Axle 6 Axle >6 Axle Not Start Time Total Grand Total Percent 0.4% 54.3% 23.4% 1.4% 10.1% 0.7% 0.0% 4.9% 0.3% 0.2% 0.7% 0.0% 0.1% 3.4% ADT 4897 Comments: Report generated on 6/17/2014 6:17 PM SOURCE: Quality Counts, LLC (
143 Type of report: Tube Count - Speed Data Page 1 of 2 LOCATION: Winchester Ave (Hwy 101) btwn Longwood Dr & 22nd St QC JOB #: SPECIFIC LOCATION: 0 ft from DIRECTION: NB CITY/STATE: Reedsport, OR DATE: Jun Start Time Total Pace Speed Number in Pace 12:00 AM :00 AM :00 AM :00 AM :00 AM :00 AM :00 AM :00 AM :00 AM :00 AM :00 AM :00 AM :00 PM :00 PM :00 PM :00 PM :00 PM :00 PM :00 PM :00 PM :00 PM :00 PM :00 PM :00 PM Day Total Percent 16.3% 7.7% 9.1% 25.9% 28.3% 10.2% 2.3% 0.2% 0.0% 0.0% 0.0% 0.0% 0.0% 0.0% ADT 4897 AM Peak 7:00 AM 11:00 AM 11:00 AM 11:00 AM 11:00 AM 10:00 AM 10:00 AM 1:00 AM 6:00 AM 11:00 AM Volume PM Peak 3:00 PM 2:00 PM 3:00 PM 3:00 PM 1:00 PM 4:00 PM 5:00 PM 5:00 PM 3:00 PM Volume Comments: Report generated on 6/17/2014 6:17 PM SOURCE: Quality Counts, LLC (
144 Type of report: Tube Count - Speed Data SUMMARY - Tube Count - Speed Data Page 2 of 2 LOCATION: Winchester Ave (Hwy 101) btwn Longwood Dr & 22nd St QC JOB #: SPECIFIC LOCATION: 0 ft from DIRECTION: NB CITY/STATE: Reedsport, OR DATE: Jun Jun Start Time Total Pace Speed Number in Pace Grand Total Percent 16.3% 7.7% 9.1% 25.9% 28.3% 10.2% 2.3% 0.2% 0.0% 0.0% 0.0% 0.0% 0.0% 0.0% Cumulative Percent 16.3% 23.9% 33.1% 59.0% 87.3% 97.5% 99.8% 100.0% 100.0% 100.0% 100.0% 100.0% 100.0% 100.0% ADT th Percentile: 34 MPH Comments: Report generated on 6/17/2014 6:17 PM Mean Speed(Average): 25 MPH Median 28 MPH Mode: 33 MPH SOURCE: Quality Counts, LLC (
145 Reedsport Pedestrian Safety Study Executive Summary December 2014 Directional Volume Figures

146 US Hour Direction Volumes South of 22nd Street US Hour Direction Volumes North of 11th Street US Hour Direction Volumes North of OR 38
147 Reedsport Pedestrian Safety Study Executive Summary December 2014 Peak Hour Turn Movement Counts
148 Type of peak hour being reported: System Peak Method for determining peak hour: Total Entering Volume LOCATION: N 3rd St -- Umpqua Ave (OR 38) QC JOB #: CITY/STATE: Reedsport, OR DATE: Wed, Jun Peak-Hour: 7:30 AM -- 8:30 AM Peak 15-Min: 7:45 AM -- 8:00 AM NA NA NA NA NA NA NA NA 5-Min Count Period N 3rd St (Northbound) N 3rd St (Southbound) Umpqua Ave (OR 38) (Eastbound) Umpqua Ave (OR 38) (Westbound) Total Hourly Totals Beginning At Left Thru Right U Left Thru Right U Left Thru Right U Left Thru Right U 7:00 AM :05 AM :10 AM :15 AM :20 AM :25 AM :30 AM :35 AM :40 AM :45 AM :50 AM :55 AM :00 AM :05 AM :10 AM :15 AM :20 AM :25 AM :30 AM :35 AM :40 AM :45 AM :50 AM :55 AM Peak 15-Min Northbound Southbound Eastbound Westbound Flowrates Left Thru Right U Left Thru Right U Left Thru Right U Left Thru Right U Total All Vehicles Heavy Trucks Pedestrians Bicycles Railroad Stopped Buses Comments: Report generated on 6/17/2014 6:47 PM SOURCE: Quality Counts, LLC (
149 Type of peak hour being reported: System Peak Method for determining peak hour: Total Entering Volume LOCATION: Hwy Umpqua Ave (OR 38) QC JOB #: CITY/STATE: Reedsport, OR DATE: Thu, Jun Peak-Hour: 7:30 AM -- 8:30 AM Peak 15-Min: 7:45 AM -- 8:00 AM NA NA NA NA NA NA NA NA 5-Min Count Period Hwy 101 (Northbound) Hwy 101 (Southbound) Umpqua Ave (OR 38) (Eastbound) Umpqua Ave (OR 38) (Westbound) Total Hourly Totals Beginning At Left Thru Right U Left Thru Right U Left Thru Right U Left Thru Right U 7:00 AM :05 AM :10 AM :15 AM :20 AM :25 AM :30 AM :35 AM :40 AM :45 AM :50 AM :55 AM :00 AM :05 AM :10 AM :15 AM :20 AM :25 AM :30 AM :35 AM :40 AM :45 AM :50 AM :55 AM Peak 15-Min Northbound Southbound Eastbound Westbound Flowrates Left Thru Right U Left Thru Right U Left Thru Right U Left Thru Right U Total All Vehicles Heavy Trucks Pedestrians Bicycles Railroad Stopped Buses Comments: Report generated on 6/17/2014 6:47 PM SOURCE: Quality Counts, LLC (
150 Type of peak hour being reported: System Peak Method for determining peak hour: Total Entering Volume LOCATION: N 20th St -- Winchester Ave (Hwy 101) QC JOB #: CITY/STATE: Reedsport, OR DATE: Thu, Jun Peak-Hour: 7:30 AM -- 8:30 AM Peak 15-Min: 7:45 AM -- 8:00 AM NA NA NA NA NA NA NA NA 5-Min Count Period N 20th St (Northbound) N 20th St (Southbound) Winchester Ave (Hwy 101) (Eastbound) Winchester Ave (Hwy 101) (Westbound) Total Hourly Totals Beginning At Left Thru Right U Left Thru Right U Left Thru Right U Left Thru Right U 7:00 AM :05 AM :10 AM :15 AM :20 AM :25 AM :30 AM :35 AM :40 AM :45 AM :50 AM :55 AM :00 AM :05 AM :10 AM :15 AM :20 AM :25 AM :30 AM :35 AM :40 AM :45 AM :50 AM :55 AM Peak 15-Min Northbound Southbound Eastbound Westbound Flowrates Left Thru Right U Left Thru Right U Left Thru Right U Left Thru Right U Total All Vehicles Heavy Trucks Pedestrians Bicycles Railroad Stopped Buses Comments: Report generated on 6/17/2014 6:47 PM SOURCE: Quality Counts, LLC (
151 Type of peak hour being reported: System Peak Method for determining peak hour: Total Entering Volume LOCATION: N 21st St -- Winchester Ave (Hwy 101) QC JOB #: CITY/STATE: Reedsport, OR DATE: Wed, Jun Peak-Hour: 7:30 AM -- 8:30 AM Peak 15-Min: 7:45 AM -- 8:00 AM NA NA NA NA NA NA NA NA 5-Min Count Period N 21st St (Northbound) N 21st St (Southbound) Winchester Ave (Hwy 101) (Eastbound) Winchester Ave (Hwy 101) (Westbound) Total Hourly Totals Beginning At Left Thru Right U Left Thru Right U Left Thru Right U Left Thru Right U 7:00 AM :05 AM :10 AM :15 AM :20 AM :25 AM :30 AM :35 AM :40 AM :45 AM :50 AM :55 AM :00 AM :05 AM :10 AM :15 AM :20 AM :25 AM :30 AM :35 AM :40 AM :45 AM :50 AM :55 AM Peak 15-Min Northbound Southbound Eastbound Westbound Flowrates Left Thru Right U Left Thru Right U Left Thru Right U Left Thru Right U Total All Vehicles Heavy Trucks Pedestrians Bicycles Railroad Stopped Buses Comments: Report generated on 6/17/2014 6:47 PM SOURCE: Quality Counts, LLC (
152 Type of peak hour being reported: System Peak Method for determining peak hour: Total Entering Volume LOCATION: N 3rd St -- Umpqua Ave (OR 38) QC JOB #: CITY/STATE: Reedsport, OR DATE: Wed, Jun Peak-Hour: 11:55 AM -- 12:55 PM Peak 15-Min: 12:30 PM -- 12:45 PM NA NA NA NA NA NA NA NA 5-Min Count Period N 3rd St (Northbound) N 3rd St (Southbound) Umpqua Ave (OR 38) (Eastbound) Umpqua Ave (OR 38) (Westbound) Total Hourly Totals Beginning At Left Thru Right U Left Thru Right U Left Thru Right U Left Thru Right U 11:00 AM :05 AM :10 AM :15 AM :20 AM :25 AM :30 AM :35 AM :40 AM :45 AM :50 AM :55 AM :00 PM :05 PM :10 PM :15 PM :20 PM :25 PM :30 PM :35 PM :40 PM :45 PM :50 PM :55 PM Peak 15-Min Northbound Southbound Eastbound Westbound Flowrates Left Thru Right U Left Thru Right U Left Thru Right U Left Thru Right U Total All Vehicles Heavy Trucks Pedestrians Bicycles Railroad Stopped Buses Comments: Report generated on 6/17/2014 7:18 PM SOURCE: Quality Counts, LLC (
153 Type of peak hour being reported: System Peak Method for determining peak hour: Total Entering Volume LOCATION: Hwy Umpqua Ave (OR 38) QC JOB #: CITY/STATE: Reedsport, OR DATE: Thu, Jun Peak-Hour: 11:55 AM -- 12:55 PM Peak 15-Min: 12:30 PM -- 12:45 PM NA NA NA NA NA NA NA NA 5-Min Count Period Hwy 101 (Northbound) Hwy 101 (Southbound) Umpqua Ave (OR 38) (Eastbound) Umpqua Ave (OR 38) (Westbound) Total Hourly Totals Beginning At Left Thru Right U Left Thru Right U Left Thru Right U Left Thru Right U 11:00 AM :05 AM :10 AM :15 AM :20 AM :25 AM :30 AM :35 AM :40 AM :45 AM :50 AM :55 AM :00 PM :05 PM :10 PM :15 PM :20 PM :25 PM :30 PM :35 PM :40 PM :45 PM :50 PM :55 PM Peak 15-Min Northbound Southbound Eastbound Westbound Flowrates Left Thru Right U Left Thru Right U Left Thru Right U Left Thru Right U Total All Vehicles Heavy Trucks Pedestrians Bicycles Railroad Stopped Buses Comments: Report generated on 6/17/2014 7:18 PM SOURCE: Quality Counts, LLC (
154 Type of peak hour being reported: System Peak Method for determining peak hour: Total Entering Volume LOCATION: N 20th St -- Winchester Ave (Hwy 101) QC JOB #: CITY/STATE: Reedsport, OR DATE: Thu, Jun Peak-Hour: 11:55 AM -- 12:55 PM Peak 15-Min: 12:30 PM -- 12:45 PM NA NA NA NA NA NA NA NA 5-Min Count Period N 20th St (Northbound) N 20th St (Southbound) Winchester Ave (Hwy 101) (Eastbound) Winchester Ave (Hwy 101) (Westbound) Total Hourly Totals Beginning At Left Thru Right U Left Thru Right U Left Thru Right U Left Thru Right U 11:00 AM :05 AM :10 AM :15 AM :20 AM :25 AM :30 AM :35 AM :40 AM :45 AM :50 AM :55 AM :00 PM :05 PM :10 PM :15 PM :20 PM :25 PM :30 PM :35 PM :40 PM :45 PM :50 PM :55 PM Peak 15-Min Northbound Southbound Eastbound Westbound Flowrates Left Thru Right U Left Thru Right U Left Thru Right U Left Thru Right U Total All Vehicles Heavy Trucks Pedestrians Bicycles Railroad Stopped Buses Comments: Report generated on 6/17/2014 7:18 PM SOURCE: Quality Counts, LLC (
155 Type of peak hour being reported: System Peak Method for determining peak hour: Total Entering Volume LOCATION: N 21st St -- Winchester Ave (Hwy 101) QC JOB #: CITY/STATE: Reedsport, OR DATE: Wed, Jun Peak-Hour: 11:55 AM -- 12:55 PM Peak 15-Min: 12:30 PM -- 12:45 PM NA NA NA NA NA NA NA NA 5-Min Count Period N 21st St (Northbound) N 21st St (Southbound) Winchester Ave (Hwy 101) (Eastbound) Winchester Ave (Hwy 101) (Westbound) Total Hourly Totals Beginning At Left Thru Right U Left Thru Right U Left Thru Right U Left Thru Right U 11:00 AM :05 AM :10 AM :15 AM :20 AM :25 AM :30 AM :35 AM :40 AM :45 AM :50 AM :55 AM :00 PM :05 PM :10 PM :15 PM :20 PM :25 PM :30 PM :35 PM :40 PM :45 PM :50 PM :55 PM Peak 15-Min Northbound Southbound Eastbound Westbound Flowrates Left Thru Right U Left Thru Right U Left Thru Right U Left Thru Right U Total All Vehicles Heavy Trucks Pedestrians Bicycles Railroad Stopped Buses Comments: Report generated on 6/17/2014 7:18 PM SOURCE: Quality Counts, LLC (
156 Type of peak hour being reported: System Peak Method for determining peak hour: Total Entering Volume LOCATION: N 3rd St -- Umpqua Ave (OR 38) QC JOB #: CITY/STATE: Reedsport, OR DATE: Wed, Jun Peak-Hour: 4:00 PM -- 5:00 PM Peak 15-Min: 4:30 PM -- 4:45 PM NA NA NA NA NA NA NA NA 5-Min Count Period N 3rd St (Northbound) N 3rd St (Southbound) Umpqua Ave (OR 38) (Eastbound) Umpqua Ave (OR 38) (Westbound) Total Hourly Totals Beginning At Left Thru Right U Left Thru Right U Left Thru Right U Left Thru Right U 4:00 PM :05 PM :10 PM :15 PM :20 PM :25 PM :30 PM :35 PM :40 PM :45 PM :50 PM :55 PM :00 PM :05 PM :10 PM :15 PM :20 PM :25 PM :30 PM :35 PM :40 PM :45 PM :50 PM :55 PM Peak 15-Min Northbound Southbound Eastbound Westbound Flowrates Left Thru Right U Left Thru Right U Left Thru Right U Left Thru Right U Total All Vehicles Heavy Trucks Pedestrians Bicycles Railroad Stopped Buses Comments: Report generated on 6/17/2014 7:19 PM SOURCE: Quality Counts, LLC (
157 Type of peak hour being reported: System Peak Method for determining peak hour: Total Entering Volume LOCATION: Hwy Umpqua Ave (OR 38) QC JOB #: CITY/STATE: Reedsport, OR DATE: Thu, Jun Peak-Hour: 4:00 PM -- 5:00 PM Peak 15-Min: 4:30 PM -- 4:45 PM NA NA NA NA NA NA NA NA 5-Min Count Period Hwy 101 (Northbound) Hwy 101 (Southbound) Umpqua Ave (OR 38) (Eastbound) Umpqua Ave (OR 38) (Westbound) Total Hourly Totals Beginning At Left Thru Right U Left Thru Right U Left Thru Right U Left Thru Right U 4:00 PM :05 PM :10 PM :15 PM :20 PM :25 PM :30 PM :35 PM :40 PM :45 PM :50 PM :55 PM :00 PM :05 PM :10 PM :15 PM :20 PM :25 PM :30 PM :35 PM :40 PM :45 PM :50 PM :55 PM Peak 15-Min Northbound Southbound Eastbound Westbound Flowrates Left Thru Right U Left Thru Right U Left Thru Right U Left Thru Right U Total All Vehicles Heavy Trucks Pedestrians Bicycles Railroad Stopped Buses Comments: Report generated on 6/17/2014 7:19 PM SOURCE: Quality Counts, LLC (
158 Type of peak hour being reported: System Peak Method for determining peak hour: Total Entering Volume LOCATION: N 20th St -- Winchester Ave (Hwy 101) QC JOB #: CITY/STATE: Reedsport, OR DATE: Thu, Jun Peak-Hour: 4:00 PM -- 5:00 PM Peak 15-Min: 4:30 PM -- 4:45 PM NA NA NA NA NA NA NA NA 5-Min Count Period N 20th St (Northbound) N 20th St (Southbound) Winchester Ave (Hwy 101) (Eastbound) Winchester Ave (Hwy 101) (Westbound) Total Hourly Totals Beginning At Left Thru Right U Left Thru Right U Left Thru Right U Left Thru Right U 4:00 PM :05 PM :10 PM :15 PM :20 PM :25 PM :30 PM :35 PM :40 PM :45 PM :50 PM :55 PM :00 PM :05 PM :10 PM :15 PM :20 PM :25 PM :30 PM :35 PM :40 PM :45 PM :50 PM :55 PM Peak 15-Min Northbound Southbound Eastbound Westbound Flowrates Left Thru Right U Left Thru Right U Left Thru Right U Left Thru Right U Total All Vehicles Heavy Trucks Pedestrians Bicycles Railroad Stopped Buses Comments: Report generated on 6/17/2014 7:19 PM SOURCE: Quality Counts, LLC (
159 Type of peak hour being reported: System Peak Method for determining peak hour: Total Entering Volume LOCATION: N 21st St -- Winchester Ave (Hwy 101) QC JOB #: CITY/STATE: Reedsport, OR DATE: Wed, Jun Peak-Hour: 4:00 PM -- 5:00 PM Peak 15-Min: 4:30 PM -- 4:45 PM NA NA NA NA NA NA NA NA 5-Min Count Period N 21st St (Northbound) N 21st St (Southbound) Winchester Ave (Hwy 101) (Eastbound) Winchester Ave (Hwy 101) (Westbound) Total Hourly Totals Beginning At Left Thru Right U Left Thru Right U Left Thru Right U Left Thru Right U 4:00 PM :05 PM :10 PM :15 PM :20 PM :25 PM :30 PM :35 PM :40 PM :45 PM :50 PM :55 PM :00 PM :05 PM :10 PM :15 PM :20 PM :25 PM :30 PM :35 PM :40 PM :45 PM :50 PM :55 PM Peak 15-Min Northbound Southbound Eastbound Westbound Flowrates Left Thru Right U Left Thru Right U Left Thru Right U Left Thru Right U Total All Vehicles Heavy Trucks Pedestrians Bicycles Railroad Stopped Buses Comments: Report generated on 6/17/2014 7:19 PM SOURCE: Quality Counts, LLC (
160 Reedsport Pedestrian Safety Study Executive Summary December 2014 Pedestrian Crossing and Gap Surveys
161 Hwy 101 Pedestrians Btwn Winchester Ave & 13th St 7409 SW Tech Center Dr, Suite B150 Tigard, OR Ph: Hwy 101 Pedestrians Btwn Winchester Ave & 13th St Hwy 101 Pedestrians Btwn Winchester Ave & 13th St 6/11/2014 Westbound Eastbound 6/11/2014 Westbound Eastbound 6/11/2014 Westbound Eastbound 7:00 AM :00 AM 0 0 4:00 PM 0 0 7:05 AM :05 AM 0 0 4:05 PM 0 0 7:10 AM :10 AM 0 0 4:10 PM 0 0 7:15 AM :15 AM 0 0 4:15 PM 0 0 7:20 AM :20 AM 0 0 4:20 PM 0 0 7:25 AM :25 AM 1 0 4:25 PM 0 0 7:30 AM :30 AM 0 0 4:30 PM 0 0 7:35 AM :35 AM 0 0 4:35 PM 0 0 7:40 AM :40 AM 0 0 4:40 PM 0 0 7:45 AM :45 AM 0 0 4:45 PM 0 0 7:50 AM :50 AM 0 0 4:50 PM 0 0 7:55 AM :55 AM 0 0 4:55 PM 0 0 8:00 AM :00 PM 0 0 5:00 PM 0 0 8:05 AM :05 PM 0 0 5:05 PM 0 0 8:10 AM :10 PM 0 0 5:10 PM 0 1 8:15 AM :15 PM 0 0 5:15 PM 0 0 8:20 AM :20 PM 0 0 5:20 PM 0 0 8:25 AM :25 PM 0 0 5:25 PM 0 0 8:30 AM :30 PM 0 0 5:30 PM 0 1 8:35 AM :35 PM 0 0 5:35 PM 1 0 8:40 AM :40 PM 0 0 5:40 PM 0 0 8:45 AM :45 PM 1 0 5:45 PM 0 0 8:50 AM :50 PM 0 0 5:50 PM 1 0 8:55 AM :55 PM 1 0 5:55 PM 0 0 Total: 4 5 Total: 3 0 Total: 2 2 Hwy 101 Pedestrians Btwn 12th St & 10th St Hwy 101 Pedestrians Btwn 12th St & 10th St Hwy 101 Pedestrians Btwn 12th St & 10th St 6/5/2014 Westbound Eastbound 6/5/2014 Westbound Eastbound 6/5/2014 Westbound Eastbound 7:00 AM :00 AM 0 0 4:00 PM 0 0 7:05 AM :05 AM 0 0 4:05 PM 0 0 7:10 AM :10 AM 0 0 4:10 PM 0 0 7:15 AM :15 AM 0 0 4:15 PM 0 0 7:20 AM :20 AM 0 0 4:20 PM 0 0 7:25 AM :25 AM 0 0 4:25 PM 0 0 7:30 AM :30 AM 0 0 4:30 PM 0 0 7:35 AM :35 AM 0 0 4:35 PM 0 0 7:40 AM :40 AM 0 0 4:40 PM 0 0 7:45 AM :45 AM 0 0 4:45 PM 2 0 7:50 AM :50 AM 0 0 4:50 PM 0 0 7:55 AM :55 AM 0 1 4:55 PM 0 0 8:00 AM :00 PM 0 0 5:00 PM 0 0 8:05 AM :05 PM 0 0 5:05 PM 0 0 8:10 AM :10 PM 0 0 5:10 PM 0 0 8:15 AM :15 PM 0 0 5:15 PM 0 0 8:20 AM :20 PM 1 2 5:20 PM 0 0 8:25 AM :25 PM 0 0 5:25 PM 0 0 8:30 AM :30 PM 0 0 5:30 PM 0 0 8:35 AM :35 PM 0 0 5:35 PM 0 0 8:40 AM :40 PM 0 0 5:40 PM 0 0 8:45 AM :45 PM 0 0 5:45 PM 0 0 8:50 AM :50 PM 0 0 5:50 PM 0 0 8:55 AM :55 PM 0 1 5:55 PM 2 0 Total: 4 1 Total: 1 4 Total: 4 0
162 7409 SW Tech Center Dr, Suite B150 Tigard, OR Ph: Winchester Ave (Hwy 101) Pedestrians Winchester Ave (Hwy 101) Pedestrians Winchester Ave (Hwy 101) Btwn 22nd St & 21st St Btwn 22nd St & 21st St Btwn 22nd St & 21st St 22nd St WB 21st St EB 22nd St WB 21st St EB 22nd St WB 21st St EB Jaywalkers Jaywalkers Jaywalkers 6/11/2014 Crosswalk Crosswalk 6/11/2014 Crosswalk Crosswalk 6/11/2014 Crosswalk Crosswalk 7:00 AM :00 AM :00 PM :05 AM :05 AM :05 PM :10 AM :10 AM :10 PM :15 AM :15 AM :15 PM :20 AM :20 AM :20 PM :25 AM :25 AM :25 PM :30 AM :30 AM :30 PM :35 AM :35 AM :35 PM :40 AM :40 AM :40 PM :45 AM :45 AM :45 PM :50 AM :50 AM :50 PM :55 AM :55 AM :55 PM :00 AM :00 PM :00 PM :05 AM :05 PM :05 PM :10 AM :10 PM :10 PM :15 AM :15 PM :15 PM :20 AM :20 PM :20 PM :25 AM :25 PM :25 PM :30 AM :30 PM :30 PM :35 AM :35 PM :35 PM :40 AM :40 PM :40 PM :45 AM :45 PM :45 PM :50 AM :50 PM :50 PM :55 AM :55 PM :55 PM Total: Total: Total: Fir Ave (OR 38) Pedestrians Btwn 5th St & 4th St Fir Ave (OR 38) Pedestrians Btwn 5th St & 4th St Fir Ave (OR 38) Pedestrians Btwn 5th St & 4th St 5th St WB 4th St EB 5th St WB 4th St EB 5th St WB 4th St EB Jaywalkers Jaywalkers Jaywalkers 6/11/2014 Crosswalk Crosswalk 6/11/2014 Crosswalk Crosswalk 6/11/2014 Crosswalk Crosswalk 7:00 AM :00 AM :00 PM :05 AM :05 AM :05 PM :10 AM :10 AM :10 PM :15 AM :15 AM :15 PM :20 AM :20 AM :20 PM :25 AM :25 AM :25 PM :30 AM :30 AM :30 PM :35 AM :35 AM :35 PM :40 AM :40 AM :40 PM :45 AM :45 AM :45 PM :50 AM :50 AM :50 PM :55 AM :55 AM :55 PM :00 AM :00 PM :00 PM :05 AM :05 PM :05 PM :10 AM :10 PM :10 PM :15 AM :15 PM :15 PM :20 AM :20 PM :20 PM :25 AM :25 PM :25 PM :30 AM :30 PM :30 PM :35 AM :35 PM :35 PM :40 AM :40 PM :40 PM :45 AM :45 PM :45 PM :50 AM :50 PM :50 PM :55 AM :55 PM :55 PM Total: Total: Total: 2 0 3
163 Reedsport Pedestrian Safety Study Executive Summary December 2014 Level of Service Descriptions
164 TRAFFIC LEVELS OF SERVICE Analysis of traffic volumes is useful in understanding the general nature of traffic in an area, but by itself indicates neither the ability of the street network to carry additional traffic nor the quality of service afforded by the street facilities. For this, the concept of level of service has been developed to subjectively describe traffic performance. Level of service can be measured at intersections and along key roadway segments. Level of service categories are similar to report card ratings for traffic performance. Intersections are typically the controlling bottlenecks of traffic flow and the ability of a roadway system to carry traffic efficiently is generally diminished in their vicinities. Levels of Service A, B and C indicate conditions where traffic moves without significant delays over periods of peak travel demand. Level of service D and E are progressively worse peak hour operating conditions and F conditions represent where demand exceeds the capacity of an intersection. Most urban communities set level of service D as the minimum acceptable level of service for peak hour operation and plan for level of service C or better for all other times of the day. The Highway Capacity Manual provides level of service calculation methodology for both intersections and arterials. 1 The following two sections provide interpretations of the analysis approaches Highway Capacity Manual, Transportation Research Board, Washington D.C., 2000, Chapters 16 and 17.
165 UNSIGNALIZED INTERSECTIONS (Two-Way Stop Controlled) Unsignalized intersection level of service is reported for the major street and minor street (generally, left turn movements). The method assesses available and critical gaps in the traffic stream which make it possible for side street traffic to enter the main street flow. The 2000 Highway Capacity Manual describes the detailed methodology. It is not unusual for an intersection to experience level of service E or F conditions for the minor street left turn movement. It should be understood that, often, a poor level of service is experienced by only a few vehicles and the intersection as a whole operates acceptably. Unsignalized intersection levels of service are described in the following table. Level of Service Expected Delay (Sec/Veh) A Little or no delay B Short traffic delay > C Average traffic delays > D Long traffic delays > E Very long traffic delays > F Extreme delays potentially affecting > 50 other traffic movements in the intersection Source: 2000 Highway Capacity Manual, Transportation Research Board Washington, D.C.
166 SIGNALIZED INTERSECTIONS For signalized intersections, level of service is evaluated based upon average vehicle delay experienced by vehicles entering an intersection. Control delay (or signal delay) includes initial deceleration delay, queue move-up time, stopped delay, and final acceleration delay. In previous versions of this chapter of the HCM (1994 and earlier), delay included only stopped delay. As delay increases, the level of service decreases. Calculations for signalized and unsignalized intersections are different due to the variation in traffic control. The 2000 Highway Capacity Manual provides the basis for these calculations. Level of Delay Service (secs.) Description A <10.00 Free Flow/Insignificant Delays: No approach phase is fully utilized by traffic and no vehicle waits longer than one red indication. Most vehicles do not stop at all. Progression is extremely favorable and most vehicles arrive during the green phase. B Stable Operation/Minimal Delays: An occasional approach phase is fully utilized. Many drivers begin to feel somewhat restricted within platoons of vehicles. This level generally occurs with good progression, short cycle lengths, or both. C Stable Operation/Acceptable Delays: Major approach phases fully utilized. Most drivers feel somewhat restricted. Higher delays may result from fair progression, longer cycle lengths, or both. Individual cycle failures may begin to appear at this level, and the number of vehicles stopping is significant. D Approaching Unstable/Tolerable Delays: The influence of congestion becomes more noticeable. Drivers may have to wait through more than one red signal indication. Longer delays may result from some combination of unfavorable progression, long cycle lengths, or high v/c ratios. The proportion of vehicles not stopping declines, and individual cycle failures are noticeable. E Unstable Operation/Significant Delays: Volumes at or near capacity. Vehicles may wait though several signal cycles. Long queues form upstream from intersection. These high delay values generally indicate poor progression, long cycle lengths, and high v/c ratios. Individual cycle failures are a frequent occurrence. F >80.0 Forced Flow/Excessive Delays: Represents jammed conditions. Queues may block upstream intersections. This level occurs when arrival flow rates exceed intersection capacity, and is considered to be unacceptable to most drivers. Poor progression, long cycle lengths, and v/c ratios approaching 1.0 may contribute to these high delay levels. Source: 2000 Highway Capacity Manual, Transportation Research Board, Washington D.C.
167 Reedsport Pedestrian Safety Study Executive Summary December 2014 HCM Intersection Analysis
168 HCM Unsignalized Intersection Capacity Analysis 2014 Future Mid 1: Hwy 101 & 21st Street Reedsport Pedestrian Safety Study HCM Unsignalized Intersection Capacity Analysis 2014 Future Mid 2: Hwy 101 & 20th Street Reedsport Pedestrian Safety Study Movement EBL EBT EBR WBL WBT WBR NBL NBT NBR SBL SBT SBR Lane Configurations Volume (veh/h) Sign Control Free Free Stop Stop Grade 0% 0% 0% 0% Peak Hour Factor Hourly flow rate (vph) Pedestrians Lane Width (ft) Walking Speed (ft/s) Percent Blockage Right turn flare (veh) Median type None None Median storage veh) Upstream signal (ft) 416 px, platoon unblocked vc, conflicting volume vc1, stage 1 conf vol vc2, stage 2 conf vol vcu, unblocked vol tc, single (s) tc, 2 stage (s) tf (s) p0 queue free % cm capacity (veh/h) Direction, Lane # EB 1 EB 2 WB 1 WB 2 NB 1 SB 1 Volume Total Volume Left Volume Right csh Volume to Capacity Queue Length 95th (ft) Control Delay (s) Lane LOS A A B C Approach Delay (s) Approach LOS B C Intersection Summary Average Delay 0.4 Intersection Capacity Utilization 44.5% ICU Level of Service A Analysis Period (min) 15 Movement EBL EBT EBR WBL WBT WBR NBL NBT NBR SBL SBT SBR Lane Configurations Volume (veh/h) Sign Control Free Free Stop Stop Grade 0% 0% 0% 0% Peak Hour Factor Hourly flow rate (vph) Pedestrians Lane Width (ft) Walking Speed (ft/s) Percent Blockage Right turn flare (veh) Median type None None Median storage veh) Upstream signal (ft) 827 px, platoon unblocked vc, conflicting volume vc1, stage 1 conf vol vc2, stage 2 conf vol vcu, unblocked vol tc, single (s) tc, 2 stage (s) tf (s) p0 queue free % cm capacity (veh/h) Direction, Lane # EB 1 EB 2 WB 1 WB 2 NB 1 SB 1 Volume Total Volume Left Volume Right csh Volume to Capacity Queue Length 95th (ft) Control Delay (s) Lane LOS A A B C Approach Delay (s) Approach LOS B C Intersection Summary Average Delay 1.0 Intersection Capacity Utilization 46.0% ICU Level of Service A Analysis Period (min) 15 DKS Associates Synchro 8 Report 6/26/2014 Page 1 DKS Associates Synchro 8 Report 6/26/2014 Page 2
169 HCM Signalized Intersection Capacity Analysis 2014 Future Mid 3: Hwy 101 & Port Dock Road/OR 38 Reedsport Pedestrian Safety Study HCM Unsignalized Intersection Capacity Analysis 2014 Future Mid 4: OR 38 & 3rd Street Reedsport Pedestrian Safety Study Movement EBL EBT EBR WBL WBT WBR NBL NBT NBR SBL SBT SBR Lane Configurations Volume (vph) Ideal Flow (vphpl) Total Lost time (s) Lane Util. Factor Frpb, ped/bikes Flpb, ped/bikes Frt Flt Protected Satd. Flow (prot) Flt Permitted Satd. Flow (perm) Peak-hour factor, PHF Adj. Flow (vph) RTOR Reduction (vph) Lane Group Flow (vph) Confl. Peds. (#/hr) Confl. Bikes (#/hr) 1 Heavy Vehicles (%) 17% 11% 12% 16% 50% 19% 9% 12% 12% 15% 15% 40% Turn Type Perm NA Perm NA Prot NA Prot NA Protected Phases Permitted Phases 4 8 Actuated Green, G (s) Effective Green, g (s) Actuated g/c Ratio Clearance Time (s) Vehicle Extension (s) Lane Grp Cap (vph) v/s Ratio Prot 0.03 c0.13 c v/s Ratio Perm 0.03 c0.28 v/c Ratio Uniform Delay, d Progression Factor Incremental Delay, d Delay (s) Level of Service B D D B D B Approach Delay (s) Approach LOS B D B B Intersection Summary HCM 2000 Control Delay 21.7 HCM 2000 Level of Service C HCM 2000 Volume to Capacity ratio 0.57 Actuated Cycle Length (s) 63.9 Sum of lost time (s) 13.5 Intersection Capacity Utilization 52.0% ICU Level of Service A Analysis Period (min) 15 c Critical Lane Group Movement EBL EBT EBR WBL WBT WBR NBL NBT NBR SBL SBT SBR Lane Configurations Volume (veh/h) Sign Control Free Free Stop Stop Grade 0% 0% 0% 0% Peak Hour Factor Hourly flow rate (vph) Pedestrians Lane Width (ft) Walking Speed (ft/s) Percent Blockage Right turn flare (veh) Median type None None Median storage veh) Upstream signal (ft) px, platoon unblocked vc, conflicting volume vc1, stage 1 conf vol vc2, stage 2 conf vol vcu, unblocked vol tc, single (s) tc, 2 stage (s) tf (s) p0 queue free % cm capacity (veh/h) Direction, Lane # EB 1 WB 1 NB 1 SB 1 Volume Total Volume Left Volume Right csh Volume to Capacity Queue Length 95th (ft) Control Delay (s) Lane LOS A A B B Approach Delay (s) Approach LOS B B Intersection Summary Average Delay 3.0 Intersection Capacity Utilization 43.0% ICU Level of Service A Analysis Period (min) 15 DKS Associates Synchro 8 Report 6/26/2014 Page 3 DKS Associates Synchro 8 Report 6/26/2014 Page 4
170 HCM Unsignalized Intersection Capacity Analysis 2014 Seasonal Balanced PM 1: Hwy 101 & 21st Street Reedsport Pedestrian Safety Study HCM Unsignalized Intersection Capacity Analysis 2014 Seasonal Balanced PM 2: Hwy 101 & 20th Street Reedsport Pedestrian Safety Study Movement EBL EBT EBR WBL WBT WBR NBL NBT NBR SBL SBT SBR Lane Configurations Volume (veh/h) Sign Control Free Free Stop Stop Grade 0% 0% 0% 0% Peak Hour Factor Hourly flow rate (vph) Pedestrians Lane Width (ft) Walking Speed (ft/s) Percent Blockage Right turn flare (veh) Median type None None Median storage veh) Upstream signal (ft) 416 px, platoon unblocked vc, conflicting volume vc1, stage 1 conf vol vc2, stage 2 conf vol vcu, unblocked vol tc, single (s) tc, 2 stage (s) tf (s) p0 queue free % cm capacity (veh/h) Direction, Lane # EB 1 EB 2 WB 1 WB 2 NB 1 SB 1 Volume Total Volume Left Volume Right csh Volume to Capacity Queue Length 95th (ft) Control Delay (s) Lane LOS A A C A Approach Delay (s) Approach LOS C A Intersection Summary Average Delay 0.6 Intersection Capacity Utilization 38.1% ICU Level of Service A Analysis Period (min) 15 Movement EBL EBT EBR WBL WBT WBR NBL NBT NBR SBL SBT SBR Lane Configurations Volume (veh/h) Sign Control Free Free Stop Stop Grade 0% 0% 0% 0% Peak Hour Factor Hourly flow rate (vph) Pedestrians Lane Width (ft) Walking Speed (ft/s) Percent Blockage Right turn flare (veh) Median type None None Median storage veh) Upstream signal (ft) 827 px, platoon unblocked vc, conflicting volume vc1, stage 1 conf vol vc2, stage 2 conf vol vcu, unblocked vol tc, single (s) tc, 2 stage (s) tf (s) p0 queue free % cm capacity (veh/h) Direction, Lane # EB 1 EB 2 WB 1 WB 2 NB 1 SB 1 Volume Total Volume Left Volume Right csh Volume to Capacity Queue Length 95th (ft) Control Delay (s) Lane LOS A A B C Approach Delay (s) Approach LOS B C Intersection Summary Average Delay 0.8 Intersection Capacity Utilization 31.8% ICU Level of Service A Analysis Period (min) 15 DKS Associates Synchro 8 Report 6/26/2014 Page 1 DKS Associates Synchro 8 Report 6/26/2014 Page 2
171 HCM Signalized Intersection Capacity Analysis 2014 Seasonal Balanced PM 3: Hwy 101 & Port Dock Road/OR 38 Reedsport Pedestrian Safety Study HCM Unsignalized Intersection Capacity Analysis 2014 Seasonal Balanced PM 4: OR 38 & 3rd Street Reedsport Pedestrian Safety Study Movement EBL EBT EBR WBL WBT WBR NBL NBT NBR SBL SBT SBR Lane Configurations Volume (vph) Ideal Flow (vphpl) Total Lost time (s) Lane Util. Factor Frt Flt Protected Satd. Flow (prot) Flt Permitted Satd. Flow (perm) Peak-hour factor, PHF Adj. Flow (vph) RTOR Reduction (vph) Lane Group Flow (vph) Heavy Vehicles (%) 50% 25% 33% 17% 17% 0% 2% 13% 13% 21% 16% 20% Turn Type Perm NA Perm NA Prot NA Prot NA Protected Phases Permitted Phases 4 8 Actuated Green, G (s) Effective Green, g (s) Actuated g/c Ratio Clearance Time (s) Vehicle Extension (s) Lane Grp Cap (vph) v/s Ratio Prot c0.03 c v/s Ratio Perm 0.01 c0.13 v/c Ratio Uniform Delay, d Progression Factor Incremental Delay, d Delay (s) Level of Service B C C A D A Approach Delay (s) Approach LOS B C B B Intersection Summary HCM 2000 Control Delay 15.4 HCM 2000 Level of Service B HCM 2000 Volume to Capacity ratio 0.32 Actuated Cycle Length (s) 56.5 Sum of lost time (s) 13.5 Intersection Capacity Utilization 38.6% ICU Level of Service A Analysis Period (min) 15 c Critical Lane Group Movement EBL EBT EBR WBL WBT WBR NBL NBT NBR SBL SBT SBR Lane Configurations Volume (veh/h) Sign Control Free Free Stop Stop Grade 0% 0% 0% 0% Peak Hour Factor Hourly flow rate (vph) Pedestrians 2 2 Lane Width (ft) Walking Speed (ft/s) Percent Blockage 0 0 Right turn flare (veh) Median type None None Median storage veh) Upstream signal (ft) px, platoon unblocked vc, conflicting volume vc1, stage 1 conf vol vc2, stage 2 conf vol vcu, unblocked vol tc, single (s) tc, 2 stage (s) tf (s) p0 queue free % cm capacity (veh/h) Direction, Lane # EB 1 WB 1 NB 1 SB 1 Volume Total Volume Left Volume Right csh Volume to Capacity Queue Length 95th (ft) Control Delay (s) Lane LOS A B A Approach Delay (s) Approach LOS B A Intersection Summary Average Delay 2.9 Intersection Capacity Utilization 28.6% ICU Level of Service A Analysis Period (min) 15 DKS Associates Synchro 8 Report 6/26/2014 Page 3 DKS Associates Synchro 8 Report 6/26/2014 Page 4
172 HCM Unsignalized Intersection Capacity Analysis 2014 Existing PM 1: 21st Street Reedsport Pedestrian Safety Study Movement EBL EBT EBR WBL WBT WBR NBL NBT NBR SBL SBT SBR Lane Configurations Volume (veh/h) Sign Control Free Free Stop Stop Grade 0% 0% 0% 0% Peak Hour Factor Hourly flow rate (vph) Pedestrians Lane Width (ft) Walking Speed (ft/s) Percent Blockage Right turn flare (veh) Median type None None Median storage veh) Upstream signal (ft) 416 px, platoon unblocked vc, conflicting volume vc1, stage 1 conf vol vc2, stage 2 conf vol vcu, unblocked vol tc, single (s) tc, 2 stage (s) tf (s) p0 queue free % cm capacity (veh/h) Direction, Lane # EB 1 EB 2 WB 1 WB 2 NB 1 SB 1 Volume Total Volume Left Volume Right csh Volume to Capacity Queue Length 95th (ft) Control Delay (s) Lane LOS A A B C Approach Delay (s) Approach LOS B C Intersection Summary Average Delay 0.6 Intersection Capacity Utilization 41.7% ICU Level of Service A Analysis Period (min) 15 DKS Associates Synchro 8 Report 6/25/2014 Page 1
173 HCM Unsignalized Intersection Capacity Analysis 2014 Existing PM 2: 20th Street Reedsport Pedestrian Safety Study Movement EBL EBT EBR WBL WBT WBR NBL NBT NBR SBL SBT SBR Lane Configurations Volume (veh/h) Sign Control Free Free Stop Stop Grade 0% 0% 0% 0% Peak Hour Factor Hourly flow rate (vph) Pedestrians Lane Width (ft) Walking Speed (ft/s) Percent Blockage Right turn flare (veh) Median type None None Median storage veh) Upstream signal (ft) 827 px, platoon unblocked vc, conflicting volume vc1, stage 1 conf vol vc2, stage 2 conf vol vcu, unblocked vol tc, single (s) tc, 2 stage (s) tf (s) p0 queue free % cm capacity (veh/h) Direction, Lane # EB 1 EB 2 WB 1 WB 2 NB 1 SB 1 Volume Total Volume Left Volume Right csh Volume to Capacity Queue Length 95th (ft) Control Delay (s) Lane LOS A A B C Approach Delay (s) Approach LOS B C Intersection Summary Average Delay 1.2 Intersection Capacity Utilization 43.4% ICU Level of Service A Analysis Period (min) 15 DKS Associates Synchro 8 Report 6/25/2014 Page 2
174 HCM Signalized Intersection Capacity Analysis 2014 Existing PM 3: Port Dock Road/OR 38 & Hwy 101 Reedsport Pedestrian Safety Study Movement EBL EBT EBR WBL WBT WBR NBL NBT NBR SBL SBT SBR Lane Configurations Volume (vph) Ideal Flow (vphpl) Total Lost time (s) Lane Util. Factor Frpb, ped/bikes Flpb, ped/bikes Frt Flt Protected Satd. Flow (prot) Flt Permitted Satd. Flow (perm) Peak-hour factor, PHF Adj. Flow (vph) RTOR Reduction (vph) Lane Group Flow (vph) Confl. Peds. (#/hr) Confl. Bikes (#/hr) 2 1 Heavy Vehicles (%) 10% 33% 6% 11% 0% 8% 10% 8% 12% 9% 7% 27% Turn Type Perm NA Perm NA Prot NA Prot NA Protected Phases Permitted Phases 4 8 Actuated Green, G (s) Effective Green, g (s) Actuated g/c Ratio Clearance Time (s) Vehicle Extension (s) Lane Grp Cap (vph) v/s Ratio Prot 0.02 c0.11 c v/s Ratio Perm 0.03 c0.21 v/c Ratio Uniform Delay, d Progression Factor Incremental Delay, d Delay (s) Level of Service B C E B C A Approach Delay (s) Approach LOS B C B B Intersection Summary HCM 2000 Control Delay 17.3 HCM 2000 Level of Service B HCM 2000 Volume to Capacity ratio 0.44 Actuated Cycle Length (s) 60.5 Sum of lost time (s) 13.5 Intersection Capacity Utilization 53.9% ICU Level of Service A Analysis Period (min) 15 c Critical Lane Group DKS Associates Synchro 8 Report 6/25/2014 Page 3
175 HCM Unsignalized Intersection Capacity Analysis 2014 Existing PM 4: OR 38 & 3rd Street Reedsport Pedestrian Safety Study Movement EBL EBT EBR WBL WBT WBR NBL NBT NBR SBL SBT SBR Lane Configurations Volume (veh/h) Sign Control Free Free Stop Stop Grade 0% 0% 0% 0% Peak Hour Factor Hourly flow rate (vph) Pedestrians Lane Width (ft) Walking Speed (ft/s) Percent Blockage Right turn flare (veh) Median type None None Median storage veh) Upstream signal (ft) px, platoon unblocked vc, conflicting volume vc1, stage 1 conf vol vc2, stage 2 conf vol vcu, unblocked vol tc, single (s) tc, 2 stage (s) tf (s) p0 queue free % cm capacity (veh/h) Direction, Lane # EB 1 WB 1 NB 1 SB 1 Volume Total Volume Left Volume Right csh Volume to Capacity Queue Length 95th (ft) Control Delay (s) Lane LOS A A B B Approach Delay (s) Approach LOS B B Intersection Summary Average Delay 3.0 Intersection Capacity Utilization 36.0% ICU Level of Service A Analysis Period (min) 15 DKS Associates Synchro 8 Report 6/25/2014 Page 4
176 HCM Unsignalized Intersection Capacity Analysis 2014 Existing Mid 1: 21st Street Reedsport Pedestrian Safety Study Movement EBL EBT EBR WBL WBT WBR NBL NBT NBR SBL SBT SBR Lane Configurations Volume (veh/h) Sign Control Free Free Stop Stop Grade 0% 0% 0% 0% Peak Hour Factor Hourly flow rate (vph) Pedestrians Lane Width (ft) Walking Speed (ft/s) Percent Blockage Right turn flare (veh) Median type None None Median storage veh) Upstream signal (ft) 416 px, platoon unblocked vc, conflicting volume vc1, stage 1 conf vol vc2, stage 2 conf vol vcu, unblocked vol tc, single (s) tc, 2 stage (s) tf (s) p0 queue free % cm capacity (veh/h) Direction, Lane # EB 1 EB 2 WB 1 WB 2 NB 1 SB 1 Volume Total Volume Left Volume Right csh Volume to Capacity Queue Length 95th (ft) Control Delay (s) Lane LOS A A B C Approach Delay (s) Approach LOS B C Intersection Summary Average Delay 0.4 Intersection Capacity Utilization 38.8% ICU Level of Service A Analysis Period (min) 15 DKS Associates Synchro 8 Report 6/25/2014 Page 1
177 HCM Unsignalized Intersection Capacity Analysis 2014 Existing Mid 2: 20th Street Reedsport Pedestrian Safety Study Movement EBL EBT EBR WBL WBT WBR NBL NBT NBR SBL SBT SBR Lane Configurations Volume (veh/h) Sign Control Free Free Stop Stop Grade 0% 0% 0% 0% Peak Hour Factor Hourly flow rate (vph) Pedestrians Lane Width (ft) Walking Speed (ft/s) Percent Blockage Right turn flare (veh) Median type None None Median storage veh) Upstream signal (ft) 827 px, platoon unblocked vc, conflicting volume vc1, stage 1 conf vol vc2, stage 2 conf vol vcu, unblocked vol tc, single (s) tc, 2 stage (s) tf (s) p0 queue free % cm capacity (veh/h) Direction, Lane # EB 1 EB 2 WB 1 WB 2 NB 1 SB 1 Volume Total Volume Left Volume Right csh Volume to Capacity Queue Length 95th (ft) Control Delay (s) Lane LOS A A C C Approach Delay (s) Approach LOS C C Intersection Summary Average Delay 0.9 Intersection Capacity Utilization 38.8% ICU Level of Service A Analysis Period (min) 15 DKS Associates Synchro 8 Report 6/25/2014 Page 2
178 HCM Signalized Intersection Capacity Analysis 2014 Existing Mid 3: Port Dock Road/OR 38 & Hwy 101 Reedsport Pedestrian Safety Study Movement EBL EBT EBR WBL WBT WBR NBL NBT NBR SBL SBT SBR Lane Configurations Volume (vph) Ideal Flow (vphpl) Total Lost time (s) Lane Util. Factor Frpb, ped/bikes Flpb, ped/bikes Frt Flt Protected Satd. Flow (prot) Flt Permitted Satd. Flow (perm) Peak-hour factor, PHF Adj. Flow (vph) RTOR Reduction (vph) Lane Group Flow (vph) Confl. Peds. (#/hr) Confl. Bikes (#/hr) 1 Heavy Vehicles (%) 17% 11% 12% 16% 50% 19% 9% 12% 12% 15% 15% 40% Turn Type Perm NA Perm NA Prot NA Prot NA Protected Phases Permitted Phases 4 8 Actuated Green, G (s) Effective Green, g (s) Actuated g/c Ratio Clearance Time (s) Vehicle Extension (s) Lane Grp Cap (vph) v/s Ratio Prot 0.02 c0.11 c v/s Ratio Perm 0.02 c0.21 v/c Ratio Uniform Delay, d Progression Factor Incremental Delay, d Delay (s) Level of Service B C E B E A Approach Delay (s) Approach LOS B C B B Intersection Summary HCM 2000 Control Delay 18.4 HCM 2000 Level of Service B HCM 2000 Volume to Capacity ratio 0.44 Actuated Cycle Length (s) 58.5 Sum of lost time (s) 13.5 Intersection Capacity Utilization 45.1% ICU Level of Service A Analysis Period (min) 15 c Critical Lane Group DKS Associates Synchro 8 Report 6/25/2014 Page 3
179 HCM Unsignalized Intersection Capacity Analysis 2014 Existing Mid 4: OR 38 & 3rd Street Reedsport Pedestrian Safety Study Movement EBL EBT EBR WBL WBT WBR NBL NBT NBR SBL SBT SBR Lane Configurations Volume (veh/h) Sign Control Free Free Stop Stop Grade 0% 0% 0% 0% Peak Hour Factor Hourly flow rate (vph) Pedestrians Lane Width (ft) Walking Speed (ft/s) Percent Blockage Right turn flare (veh) Median type None None Median storage veh) Upstream signal (ft) px, platoon unblocked vc, conflicting volume vc1, stage 1 conf vol vc2, stage 2 conf vol vcu, unblocked vol tc, single (s) tc, 2 stage (s) tf (s) p0 queue free % cm capacity (veh/h) Direction, Lane # EB 1 WB 1 NB 1 SB 1 Volume Total Volume Left Volume Right csh Volume to Capacity Queue Length 95th (ft) Control Delay (s) Lane LOS A A B A Approach Delay (s) Approach LOS B A Intersection Summary Average Delay 2.6 Intersection Capacity Utilization 38.4% ICU Level of Service A Analysis Period (min) 15 DKS Associates Synchro 8 Report 6/25/2014 Page 4
180 HCM Unsignalized Intersection Capacity Analysis 2014 Existing AM 1: 21st Street Reedsport Pedestrian Safety Study Movement EBL EBT EBR WBL WBT WBR NBL NBT NBR SBL SBT SBR Lane Configurations Volume (veh/h) Sign Control Free Free Stop Stop Grade 0% 0% 0% 0% Peak Hour Factor Hourly flow rate (vph) Pedestrians Lane Width (ft) Walking Speed (ft/s) Percent Blockage Right turn flare (veh) Median type None None Median storage veh) Upstream signal (ft) 416 px, platoon unblocked vc, conflicting volume vc1, stage 1 conf vol vc2, stage 2 conf vol vcu, unblocked vol tc, single (s) tc, 2 stage (s) tf (s) p0 queue free % cm capacity (veh/h) Direction, Lane # EB 1 EB 2 WB 1 WB 2 NB 1 SB 1 Volume Total Volume Left Volume Right csh Volume to Capacity Queue Length 95th (ft) Control Delay (s) Lane LOS A A B C Approach Delay (s) Approach LOS B C Intersection Summary Average Delay 0.6 Intersection Capacity Utilization 33.9% ICU Level of Service A Analysis Period (min) 15 DKS Associates Synchro 8 Report 6/25/2014 Page 1
181 HCM Unsignalized Intersection Capacity Analysis 2014 Existing AM 2: 20th Street Reedsport Pedestrian Safety Study Movement EBL EBT EBR WBL WBT WBR NBL NBT NBR SBL SBT SBR Lane Configurations Volume (veh/h) Sign Control Free Free Stop Stop Grade 0% 0% 0% 0% Peak Hour Factor Hourly flow rate (vph) Pedestrians Lane Width (ft) Walking Speed (ft/s) Percent Blockage Right turn flare (veh) Median type None None Median storage veh) Upstream signal (ft) 827 px, platoon unblocked vc, conflicting volume vc1, stage 1 conf vol vc2, stage 2 conf vol vcu, unblocked vol tc, single (s) tc, 2 stage (s) tf (s) p0 queue free % cm capacity (veh/h) Direction, Lane # EB 1 EB 2 WB 1 WB 2 NB 1 SB 1 Volume Total Volume Left Volume Right csh Volume to Capacity Queue Length 95th (ft) Control Delay (s) Lane LOS A A B C Approach Delay (s) Approach LOS B C Intersection Summary Average Delay 0.7 Intersection Capacity Utilization 28.6% ICU Level of Service A Analysis Period (min) 15 DKS Associates Synchro 8 Report 6/25/2014 Page 2
182 HCM Signalized Intersection Capacity Analysis 2014 Existing AM 3: Port Dock Road/OR 38 & Hwy 101 Reedsport Pedestrian Safety Study Movement EBL EBT EBR WBL WBT WBR NBL NBT NBR SBL SBT SBR Lane Configurations Volume (vph) Ideal Flow (vphpl) Total Lost time (s) Lane Util. Factor Frt Flt Protected Satd. Flow (prot) Flt Permitted Satd. Flow (perm) Peak-hour factor, PHF Adj. Flow (vph) RTOR Reduction (vph) Lane Group Flow (vph) Heavy Vehicles (%) 50% 25% 33% 17% 17% 0% 2% 13% 13% 21% 16% 20% Turn Type Perm NA Perm NA Prot NA Prot NA Protected Phases Permitted Phases 4 8 Actuated Green, G (s) Effective Green, g (s) Actuated g/c Ratio Clearance Time (s) Vehicle Extension (s) Lane Grp Cap (vph) v/s Ratio Prot c0.03 c v/s Ratio Perm 0.01 c0.09 v/c Ratio Uniform Delay, d Progression Factor Incremental Delay, d Delay (s) Level of Service B C E A F A Approach Delay (s) Approach LOS B C B C Intersection Summary HCM 2000 Control Delay 20.7 HCM 2000 Level of Service C HCM 2000 Volume to Capacity ratio 0.25 Actuated Cycle Length (s) 53.4 Sum of lost time (s) 13.5 Intersection Capacity Utilization 36.1% ICU Level of Service A Analysis Period (min) 15 c Critical Lane Group DKS Associates Synchro 8 Report 6/25/2014 Page 3
183 HCM Unsignalized Intersection Capacity Analysis 2014 Existing AM 4: OR 38 & 3rd Street Reedsport Pedestrian Safety Study Movement EBL EBT EBR WBL WBT WBR NBL NBT NBR SBL SBT SBR Lane Configurations Volume (veh/h) Sign Control Free Free Stop Stop Grade 0% 0% 0% 0% Peak Hour Factor Hourly flow rate (vph) Pedestrians 2 2 Lane Width (ft) Walking Speed (ft/s) Percent Blockage 0 0 Right turn flare (veh) Median type None None Median storage veh) Upstream signal (ft) px, platoon unblocked vc, conflicting volume vc1, stage 1 conf vol vc2, stage 2 conf vol vcu, unblocked vol tc, single (s) tc, 2 stage (s) tf (s) p0 queue free % cm capacity (veh/h) Direction, Lane # EB 1 WB 1 NB 1 SB 1 Volume Total Volume Left Volume Right csh Volume to Capacity Queue Length 95th (ft) Control Delay (s) Lane LOS A A A A Approach Delay (s) Approach LOS A A Intersection Summary Average Delay 2.8 Intersection Capacity Utilization 25.1% ICU Level of Service A Analysis Period (min) 15 DKS Associates Synchro 8 Report 6/25/2014 Page 4
184 HCM Signalized Intersection Capacity Analysis 2014 Existing AM 5: 22nd Street Reedsport Pedestrian Safety Study Movement EBL EBT EBR WBL WBT WBR NBL NBT NBR SBL SBT SBR Lane Configurations Volume (vph) Ideal Flow (vphpl) Total Lost time (s) Lane Util. Factor Frt Flt Protected Satd. Flow (prot) Flt Permitted Satd. Flow (perm) Peak-hour factor, PHF Adj. Flow (vph) RTOR Reduction (vph) Lane Group Flow (vph) Turn Type Prot Prot Perm Perm Protected Phases Permitted Phases 8 4 Actuated Green, G (s) Effective Green, g (s) Actuated g/c Ratio Clearance Time (s) Vehicle Extension (s) Lane Grp Cap (vph) v/s Ratio Prot v/s Ratio Perm v/c Ratio Uniform Delay, d1 Progression Factor Incremental Delay, d2 Delay (s) Level of Service Approach Delay (s) Approach LOS A A A A Intersection Summary HCM 2000 Control Delay 0.0 HCM 2000 Level of Service A HCM 2000 Volume to Capacity ratio 0.00 Actuated Cycle Length (s) 65.0 Sum of lost time (s) 13.5 Intersection Capacity Utilization 0.0% ICU Level of Service A Analysis Period (min) 15 c Critical Lane Group DKS Associates Synchro 8 Report 6/25/2014 Page 5
185 HCM 2010 TWSC 2014 Future PM 1: Hwy 101 & 21st Street Reedsport Pedestrian Safety Study HCM 2010 TWSC 2014 Future PM 2: Hwy 101 & 20th Street Reedsport Pedestrian Safety Study Intersection Intersection Delay, s/veh 0.7 Movement EBL EBT EBR WBL WBT WBR NBL NBT NBR SBL SBT SBR Vol, veh/h Conflicting Peds, #/hr Sign Control Free Free Free Free Free Free Stop Stop Stop Stop Stop Stop RT Channelized - - None - - None - - None - - None Storage Length Veh in Median Storage, # Grade, % Peak Hour Factor Heavy Vehicles, % Mvmt Flow Major/Minor Major1 Major2 Minor1 Minor2 Conflicting Flow All Stage Stage Follow-up Headway Pot Capacity-1 Maneuver Stage Stage Time blocked-platoon, % Mov Capacity-1 Maneuver Mov Capacity-2 Maneuver Stage Stage Approach EB WB NB SB HCM Control Delay, s Minor Lane / Major Mvmt NBLn1 EBL EBT EBR WBL WBT WBR SBLn1 Capacity (veh/h) HCM Lane V/C Ratio HCM Control Delay (s) HCM Lane LOS B A A A A C HCM 95th %tile Q(veh) Notes ~ : Volume Exceeds Capacity; $ : Delay Exceeds 300 Seconds; Error : Computation Not Defined Intersection Intersection Delay, s/veh 1.4 Movement EBL EBT EBR WBL WBT WBR NBL NBT NBR SBL SBT SBR Vol, veh/h Conflicting Peds, #/hr Sign Control Free Free Free Free Free Free Stop Stop Stop Stop Stop Stop RT Channelized - - None - - None - - None - - None Storage Length Veh in Median Storage, # Grade, % Peak Hour Factor Heavy Vehicles, % Mvmt Flow Major/Minor Major1 Major2 Minor1 Minor2 Conflicting Flow All Stage Stage Follow-up Headway Pot Capacity-1 Maneuver Stage Stage Time blocked-platoon, % Mov Capacity-1 Maneuver Mov Capacity-2 Maneuver Stage Stage Approach EB WB NB SB HCM Control Delay, s Minor Lane / Major Mvmt NBLn1 EBL EBT EBR WBL WBT WBR SBLn1 Capacity (veh/h) HCM Lane V/C Ratio HCM Control Delay (s) HCM Lane LOS C A A A A D HCM 95th %tile Q(veh) Notes ~ : Volume Exceeds Capacity; $ : Delay Exceeds 300 Seconds; Error : Computation Not Defined DKS Associates Synchro 8 Report 8/18/2014 Page 1 DKS Associates Synchro 8 Report 8/18/2014 Page 2
186 HCM Signalized Intersection Capacity Analysis 2014 Future PM 3: Hwy 101 & Port Dock Road/OR 38 Reedsport Pedestrian Safety Study HCM 2010 TWSC 2014 Future PM 3: Hwy 101 & Port Dock Road/OR 38 Reedsport Pedestrian Safety Study Movement EBL EBT EBR WBL WBT WBR NBL NBT NBR SBL SBT SBR Lane Configurations Volume (vph) Ideal Flow (vphpl) Total Lost time (s) Lane Util. Factor Frpb, ped/bikes Flpb, ped/bikes Frt Flt Protected Satd. Flow (prot) Flt Permitted Satd. Flow (perm) Peak-hour factor, PHF Adj. Flow (vph) RTOR Reduction (vph) Lane Group Flow (vph) Confl. Peds. (#/hr) Confl. Bikes (#/hr) 2 1 Heavy Vehicles (%) 10% 33% 6% 11% 0% 8% 10% 8% 12% 9% 7% 27% Turn Type Perm NA Perm NA Prot NA Prot NA Protected Phases Permitted Phases 4 8 Actuated Green, G (s) Effective Green, g (s) Actuated g/c Ratio Clearance Time (s) Vehicle Extension (s) Lane Grp Cap (vph) v/s Ratio Prot 0.03 c0.12 c v/s Ratio Perm 0.04 c0.24 v/c Ratio Uniform Delay, d Progression Factor Incremental Delay, d Delay (s) Level of Service B C F B D B Approach Delay (s) Approach LOS B C B B Intersection Summary HCM 2000 Control Delay 20.2 HCM 2000 Level of Service C HCM 2000 Volume to Capacity ratio 0.50 Actuated Cycle Length (s) 62.2 Sum of lost time (s) 13.5 Intersection Capacity Utilization 59.0% ICU Level of Service B Analysis Period (min) 15 c Critical Lane Group Two Way Analysis cannot be performed on Signalized Intersection. DKS Associates Synchro 8 Report 8/18/2014 Page 3 DKS Associates Synchro 8 Report 8/18/2014 Page 4
187 HCM 2010 TWSC 2014 Future PM 4: OR 38 & 3rd Street Reedsport Pedestrian Safety Study HCM Signalized Intersection Capacity Analysis 2014 Future PM 5: Hwy 101 & 22nd Street Reedsport Pedestrian Safety Study Intersection Intersection Delay, s/veh 2.8 Movement EBL EBT EBR WBL WBT WBR NBL NBT NBR SBL SBT SBR Vol, veh/h Conflicting Peds, #/hr Sign Control Free Free Free Free Free Free Stop Stop Stop Stop Stop Stop RT Channelized - - None - - None - - None - - None Storage Length Veh in Median Storage, # Grade, % Peak Hour Factor Heavy Vehicles, % Mvmt Flow Major/Minor Major1 Major2 Minor1 Minor2 Conflicting Flow All Stage Stage Follow-up Headway Pot Capacity-1 Maneuver Stage Stage Time blocked-platoon, % Mov Capacity-1 Maneuver Mov Capacity-2 Maneuver Stage Stage Approach EB WB NB SB HCM Control Delay, s Minor Lane / Major Mvmt NBLn1 EBL EBT EBR WBL WBT WBR SBLn1 Capacity (veh/h) HCM Lane V/C Ratio HCM Control Delay (s) HCM Lane LOS B A A A A B HCM 95th %tile Q(veh) Notes ~ : Volume Exceeds Capacity; $ : Delay Exceeds 300 Seconds; Error : Computation Not Defined Movement EBL EBT EBR WBL WBT WBR NBL NBT NBR SBL SBT SBR Lane Configurations Volume (vph) Ideal Flow (vphpl) Total Lost time (s) Lane Util. Factor Frt Flt Protected Satd. Flow (prot) Flt Permitted Satd. Flow (perm) Peak-hour factor, PHF Adj. Flow (vph) RTOR Reduction (vph) Lane Group Flow (vph) Turn Type Prot Prot Perm Perm Protected Phases Permitted Phases 8 4 Actuated Green, G (s) Effective Green, g (s) Actuated g/c Ratio Clearance Time (s) Vehicle Extension (s) Lane Grp Cap (vph) v/s Ratio Prot v/s Ratio Perm v/c Ratio Uniform Delay, d1 Progression Factor Incremental Delay, d2 Delay (s) Level of Service Approach Delay (s) Approach LOS A A A A Intersection Summary HCM 2000 Control Delay 0.0 HCM 2000 Level of Service A HCM 2000 Volume to Capacity ratio 0.00 Actuated Cycle Length (s) 65.0 Sum of lost time (s) 13.5 Intersection Capacity Utilization 0.0% ICU Level of Service A Analysis Period (min) 15 c Critical Lane Group DKS Associates Synchro 8 Report 8/18/2014 Page 5 DKS Associates Synchro 8 Report 8/18/2014 Page 6
188 HCM 2010 TWSC 2014 Future PM (45% Growth) 1: Hwy 101 & 21st Street Reedsport Pedestrian Safety Study Intersection Intersection Delay, s/veh 0.7 Movement EBL EBT EBR WBL WBT WBR NBL NBT NBR SBL SBT SBR Vol, veh/h Conflicting Peds, #/hr Sign Control Free Free Free Free Free Free Stop Stop Stop Stop Stop Stop RT Channelized - - None - - None - - None - - None Storage Length Veh in Median Storage, # Grade, % Peak Hour Factor Heavy Vehicles, % Mvmt Flow Major/Minor Major1 Major2 Minor1 Minor2 Conflicting Flow All Stage Stage Follow-up Headway Pot Capacity-1 Maneuver Stage Stage Time blocked-platoon, % Mov Capacity-1 Maneuver Mov Capacity-2 Maneuver Stage Stage Approach EB WB NB SB HCM Control Delay, s Minor Lane / Major Mvmt NBLn1 EBL EBT EBR WBL WBT WBR SBLn1 Capacity (veh/h) HCM Lane V/C Ratio HCM Control Delay (s) HCM Lane LOS B B A B A E HCM 95th %tile Q(veh) Notes ~ : Volume Exceeds Capacity; $ : Delay Exceeds 300 Seconds; Error : Computation Not Defined DKS Associates Synchro 8 Report 12/12/2014 Page 1
189 HCM 2010 TWSC 2014 Future PM (45% Growth) 2: Hwy 101 & 20th Street Reedsport Pedestrian Safety Study Intersection Intersection Delay, s/veh 1.9 Movement EBL EBT EBR WBL WBT WBR NBL NBT NBR SBL SBT SBR Vol, veh/h Conflicting Peds, #/hr Sign Control Free Free Free Free Free Free Stop Stop Stop Stop Stop Stop RT Channelized - - None - - None - - None - - None Storage Length Veh in Median Storage, # Grade, % Peak Hour Factor Heavy Vehicles, % Mvmt Flow Major/Minor Major1 Major2 Minor1 Minor2 Conflicting Flow All Stage Stage Follow-up Headway Pot Capacity-1 Maneuver Stage Stage Time blocked-platoon, % Mov Capacity-1 Maneuver Mov Capacity-2 Maneuver Stage Stage Approach EB WB NB SB HCM Control Delay, s Minor Lane / Major Mvmt NBLn1 EBL EBT EBR WBL WBT WBR SBLn1 Capacity (veh/h) HCM Lane V/C Ratio HCM Control Delay (s) HCM Lane LOS B B A B A F HCM 95th %tile Q(veh) Notes ~ : Volume Exceeds Capacity; $ : Delay Exceeds 300 Seconds; Error : Computation Not Defined DKS Associates Synchro 8 Report 12/12/2014 Page 2
190 HCM Signalized Intersection Capacity Analysis 2014 Future PM (45% Growth) 3: Hwy 101 & Port Dock Road/OR 38 Reedsport Pedestrian Safety Study Movement EBL EBT EBR WBL WBT WBR NBL NBT NBR SBL SBT SBR Lane Configurations Volume (vph) Ideal Flow (vphpl) Total Lost time (s) Lane Util. Factor Frpb, ped/bikes Flpb, ped/bikes Frt Flt Protected Satd. Flow (prot) Flt Permitted Satd. Flow (perm) Peak-hour factor, PHF Adj. Flow (vph) RTOR Reduction (vph) Lane Group Flow (vph) Confl. Peds. (#/hr) Confl. Bikes (#/hr) 1 Heavy Vehicles (%) 17% 11% 12% 16% 50% 19% 9% 12% 12% 15% 15% 40% Turn Type Perm NA Perm NA Prot NA Prot NA Protected Phases Permitted Phases 4 8 Actuated Green, G (s) Effective Green, g (s) Actuated g/c Ratio Clearance Time (s) Vehicle Extension (s) Lane Grp Cap (vph) v/s Ratio Prot 0.04 c0.18 c v/s Ratio Perm 0.04 c0.41 v/c Ratio Uniform Delay, d Progression Factor Incremental Delay, d Delay (s) Level of Service B F F B E B Approach Delay (s) Approach LOS B F C C Intersection Summary HCM 2000 Control Delay 38.7 HCM 2000 Level of Service D HCM 2000 Volume to Capacity ratio 0.78 Actuated Cycle Length (s) 71.1 Sum of lost time (s) 13.5 Intersection Capacity Utilization 70.1% ICU Level of Service C Analysis Period (min) 15 c Critical Lane Group DKS Associates Synchro 8 Report 12/12/2014 Page 3
191 HCM 2010 TWSC 2014 Future PM (45% Growth) 4: OR 38 & 3rd Street Reedsport Pedestrian Safety Study Intersection Intersection Delay, s/veh 3.3 Movement EBL EBT EBR WBL WBT WBR NBL NBT NBR SBL SBT SBR Vol, veh/h Conflicting Peds, #/hr Sign Control Free Free Free Free Free Free Stop Stop Stop Stop Stop Stop RT Channelized - - None - - None - - None - - None Storage Length Veh in Median Storage, # Grade, % Peak Hour Factor Heavy Vehicles, % Mvmt Flow Major/Minor Major1 Major2 Minor1 Minor2 Conflicting Flow All Stage Stage Follow-up Headway Pot Capacity-1 Maneuver Stage Stage Time blocked-platoon, % Mov Capacity-1 Maneuver Mov Capacity-2 Maneuver Stage Stage Approach EB WB NB SB HCM Control Delay, s Minor Lane / Major Mvmt NBLn1 EBL EBT EBR WBL WBT WBR SBLn1 Capacity (veh/h) HCM Lane V/C Ratio HCM Control Delay (s) HCM Lane LOS C A A A A B HCM 95th %tile Q(veh) Notes ~ : Volume Exceeds Capacity; $ : Delay Exceeds 300 Seconds; Error : Computation Not Defined DKS Associates Synchro 8 Report 12/12/2014 Page 5
192 HCM Signalized Intersection Capacity Analysis 2014 Future PM (45% Growth) 5: Hwy 101 & 22nd Street Reedsport Pedestrian Safety Study Movement EBL EBT EBR WBL WBT WBR NBL NBT NBR SBL SBT SBR Lane Configurations Volume (vph) Ideal Flow (vphpl) Total Lost time (s) Lane Util. Factor Frt Flt Protected Satd. Flow (prot) Flt Permitted Satd. Flow (perm) Peak-hour factor, PHF Adj. Flow (vph) RTOR Reduction (vph) Lane Group Flow (vph) Turn Type Prot Prot Perm Perm Protected Phases Permitted Phases 8 4 Actuated Green, G (s) Effective Green, g (s) Actuated g/c Ratio Clearance Time (s) Vehicle Extension (s) Lane Grp Cap (vph) v/s Ratio Prot v/s Ratio Perm v/c Ratio Uniform Delay, d1 Progression Factor Incremental Delay, d2 Delay (s) Level of Service Approach Delay (s) Approach LOS A A A A Intersection Summary HCM 2000 Control Delay 0.0 HCM 2000 Level of Service A HCM 2000 Volume to Capacity ratio 0.00 Actuated Cycle Length (s) 65.0 Sum of lost time (s) 13.5 Intersection Capacity Utilization 0.0% ICU Level of Service A Analysis Period (min) 15 c Critical Lane Group DKS Associates Synchro 8 Report 12/12/2014 Page 6
193 Reedsport Pedestrian Safety Study Executive Summary December 2014 ODOT Collision Data
194 ODOT Collision Data ( ) Serial # Crash Date 1st Street 2nd Street Dir. Coll Type Severity Weather Surf Light 835 9/8/ TH ST WINCHESTER AVE SE HEAD PDO CLEAR DRY DAYLIGHT 801 8/30/2013 WINCHESTER AVE 18TH ST NE REAR PDO CLEAR DRY DAYLIGHT 805 8/30/2013 FIR AVE 4TH ST CN TURN PDO CLEAR DRY DAYLIGHT 506 6/20/2013 OREGON COAST HY 11TH ST NE REAR INJ CLEAR DRY DAYLIGHT 210 3/7/2013 RANCH RD EVERGREEN LP SW SS O PDO CLOUDY WET DAYLIGHT 207 3/6/2013 OREGON COAST HY 13TH ST CN ANGL INJ RAIN WET DAYLIGHT 198 3/3/2013 FRONTAGE RD 22ND ST CN TURN PDO CLEAR DRY DAYLIGHT 153 2/15/ ND ST WINCHESTER AVE SE HEAD PDO CLOUDY WET DARK NO ST LIGHTS 723 2/13/2013 WINCHESTER AVE 19TH ST CN ANGL PDO CLEAR DRY DAYLIGHT /13/2013 WINCHESTER AVE 19TH ST NE TURN PDO CLEAR DRY DAYLIGHT 65 1/18/2013 WINCHESTER AVE 20TH ST SW REAR INJ CLEAR DRY DAYLIGHT /27/2012 WINCHESTER AVE 21ST ST NE REAR PDO CLEAR DRY DAYLIGHT /25/2012 OREGON COAST HY 10TH ST CN TURN INJ RAIN WET DAYLIGHT /12/2012 WINCHESTER AVE 20TH ST NE REAR PDO RAIN WET DAYLIGHT /7/2012 OREGON COAST HY 14TH ST CN TURN PDO RAIN WET DAYLIGHT /2/2012 WINCHESTER AVE 22ND ST CN PED INJ CLEAR WET DAYLIGHT /18/2012 WINCHESTER AVE 22ND ST SW REAR PDO CLEAR DRY DAYLIGHT /1/2012 REGENTS PL RANCH RD CN TURN PDO CLEAR DRY DAYLIGHT 911 9/23/2012 WINCHESTER AVE 16TH ST SW REAR INJ CLEAR DRY DAYLIGHT 897 9/20/2012 LONGWOOD DR HIGHLANDS DR SW FIX PDO CLEAR DRY DAYLIGHT 789 8/21/2012 MYRTLE AVE OREGON COAST HY W REAR PDO CLEAR DRY DAYLIGHT 705 7/27/2012 OREGON COAST HY 14TH ST NE REAR INJ CLEAR DRY DAYLIGHT 679 7/19/2012 MYRTLE AVE UMPQUA AVE CN TURN PDO CLEAR DRY DAYLIGHT 483 5/30/2012 UMPQUA AVE W RAILROAD AVE CN ANGL INJ CLEAR DRY DAYLIGHT 440 5/16/2012 WINCHESTER AVE 21ST ST SW REAR INJ CLEAR DRY DAYLIGHT 363 4/25/2012 ELM AVE 22ND ST CN TURN INJ RAIN WET DAYLIGHT 327 4/12/2012 OREGON COAST HY 13TH ST NE TURN PDO RAIN WET DAYLIGHT 194 2/27/2012 WINCHESTER AVE 22ND ST CN TURN PDO CLEAR DRY DAYLIGHT 188 2/22/2012 WINCHESTER AVE 16TH ST SW REAR PDO UNKNOWN UNKNOWN DAYLIGHT 113 1/31/2012 OREGON COAST HY 14TH ST NE SS O INJ CLEAR DRY DAYLIGHT 83 1/20/2012 MILL AVE 8TH ST W TURN PDO CLOUDY WET DARK NO ST LIGHTS 24 1/8/2012 WINCHESTER AVE 22ND ST NE REAR INJ CLEAR DRY DAYLIGHT /22/ TH ST ELM AVE NW ANGL INJ CLOUDY DRY DAYLIGHT /5/2011 WINCHESTER AVE 22ND ST NE PED INJ CLEAR DRY DAYLIGHT /29/2011 OREGON COAST HY 13TH ST W REAR INJ RAIN WET DAYLIGHT 937 9/28/2011 LONGWOOD DR WINCHESTER AVE CN TURN INJ CLEAR DRY DAYLIGHT 616 7/10/2011 LAUREL AVE 9TH ST W PARK PDO CLEAR DRY DAYLIGHT 471 6/1/2011 ELM AVE 20TH ST NE TURN PDO CLOUDY DRY DAYLIGHT 462 5/27/2011 WINCHESTER AVE 21ST ST NE REAR PDO CLEAR DRY DAYLIGHT 430 5/15/2011 WINCHESTER AVE 16TH ST CN TURN PDO RAIN WET DAYLIGHT 376 4/28/2011 OREGON COAST HY UMPQUA AVE CN TURN INJ RAIN WET DAYLIGHT 418 4/24/2011 FIR AVE 20TH ST SW FIX INJ RAIN WET DARK NO ST LIGHTS 342 4/14/2011 FRONTAGE RD 22ND ST SW TURN PDO CLEAR DRY DAYLIGHT 327 4/11/2011 OREGON COAST HY WINCHESTER AVE NE TURN PDO CLEAR DRY DAYLIGHT 274 3/26/2011 OREGON COAST HY WINCHESTER AVE CN ANGL PDO RAIN WET DAYLIGHT 227 3/14/2011 WINCHESTER AVE 19TH ST CN TURN PDO CLEAR DRY DAYLIGHT
195 ODOT Collision Data ( ) Serial # Crash Date 1st Street 2nd Street Dir. Coll Type Severity Weather Surf Light 190 3/2/2011 OREGON COAST HY JUNIPER AVE SW REAR INJ RAIN WET DAYLIGHT 78 1/25/2011 ARTHUR DR LONGWOOD DR SE SS O PDO CLEAR DRY DARK NO ST LIGHTS /15/2010 WINCHESTER AVE 16TH ST CN TURN PDO RAIN WET DUSK /13/2010 FIR AVE NE REAR INJ RAIN WET DAYLIGHT /8/2010 RANCH RD RIDGEWAY DR CN ANGL PDO CLEAR DRY DAYLIGHT /3/2010 E RAILROAD AVE UMPQUA AVE SE TURN PDO CLEAR WET DAYLIGHT /31/2010 OREGON COAST HY UMPQUA AVE SE FIX PDO RAIN WET DUSK /21/2010 UMPQUA AVE W RAILROAD AVE NW REAR PDO UNKNOWN UNKNOWN DARK ST LIGHTS /22/2010 OREGON COAST HY 13TH ST NE SS O PDO CLEAR DRY DAYLIGHT 729 8/7/2010 OREGON COAST HY 10TH ST SW REAR INJ CLEAR DRY DARK ST LIGHTS 779 8/4/2010 WINCHESTER AVE 20TH ST CN TURN INJ CLEAR DRY DAYLIGHT 447 5/18/2010 WINCHESTER AVE 22ND ST SW REAR INJ RAIN WET DAYLIGHT 398 5/3/2010 WINCHESTER AVE 18TH ST NE REAR PDO RAIN WET DAYLIGHT 179 3/14/2010 BOWMAN RD ROWE ST N FIX PDO CLEAR DRY DAYLIGHT 122 2/26/2010 FRONTAGE RD RANCH RD NE FIX PDO CLEAR WET DARK ST LIGHTS /6/2009 WINCHESTER AVE 21ST ST SW REAR INJ RAIN WET DARK NO ST LIGHTS /25/2009 MYRTLE AVE UMPQUA AVE W REAR PDO CLEAR DRY DAYLIGHT /2/2009 JUNIPER AVE 10TH ST E REAR PDO CLEAR DRY DAYLIGHT 922 9/16/2009 FRONTAGE RD RANCH RD CN ANGL PDO RAIN WET DAYLIGHT 789 8/27/2009 WINCHESTER AVE 21ST ST SW REAR INJ CLEAR DRY DAYLIGHT 757 8/23/2009 WINCHESTER AVE 20TH ST NE REAR PDO CLEAR DRY DAYLIGHT 724 8/8/2009 FIR AVE 5TH ST NE REAR PDO CLEAR DRY DAYLIGHT 596 7/14/2009 WINCHESTER AVE 19TH ST NE REAR PDO CLEAR DRY DAYLIGHT 582 7/8/2009 GREENBRIAR ST WARD WAY SW SS O INJ CLEAR DRY DARK ST LIGHTS 555 6/30/2009 JUNIPER AVE 9TH ST W BACK INJ CLEAR DRY DAYLIGHT 573 6/15/2009 OREGON COAST HY 13TH ST NE PED INJ CLEAR DRY DAYLIGHT 560 6/15/2009 WINCHESTER AVE 16TH ST SW REAR INJ CLEAR DRY DAYLIGHT 528 6/7/2009 WINCHESTER AVE 19TH ST CN ANGL PDO CLEAR DRY DAYLIGHT 467 6/1/2009 WINCHESTER AVE 19TH ST CN TURN INJ CLEAR DRY DAYLIGHT 425 5/18/ TH ST OREGON COAST HY NW FIX PDO CLEAR DRY DAYLIGHT 367 5/9/2009 JUNIPER AVE 10TH ST W SS O INJ CLEAR DRY DARK ST LIGHTS 278 4/4/2009 FIR AVE W RAILROAD AVE SW FIX INJ CLEAR ICE DARK NO ST LIGHTS 275 4/3/2009 FOREST HILL RD RIDGEWAY DR SW FIX PDO CLEAR DRY DUSK 173 3/7/2009 OREGON COAST HY 12TH ST CN TURN PDO RAIN WET DAYLIGHT 187 3/2/2009 WINCHESTER AVE 22ND ST SW OTH PDO RAIN WET DUSK 85 1/27/2009 WINCHESTER AVE 3RD ST CN TURN INJ RAIN WET DAYLIGHT /31/2008 OREGON COAST HY WINCHESTER AVE NE TURN INJ RAIN WET DAYLIGHT /29/2008 WINCHESTER AVE 22ND ST SW REAR PDO CLEAR DRY DARK NO ST LIGHTS /1/2008 WINCHESTER AVE 19TH ST CN TURN INJ CLEAR DRY DAYLIGHT 731 8/12/2008 OREGON COAST HY 11TH ST SW REAR PDO CLEAR DRY DAYLIGHT 661 7/25/2008 OREGON COAST HY NB EF UMPQUA AVE E REAR INJ CLEAR DRY DAYLIGHT 522 6/28/2008 WINCHESTER AVE 22ND ST CN TURN PDO CLEAR DRY DARK NO ST LIGHTS 509 6/14/2008 WINCHESTER AVE 16TH ST SW FIX INJ CLEAR DRY DAYLIGHT 578 6/2/2008 WINCHESTER AVE 13TH ST NE BACK PDO UNKNOWN UNKNOWN DAYLIGHT 356 4/24/2008 FIR AVE WINCHESTER AVE E TURN PDO CLEAR DRY DAYLIGHT 295 3/23/2008 FIR AVE WINCHESTER AVE E FIX PDO RAIN WET DAYLIGHT
196 ODOT Collision Data ( ) Serial # Crash Date 1st Street 2nd Street Dir. Coll Type Severity Weather Surf Light 277 3/13/2008 WINCHESTER AVE 22ND ST CN TURN INJ RAIN WET DAYLIGHT 198 2/26/2008 7TH ST MILL AVE N REAR PDO CLEAR DRY DARK ST LIGHTS 130 2/16/2008 WINCHESTER AVE 20TH ST NE ANGL INJ CLEAR DRY DAYLIGHT
197 Reedsport Pedestrian Safety Study Executive Summary December 2014 NCHRP Guidelines for Pedestrian Crossing Treatments
198 Key This spreadsheet combines Worksheet 1 and Worksheet 2 (Appendix A, pages 69-70) of TCRP Report 112/NCHRP Report 562 (Improving Pedestrian Safety at Unsignalized Intersections ) into an electronic format. This spreadsheet should be used in conjunction with, and not independent of, Appendix A documentation. This spreadsheet is still under development, please inform TTI if errors are identified. Blue fields contain descriptive information. Green fields are required and must be completed. Tan fields are adjustments that are filled out only under certain conditions (follow instructions to the left of the cell). Gray fields are automatically calculated and should not be edited. Analyst and Site Information Analyst Analysis Date June 29, 2014 Data Collection Date July 5, 2014 Step 1: Select worksheet: Posted or statutory speed limit (or 85th percentile speed) on the major street (mph) Major Street Minor Street or Location 20th Street (Option A) Peak Hour 1a 30 Is the population of the surrounding area <10,000? (enter YES or NO ) 1b NO Step 2: Does the crossing meet minimum pedestrian volumes to be considered for a traffic control device? Peak-hour pedestrian volume (ped/h), V p 2a 22 Result: Go to step 3. Step 3: Does the crossing meet the pedestrian warrant for a traffic signal? Major road volume, total of both approaches during peak hour (veh/h), V maj-s 3a 1340 [Calculated automatically] Preliminary (before min. threshold) peak hour pedestrian volume to meet warrant 3b 158 [Calculated automatically] Minimum required peak hour pedestrian volume to meet traffic signal warrant 3c 158 Is 15th percentile crossing speed of pedestrians less than 3.5 ft/s (1.1 m/s)? (enter YES or NO ) 3d NO If 15th percentile crossing speed of pedestrians is less than 3.5 ft/s (1.1 m/s), then reduce 3c by up to 50%. % rate of reduction for 3c (up to 50%) Reduced value or 3c 3e 3f 158 Result: The signal warrant is not met. Go to step 4. Step 4: Estimate pedestrian delay. Pedestrian crossing distance, curb to curb (ft), L Pedestrian walking speed (ft/s), S p (suggested speed = 3.5 ft/s) Pedestrian start-up time and end clearance time (s), t s (suggested start-up time = 3 sec) 4a 28 4b 3.5 4c 3 [Calculated automatically] Critical gap required for crossing pedestrian (s), t c 4d 11 Major road volume, total both approaches OR approach being crossed if raised median island is present, during peak hour (veh/h), V maj-d 4e 670 Major road flow rate (veh/s), v 4f 0.19 Average pedestrian delay (s/person), d p 4g 26 Total pedestrian delay (h), D p The value in 4h is the calculated estimated delay for all pedestrians crossing the 4h 0.2 major roadway without a crossing treatment (assumes 0% compliance). If the actual total pedestrian delay has been measured at the site, that value can be entered in 4i to replace the calculated value in 4h. 4i Step 5: Select treatment based up on total pedestrian delay and expected motorist compliance. Expected motorist compliance at pedestrian crossings in region: enter HIGH for High Compliance or LOW for Low Compliance 5a LOW Treatment Category: GUIDELINES FOR PEDESTRIAN CROSSING TREATMENTS DKS Associates US 101 Midday CROSSWALK Pedestrian Volume Crossing Major Road (ped/h) Major Road Volume (veh/h) No Treatment Crosswalk Active/Enhanced Red Signal (proposed) Because the volume in Step 4e is different from the volume in Step 3a, the graph may show a different result than the Treatment Category above. This worksheet provides general recommendations on pedestrian crossing treatments to consider at unsignalized intersections; in all cases, engineering judgment should be used in selecting a specific treatment for installation. This worksheet does not apply to school crossings. In addition to the results provided by this worksheet, users should consider whether a pedestrian treatment could present an increased safety risk to pedestrians, such as where there is poor sight distance, complex geometrics, or nearby traffic signals. Spreadsheet developed by Texas Transportation Institute Printed 1/23/2015 PED-CROSSING v 0.5 (Released August 2007)
199 Key This spreadsheet combines Worksheet 1 and Worksheet 2 (Appendix A, pages 69-70) of TCRP Report 112/NCHRP Report 562 (Improving Pedestrian Safety at Unsignalized Intersections ) into an electronic format. This spreadsheet should be used in conjunction with, and not independent of, Appendix A documentation. This spreadsheet is still under development, please inform TTI if errors are identified. Blue fields contain descriptive information. Green fields are required and must be completed. Tan fields are adjustments that are filled out only under certain conditions (follow instructions to the left of the cell). Gray fields are automatically calculated and should not be edited. Analyst and Site Information Analyst Analysis Date GUIDELINES FOR PEDESTRIAN CROSSING TREATMENTS DKS Associates June 29, 2014 Major Street Minor Street or Location 20th Street (Option B) 1a 30 Is the population of the surrounding area <10,000? (enter YES or NO ) 1b NO Step 2: Does the crossing meet minimum pedestrian volumes to be considered for a traffic control device? Peak-hour pedestrian volume (ped/h), V p 2a 22 Result: Go to step 3. Step 3: Does the crossing meet the pedestrian warrant for a traffic signal? Major road volume, total of both approaches during peak hour (veh/h), V maj-s 3a 1340 [Calculated automatically] Preliminary (before min. threshold) peak hour pedestrian volume to meet warrant 3b 158 US 101 Data Collection Date July 5, 2014 Peak Hour Midday Step 1: Select worksheet: Posted or statutory speed limit (or 85th percentile speed) on the major street (mph) [Calculated automatically] Minimum required peak hour pedestrian volume to meet traffic signal warrant Is 15th percentile crossing speed of pedestrians less than 3.5 ft/s (1.1 m/s)? (enter YES or NO ) If 15th percentile crossing speed of pedestrians is less than 3.5 ft/s % rate of reduction for 3c (up to 50%) (1.1 m/s), then reduce 3c by up to 50%. Reduced value or 3c Result: The signal warrant is not met. Go to step 4. Step 4: Estimate pedestrian delay. Pedestrian crossing distance, curb to curb (ft), L Pedestrian walking speed (ft/s), S p (suggested speed = 3.5 ft/s) Pedestrian start-up time and end clearance time (s), t s (suggested start-up time = 3 sec) Treatment Category: RED 3c 158 3d NO 3e 3f 158 4a 50 4b 3.5 4c 3 [Calculated automatically] Critical gap required for crossing pedestrian (s), t c 4d 17 Major road volume, total both approaches OR approach being crossed if raised median island is present, during peak hour (veh/h), V maj-d 4e 1340 Major road flow rate (veh/s), v 4f 0.37 Average pedestrian delay (s/person), d p 4g 1600 Total pedestrian delay (h), D p The value in 4h is the calculated estimated delay for all pedestrians crossing the 4h 9.8 major roadway without a crossing treatment (assumes 0% compliance). If the actual total pedestrian delay has been measured at the site, that value can be entered in 4i to replace the calculated value in 4h. 4i Step 5: Select treatment based up on total pedestrian delay and expected motorist compliance. Expected motorist compliance at pedestrian crossings in region: enter HIGH for High Compliance or LOW for Low Compliance 5a LOW Pedestrian Volume Crossing Major Road (ped/h) Major Road Volume (veh/h) No Treatment Crosswalk Active/Enhanced Red Signal (proposed) This worksheet provides general recommendations on pedestrian crossing treatments to consider at unsignalized intersections; in all cases, engineering judgment should be used in selecting a specific treatment for installation. This worksheet does not apply to school crossings. In addition to the results provided by this worksheet, users should consider whether a pedestrian treatment could present an increased safety risk to pedestrians, such as where there is poor sight distance, complex geometrics, or nearby traffic signals. Spreadsheet developed by Texas Transportation Institute Printed 1/23/2015 PED-CROSSING v 0.5 (Released August 2007)
200 Key GUIDELINES FOR PEDESTRIAN CROSSING TREATMENTS This spreadsheet combines Worksheet 1 and Worksheet 2 (Appendix A, pages 69-70) of TCRP Report 112/NCHRP Report 562 (Improving Pedestrian Safety at Unsignalized Intersections ) into an electronic format. This spreadsheet should be used in conjunction with, and not independent of, Appendix A documentation. This spreadsheet is still under development, please inform TTI if errors are identified. Blue fields contain descriptive information. Green fields are required and must be completed. Tan fields are adjustments that are filled out only under certain conditions (follow instructions to the left of the cell). Gray fields are automatically calculated and should not be edited. Analyst and Site Information Analyst DKS Associates Major Street US 101 Analysis Date June 29, 2014 Minor Street or Location 20th Street (Option C) Data Collection Date July 5, 2014 Peak Hour Midday Step 1: Select worksheet: Posted or statutory speed limit (or 85th percentile speed) on the major street (mph) 1a 30 Is the population of the surrounding area <10,000? (enter YES or NO ) 1b NO Step 2: Does the crossing meet minimum pedestrian volumes to be considered for a traffic control device? Peak-hour pedestrian volume (ped/h), V p 2a 22 Result: Go to step 3. Step 3: Does the crossing meet the pedestrian warrant for a traffic signal? Major road volume, total of both approaches during peak hour (veh/h), V maj-s 3a 1340 [Calculated automatically] Preliminary (before min. threshold) peak hour pedestrian volume to meet warrant 3b 158 [Calculated automatically] Minimum required peak hour pedestrian volume to meet traffic signal warrant 3c 158 Is 15th percentile crossing speed of pedestrians less than 3.5 ft/s (1.1 m/s)? (enter YES or NO ) 3d NO If 15th percentile crossing speed of pedestrians is less than 3.5 ft/s (1.1 m/s), then reduce 3c by up to 50%. % rate of reduction for 3c (up to 50%) Reduced value or 3c 3e 3f 158 Result: The signal warrant is not met. Go to step 4. Step 4: Estimate pedestrian delay. Pedestrian crossing distance, curb to curb (ft), L Pedestrian walking speed (ft/s), S p (suggested speed = 3.5 ft/s) Pedestrian start-up time and end clearance time (s), t s (suggested start-up time = 3 sec) 4a 20 4b 3.5 4c 3 4d 9 [Calculated automatically] Critical gap required for crossing pedestrian (s), t c Major road volume, total both approaches OR approach being crossed if raised median island is present, during peak hour (veh/h), V maj-d 4e 670 Major road flow rate (veh/s), v 4f 0.19 Average pedestrian delay (s/person), d p 4g 14 Total pedestrian delay (h), D p The value in 4h is the calculated estimated delay for all pedestrians crossing the 4h 0.1 major roadway without a crossing treatment (assumes 0% compliance). If the actual total pedestrian delay has been measured at the site, that value can be entered in 4i to replace the calculated value in 4h. 4i Step 5: Select treatment based up on total pedestrian delay and expected motorist compliance. Expected motorist compliance at pedestrian crossings in region: enter HIGH for High Compliance or LOW for Low Compliance 5a LOW Treatment Category: CROSSWALK Pedestrian Volume Crossing Major Road (ped/h) Major Road Volume (veh/h) No Treatment Crosswalk Active/Enhanced Red Signal (proposed) Because the volume in Step 4e is different from the volume in Step 3a, the graph may show a different result than the Treatment Category above. This worksheet provides general recommendations on pedestrian crossing treatments to consider at unsignalized intersections; in all cases, engineering judgment should be used in selecting a specific treatment for installation. This worksheet does not apply to school crossings. In addition to the results provided by this worksheet, users should consider whether a pedestrian treatment could present an increased safety risk to pedestrians, such as where there is poor sight distance, complex geometrics, or nearby traffic signals. Spreadsheet developed by Texas Transportation Institute Printed 1/23/2015 PED-CROSSING v 0.5 (Released August 2007)
201 Reedsport Pedestrian Safety Study Executive Summary December 2014 Three-Lane Conversion Capacity Reports
202 HCM 2010 TWSC 2014 Seasonal Balanced PM (3-Ln) 1: Hwy 101 & 21st Street Reedsport Pedestrian Safety Study Intersection Intersection Delay, s/veh 0.8 Movement EBL EBT EBR WBL WBT WBR NBL NBT NBR SBL SBT SBR Vol, veh/h Conflicting Peds, #/hr Sign Control Free Free Free Free Free Free Stop Stop Stop Stop Stop Stop RT Channelized - - None - - None - - None - - None Storage Length Veh in Median Storage, # Grade, % Peak Hour Factor Heavy Vehicles, % Mvmt Flow Major/Minor Major1 Major2 Minor1 Minor2 Conflicting Flow All Stage Stage Follow-up Headway Pot Capacity-1 Maneuver Stage Stage Time blocked-platoon, % Mov Capacity-1 Maneuver Mov Capacity-2 Maneuver Stage Stage Approach EB WB NB SB HCM Control Delay, s Minor Lane / Major Mvmt NBLn1 EBL EBT EBR WBL WBT WBR SBLn1 Capacity (veh/h) HCM Lane V/C Ratio HCM Control Delay (s) HCM Lane LOS B A A E HCM 95th %tile Q(veh) Notes ~ : Volume Exceeds Capacity; $ : Delay Exceeds 300 Seconds; Error : Computation Not Defined DKS Associates Synchro 8 Report 7/8/2014 Page 1
203 HCM 2010 TWSC 2014 Seasonal Balanced PM (3-Ln) 2: Hwy 101 & 20th Street Reedsport Pedestrian Safety Study Intersection Intersection Delay, s/veh 2.1 Movement EBL EBT EBR WBL WBT WBR NBL NBT NBR SBL SBT SBR Vol, veh/h Conflicting Peds, #/hr Sign Control Free Free Free Free Free Free Stop Stop Stop Stop Stop Stop RT Channelized - - None - - None - - None - - None Storage Length Veh in Median Storage, # Grade, % Peak Hour Factor Heavy Vehicles, % Mvmt Flow Major/Minor Major1 Major2 Minor1 Minor2 Conflicting Flow All Stage Stage Follow-up Headway Pot Capacity-1 Maneuver Stage Stage Time blocked-platoon, % Mov Capacity-1 Maneuver Mov Capacity-2 Maneuver Stage Stage Approach EB WB NB SB HCM Control Delay, s Minor Lane / Major Mvmt NBLn1 EBL EBT EBR WBL WBT WBR SBLn1 Capacity (veh/h) HCM Lane V/C Ratio HCM Control Delay (s) HCM Lane LOS C A A F HCM 95th %tile Q(veh) Notes ~ : Volume Exceeds Capacity; $ : Delay Exceeds 300 Seconds; Error : Computation Not Defined DKS Associates Synchro 8 Report 7/8/2014 Page 2
204 HCM Signalized Intersection Capacity Analysis 2014 Seasonal Balanced PM (3-Ln) 3: Hwy 101 & Port Dock Road/OR 38 Reedsport Pedestrian Safety Study Movement EBL EBT EBR WBL WBT WBR NBL NBT NBR SBL SBT SBR Lane Configurations Volume (vph) Ideal Flow (vphpl) Total Lost time (s) Lane Util. Factor Frpb, ped/bikes Flpb, ped/bikes Frt Flt Protected Satd. Flow (prot) Flt Permitted Satd. Flow (perm) Peak-hour factor, PHF Adj. Flow (vph) RTOR Reduction (vph) Lane Group Flow (vph) Confl. Peds. (#/hr) Confl. Bikes (#/hr) 2 1 Heavy Vehicles (%) 10% 33% 6% 11% 0% 8% 10% 8% 12% 9% 7% 27% Turn Type Perm NA Perm NA Prot NA Prot NA Protected Phases Permitted Phases 4 8 Actuated Green, G (s) Effective Green, g (s) Actuated g/c Ratio Clearance Time (s) Vehicle Extension (s) Lane Grp Cap (vph) v/s Ratio Prot 0.03 c0.33 c v/s Ratio Perm 0.05 c0.28 v/c Ratio Uniform Delay, d Progression Factor Incremental Delay, d Delay (s) Level of Service B C D C D B Approach Delay (s) Approach LOS B C C C Intersection Summary HCM 2000 Control Delay 26.4 HCM 2000 Level of Service C HCM 2000 Volume to Capacity ratio 0.81 Actuated Cycle Length (s) 63.6 Sum of lost time (s) 13.5 Intersection Capacity Utilization 61.6% ICU Level of Service B Analysis Period (min) 15 c Critical Lane Group DKS Associates Synchro 8 Report 7/8/2014 Page 3
205 HCM 2010 TWSC 2014 Seasonal Balanced PM (3-Ln) 4: OR 38 & 3rd Street Reedsport Pedestrian Safety Study Intersection Intersection Delay, s/veh 3.1 Movement EBL EBT EBR WBL WBT WBR NBL NBT NBR SBL SBT SBR Vol, veh/h Conflicting Peds, #/hr Sign Control Free Free Free Free Free Free Stop Stop Stop Stop Stop Stop RT Channelized - - None - - None - - None - - None Storage Length Veh in Median Storage, # Grade, % Peak Hour Factor Heavy Vehicles, % Mvmt Flow Major/Minor Major1 Major2 Minor1 Minor2 Conflicting Flow All Stage Stage Follow-up Headway Pot Capacity-1 Maneuver Stage Stage Time blocked-platoon, % Mov Capacity-1 Maneuver Mov Capacity-2 Maneuver Stage Stage Approach EB WB NB SB HCM Control Delay, s Minor Lane / Major Mvmt NBLn1 EBL EBT EBR WBL WBT WBR SBLn1 Capacity (veh/h) HCM Lane V/C Ratio HCM Control Delay (s) HCM Lane LOS C A A A A B HCM 95th %tile Q(veh) Notes ~ : Volume Exceeds Capacity; $ : Delay Exceeds 300 Seconds; Error : Computation Not Defined DKS Associates Synchro 8 Report 7/8/2014 Page 5
206 HCM 2010 TWSC 2014 Seasonal Balanced (10% Growth) PM (3-Ln) 1: Hwy 101 & 21st Street Reedsport Pedestrian Safety Study Intersection Intersection Delay, s/veh 0.8 Movement EBL EBT EBR WBL WBT WBR NBL NBT NBR SBL SBT SBR Vol, veh/h Conflicting Peds, #/hr Sign Control Free Free Free Free Free Free Stop Stop Stop Stop Stop Stop RT Channelized - - None - - None - - None - - None Storage Length Veh in Median Storage, # Grade, % Peak Hour Factor Heavy Vehicles, % Mvmt Flow Major/Minor Major1 Major2 Minor1 Minor2 Conflicting Flow All Stage Stage Follow-up Headway Pot Capacity-1 Maneuver Stage Stage Time blocked-platoon, % Mov Capacity-1 Maneuver Mov Capacity-2 Maneuver Stage Stage Approach EB WB NB SB HCM Control Delay, s Minor Lane / Major Mvmt NBLn1 EBL EBT EBR WBL WBT WBR SBLn1 Capacity (veh/h) HCM Lane V/C Ratio HCM Control Delay (s) HCM Lane LOS B A A E HCM 95th %tile Q(veh) Notes ~ : Volume Exceeds Capacity; $ : Delay Exceeds 300 Seconds; Error : Computation Not Defined DKS Associates Synchro 8 Report 8/26/2014 Page 1
207 HCM 2010 TWSC 2014 Seasonal Balanced (10% Growth) PM (3-Ln) 2: Hwy 101 & 20th Street Reedsport Pedestrian Safety Study Intersection Intersection Delay, s/veh 2 Movement EBL EBT EBR WBL WBT WBR NBL NBT NBR SBL SBT SBR Vol, veh/h Conflicting Peds, #/hr Sign Control Free Free Free Free Free Free Stop Stop Stop Stop Stop Stop RT Channelized - - None - - None - - None - - None Storage Length Veh in Median Storage, # Grade, % Peak Hour Factor Heavy Vehicles, % Mvmt Flow Major/Minor Major1 Major2 Minor1 Minor2 Conflicting Flow All Stage Stage Follow-up Headway Pot Capacity-1 Maneuver Stage Stage Time blocked-platoon, % Mov Capacity-1 Maneuver Mov Capacity-2 Maneuver Stage Stage Approach EB WB NB SB HCM Control Delay, s Minor Lane / Major Mvmt NBLn1 EBL EBT EBR WBL WBT WBR SBLn1 Capacity (veh/h) HCM Lane V/C Ratio HCM Control Delay (s) HCM Lane LOS C A A F HCM 95th %tile Q(veh) Notes ~ : Volume Exceeds Capacity; $ : Delay Exceeds 300 Seconds; Error : Computation Not Defined DKS Associates Synchro 8 Report 8/26/2014 Page 2
208 HCM Signalized Intersection Capacity Analysis 2014 Seasonal Balanced (10% Growth) PM (3-Ln) 3: Hwy 101 & Port Dock Road/OR 38 Reedsport Pedestrian Safety Study Movement EBL EBT EBR WBL WBT WBR NBL NBT NBR SBL SBT SBR Lane Configurations Volume (vph) Ideal Flow (vphpl) Total Lost time (s) Lane Util. Factor Frpb, ped/bikes Flpb, ped/bikes Frt Flt Protected Satd. Flow (prot) Flt Permitted Satd. Flow (perm) Peak-hour factor, PHF Adj. Flow (vph) RTOR Reduction (vph) Lane Group Flow (vph) Confl. Peds. (#/hr) Confl. Bikes (#/hr) 2 1 Heavy Vehicles (%) 10% 33% 6% 11% 0% 8% 10% 8% 12% 9% 7% 27% Turn Type Perm NA Perm NA Prot NA Prot NA Protected Phases Permitted Phases 4 8 Actuated Green, G (s) Effective Green, g (s) Actuated g/c Ratio Clearance Time (s) Vehicle Extension (s) Lane Grp Cap (vph) v/s Ratio Prot 0.03 c0.31 c v/s Ratio Perm 0.05 c0.26 v/c Ratio Uniform Delay, d Progression Factor Incremental Delay, d Delay (s) Level of Service B C D C E B Approach Delay (s) Approach LOS B C C C Intersection Summary HCM 2000 Control Delay 25.1 HCM 2000 Level of Service C HCM 2000 Volume to Capacity ratio 0.78 Actuated Cycle Length (s) 62.6 Sum of lost time (s) 13.5 Intersection Capacity Utilization 69.3% ICU Level of Service C Analysis Period (min) 15 c Critical Lane Group DKS Associates Synchro 8 Report 8/26/2014 Page 3
209 HCM 2010 TWSC 2014 Seasonal Balanced (10% Growth) PM (3-Ln) 4: OR 38 & 3rd Street Reedsport Pedestrian Safety Study Intersection Intersection Delay, s/veh 2.8 Movement EBL EBT EBR WBL WBT WBR NBL NBT NBR SBL SBT SBR Vol, veh/h Conflicting Peds, #/hr Sign Control Free Free Free Free Free Free Stop Stop Stop Stop Stop Stop RT Channelized - - None - - None - - None - - None Storage Length Veh in Median Storage, # Grade, % Peak Hour Factor Heavy Vehicles, % Mvmt Flow Major/Minor Major1 Major2 Minor1 Minor2 Conflicting Flow All Stage Stage Follow-up Headway Pot Capacity-1 Maneuver Stage Stage Time blocked-platoon, % Mov Capacity-1 Maneuver Mov Capacity-2 Maneuver Stage Stage Approach EB WB NB SB HCM Control Delay, s Minor Lane / Major Mvmt NBLn1 EBL EBT EBR WBL WBT WBR SBLn1 Capacity (veh/h) HCM Lane V/C Ratio HCM Control Delay (s) HCM Lane LOS B A A A A B HCM 95th %tile Q(veh) Notes ~ : Volume Exceeds Capacity; $ : Delay Exceeds 300 Seconds; Error : Computation Not Defined DKS Associates Synchro 8 Report 8/26/2014 Page 5
210 HCM Signalized Intersection Capacity Analysis 2014 Seasonal Balanced (10% Growth) PM (3-Ln) 5: Hwy 101 & 22nd Street Reedsport Pedestrian Safety Study Movement EBL EBT EBR WBL WBT WBR NBL NBT NBR SBL SBT SBR Lane Configurations Volume (vph) Ideal Flow (vphpl) Total Lost time (s) Lane Util. Factor Frt Flt Protected Satd. Flow (prot) Flt Permitted Satd. Flow (perm) Peak-hour factor, PHF Adj. Flow (vph) RTOR Reduction (vph) Lane Group Flow (vph) Turn Type Prot Prot Perm Perm Protected Phases Permitted Phases 8 4 Actuated Green, G (s) Effective Green, g (s) Actuated g/c Ratio Clearance Time (s) Vehicle Extension (s) Lane Grp Cap (vph) v/s Ratio Prot v/s Ratio Perm v/c Ratio Uniform Delay, d1 Progression Factor Incremental Delay, d2 Delay (s) Level of Service Approach Delay (s) Approach LOS A A A A Intersection Summary HCM 2000 Control Delay 0.0 HCM 2000 Level of Service A HCM 2000 Volume to Capacity ratio 0.00 Actuated Cycle Length (s) 65.0 Sum of lost time (s) 13.5 Intersection Capacity Utilization 0.0% ICU Level of Service A Analysis Period (min) 15 c Critical Lane Group DKS Associates Synchro 8 Report 8/26/2014 Page 6
211 HCM 2010 TWSC 2014 Seasonal Balanced (45% Growth) PM (3-Ln) 1: Hwy 101 & 21st Street Reedsport Pedestrian Safety Study Intersection Intersection Delay, s/veh 0.6 Movement EBL EBT EBR WBL WBT WBR NBL NBT NBR SBL SBT SBR Vol, veh/h Conflicting Peds, #/hr Sign Control Free Free Free Free Free Free Stop Stop Stop Stop Stop Stop RT Channelized - - None - - None - - None - - None Storage Length Veh in Median Storage, # Grade, % Peak Hour Factor Heavy Vehicles, % Mvmt Flow Major/Minor Major1 Major2 Minor1 Minor2 Conflicting Flow All Stage Stage Follow-up Headway Pot Capacity-1 Maneuver Stage Stage Time blocked-platoon, % Mov Capacity-1 Maneuver Mov Capacity-2 Maneuver Stage Stage Approach EB WB NB SB HCM Control Delay, s Minor Lane / Major Mvmt NBLn1 EBL EBT EBR WBL WBT WBR SBLn1 Capacity (veh/h) HCM Lane V/C Ratio HCM Control Delay (s) HCM Lane LOS C B B F HCM 95th %tile Q(veh) Notes ~ : Volume Exceeds Capacity; $ : Delay Exceeds 300 Seconds; Error : Computation Not Defined DKS Associates Synchro 8 Report 9/5/2014 Page 1
212 HCM 2010 TWSC 2014 Seasonal Balanced (45% Growth) PM (3-Ln) 2: Hwy 101 & 20th Street Reedsport Pedestrian Safety Study Intersection Intersection Delay, s/veh 2.9 Movement EBL EBT EBR WBL WBT WBR NBL NBT NBR SBL SBT SBR Vol, veh/h Conflicting Peds, #/hr Sign Control Free Free Free Free Free Free Stop Stop Stop Stop Stop Stop RT Channelized - - None - - None - - None - - None Storage Length Veh in Median Storage, # Grade, % Peak Hour Factor Heavy Vehicles, % Mvmt Flow Major/Minor Major1 Major2 Minor1 Minor2 Conflicting Flow All Stage Stage Follow-up Headway Pot Capacity-1 Maneuver Stage Stage Time blocked-platoon, % Mov Capacity-1 Maneuver Mov Capacity-2 Maneuver Stage Stage Approach EB WB NB SB HCM Control Delay, s Minor Lane / Major Mvmt NBLn1 EBL EBT EBR WBL WBT WBR SBLn1 Capacity (veh/h) HCM Lane V/C Ratio HCM Control Delay (s) HCM Lane LOS C B B F HCM 95th %tile Q(veh) Notes ~ : Volume Exceeds Capacity; $ : Delay Exceeds 300 Seconds; Error : Computation Not Defined DKS Associates Synchro 8 Report 9/5/2014 Page 2
213 Reedsport Pedestrian Safety Study Executive Summary December 2014 Three-Lane Conversion Travel Time Differential Reports
214 Arterial Level of Service 2014 Seasonal Balanced PM 8/7/2014 Arterial Level of Service: EB Hwy 101 Delay Travel Dist Arterial Cross Street Node (s/veh) time (s) (mi) Speed OR Total Arterial Level of Service: WB Hwy 101 Delay Travel Dist Arterial Cross Street Node (s/veh) time (s) (mi) Speed Port Dock Road th Street st Street Total Reedsport Pedestrian Safety Study SimTraffic Report DKS Associates Page 1
215 Arterial Level of Service 2014 Seasonal Balanced PM (3-Ln) 8/7/2014 Arterial Level of Service: EB Hwy 101 Delay Travel Dist Arterial Cross Street Node (s/veh) time (s) (mi) Speed OR Total Arterial Level of Service: WB Hwy 101 Delay Travel Dist Arterial Cross Street Node (s/veh) time (s) (mi) Speed Port Dock Road th Street st Street Total Reedsport Pedestrian Safety Study SimTraffic Report DKS Associates Page 1

216 Reedsport Pedestrian Safety Study Executive Summary December 2014 Cost Estimates
TIMBERVINE TRANSPORTATION IMPACT STUDY FORT COLLINS, COLORADO JANUARY Prepared for:
 TIMBERVINE TRANSPORTATION IMPACT STUDY FORT COLLINS, COLORADO JANUARY 2014 Prepared for: Hartford Companies 1218 W. Ash Street Suite A Windsor, Co 80550 Prepared by: DELICH ASSOCIATES 2272 Glen Haven Drive
Traffic Engineering Study
 Traffic Engineering Study Bellaire Boulevard Prepared For: International Management District Technical Services, Inc. Texas Registered Engineering Firm F-3580 November 2009 Executive Summary has been requested
EXCEPTION TO STANDARDS REPORT
 EXCEPTION TO STANDARDS REPORT PROJECT DESCRIPTION AND NEED The project is located in Section 6, Township 23 North, Range 9 East and Section 31 Township 24 North, Range 9 East, in the Town of Stockton,
BROWARD BOULEVARD CORRIDOR TRANSIT STUDY
 BROWARD BOULEVARD CORRIDOR TRANSIT STUDY FM # 42802411201 EXECUTIVE SUMMARY July 2012 GOBROWARD Broward Boulevard Corridor Transit Study FM # 42802411201 Executive Summary Prepared For: Ms. Khalilah Ffrench,
Figure 1 Map of intersection of SR 44 (Ravenna Rd) and Butternut Rd
 and Butternut Rd") Abbreviated Study District: 12 County: Geauga Route: SR 44 Section: 1.58 GEA 44 1.58 213 HSP # 47 (Rural Intersection) Prepared April 23, 215 By Bryan Emery Existing Conditions This study contains the
Abbreviated Study District: 12 County: Geauga Route: SR 44 Section: 1.58 GEA 44 1.58 213 HSP # 47 (Rural Intersection) Prepared April 23, 215 By Bryan Emery Existing Conditions This study contains the
LAWRENCE TRANSIT CENTER LOCATION ANALYSIS 9 TH STREET & ROCKLEDGE ROAD / 21 ST STREET & IOWA STREET LAWRENCE, KANSAS
 LAWRENCE TRANSIT CENTER LOCATION ANALYSIS 9 TH STREET & ROCKLEDGE ROAD / 21 ST STREET & IOWA STREET LAWRENCE, KANSAS TRAFFIC IMPACT STUDY FEBRUARY 214 OA Project No. 213-542 TABLE OF CONTENTS 1. INTRODUCTION...
2.0 Development Driveways. Movin Out June 2017
 Movin Out June 2017 1.0 Introduction The proposed Movin Out development is a mixed use development in the northeast quadrant of the intersection of West Broadway and Fayette Avenue in the City of Madison.
Table of Contents INTRODUCTION... 3 PROJECT STUDY AREA Figure 1 Vicinity Map Study Area... 4 EXISTING CONDITIONS... 5 TRAFFIC OPERATIONS...
 Crosshaven Drive Corridor Study City of Vestavia Hills, Alabama Table of Contents INTRODUCTION... 3 PROJECT STUDY AREA... 3 Figure 1 Vicinity Map Study Area... 4 EXISTING CONDITIONS... 5 TRAFFIC OPERATIONS...
Traffic Impact Study Speedway Gas Station Redevelopment
 Traffic Impact Study Speedway Gas Station Redevelopment Warrenville, Illinois Prepared For: Prepared By: April 11, 2018 Table of Contents 1. Introduction... 1 2. Existing Conditions... 4 Site Location...
ACTION TRANSMITTAL No
 Transportation Advisory Board of the Metropolitan Council of the Twin Cities DATE: January 4, 2016 TO: ACTION TRANSMITTAL No. 2016-19 TAC Funding and Programming Committee PREPARED BY: Joe Barbeau, Senior
5. OPPORTUNITIES AND NEXT STEPS
 5. OPPORTUNITIES AND NEXT STEPS When the METRO Green Line LRT begins operating in mid-2014, a strong emphasis will be placed on providing frequent connecting bus service with Green Line trains. Bus hours
King Soopers #116 Thornton, Colorado
 Traffic Impact Study King Soopers #116 Thornton, Colorado Prepared for: Galloway & Company, Inc. T R A F F I C I M P A C T S T U D Y King Soopers #116 Thornton, Colorado Prepared for Galloway & Company
Open House. Highway212. Meetings. Corridor Access Management, Safety & Phasing Plan. 5:30 to 6:30 p.m. - Southwest Corridor Transportation Coalition
 Welcome Meetings 5:30 to 6:30 p.m. - Southwest Corridor Transportation Coalition 6:30 to 8:00 p.m. - Open House Why is Highway 212 Project Important? Important Arterial Route Local Support Highway 212
Citizens Committee for Facilities
 Citizens Committee for Facilities AGENDA Thursday, December 11, 2014 City Council Chambers 305 3 rd Avenue East -Twin Falls, Idaho 11:30 A.M. AGENDA ITEMS Purpose By 1. Discussion and possible action on
Corridor Sketch Summary
 Corridor Sketch Summary SR 241: I-82 Jct (Sunnyside) to SR 24 Jct Corridor Highway No. 241 Mileposts: 7.53 to 25.21 Length: 17.65 miles Corridor Description The seventeen and one-half mile corridor begins
Appendix J Traffic Impact Study
 MRI May 2012 Appendix J Traffic Impact Study Level 2 Traffic Assessment Limited Impact Review Appendix J [This page was left blank intentionally.] www.sgm-inc.com Figure 1. Site Driveway and Trail Crossing
Metropolitan Freeway System 2013 Congestion Report
 Metropolitan Freeway System 2013 Congestion Report Metro District Office of Operations and Maintenance Regional Transportation Management Center May 2014 Table of Contents PURPOSE AND NEED... 1 INTRODUCTION...
Memorandum. To: Sue Polka, City Engineer, City of Arden Hills. From: Sean Delmore, PE, PTOE. Date: June 21, 2017
 Memorandum engineering planning environmental construction 701 Xenia Avenue South Suite 300 Minneapolis, MN 55416 Tel: 763-541-4800 Fax: 763-541-1700 To: Sue Polka, City Engineer, City of Arden Hills From:
IMPROVEMENT CONCEPTS
 IMPROVEMENT CONCEPTS for the South Novato Transit Hub Study Prepared by: January 11, 2010 DKS Associates With Wilbur Smith Associates IMPROVEMENT CONCEPTS Chapter 1: Introduction 1. INTRODUCTION The strategic
STH 60 Northern Reliever Route Feasibility Study Report
 #233087 v3 STH 60 Northern Reliever Route Feasibility Study Report Washington County Public Works Committee Meeting September 28, 2016 1 STH 60 Northern Reliever Route Feasibility Study Hartford Area Development
Speed Limit and Safety Nexus Studies for Automated Enforcement Locations in the District of Columbia 400 Block 14th Street SW
 Speed Limit and Safety Nexus Studies for Automated Enforcement Locations in the District of Columbia 4 Block 4th Street SW Study Area and Location District PSA Ward ANC Phase Description 27 6 6D Existing
King County Metro. Columbia Street Transit Priority Improvements Alternative Analysis. Downtown Southend Transit Study. May 2014.
 King County Metro Columbia Street Transit Priority Improvements Alternative Analysis Downtown Southend Transit Study May 2014 Parametrix Table of Contents Introduction... 1 Methodology... 1 Study Area...
TRAFFIC IMPACT ANALYSIS
 TRAFFIC IMPACT ANALYSIS Emerald Isle Commercial Development Prepared by SEPI Engineering & Construction Prepared for Ark Consulting Group, PLLC March 2016 I. Executive Summary A. Site Location The Emerald
Study Area and Location District PSA Ward ANC Phase Description C Planned Suitland Parkway Westbound at Stanton Road Southeast
 Speed Limit and Safety Nexus Studies for Automated Enforcement Locations in the District of Columbia Suitland Parkway at Stanton Road SE Study Area and Location District PSA Ward ANC Phase Description
Bennett Pit. Traffic Impact Study. J&T Consulting, Inc. Weld County, Colorado. March 3, 2017
 Bennett Pit Traffic Impact Study J&T Consulting, Inc. Weld County, Colorado March 3, 217 Prepared By: Sustainable Traffic Solutions, Inc. http://www.sustainabletrafficsolutions.com/ Joseph L. Henderson,
Traffic Analysis for Bon Air Bridge Mitigation Magnolia Storm Water Quality Project
 Memo To: Paul DiDonato, ATI Architects and Engineers From: David Parisi, PE and Ashley Tam, EIT Date: February 23, 216 Subject: Traffic Analysis for Bon Air Bridge Mitigation Magnolia Storm Water Quality
SPEED HUMP POLICY and PROCEDURES for RESIDENTIAL AREAS
 SPEED HUMP POLICY and PROCEDURES for RESIDENTIAL AREAS City of Panama City, Florida Public Works Department 9 Harrison Avenue Panama City, Florida 32401 Phone: (850) 872-3015 Effective 1/22/08 Table of
2016 Congestion Report
 2016 Congestion Report Metropolitan Freeway System May 2017 2016 Congestion Report 1 Table of Contents Purpose and Need...3 Introduction...3 Methodology...4 2016 Results...5 Explanation of Percentage Miles
Slow Down! Why speed is important in realizing your Vision Zero goals and how to achieve the speeds you need
 Slow Down! Why speed is important in realizing your Vision Zero goals and how to achieve the speeds you need Lake McTighe, METRO Joel McCarroll, ODOT Jenna Marmon, ODOT Matt Ferris-Smith, PBOT Oregon Active
Trip Generation Study: Provo Assisted Living Facility Land Use Code: 254
 Trip Generation Study: Provo Assisted Living Facility Land Use Code: 254 Introduction The Brigham Young University Institute of Transportation Engineers (BYU ITE) student chapter completed a trip generation
Harlem Avenue between 63 rd and 65 th
 Harlem Avenue between 63 rd and 65 th Public Meeting #2 March 13, 2018 Summit Park District Welcome to the second Public Meeting for the preliminary engineering and environmental studies of Illinois 43
Proposed location of Camp Parkway Commerce Center. Vicinity map of Camp Parkway Commerce Center Southampton County, VA
 Proposed location of Camp Parkway Commerce Center Vicinity map of Camp Parkway Commerce Center Southampton County, VA Camp Parkway Commerce Center is a proposed distribution and industrial center to be
INDUSTRIAL DEVELOPMENT
 INDUSTRIAL DEVELOPMENT Traffic Impact Study Plainfield, Illinois August 2018 Prepared for: Seefried Industrial Properties, Inc. TABLE OF CONTENTS Executive Summary 2 Introduction 3 Existing Conditions
CITY OF POWAY MEMORANDUM
 CITY OF POWAY MEMORANDUM TO: FROM: Traffic Safety Committee Steve Crosby P.E., City Engineer DATE: February 14, 2018 SUBJECT: Espola Road speeding concerns BACKGROUND In 2017, staff received a request
INTERSECTION CONTROL EVALUATION
 INTERSECTION CONTROL EVALUATION Trunk Highway 22 and CSAH 21 (E Hill Street/Shanaska Creek Road) Kasota, Le Sueur County, Minnesota November 2018 Trunk Highway 22 and Le Sueur CSAH 21 (E Hill Street/Shanaska
TRAFFIC IMPACT STUDY. USD #497 Warehouse and Bus Site
 TRAFFIC IMPACT STUDY for USD #497 Warehouse and Bus Site Prepared by: Jason Hoskinson, PE, PTOE BG Project No. 16-12L July 8, 216 145 Wakarusa Drive Lawrence, Kansas 6649 T: 785.749.4474 F: 785.749.734
APPENDIX VMT Evaluation
 APPENDIX 2.7-2 VMT Evaluation MEMORANDUM To: From: Mr. Jonathan Frankel New Urban West, Incorporated Chris Mendiara LLG, Engineers Date: May 19, 2017 LLG Ref: 3-16-2614 Subject: Villages VMT Evaluation
Construction Realty Co.
 MEMORANDUM TO: FROM : Jeff Pickus Construction Realty Co. Luay R. Aboona, PE Principal 9575 West Higgins Road, Suite 400 Rosemont, Illinois 60018 p: 847-518-9990 f: 847-518-9987 DATE: May 22, 2014 SUBJECT:
Traffic Impact Analysis West Street Garden Plots Improvements and DuPage River Park Garden Plots Development Naperville, Illinois
 Traffic Impact Analysis West Street Garden Plots Improvements and DuPage River Park Garden Plots Development Naperville, Illinois Submitted by April 9, 2009 Introduction Kenig, Lindgren, O Hara, Aboona,
APPENDIX E. Traffic Analysis Report
 APPENDIX E Traffic Analysis Report THIS PAGE INTENTIONALLY BLANK EAGLE RIVER TRAFFIC MITIGATION PHASE I OLD GLENN HIGHWAY/EAGLE RIVER ROAD INTERSECTION IMPROVEMENTS TRAFFIC ANALYSIS Eagle River, Alaska
Letter EL652 City of Mercer Island. Page 1. No comments n/a
 Letter EL652 City of Mercer Island Page 1 No comments n/a Page 2 Response to comment EL652 1 Section 4.5.3 of the Final EIS presents the range of potential impacts of the project. This project also lists
Downtown Lee s Summit Parking Study
 Downtown Lee s Summit Parking Study As part of the Downtown Lee s Summit Master Plan, a downtown parking and traffic study was completed by TranSystems Corporation in November 2003. The parking analysis
TRANSPORTATION REVIEW
 TRANSPORTATION REVIEW - PROPOSED MIX OF LAND USES IS CONSISTENT WITH THE CITY S UNDER THE GRANVILLE BRIDGE POLICIES THAT AIM TO MEET NEIGHBOURING RESIDENTS SHOPPING NEEDS AND REDUCE RELIANCE ON AUTOMOBILE
Metropolitan Freeway System 2007 Congestion Report
 Metropolitan Freeway System 2007 Congestion Report Minnesota Department of Transportation Office of Traffic, Safety and Operations Freeway Operations Section Regional Transportation Management Center March
EXECUTIVE SUMMARY. The following is an outline of the traffic analysis performed by Hales Engineering for the traffic conditions of this project.
 EXECUTIVE SUMMARY This study addresses the traffic impacts associated with the proposed Shopko redevelopment located in Sugarhouse, Utah. The Shopko redevelopment project is located between 1300 East and
TRAFFIC CALMING PROGRAM
 TRAFFIC CALMING PROGRAM PROGRAM BASICS Mount Pleasant Transportation Department 100 Ann Edwards Lane Mt. Pleasant, SC 29465 Tel: 843-856-3080 www.tompsc.com The Town of Mount Pleasant has adopted a traffic
City of Marina. Regional Roundabout Study Utilizing Caltrans Intersection Control Evaluation Section 4: Transportation Agency for Monterey County
 Regional Roundabout Study Utilizing Caltrans Intersection Control Evaluation Section 4: City of Marina Study Intersections: RESERVATION ROAD AT BEACH ROAD RESERVATION ROAD AT DEFOREST ROAD CARDOZA AVENUE
RICHMOND OAKS HEALTH CENTRE 6265 PERTH STREET OTTAWA, ONTARIO TRANSPORTATION BRIEF. Prepared for: Guycoki (Eastern) Limited.
 Limited.") RICHMOND OAKS HEALTH CENTRE 6265 PERTH STREET OTTAWA, ONTARIO TRANSPORTATION BRIEF Prepared for: Guycoki (Eastern) Limited June 16, 2016 116-638 Brief_1.doc D. J. Halpenny & Associates Ltd. Consulting
RICHMOND OAKS HEALTH CENTRE 6265 PERTH STREET OTTAWA, ONTARIO TRANSPORTATION BRIEF Prepared for: Guycoki (Eastern) Limited June 16, 2016 116-638 Brief_1.doc D. J. Halpenny & Associates Ltd. Consulting
Study Area and Location District PSA Ward ANC Phase Description A Proposed Monroe Street Northeast Eastbound at Rhode Island Avenue
 Speed Limit and Safety Nexus Studies for Automated Enforcement Locations in the District of Columbia Monroe Street NE and Rhode Island Avenue NE Study Area and Location District PSA Ward ANC Phase Description
The Jack A. Markell Trail Delaware s Bicycle Highway New England Bike- Walk Summit
 The Jack A. Markell Trail Delaware s Bicycle Highway 2018 New England Bike- Walk Summit The Jack A. Markell Trail Sometimes a very difficult project, including significant investment and perseverance,
METRO Orange Line BRT American Boulevard Station Options
 METRO Orange Line BRT American Boulevard Station Options Bloomington City Council Work Session November 18, 2013 Christina Morrison BRT/Small Starts Project Office Coordinating Planning and Design AMERICAN
VOA Vista Drive Residential housing Development TIA Project #13915 TABLE OF CONTENTS
 VOA Vista Drive Residential housing Development TIA Project #13915 TABLE OF CONTENTS Executive Summary... 2 Project Background... 2 Conditions... 2 Findings... 3 Recommendations... 4 Introduction... 6
Highway 18 BNSF Railroad Overpass Feasibility Study Craighead County. Executive Summary
 Highway 18 BNSF Railroad Overpass Feasibility Study Craighead County Executive Summary October 2014 Highway 18 BNSF Railroad Overpass Feasibility Study Craighead County Executive Summary October 2014 Prepared
Parks and Transportation System Development Charge Methodology
 City of Sandy Parks and Transportation System Development Charge Methodology March, 2016 Background In order to implement a City Council goal the City of Sandy engaged FCS Group in January of 2015 to update
BARRHAVEN FELLOWSHIP CRC 3058 JOCKVALE ROAD OTTAWA, ONTARIO TRANSPORTATION BRIEF. Prepared for:
 BARRHAVEN FELLOWSHIP CRC 3058 JOCKVALE ROAD OTTAWA, ONTARIO TRANSPORTATION BRIEF Prepared for: Barrhaven Fellowship CRC 3058 Jockvale Road Ottawa, ON K2J 2W7 December 7, 2016 116-649 Report_1.doc D. J.
residents of data near walking. related to bicycling and Safety According available. available. 2.2 Land adopted by
 2. Assessment of Current Conditions and Needs In order to prepare a plan to reach the vision desired by the residents of Texarkana, it is first necessary to ascertain the current situation. Since there
L1TILE BEARS DAY CARE TRANSPORTATION IMPACT STUDY FORT COLLINS, COLORADO MAY Prepared for:
 L1TILE BEARS DAY CARE TRANSPORTATION IMPACT STUDY FORT COLLINS, COLORADO MAY 2012 Prepared for: Hillside Construction, Inc. 216 Hemlock Street, Suite B Fort Collins, CO 80534 Prepared by: DELICH ASSOCIATES
RTE. 1 at RTE. 637 & RTE. 639
 INTERSECTION SAFETY STUDY Prepared for: Virginia Department of Transportation Central Region Operations Traffic Engineering (UPC #81378, TO 12-092) DAVENPORT Project Number: 13-368 / /2014 RTE. 1 at RTE.
INTERSECTION ANALYSIS PARK AVENUE AND BRADDOCK ROAD (FROSTBURG, MD) FOR LENHART TRAFFIC CONSULTING, INC.
 FOR LENHART TRAFFIC CONSULTING, INC.") INTERSECTION ANALYSIS FOR PARK AVENUE AND BRADDOCK ROAD (FROSTBURG, MD) Prepared for: City of Frostburg, Maryland & Allegany County Commissioners Prepared by: LENHART TRAFFIC CONSULTING, INC. TRAFFIC ENGINEERING
INTERSECTION ANALYSIS FOR PARK AVENUE AND BRADDOCK ROAD (FROSTBURG, MD) Prepared for: City of Frostburg, Maryland & Allegany County Commissioners Prepared by: LENHART TRAFFIC CONSULTING, INC. TRAFFIC ENGINEERING
Study Area and Location District PSA Ward ANC Phase Description B Existing 600 Block New York Avenue Northeast Westbound
 Speed Limit and Safety Nexus Studies for Automated Enforcement Locations in the District of Columbia 6 Block New York Avenue NE Study Area and Location District PSA Ward ANC Phase Description 5 55 5 5B
Brigham City 1200 West Box Elder Creek Bridge - Widening Project Type Reconstruction
 Brigham City 1200 West Box Elder Creek Bridge - Widening Project Type Reconstruction 550 North to 650 North $ 1,750,000 $ 1,582,113 To widen an existing bridge on 1200 West over Box Elder Creek that will
V. DEVELOPMENT OF CONCEPTS
 Martin Luther King, Jr. Drive Extension FINAL Feasibility Study Page 9 V. DEVELOPMENT OF CONCEPTS Throughout the study process several alternative alignments were developed and eliminated. Initial discussion
TRAFFIC IMPACT ANALYSIS FOR. McDONALD S RESTAURANT IN CARMICAEL Sacramento County, CA. Prepared For:
 TRAFFIC IMPACT ANALYSIS FOR McDONALD S RESTAURANT IN CARMICAEL Sacramento County, CA Prepared For: McDonald s USA, LLC Pacific Sierra Region 2999 Oak Road, Suite 900 Walnut Creek, CA 94597 Prepared By:
Southern Windsor County 2016 Traffic Count Program Summary April 2017
 Southern Windsor County 2016 Traffic Count Program Summary April 2017 The Southern Windsor County Regional Planning Commission (the RPC ) has been monitoring traffic at 19 locations throughout the southern
Appendix C-5: Proposed Refinements Rail Operations and Maintenance Facility (ROMF) Traffic Impact Analysis. Durham-Orange Light Rail Transit Project
 Traffic Impact Analysis. Durham-Orange Light Rail Transit Project") Appendix C-5: Proposed Refinements Rail Operations and Maintenance Facility (ROMF) Traffic Impact Analysis Durham-Orange Light Rail Transit Project July 25, 218 ROMF Transportation Impact Analysis Version
Appendix C-5: Proposed Refinements Rail Operations and Maintenance Facility (ROMF) Traffic Impact Analysis Durham-Orange Light Rail Transit Project July 25, 218 ROMF Transportation Impact Analysis Version
Highway 23 New London Access & Safety Assessment. Public Open House #2 October 3, :00 to 7:00 PM
 Public Open House #2 October 3, 2017 5:00 to 7:00 PM Highway 9 OVERVIEW OF ASSESSMENT Assessment Limits Highway 23 from County Road 40 to North Shore Dr Purpose: Identify opportunities to reduce serious
TECHNICAL MEMORANDUM. Part A: Introduction
 TECHNICAL MEMORANDUM To: David J. Decker Decker Properties, Inc. 5950 Seminole Centre Ct. Suite 200 Madison, Wisconsin 53711 608-663-1218 Fax: 608-663-1226 www.klengineering.com From: Mike Scarmon, P.E.,
MILLERSVILLE PARK TRAFFIC IMPACT ANALYSIS ANNE ARUNDEL COUNTY, MARYLAND
 MILLERSVILLE PARK TRAFFIC IMPACT ANALYSIS ANNE ARUNDEL COUNTY, MARYLAND Prepared for: Department of Public Works Anne Arundel County Prepared by: URS Corporation 4 North Park Drive, Suite 3 Hunt Valley,
Traffic Impact Analysis. Alliance Cole Avenue Residential Site Dallas, Texas. Kimley-Horn and Associates, Inc. Dallas, Texas.
 Traffic Impact Analysis Alliance Cole Avenue Residential Site Dallas, Texas February 15, 2018 Kimley-Horn and Associates, Inc. Dallas, Texas Project #064524900 Registered Firm F-928 Traffic Impact Analysis
APPENDIX C1 TRAFFIC ANALYSIS DESIGN YEAR TRAFFIC ANALYSIS
 APPENDIX C1 TRAFFIC ANALYSIS DESIGN YEAR TRAFFIC ANALYSIS DESIGN YEAR TRAFFIC ANALYSIS February 2018 Highway & Bridge Project PIN 6754.12 Route 13 Connector Road Chemung County February 2018 Appendix
DRAFT TRANSPORTATION IMPACT STUDY CASTILIAN REDEVELOPMENT PROJECT
 DRAFT TRANSPORTATION IMPACT STUDY CASTILIAN REDEVELOPMENT PROJECT Prepared for: Submitted by: 299 Lava Ridge Ct. Suite 2 Roseville, CA. 95661 June 212 TABLE OF CONTENTS 1. Introduction... 1 Project Location
MEMO VIA . Ms. Amy Roth DPS Director, City of Three Rivers. To:
 MEMO To: Ms. Amy Roth DPS Director, City of Three Rivers VIA EMAIL From: Michael J. Labadie, PE Julie M. Kroll, PE, PTOE Brandon Hayes, PE, P.Eng. Fleis & VandenBrink Date: January 5, 2017 Re: Proposed
TRAFFIC SIMULATION IN REGIONAL MODELING: APPLICATION TO THE INTERSTATEE INFRASTRUCTURE NEAR THE TOLEDO SEA PORT
 MICHIGAN OHIO UNIVERSITY TRANSPORTATION CENTER Alternate energy and system mobility to stimulate economic development. Report No: MIOH UTC TS41p1-2 2012-Final TRAFFIC SIMULATION IN REGIONAL MODELING: APPLICATION
Act 229 Evaluation Report
 R22-1 W21-19 W21-20 Act 229 Evaluation Report Prepared for Prepared by Table of Contents 1. Documentation Page 3 2. Executive Summary 4 2.1. Purpose 4 2.2. Evaluation Results 4 3. Background 4 4. Approach
Speed Limit and Safety Nexus Studies for Automated Enforcement Locations in the District of Columbia 3rd Street Tunnel at Massachusetts Avenue Exit
 Speed Limit and Safety Nexus Studies for Automated Enforcement Locations in the District of Columbia 3rd Street Tunnel at Massachusetts Avenue Exit Study Area and Location District PSA Ward ANC Phase Description
County State Aid Highway 32 (Cliff Road) and Dodd Road Intersection Study
 and Dodd Road Intersection Study") County State Aid Highway 32 (Cliff Road) and Dodd Road Intersection Study City of Eagan, Dakota County, Minnesota Date: March 2012 Project No. 14957.000 444 Cedar Street, Suite 1500 Saint Paul, MN 55101
County State Aid Highway 32 (Cliff Road) and Dodd Road Intersection Study City of Eagan, Dakota County, Minnesota Date: March 2012 Project No. 14957.000 444 Cedar Street, Suite 1500 Saint Paul, MN 55101
City of Pacific Grove
 Regional Study Utilizing Caltrans Intersection Evaluation Section 7: City of Pacific Grove s: FIRST STREET AT CENTRAL AVENUE Transportation Agency for Monterey County Prepared by Transportation Agency
Safety Assessment. Intersection of Route 29 (Seminole Trail) and Ashwood Blvd (Route 1670). Albemarle County
 and Ashwood Blvd (Route 1670). Albemarle County") Safety Assessment for Intersection of Route 29 (Seminole Trail) and Ashwood Blvd (Route 1670). Albemarle County Prepared by: VIRGINIA DEPARTMENT OF TRANSPORTATION Northwestern Regional Operations - Traffic
Safety Assessment for Intersection of Route 29 (Seminole Trail) and Ashwood Blvd (Route 1670). Albemarle County Prepared by: VIRGINIA DEPARTMENT OF TRANSPORTATION Northwestern Regional Operations - Traffic
Waco Rapid Transit Corridor (RTC) Feasibility Study
 Feasibility Study") Waco Rapid Transit Corridor (RTC) Feasibility Study Chris Evilia, Director of Waco Metropolitan Planning Organization Allen Hunter, General Manager Waco Transit System Jimi Mitchell, Project Manager AECOM
Waco Rapid Transit Corridor (RTC) Feasibility Study Chris Evilia, Director of Waco Metropolitan Planning Organization Allen Hunter, General Manager Waco Transit System Jimi Mitchell, Project Manager AECOM
Subarea Study. Manning Avenue (CSAH 15) Corridor Management and Safety Improvement Project. Final Version 1. Washington County.
 Corridor Management and Safety Improvement Project. Final Version 1. Washington County.") Subarea Study Manning Avenue (CSAH 15) Corridor Management and Safety Improvement Project Final Version 1 Washington County June 12, 214 SRF No. 138141 Table of Contents Introduction... 1 Forecast Methodology
Subarea Study Manning Avenue (CSAH 15) Corridor Management and Safety Improvement Project Final Version 1 Washington County June 12, 214 SRF No. 138141 Table of Contents Introduction... 1 Forecast Methodology
US 81 Bypass of Chickasha Environmental Assessment Public Meeting
 US 81 Bypass of Chickasha Environmental Assessment Public Meeting March 14, 2013 Introductions ODOT FHWA SAIC Meeting Purpose Present need for bypass Provide responses to 10/04/11 public meeting comments
2030 Multimodal Transportation Study
 2030 Multimodal Transportation Study City of Jacksonville Planning and Development Department Prepared by Ghyabi & Associates April 29,2010 Introduction Presentation Components 1. Study Basis 2. Study
Traffic Management Plan and Queuing Analysis Lakehill Preparatory School Z Hillside Drive, Dallas, TX October 27, 2015
 Traffic Management Plan and Queuing Analysis Lakehill Preparatory School Z145-235 2720 Hillside Drive, Dallas, TX October 27, 2015 Introduction: The Lakehill Preparatory School is located on the northeast
COUNTY ROAD SPEED LIMITS. Policy 817 i
 Table of Contents COUNTY ROAD SPEED LIMITS Policy 817.1 PURPOSE... 1.2 APPLICABILITY... 1.3 DEFINITIONS... 1.4 STATE ENABLING LEGISLATION... 2.5 SPEED LIMITS ON COUNTY ROADS (CCC 11.04)... 2.6 ESTABLISHING
MINERVA PARK SITE TRAFFIC IMPACT STUDY M/I HOMES. September 2, 2015
 5500 New Albany Road Columbus, Ohio 43054 Phone: 614.775.4500 Fax: 614.775.4800 Toll Free: 1-888-775-EMHT emht.com 2015-1008 MINERVA PARK SITE TRAFFIC IMPACT STUDY M/I HOMES September 2, 2015 Engineers
Study Area and Location District PSA Ward ANC Phase Description C Existing 100 Block Michigan Avenue Northeast Westbound
 Speed Limit and Safety Nexus Studies for Automated Enforcement Locations in the District of Columbia 1 Block Michigan Avenue NE W/B Study Area and Location District PSA Ward ANC Phase Description 5 45
CITY CLERK. Warrants for All-Way Stop Sign Control and 40 km/h Maximum Speed Limits
 CITY CLERK Clause embodied in Report No. 9 of the, as adopted by the Council of the City of Toronto at its Special Meeting held on July 30, 31 and August 1, 2002. 10 Warrants for All-Way Stop Sign Control
STRATEGIC PRIORITIES AND POLICY COMMITTEE MAY 5, 2016
 STRATEGIC PRIORITIES AND POLICY COMMITTEE MAY 5, 2016 Shift Rapid Transit Initiative Largest infrastructure project in the city s history. Rapid Transit initiative will transform London s public transit
WELLS COUNTY TRANSPORTATION PLAN
 WELLS COUNTY TRANSPORTATION PLAN 2010 NORTHEASTERN INDIANA REGIONAL COORDINATION COUNCIL INTRODUCTION The Northeastern Indiana Regional Coordinating Council has conducted the transportation planning activities
The Eastern Connector Study November, 2007 planning for the future
 The Eastern Connector Study November, 2007 planning for the future In late 2006, Albemarle County and the City of Charlottesville jointly initiated the Eastern Connector Corridor Study. The Project Team
Purpose and Need Report
 Purpose and Need Report State Highway (SH) 29 From Southwestern Boulevard to SH 95 Williamson County, Texas (CSJ: 0337-02-045) Prepared by Blanton & Associates, Inc. Date: November, 2015 The environmental
Major Widening/New Roadway
 Revised Evaluation s Major Widening/New Roadway This page provides a summary of any revisions made to the draft scores presented at the October th Attributable Funds Committee meeting. The information
TRANSPORTATION TECHNICAL REPORT
 TRANSPORTATION TECHNICAL REPORT for Sunrise Elementary School Replacement PREPARED FOR: Puyallup School District PREPARED BY: 6544 NE 61 st Street, Seattle, WA 98115 ph: (26) 523-3939 fx: (26) 523-4949
POLICY AND PROCEDURE FOR SPEED HUMP INSTALLATION. Effective Date: July 10, 2013
 CITY OF MORENO VALLEY DEPARTMENT OF PUBLIC WORKS TRANSPORTATION ENGINEERING DIVISION Administration Policy #A-14A POLICY AND PROCEDURE FOR SPEED HUMP INSTALLATION Effective Date: July 10, 2013 Approved
South Lexington Transportation Study Lexington, Massachusetts
 South Lexington Transportation Study Lexington, Massachusetts Preliminary Findings and Options for Consideration Businesses Meeting 10/10/13 Town of Lexington Engineering and Planning Departments Meeting
appendix 4: Parking Management Study, Phase II
 appendix 4: Parking Management Study, Phase II A4-1 A4-2 Eastlake Parking Management Study Final Phase 2 Report Future Parking Demand & Supply January 6, 2017 Submitted by Denver Corp Center III 7900 E.
Dixie Transportation Planning Office
 A project must be given a yes rating on items 1 & 2 in order to be prioritized. Sponsor: St. George City Project: Pioneer Parkway Type: Road Widening and Reconstruction Rev. 9/17/2010 Dixie Transportation
Background. Request for Decision. Pedestrian Lighting Standards for Road Right-of-ways. Recommendation. Presented: Monday, Mar 17, 2014
 Presented To: Operations Committee Request for Decision Pedestrian Lighting Standards for Road Right-of-ways Presented: Monday, Mar 17, 2014 Report Date Thursday, Mar 06, 2014 Type: Presentations Recommendation
GASOLINE SERVICE STATION 1618, 1622 ROGER STEVENS DRIVE OTTAWA, ONTARIO TRANSPORTATION IMPACT ASSESSMENT. Prepared for:
 GASOLINE SERVICE STATION 1618, 1622 ROGER STEVENS DRIVE OTTAWA, ONTARIO TRANSPORTATION IMPACT ASSESSMENT Prepared for: Invecta Development (Ottawa) Corporation 758 Shanks Height Milton, ON L9T 7P7 May
ROAD SAFETY AUDIT. Main St. (U.S. Route 7, Routes 23 & 41) at South Main St. (U.S. Route 7) and Maple Ave. (Routes 23 & 41) MassDOT Project #607756
 at South Main St. (U.S. Route 7) and Maple Ave. (Routes 23 & 41) MassDOT Project #607756") ROAD SAFETY AUDIT Main St. (U.S. Route 7, Routes 23 & 41) at South Main St. (U.S. Route 7) and Maple Ave. (Routes 23 & 41) MassDOT Project #607756 Town of Great Barrington August 13, 2015 Prepared For:
ROAD SAFETY AUDIT Main St. (U.S. Route 7, Routes 23 & 41) at South Main St. (U.S. Route 7) and Maple Ave. (Routes 23 & 41) MassDOT Project #607756 Town of Great Barrington August 13, 2015 Prepared For: