APPENDIX B. Fire Flow Evaluation in the High Severity Zones TM February 16, 2012
|
|
|
- Darcy Shaw
- 5 years ago
- Views:
Transcription
1 APPENDIX B Fire Flow Evaluation in the High Severity Zones TM February 16, 2012
2


3
4 Technical Memorandum February 16, 2012 Page 2 Oakmont Pressure Zones (A8, R12 and reduced R12, and R15) Wild Oak Pressure Zones (R13 and reduced R12, and R14 and reduced R14) The Hillside Pressure Zones have storage tanks located in each zone that contains fire flow storage volume, except for R15. The size of most storage tanks in the City s Hillside Pressure Zones is small, and will not be able to accommodate a 1,500 gpm fire flow for multiple hours. Table 1 presents the storage tank volume for each Hillside Pressure Zone and the total hours that each storage tank can provide supply during a 1,500 gpm fire flow event. Table 1. Storage Tank Volume in Hillside Pressure Zones and Hours Available while Serving 1,500 gpm Fire Flow (a) Hours Available to Serve 1,500 gpm Fire Flow with Tank 100% Full Hours Available to Serve 1,500 gpm Fire Flow with Tank 50% Full Tank Pressure Zone Volume, MG R1 (Tanks R1A and R1B) R2 (Tanks R2A and R2B) R R4 (Tanks R4A and R4B) R R R R R9 (Tanks R9A, R9B and R9C) R R R12 (Tanks R2A and R2B) R R R R (a) Does not include system maximum day demand. Based on discussion with City staff, hydraulic model runs were to be evaluated under two storage tank level conditions. These hydraulic model runs include evaluating available fire flow when the storage tank level is at 90 percent of the tank overflow level, and when the storage tank level is near empty, requiring the pump station providing water to fill this tank to be operating. When the storage tank level is 90 percent, the pump station that serves the same zone is assumed to be offline. o\c\405\ \wp\120211_1 TM FireFlow Analysis
5 Technical Memorandum February 16, 2012 Page 3 HYDRAULIC RESULTS Hydraulic analyses were conducted under existing maximum day demand conditions. The available fire flow results were simulated at the model nodes where actual hydrants are located. However, the hydraulic model developed in 2007 doesn t include 100 percent of the actual hydrants in the City Hillside Pressure Zones. Based on discussion with the City staff, West Yost added additional nodes in the smaller Hillside Pressure Zones to represent 100 percent of actual hydrants. However, for the larger Hillside Pressure Zones, as discussed and agreed to by City staff, West Yost only added approximately 80 percent of the actual hydrants into the hydraulic model. These hydrants represent hydrants located at the highest elevation or furthest away from major transmission mains. The hydraulic model results are discussed in the following sections. Hillside Pressure Zones Storage Tank Level at 90 percent and Booster Pump Station is Offline Figure 2 presents the currently available fire flow results under a system condition where the storage tank levels in the Hillside Pressure Zones are 90 percent full, and the booster pump stations are offline. As presented on Figure 2, the existing water system with the tank level at 90 percent in the Hillside Pressure Zones R4, R6, R9, R13 and R17 could not provide 1,500 gpm fire flow demands while maintaining a required minimum 20 psi system residual pressure. Results also indicated that the existing system in the Aqueduct Zone within Oakmont area (A8) could not meet 1,500 gpm fire flow demands. This area is mostly served from 6-inch or 8-inch diameter pipelines through system check valves that convey water from Sonoma County Water Agency (SWCA) into the City s existing system. Fire flow deficiencies in this area were mainly observed on 6-inch diameter dead-end pipelines that are undersized. The fire flow deficiencies in the Hillside Pressure Zones R6, R9 and R13 are a result of dead-end pipelines, and the fire flow deficiency in R11 is located near the R11 storage tank site. These areas were not included in the evaluation to determine required improvements to meet 1,500 gpm fire flow demands because: 1) there is no potential for providing system looping to these dead-end areas or tank site; or 2) there are nearby hydrants that can be used to supplement and to meet the 1,500 fire flow demand requirement. Hydraulic results for R4 and R17 indicated that the existing water system with the tank level at 90 percent full and no pump station operating is not adequate to meet the required 1,500 gpm fire flow demands. Because these two pressure zones also have booster pump stations, West Yost evaluated the capacity of the existing pump station to provide 1,500 gpm fire flow demands when the tank is nearly empty. The results are described in the Hillside Pressure Zone Storage Tank Level near Empty with Booster Pump Station Online Section. Hillside Pressure Zone Storage Tank Level near Empty with Booster Pump Station Online Figure 3 presents the available fire flow results simulated with the storage tank level at near empty and the booster pump station operating. Under this system condition, there is no flow from storage tank into each of the Hillside Pressure Zones. o\c\405\ \wp\120211_1 TM FireFlow Analysis
6 Technical Memorandum February 16, 2012 Page 4 As shown on Figure 3, the existing water system with fire flow demands to be served from the booster pump station could not provide 1,500 gpm fire flow demands in Pressure Zones R4, R6, R8, R9, R11, R13, R14 and R17. The available fire flow deficiencies in Pressure Zones R6, R8, R9 and R11 are related to either the undersized dead-end pipelines or due to high elevations near the storage tank site; consequently, West Yost did not evaluate the system improvements required to meet the minimum 1,500 fire flow demands in these areas. To meet 1,500 gpm fire flow demands in Pressure Zones R4, R13, R14, R16 and R17, West Yost evaluated the pumping capacity at each pump stations that supplies flow to these pressure zones. Table 2 presents the existing pumping capacity at Pressure Zones R4, R13, R14, R16 and R17. Table 2. Existing Pumping Capacity Total Demand During Maximum Day Demand plus 1,500 gpm Fire Flow, gpm Sufficient Existing Pumping Capacity to Provide 1,500 gpm Fire Flow Pump Station Total Existing Pumping Capacity, gpm Maximum Day Demand, gpm Total Maximum Day Demand (a), gpm S4 5, ,196 2,696 Yes S13 2, ,560 Yes S14 2, ,534 Yes S16 1, ,791 No S17 1, ,766 No (a) Calculated based on cascaded demand of each pressure zone, for instance, Pump Station S4 existing maximum day demand requirement of 1,196 gpm equals to the summation of the maximum day demands in Pressure Zones R16 and R17. The following sections discuss the pumping evaluation and the hydraulic model simulation results for Pressure Zones R4, R16, R17, R13 and R14. Pressure Zones R4, R16 and R17 As shown on Table 2, the total existing pumping capacity at Station R4 is adequate to provide the 1,500 gpm fire flow; however, Pumping Stations S16 and 17 are not adequate to meet the minimum fire flow requirement. Pressure Zone R16 conveys water to Pressure Zone R17 through pump station S16. Therefore, the pumping capacity at Station S16 includes the total maximum day demands in Pressure Zones 16 and 17. The pumping deficiency at Station S16 is 671 gpm and the pumping deficiency at Station S17 is 116 gpm. As illustrated on Figure 3, the available fire flow demands at some hydrants in Pressure Zone R4 are less than the 1,500 gpm minimum requirement. Although Station S4 has the capacity to deliver the 1,500 gpm fire flow under maximum day demand condition, the accumulated head losses through the existing 12-inch diameter pipelines along Del Rosa Avenue, Osage Avenue and Alta Vista Avenue, and the existing 14-inch diameter pipelines along Farmers Lane causes the water system to be inadequate to deliver 1,500 gpm fire flow demands at 20 psi system residual pressure to the highest hydrant in Pressure Zone R4. Although, the replacement of these existing 12-inch and 14-inch diameter pipelines to 16-inch diameter pipelines would reduce head losses and increase the resultant fire flow demands in Pressure Zone R4, the required pipeline construction along Farmers Lane will be extremely difficult and is not preferable by the City. o\c\405\ \wp\120211_1 TM FireFlow Analysis
7 Technical Memorandum February 16, 2012 Page 5 Therefore, the City requested West Yost evaluate an alternate solution. This alternate solution was to use the Proctor Pump station to provide fire flow to Pressure Zone 4. The Proctor Pump Station is currently not being operated. It is supplied by two Proctor Tanks that are also currently not operated. These tanks float off the City s Aqueduct Zone, and the total storage capacity of these tanks is 5.2 MG. Proctor Pump Station has a total pumping capacity of 2,600 gpm which is adequate to supply the 1,500 gpm fire flow demand requirement. Figure 4 presents the simulated available fire flow in Pressure Zone 4 from the hydraulic model run with the Proctor Pump Station and the replacement of the 12-inch diameter pipelines to 16- inch diameter pipelines (approximately 2,342 lf) configurations. The results indicate that utilizing the Proctor Pump Station and upsizing the existing 12-inch diameter pipeline could provide the 1,500 gpm fire flow demands while maintaining 20 psi system residual pressure in Pressure Zone R4. The capital cost estimate for this improvement is estimated in the Capital Improvement Cost Section of this TM. For Pressure Zones R16 and R17, West Yost evaluated the total hydraulic head required for the pump to provide a required minimum 20 psi system residual pressure at the highest hydrant in Pressure Zones R16 and R17. Results indicate that the existing total dynamic head at Stations S16 and S17 are inadequate to serve 20 psi residual pressure at the highest hydrant elevation locations in Pressure Zones R16 and R17 due to accumulated pipeline head loss. Using the hydraulic model run, West Yost estimated the required total dynamic head for stations S16 and S17 to deliver a 1,500 gpm fire flow while maintaining 20 psi system residual pressure. Table 3 provides the summary of this evaluation. Based on these data, West Yost reran the hydraulic model with pump improvements at Stations S16 and S17. Pump Station 16 was simulated in the hydraulic model with a pumping capacity of 1,000 gpm and a total dynamic head (TDH) of 243 feet at each pump, and pumps at Station 17 were simulated in the hydraulic model with a pumping capacity of 1,000 gpm with a TDH of 220 feet at each pump. Hydraulic results indicated these pump improvements could deliver 1,500 gpm fire flow while maintaining 20 psi system residual pressure at the highest hydrant. Figure 5 presents simulated available fire flow under these pump improvement conditions. Table 3. Total Dynamic Head and Highest Hydrant Elevation (a) Pump Station Pump Station Elevation, feet Total Dynamic Head, feet Highest Hydrant Elevation, feet Required Total Dynamic Head at the Pump Station to Deliver 1,500 gpm Fire Flow Demand at 20 psi Residual Pressure (a) S S Estimated based on hydraulic model run which includes pipeline headlosses. After presenting these hydraulic results and required improvements for Pressure Zones R16 and R17 to the City staff, due to City concerns regarding extremely difficult construction conditions for the proposed pipeline replacement project, the City requested that West Yost evaluate an alternate option. This option would provide the fire flow in Pressure Zone R17 through the emergency pump station S18, which is supplied by Pressure Zones R3, R2 and R1. Currently, the o\c\405\ \wp\120211_1 TM FireFlow Analysis
8 Technical Memorandum February 16, 2012 Page 6 City has storage capacity and pumping capacity in Pressure Zones R2 and R1. However, Station S3 does not have the pumping capacity to provide the 1,500 gpm fire flow to Pressure Zone R17 as presented on Table 4. West Yost also identified a pipeline restriction along Fountaingrove Parkway, east of Fir Ridge Drive. This existing pipeline, approximately 606 lineal feet (lf), is a 10-inch diameter pipeline. To deliver 1,500 gpm demand from Station S3 to Station S18, this existing 10-inch pipeline has to be replaced with a 12-inch diameter pipeline. Figure 6 presents the available fire flow in Pressure Zone R17 under this proposed supply configuration. Table 4. Existing Pumping Capacity in Pressure Zones R1, R2, R3 Total Demand during Maximum Day Demand plus 1,500 gpm Fire Flow, gpm Sufficient Existing Pumping Capacity to Provide 1,500 gpm Fire Flow Pump Station Total Existing Pumping Capacity, gpm Maximum Day Demand, gpm Total Maximum Day Demand (a), gpm S1 5, ,367 Yes S2 4, (b) 2,240 Yes S3 1, (c) 1,932 No S18 1, ,766 No (a) (b) (c) Calculated based on cascaded demand of each pressure zone, for instance, Pump Station Ss existing maximum day demand requirement of 1,196 gpm equals to the summation of the maximum day demands in Pressure Zones R1, R2, R5 and R3. Includes Pressure Zone R5 maximum day demand of 37 gpm. Includes Pressure Zone R17 maximum day demand of 266 gpm. The upgrade of Pump Station S3 and the replacement of the existing 10-inch pipeline to a 12-inch diameter pipeline would also provide an alternate supply solution for providing fire flow in Pressure Zone R4 without the pipeline replacement along Del Rosa Avenue, Osage Avenue and Alta Vista Avenue. Based on discussion with City staff, the construction along Del Rosa Avenue will be difficult and is not preferable by the City. This alternate fire flow supply solution includes operating the City s bypass pressure regulator stations located at Pump Stations S17 and S16. The City needs to operate Pump Station S18 to move flow from the upgraded Pump Station S3 into Pressure Zone R17 which will continually flow through the bypasses at Stations S17 and S16 to Pressure Zone R4. Under this alternate supply configuration, the City also needs to operate the Proctor Pump Station, S20, to supplement the fire flow demand in Pressure Zone R4, so flow is actually being provided from two different source areas. West Yost ran the hydraulic model under this alternate supply configuration to determine the fire flow availability in Pressure Zone R4. Results indicate that this alternate supply configuration could meet the 1,500 gpm fire flow demands while maintaining the required 20 psi system pressure. Only a few areas which are located on dead-end pipelines could not meet the 1,500 gpm fire flow demand requirement during maximum day demand conditions. The hydraulic results for the available fire flow under this alternate supply configuration for Pressure Zone R4 is presented on Figure 7. o\c\405\ \wp\120211_1 TM FireFlow Analysis
9 Technical Memorandum February 16, 2012 Page 7 Pressure Zones R13 and R14 Table 2 shows that Stations S13 and S14 have sufficient existing pumping capacity to meet maximum day demand plus a 1,500 gpm fire flow demand. However, based on hydraulic results, the system could not provide 1,500 gpm fire flow demands while maintaining the required minimum 20 psi system residual pressure at hydrants located in these pressure zones. In Pressure Zone R13, the hydrants that could not meet the 1,500 gpm fire flow are located on an existing 6-inch diameter dead-end and long pipeline, approximately 1,994 lf. The accumulated head loss on this existing pipeline causes the fire flow deficiency. To meet the 1,500 gpm fire flow demand while maintaining the 20 psi system residual pressure, about 876 lf of the existing 6- inch diameter pipeline is required to be upsized to an 8-inch diameter pipeline. Most hydrants located in Pressure Zone R14 could not meet the required 1,500 fire flow while maintaining 20 psi system residual pressure. Because the pump station, S14, has the flow capacity, West Yost evaluated the total dynamic head at this station. Based on hydraulic model runs, West Yost identified the required total dynamic head at Station S14 to deliver 1,500 gpm fire flow demand at 20 psi system residual pressure, and it is presented on Table 5. Table 5. Total Dynamic Head and Highest Hydrant Elevation (b) Pump Station Pump Station Elevation, feet Total Dynamic Head, feet Highest Hydrant Elevation, feet Required Total Dynamic Head at the Pump Station to Deliver 1,500 gpm Fire Flow Demand at 20 psi Residual Pressure (a) S Estimated based on hydraulic model run which includes pipeline head losses. With the pipeline improvement in Pressure Zone R13 and the pump improvement in Pressure Zone R14, the hydraulic model was rerun. Results indicated the system could provide the 1,500 gpm fire flow demand while maintaining 20 psi system residual pressure. Figure 8 presents the simulated available fire flow at the required minimum 20 psi system residual pressure. Required Improvements This section summarizes the improvements required by pressure zone to meet the minimum 1,500 gpm fire flow demand during maximum day demand condition while maintaining a required minimum 20 psi system residual pressure. Pressure Zone R4 Alternate 1 Operate Proctor Pump Station and Proctor Tanks Replace 2,342 lf of existing 12-inch diameter pipeline along Del Rosa Avenue, Osage Avenue and Alta Vista Avenue with a 16-inch diameter pipeline o\c\405\ \wp\120211_1 TM FireFlow Analysis
10 Technical Memorandum February 16, 2012 Page 8 Alternate 2 (Recommended Alternative) Replace pumps at Station S3 Replace 606 lf of existing 10-inch diameter pipeline along Fountaingrove Parkway, east of Fir Ridge Drive with a 12-inch diameter pipeline Pressure Zones R16 and R17 Alternate 1 Replace pumps at Station S17 Replace pumps at Station S16 Alternate 2 (Recommended Alternative) Pressure Zone R13 Replace pumps at Station S3 Replace 606 lf of existing 10-inch diameter pipeline along Fountaingrove Parkway, east of Fir Ridge Drive with a 12-inch diameter pipeline Replace 876 lf of existing 6-inch diameter pipeline, east of Station S13, with an 8-inch diameter pipeline Pressure Zone R14 Replace pumps at Station S14 CAPITAL IMPROVEMENTS COSTS The probable construction cost for each improvement was calculated based on data supplied by manufacturers, published industry standard cost data and curves, construction costs provided by the City, and construction costs previously estimated by West Yost for similar facilities with similar construction cost indexes. The City provided West Yost the pipeline unit cost of $600 per lineal feet which is based on the City s Unit Cost that includes all pipeline cost and roadway repair cost. Table 6 presents the construction cost to meet the 1,500 gpm fire flow requirement in Pressure Zones R4, R16 and R17. The construction cost for Pressure Zones R16 and R17 include pump replacements (Alternate 1) at Station S16 and S17. The total pump replacement construction cost is $3.48M. The total construction cost to replace the existing 12-inch diameter pipeline with a 16-inch diameter pipeline in Pressure Zone R4 is $2.04M. Table 7 presents the construction cost to meet the 1,500 gpm fire flow requirement in Pressure Zones R4, R16 and R17 under the City s requested alternate supply (Alternate 2 (Recommended Alternative)) to provide fire flow demand in Pressure Zones R4 and R17 through Station S18. The construction cost for upgrading Station S3 is $1.74M and construction cost to replace pipeline along Fountaingrove Parkway is $0.53M. o\c\405\ \wp\120211_1 TM FireFlow Analysis
11 Improvement Type Improvement Description Pressure Zone Quantity Estimated Construction Cost CIP Cost (includes mark-ups) (c,d) Pump Station Upgrade CIP S16 Booster Pump Station 4.32 mgd at S16 R16 1 L.S. $ 1,196,385 $ 1,735,000 S17 Booster Pump Station 4.32 mgd at S17 R17 1 L.S. $ 1,196,385 $ 1,735,000 Pump Station CIP Subtotal $ 3,470,000 New Pipeline and Pipeline Replacement CIP R4 Pipeline Replacement 16-inch diameter pipeline (from 12-inch diameter pipeline) R4 2,342 lf $ 1,405,232 $ 2,038,000 Pipeline CIP Subtotal Total Capital Improvement Cost $ 2,038,000 $ 5,508,000 (b) Pipeline Unit Cost is based on City's Unit Cost which includes all pipeline cost and roadway repair cost. (a) Pump Station Costs shown are presented in November 2011 dollars based on an ENR CCI of 9173 (20-City Average). (c) Costs include mark-ups equal to 45 percent (General Contingency: 20 percent; Design and Planning: (d) Total rounded to nearest $1,000. (a, b) Table 6. Summary of Alternative 1 Construction Costs to Meet Fire Flow Requirement in Pressure Zones R4, R16 and R17 10 percent; Construction Management: 10 percent; and Program Administration: 5 percent). W E S T Y O S T A S S O C I A T E S O:\C\405\ \ENGR\Capital Improvement\R4-R16-R17.xlsx Last Revised: City of Santa Rosa Fire Flow Evaluation
12 Improvement Type Pump Station Upgrade CIP Table 7. Summary of Alternative 2 (Recommended Alternative) Construction Costs to Meet 1,500 gpm Fire Flow Requirement for Pressure Zones R4, R16 and R17 Improvement Description Pressure Zone Estimated Construction Cost CIP Cost (includes mark-ups) (c,d) S3 Booster Pump Station 2.88 mgd at S3 R3 1 L.S. $ 1,196,385 $ 1,735,000 Pump Station CIP Subtotal $ 1,735,000 New Pipeline and Pipeline Replacement CIP R3 Pipeline Replacement 12-inch diameter pipelines (from 6-inch and 12-inch diameter pipelines) R3 606 lf $ 363,600 $ 527,000 Pipeline CIP Subtotal Total Capital Improvement Cost $ 527,000 $ 2,262,000 (b) Pipeline Unit Cost is based on City's Unit Cost which includes all pipeline cost and roadway repair cost. (a) Pump Station Costs shown are presented in November 2011 dollars based on an ENR CCI of 9173 (20-City Average). (c) Costs include mark-ups equal to 45 percent (General Contingency: 20 percent; Design and Planning: 10 percent; Construction Management: 10 percent; and Program Administration: 5 percent). (d) Total rounded to nearest $1,000. Quantity (a, b) W E S T Y O S T A S S O C I A T E S O:\C\405\ \ENGR\Capital Improvement\CIP_Option_S18_Served_R17FF.xlsx Last Revised: City of Santa Rosa Fire Flow Evaluation
13 Technical Memorandum February 16, 2012 Page 9 Table 8 presents the construction cost to meet the 1,500 gpm fire flow requirement in Pressure Zones R13 and R14. The construction cost to replace pump at Station S14 is $1.51M. The Construction cost to replace the existing 6-inch diameter pipeline in Pressure Zone R13, near Station S13 is $0.76M. The summary of all probable construction cost of system improvements to meet 1,500 gpm fire flow requirement in each Hillside Pressure Zones is presented on Table 9. o\c\405\ \wp\120211_1 TM FireFlow Analysis
14 Estimated Improvement Type Improvement Description Pressure Zone Quantity Construction Cost CIP Cost (includes mark-ups) (c,d) S14 Booster Pump Station 5.62 mgd at S14 R14 1 L.S. $ 1,509,935 $ 1,510,000 R13 Pipeline Replacement 8-inch diameter pipeline (From 6-inch diameter pipeline) R lf $ 525,600 Total Cost $ 762,000 $ 2,272,000 (b) Pipeline Unit Cost is based on City's Unit Cost which includes all pipeline cost and roadway repair cost. 10 percent; Construction Management: 10 percent; and Program Administration: 5 percent). (d) Total rounded to nearest $1,000. (a, b) Table 8. Summary of Construction Costs to Meet 1,500 gpm Fire Flow Requirement for Pressure Zones R13 and R14 (a) Pump Station Costs shown are presented in November 2011 dollars based on an ENR CCI of 9173 (20-City Average). (c) Costs include mark-ups equal to 45 percent (General Contingency: 20 percent; Design and Planning: W E S T Y O S T A S S O C I A T E S O:\C\405\ \ENGR\Capital Improvement\Oakmont_CIPrvsd_ xlsx Last Revised: City of Santa Rosa Fire Flow Evaluation
15 Technical Memorandum February 16, 2012 Page 13 Table 9. Total Dynamic Head and Highest Hydrant Elevation Pressure Zone Pipeline Upgrade Pump Replacement Total Cost To meet 1,500 gpm fire flow in Pressure Zone R4 Alternative 1 R4 $2.04M Alternative 2 (The recommended improvements for this alternative is identical to Alternative 2 for Pressure Zones R16 and R17) R3 $2.26M To meet 1,500 gpm fire flow in Pressure Zones R16 and R17 Alternate 1 R16 $1.74M R17 $1.74M Subtotal $3.48M Alternate 2 (The recommended improvements for this alternative is identical to Alternative 2 for Pressure Zone R4) (a) R3 To meet 1,500 gpm fire flow in Pressure Zones R13 and R14 R13 $0.76M R14 $1.51M (a) The recommended improvements for this alternative are identical to Alternative 2 for Pressure Zone R4 and the total cost for these improvements is listed in Alternative 2 for Pressure Zone R4. CONCLUSIONS The results of hydraulic analyses of various system configurations are summarized below. Based on the fire flow evaluation in the City s Hillside Pressure Zones, there are 4 pressure zones that could not meet the minimum required 1,500 gpm fire flow demand while maintaining the required minimum 20 psi system residual pressure. These pressure zones are R4, R17, R13 and R14. The fire flow deficiency in these zones are either resulted from accumulated head losses on downstream pipeline that convey water from the pump station into the City s water system or from lower head on the pumps that serve these pressure zones. Based on hydraulic simulated results, West Yost identified pipeline and pump improvements for these pressure zones. West Yost also evaluated the probable cost estimate for each improvement. The improvements to meet the minimum required 1,500 gpm fire flow demand for Pressure Zones R4, R17, R13 and R14 are described as follow: For Pressure Zone R4 and Pressure Zone R17 Replace pumps at Station S3. The recommended total capacity of the new pump station is 3,000 gpm (currently, Station S3 only have 2 pumps). Replace 606 lf of existing 10-inch diameter pipeline along Fountaingrove Parkway, east of Fir Ridge Drive with a 12-inch diameter pipeline. o\c\405\ \wp\120211_1 TM FireFlow Analysis
16 Technical Memorandum February 16, 2012 Page 14 Pressure Zone R13 Replace 876 lf of existing 6-inch diameter pipeline, east of Station S13, with an 8- inch diameter pipeline. Pressure Zone R14 Replace pumps at Station S14 with a total dynamic head of approximately 235 feet. The total capital costs for the identified system upgrades discussed in this TM is $4.53M. o\c\405\ \wp\120211_1 TM FireFlow Analysis


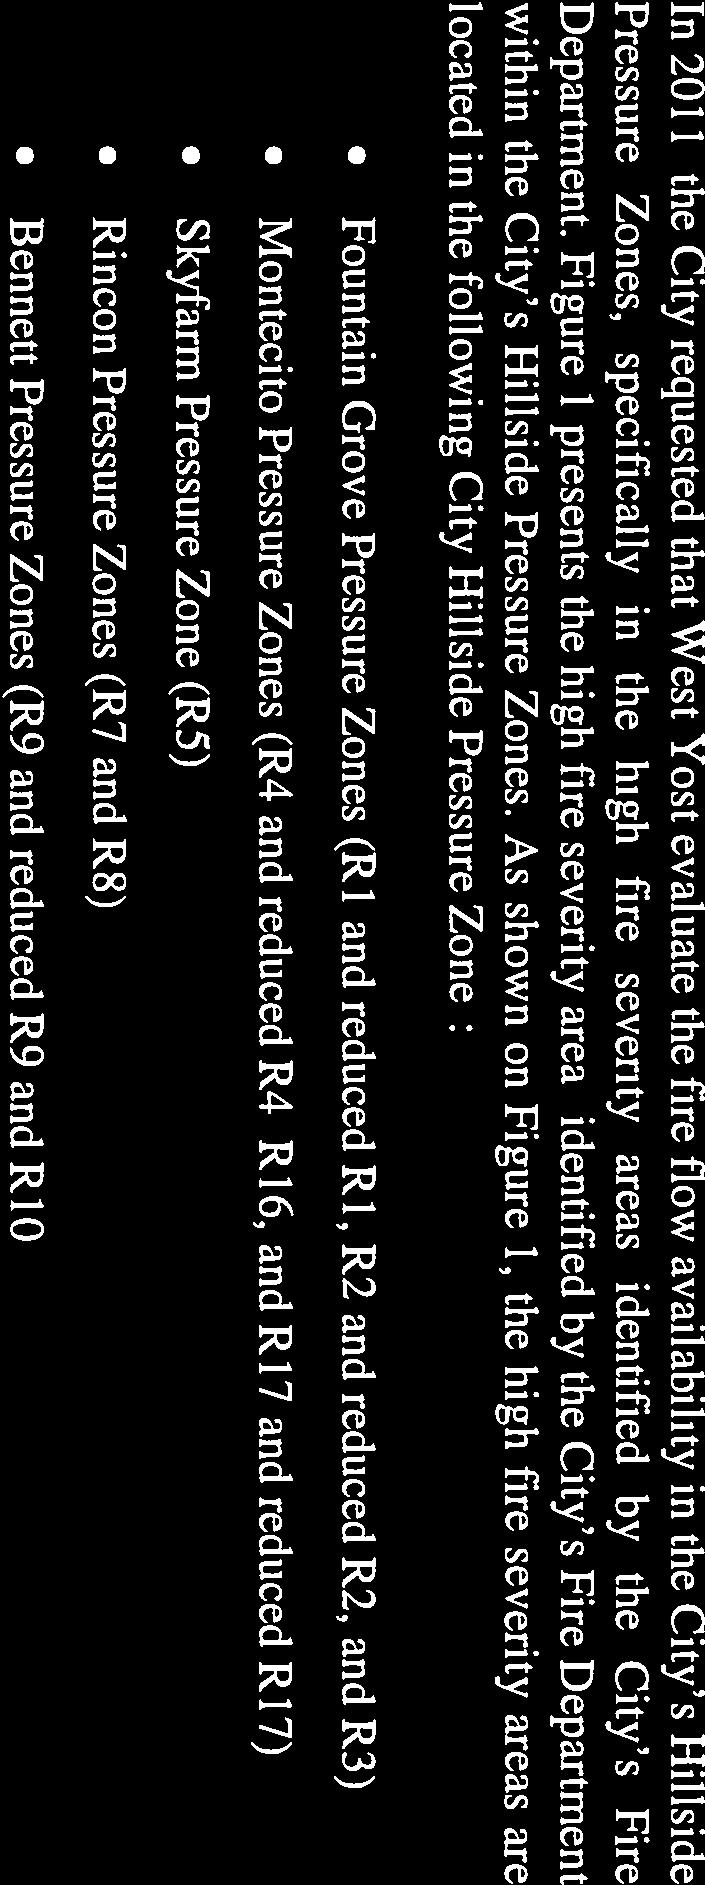
17 FIGURE 1 City of Santa Rosa Fire Flow Availability Evaluation HIGH FIRE SEVERITY AREAS BAIRD DENNIS MISSION 0 2,750 5,500 Scale in Feet 9TH FAIRFIELD OAK LEAF 12 PYTHIAN OAKMONT WRIGHT YOLANDA BURT DOWD YUBA MOUNTAIN VIEW STONE BRIDGE YERBA BUENA CALISTOGA LOS ALAMOS MELITA RINCON BADGER PARKHURST SAINT FRANCIS SUMMERFIELD O:\Clients\405 City of Santa Rosa\ On_Call Modeling Assistance\GIS\TM Figures\Fig1_HighFFSeverity.mxd 12/1/2011 SKYFARM RIEBLI MARK WEST SPRINGS SAINT ANDREWS WALLACE FOUNTAINGROVE COFFEY PINER STEELE FULTON MENDOCINO GUERNEVILLE HOPPER MONTECITO PARKER HILL MONTGOMERY CLEVELAND YULUPA COLLEGE SONOMA 4TH 5TH 3RD HOEN E B 12 BENNETT VALLEY STONY POINT SANTA ROSA RANGE D OCCIDENTAL HEARN LUDWIG R4R1 R16 CHANATE OLD REDWOOD FRANCISCO BARNES AIRWAY SAN MIGUEL CANYON BRUSH CREEK BICENTENNIAL WALTZER PETERSON MONTECITO VENTURA 101 FRANKLIN MARSH ELLIOTT FOOTHILL PACIFIC BRYDEN NORTH HUMBOLDT JENNINGS ARMORY RIDLEY MARLOW EXETER PUTNEY FRANQUETTE FARMERS 7TH VALLEJO WILSON HALL CREEKSIDE BROOKWOOD MAPLE SEBASTOPOL BETHARDS BOYD ALLAN BARHAM SEBASTOPOL ASTON COLGAN BAKER AV DUTTON WEST WRIGHT LEO BURBANK FRESNO CHICO FINLEY PRICE KAWANA SPRINGS GIFFEN GRIFFEN NORTHPOINT 101 CORBY DUTTON MEADOW FRESNO PYLE R5 R2 R1 R1R1 R2R4 R2R2 R4R2 R4R3 R3 R17 R2R3 R2R1 R17R1 R4R1 R4 R4R4 R11 R6 R6R1 R8 R7 R9 R10 R8 R15 R13 R13R1 R14 R12 R14R1 R12R1 LEGEND High Fire Severity Areas Code Hillside Pressure Zones: A8 R1 R10 R11 R12 R12R1 R13 R13R1 R14 R14R1 R15 R16 R17 R17R1 R1R1 R2 R2R1 R2R2 R2R3 R2R4 R3 R4 R4R1 R4R2 R4R3 R4R4 R5 R6 R6R1 R7 R8 R9 ASH WILJAN BELLEVUE DUTTON 101 LLANO PETALUMA HILL ROBLES MOORLAND TODD TODD RD STANDISH TODD SCENIC
18
19 WRIGHT WALLACE MISSION BAIRD O:\Clients\405 City of Santa Rosa\ On_Call Modeling Assistance\GIS\TM Figures\Fig2_90%Tank.mxd 12/5/2011 HALL Notes CHICO PRICE FULTON WRIGHT PETERSON PINER GUERNEVILLE FINLEY FRANCISCO PUTNEY BARNES 12 WALTZER MARSH DENNIS 1. All Hillside pump stations were not operated. 2. All Hillside tank levels were at 90 percent full. 3. No storage tank in R15 Pressure Zone. FRESNO EXETER MARLOW BRITTAIN OCCIDENTAL CORPORATE CENTER GRIFFEN NORTHPOINT LEGEND Available Fire Flow at 20 psi Less than 1,500 gpm Greater than 1,500 gpm COFFEY SAN MIGUEL RIDLEY SEBASTOPOL GIFFEN MARK WEST SPRINGS OLD REDWOOD HOPPER JENNINGS STONY POINT AIRWAY 9TH RANGE STEELE Pumps SCWA Tanks Tanks BURBANK R5 Skyfarm S5 S3 S18 R3 Fountain Grove 3 G! G!. R17 G!Ġ Rountain Grove 5 R3 G G!. G!.!.!. G! Ġ!. G!. G!. G R6 Rincon 1 R2A Fountain Grove R17 R2 G S2!. G!. R2R3 BADGER S17 R1A, R1B Fountain Grove R2R1 R16 Fountain Grove 6 G! R17R1 R1 S1 R4R1 R16 R7 Rincon 2 G! R2R2 S16 R4B Montecito R6 G! S7 Ġ R8 G R1R1 R4A Montecito R4R2 R4R1 G! S8 R4R3 R4 R7 S4R G! G! S6 G!. G!. Ralphine Tanks G!. 101 CLEVELAND WEST ARMORY VENTURA SEBASTOPOL High Fire Severity 101 FRANCES LEO R5 R2B Fountain Grove DUTTON HEARN THOMAS LAKE HARRIS ELLIOTT RIDGWAY MORGAN WILSON BICENTENNIAL CHANATE A BOYD MENDOCINO COLLEGE OLIVE BARHAM CORBY R2R4 SAINT ANDREWS LEWIS HUMBOLDT B 1ST SANTA ROSA 7TH FOUNTAINGROVE 5TH HEARN AV FRANKLIN SPENCER 3RD D PACIFIC NORTH 4TH E COLGAN Existing Pipelines SCWA Aqueduct PARKER HILL MAPLE VALLEJO ASTON PETALUMA HILL HIDDEN VALLEY PARKER HILL RIEBLI BRYDEN SOTOYOME TALBOT BROOKWOOD FOOTHILL R4R4 G! G! G! R6R1 G! Ġ! G! G! G! G! Farmers Lane Well G! G! S4 Ġ! G G! G! S9 G! G! G! G! G! G! G! Ġ! G!. G!!. G! G!G!Ġ!Ġ!G!Ġ!Ġ!Ġ!Ġ! G! G! G! G! G! G!Ġ!Ġ! R9 G! G! R11 Southeast G! G! G!Ġ! G! R11 S10 G! G! ALLAN S11 MONTECITO ROGERS MONTGOMERY SONOMA FARMERS BRUSH CREEK BENNETT VALLEY FRANQUETTE HOEN AVE FRONTAGE Kawana CYPRESS YULUPA RINCONADA MONTECITO HOEN CREEKSIDE TACHEVAH RINCON CANYON SUMMERFIELD BETHARDS 0 2,000 4,000 Scale in Feet PARKHURST YERBA BUENA CALISTOGA R10 SAINT FRANCIS R9A BennettR9B MELITA R10 Fairway R8 LOS ALAMOS R8 Los Alamos S15 R15 Annadel G! S13 G! Los Guilicos R13 S14 R13R1 R12 R13 Wildoak S12 R12A Oakmont 1 R14R1 R12R1 R12B Oakmont 2 R14 R14 Wildoak STONE BRIDGE OAKMONT 12 FAIRFIELD VALLEY OAKS OAK LEAF FIGURE 2 City of Santa Rosa Fire Flow Availability Evaluation AVAILABLE FIRE FLOW AT 20 PSI TANK LEVEL AT 90 PERCENT FULL AND PUMP STATIONS ARE OFFLINE PYTHIAN
20
21 WRIGHT WALLACE MISSION BAIRD O:\Clients\405 City of Santa Rosa\ On_Call Modeling Assistance\GIS\TM Figures\Fig3_10%Tank.mxd 12/5/2011 Notes MERCED HALL CHICO PRICE FULTON WRIGHT PETERSON GUERNEVILLE FINLEY FRANCISCO PINER PUTNEY BARNES 12 WALTZER MARSH 1. All Hillside pump stations were operated. 2. All Hillside tank levels were at 10 percent full. 3. No storage tank in R15 Pressure Zone. FRESNO EXETER DENNIS MARLOW BRITTAIN OCCIDENTAL CORPORATE CENTER GRIFFEN NORTHPOINT LEGEND Available Fire Flow at 20 psi Less than 1,500 gpm Greater than 1,500 gpm COFFEY SAN MIGUEL RIDLEY SEBASTOPOL GIFFEN MARK WEST SPRINGS OLD REDWOOD HOPPER JENNINGS STONY POINT AIRWAY 9TH Pumps SCWA Tanks Tanks RANGE STEELE High Fire Severity BURBANK R5 Skyfarm S5 S3 S18 R3 G Fountain Grove 3!. G! G! R3 R2A Fountain Grove R6 Rincon 1 R2B Fountain G!. G! Grove R17 Rountain G! G!. G Grove 5 R17 R2 S2 R2R3 BADGER S17 R1A, R1B Fountain Grove R2R1 R16 Fountain Grove 6 R17R1 G! G! G!. Ġ R1!. S1 R4R1 R16 R7 Rincon 2 G! R2R2 S16 R4B Montecito R6 G! S7 Ġ G R8 G R1R1!. R4A Montecito R4R2 R4R1 G! G! G G! Ġ!. G S8 R4R3!.!. G R4 R7 S4R G! G! S6 Ralphine Tanks R4R4 G! G! G! G! R6R1 Ġ! G! G! G! G! Farmers Lane Well G! G! S4 Ġ! G! G! S9 G! G! G! G! R9A G! BennettR9B G! G! Ġ! G! G!. G!!. G! G!G!Ġ!Ġ!G!Ġ!Ġ!Ġ!Ġ! G! G! G! G! G! G!Ġ!Ġ! R9 G! G! G! G!Ġ!Ġ! R11 Southeast Ġ!Ġ! G! G! G! G!Ġ!Ġ! R10 Fairway G! G!Ġ!Ġ! G! G! G!Ġ! G! G! G! R11 S10 G! G!Ġ! R10 S11 G! G! CLEVELAND WEST ARMORY VENTURA FRANCES SEBASTOPOL LEO R5 DUTTON HEARN THOMAS LAKE HARRIS ELLIOTT RIDGWAY MORGAN WILSON BICENTENNIAL CHANATE A RAILROAD BOYD MENDOCINO COLLEGE BARHAM CORBY R2R4 SAINT ANDREWS LEWIS HUMBOLDT B 1ST SANTA ROSA 7TH FOUNTAINGROVE 5TH HEARN AV FRANKLIN 3RD D NORTH SPENCER Existing Pipelines SCWA Aqueduct PACIFIC NORTH 4TH E COLGAN PARKER HILL MAPLE VALLEJO ASTON PETALUMA HILL HIDDEN VALLEY RIEBLI BRYDEN SOTOYOME TALBOT BROOKWOOD ALLAN MONTECITO FOOTHILL ROGERS MONTGOMERY SONOMA FARMERS BENNETT VALLEY Kawana BRUSH CREEK FRANQUETTE CYPRESS YULUPA RINCONADA MONTECITO HOEN CREEKSIDE TACHEVAH 0 2,000 4,000 Scale in Feet RINCON CANYON SUMMERFIELD BETHARDS PARKHURST YERBA BUENA CALISTOGA SAINT FRANCIS MELITA R8 LOS ALAMOS R8 Los Alamos S15 R15 Annadel G! S13 G! Los Guilicos R13 S14 R13R1 R12 R13 Wildoak S12 R12A Oakmont 1 R14R1 G! R12R1 Ġ!. R12B Oakmont 2 R14 R14 Wildoak STONE BRIDGE OAKMONT 12 FAIRFIELD VALLEY OAKS OAK LEAF FIGURE 3 City of Santa Rosa Fire Flow Availability Evaluation AVAILABLE FIRE FLOW AT 20 PSI TANK LEVEL AT 10 PERCENT FULL AND PUMP STATIONS ARE ONLINE PYTHIAN
22
23 PETERSON WALLACE BAIRD O:\Clients\405 City of Santa Rosa\ On_Call Modeling Assistance\GIS\TM Figures\Fig4_R4_Proctor.mxd 2/13/2012 R5 Skyfarm R5 SAINT ANDREWS R2R4 S5 S3 R2B Fountain Grove R3 R2A Fountain Grove PARKER HILL S18 R3 Fountain Grove 3 R17 Rountain Grove 5 R17 R6 Rincon 1 FULTON Notes FRANCISCO PINER GUERNEVILLE PUTNEY BARNES WALTZER MARSH DENNIS MARLOW STONY POINT SAN MIGUEL 1. Proctor pumps were operated. 2. S4 pumps were not operated. 3. R4A and R4B tank levels were at 10 percent full (assume no flow). EXETER HOPPER Most hydrants that have available fire flow less than 1,500 gpm are located on dead-end pipeline COFFEY STEELE JENNINGS LEGEND Available Fire Flow at 20 psi Pumps Less than 1,500 gpm Pipeline Replacement Greater than 1,500 gpm (from 12-inch to 16-inch diameter) SCWA Tanks Tanks RIDLEY AIRWAY OLD REDWOOD RANGE MENDOCINO AVE DUTTON 101 BICENTENNIAL 9TH CLEVELAND ARMORY FRANCES R1 S1 High Fire Severity Existing Pipelines SCWA Aqueduct THOMAS LAKE HARRIS ADMINISTRATION MORGAN 9TH ELLIOTT RIDGWAY gpm 663gpm 725gpm 771gpm R1R1 G!. A MENDOCINO HEALDSBURG B S2 HUMBOLDT 1034gpm HUMBOLDT LEWIS COLLEGE 7TH FOUNTAINGROVE S4R FRANKLIN SPENCER E NORTH PACIFIC 5TH BROOKWOOD 3RD R2 R2R3 R1A, R1B Fountain Grove R2R2 R4R2 R4R1 R4R3 PARKER HILL 531gpm 569gpm 1239gpm 1133gpm R4R1 Proctor Tanks and Pump Station 4TH CHANATE HIDDEN VALLEY TERRACE R2R1 BRYDEN 0 1,250 2,500 Scale in Feet 1395gpm TALBOT R4 GRAHN R17R1 MONTECITO S17 FOOTHILL ROGERS MONTGOMERY R16 S16 R4B Montecito S4 FARMERS R16 Fountain Grove 6 R4R4 R6R1 SONOMA R4A Montecito Farmers Lane Well BRUSH CREEK FRANQUETTE R6 12 MISSION YULUPA BADGER MIDDLE RINCON RINCONADA SUMMERFIELD RINCON MONTECITO CANYON HOEN SAINT MARYS R9 PARKHURST S7 S6 CALISTOGA DUPONT Ralphine Tanks YERBA BUENA FIGURE 4 City of Santa Rosa Fire Flow Availability Evaluation AVAILABLE FIRE FLOW AT 20 PSI TANK LEVEL AT 10 PERCENT FULL FOR R4 PRESSURE ZONE (with Proctor Pump Station and Pipeline Replacement) R7 SAINT FRANCIS R7 Rincon 2 MELITA S8 R8 R8 R8 LOS ALAMOS
24
25 O:\Clients\405 City of Santa Rosa\ On_Call Modeling Assistance\GIS\TM Figures\Fig5_R16_R17.mxd 12/2/2011 R5 SAINT ANDREWS S5 R2B Fountain Grove THOMAS LAKE HARRIS S3 R3 R2A Fountain Grove PARKER HILL S18 R3 Fountain Grove 3 R17 R17 Rountain Grove 5 STAGECOACH THOMAS LAKE HARRIS FOUNTAINGROVE S2 R1A, R1B Fountain Grove R2 PARKER HILL R2R3 R2R1 R17R1 S17 R16 Fountain Grove 6 WALLACE R6 BADGER MIDDLE RINCON Notes BICENTENNIAL 1. R1 S16 and S17 pumps were operated. 2. R16 and R17 tank levels were at 10 percent full (assume no flow). R2R2 R4 R4R1 S16 R16 R4B Montecito R4 BRUSH CREEK MONTECITO LEGEND Available Fire Flow at 20 psi Less than 1,500 gpm Greater than 1,500 gpm SCWA Tanks Tanks Upgraded Pump Existing Pump High Fire Severity Existing Pipelines SCWA Aqueduct ,000 Scale in Feet FIGURE 5 City of Santa Rosa Fire Flow Availability Evaluation AVAILABLE FIRE FLOW AT 20 PSI TANK LEVEL AT 10 PERCENT FULL FOR R16 AND R17 PRESSURE ZONES (Alternate 1 - with Pump Replacement)
26
27 O:\Clients\405 City of Santa Rosa\ On_Call Modeling Assistance\GIS\TM Figures\Fig6_R17_S18.mxd 12/2/2011 R5 SAINT ANDREWS S5 R2B Fountain Grove THOMAS LAKE HARRIS S3 R3 R2A Fountain Grove PARKER HILL S18 R3 Fountain Grove 3 R17 R17 Rountain Grove 5 STAGECOACH THOMAS LAKE HARRIS FOUNTAINGROVE S2 R1A, R1B Fountain Grove R2 PARKER HILL R2R3 R2R1 R17R1 S17 R16 Fountain Grove 6 WALLACE R6 BADGER MIDDLE RINCON Notes BICENTENNIAL 1. R1 S1, S2, S3, S18 pumps were operated. 2. S17 and S16 pumps were not operated. 3. R3 tank level were at 10 percent full (assume no flow). R2R2 R4 R4R1 R16 S16 R4B Montecito R4 BRUSH CREEK MONTECITO LEGEND Available Fire Flow at 20 psi Greater than 1,500 gpm SCWA Tanks Tanks Pipeline Replacement (from 10-inch to 12-inch diameter) Existing Pump Upgraded Pump High Fire Severity Existing Pipelines SCWA Aqueduct ,000 Scale in Feet FIGURE 6 City of Santa Rosa Fire Flow Availability Evaluation AVAILABLE FIRE FLOW AT 20 PSI TANK LEVEL AT 10 PERCENT FULL FOR R16 AND R17 PRESSURE ZONES (Alternate 2 - with Supply from S18 and S3 Pump Replacement)
28
29 PETERSON WALLACE BAIRD O:\Clients\405 City of Santa Rosa\ On_Call Modeling Assistance\GIS\TM Figures\Fig7_R4_Servedby_S18.mxd 2/14/2012 R5 Skyfarm R5 SAINT ANDREWS R2R4 S5 S5 S3 S3 R2B Fountain Grove S18 R3 S18 R3 Fountain Grove 3 R17 Rountain Grove 5 R2A Fountain Grove R17 R6 Rincon 1 FULTON Notes GUERNEVILLE FRANCISCO PINER BARNES WALTZER MARSH DENNIS 1. Proctor pumps were operated. 2. S4 pumps were not operated. 3. R4A and R4B tank levels were at 10 percent full (assume no flow). 4. S3 pumps were upgraded and operated. 5. S18 pumps were operated. MARLOW STONY POINT LEGEND Available Fire Flow at 20 psi Pumps Less than 1,500 gpm PUTNEY Greater than 1,500 gpm SCWA Tanks Tanks EXETER SAN MIGUEL RIDLEY HOPPER Most hydrants that have available fire flow less than 1,500 gpm are located on dead-end pipeline COFFEY AIRWAY Pipeline Replacement (from 10-inch to 12-inch diameter) Upgraded Pump STEELE JENNINGS 9TH OLD REDWOOD RANGE MENDOCINO AVE DUTTON 101 BICENTENNIAL CLEVELAND ARMORY FRANCES High Fire Severity Existing Pipelines SCWA Aqueduct R1 S1 S1 THOMAS LAKE HARRIS ADMINISTRATION MORGAN 9TH ELLIOTT RIDGWAY 101 R1R1 A 684 gpm 663 gpm 725 gpm 771 gpm G!. MENDOCINO HEALDSBURG B S2 S2 HUMBOLDT 1034 gpm HUMBOLDT LEWIS COLLEGE 7TH FOUNTAINGROVE S4R FRANKLIN SPENCER E NORTH PACIFIC 5TH BROOKWOOD 3RD R2 R2R3 R1A, R1B Fountain Grove R2R2 S4R R4R gpm R4R3 PARKER HILL 531 gpm 569 gpm 1240 gpm 1134 gpm Proctor Tanks and Pump Station 4TH CHANATE HIDDEN VALLEY TERRACE R2R gpm R4R1 R4R1 BRYDEN 0 1,250 2,500 Scale in Feet TALBOT R4 GRAHN S17 S17 R17R1 MONTECITO FOOTHILL ROGERS MONTGOMERY R16 S16 R4B Montecito S16 S4 S4 FARMERS R16 Fountain Grove 6 R4R4 R6R1 SONOMA R4A Montecito BRUSH CREEK FRANQUETTE Farmers Lane Well R6 12 MISSION YULUPA BADGER MIDDLE RINCON RINCONADA SUMMERFIELD RINCON MONTECITO CANYON HOEN SAINT MARYS R9 PARKHURST S7 S7 CALISTOGA S6 S6 DUPONT Ralphine Tanks YERBA BUENA FIGURE 7 City of Santa Rosa Fire Flow Availability Evaluation AVAILABLE FIRE FLOW AT 20 PSI TANK LEVEL AT 10 PERCENT FULL FOR R4 PRESSURE ZONE (with S3 Pump Upgrade, R3 Pipeline Replacement and Proctor Pump Station) R7 SAINT FRANCIS R7 Rincon 2 MELITA R8 S8 S8 LOS ALAMOS
30

31 O:\Clients\405 City of Santa Rosa\ On_Call Modeling Assistance\GIS\TM Figures\Fig7_R13_R14.mxd 12/2/2011 STONE BRIDGE OAKMONT WHITE OAK FAIRFIELD 1485 gpm 12 OAK LEAF S13 R13 R13R1 Los Guilicos 1228 gpm PYTHIAN S14 R13 Wildoak R12 S12 VALLEY OAKS R14R1 R12A Oakmont 1 R12R1 R14 R12B Oakmont 2 Notes 1. S13 and S14 pumps were operated. 2. R13 and R14 tank levels were at 10 percent full (assume no flow). R14 Wildoak LEGEND Available Fire Flow at 20 psi Less than 1,500 gpm Greater than 1,500 gpm Pipeline Replacement (from 6-inch to 8-inch diameter) SCWA Tanks Tanks Existing Pump Upgraded Pump High Fire Severity Existing Pipelines SCWA Aqueduct ,000 Scale in Feet FIGURE 8 City of Santa Rosa Fire Flow Availability Evaluation AVAILABLE FIRE FLOW AT 20 PSI TANK LEVEL AT 10 PERCENT FULL FOR R13 AND R14 PRESSURE ZONES (with Pump and Pipeline Improvements)
32
APPENDIX D2- HYDRAULIC ANALYSIS
 APPENDIX D2 HYDRAULIC ANALYSIS TECHNICAL MEMORANDUM DATE: February 23, 2012 Project No: 405021131 TO: CC: Danielle Dure, PE, City of Santa Rosa Steve Allen, PE, City of Santa Rosa FROM: Irene Suroso,
APPENDIX C. City of Santa Rosa Pump Replacement Evaluation at Stations S14 and S13 TM July 9, 2013
 APPENDIX C City of Santa Rosa Pump Replacement Evaluation at Stations S14 and S13 TM July 9, 2013 TECHNICAL MEMORANDUM DATE: July 9, 2013 Project No.: 405-02-11-31 TO: Norman Amidon, City of Santa Rosa
Chapter 8.0 PROPOSED CAPITAL IMPROVEMENT PROGRAM
 Chapter 8.0 PROPOSED CAPITAL IMPROVEMENT PROGRAM This chapter presents the proposed Capital Improvement Program (CIP) for the District based on the findings of this Master Plan. The Master Plan primarily
SECTION 9 CAPITAL IMPROVEMENT PROGRAM
 SECTION 9 CAPITAL IMPROVEMENT PROGRAM 9-1 Introduction The Capital Improvement Program (CIP) consists of projects that will enhance the system to meet the established criteria, properly maintain the system
4 COSTS AND OPERATIONS
 4 COSTS AND OPERATIONS 4.1 INTRODUCTION This chapter summarizes the estimated capital and operations and maintenance (O&M) costs for the Modal and High-Speed Train (HST) Alternatives evaluated in this
Pump Station 7 Improvements
 Project Business Case ID: C04 2/18/2017 Pump Station 7 Project Purpose: The purpose of this project is to ensure that Pump Station 7 continues to operate in an efficient and effective manner following
2005 City of Santa Paula Potable Water System Master Plan Amendment
 2005 City of Santa Paula Potable Water System Master Plan Amendment City of Santa Paula Project Engineer Randy Toedter, PE Brian Yanez June, 2012 970 Ventura Street Santa Paula, CA 93060 PURPOSE OF THE
Appendix II: County & City Data
 Appendix II: County & City Data This Appendix presents selected handgun commerce data for all counties and for the 56 cities with a total population greater than 100,000 persons in 2000. Table 9: Handgun
APPENDIX B Traffic Analysis
 APPENDIX B Traffic Analysis Rim of the World Unified School District Reconfiguration Prepared for: Rim of the World School District 27315 North Bay Road, Blue Jay, CA 92317 Prepared by: 400 Oceangate,
San Rafael Civic Center Station Area Plan May 2012 DRAFT FOR PUBLIC REVIEW
 CHAPTER 4. PARKING Parking has been identified as a key concern among neighbors and employers in the area, both in terms of increased demand from potential new development and from SMART passengers that
ST. CROIX RIVER CROSSING PROJECT 2004 SUPPLEMENTAL ENVIRONMENTAL IMPACT STATEMENT TECHNICAL MEMORANDUM SUPPLEMENT FOR THE PREFERRED ALTERNATIVE:
 ST. CROIX RIVER CROSSING PROJECT 2004 SUPPLEMENTAL ENVIRONMENTAL IMPACT STATEMENT TECHNICAL MEMORANDUM SUPPLEMENT FOR THE PREFERRED ALTERNATIVE: TRAVEL DEMAND FORECASTS May 12, 2005 Prepared for Minnesota
Foothill College Participation Rates of High School Graduates in Fall Quarter
 Santa Clara County Public High Schools Campbell 4330759 Boynton Graduates 83 103 86 100 127 116 122 133 126 Enrolled in fall quarter 0 0 0 4 1 2 2 2 0 Percent attracted 0.0 0.0 0.0 4.0 0.8 1.7 1.6 1.5
Energy Technical Memorandum
 Southeast Extension Project Lincoln Station to RidgeGate Parkway Prepared for: Federal Transit Administration Prepared by: Denver Regional Transportation District May 2014 Table of Contents Page No. Chapter
APPENDIX 7.6 TRANSPORTATION
 APPENDIX 7.6 TRANSPORTATION 7.6 TRANSPORTATION As discussed in Section 4.2 Transportation, this appendix contains the data obtained from the Sonoma County Traffic Model as part of the impact analysis for
Construction Realty Co.
 MEMORANDUM TO: FROM : Jeff Pickus Construction Realty Co. Luay R. Aboona, PE Principal 9575 West Higgins Road, Suite 400 Rosemont, Illinois 60018 p: 847-518-9990 f: 847-518-9987 DATE: May 22, 2014 SUBJECT:
Event Press Log. Sonoma County Sheriff's Office 11/26/2017. Date Time Call Number Case # Location Beat Call Type Call Disposition
 Event Press Log Sonoma County Sheriff's Office 11/26/2017 Date Time Call Number Case # Location Beat Call Type Call Disposition 11/26/2017 0001 173300001 HARDIES LN / W STEELE LN TRAFFIC STOP 11/26/2017
Staff Report. (925)
") 5.g Staff Report Date: September 13, 2016 To: From: Reviewed by: Prepared by: Subject: City Council Valerie J. Barone, City Manager Justin Ezell, Director of Public Works Jeff Rogers Jeff.rogers@cityofconcord.org
5.g Staff Report Date: September 13, 2016 To: From: Reviewed by: Prepared by: Subject: City Council Valerie J. Barone, City Manager Justin Ezell, Director of Public Works Jeff Rogers Jeff.rogers@cityofconcord.org
The range of alternatives has been reviewed with the RTAC Subgroup and the preliminary analysis is proceeding on the following HCT alternatives:
 Attachment 2 Boise Treasure Valley Phase 1 Alternatives Analysis August 14, 2009 Introduction The Treasure Valley High Capacity Transit Priority Corridor Phase 1 Alternatives Analysis is being prepared
Proposed Project I 35 Improvements from SH 195 to I 10
 I 35 ROADWAY Proposed Project I 35 Improvements from SH 195 to I 10 The existing I 35 facility from State Highway 195 (SH 195) north of Georgetown to Interstate 10 (I 10) in San Antonio varies from four
MEMORANDUM TO: Oak Park and River Forest High School District 200. Kenig, Lindgren, O Hara, Aboona, Inc.
 9575 West Higgins Road, Suite 400 Rosemont, Illinois 60018 p: 847-518-9990 f: 847-518-9987 MEMORANDUM TO: Oak Park and River Forest High School District 200 FROM: Kenig, Lindgren, O Hara, Aboona, Inc.
MILLERSVILLE PARK TRAFFIC IMPACT ANALYSIS ANNE ARUNDEL COUNTY, MARYLAND
 MILLERSVILLE PARK TRAFFIC IMPACT ANALYSIS ANNE ARUNDEL COUNTY, MARYLAND Prepared for: Department of Public Works Anne Arundel County Prepared by: URS Corporation 4 North Park Drive, Suite 3 Hunt Valley,
FRESNO COUNTY SUBSECTION OF THE CALIFORNIA HIGH- SPEED TRAIN (HST)
") FRESNO COUNTY SUBSECTION OF THE CALIFORNIA HIGH- SPEED TRAIN (HST) The Fresno County subsection of the California High- Speed Train System (HST) is analyzed in two separate EIR/EISs the Merced-Fresno EIR/EIS
FRESNO COUNTY SUBSECTION OF THE CALIFORNIA HIGH- SPEED TRAIN (HST) The Fresno County subsection of the California High- Speed Train System (HST) is analyzed in two separate EIR/EISs the Merced-Fresno EIR/EIS
There are three types of EV charging -- "Fast", "Medium Rate" and "Slow" -- all of which we advocate being installed for public use:
 Public Electric Vehicle Charging Location Recommendations for Sonoma County North Bay Electric Auto Association Compiled by Chris Jones, Chapter President www.nbeaa.org March 13, 2009 8:30 AM 1. Overview
Memorandum October 5, 2017
 614 Magnolia Avenue Ocean Springs, Mississippi 39564 228.818.9626 Memorandum October 5, 2017 To: Gary Miller, U.S. Environmental Protection Agency From: David Keith, John Laplante, Matt Henderson, and
Light Emitting Diode (LED) Induction
 Induction") February 8 8, 2011 DOE awarded the City $491,000 EECBG in 2009 In December 2010, Council authorized reallocating $85,000 from the Financial Incentive Program to the Streetlight Conversion Program $382,000
February 8 8, 2011 DOE awarded the City $491,000 EECBG in 2009 In December 2010, Council authorized reallocating $85,000 from the Financial Incentive Program to the Streetlight Conversion Program $382,000
FREQUENTLY ASKED QUESTIONS
 THE PROJECT Last updated on 2/19/16 FREQUENTLY ASKED QUESTIONS What s happening on Highway 169? The Minnesota Department of Transportation (MnDOT) is planning to rebuild and repair the infrastructure on
Final Technical. Memorandum
 Federal Emergency Management Agency Task Or rder #34 Final Technical Memorandum HYDROLOGIC REVIEW FOR THE VENTURA RIVER WATERSHED AND SEVERAL TRIBUTARY STREAMS FLOOD INSURANCE STUDY Ventu ra County, CA
Date: February 7, 2017 John Doyle, Z-Best Products Robert Del Rio. T.E. Z-Best Traffic Operations and Site Access Analysis
 Memorandum Date: February 7, 07 To: From: Subject: John Doyle, Z-Best Products Robert Del Rio. T.E. Z-Best Traffic Operations and Site Access Analysis Introduction Hexagon Transportation Consultants, Inc.
Costco Gasoline Fuel Station Transportation Characteristics
 Exhibit A MEMORANDUM Date: May 23, 2013 Project #: I-10 To: Jennifer Murillo, Costco Wholesale Terry Odle, Mulvanny G2 Architecture From: Sonia Hennum, PTOE Project: Subject: Signal Hill Costco Gasoline
Ravenswood Avenue Railroad Crossing Project City Council Meeting Study Session April 4, Ravenswood Avenue Railroad Crossing Project
 Ravenswood Avenue Railroad Crossing Project City Council Meeting Study Session April 4, 2017 1 Presentation Outline Project Background Review Current Alternatives City Council Requests Council Direction
Recommended Transportation. Capital Improvement Program
 Recommended 2018-2022 Transportation Capital Improvement Program 1 Overview 2017 Review 2018-2022 Considerations 2018-2022 Recommended CIP 2 Limited Resources are Directed to the Highest Priority Number
Comprehensive Lift Station Evaluation Buffalo, Minnesota
 City of Buffalo Comprehensive Lift Station Evaluation Buffalo, Minnesota W3.088 Submitted by: Bolton & Menk, Inc. 040 Hwy East Willmar, MN 560 P: 30-3-3956 F: 30-3-970 Certification Comprehensive Lift
Note: The October 2007 version of this report has been updated in this December 2008 report to present costs in year 2007 dollars.
 Sound Transit Phase 2 South Corridor LRT Design Report: SR 99 and I-5 Alignment Scenarios (S 200 th Street to Tacoma Dome Station) Tacoma Link Extension to West Tacoma Prepared for: Sound Transit Prepared
TABLE OF CONTENTS EXECUTIVE SUMMARY...1 INTRODUCTION...3 PROJECTED FUTURE GROWTH...3 ROADWAY IMPROVEMENT PROJECTS...4 POTENTIAL FUNDING SOURCES...
 Transportation Impact Fee Study September 2014 TABLE OF CONTENTS EXECUTIVE SUMMARY...1 INTRODUCTION...3 PROJECTED FUTURE GROWTH...3 ROADWAY IMPROVEMENT PROJECTS......4 POTENTIAL FUNDING SOURCES...7 PROPOSED
Purpose of Capital Improvement Program
 1 Purpose of Capital Improvement Program o To identify capital projects and funding sources. o To strategically plan and prioritize projects within a budget to maximize the efficient use of funds. o Preserve
CHINO DESALTER PHASE 3
 CHINO DESALTER PHASE 3 Comprehensive Predesign Report Prepared for Jurupa Community Services District, City of Ontario, and Western Municipal Water District REVISED FINAL December 2010 Jurupa Community
This letter summarizes our observations, anticipated traffic changes, and conclusions.
 Mr. David Jorschumb Project Manager Boulder Valley School District Re: Review of proposed school access improvements at the Foothills Elementary School in Boulder Dear Mr. Jorschumb, At your request, the
FREQUENTLY ASKED QUESTIONS
 THE PROJECT Last updated on 9/8/16 FREQUENTLY ASKED QUESTIONS What s happening on Highway 169? The Minnesota Department of Transportation (MnDOT) is planning to rebuild and repair the infrastructure on
Appendix 5. Haymeadow Interim Traffic Analysis
 Appendix 5 Haymeadow Interim Traffic Analysis 20 MEMORANDUM To: From: Rick Pylman Gary Brooks Bill Fox Date: September 15, 2016 Project: Subject: Haymeadow Evaluation of interim access configuration Currently
TECHNICAL MEMORANDUM. Part A: Introduction
 TECHNICAL MEMORANDUM To: David J. Decker Decker Properties, Inc. 5950 Seminole Centre Ct. Suite 200 Madison, Wisconsin 53711 608-663-1218 Fax: 608-663-1226 www.klengineering.com From: Mike Scarmon, P.E.,
Develop ground transportation improvements to make the Airport a multi-modal regional
 Project Overview TRANSPORTATION IMPROVEMENTS WHAT ARE THE PROJECT GOALS? Transportation transportation hub. Develop ground transportation improvements to make the Airport a multi-modal regional Land Use
VOLUME II. List of Figures. List of Tables
 VOLUME II Chapter 9- Recommended Capital Improvement Program... 9-1 9.1 Recommended Capital Expenditures... 9-1 9.2 Schedule of Improvements... 9-1 9.2.1 Project Prioritization... 9-1 9.3 Comparison to
City of St. Pete Beach Model Capacity Report Addendum
 Model Capacity Report - Addendum City of St. Pete Beach Model Capacity Report Addendum Prepared for: City of St. Pete Beach 155 Corey Avenue St. Pete Beach, FL 33706 Prepared By: Kimley-Horn and Associates,
Hydraulic Modeling: Pipe Network Analysis
 Utah State University DigitalCommons@USU All Graduate Plan B and other Reports Graduate Studies 12-2012 Hydraulic Modeling: Pipe Network Analysis Trevor T. Datwyler Utah State University Follow this and
Alternatives Analysis Findings Report
 6.0 This chapter presents estimates of the potential capital, operations and maintenance costs associated with the alternatives carried forward for detailed evaluation. The methodology used to develop
Total Usage (kwh) Present Reading (kwh) (=)
 Present Reading (kwh) (=)") Alamo Anderson Angwin Antioch Bakersfield 1 6/9/2010 11/19/2010 04891 00002 4889 11984 07112 4872-17 Gen 2 2 6/11/2010 11/19/2010 04434 00002 4432 09371 04945 4426-6 Gen 2 3 6/18/2010 11/19/2010 05004
Alamo Anderson Angwin Antioch Bakersfield 1 6/9/2010 11/19/2010 04891 00002 4889 11984 07112 4872-17 Gen 2 2 6/11/2010 11/19/2010 04434 00002 4432 09371 04945 4426-6 Gen 2 3 6/18/2010 11/19/2010 05004
Figure 2-14: Existing Bus Routing at Irwindale Station
 494 W oothill Blvd 69 N Irwindale Ave 185 Irwindale E 1st St 3 6 feet igure 2-14: Existing Bus Routing at Irwindale 39 Proposed Bus Route 494 W oothill Blvd Proposed Discontinued Bus Route Proposed New
WEST CONTRA COSTA HIGH-CAPACITY TRANSIT STUDY TASK NUMBER 13.2: REFINED PRELIMINARY SCREENING COST ESTIMATE
 TASK NUMBER 13.2: REFINED PRELIMINARY SCREENING COST ESTIMATE PRELIMINARY ESTIMATE OF PROBABLE CONSTRUCTION COST (AN OPINION OF PROBABLE CONSTRUCTION COST) BASED ON DRAFT TM #11 ALTERNATIVE REFINEMENT
LAWRENCE TRANSIT CENTER LOCATION ANALYSIS 9 TH STREET & ROCKLEDGE ROAD / 21 ST STREET & IOWA STREET LAWRENCE, KANSAS
 LAWRENCE TRANSIT CENTER LOCATION ANALYSIS 9 TH STREET & ROCKLEDGE ROAD / 21 ST STREET & IOWA STREET LAWRENCE, KANSAS TRAFFIC IMPACT STUDY FEBRUARY 214 OA Project No. 213-542 TABLE OF CONTENTS 1. INTRODUCTION...
SH 249 IN GRIMES COUNTY. Open House April 3, 2014
 SH 249 IN GRIMES COUNTY Open House April 3, 2014 Meeting Agenda Purpose of Meeting Today: Review the purpose and need for the SH 249 Grimes County project Review the proposed project and alternatives Discuss
Board of Vocational Nursing and Psychiatric Technicians
 Department of Consumer Affairs Board of Vocational and Psychiatric Technicians The table below represents the performance of all first - time program graduates who completed the NCLEX/PN during the last
SAN FRANCISCO TO SAN JOSE PROJECT UPDATE
 SAN FRANCISCO TO SAN JOSE PROJECT UPDATE San Francisco County Transportation Authority Tuesday, April 25, 2017 Ben Tripousis, Northern California Regional Director HIGH-SPEED RAIL: Connecting California
Committee Report. Transportation Committee. Business Item No
 Committee Report Business Item No. 2015-280 Transportation Committee For the Metropolitan Council meeting of December 9, 2015 Subject: METRO Blue Line Extension (Bottineau Light Rail Transit) Revised Scope
Total Usage (kwh) Present Reading (kwh) (=)
 Present Reading (kwh) (=)") Alamo Anderson Angwin Antioch Bakersfield 1 6/9/2010 9/24/2010 03170 00002 3168 10269 07112 3157-11 Gen 2 2 6/11/2010 9/24/2010 02959 00002 2957 07899 04945 2954-3 Gen 2 3 6/18/2010 9/24/2010 03528 00001
Alamo Anderson Angwin Antioch Bakersfield 1 6/9/2010 9/24/2010 03170 00002 3168 10269 07112 3157-11 Gen 2 2 6/11/2010 9/24/2010 02959 00002 2957 07899 04945 2954-3 Gen 2 3 6/18/2010 9/24/2010 03528 00001
DELICETO, LLC PALM BEACH COUNTY, FL
 COMPREHENSIVE PLAN AMENDMENT TRAFFIC ANALYSIS DELICETO, LLC PALM BEACH COUNTY, FL PREPARED FOR: DELICETO, LLC Project #042787007 April 18, 2018 Revised May 29, 2018 CA 00000696 Kimley-Horn and Associates,
TIMBERVINE TRANSPORTATION IMPACT STUDY FORT COLLINS, COLORADO JANUARY Prepared for:
 TIMBERVINE TRANSPORTATION IMPACT STUDY FORT COLLINS, COLORADO JANUARY 2014 Prepared for: Hartford Companies 1218 W. Ash Street Suite A Windsor, Co 80550 Prepared by: DELICH ASSOCIATES 2272 Glen Haven Drive
IH 35 FEASIBILITY STUDY
 IH 35 FEASIBILITY STUDY COOKE COUNTY, TEXAS February 1, 2007 Prepared by: Carter & Burgess, Inc. For: The Wichita Falls District of the Texas Department of Transportation INDEX I. INTRODUCTION. 3 II. PURPOSE
APPENDIX TR-1 PARKING AND QUEUING ASSESSMENT
 APPENDIX TR-1 PARKING AND QUEUING ASSESSMENT Overland Overland Traffic Consultants, Traffic Consultants, Inc. Inc. Overland Traffic Consultants 952 Manhattan Beach Boulevard, Suite #100 Manhattan Beach,
Escondido Marriott Hotel and Mixed-Use Condominium Project TRAFFIC IMPACT ANALYSIS REPORT
 Escondido Marriott Hotel and Mixed-Use Condominium Project TRAFFIC IMPACT ANALYSIS REPORT Prepared for Phelps Program Management 420 Sixth Avenue, Greeley, CO 80632 Prepared by 5050 Avenida Encinas, Suite
Open Session Item. Construction Bid Award Pavement Maintenance & Rehabilitation Program FY 16 Chip Seal Applications, Contract No.
 Board of County Commissioners of Washington County, Maryland Agenda Report Form Open Session Item SUBJECT: Construction Bid Award Pavement Maintenance & Rehabilitation Program FY 16 Chip Seal Applications,
Traffic Impact Study Speedway Gas Station Redevelopment
 Traffic Impact Study Speedway Gas Station Redevelopment Warrenville, Illinois Prepared For: Prepared By: April 11, 2018 Table of Contents 1. Introduction... 1 2. Existing Conditions... 4 Site Location...
Oaks Commerce Center
 Mansour Edlin Consulting 1515 Mockingbird Lane Charlotte, NC 28209 Oaks Commerce Center Water & Sanitary Sewer Improvements Phase I - Concept Utility Plan Gravity Sanitary Sewer A1 Connect to Existing
Traffic Impact Analysis. Alliance Cole Avenue Residential Site Dallas, Texas. Kimley-Horn and Associates, Inc. Dallas, Texas.
 Traffic Impact Analysis Alliance Cole Avenue Residential Site Dallas, Texas February 15, 2018 Kimley-Horn and Associates, Inc. Dallas, Texas Project #064524900 Registered Firm F-928 Traffic Impact Analysis
Uptown Parking Utilization Study Blue Island, Bensenville, Illinois
 9575 West Higgins Road, Suite 100 Rosemont, Illinois 60018 p: 847-518-9990 f: 847-518-9987 MEMORANDUM TO: FROM: Jason Berry Community Development Special Projects Manager City of Blue Island Eric Russell,
4.0 SUMMARY OF ARTERIAL INTERSECTIONS CONGESTION ANALYSIS AND IMPROVEMENT CONCEPTS
 4.0 SUMMARY OF ARTERIAL INTERSECTIONS CONGESTION ANALYSIS AND IMPROVEMENT CONCEPTS 4.1 SUMMARY The Arterial Intersection Congestion Analysis Report, dated May 29, 2012, was approved by the SR-91/I-605/I-405
Appendix H TM 10.7 Well Interference
 Appendix H TM 10.7 Well Interference Regional Groundwater Storage and Recovery Project Draft EIR Appendix-H April 2013 Case No. 2008.1396E FUGRO CONSULTANTS, INC. April 26, 2012 Project No. 0103.128 1000
Plan and Profile for the Black Dog Natural Gas Pipeline Project Docket No. G002/GP
 414 Nicollet Mall Minneapolis, MN 55401 March 13, 2017 Daniel P. Wolf Executive Secretary Minnesota Public Utilities Commission 121 7 th Place East, Suite 350 St. Paul, MN 55101 Via Electronic Filing RE:
Pacific Gas and Electric Company s Revised 2015 Annual Progress
 March 02, 2015 Mr. Tracy Rolstad Chair, WECC Technical Studies Subcommittee Avista PO Box 3727 MSC-16 1411 East Mission Ave Spokane, WA 99220-3727 Mr. Enoch Davies WECC Technical Staff 155 North 400 West
Capital Improvement Program (CIPs) City of Industry FY 2017/18 Adopted Budget
 City of Industry FY 2017/18 Adopted Budget") Capital Improvement Program (CIPs) City of Industry FY 2017/18 155 FY 2017/18 156 City of Industry, California Capital Improvement Program Overview of Department The Capital Improvement Program (CIP) is
Capital Improvement Program (CIPs) City of Industry FY 2017/18 155 FY 2017/18 156 City of Industry, California Capital Improvement Program Overview of Department The Capital Improvement Program (CIP) is
Community Advisory Committee. October 5, 2015
 Community Advisory Committee October 5, 2015 1 Today s Topics Hennepin County Community Works Update Project Ridership Estimates Technical Issue #4:Golden Valley Rd and Plymouth Ave Stations Technical
Development of the Preferred Option and Implementation Plan
 Presentation To RMRA Peer Panel Day #1 Preferred Option and Risk Assessment August 25, 2009 TEMS, Inc. / Quandel Consultants, LLC 0 Development of the Preferred Option and Implementation Plan 1 1 Results
Traffic Impact Analysis 5742 BEACH BOULEVARD MIXED USE PROJECT
 Traffic Impact Analysis 5742 BEACH BOULEVARD MIXED USE PROJECT CITY OF BUENA PARK Prepared by Project No. 14139 000 April 17 th, 2015 DKS Associates Jeffrey Heald, P.E. Rohit Itadkar, T.E. 2677 North Main
TRAFFIC SIMULATION IN REGIONAL MODELING: APPLICATION TO THE INTERSTATEE INFRASTRUCTURE NEAR THE TOLEDO SEA PORT
 MICHIGAN OHIO UNIVERSITY TRANSPORTATION CENTER Alternate energy and system mobility to stimulate economic development. Report No: MIOH UTC TS41p1-2 2012-Final TRAFFIC SIMULATION IN REGIONAL MODELING: APPLICATION
California Local Government Shopping Cart Ordinances. As of November 27, 2012
 California Local Government Shopping Cart Ordinances As of November 27, 2012 Alameda County (2003) Alhambra (1986) Anaheim Antioch Atwater Azusa (2000) Carts not removed in timely manner will require modified
November 4, 2016 PUBLIC HEARING RESULTS
 The Sustainable Streets Division of the San Francisco Municipal Transportation Agency held a public hearing on Friday,, at 10:00 AM, in Room 416 (Hearing Room 4), City Hall, 1 Dr. Carlton B. Goodlett Place,
Unified Corridor Investment Study DRAFT Step 2 Scenario Analysis Report
 Unified Corridor Investment Study DRAFT Step 2 Scenario Analysis Report REVISIONS 1. Table 39: New Public Investments for Operation and Maintenance Costs 2. Appendix A-10: Passenger Rail Service - Operations
Alpine Highway to North County Boulevard Connector Study
 Alpine Highway to North County Boulevard Connector Study prepared by Avenue Consultants March 16, 2017 North County Boulevard Connector Study March 16, 2017 Table of Contents 1 Summary of Findings... 1
Subarea Study. Manning Avenue (CSAH 15) Corridor Management and Safety Improvement Project. Final Version 1. Washington County.
 Corridor Management and Safety Improvement Project. Final Version 1. Washington County.") Subarea Study Manning Avenue (CSAH 15) Corridor Management and Safety Improvement Project Final Version 1 Washington County June 12, 214 SRF No. 138141 Table of Contents Introduction... 1 Forecast Methodology
Subarea Study Manning Avenue (CSAH 15) Corridor Management and Safety Improvement Project Final Version 1 Washington County June 12, 214 SRF No. 138141 Table of Contents Introduction... 1 Forecast Methodology
Directions to Games from JICHS (times are Google Maps estimates by car)
") Directions to Games from JICHS (times are Google Maps estimates by car) Arrupe Jesuit (1 hour 30 min) 4343 Utica Street Denver 80212 303-455-7449 I25 north about 73 miles to exit 212B for N Speer Blvd.
Directions to Games from JICHS (times are Google Maps estimates by car) Arrupe Jesuit (1 hour 30 min) 4343 Utica Street Denver 80212 303-455-7449 I25 north about 73 miles to exit 212B for N Speer Blvd.
CONTRA COSTA COUNTY PUBLIC WORKS DEPARTMENT
 Page 1 of 5 CONTRA COSTA COUNTY PUBLIC WORKS DEPARTMENT ROUTES AUTHORIZED FOR ANNUAL TRANSPORTATION PERMITS Those County of Contra Costa maintained public roads listed in Column 1 of the following table
MEMORANDUM. Figure 1. Roundabout Interchange under Alternative D
 MEMORANDUM Date: To: Liz Diamond, Dokken Engineering From: Subject: Dave Stanek, Fehr & Peers Western Placerville Interchanges 2045 Analysis RS08-2639 Fehr & Peers has completed a transportation analysis
TORONTO TRANSIT COMMISSION REPORT NO.
 Form Revised: February 2005 TORONTO TRANSIT COMMISSION REPORT NO. MEETING DATE: October 24, 2012 SUBJECT: DOWNTOWN RAPID TRANSIT EXPANSION STUDY (DRTES) PHASE 1 STRATEGIC PLAN ACTION ITEM RECOMMENDATIONS
Appendix 3 Traffic Technical Memorandum
 Appendix 3 Traffic Technical Memorandum DRAFT TECHNICAL MEMORANDUM Southport Connector Project Traffic Development Comparison of Future Year Model Results Date: September 10, 2015 Project #:11730.030 To:
Highway 18 BNSF Railroad Overpass Feasibility Study Craighead County. Executive Summary
 Highway 18 BNSF Railroad Overpass Feasibility Study Craighead County Executive Summary October 2014 Highway 18 BNSF Railroad Overpass Feasibility Study Craighead County Executive Summary October 2014 Prepared
APPENDIX A Interstate 26 Widening Traffic Analysis Report
 Interstate 26 Widening MM 85-MM101, Newberry, Lexington, Richland Counties, SC Environmental Assessment APPENDIX A Interstate 26 Widening Traffic Analysis Report Interstate 26 Widening Traffic Analysis
Lake Mead Intake No. 3
 Lake Mead Intake No. 3 1 Lake Mead Intake No. 3 Total Project Scope INTAKE STRUCTURE PUMPING STATION ACCESS SHAFTS WATER TREATMENT FACILITY CONNECTOR TUNNEL INTAKE 1 INTAKE 2 C-2 Lake Mead Intake No. 3
CONCEPTUAL UTILITY REPORT FOR THE CANYONS PHASE 1 CITY OF CASTLE PINES, CO
 CONCEPTUAL UTILITY REPORT FOR THE CANYONS PHASE 1 CITY OF CASTLE PINES, CO PREPARED FOR: SHEA HOMES 9380 STATION ST., SUITE 600 LONE TREE, CO 80124 PHONE: 303-791-8180 CONTACT: RYAN MCDERMED PREPARED BY:
EXCEPTION TO STANDARDS REPORT
 EXCEPTION TO STANDARDS REPORT PROJECT DESCRIPTION AND NEED The project is located in Section 6, Township 23 North, Range 9 East and Section 31 Township 24 North, Range 9 East, in the Town of Stockton,
A Cal Trans District 4 TANK SIZE MED/LG DELIVERY LOCATION
 DOE DELIVERY LOTION Sweetwater FFS 705 Mines Road Dublin Area Office 999 Gleason Drive Dublin Hayward Area Office 23 Whipple Road Hayward Nimitz Inspection Sta. N/B I-880 S of Fremont Fremont Oakland Area
appendix 4: Parking Management Study, Phase II
 appendix 4: Parking Management Study, Phase II A4-1 A4-2 Eastlake Parking Management Study Final Phase 2 Report Future Parking Demand & Supply January 6, 2017 Submitted by Denver Corp Center III 7900 E.
SH 249 PUBLIC MEETING DESIGN CHANGES FROM FM 2920 TO HARDIN STORE ROAD
 SH 249 PUBLIC MEETING DESIGN CHANGES FROM FM 2920 TO HARDIN STORE ROAD Lone Star College, Tomball Campus December 8, 2015 Open House 5:30-7:30 pm National Environmental Policy Act The environmental review,
Pacific Gas and Electric Company s Revised 2016 Annual Progress
 March 06, 2016 Mr. Philip Augustin Chair, WECC Technical Studies Subcommittee Mr. Enoch Davies WECC Technical Staff 155 North 400 West Salt Lake City, UT 84103-1114 Subject: Report Pacific Gas and Electric
The major roadways in the study area are State Route 166 and State Route 33, which are shown on Figure 1-1 and described below:
 3.5 TRAFFIC AND CIRCULATION 3.5.1 Existing Conditions 3.5.1.1 Street Network DRAFT ENVIRONMENTAL IMPACT REPORT The major roadways in the study area are State Route 166 and State Route 33, which are shown
Generator Interconnection Facilities Study For SCE&G Two Combustion Turbine Generators at Hagood
 Generator Interconnection Facilities Study For SCE&G Two Combustion Turbine Generators at Hagood Prepared for: SCE&G Fossil/Hydro June 30, 2008 Prepared by: SCE&G Transmission Planning Table of Contents
3.14 Parks and Community Facilities
 3.14 Parks and Community Facilities 3.14.1 Introduction This section identifies the park and community facility resources in the study area and examines the potential impacts that the proposed Expo Phase
TransNet Dollars Keep San Diego Moving
 TransNet Dollars Keep San Diego Moving In 1987, San Diego region voters approved the TransNet program a half-cent sales tax to fund a variety of important transportation projects throughout the region.
2007 Traffic Impact Mitigation Fee Update Study
 2007 Traffic Impact Mitigation Fee Update Study Prepared for: Council of San Benito County Governments Prepared by: Hexagon Transportation Consultants Adopted June 21, 2007 MEMORANDUM To: From: Subject:
RTID Travel Demand Modeling: Assumptions and Method of Analysis
 RTID Travel Demand Modeling: Assumptions and Method of Analysis Overall Model and Scenario Assumptions The Puget Sound Regional Council s (PSRC) regional travel demand model was used to forecast travel
APPENDIX C1 TRAFFIC ANALYSIS DESIGN YEAR TRAFFIC ANALYSIS
 APPENDIX C1 TRAFFIC ANALYSIS DESIGN YEAR TRAFFIC ANALYSIS DESIGN YEAR TRAFFIC ANALYSIS February 2018 Highway & Bridge Project PIN 6754.12 Route 13 Connector Road Chemung County February 2018 Appendix
April 2014: Capital Improvements Update. through $ 102,233,755 Available Funding through 2019 $ 149,764,558. Staff s Recommendation
 Capital Improvements Update April 2014: Pl dp j t Planned Projects through 2019 - $ 102,233,755 Available Funding through 2019 $ 149,764,558 pp p,, Un-appropriated - $ 47,530,803 Staff s Recommendation