Inland Goods Movement Corridor Study: Rail Crossing Improvement Plan Final Report
|
|
|
- Octavia James
- 5 years ago
- Views:
Transcription

1 Inland Goods Movement Corridor Study: Rail Crossing Improvement Plan Final Report Prepared for: Southern California Association of Governments San Bernardino Associated Governments Prepared by: In Association with: Kaku Associates, Inc. August 2000
2 INLAND GOODS MOVEMENT CORRIDOR STUDY: RAIL CROSSING IMPROVEMENT PLAN Final Report Prepared for: Southern California Association of Governments San Bernardino Associated Governments Prepared by: Parsons Brinckerhoff Quade & Douglas, Inc. Kaku Associates, Inc. August 2000
3 Table of Contents PAGE EXECUTIVE SUMMARY... S-1 INTRODUCTION... 1 METHODOLOGY... 2 Study Area and Rail Lines... 2 Evaluation Criteria... 6 Data Collection... 8 Grade Crossing Analysis Methodology EXISTING AND FUTURE DELAY DEVELOPMENT OF POTENTIAL IMPROVEMENT STRATEGIES Rail Crossing Improvement Categories Delay Thresholds for Improvement Categories Cost Estimates for Improvement Strategies EVALUATION AND PRIORITIZATION Delay Reduction Cost Effectiveness Accident Reduction Potential Evaluation Comparisons of Improvement Options Delay Reduction Priorities Priority Groupings CONCLUSIONS Inland Goods Movement Corridor Study
4 List of Figures FIGURE PAGE S-1: Project Study Area... S-2 S-2a: Recommendations Valley Area... S-10 S-2b: Recommendations Victor Valley Area... S-11 1: Project Study Area a: Rail Crossings Valley Area b: Rail Crossings Victor Valley Area a: Recommendations Valley Area b: Recommendations Victor Valley Area a: Delay Reduction Priorities Valley Area b: Delay Reduction Priorities Victor Valley Area List of Tables TABLE PAGE S-1: Train Assumptions... S-1 S-2: Existing and Projected Rail Crossing Delay... S-4 S-3: Delay Reduction and Cost-Effectiveness of Proposed Improvements... S-6 S-4: Recommended Improvements and Delay Reduction Priorities... S-8 1: Number Of Crossings By Rail Line : Potential Performance Measures (Preliminary) : Evaluation Criteria (Recommended) : Train Assumptions : Inputs To Delay Calculations : Existing And Future Delay : Grade Crossing Improvement Options : Delay Reduction : Delay Reduction & Cost Effectiveness : Accident Reduction Potential : Evaluation Comparisons And Recommendations : Priority Evaluations : Priority Groupings For Delay Reduction : Priority Groupings For Delay Reduction Sorted In Priority Order Inland Goods Movement Corridor Study
5 EXECUTIVE SUMMARY The shipment of goods via rail, particularly from the ports of Los Angeles and Long Beach, is projected to increase dramatically over the next years. In Los Angeles County, the Alameda Corridor is being developed to accommodate this rail traffic and minimize delays to vehicles on intersecting streets. The rail lines leading easterly from the Alameda Corridor pass through developed and rapidly-urbanizing portions of San Bernardino County. Over time, the substantial increases in freight rail movements will mean much longer delays for traffic where rail lines cross streets at grade. The purpose of this study is to inventory the rail crossings on the main freight rail lines in San Bernardino County and develop an action plan to minimize or eliminate conflicts between trains and vehicular traffic and reduce vehicular delay at crossings on these main rail lines. STUDY AREA AND RAIL LINES The study area covers much of San Bernardino County (see Figure S-1), and includes seven separately identified sets of railroad tracks. These lines are traversed by three railroads the Southern California Regional Rail Authority s Metrolink (passenger) service, Union Pacific (freight), and Burlington Northern Santa Fe (BNSF-freight). In addition, Amtrak passenger trains also make a few trips per day across the study area. Along these seven rail lines there are 119 roadway crossings 50 are grade-separated and 69 are at-grade. Existing (1999) and projected future (Year 2020) train characteristics are summarized in Table S-1. Table S-1 TRAIN ASSUMPTIONS Year 1999 Year 2020 Length # of Trains # of Trains Line (miles) Per Day Per Day Alhambra FREIGHT 67 FREIGHT 1 PASSENGER 1 PASSENGER Los Angeles FREIGHT 39 FREIGHT 15 PASSENGER 28 PASSENGER San Gabriel Valley PASSENGER 58 PASSENGER San Bernardino 6 30 FREIGHT 67 FREIGHT 11 PASSENGER 22 PASSENGER Cajon FREIGHT 67 FREIGHT 2 PASSENGER 3 PASSENGER Cutoff 50 9 FREIGHT 13 FREIGHT 0 PASSENGER 0 PASSENGER Yuma FREIGHT 67 FREIGHT 1 PASSENGER 1 PASSENGER S-1
6 Figure S-1
7 EXISTING AND FUTURE DELAY The amount of vehicular delay at each crossing was estimated for existing and future conditions, based on traffic volumes, train volumes, train lengths, and the hourly distribution of vehicles and trains. The existing and future traffic volumes and delay are shown in Table S-2. In the existing condition, seven crossings have over 20 vehicle-hours of delay daily. In the Year 2020, 33 crossings are projected to experience over 20 vehicle-hours of delay per day, and 13 of these are projected to have over 100 vehicle-hours of delay per day. Throughout the study area, total delay is projected to increase from 500 hours per day in 1999 to over 6,200 hours per day in The average delay to each vehicle crossing a rail line is projected to increase from 2 seconds in 1999 to 17 seconds in EVALUATION OF IMPROVEMENT STRATEGIES For each at-grade crossing, two improvement options were identified. For crossings with high projected delay in 2020, grade separation was evaluated as the High option, with roadway widening or safety upgrades as the Low option. For crossings with moderate delay, roadway widening was evaluated as the High option, with safety upgrades as the Low option. For crossings with little delay, safety upgrades were evaluated. Local agency staff was consulted on the appropriateness of the improvement options, and the improvement options were refined to reflect their inputs. Each improvement option was evaluated in terms of delay reduction (daily hours of delay eliminated) and cost-effectiveness in reducing delay (hours of delay reduced per million dollars invested). The options evaluated at each crossing, together with their performance in delay reduction and cost-effectiveness, are shown in Table S-3. RECOMMENDATIONS AND PRIORITY GROUPINGS The purpose of the evaluation and prioritization process is twofold: To recommend a preferred improvement at each rail crossing by evaluating the performance of the High and Low Improvement Options relative to the established evaluation criteria; To determine the relative priority of the recommended improvements. The recommended improvements were selected based on the following criteria: If both the delay reduction ratio and the cost-effectiveness ratio favor the High option, the High improvement option is recommended. If implementation of the Low option would still result in more than 25 hours of delay per day, the High improvement option is recommended. If the location has High or Medium accident reduction potential, the High option is recommended. If the High option was not recommended under any of the previous three criteria, the Low option is recommended. Additional analysis was performed to determine which locations should take priority in spending of funds for reducing delays at rail crossings. The recommended improvements were assigned to priority groupings based on the amount of delay reduction, costeffectiveness, potential safety benefit, number of lanes, and traffic volume. The recommended improvements are listed by priority grouping in Table S-4 and shown on Figure S-2. S-3
8 TABLE S-2 EXISTING AND PROJECTED RAIL CROSSING DELAY Arterial Traffic at Crossing Delay Per Day Year 1999 Year 2020 Rail Cross Year 1999 Year 2020 Vehicle Hours of Vehicle Hours of Line Street ADT ADT Delay Per Day Delay Per Day Alhambra Ramona Av 23,000 33, Monte Vista Av 15,330 21, San Antonio Av 10,442 9, Campus Av 8,267 14, Vineyard Av 9,794 29, Milliken Av 32,096 65, Los Angeles Ramona Av 23,000 33, Monte Vista Av 15,330 21, San Antonio Av 10,442 9, Vine Av 7,150 9, Sultana Av 5,301 7, Campus Av 8,267 14, Bon View Av 5,252 9, Grove Av 33,347 56, Vineyard Av 6,496 8, Archibald Av 9,532 16, Milliken Av 18,730 36, San Gabriel Valley Central Av 22,080 24, Benson Ave 18,630 20, Mountain Av 42,205 50, San Antonio Av 11,155 14, Euclid Av 34,500 47, nd Av 4,370 5, Campus Av 8,740 11, Grove Av 18,299 22, Baker Av (1) 5,920 7, Vineyard Av 30,911 33, Hellman Av 8,647 16, Archibald Av 30,516 32, Hermosa Av 7,373 8, Haven Av 43,946 60, Rochester Av 5,059 9, Etiwanda Av 18,161 39, Beech Av 3,220 14, Citrus Av 28,000 47, Juniper Av 14,260 17, Sierra Av 27,300 32, Mango Av 10,235 10, Palmetto Av 6,000 6, Alder Av 11,385 13, Locust Av 8,363 10, Cedar Av 18,975 30, Cactus Av 11,500 12, Lilac Av 3,600 3, Willow Av 5,200 5, Riverside Av 21,200 21, Sycamore Av 4,800 5, Note: (1) ADT based on City Model ADT forecast for 2010, adjusted by a factor of 3% per year.
9 TABLE S-2 (continued) EXISTING AND PROJECTED RAIL CROSSING DELAY Arterial Traffic at Crossing Delay Per Day Year 1999 Year 2020 Rail Cross Year 1999 Year 2020 Vehicle Hours of Vehicle Hours of Line Street ADT ADT Delay Per Day Delay Per Day San Gabriel Valley Acacia Av 7,300 8, (Cont.) Eucalytus Av (2) (2) Pepper Av 15,300 21, Rialto Av 12,305 11, Rancho Av 5,290 7, San Bernardino Rialto Av 8,683 11, Laurel St 5,750 7, Olive St 4,945 8, E St H St Valley Bl 4,600 10, Cajon State/University 14,260 24, Palm Av 4,945 20, Glen Helen Pkwy 1,476 15, Vista (3) 6,540 14, Indian Trail (3) Hinkley (3) 1,366 5, Lenwood (3) 9,686 22, Cutoff Ranchero Rd. 8,247 32, Phelan 8,835 22, Johnson Rd. 1,769 2, Yuma Hunts Ln 14,490 23, Whittier Av 355 5, Beaumont Av 1,392 5, San Timoteo Rd 4,856 14, Alessandro Rd 2,415 9, Note: (2) - Existing and future traffic volumes are not available. (3) - ADT growth from 1999 to 2020 was estimated.
10 TABLE S-3 DELAY REDUCTION & COST EFFECTIVENESS OF PROPOSED IMPROVEMENTS PROPOSED IMPROVEMENTS DELAY REDUCTION (hrs/day) COST EFFECTIVENESS (hr/$m) Rail Cross Low High Low High Low High Line Street Option Option Option Option Option Option Alhambra Ramona Av Roadway Widening - (4-Lane) Grade Separation Monte Vista Av Spot Widening Grade Separation San Antonio Av Spot Widening Grade Separation Campus Av Spot Widening Grade Separation Vineyard Av Safety Upgrade Grade Separation Milliken Av Safety Upgrade Grade Separation Los Angeles Ramona Av Roadway Widening - (4-Lane) Grade Separation Monte Vista Av Spot Widening Grade Separation San Antonio Av Spot Widening Grade Separation Vine Av Safety Upgrade Grade Separation Sultana Av Safety Upgrade Grade Separation Campus Av Spot Widening Grade Separation Bon View Av Safety Upgrade Grade Separation Grove Av Roadway Widening - (6-Lane) Grade Separation Vineyard Av Spot Widening Grade Separation Archibald Av Roadway Widening - (6-Lane) Grade Separation Milliken Av Safety Upgrade Grade Separation San Gabriel Valley Central Av Spot Widening Grade Separation Benson Ave Safety Upgrade Spot Widening Mountain Av Safety Upgrade Grade Separation San Antonio Av Safety Upgrade Safety Upgrade Euclid Av Safety Upgrade Grade Separation nd Av Safety Upgrade Safety Upgrade Campus Av Safety Upgrade Safety Upgrade Grove Av Safety Upgrade Safety Upgrade Baker Av Safety Upgrade Spot Widening Vineyard Av Safety Upgrade Grade Separation Hellman Av Safety Upgrade Spot Widening Archibald Av Safety Upgrade Grade Separation Hermosa Av Safety Upgrade Spot Widening Haven Av Safety Upgrade Grade Separation Rochester Av Safety Upgrade Safety Upgrade Etiwanda Av Roadway Widening - (4-Lane) Grade Separation Beech Av Safety Upgrade Roadway Widening - (4-Lane) Citrus Av Spot Widening Grade Separation Juniper Av Safety Upgrade Spot Widening Sierra Av Spot Widening Grade Separation Mango Av Safety Upgrade Safety Upgrade
11 TABLE S-3 (continued) DELAY REDUCTION & COST EFFECTIVENESS OF PROPOSED IMPROVEMENTS PROPOSED IMPROVEMENTS DELAY REDUCTION (hrs/day) COST EFFECTIVENESS (hr/$m) Rail Cross Low High Low High Low High Line Street Option Option Option Option Option Option San Gabriel Valley Palmetto Av Safety Upgrade Safety Upgrade (Cont.) Alder Av Safety Upgrade Spot Widening Locust Av Safety Upgrade Spot Widening Cedar Av Safety Upgrade Grade Separation Cactus Av Safety Upgrade Safety Upgrade Lilac Av Safety Upgrade Safety Upgrade Willow Av Safety Upgrade Safety Upgrade Riverside Av Safety Upgrade Safety Upgrade Sycamore Av Safety Upgrade Safety Upgrade Acacia Av Safety Upgrade Safety Upgrade Eucalytus Av Safety Upgrade Safety Upgrade Pepper Av Safety Upgrade Spot Widening Rialto Av Safety Upgrade Roadway Widening - (4-Lane) Rancho Av Safety Upgrade Safety Upgrade San Bernardino Rialto Av Spot Widening Grade Separation Laurel St Spot Widening Grade Separation Olive St Spot Widening Grade Separation E St Safety Upgrade Safety Upgrade H St Safety Upgrade Safety Upgrade Valley Bl Roadway Widening - (6-Lane) Grade Separation Cajon State/University Spot Widening Grade Separation Palm Av Spot Widening Grade Separation Glen Helen Pkwy Roadway Widening - (4-Lane) Grade Separation Vista Spot Widening Grade Separation Indian Trail Safety Upgrade Safety Upgrade Hinkley Spot Widening Grade Separation Lenwood Spot Widening Grade Separation Cutoff Ranchero Rd. Spot Widening Grade Separation Phelan Spot Widening Grade Separation Johnson Rd. Safety Upgrade Safety Upgrade Yuma Hunts Ln Spot Widening Grade Separation Whittier Av Safety Upgrade Grade Separation Beaumont Av Safety Upgrade Grade Separation San Timoteo Rd Spot Widening Spot Widening Alessandro Rd Spot Widening Grade Separation
12 TABLE S-4 RECOMMENDED IMPROVEMENTS AND DELAY REDUCTION PRIORITIES RECOMMENDED IMPROVEMENTS 2020 Estimated Rail Cross Recommended Improvement Line Street Jurisdiction Improvement Cost PRIORITY #1 Alhambra Ramona Av Montclair Grade Separation 12,000,000 Los Angeles Ramona Av Montclair Grade Separation (included in Alhambra Line) Alhambra Milliken Av Ontario Grade Separation 29,720,000 Los Angeles Grove Av Ontario Grade Separation 16,180,000 San Bernardino Rialto Av San Bernardino City Grade Separation 14,020,000 Cajon Glen Helen Pkwy San Bernardino County Grade Separation 15,270,000 Subtotal $87,190,000 PRIORITY #2 San Gabriel Valley Citrus Av Fontana Grade Separation 14,020,000 Alhambra Monte Vista Av Montclair Grade Separation 14,650,000 Los Angeles Monte Vista Av Montclair Grade Separation (included in Alhambra Line) San Gabriel Valley Etiwanda Av Rancho Cucamonga Grade Separation 14,650,000 Cajon State/University San Bernardino City Grade Separation 14,360,000 Subtotal $57,680,000 PRIORITY #3 San Bernardino Laurel St Colton Grade Separation 14,880,000 San Bernardino Valley Bl Colton Grade Separation 17,300,000 San Gabriel Valley Sierra Av Fontana Grade Separation 14,020,000 San Gabriel Valley Central Av Montclair Grade Separation 16,180,000 Alhambra Vineyard Av Ontario Grade Separation 16,180,000 Los Angeles Archibald Av Ontario Grade Separation 16,950,000 Los Angeles Milliken Av Ontario Grade Separation 14,020,000 San Gabriel Valley Haven Av Rancho Cucamonga Grade Separation 16,950,000 San Gabriel Valley Cedar Av Rialto Grade Separation 14,650,000 Cajon Palm Av San Bernardino City Grade Separation 13,780,000 Cajon Vista San Bernardino County Grade Separation 13,280,000 Cajon Lenwood San Bernardino County Grade Separation 13,280,000 Subtotal $181,470,000 PRIORITY #4 San Bernardino Olive St Colton Grade Separation 14,000,000 Yuma Beaumont Av Loma Linda Grade Separation 13,780,000 Alhambra San Antonio Av Ontario Grade Separation 17,260,000 Alhambra Campus Av Ontario Grade Separation 17,260,000 Los Angeles San Antonio Av Ontario Grade Separation (included in Alhambra Line) Los Angeles Vine Av Ontario Grade Separation 13,780,000 Los Angeles Sultana Av Ontario Grade Separation 13,780,000 Los Angeles Campus Av Ontario Grade Separation (included in Alhambra Line) Los Angeles Bon View Av Ontario Grade Separation 13,780,000 Los Angeles Vineyard Av Ontario Grade Separation 14,650,000 San Gabriel Valley Vineyard Av Rancho Cucamonga Grade Separation 14,020,000 San Gabriel Valley Hellman Av Rancho Cucamonga Spot Widening 1,469,479 San Gabriel Valley Archibald Av Rancho Cucamonga Grade Separation 14,650,000 Yuma San Timoteo Rd Redlands Spot Widening 1,002,738 Yuma Alessandro Rd Redlands Grade Separation 13,780,000 Yuma Hunts Ln San Bernardino City/Colton Grade Separation 14,950,000 Cajon Hinkley San Bernardino County Grade Separation 13,280,000 Cutoff Ranchero Rd. San Bernardino County Grade Separation 13,280,000 Cutoff Phelan San Bernardino County Spot Widening 796,488 San Gabriel Valley Mountain Ave. Upland Grade Separation 16,180,000 San Gabriel Valley Eculid Ave. Upland Grade Separation 16,180,000 Subtotal $237,878,705
13 TABLE S-4 (continued) RECOMMENDED IMPROVEMENTS AND DELAY REDUCTION PRIORITIES RECOMMENDED IMPROVEMENTS 2020 Estimated Rail Cross Recommended Improvement Line Street Jurisdiction Improvement Cost PRIORITY #5: SAFETY UPGRADE ONLY San Bernardino E St Colton Safety Upgrade 110,825 San Bernardino H St Colton Safety Upgrade 110,825 San Gabriel Valley Juniper Av Fontana Safety Upgrade 137,500 San Gabriel Valley Mango Av Fontana Safety Upgrade 385,825 San Gabriel Valley Palmetto Av Fontana Safety Upgrade 110,825 San Gabriel Valley Alder Av Fontana Safety Upgrade 248,325 Yuma Whittier Av Loma Linda Safety Upgrade 179,575 San Gabriel Valley Grove Av Rancho Cucamonga Safety Upgrade 275,000 San Gabriel Valley Baker Av Rancho Cucamonga Safety Upgrade 110,825 San Gabriel Valley Hermosa Av Rancho Cucamonga Safety Upgrade 110,825 San Gabriel Valley Rochester Av Rancho Cucamonga Safety Upgrade 343,750 San Gabriel Valley Cactus Av Rialto Safety Upgrade 482,075 San Gabriel Valley Lilac Av Rialto Safety Upgrade 69,575 San Gabriel Valley Willow Av Rialto Safety Upgrade 69,988 San Gabriel Valley Riverside Av Rialto Safety Upgrade 343,750 San Gabriel Valley Sycamore Av Rialto Safety Upgrade 69,988 San Gabriel Valley Acacia Av Rialto Safety Upgrade 69,575 San Gabriel Valley Eucalytus Av Rialto/San Bernardino City Safety Upgrade 69,988 San Gabriel Valley Pepper Av San Bernardino City Safety Upgrade 206,250 San Gabriel Valley Rialto Av San Bernardino City Safety Upgrade 110,825 San Gabriel Valley Rancho Av San Bernardino City Safety Upgrade 110,825 San Gabriel Valley Beech Av San Bernardino County Safety Upgrade 69,575 San Gabriel Valley Locust Av San Bernardino County Safety Upgrade 110,825 Cajon Indian Trail San Bernardino County Safety Upgrade 69,575 Cutoff Johnson Rd. San Bernardino County Safety Upgrade 69,575 San Gabriel Valley Benson Ave Upland Safety Upgrade 275,000 San Gabriel Valley San Antonio Av Upland Safety Upgrade 206,250 San Gabriel Valley 2nd Av Upland Safety Upgrade 398,244 San Gabriel Valley Campus Av Upland Safety Upgrade 110,825 Subtotal $5,036,808 Grand Total $569,255,513
14
15
16 INTRODUCTION The movement of goods is an often-overlooked component of transportation, which affects individuals and communities in profound ways. The system of transporting materials and merchandise directly affects the cost and availability of consumer products. The vehicles which transport goods (particularly trains and trucks) can create delays, safety hazards, and inconvenience for motorists. The transportation of goods provides employment and economic opportunity for individuals and businesses. The system of transporting goods through the Los Angeles metropolitan area has been changing in recent years, and the ripple effects of those changes are profound. The Ports of Los Angeles and Long Beach are expanding, with a greater emphasis on shipping goods out of the ports via rail to optimize the efficiency of port-side land use. The Alameda Rail Corridor is being constructed in Los Angeles County to accommodate the high volume of rail traffic and minimize delays to vehicular traffic. The rail companies are developing and enhancing huge inland facilities for cargo sorting and rail-to-truck transfer in order to optimize the distribution of goods from rail terminals to their destinations. In the Inland Empire, a major rail-to-truck intermodal transfer yard has been developed by Burlington Northern Santa Fe (BNSF) in San Bernardino, and Union Pacific (UP) is considering development of an intermodal yard somewhere between Ontario and Beaumont. The rail lines leading easterly from the Alameda Corridor to these rail yards and beyond (to midwest and eastern United States) pass through developed and rapidly-urbanizing portions of San Bernardino County. Over time, the substantial increases in freight rail movements will mean much longer delays for traffic where rail lines cross streets at grade. In addition, some of these rail lines are used for commuter rail service (Metrolink), and the increasing service levels add to the delays at crossings. Other corridors faced with these increasing delays (the Orangethorpe Corridor in Orange County and the San Gabriel Valley in Los Angeles County) have developed plans to improve or grade-separate rail crossings to improve safety and minimize delays. The purpose of this study is to inventory the rail crossings on the main freight rail lines in San Bernardino County and develop an action plan to minimize or eliminate conflicts between trains and vehicular traffic and reduce vehicular delay at crossings on these main rail lines. The study has been conducted under contract to the Southern California Association of Governments (SCAG), and has been managed by the San Bernardino Associated Governments (SANBAG). Technical direction has been provided by a Project Steering Committee (PSC), consisting of staff from SANBAG, SCAG, local jurisdictions in the study area, and representatives of the BNSF and UP railroads. The remainder of this report includes a description of the study methodology, discussion of existing conditions at rail crossings, identification and evaluation of improvement alternatives, recommended improvements, and priority strategies to reduce delay
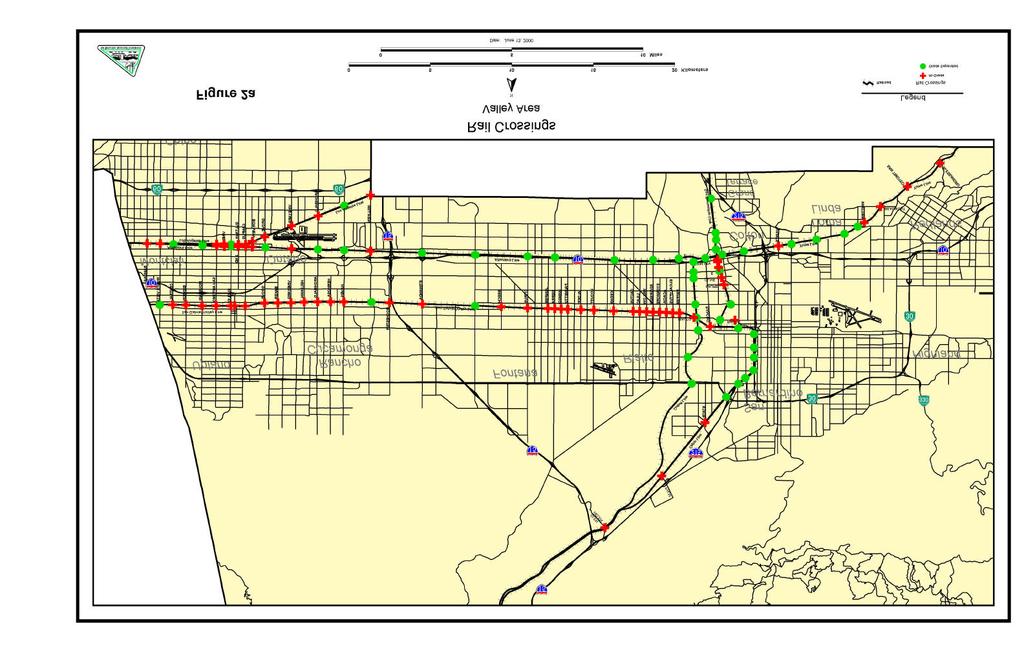
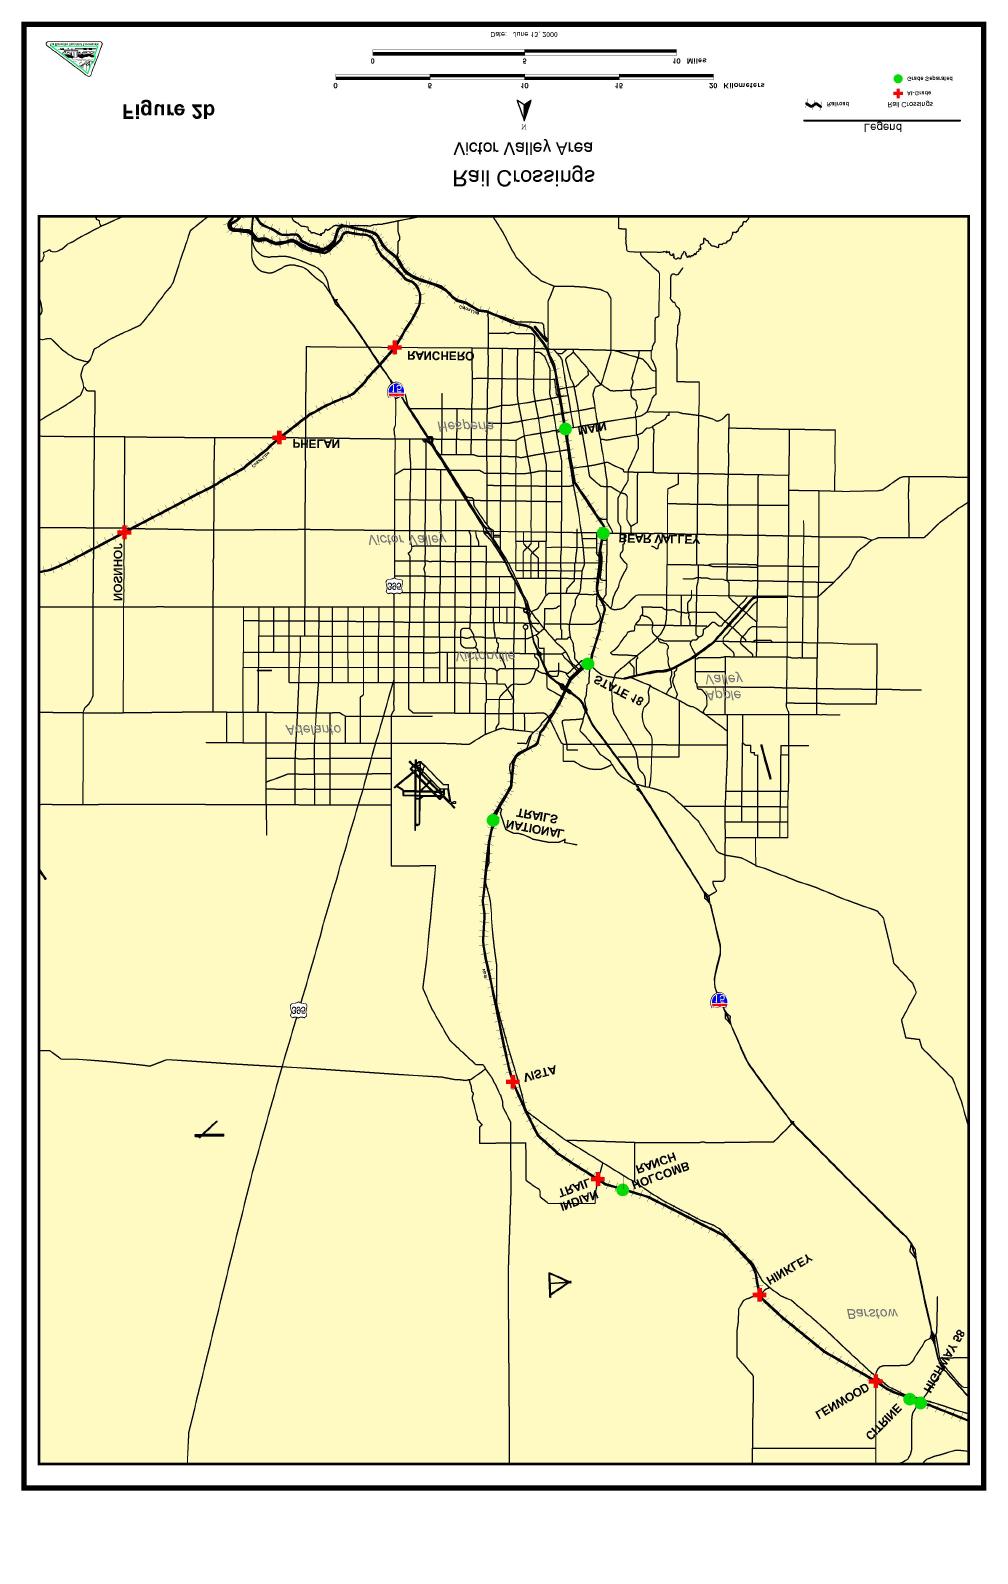
17 METHODOLOGY STUDY AREA AND RAIL LINES The study area covers much of San Bernardino County (see Figure 1). Most of the rail crossings are located in the more urbanized Valley area between Montclair and Redlands, but the heavily-used intercontinental freight rail lines extend easterly through San Timoteo Canyon toward the Banning Pass and Coachella Valley, and northerly through Cajon Pass and the Victor Valley area. This study area is traversed by three railroads Southern California Regional Rail Authority s Metrolink (passenger), Union Pacific (freight), and Burlington Northern Santa Fe (BNSF-freight). In addition, Amtrak passenger trains also make a few trips per day through the study area. Trains operate over seven separately identifiable sets of tracks. Crossings were identified and analyzed along the following seven railroad line segments: Alhambra Line Union Pacific (former Southern Pacific) to Colton from the west Los Angeles Line Union Pacific transcontinental line to Riverside Junction San Gabriel Line Metrolink to San Bernardino San Bernardino Line BNSF to San Bernardino from Riverside Cajon Line BNSF to San Bernardino from High Desert Cut-off Line Union Pacific (former Southern Pacific) to Colton from High Desert Yuma Line Union Pacific (former Southern Pacific) to Colton from the east Figure 2 shows the existing crossing locations on each line. The seven lines include a total of 69 grade crossings and 50 grade-separated crossings. The number of grade crossings on each line is presented in Table 1. (The number of crossings on individual lines adds up to more than 119 because some of the grade crossings of the Alhambra and Los Angeles lines occur at the same location where the two lines are adjacent to each other.) Table 1 Number of Crossings by Rail Line Grade- Separated Crossings Length Line (miles) Alhambra Los Angeles San Gabriel San Bernardino Cajon Cut-off Yuma At-Grade Crossings - 2 -
18 Figure 1
19
20
21 EVALUATION CRITERIA Criteria for evaluating and prioritizing rail crossing improvements were established in consultation with the Project Steering Committee, and approved by the SANBAG Plans and Policies Committee and Executive Board. The process used to identify the criteria consisted of three steps: 1. Identification of an initial list of potential criteria for consideration. 2. Determination of how each potential criterion would be measured. 3. Refinement of the list to focus on those criteria most relevant to the study s purpose. The three-step process is described in greater detail below. 1. An initial list of potential criteria was developed for evaluating and prioritizing potential improvements at each rail crossing. The list was comprised of evaluation criteria that could meet the objectives of delay reduction, safety improvement, environmental and economic benefit, and implementability. Each initial criterion was assigned a score (1-3) to reflect its relative importance to the most important issues in the study delay and safety. The number in parentheses () adjacent to each criterion indicates its relative importance. This initial list is presented below 1. improved safety (1) 2. reduced delay (1) 3. increased traffic flow (1) 4. capital cost (2) 5. cost-effectiveness (2) 6. economic benefits to surrounding area (3) 7. potential for consolidation or shifts of rail traffic (3) 8. impact on surrounding communities (2) 9. fuel savings (3) 10. emission reductions (3) 11. agency and public preferences (2) 2. For each criterion in the initial list, a method for measuring benefits or impacts was identified. The potential evaluation methods and measures are arrayed in Table 2. Generally, quantitative measures were used; however, several criteria could not be readily quantified and so qualitative measures were considered. The initial criteria and their potential measures are listed in order of relative importance
22 Importance Table 2 Potential Performance Measures (Preliminary) Criterion Method Measures Sources 1 safety Potential accident reduction. 1 reduced delay Daily vehicular delay using the Alameda Corridor method 1 increased traffic flow [not needed same as reduced delay] 2 capital cost [not needed part of cost-effectiveness] 2 costeffectiveness cost per hour of delay reduction, cost per accident eliminated 2 community impacts 2 agency & public preferences 3 economic benefit to surrounding area 3 potential for rail consolidation or shift aerial or field review [not needed not relevant to purpose of study] 3 fuel savings [not needed dependent on delay] 3 emission reductions [not needed dependent on delay] existing accident rates existing and future traffic volumes, train volumes, and train lengths estimated cost, combined with delay and safety measures Determine whether a taking is involved, and the affected land use Difficult to measure Difficult to measure Difficult to measure cities, SWITRS cities, railroad data, SCAG traffic forecasts costs based on typical unit and project cost data Consultant team PSC input PSC input 3. As seen in Table 2, several of the initial evaluation criteria would be duplicative, highly subjective, or not relevant to the purpose of the study. Therefore, the list of potential evaluation criteria were refined to eliminate redundancy and streamline the analysis; this was accomplished by combining criteria which have similar measures of effectiveness and by eliminating criteria which are not directly relevant to the primary purposes of the study. For example, the fuel savings and emission reductions criteria are dependant on delay and can be evaluated by looking at the analysis of delay. Consequently, four evaluation criteria were recommended for the rail crossing analysis. The recommended criteria are shown in Table 3, titled Evaluation Criteria (Recommended)
23 Importance Table 3 Evaluation Criteria (Recommended) Criterion Method Measures Sources 1 safety Potential accident reduction. 1 reduced delay Daily vehicular delay using the Alameda Corridor method 2 costeffectiveness - delay 2 costeffectiveness safety 2 Community impacts 2 Agency & public preferences 3 economic benefit to surrounding area cost per hour of delay reduction cost per accident rate reduction Not recommended Not recommended Not recommended existing accident rates existing and future traffic volumes, train volumes, and train lengths estimated cost, combined with delay measure estimated cost, combined with safety measure cities, SWITRS cities, railroad data, SCAG traffic forecasts costs based on typical unit and project cost data costs based on typical unit and project cost data Subsequent to the identification of evaluation criteria, it was found that consistent accident data could not be obtained for all the crossings (see discussion of Data Collection below). The PSC and SANBAG Plans and Programs Committee therefore directed that delay reduction and cost-effectiveness in reducing delay should be the primary factors in the evaluation of rail crossing improvements, and that potential safety improvements and other qualitative factors be used as secondary factors. DATA COLLECTION Data required for the grade crossing analysis was assembled based on three broad categories: physical, operational and land use. Physical data at each railroad crossing consisted of number of rail tracks, crossing roadway geometrics, train length and type of warning and control devices. Operational data consisted of existing freight and passenger train traffic, average daily traffic (ADT) on the roadway crossing each set of railroad tracks, prevailing train speed and accident data. Finally, land use data was assembled and consisted of the type of land use adjacent to the rail grade crossing. This data was used to estimate a vehicle departure rate from a stop at the crossing and the average distance between vehicles. Existing freight train traffic and time of day operations was obtained from staff of Union Pacific and BNSF, while passenger train frequencies and time of day operations was collected from - 8 -
24 Metrolink and Amtrak timetables. In recent years, various estimates of growth in freight and passenger train traffic was made by: SCAG s Regional Railroad Consolidation Study (March, 1995) San Gabriel Valley Council of Governments Grade Crossing Study Final Report (January, 1997) SCAG s Regional Grade Crossing Improvement Program (July, 1998) In addition to the consideration of these sources, discussions were held with railroad representatives in an attempt to gauge the most likely train frequencies for future year 2020 planning purposes. Train speeds provided by the railroads were used as the normal speeds by line and segment. In many areas, trains are able to operate at 55 to 60 miles per hour (mph), however, at several locations, 30 mph or less was the prevailing speed. The train assumptions are summarized in Table 4. Table 4 TRAIN ASSUMPTIONS Year 1999 Year 2020 # of Trains # of Trains Train Per Day Length Speed Per Day Length Speed Alhambra 32 FREIGHT FREIGHT PASSENGER PASSENGER 1000 Los Angeles 19 FREIGHT FREIGHT PASSENGER PASSENGER 1000 San Gabriel Valley 26 PASSENGER PASSENGER San Bernardino 30 FREIGHT FREIGHT PASSENGER PASSENGER 1000 Cajon 30 FREIGHT FREIGHT PASSENGER PASSENGER 1000 Cutoff 9 FREIGHT FREIGHT PASSENGER 0 PASSENGER Yuma 38 FREIGHT FREIGHT PASSENGER 1 PASSENGER Existing ADT data (traffic counts) on roadways crossing the railroad tracks were obtained from the local jurisdictions. To forecasts traffic volumes in 2020, the SCAG RIVSAN CTP model was used to determine how much the existing volume would increase by the year Accident statistics for the rail crossings were obtained from two sources. First, data were obtained from the statewide accident reporting database, known as SWITRS, which is managed by the California Highway Patrol. The accident data provided was for a total of six years. However, SWITRS data is shown as "between intersections" for street-to-street intersections. Consequently, the database includes accidents on either side of the grade crossings, as well as those occurring at the crossing itself. Since this database includes many - 9 -
25 accidents not related to the crossings, accident history at each crossing was requested from the local agencies. Many agencies were able to supply this historical data, though some jurisdictions were not. In addition, it was found that available safety records are not always consistent between the various crossings being studied. While it is possible to obtain consistent evaluations of comparative benefits in reducing travel delay and the costeffectiveness thereof, the history of accident record-keeping renders it impossible to obtain the same type of consistent evaluations for accident reduction potential. It was therefore determined that the study would primarily evaluate the improvement options on the basis of delay reduction and the cost-effectiveness of the improvement options in reducing delay, and that potential safety benefits be utilized (where data are available) to differentiate between crossings with similar delay reduction benefits. GRADE CROSSING ANALYSIS METHODOLOGY The principal measures of delay impacts at highway/rail grade crossing are characterized by the following two measures of effectiveness: Total Gate Down Time in Minutes; and Total Vehicle-Hours of Delay per Day The grade crossing delay analysis used for this study followed the same methodology used in the Alameda Corridor Draft EIS (August 1992) and the San Gabriel Valley Grade Crossing Study (January 1997). This analytical methodology was employed to estimate existing and future levels of delay at each of the grade crossings being studied, including consideration of delays to vehicles on parallel roads close to the rail line. The calculation produces the total crossing-gate down-time and vehicle-hours of delay experienced by roadway traffic at each grade crossing location. In addition, it produces an estimate of the length of roadway traffic queue due to the gate down interval caused by trains passing through the crossing. The formulas are as follows: Gate down time (for each train) = ({60*[train length * # lanes]} / {5280 * train speed}) Vehicle delay (for each train) = ({[gate down time 2 ] * vehicle queue per lane / [2 * (1 vehicle queue per lane / vehicle departure rate)]} / 60) * # lanes Queue length (for each train) = gate down time * vehicle queue per lane * avg. vehicle length For the evaluation of potential safety improvements at rail crossings, an overall accident rate was developed which combines measures of frequency and severity. In the three-step calculation, the accident frequency and accident severity ratings are determined for the crossing, and multiplied together to obtain the overall weighted accident rate. The formulas are as follows: Accident frequency rate per million entering vehicles (MEV) = (number of accidents * 1 million) / total crossing vehicles Accident severity rate per MEV = ({[(1 * # of injuries) + (2 * # of fatalities)] * 1 million} / total crossing vehicles) + 1. However, if the total accident rate is 0, then the severity rate should be set to 0 (instead of 1). Overall accident rate = (accident frequency rate * accident severity rate) The number of accidents and total vehicles are based on six years of historical data
26 EXISTING AND FUTURE DELAY The input data to the delay calculations is summarized in Table 5. It includes the 1999 average daily traffic volume (ADT), the forecast Year 2020 ADT, the number of traffic lanes at the crossing (Year 1999, Year 2020, and ultimate plan), and the adjacent land use type (for use in determining the relative volume of trucks and resulting headway between vehicles). The resulting estimates of existing and future gate down time and delay are shown in Table 6. In the existing condition, the Rialto Avenue crossing of the San Bernardino experiences the highest vehicular delay, with over 42 hours of delay daily. Five other locations experience over 20 hours of delay daily, and five additional crossings experience between hours of delay daily. The delay calculations have been performed separately for each crossing. At several crossings of the Alhambra and Los Angeles lines in Montclair and Ontario, the rail lines are adjacent to one another, so the total delay experienced at the two lines is probably less than the sum of the two amounts since trains will sometimes cross these locations simultaneously. In the Year 2020, projected delay increases substantially due to the greater number of trains, longer trains, and greater traffic volumes. In 2020: 12 crossings are projected to experience over 100 hours of vehicular delay per day 8 crossings are projected to experience hours of delay per day 13 crossings are projected to experience hours of delay per day 9 crossings are projected to experience hours of delay per day. Throughout the study area, total delay is projected to increase by more than 13 times, from 460 hours per day in 1999 to almost 6,200 hours per day in The average delay per vehicle crossing a rail line is projected to increase by almost nine times, from an average of 1.9 seconds per vehicle in 1999 to 17 seconds per vehicle in 2020 (this is the average for all vehicles traversing the at-grade crossings, including vehicles which have no delay at all)
27 TABLE 5 INPUTS TO DELAY CALCULATIONS Year Planned Cross # of Base # No. of Land Train Street Jurisdiction ADT ADT Lanes Lanes Lanes Use Alhambra Ramona Av Montclair 23,000 33, High Industrial Monte Vista Av Montclair 15,330 21, High Industrial San Antonio Av Ontario 10,442 9, Medium Industrial Campus Av Ontario 8,267 14, Medium Industrial Vineyard Av Ontario 9,794 29, Commercial Milliken Av Ontario 32,096 65, Commercial Los Angeles Ramona Av Montclair 23,000 33, High Industrial Monte Vista Av Montclair 15,330 21, High Industrial San Antonio Av Ontario 10,442 9, Medium Industrial Vine Av Ontario 7,150 9, Medium Industrial Sultana Av Ontario 5,301 7, Medium Industrial Campus Av Ontario 8,267 14, Medium Industrial Bon View Av Ontario 5,252 9, Medium Industrial Grove Av Ontario 33,347 56, Low Industrial Vineyard Av Ontario 6,496 8, High Industrial Archibald Av Ontario 9,532 16, High Industrial Milliken Av Ontario 18,730 36, High Industrial San Gabriel Valley Central Av Montclair 22,080 24, Medium Industrial Benson Ave Upland 18,630 17, Medium Industrial Mountain Av Upland 42,205 29, Commercial San Antonio Av Upland 11,155 17, Residential Euclid Av Upland 34,500 52, Commercial 2nd Av Upland 4,370 2, Low Industrial Campus Av Upland 8,740 4, Low Industrial Grove Av Rancho Cucamonga 18,299 22, Residential Baker Av (1) Rancho Cucamonga 5,920 7, Residential Vineyard Av Rancho Cucamonga 30,911 33, Residential Hellman Av Rancho Cucamonga 8,647 16, High Industrial Archibald Av Rancho Cucamonga 30,516 32, Commercial Hermosa Av Rancho Cucamonga 7,373 8, Residential Haven Av Rancho Cucamonga 43,946 60, Medium Industrial Rochester Av Rancho Cucamonga 5,059 9, High Industrial Etiwanda Av Rancho Cucamonga 18,161 39, High Industrial Beech Av San Bernardino County 3,220 14, Medium Industrial Citrus Av Fontana 28,000 47, Residential Juniper Av Fontana 14,260 17, Low Industrial Sierra Av Fontana 27,300 32, Commercial Mango Av Fontana 10,235 10, Residential Palmetto Av Fontana 6,000 6, Residential Alder Av Fontana 11,385 13, Residential Locust Av San Bernardino County 8,363 10, Residential Cedar Av Rialto 13,200 24, Low Industrial Cactus Av Rialto 11,500 12, Medium Industrial Lilac Av Rialto 3,600 3, Medium Industrial Willow Av Rialto 5,200 5, Commercial Riverside Av Rialto 21,200 21, Commercial Sycamore Av Rialto 4,800 5, Commercial Acacia Av Rialto 7,300 8, Residential Eucalyptus Av Rialto/San Bernardino City N/A (2) N/A (2) Residential Pepper Av San Bernardino City 15,300 21, Low Industrial Rialto Av San Bernardino City 12,305 11, Residential Rancho Av San Bernardino City 5,290 7, High Industrial San Bernardino Rialto Av San Bernardino City 8,683 11, Low Industrial Laurel St Colton 5,750 7, High Industrial Olive St Colton 4,945 8, Commercial E St Colton N/A (2) N/A (2) Residential H St Colton N/A (2) N/A (2) Residential Valley Bl Colton 4,600 10, Low Industrial Note: (1) ADT based on City Model 2010 forecast, adjusted by a factor of 3% per year. (2) - Existing and future traffic volumes are not available.
28 TABLE 5 (continued) INPUTS TO DELAY CALCULATIONS Year Planned Cross # of Base # No. of Land Train Street Jurisdiction ADT ADT Lanes Lanes Lanes Use Cajon State/University San Bernardino City 14,260 24, Medium Industrial Palm Av San Bernardino City 4,945 20, Medium Industrial Glen Helen Pkwy San Bernardino County 1,476 15, Residential Vista (3) San Bernardino County 6,540 14, Low Industrial (4) Indian Trail (3) San Bernardino County Low Industrial (4) Hinkley (3) San Bernardino County 1,366 5, Low Industrial (4) Lenwood (3) San Bernardino County 9,686 22, Low Industrial (4) Cutoff Ranchero Rd. San Bernardino County 8,247 32, Low Industrial (4) Phelan San Bernardino County 8,835 22, Low Industrial (4) Johnson Rd. San Bernardino County 1,769 2, Low Industrial (4) Yuma Hunts Ln San Bernardino City/Colton 14,490 23, Commercial Whittier Av Loma Linda 355 5, Residential Beaumont Av Loma Linda 1,392 5, Residential San Timoteo Rd Redlands 4,856 14, Residential Alessandro Rd Redlands 2,415 9, Residential Note: (3) - ADT Difference from 1999 to 2020 was estimated based on the data for the cross streets of the Cutoff Line. (4) - Assumed Land Use
29 TABLE 6 EXISTING AND FUTURE DELAY Year 1999 Year 2020 Cross Vehicle Hours of Vehicle Hours of Train Street Jurisdiction Delay Per Day Delay Per Day Alhambra Ramona Av Montclair Monte Vista Av Montclair San Antonio Av Ontario Campus Av Ontario Vineyard Av Ontario Milliken Av Ontario Los Angeles Ramona Av Montclair Monte Vista Av Montclair San Antonio Av Ontario Vine Av Ontario Sultana Av Ontario Campus Av Ontario Bon View Av Ontario Grove Av Ontario Vineyard Av Ontario Archibald Av Ontario Milliken Av Ontario San Gabriel Valley Central Av Montclair Benson Ave Upland Mountain Av Upland San Antonio Av Upland Euclid Av Upland nd Av Upland Campus Av Upland Grove Av Rancho Cucamonga Baker Av Rancho Cucamonga Vineyard Av Rancho Cucamonga Hellman Av Rancho Cucamonga Archibald Av Rancho Cucamonga Hermosa Av Rancho Cucamonga Haven Av Rancho Cucamonga Rochester Av Rancho Cucamonga Etiwanda Av Rancho Cucamonga Beech Av San Bernardino County Citrus Av Fontana Juniper Av Fontana Sierra Av Fontana Mango Av Fontana Palmetto Av Fontana Alder Av Fontana Locust Av San Bernardino County Cedar Av Rialto Cactus Av Rialto Lilac Av Rialto Willow Av Rialto Riverside Av Rialto Sycamore Av Rialto Acacia Av Rialto Eucalyptus Av Rialto/San Bernardino City N/A (1) N/A (1) Pepper Av San Bernardino City Rialto Av San Bernardino City Rancho Av San Bernardino City Note: (1) - Existing and future traffic volumes are not available.
30 TABLE 6 (continued) EXISTING AND FUTURE DELAY Year 1999 Year 2020 Cross Vehicle Hours of Vehicle Hours of Train Street Jurisdiction Delay Per Day Delay Per Day San Bernardino Rialto Av San Bernardino City Laurel St Colton Olive St Colton E St Colton N/A (1) N/A (1) H St Colton N/A (1) N/A (1) Valley Bl Colton Cajon State/University San Bernardino City Palm Av San Bernardino City Glen Helen Pkwy San Bernardino County Vista San Bernardino County Indian Trail San Bernardino County Hinkley San Bernardino County Lenwood San Bernardino County Cutoff Ranchero Rd. San Bernardino County Phelan San Bernardino County Johnson Rd. San Bernardino County Yuma Hunts Ln San Bernardino City/Colton Whittier Av Loma Linda Beaumont Av Loma Linda San Timoteo Rd Redlands Alessandro Rd Redlands Note: (1) - Existing and future traffic volumes are not available.
31 DEVELOPMENT OF POTENTIAL IMPROVEMENT STRATEGIES Once the Year 2020 delay at each of the grade crossings was calculated, potential improvements were identified for each crossing. To address the crossings in a consistent fashion, a process was developed for identifying appropriate improvements to be evaluated at each location. The process included: (1) identifying categories of potential improvements; (2) identifying thresholds of delay associated with each category; and (3) identifying improvement options for each location, based on the improvement categories. The improvement options were then reviewed with local agency staff, and in some cases were modified to eliminate infeasible options from consideration. Finally, planning-level cost estimates were developed for each improvement option. This chapter presents the process for identifying improvement options, and presents the options carried forward into the evaluation process. RAIL CROSSING IMPROVEMENT CATEGORIES Potential improvements to rail crossings could involve safety upgrades, traffic and signal control measures, roadway widening or realignment, and grade separation. For the purpose of illustration, the following is a list of specific improvement strategies within these categories. Safety Upgrade Improve grade crossing signage and striping Physically improve grade crossing Improve warning system Provide improved surveillance Vehicle detection systems Full closure crossing gates Raised median islands Median automatic gates Provide pedestrian crosswalks with crossing gate Traffic and Signal Control Measures Smart grade crossings Implement traffic and signal control/its measures Traffic diversions to grade separated crossings Active queue cutter sign or signal Close or consolidate grade crossings Roadway/Rail Improvements Spot widening to upgrade crossing capacity Roadway widening Roadway realignment Grade Separation Roadway grade separation
32 For the purpose of reducing delay at rail crossings, safety improvements and signal control have relatively low delay reduction potential. Roadway widening has moderate delay reduction potential, and grade separation has high delay reduction potential. Therefore, three categories were used for the purpose of categorizing improvement options: Category I: Safety Improvements. This category includes both safety improvements and traffic and signal control measures. These types of improvements apply to crossings with relatively low delay, and may also be apply to crossings which fall in Category II or Category III. Category II: Roadway Improvements: This category includes roadway widening to reduce delay by widening the street to add lanes, as well as spot widening to add lanes on either side of the crossing (but not further along the street). These improvements apply to crossings with moderate delay. Roadway widening is considered if the local agency s General Plan envisions additional lanes on the street; if not, spot widening is considered. Safety improvements are assumed in all widening options. Category III: Grade Separation: Category III involves grade separation of the roadway from the rail line. This improvement applies to crossings with high delay. Each crossing is assigned to one of these three improvement categories based on its Year 2020 daily delay. For each crossing, two improvement options are evaluated (a High option and a Low option), based on the delay category. The following section discusses the threshold values used to assign crossings to improvement categories. DELAY THRESHOLDS FOR IMPROVEMENT CATEGORIES As noted in the preceding section, estimates of future delay were applied to categorize the rail crossings and determine appropriate improvements for study. Delay thresholds were identified to differentiate between the three categories (Safety Improvements, Roadway Improvements, and Grade Separation). Other recent Southern California studies of rail crossing improvements were reviewed to identify appropriate delay thresholds for considering different types of improvements. These studies included the Southern California Association of Governments (SCAG) Rail Consolidation Study, the San Gabriel Valley Council of Governments Grade Crossing Study, and the Orangethorpe Corridor Study in Orange County. In those studies, the delay threshold for considering grade separation ranged from 600 minutes of total vehicular delay per day to 1,000 minutes per day. Since San Bernardino County typically maintains better service levels on its arterial streets and drivers encounter less driving delay than in Los Angeles and Orange Counties, the lower end of the threshold range (550 minutes per day) was felt to be an appropriate threshold for considering grade separations in this study. 550 minutes of delay was selected as the threshold rather than 600 minutes because this threshold represented a distinct dividing point in the estimated delays. In simplified terms, this amount of delay would mean that 550 vehicles per day would be delayed by an average of one minute at a crossing; to be considered for grade separation, the
33 number of vehicles delayed or the average delay would need to exceed these numbers. Application of this threshold to Year 2020 delay would mean that approximately half of the 69 crossings would fall into Category III for consideration as possible grade separations. Examples of crossings which exceed this threshold in 1999 include: Ramona Avenue (Montclair) Monte Vista Avenue (Montclair) Milliken Avenue (at Guasti Rd. Ontario) Grove Avenue (near Mission Blvd. Ontario) Rialto Avenue (San Bernardino) Hunts Lane (San Bernardino) Lenwood Road (near Barstow San Bernardino County) Examples of crossings which approach but do not exceed this threshold in 1999 include: Milliken Avenue (at Mission Blvd. Ontario) Haven Avenue (Rancho Cucamonga) To differentiate between Category I (Safety Improvements) and Category II (Roadway Widening), a threshold of 300 minutes per day was selected. In simplified terms, this amount of delay would mean that 600 vehicles per day would be delayed by an average of 30 seconds at a crossing; to be considered for roadway widening, the number of vehicles delayed or the average delay would need to exceed these numbers. With this threshold, 48 of the 69 crossings (70%) would be considered for either roadway widening or grade separation. All crossings would be evaluated for safety improvements at a minimum. After assigning each rail crossing to an improvement category based on the amount of delay caused by rail and surface traffic, initial improvement options (High and Low) were identified as follows: For Category I crossings, the Low option was identified as safety improvements. Safety improvements were also initially considered as the High option at these locations, unless the local agency has planned or wishes to consider roadway widening. For Category II crossings, either roadway widening or spot widening was initially identified as the High option. Roadway widening was identified if the local agency s General Plan envisions additional lanes on the street; if not, spot widening was identified. Safety improvements are included in all widening options, and could be the Low option if only one type of widening improvement is evaluated. Category III: Grade Separation: These crossings are projected to have high future delay. A grade separation will be evaluated as the High option, unless local conditions rule out a grade separation. The Low option could be roadway widening, spot widening, or safety improvements, depending on what is feasible at that location. After initial improvement options had been identified in this fashion, SANBAG staff and the consultants met individually with staff from each local jurisdiction to review the potential improvements at each crossing. The purpose of these meetings was to refine specific improvement options to reflect local conditions and future plans (such as adjacent land use or right-of-way constraints). This means that the improvement options to be evaluated do not
34 correspond in all cases with the improvement category assigned on the basis of delay. The improvement options for each crossing are shown in Table 7. COST ESTIMATES FOR IMPROVEMENT STRATEGIES Once the improvement options had been identified, planning-level cost estimates were developed for each improvement option at each crossing. The estimate of unit costs for the various elements of improvement strategies were based on 1997 Caltrans cost data, Parsons Brinckerhoff s previous experience on projects with similar elements, and research. No engineering design plans were prepared to quantify the various improvement costs. However, cost estimates from previous projects were used to determine the quantities required to implement the identified improvement strategies. For grade separations, quantities were based on the width of the road and the number of tracks being crossed. To minimize environmental impacts, utility relocations and construction costs, the cost estimate assumed that the grade separations would be constructed as arterial overcrossings. If the train tracks within the grade crossing were more than 300 feet apart, or if the proposed grade separation was in close proximity to an existing grade separation, the cost estimate assumed construction of a viaduct to span the entire crossing. For roadway widening, quantities were based on adding a 12-foot lane in each direction for one-half mile on either side of the crossing. For spot widening, quantities were based on adding a 12-foot lane in each direction for 500 feet on either side of the crossing. Safety upgrades or operational improvements included various elements such as raised medians, quad gates, constant warning time system, signal timing improvements, signal system improvements, roadway closures and train activated signage among others. The assumed improvement elements depended on existing grade crossing hardware, existing roadway configuration, accident history within 150 feet of the crossing, future queue length, future traffic volumes, and accessibility and proximity of other grade crossings. The quantities, in combination with the unit costs obtained from the sources previously identified, were used to determine the total costs for these various improvements at each grade crossing. The costs of the High and Low option at each location are shown in Table
35 TABLE 7 GRADE CROSSING IMPROVEMENT OPTIONS Improvement Options Estimated Costs Rail Cross Jurisdiction Low High Low High Line Street Option Option Option Option Alhambra Ramona Av Montclair Roadway Widening (II) - (4-Lane) Grade Separation (III) $2,466,168 $12,000,000 Monte Vista Av Montclair Spot Widening (II) Grade Separation (III) $1,347,313 $14,650,000 San Antonio Av Ontario Spot Widening (II) Grade Separation (III) $1,141,063 $17,260,000 Campus Av Ontario Spot Widening (II) Grade Separation (III) $1,092,113 $17,260,000 Vineyard Av Ontario Safety Upgrade (I) Grade Separation (III) $241,450 $16,180,000 Milliken Av Ontario Safety Upgrade (I) Grade Separation (III) $378,950 $29,720,000 Los Angeles Ramona Av Montclair Roadway Widening (II) - (4-Lane) Grade Separation (III) $2,466,168 $12,000,000 Monte Vista Av Montclair Spot Widening (II) Grade Separation (III) $1,347,313 $14,650,000 San Antonio Av Ontario Spot Widening (II) Grade Separation (III) $1,141,063 $17,260,000 Vine Av Ontario Safety Upgrade (I) Grade Separation (III) $179,575 $13,780,000 Sultana Av Ontario Safety Upgrade (I) Grade Separation (III) $179,575 $13,780,000 Campus Av Ontario Spot Widening (II) Grade Separation (III) $1,092,113 $17,260,000 Bon View Av Ontario Safety Upgrade (I) Grade Separation (III) $179,575 $13,780,000 Grove Av Ontario Roadway Widening (II) - (6-Lane) Grade Separation (III) $2,638,043 $16,180,000 Vineyard Av Ontario Spot Widening (II) Grade Separation (III) $949,069 $14,650,000 Archibald Av Ontario Roadway Widening (II) - (6-Lane) Grade Separation (III) $2,908,508 $16,950,000 Milliken Av Ontario Safety Upgrade (I) Grade Separation (III) $241,450 $14,020,000 San Gabriel Central Av Montclair Spot Widening (II) Grade Separation (III) $961,488 $16,180,000 Benson Ave Upland Safety Upgrade (I) Spot Widening (II) $275,000 $961,488 (Metrolink) Mountain Av Upland Safety Upgrade (I)* Grade Separation (III) $378,950 $16,180,000 San Antonio Av Upland Safety Upgrade (I) Safety Upgrade (I) $206,250 $206,250 Euclid Av Upland Safety Upgrade (I)* Grade Separation (III) $378,950 $16,180,000 Second Av Upland Safety Upgrade (I)* Safety Upgrade (I)* $398,244 $398,244 Campus Av Upland Safety Upgrade (I) Safety Upgrade (I) $110,825 $110,825 Grove Av Rancho Cucamonga Safety Upgrade (I)* Safety Upgrade (I)* $275,000 $275,000 Baker Av Rancho Cucamonga Safety Upgrade (I) Spot Widening (II)* $110,825 $804,188 Vineyard Av Rancho Cucamonga Safety Upgrade (I)* Grade Separation (III) $550,000 $14,020,000 Hellman Av Rancho Cucamonga Safety Upgrade (I) Spot Widening (II)* $247,500 $1,469,479 Archibald Av Rancho Cucamonga Safety Upgrade (I)* Grade Separation (III) $446,875 $14,650,000 Hermosa Av Rancho Cucamonga Safety Upgrade (I) Spot Widening (II)* $110,825 $1,278,310 Haven Av Rancho Cucamonga Safety Upgrade (I) Grade Separation (III) $550,000 $16,950,000 Rochester Av Rancho Cucamonga Safety Upgrade (I)* Safety Upgrade (I)* $343,750 $343,750 Etiwanda Av Rancho Cucamonga Roadway Widening (II) - (4-Lane)* Grade Separation (III) $2,823,179 $14,650,000 Beech Av San Bernardino County Safety Upgrade (I) Roadway Widening (II) - (4-Lane) $69,575 $1,840,543 Citrus Av Fontana Spot Widening (II) Grade Separation (III) $1,416,063 $14,020,000 Juniper Av Fontana Safety Upgrade (I) Spot Widening (II)* $137,500 $892,738 Sierra Av Fontana Spot Widening (II) Grade Separation (III) $1,133,363 $14,020,000 Mango Av Fontana Safety Upgrade (I) Safety Upgrade (I) $385,825 $385,825 Palmetto Av Fontana Safety Upgrade (I) Safety Upgrade (I)* $110,825 $110,825 Alder Av Fontana Safety Upgrade (I) Spot Widening (II) $248,325 $1,003,563 * - Improvement Strategy per Agency's direction
36 TABLE 7 (continued) GRADE CROSSING IMPROVEMENT OPTIONS Improvement Options Estimated Costs Rail Cross Jurisdiction Low High Low High Line Street Option Option Option Option San Gabriel Locust Av San Bernardino County Safety Upgrade (I) Spot Widening (II) $110,825 $865,238 Cedar Av Rialto Safety Upgrade (I)* Grade Separation (III) $618,750 $14,650,000 (Metrolink) Cactus Av Rialto Safety Upgrade (I)* Safety Upgrade (I)* $482,075 $482,075 Lilac Av Rialto Safety Upgrade (I) Safety Upgrade (I)* $69,575 $69,575 (continued) Willow Av Rialto Safety Upgrade (I) Safety Upgrade (I) $69,988 $69,988 Riverside Av Rialto Safety Upgrade (I)* Safety Upgrade (I)* $343,750 $343,750 Sycamore Av Rialto Safety Upgrade (I) Safety Upgrade (I) $69,988 $69,988 Acacia Av Rialto Safety Upgrade (I) Safety Upgrade (I)* $69,575 $69,575 Eucalyptus Av Rialto/San Bernardino City Safety Upgrade (I) Safety Upgrade (I) $69,988 $69,988 Pepper Av San Bernardino City Safety Upgrade (I) Spot Widening (II)* $206,250 $961,488 Rialto Av San Bernardino City Safety Upgrade (I) Roadway Widening (II) - (4-Lane) $110,825 $1,881,793 Rancho Av San Bernardino City Safety Upgrade (I) Safety Upgrade (I) $110,825 $110,825 San Bernadino Rialto Av San Bernardino City Spot Widening (II) Grade Separation (III) $1,003,151 $14,020,000 Laurel St Colton Spot Widening (II) Grade Separation (III) $796,488 $14,880,000 Olive St Colton Spot Widening (II) Grade Separation (III) $796,488 $14,000,000 E St Colton Safety Upgrade (I)* Safety Upgrade (I)* $110,825 $110,825 H St Colton Safety Upgrade (I)* Safety Upgrade (I)* $110,825 $110,825 Valley Bl Colton Roadway Widening (II) - (6-Lane) Grade Separation (III) $1,840,543 $17,300,000 Cajon State/University Pkwy San Bernardino City Spot Widening (II) Grade Separation (III) $961,488 $14,360,000 Palm Av San Bernardino City Spot Widening (II) Grade Separation (III) $865,238 $13,780,000 Glen Helen Pkwy San Bernardino County Roadway Widening (II) - (4-Lane) Grade Separation (III) $1,881,793 $15,270,000 Vista San Bernardino County Spot Widening (II) Grade Separation (III) $796,488 $13,280,000 Indian Trail San Bernardino County Safety Upgrade (I) Safety Upgrade (I) $69,575 $69,575 Hinkley San Bernardino County Spot Widening (II) Grade Separation (III) $796,488 $13,280,000 Lenwood San Bernardino County Spot Widening (II) Grade Separation (III) $796,488 $13,280,000 Cut-Off Ranchero Rd San Bernardino County Spot Widening (II) Grade Separation (III) $796,488 $13,280,000 Phelan San Bernardino County Spot Widening (II) Grade Separation (III) $796,488 $13,280,000 Johnson Rd San Bernardino County Safety Upgrade (I) Safety Upgrade (I) $69,575 $69,575 Yuma Hunts Ln San Bernardino City/Colton Spot Widening (II) Grade Separation (III) $961,488 $14,950,000 Whittier Av Loma Linda Safety Upgrade (I) Grade Separation (III) $179,575 $13,780,000 Beaumont Av Loma Linda Safety Upgrade (I) Grade Separation (III) $179,575 $13,780,000 San Timoteo Rd Redlands Spot Widening (II)* Spot Widening (II)* $1,002,738 $1,002,738 Alessandro Rd Redlands Spot Widening (II) Grade Separation (III) $1,002,738 $13,780,000 * - Improvement Strategy per Agency's direction TOTAL $49,805,603 $665,618,849 ** - Total adjusted for double counting crossings ADJUSTED TOTAL** $43,758,946 $604,448,849
37 EVALUATION AND PRIORITIZATION The purpose of the evaluation and prioritization process is twofold: To recommend a preferred improvement at each rail crossing by evaluating the performance of the High and Low Improvement Options relative to the established evaluation criteria; To determine the relative priority of the recommended improvements. As previously determined by the Project Steering Committee and the SANBAG Plans and Programs Committee, delay reduction and cost-effectiveness in reducing delay are the primary factors in the evaluation of rail crossing improvements. Potential safety improvements and other qualitative factors are to be used as secondary factors in the evaluation. This chapter presents the results of the evaluation, provides recommended improvements for each rail crossing, and prioritizes the improvements in terms of delay reduction and costeffectiveness. DELAY REDUCTION For each rail crossing, the High and Low improvement options were evaluated in terms of how much delay could be eliminated in the Year Grade separation would eliminate delay entirely. Roadway widening or spot widening would reduce delay by accommodating additional vehicles through the crossing when gates are up; this factor was incorporated into the delay calculations by increasing the hourly vehicle capacity through the crossing. Safety improvements would not provide any reduction in delay. Table 8 presents the results of the delay reduction analysis, including the daily hours of delay in 1999, 2020, 2020 with Low option, and 2020 with High option, plus the number of hours of delay eliminated by each improvement option. Delay reductions at specific crossings in the Year 2020 range from 0 to over 1,700 hours daily. COST EFFECTIVENESS Cost-effectiveness results are shown in Table 9, including the number of daily hours of delay reduction in 2020 per million dollars of capital cost. To aid in the subsequent prioritization step, an estimated 1999 cost effectiveness ratio was also calculated. Cost-effectiveness in reducing delay at specific crossings ranges from 0 hours per million dollars to 646. ACCIDENT REDUCTION POTENTIAL Table 10 shows the accident frequency per million entering vehicles at each rail crossing. As previously reported, historical accident data were not available from local agencies for all crossings those without available data are shown as N/A. Overall accident rates range from 0 (at crossings such as the Campus Avenue crossing of the Los Angeles line) to over 10,000,000 (at the Glen Helen Parkway crossing of the Cajon line). As noted in the methodology discussion, this is a weighted value combining accident
38 TABLE 8 DELAY REDUCTION PROPOSED IMPROVEMENTS Delay Per Day DELAY REDUCTION (hrs/day) Year 1999 Year Low Option 2020 High Option Rail Cross Low High Vehicle Hours of Vehicle Hours of Vehicle Hours of Vehicle Hours of Low High Line Street Option Option Delay Per Day Delay Per Day Delay Per Day Delay Per Day Option Option Alhambra Ramona Av Roadway Widening (II) - (4-Lane) Grade Separation (III) Monte Vista Av Spot Widening (II) Grade Separation (III) San Antonio Av Spot Widening (II) Grade Separation (III) Campus Av Spot Widening (II) Grade Separation (III) Vineyard Av Safety Upgrade (I) Grade Separation (III) Milliken Av Safety Upgrade (I) Grade Separation (III) Los Angeles Ramona Av Roadway Widening (II) - (4-Lane) Grade Separation (III) Monte Vista Av Spot Widening (II) Grade Separation (III) San Antonio Av Spot Widening (II) Grade Separation (III) Vine Av Safety Upgrade (I) Grade Separation (III) Sultana Av Safety Upgrade (I) Grade Separation (III) Campus Av Spot Widening (II) Grade Separation (III) Bon View Av Safety Upgrade (I) Grade Separation (III) Grove Av Roadway Widening (II) - (6-Lane) Grade Separation (III) Vineyard Av Spot Widening (II) Grade Separation (III) Archibald Av Roadway Widening (II) - (6-Lane) Grade Separation (III) Milliken Av Safety Upgrade (I) Grade Separation (III) San Gabriel Valley Central Av Spot Widening (II) Grade Separation (III) Benson Ave Safety Upgrade (I) Spot Widening (II) Mountain Av Safety Upgrade (I) Grade Separation (III) San Antonio Av Safety Upgrade (I) Safety Upgrade (I) Euclid Av Safety Upgrade (I) Grade Separation (III) nd Av Safety Upgrade (I) Safety Upgrade (I) Campus Av Safety Upgrade (I) Safety Upgrade (I) Grove Av Safety Upgrade (I) Safety Upgrade (I) Baker Av Safety Upgrade (I) Spot Widening (II) Vineyard Av Safety Upgrade (I) Grade Separation (III) Hellman Av Safety Upgrade (I) Spot Widening (II) Archibald Av Safety Upgrade (I) Grade Separation (III) Hermosa Av Safety Upgrade (I) Spot Widening (II) Haven Av Safety Upgrade (I) Grade Separation (III) Rochester Av Safety Upgrade (I) Safety Upgrade (I) Etiwanda Av Roadway Widening (II) - (4-Lane) Grade Separation (III) Beech Av Safety Upgrade (I) Roadway Widening (II) - (4-Lane) Citrus Av Spot Widening (II) Grade Separation (III) Juniper Av Safety Upgrade (I) Spot Widening (II) Sierra Av Spot Widening (II) Grade Separation (III) Mango Av Safety Upgrade (I) Safety Upgrade (I) Palmetto Av Safety Upgrade (I) Safety Upgrade (I) Alder Av Safety Upgrade (I) Spot Widening (II) Locust Av Safety Upgrade (I) Spot Widening (II) Cedar Av Safety Upgrade (I) Grade Separation (III) Cactus Av Safety Upgrade (I) Safety Upgrade (I) Lilac Av Safety Upgrade (I) Safety Upgrade (I) Willow Av Safety Upgrade (I) Safety Upgrade (I)
39 TABLE 8 (continued) DELAY REDUCTION PROPOSED IMPROVEMENTS Delay Per Day DELAY REDUCTION (hrs/day) Year 1999 Year Low Option 2020 High Option Rail Cross Low High Vehicle Hours of Vehicle Hours of Vehicle Hours of Vehicle Hours of Low High Line Street Option Option Delay Per Day Delay Per Day Delay Per Day Delay Per Day Option Option San Gabriel Valley Riverside Av Safety Upgrade (I) Safety Upgrade (I) (continued) Sycamore Av Safety Upgrade (I) Safety Upgrade (I) Acacia Av Safety Upgrade (I) Safety Upgrade (I) Eucalytus Av Safety Upgrade (I) Safety Upgrade (I) Pepper Av Safety Upgrade (I) Spot Widening (II) Rialto Av Safety Upgrade (I) Roadway Widening (II) - (4-Lane) Rancho Av Safety Upgrade (I) Safety Upgrade (I) San Bernardino Rialto Av Spot Widening (II) Grade Separation (III) Laurel St Spot Widening (II) Grade Separation (III) Olive St Spot Widening (II) Grade Separation (III) E St Safety Upgrade (I) Safety Upgrade (I) H St Safety Upgrade (I) Safety Upgrade (I) Valley Bl Roadway Widening (II) - (6-Lane) Grade Separation (III) Cajon State/University Spot Widening (II) Grade Separation (III) Palm Av Spot Widening (II) Grade Separation (III) Glen Helen Pkwy Roadway Widening (II) - (4-Lane) Grade Separation (III) Vista Spot Widening (II) Grade Separation (III) Indian Trail Safety Upgrade (I) Safety Upgrade (I) Hinkley Spot Widening (II) Grade Separation (III) Lenwood Spot Widening (II) Grade Separation (III) Cutoff Ranchero Rd. Spot Widening (II) Grade Separation (III) Phelan Spot Widening (II) Grade Separation (III) Johnson Rd. Safety Upgrade (I) Safety Upgrade (I) Yuma Hunts Ln Spot Widening (II) Grade Separation (III) Whittier Av Safety Upgrade (I) Grade Separation (III) Beaumont Av Safety Upgrade (I) Grade Separation (III) San Timoteo Rd Spot Widening (II) Spot Widening (II) Alessandro Rd Spot Widening (II) Grade Separation (III)
40 TABLE 9 DELAY REDUCTION & COST EFFECTIVENESS PROPOSED IMPROVEMENTS IMPROVEMENT COSTS (million $) 1999 COST EFFECTIVENESS (hr/$m) COST EFFECTIVENESS (hr/$m) Rail Cross Low High Low High Low High Low High Line Street Option Option Option Option Option Option Option Option Alhambra Ramona Av Roadway Widening (II) - (4-Lane) Grade Separation (III) Monte Vista Av Spot Widening (II) Grade Separation (III) San Antonio Av Spot Widening (II) Grade Separation (III) Campus Av Spot Widening (II) Grade Separation (III) Vineyard Av Safety Upgrade (I) Grade Separation (III) Milliken Av Safety Upgrade (I) Grade Separation (III) Los Angeles Ramona Av Roadway Widening (II) - (4-Lane) Grade Separation (III) Monte Vista Av Spot Widening (II) Grade Separation (III) San Antonio Av Spot Widening (II) Grade Separation (III) Vine Av Safety Upgrade (I) Grade Separation (III) Sultana Av Safety Upgrade (I) Grade Separation (III) Campus Av Spot Widening (II) Grade Separation (III) Bon View Av Safety Upgrade (I) Grade Separation (III) Grove Av Roadway Widening (II) - (6-Lane) Grade Separation (III) Vineyard Av Spot Widening (II) Grade Separation (III) Archibald Av Roadway Widening (II) - (6-Lane) Grade Separation (III) Milliken Av Safety Upgrade (I) Grade Separation (III) San Gabriel Valley Central Av Spot Widening (II) Grade Separation (III) Benson Ave Safety Upgrade (I) Spot Widening (II) Mountain Av Safety Upgrade (I) Grade Separation (III) San Antonio Av Safety Upgrade (I) Safety Upgrade (I) Euclid Av Safety Upgrade (I) Grade Separation (III) nd Av Safety Upgrade (I) Safety Upgrade (I) Campus Av Safety Upgrade (I) Safety Upgrade (I) Grove Av Safety Upgrade (I) Safety Upgrade (I) Baker Av Safety Upgrade (I) Spot Widening (II) Vineyard Av Safety Upgrade (I) Grade Separation (III) Hellman Av Safety Upgrade (I) Spot Widening (II) Archibald Av Safety Upgrade (I) Grade Separation (III) Hermosa Av Safety Upgrade (I) Spot Widening (II) Haven Av Safety Upgrade (I) Grade Separation (III) Rochester Av Safety Upgrade (I) Safety Upgrade (I) Etiwanda Av Roadway Widening (II) - (4-Lane) Grade Separation (III) Beech Av Safety Upgrade (I) Roadway Widening (II) - (4-Lane) Citrus Av Spot Widening (II) Grade Separation (III) Juniper Av Safety Upgrade (I) Spot Widening (II) Sierra Av Spot Widening (II) Grade Separation (III) Mango Av Safety Upgrade (I) Safety Upgrade (I) Palmetto Av Safety Upgrade (I) Safety Upgrade (I) Alder Av Safety Upgrade (I) Spot Widening (II) Locust Av Safety Upgrade (I) Spot Widening (II) Cedar Av Safety Upgrade (I) Grade Separation (III) Cactus Av Safety Upgrade (I) Safety Upgrade (I) Lilac Av Safety Upgrade (I) Safety Upgrade (I) Willow Av Safety Upgrade (I) Safety Upgrade (I) Riverside Av Safety Upgrade (I) Safety Upgrade (I) Sycamore Av Safety Upgrade (I) Safety Upgrade (I) Acacia Av Safety Upgrade (I) Safety Upgrade (I)
41 TABLE 9 (continued) DELAY REDUCTION & COST EFFECTIVENESS PROPOSED IMPROVEMENTS IMPROVEMENT COSTS (million $) 1999 COST EFFECTIVENESS (hr/$m) COST EFFECTIVENESS (hr/$m) Rail Cross Low High Low High Low High Low High Line Street Option Option Option Option Option Option Option Option San Gabriel Valley Eucalytus Av Safety Upgrade (I) Safety Upgrade (I) (continued) Pepper Av Safety Upgrade (I) Spot Widening (II) Rialto Av Safety Upgrade (I) Roadway Widening (II) - (4-Lane) Rancho Av Safety Upgrade (I) Safety Upgrade (I) San Bernardino Rialto Av Spot Widening (II) Grade Separation (III) Laurel St Spot Widening (II) Grade Separation (III) Olive St Spot Widening (II) Grade Separation (III) E St Safety Upgrade (I) Safety Upgrade (I) H St Safety Upgrade (I) Safety Upgrade (I) Valley Bl Roadway Widening (II) - (6-Lane) Grade Separation (III) Cajon State/University Spot Widening (II) Grade Separation (III) Palm Av Spot Widening (II) Grade Separation (III) Glen Helen Pkwy Roadway Widening (II) - (4-Lane) Grade Separation (III) Vista Spot Widening (II) Grade Separation (III) Indian Trail Safety Upgrade (I) Safety Upgrade (I) Hinkley Spot Widening (II) Grade Separation (III) Lenwood Spot Widening (II) Grade Separation (III) Cutoff Ranchero Rd. Spot Widening (II) Grade Separation (III) Phelan Spot Widening (II) Grade Separation (III) Johnson Rd. Safety Upgrade (I) Safety Upgrade (I) Yuma Hunts Ln Spot Widening (II) Grade Separation (III) Whittier Av Safety Upgrade (I) Grade Separation (III) Beaumont Av Safety Upgrade (I) Grade Separation (III) San Timoteo Rd Spot Widening (II) Spot Widening (II) Alessandro Rd Spot Widening (II) Grade Separation (III)
42 TABLE 10 ACCIDENT REDUCTION POTENTIAL IMPROVEMENT OPTIONS WEIGHTED Rail Cross Low High ACCIDENT RATE Line Street Jurisdiction Option Option 1999 Alhambra Ramona Av Montclair Roadway Widening (II) - (4-Lane) Grade Separation (III) N/A Monte Vista Av Montclair Spot Widening (II) Grade Separation (III) 595,625 San Antonio Av Ontario Spot Widening (II) Grade Separation (III) 44 Campus Av Ontario Spot Widening (II) Grade Separation (III) N/A Vineyard Av Ontario Safety Upgrade (I) Grade Separation (III) N/A Milliken Av Ontario Safety Upgrade (I) Grade Separation (III) N/A Los Angeles Ramona Av Montclair Roadway Widening (II) - (4-Lane) Grade Separation (III) N/A Monte Vista Av Montclair Spot Widening (II) Grade Separation (III) 595,625 San Antonio Av Ontario Spot Widening (II) Grade Separation (III) 44 Vine Av Ontario Safety Upgrade (I) Grade Separation (III) 70,389 Sultana Av Ontario Safety Upgrade (I) Grade Separation (III) 9,479 Campus Av Ontario Spot Widening (II) Grade Separation (III) 0 Bon View Av Ontario Safety Upgrade (I) Grade Separation (III) 105,607 Grove Av Ontario Roadway Widening (II) - (6-Lane) Grade Separation (III) 0 Vineyard Av Ontario Spot Widening (II) Grade Separation (III) 71 Archibald Av Ontario Roadway Widening (II) - (6-Lane) Grade Separation (III) 0 Milliken Av Ontario Safety Upgrade (I) Grade Separation (III) N/A San Gabriel Valley Central Av Montclair Spot Widening (II) Grade Separation (III) 140,693 Benson Ave Upland Safety Upgrade (I) Spot Widening (II) N/A Mountain Av Upland Safety Upgrade (I) Grade Separation (III) 5 San Antonio Av Upland Safety Upgrade (I) Safety Upgrade (I) N/A Euclid Av Upland Safety Upgrade (I) Grade Separation (III) 33 2nd Av Upland Safety Upgrade (I) Safety Upgrade (I) N/A Campus Av Upland Safety Upgrade (I) Safety Upgrade (I) N/A Grove Av Rancho Cucamonga Safety Upgrade (I) Safety Upgrade (I) 63 Baker Av**** Rancho Cucamonga Safety Upgrade (I) Spot Widening (II) 1,081 Vineyard Av Rancho Cucamonga Safety Upgrade (I) Grade Separation (III) 2,309 Hellman Av Rancho Cucamonga Safety Upgrade (I) Spot Widening (II) 44 Archibald Av Rancho Cucamonga Safety Upgrade (I) Grade Separation (III) 31 Hermosa Av Rancho Cucamonga Safety Upgrade (I) Spot Widening (II) 702 Haven Av Rancho Cucamonga Safety Upgrade (I) Grade Separation (III) 17 Rochester Av Rancho Cucamonga Safety Upgrade (I) Safety Upgrade (I) 76 Etiwanda Av Rancho Cucamonga Roadway Widening (II) - (4-Lane) Grade Separation (III) 32 Beech Av* San Bernardino County Safety Upgrade (I) Roadway Widening (II) - (4-Lane) 21,616 Citrus Av Fontana Spot Widening (II) Grade Separation (III) 87,850 Juniper Av Fontana Safety Upgrade (I) Spot Widening (II) N/A Sierra Av Fontana Spot Widening (II) Grade Separation (III) 33,718 Mango Av Fontana Safety Upgrade (I) Safety Upgrade (I) N/A Palmetto Av Fontana Safety Upgrade (I) Safety Upgrade (I) N/A Alder Av Fontana Safety Upgrade (I) Spot Widening (II) 149,148 Locust Av San Bernardino County Safety Upgrade (I) Spot Widening (II) 1,096 Cedar Av Rialto Safety Upgrade (I) Grade Separation (III) 873,154 Cactus Av Rialto Safety Upgrade (I) Safety Upgrade (I) 154,179 Lilac Av Rialto Safety Upgrade (I) Safety Upgrade (I) N/A Willow Av Rialto Safety Upgrade (I) Safety Upgrade (I) N/A Riverside Av Rialto Safety Upgrade (I) Safety Upgrade (I) 671,698 Sycamore Av Rialto Safety Upgrade (I) Safety Upgrade (I) N/A Acacia Av Rialto Safety Upgrade (I) Safety Upgrade (I) N/A Eucalytus Av Rialto/San Bernardino City Safety Upgrade (I) Safety Upgrade (I) N/A Pepper Av San Bernardino City Safety Upgrade (I) Spot Widening (II) 11,941 Rialto Av San Bernardino City Safety Upgrade (I) Roadway Widening (II) - (4-Lane) 2,230 Rancho Av San Bernardino City Safety Upgrade (I) Safety Upgrade (I) 5,396 San Bernardino Rialto Av San Bernardino City Spot Widening (II) Grade Separation (III) 720,172 Laurel St Colton Spot Widening (II) Grade Separation (III) N/A Olive St Colton Spot Widening (II) Grade Separation (III) N/A E St Colton Safety Upgrade (I) Safety Upgrade (I) N/A H St Colton Safety Upgrade (I) Safety Upgrade (I) N/A Valley Bl Colton Roadway Widening (II) - (6-Lane) Grade Separation (III) N/A Cajon State/University San Bernardino City Spot Widening (II) Grade Separation (III) 12,071 Palm Av San Bernardino City Spot Widening (II) Grade Separation (III) 6,087 Glen Helen Pkwy San Bernardino County Roadway Widening (II) - (4-Lane) Grade Separation (III) 10,253,313 Vista San Bernardino County Spot Widening (II) Grade Separation (III) 3,553 Indian Trail San Bernardino County Safety Upgrade (I) Safety Upgrade (I) N/A Hinkley San Bernardino County Spot Widening (II) Grade Separation (III) 140 Lenwood San Bernardino County Spot Widening (II) Grade Separation (III) 119 N/A = not available
43 TABLE 10 (continued) ACCIDENT REDUCTION POTENTIAL IMPROVEMENT OPTIONS WEIGHTED Rail Cross Low High ACCIDENT RATE Line Street Jurisdiction Option Option 1999 Cutoff Ranchero Rd. San Bernardino County Spot Widening (II) Grade Separation (III) 186 Phelan San Bernardino County Spot Widening (II) Grade Separation (III) 130 Johnson Rd. San Bernardino County Safety Upgrade (I) Safety Upgrade (I) 542 Yuma Hunts Ln San Bernardino City/Colton Spot Widening (II) Grade Separation (III) 1,089 Whittier Av Loma Linda Safety Upgrade (I) Grade Separation (III) N/A Beaumont Av Loma Linda Safety Upgrade (I) Grade Separation (III) N/A San Timoteo Rd Redlands Spot Widening (II) Spot Widening (II) 37,698 Alessandro Rd Redlands Spot Widening (II) Grade Separation (III) 0 N/A = not available
44 frequency and severity, so it is not intended to indicate the number of accidents per million entering vehicles. These accident rates indicate the locations with a significant potential safety benefit if a grade separation were constructed at a high-scoring location, accidents at a dangerous rail crossing could be eliminated. EVALUATION COMPARISONS OF IMPROVEMENT OPTIONS The first step in developing recommendations was to compare the performance of the High and Low improvement options at each location. These comparisons and the resulting recommendations are shown in Table 11. The recommended improvements are shown by location in Figure 3. Four evaluation comparisons are presented. The Delay Reduction Ratio shows the ratio of delay reduction in the High option to the Low option. A ratio of 1.0 means that each improvement option results in the same number of hour of delay reduction. A ratio greater than 1.0 means that the High option provides greater delay reduction (with higher ratios meaning higher delay reduction in the High option). A ratio less than 1.0 means that the Low option provides greater delay reduction (with lower ratios meaning higher delay reduction in the Low option). The Cost-Effectiveness Ratio shows the Year 2020 ratio of cost-effectiveness in the High option to the Low option. A ratio of 1.0 means that each improvement option has the same cost-effectiveness in reducing delay. A ratio greater than 1.0 means that the High option is more cost-effective (with higher ratios meaning greater cost-effectiveness in the High option). A ratio less than 1.0 means that the Low option is more cost-effective (with lower ratios meaning greater cost-effectiveness in the Low option). The 2020 Delay After Low Option Implemented shows the remaining delay in Year 2020 assuming the Low option has been implemented. This is shown to assist in developing recommendations, since the Low option could have favorable results in delay reduction and cost-effectiveness, but still result in substantial future delay, meaning that the High option should be selected. The Accident Reduction Potential shows a qualitative rating, based on the available accident rate data. The weighted overall accident rates were converted into low, medium, and high accident reduction potential. Crossings with accident scores higher than 100,000 were classified as having high reduction potential; those with scores between 25,000 and 100,000 were classified as having medium reduction potential; those with scores below 25,000 were classified as having low reduction potential. Table 11 also shows the development of the recommended improvements, based on the evaluations. If both the delay reduction ratio and the cost-effectiveness ratio favor the High option, the High improvement option is recommended. Recommendations based on this criterion are shown in the column labeled Delay and Cost Effectiveness. (This column also lists recommended improvements for locations where the High and Low options are the same.) For the remaining locations: if the Low option s remaining delay is more than 25 hours per day, the High improvement option is recommended. Recommendations based on this criterion are added in the column labeled High Remaining Delay. For the still-remaining locations, the High improvement option (grade separation) is recommended if the location has High or Medium accident reduction potential. Recommendations based on this criterion are added in the column labeled Accident Reduction Potential
45 TABLE 11 EVALUATION COMPARISONS AND RECOMMENDATIONS PROPOSED IMPROVEMENTS EVALUATION COMPARISONS RECOMMENDATIONS Delay Cost-Effectiveness 2020 Delay after Accident Delay High Accident FINAL COST OF Rail Cross Low High Reduction Ratio Ratio Low Option Reduction & Cost- Remaining Reduction LONG-TERM RECOMMENDED Line Street Option Option (High/Low) (High/Low) Implemented Potential Effectiveness Delay Potential RECOMMENDATION IMPROVEMENT Alhambra Ramona Av Roadway Widening (II) - (4-Lane) Grade Separation (III) N/A Grade Separation (III) Grade Separation (III) Grade Separation (III) 12,000,000 Monte Vista Av Spot Widening (II) Grade Separation (III) HIGH Grade Separation (III) Grade Separation (III) Grade Separation (III) 14,650,000 San Antonio Av Spot Widening (II) Grade Separation (III) Low Grade Separation (III) Grade Separation (III) Grade Separation (III) Grade Separation (III) 17,260,000 Campus Av Spot Widening (II) Grade Separation (III) N/A Grade Separation (III) Grade Separation (III) Grade Separation (III) 17,260,000 Vineyard Av Safety Upgrade (I) Grade Separation (III) N/A Grade Separation (III) Grade Separation (III) Grade Separation (III) Grade Separation (III) 16,180,000 Milliken Av Safety Upgrade (I) Grade Separation (III) N/A Grade Separation (III) Grade Separation (III) Grade Separation (III) Grade Separation (III) 29,720,000 Los Angeles Ramona Av Roadway Widening (II) - (4-Lane) Grade Separation (III) N/A Grade Separation (III) Grade Separation (III) Grade Separation (III) (incl. in Alhambra line) Monte Vista Av Spot Widening (II) Grade Separation (III) HIGH Grade Separation (III) Grade Separation (III) Grade Separation (III) (incl. in Alhambra line) San Antonio Av Spot Widening (II) Grade Separation (III) Low Grade Separation (III) Grade Separation (III) Grade Separation (III) Grade Separation (III) (incl. in Alhambra line) Vine Av Safety Upgrade (I) Grade Separation (III) Medium Grade Separation (III) Grade Separation (III) Grade Separation (III) Grade Separation (III) 13,780,000 Sultana Av Safety Upgrade (I) Grade Separation (III) Low Grade Separation (III) Grade Separation (III) Grade Separation (III) Grade Separation (III) 13,780,000 Campus Av Spot Widening (II) Grade Separation (III) Low Grade Separation (III) Grade Separation (III) Grade Separation (III) (incl. in Alhambra line) Bon View Av Safety Upgrade (I) Grade Separation (III) HIGH Grade Separation (III) Grade Separation (III) Grade Separation (III) Grade Separation (III) 13,780,000 Grove Av Roadway Widening (II) - (6-Lane) Grade Separation (III) Low Grade Separation (III) Grade Separation (III) Grade Separation (III) 16,180,000 Vineyard Av Spot Widening (II) Grade Separation (III) Low Grade Separation (III) Grade Separation (III) Grade Separation (III) Grade Separation (III) 14,650,000 Archibald Av Roadway Widening (II) - (6-Lane) Grade Separation (III) Low Grade Separation (III) Grade Separation (III) Grade Separation (III) 16,950,000 Milliken Av Safety Upgrade (I) Grade Separation (III) N/A Grade Separation (III) Grade Separation (III) Grade Separation (III) Grade Separation (III) 14,020,000 San Gabriel Valley Central Av Spot Widening (II) Grade Separation (III) HIGH Grade Separation (III) Grade Separation (III) Grade Separation (III) Grade Separation (III) 16,180,000 Benson Ave Safety Upgrade (I) Spot Widening (II) N/A Safety Upgrade (I) 275,000 Mountain Av Safety Upgrade (I) Grade Separation (III) Low Grade Separation (III) Grade Separation (III) Grade Separation (III) Grade Separation (III) 16,180,000 San Antonio Av Safety Upgrade (I) Safety Upgrade (I) 1.1 N/A Safety Upgrade (I) Safety Upgrade (I) Safety Upgrade (I) Safety Upgrade (I) 206,250 Euclid Av Safety Upgrade (I) Grade Separation (III) Low Grade Separation (III) Grade Separation (III) Grade Separation (III) Grade Separation (III) 16,180,000 2nd Av Safety Upgrade (I) Safety Upgrade (I) 1.9 N/A Safety Upgrade (I) Safety Upgrade (I) Safety Upgrade (I) Safety Upgrade (I) 398,244 Campus Av Safety Upgrade (I) Safety Upgrade (I) 4.7 N/A Safety Upgrade (I) Safety Upgrade (I) Safety Upgrade (I) Safety Upgrade (I) 110,825 Grove Av Safety Upgrade (I) Safety Upgrade (I) 8.9 Low Safety Upgrade (I) Safety Upgrade (I) Safety Upgrade (I) Safety Upgrade (I) 275,000 Baker Av Safety Upgrade (I) Spot Widening (II) Low Safety Upgrade (I) 110,825 Vineyard Av Safety Upgrade (I) Grade Separation (III) Low Grade Separation (III) Grade Separation (III) Grade Separation (III) Grade Separation (III) 14,020,000 Hellman Av Safety Upgrade (I) Spot Widening (II) Low Spot Widening (II) Spot Widening (II) Spot Widening (II) Spot Widening (II) 1,469,479 Archibald Av Safety Upgrade (I) Grade Separation (III) Low Grade Separation (III) Grade Separation (III) Grade Separation (III) Grade Separation (III) 14,650,000 Hermosa Av Safety Upgrade (I) Spot Widening (II) Low Safety Upgrade (I) 110,825 Haven Av Safety Upgrade (I) Grade Separation (III) Low Grade Separation (III) Grade Separation (III) Grade Separation (III) Grade Separation (III) 16,950,000 Rochester Av Safety Upgrade (I) Safety Upgrade (I) 3.2 Low Safety Upgrade (I) Safety Upgrade (I) Safety Upgrade (I) Safety Upgrade (I) 343,750 Etiwanda Av Roadway Widening (II) - (4-Lane) Grade Separation (III) Low Grade Separation (III) Grade Separation (III) Grade Separation (III) 14,650,000 Beech Av Safety Upgrade (I) Roadway Widening (II) - (4-Lane) Low Safety Upgrade (I) 69,575 Citrus Av Spot Widening (II) Grade Separation (III) Medium Grade Separation (III) Grade Separation (III) 14,020,000 Juniper Av Safety Upgrade (I) Spot Widening (II) N/A Safety Upgrade (I) 137,500 Sierra Av Spot Widening (II) Grade Separation (III) Medium Grade Separation (III) Grade Separation (III) 14,020,000 Mango Av Safety Upgrade (I) Safety Upgrade (I) 3.6 N/A Safety Upgrade (I) Safety Upgrade (I) Safety Upgrade (I) Safety Upgrade (I) 385,825 Palmetto Av Safety Upgrade (I) Safety Upgrade (I) 2.4 N/A Safety Upgrade (I) 110,825 Alder Av Safety Upgrade (I) Spot Widening (II) HIGH Safety Upgrade (I) 248,325 Locust Av Safety Upgrade (I) Spot Widening (II) Low Safety Upgrade (I) 110,825 Cedar Av Safety Upgrade (I) Grade Separation (III) HIGH Grade Separation (III) Grade Separation (III) 14,650,000 Cactus Av Safety Upgrade (I) Safety Upgrade (I) 5.4 HIGH Safety Upgrade (I) Safety Upgrade (I) Safety Upgrade (I) Safety Upgrade (I) 482,075 Lilac Av Safety Upgrade (I) Safety Upgrade (I) 1.3 N/A Safety Upgrade (I) 69,575 Willow Av Safety Upgrade (I) Safety Upgrade (I) 1.9 N/A Safety Upgrade (I) Safety Upgrade (I) Safety Upgrade (I) Safety Upgrade (I) 69,988 Riverside Av Safety Upgrade (I) Safety Upgrade (I) 8.7 HIGH Safety Upgrade (I) Safety Upgrade (I) Safety Upgrade (I) Safety Upgrade (I) 343,750 Sycamore Av Safety Upgrade (I) Safety Upgrade (I) 1.9 N/A Safety Upgrade (I) Safety Upgrade (I) Safety Upgrade (I) Safety Upgrade (I) 69,988 Acacia Av Safety Upgrade (I) Safety Upgrade (I) 3.1 N/A Safety Upgrade (I) 69,575 Eucalytus Av Safety Upgrade (I) Safety Upgrade (I) 0.0 N/A Safety Upgrade (I) Safety Upgrade (I) Safety Upgrade (I) Safety Upgrade (I) 69,988 Pepper Av Safety Upgrade (I) Spot Widening (II) Low Safety Upgrade (I) 206,250 Rialto Av Safety Upgrade (I) Roadway Widening (II) - (4-Lane) Low Safety Upgrade (I) 110,825 Rancho Av Safety Upgrade (I) Safety Upgrade (I) 3.0 Low Safety Upgrade (I) Safety Upgrade (I) Safety Upgrade (I) Safety Upgrade (I) 110,825
46 TABLE 11 (continued) EVALUATION COMPARISONS AND RECOMMENDATIONS PROPOSED IMPROVEMENTS EVALUATION COMPARISONS RECOMMENDATIONS Delay Cost-Effectiveness 2020 Delay after Accident Delay High Accident FINAL COST OF Rail Cross Low High Reduction Ratio Ratio Low Option Reduction & Cost- Remaining Reduction LONG-TERM RECOMMENDED Line Street Option Option (High/Low) (High/Low) Implemented Potential Effectiveness Delay Potential RECOMMENDATION IMPROVEMENT San Bernardino Rialto Av Spot Widening (II) Grade Separation (III) HIGH Grade Separation (III) Grade Separation (III) Grade Separation (III) Grade Separation (III) 14,020,000 Laurel St Spot Widening (II) Grade Separation (III) N/A Grade Separation (III) Grade Separation (III) Grade Separation (III) 14,880,000 Olive St Spot Widening (II) Grade Separation (III) N/A Grade Separation (III) Grade Separation (III) Grade Separation (III) 14,000,000 E St Safety Upgrade (I) Safety Upgrade (I) 0.0 N/A Safety Upgrade (I) Safety Upgrade (I) Safety Upgrade (I) Safety Upgrade (I) 110,825 H St Safety Upgrade (I) Safety Upgrade (I) 0.0 N/A Safety Upgrade (I) Safety Upgrade (I) Safety Upgrade (I) Safety Upgrade (I) 110,825 Valley Bl Roadway Widening (II) - (6-Lane) Grade Separation (III) N/A Grade Separation (III) Grade Separation (III) Grade Separation (III) Grade Separation (III) 17,300,000 Cajon State/University Spot Widening (II) Grade Separation (III) Low Grade Separation (III) Grade Separation (III) Grade Separation (III) 14,360,000 Palm Av Spot Widening (II) Grade Separation (III) Low Grade Separation (III) Grade Separation (III) Grade Separation (III) 13,780,000 Glen Helen Pkwy Roadway Widening (II) - (4-Lane) Grade Separation (III) HIGH Grade Separation (III) Grade Separation (III) Grade Separation (III) 15,270,000 Vista Spot Widening (II) Grade Separation (III) Low Grade Separation (III) Grade Separation (III) Grade Separation (III) 13,280,000 Indian Trail Safety Upgrade (I) Safety Upgrade (I) 5.3 N/A Safety Upgrade (I) Safety Upgrade (I) Safety Upgrade (I) Safety Upgrade (I) 69,575 Hinkley Spot Widening (II) Grade Separation (III) Low Grade Separation (III) Grade Separation (III) Grade Separation (III) Grade Separation (III) 13,280,000 Lenwood Spot Widening (II) Grade Separation (III) Low Grade Separation (III) Grade Separation (III) Grade Separation (III) 13,280,000 Cutoff Ranchero Rd. Spot Widening (II) Grade Separation (III) Low Grade Separation (III) Grade Separation (III) Grade Separation (III) 13,280,000 Phelan Spot Widening (II) Grade Separation (III) Low Spot Widening (II) 796,488 Johnson Rd. Safety Upgrade (I) Safety Upgrade (I) 1.5 Low Safety Upgrade (I) Safety Upgrade (I) Safety Upgrade (I) Safety Upgrade (I) 69,575 Yuma Hunts Ln Spot Widening (II) Grade Separation (III) Low Grade Separation (III) Grade Separation (III) Grade Separation (III) Grade Separation (III) 14,950,000 Whittier Av Safety Upgrade (I) Grade Separation (III) N/A Safety Upgrade (I) 179,575 Beaumont Av Safety Upgrade (I) Grade Separation (III) N/A Grade Separation (III) Grade Separation (III) Grade Separation (III) Grade Separation (III) 13,780,000 San Timoteo Rd Spot Widening (II) Spot Widening (II) Medium Spot Widening (II) Spot Widening (II) Spot Widening (II) Spot Widening (II) 1,002,738 Alessandro Rd Spot Widening (II) Grade Separation (III) Low Grade Separation (III) Grade Separation (III) Grade Separation (III) 13,780,000
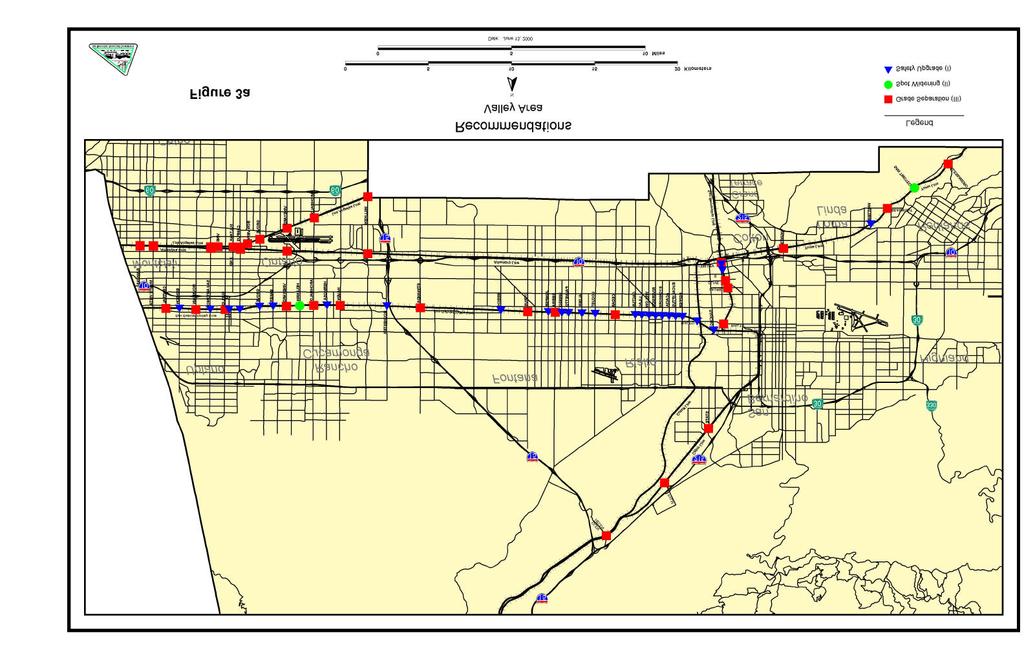
47
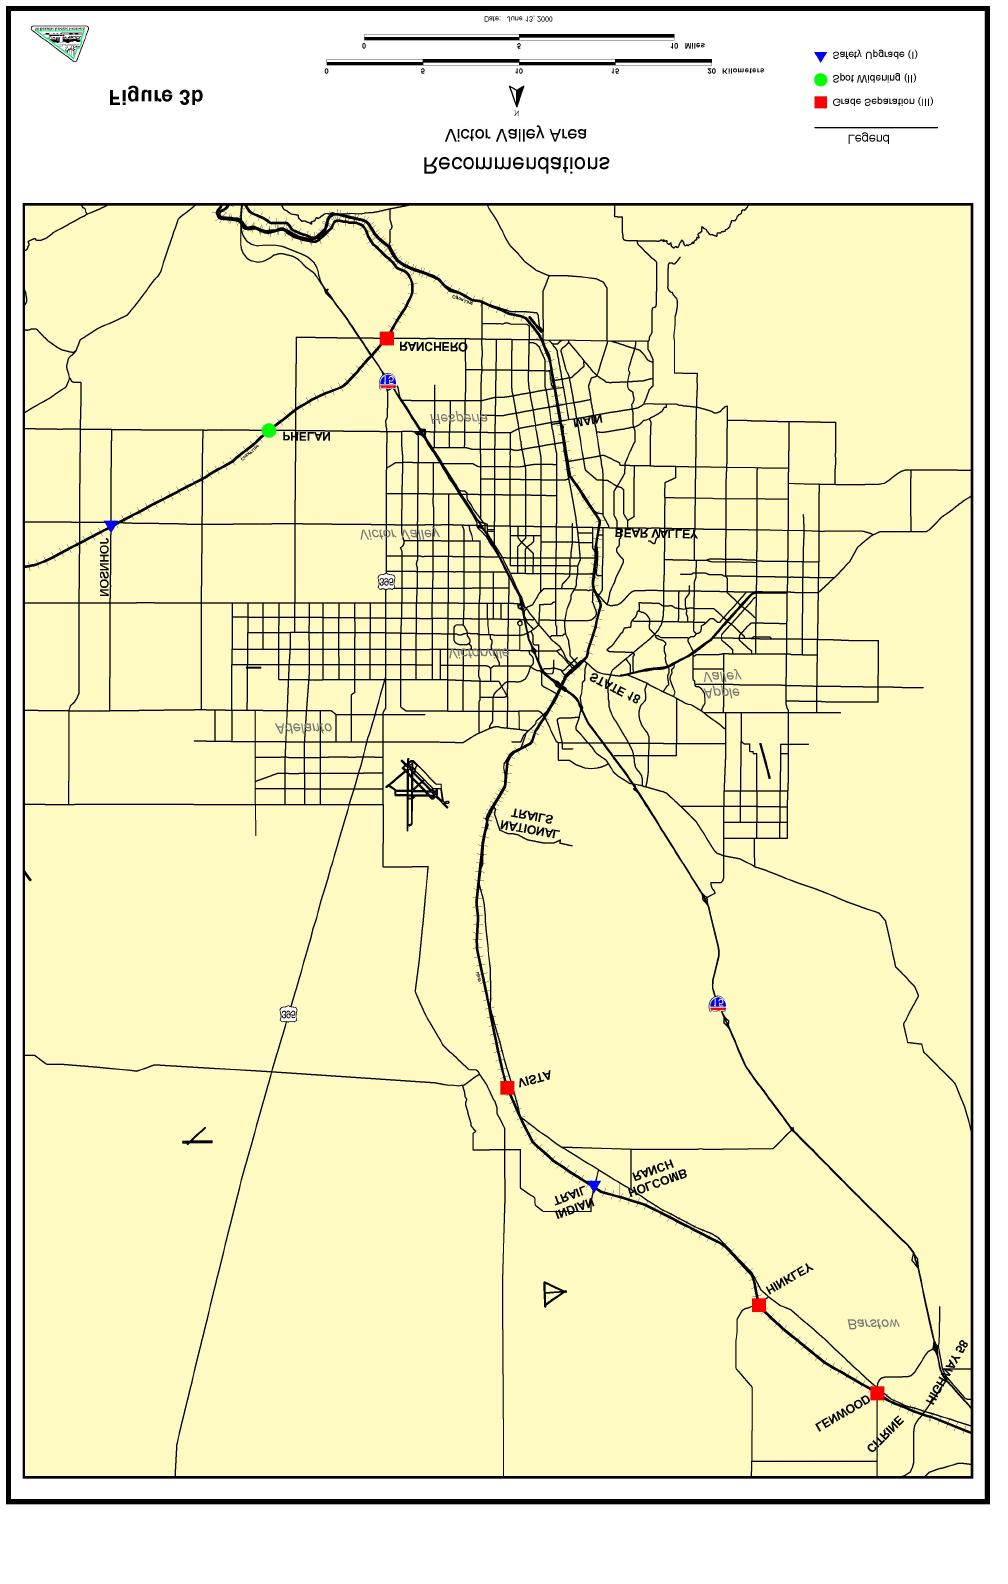
48
49 If the High option was not recommended under any of the previous three criteria, the Low option is shown recommended. Table 11 also shows the cost of the recommended improvement at each location. The total cost of the recommended improvement program is approximately $570 million. DELAY REDUCTION PRIORITIES Additional analysis was performed to assist the agencies of San Bernardino County in determining which locations should take priority in spending of funds for reducing delays at rail crossings. As with the evaluation of improvement options, the prioritization is primarily based on the amount of delay reduction, and the cost-effectiveness of the improvement in reducing delay. It also considers accident reduction potential, future traffic volumes, and the number of lanes on the street. It should be emphasized that this priority evaluation focuses on the reduction of delay. At many locations, safety upgrades are needed to enhance safety at rail crossings and to bring all crossings up to a consistent safety standard. Funds for these important safety upgrades should be identified, and improvements implemented, so that all at-grade crossings can have a reasonable expectation of safe operation. Investments in safety improvements are relatively inexpensive, compared to the improvements designed to reduce delay. For this reason, the prioritization focuses on investments to reduce delay at crossings. Table 12 shows the factors used to indicate high priority in the evaluation: Very high delay reduction in 2020 (over 100 hours per day). High delay reduction in 2020 (over 25 hours per day) Very high cost effectiveness in 2020 (over 5.0 hours of delay per day reduced per $1 million) High cost effectiveness in 2020 (over 1.5 hours of delay per day reduced per $1 million) High delay reduction in 1999 (over 25 hours per day) High cost effectiveness in 1999 (over 1.5 hours of delay per day reduced per $1 million) High accident reduction potential (for locations with a Medium or High rating in the accident evaluation, with a weighted overall accident score of more than 25,000). Two factors were counted as negative factors in the priority evaluation: Year 2020 traffic volumes of less than 10,000 vehicles per day; and Crossings with fewer than four lanes existing or programmed. These were counted as negative factors on the basis that low-volume roadways and smaller roadways should not receive as high a priority as counterparts carrying greater volumes in more lanes
50 TABLE 12 PRIORITY EVALUATIONS RECOMMENDED IMPROVEMENTS PRIORITY FACTORS 2020 V. High 2020 High 2020 V. High 2020 High 2020 High 1999 High 1999 High Accident Rail Cross Recommended Option Improvement Delay Red. Delay Reduc. Cost Effec Cost Effec Delay Red. Cost Effec Reduction volume lanes Line Street Improvement (Low - High) Cost > 100 hrs > 25 hrs. > 5.0 > 1.5 > 25 > 1.5 Potential < 10K < 4 Alhambra Ramona Av Grade Separation (III) High 12,000,000 X X X X X X Monte Vista Av Grade Separation (III) High 14,650,000 X X X X San Antonio Av Grade Separation (III) High 17,260,000 X X X Campus Av Grade Separation (III) High 17,260,000 X X X Vineyard Av Grade Separation (III) High 16,180,000 X X X Milliken Av Grade Separation (III) High 29,720,000 X X X X X Los Angeles Ramona Av Grade Separation (III) High (incl. in Alhambra line) X X X X X X Monte Vista Av Grade Separation (III) High (incl. in Alhambra line) X X X San Antonio Av Grade Separation (III) High (incl. in Alhambra line) X Vine Av Grade Separation (III) High 13,780,000 X X X X Sultana Av Grade Separation (III) High 13,780,000 X X Campus Av Grade Separation (III) High (incl. in Alhambra line) X X X Bon View Av Grade Separation (III) High 13,780,000 X X X Grove Av Grade Separation (III) High 16,180,000 X X X X X X Vineyard Av Grade Separation (III) High 14,650,000 X Archibald Av Grade Separation (III) High 16,950,000 X X Milliken Av Grade Separation (III) High 14,020,000 X X X San Gabriel Valley Central Av Grade Separation (III) High 16,180,000 X Benson Ave Safety Upgrade (I) Low 275,000 Mountain Av Grade Separation (III) High 16,180,000 X San Antonio Av Safety Upgrade (I) Low/High 206,250 Euclid Av Grade Separation (III) High 16,180,000 2nd Av Safety Upgrade (I) Low/High 398,244 X X Campus Av Safety Upgrade (I) Low/High 110,825 X X Grove Av Safety Upgrade (I) Low/High 275,000 Baker Av Safety Upgrade (I) Low 110,825 X X Vineyard Av Grade Separation (III) High 14,020,000 Hellman Av Spot Widening (II) High 1,469,479 X X Archibald Av Grade Separation (III) High 14,650,000 Hermosa Av Safety Upgrade (I) Low 110,825 X X Haven Av Grade Separation (III) High 16,950,000 X X Rochester Av Safety Upgrade (I) Low/High 343,750 X Etiwanda Av Grade Separation (III) High 14,650,000 X X X X Beech Av Safety Upgrade (I) Low 69,575 Citrus Av Grade Separation (III) High 14,020,000 X X X Juniper Av Safety Upgrade (I) Low 137,500 Sierra Av Grade Separation (III) High 14,020,000 X Mango Av Safety Upgrade (I) Low/High 385,825 Palmetto Av Safety Upgrade (I) Low 110,825 X X Alder Av Safety Upgrade (I) Low 248,325 X Locust Av Safety Upgrade (I) Low 110,825 X Cedar Av Grade Separation (III) High 14,650,000 X Cactus Av Safety Upgrade (I) Low/High 482,075 X X Lilac Av Safety Upgrade (I) Low 69,575 X X Willow Av Safety Upgrade (I) Low/High 69,988 X X Riverside Av Safety Upgrade (I) Low/High 343,750 X Sycamore Av Safety Upgrade (I) Low/High 69,988 X X
51 TABLE 12 (continued) PRIORITY EVALUATIONS RECOMMENDED IMPROVEMENTS PRIORITY FACTORS 2020 V. High 2020 High 2020 V. High 2020 High 2020 High 1999 High 1999 High Accident Rail Cross Recommended Option Improvement Delay Red. Delay Reduc. Cost Effec Cost Effec Delay Red. Cost Effec Reduction volume lanes Line Street Improvement (Low - High) Cost > 100 hrs > 25 hrs. > 5.0 > 1.5 > 25 > 1.5 Potential < 10K < 4 San Gabriel Valley Acacia Av Safety Upgrade (I) Low 69,575 X X (continued) Eucalytus Av Safety Upgrade (I) Low/High 69,988 X X Pepper Av Safety Upgrade (I) Low 206,250 Rialto Av Safety Upgrade (I) Low 110,825 Rancho Av Safety Upgrade (I) Low/High 110,825 X X San Bernardino Rialto Av Grade Separation (III) High 14,020,000 X X X X X X X Laurel St Grade Separation (III) High 14,880,000 X X X X X X Olive St Grade Separation (III) High 14,000,000 X X X X E St Safety Upgrade (I) Low/High 110,825 X X H St Safety Upgrade (I) Low/High 110,825 X X Valley Bl Grade Separation (III) High 17,300,000 X X Cajon State/University Grade Separation (III) High 14,360,000 X X X X X X Palm Av Grade Separation (III) High 13,780,000 X X X X X Glen Helen Pkwy Grade Separation (III) High 15,270,000 X X X X X Vista Grade Separation (III) High 13,280,000 X X X X X Indian Trail Safety Upgrade (I) Low/High 69,575 X X Hinkley Grade Separation (III) High 13,280,000 X X X X Lenwood Grade Separation (III) High 13,280,000 X X X X X Cutoff Ranchero Rd. Grade Separation (III) High 13,280,000 X X X X Phelan Spot Widening (II) Low 796,488 X X Johnson Rd. Safety Upgrade (I) Low/High 69,575 X X Yuma Hunts Ln Grade Separation (III) High 14,950,000 Whittier Av Safety Upgrade (I) Low 179,575 X X Beaumont Av Grade Separation (III) High 13,780,000 X X San Timoteo Rd Spot Widening (II) Low/High 1,002,738 X X X X Alessandro Rd Grade Separation (III) High 13,780,000 X X X X
52 PRIORITY GROUPINGS The priority factors indicated in Table 12 were used to group the improvements with similar priority. The delay and cost-effectiveness factors were first used to establish initial priority groupings (shown in Table 13) as follows: Priority Group #1: Improvements which have: High 1999 Delay Reduction or Cost-Effectiveness and Very High 2020 Delay Reduction and Very High 2020 Cost-Effectiveness Priority Group #2: Improvements which have: Very High 2020 Delay Reduction and High 2020 Cost-Effectiveness Priority Group #3: Improvements which have: High 2020 Delay Reduction and High 2020 Cost-Effectiveness Priority Group #4: Other delay reduction improvements which do not meet the criteria for Priority Groups #1-3. Priority Group #5: Locations with no delay reduction strategies recommended (designated for safety improvements only) After the initial priority groupings were established, locations with accident reduction potential were moved to the next group up, and locations with low volumes or less than four lanes were moved to the next group down (see Table 13). Improvement recommendations are shown with their respective priority groupings in the maps of Figure 4. Table 14 groups the recommended improvements together by priority. Improvements in the top priority group constitute 15% ($87 million) of the overall improvement cost. The second group represents 10% ($58 million) of the overall improvement cost. The third group represents 32% ($181 million), and the fourth group represents 42% ($238 million)
53 TABLE 13 PRIORITY GROUPINGS FOR DELAY REDUCTION RECOMMENDED IMPROVEMENTS LOW 2020 INITIAL ACCIDENT VOLUME FINAL Rail Cross Recommended Improvement PRIORITY REDUCTION FEW PRIORITY Line Street Jurisdiction Improvement Cost GROUPING POTENTIAL LANES GROUPING Alhambra Ramona Av Montclair Grade Separation (III) 12,000, Alhambra Monte Vista Av Montclair Grade Separation (III) 14,650, Alhambra San Antonio Av Ontario Grade Separation (III) 17,260, Alhambra Campus Av Ontario Grade Separation (III) 17,260, Alhambra Vineyard Av Ontario Grade Separation (III) 16,180, Alhambra Milliken Av Ontario Grade Separation (III) 29,720, Los Angeles Ramona Av Montclair Grade Separation (III) (incl. in Alhambra line) 1 1 Los Angeles Monte Vista Av Montclair Grade Separation (III) (incl. in Alhambra line) Los Angeles San Antonio Av Ontario Grade Separation (III) (incl. in Alhambra line) Los Angeles Vine Av Ontario Grade Separation (III) 13,780, Los Angeles Sultana Av Ontario Grade Separation (III) 13,780, Los Angeles Campus Av Ontario Grade Separation (III) (incl. in Alhambra line) Los Angeles Bon View Av Ontario Grade Separation (III) 13,780, Los Angeles Grove Av Ontario Grade Separation (III) 16,180, Los Angeles Vineyard Av Ontario Grade Separation (III) 14,650, Los Angeles Archibald Av Ontario Grade Separation (III) 16,950, Los Angeles Milliken Av Ontario Grade Separation (III) 14,020, San Gabriel Valley Central Av Montclair Grade Separation (III) 16,180, San Gabriel Valley Benson Ave Upland Safety Upgrade (I) 275, San Gabriel Valley Mountain Av Upland Grade Separation (III) 16,180, San Gabriel Valley San Antonio Av Upland Safety Upgrade (I) 206, San Gabriel Valley Euclid Av Upland Grade Separation (III) 16,180, San Gabriel Valley 2nd Av Upland Safety Upgrade (I) 398, San Gabriel Valley Campus Av Upland Safety Upgrade (I) 110, San Gabriel Valley Grove Av Rancho Cucamonga Safety Upgrade (I) 275, San Gabriel Valley Baker Av Rancho Cucamonga Safety Upgrade (I) 110, San Gabriel Valley Vineyard Av Rancho Cucamonga Grade Separation (III) 14,020, San Gabriel Valley Hellman Av Rancho Cucamonga Spot Widening (II) 1,469, San Gabriel Valley Archibald Av Rancho Cucamonga Grade Separation (III) 14,650, San Gabriel Valley Hermosa Av Rancho Cucamonga Safety Upgrade (I) 110, San Gabriel Valley Haven Av Rancho Cucamonga Grade Separation (III) 16,950, San Gabriel Valley Rochester Av Rancho Cucamonga Safety Upgrade (I) 343, San Gabriel Valley Etiwanda Av Rancho Cucamonga Grade Separation (III) 14,650, San Gabriel Valley Beech Av San Bernardino County Safety Upgrade (I) 69, San Gabriel Valley Citrus Av Fontana Grade Separation (III) 14,020, San Gabriel Valley Juniper Av Fontana Safety Upgrade (I) 137, San Gabriel Valley Sierra Av Fontana Grade Separation (III) 14,020, San Gabriel Valley Mango Av Fontana Safety Upgrade (I) 385, San Gabriel Valley Palmetto Av Fontana Safety Upgrade (I) 110,
54 TABLE 13 (continued) PRIORITY GROUPINGS FOR DELAY REDUCTION RECOMMENDED IMPROVEMENTS LOW 2020 INITIAL ACCIDENT VOLUME FINAL Rail Cross Recommended Improvement PRIORITY REDUCTION FEW PRIORITY Line Street Jurisdiction Improvement Cost GROUPING POTENTIAL LANES GROUPING San Gabriel Valley Alder Av Fontana Safety Upgrade (I) 248, San Gabriel Valley Locust Av San Bernardino County Safety Upgrade (I) 110, San Gabriel Valley Cedar Av Rialto Grade Separation (III) 14,650, San Gabriel Valley Cactus Av Rialto Safety Upgrade (I) 482, San Gabriel Valley Lilac Av Rialto Safety Upgrade (I) 69, San Gabriel Valley Willow Av Rialto Safety Upgrade (I) 69, San Gabriel Valley Riverside Av Rialto Safety Upgrade (I) 343, San Gabriel Valley Sycamore Av Rialto Safety Upgrade (I) 69, San Gabriel Valley Acacia Av Rialto Safety Upgrade (I) 69, San Gabriel Valley Eucalytus Av Rialto/San Bernardino City Safety Upgrade (I) 69, San Gabriel Valley Pepper Av San Bernardino City Safety Upgrade (I) 206, San Gabriel Valley Rialto Av San Bernardino City Safety Upgrade (I) 110, San Gabriel Valley Rancho Av San Bernardino City Safety Upgrade (I) 110, San Bernardino Rialto Av San Bernardino City Grade Separation (III) 14,020, San Bernardino Laurel St Colton Grade Separation (III) 14,880, San Bernardino Olive St Colton Grade Separation (III) 14,000, San Bernardino E St Colton Safety Upgrade (I) 110, San Bernardino H St Colton Safety Upgrade (I) 110, San Bernardino Valley Bl Colton Grade Separation (III) 17,300, Cajon State/University San Bernardino City Grade Separation (III) 14,360, Cajon Palm Av San Bernardino City Grade Separation (III) 13,780, Cajon Glen Helen Pkwy San Bernardino County Grade Separation (III) 15,270, Cajon Vista San Bernardino County Grade Separation (III) 13,280, Cajon Indian Trail San Bernardino County Safety Upgrade (I) 69, Cajon Hinkley San Bernardino County Grade Separation (III) 13,280, Cajon Lenwood San Bernardino County Grade Separation (III) 13,280, Cutoff Ranchero Rd. San Bernardino County Grade Separation (III) 13,280, Cutoff Phelan San Bernardino County Spot Widening (II) 796, Cutoff Johnson Rd. San Bernardino County Safety Upgrade (I) 69, Yuma Hunts Ln San Bernardino City/Colton Grade Separation (III) 14,950, Yuma Whittier Av Loma Linda Safety Upgrade (I) 179, Yuma Beaumont Av Loma Linda Grade Separation (III) 13,780, Yuma San Timoteo Rd Redlands Spot Widening (II) 1,002, Yuma Alessandro Rd Redlands Grade Separation (III) 13,780,
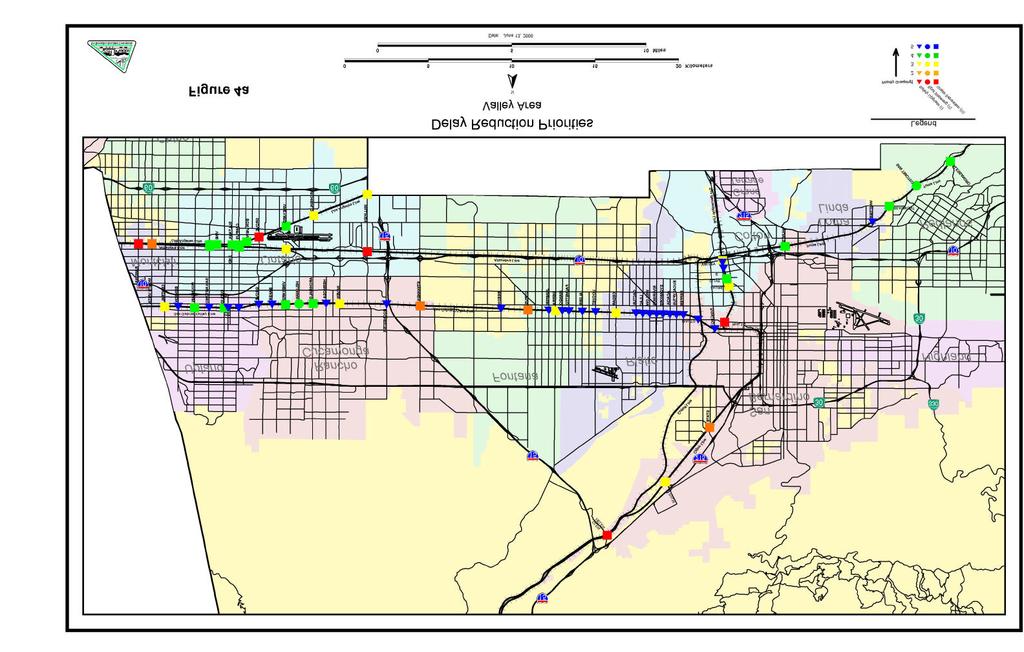
55

56
DEVELOPMENT OF RIDERSHIP FORECASTS FOR THE SAN BERNARDINO INFRASTRUCTURE IMPROVEMENT STUDY
 APPENDIX 1 DEVELOPMENT OF RIDERSHIP FORECASTS FOR THE SAN BERNARDINO INFRASTRUCTURE IMPROVEMENT STUDY INTRODUCTION: This Appendix presents a general description of the analysis method used in forecasting
4 COSTS AND OPERATIONS
 4 COSTS AND OPERATIONS 4.1 INTRODUCTION This chapter summarizes the estimated capital and operations and maintenance (O&M) costs for the Modal and High-Speed Train (HST) Alternatives evaluated in this
Table Existing Traffic Conditions for Arterial Segments along Construction Access Route. Daily
 5.8 TRAFFIC, ACCESS, AND CIRCULATION This section describes existing traffic conditions in the project area; summarizes applicable regulations; and analyzes the potential traffic, access, and circulation
Highway 18 BNSF Railroad Overpass Feasibility Study Craighead County. Executive Summary
 Highway 18 BNSF Railroad Overpass Feasibility Study Craighead County Executive Summary October 2014 Highway 18 BNSF Railroad Overpass Feasibility Study Craighead County Executive Summary October 2014 Prepared
STH 60 Northern Reliever Route Feasibility Study Report
 #233087 v3 STH 60 Northern Reliever Route Feasibility Study Report Washington County Public Works Committee Meeting September 28, 2016 1 STH 60 Northern Reliever Route Feasibility Study Hartford Area Development
Appendix C. Grade Crossing Impacts Evaluation
 Appendix C Grade Crossing Impacts Evaluation Final Report Pier T Grain Export Terminal Project prepared for Port of Long Beach, California prepared by Cambridge Systematics, Inc. October 27, 2011 1.0 Project
CITY OF RIALTO TRANSPORTATION/TRAFFIC IMPACT FEE Nexus Study
 Submitted by: CITY OF RIALTO TRANSPORTATION/TRAFFIC IMPACT FEE Nexus Study Submitted to: City of Rialto November 2016 17J14 1737 Traffic Impact Fee Nexus Study Draft Report TABLE OF CONTENTS Table of Contents...
Pier B On-Dock Rail Support Facility Project Rail Grade Crossings Analysis
 Pier B On-Dock Rail Support Facility Project Rail Grade Crossings Analysis Prepared for Port of Long Beach Prepared by Cambridge Systematics, Inc. July 2016 www.camsys.com Pier B On-Dock Rail Support Facility
Traffic Study for Barstow 2014 General Plan Amendment. Prepared for: The City of Barstow. Prepared by: ADVANTEC Consulting Engineers
 Traffic Study for Barstow 2014 General Plan Amendment Prepared for: The City of Barstow Prepared by: June 20, 2014 TABLE OF CONTENTS 1. Executive Summary... 1 2. Project Background & Description... 3 2.1
Executive Summary. Draft Environmental Impact Statement/Environmental Impact Report ES-1
 Executive Summary Introduction The Eastside Transit Corridor Phase 2 Project is a vital public transit infrastructure investment that would provide a transit connection to the existing Metro Gold Line
Comprehensive Regional Goods Movement Plan and Implementation Strategy Goods Movement in the 2012 RTP/SCS
 Comprehensive Regional Goods Movement Plan and Implementation Strategy Goods Movement in the 2012 RTP/SCS Annie Nam Southern California Association of Governments September 24, 2012 The Goods Movement
REALIZING THE AIR QUALITY BENEFITS OF PORT INFRASTRUCTURE PROJECTS. A Case Study of the Alameda Corridor
 REALIZING THE AIR QUALITY BENEFITS OF PORT INFRASTRUCTURE PROJECTS A Case Study of the Alameda Corridor April 29, 25 Dr. Margaret Lobnitz, Weston Solutions, Inc. 1 BACKGROUND In mid-198 s, growing concern
LAWRENCE TRANSIT CENTER LOCATION ANALYSIS 9 TH STREET & ROCKLEDGE ROAD / 21 ST STREET & IOWA STREET LAWRENCE, KANSAS
 LAWRENCE TRANSIT CENTER LOCATION ANALYSIS 9 TH STREET & ROCKLEDGE ROAD / 21 ST STREET & IOWA STREET LAWRENCE, KANSAS TRAFFIC IMPACT STUDY FEBRUARY 214 OA Project No. 213-542 TABLE OF CONTENTS 1. INTRODUCTION...
Traffic Engineering Study
 Traffic Engineering Study Bellaire Boulevard Prepared For: International Management District Technical Services, Inc. Texas Registered Engineering Firm F-3580 November 2009 Executive Summary has been requested
U.S. System Summary: ARIZONA/SOUTHWEST
 U.S. System Summary: ARIZONA/SOUTHWEST Arizona/Southwest High-Speed Rail System (Source: Texas A&M Transportation Institute) The Arizona/Southwest high-speed rail system described in this summary groups
Traffic Impact Analysis West Street Garden Plots Improvements and DuPage River Park Garden Plots Development Naperville, Illinois
 Traffic Impact Analysis West Street Garden Plots Improvements and DuPage River Park Garden Plots Development Naperville, Illinois Submitted by April 9, 2009 Introduction Kenig, Lindgren, O Hara, Aboona,
APPENDIX C1 TRAFFIC ANALYSIS DESIGN YEAR TRAFFIC ANALYSIS
 APPENDIX C1 TRAFFIC ANALYSIS DESIGN YEAR TRAFFIC ANALYSIS DESIGN YEAR TRAFFIC ANALYSIS February 2018 Highway & Bridge Project PIN 6754.12 Route 13 Connector Road Chemung County February 2018 Appendix
The range of alternatives has been reviewed with the RTAC Subgroup and the preliminary analysis is proceeding on the following HCT alternatives:
 Attachment 2 Boise Treasure Valley Phase 1 Alternatives Analysis August 14, 2009 Introduction The Treasure Valley High Capacity Transit Priority Corridor Phase 1 Alternatives Analysis is being prepared
Date: February 7, 2017 John Doyle, Z-Best Products Robert Del Rio. T.E. Z-Best Traffic Operations and Site Access Analysis
 Memorandum Date: February 7, 07 To: From: Subject: John Doyle, Z-Best Products Robert Del Rio. T.E. Z-Best Traffic Operations and Site Access Analysis Introduction Hexagon Transportation Consultants, Inc.
The major roadways in the study area are State Route 166 and State Route 33, which are shown on Figure 1-1 and described below:
 3.5 TRAFFIC AND CIRCULATION 3.5.1 Existing Conditions 3.5.1.1 Street Network DRAFT ENVIRONMENTAL IMPACT REPORT The major roadways in the study area are State Route 166 and State Route 33, which are shown
Pacific Electric Right-of-Way / West Santa Ana Branch Corridor Alternatives Analysis
 Pacific Electric Right-of-Way / West Santa Ana Branch Corridor Alternatives Analysis Transit Coalition September 26, 2012 2 Study Area Pacific Electric Rightof-Way/West Santa Ana Branch (PEROW/ WSAB) extends
2. Valley Circle Boulevard/Andora Avenue/Baden Avenue and Lassen Street
 IV.J TRANSPORTATION 1. INTRODUCTION This section presents an overview of the existing traffic and circulation system in and surrounding the project site. This section also discusses the potential impacts
RAILYARDS SUPPORT A VARIETY OF OPERATIONS INCLUDING: LOCOMOTIVES, ON-ROAD AND OFF-ROAD TRUCKS, CARGO-HANDLING EQUIPMENT, TRANSPORTATION
 RAILYARDS SUPPORT A VARIETY OF OPERATIONS INCLUDING: LOCOMOTIVES, ON-ROAD AND OFF-ROAD TRUCKS, CARGO-HANDLING EQUIPMENT, TRANSPORTATION REFRIGERATION UNITS AND MAINTENANCE SHOPS. CHAPTER FIVE railyards
Alpine Highway to North County Boulevard Connector Study
 Alpine Highway to North County Boulevard Connector Study prepared by Avenue Consultants March 16, 2017 North County Boulevard Connector Study March 16, 2017 Table of Contents 1 Summary of Findings... 1
TIMBERVINE TRANSPORTATION IMPACT STUDY FORT COLLINS, COLORADO JANUARY Prepared for:
 TIMBERVINE TRANSPORTATION IMPACT STUDY FORT COLLINS, COLORADO JANUARY 2014 Prepared for: Hartford Companies 1218 W. Ash Street Suite A Windsor, Co 80550 Prepared by: DELICH ASSOCIATES 2272 Glen Haven Drive
2012 Air Emissions Inventory
 SECTION 6 HEAVY-DUTY VEHICLES This section presents emissions estimates for the heavy-duty vehicles (HDV) source category, including source description (6.1), geographical delineation (6.2), data and information
Traffic Impact Study Speedway Gas Station Redevelopment
 Traffic Impact Study Speedway Gas Station Redevelopment Warrenville, Illinois Prepared For: Prepared By: April 11, 2018 Table of Contents 1. Introduction... 1 2. Existing Conditions... 4 Site Location...
City of Pacific Grove
 Regional Study Utilizing Caltrans Intersection Evaluation Section 7: City of Pacific Grove s: FIRST STREET AT CENTRAL AVENUE Transportation Agency for Monterey County Prepared by Transportation Agency
US 81 Bypass of Chickasha Environmental Assessment Public Meeting
 US 81 Bypass of Chickasha Environmental Assessment Public Meeting March 14, 2013 Introductions ODOT FHWA SAIC Meeting Purpose Present need for bypass Provide responses to 10/04/11 public meeting comments
Sepulveda Pass Corridor Systems Planning Study Final Compendium Report. Connecting the San Fernando Valley and the Westside
 Los Angeles County Metropolitan Transportation Authority November 2012 Connecting the San Fernando Valley and the Westside Interstate 405 Sepulveda Pass THIS PAGE INTENTIONALLY LEFT BLANK Sepulveda Pass
NEW HAVEN HARTFORD SPRINGFIELD RAIL PROGRAM
 NEW HAVEN HARTFORD SPRINGFIELD RAIL PROGRAM Hartford Rail Alternatives Analysis www.nhhsrail.com What Is This Study About? The Connecticut Department of Transportation (CTDOT) conducted an Alternatives
Appendix C2. Rail Grade Crossing Analysis
 Appendix C2 Rail Grade Crossing Analysis C2.1 Rail Transportation Setting The Ports of Los Angeles and Long Beach are served by two Class I railroads: Union Pacific Railroad (UP) and the Burlington Northern
Executive Summary. Treasure Valley High Capacity Transit Study Priority Corridor Phase 1 Alternatives Analysis October 13, 2009.
 Treasure Valley High Capacity Transit Study Priority Corridor Phase 1 Alternatives Analysis October 13, 2009 Background As the Treasure Valley continues to grow, high-quality transportation connections
Purpose and Need Report
 Purpose and Need Report State Highway (SH) 29 From Southwestern Boulevard to SH 95 Williamson County, Texas (CSJ: 0337-02-045) Prepared by Blanton & Associates, Inc. Date: November, 2015 The environmental
Chapter 8.0 PROPOSED CAPITAL IMPROVEMENT PROGRAM
 Chapter 8.0 PROPOSED CAPITAL IMPROVEMENT PROGRAM This chapter presents the proposed Capital Improvement Program (CIP) for the District based on the findings of this Master Plan. The Master Plan primarily
Proposed location of Camp Parkway Commerce Center. Vicinity map of Camp Parkway Commerce Center Southampton County, VA
 Proposed location of Camp Parkway Commerce Center Vicinity map of Camp Parkway Commerce Center Southampton County, VA Camp Parkway Commerce Center is a proposed distribution and industrial center to be
Subarea Study. Manning Avenue (CSAH 15) Corridor Management and Safety Improvement Project. Final Version 1. Washington County.
 Corridor Management and Safety Improvement Project. Final Version 1. Washington County.") Subarea Study Manning Avenue (CSAH 15) Corridor Management and Safety Improvement Project Final Version 1 Washington County June 12, 214 SRF No. 138141 Table of Contents Introduction... 1 Forecast Methodology
Subarea Study Manning Avenue (CSAH 15) Corridor Management and Safety Improvement Project Final Version 1 Washington County June 12, 214 SRF No. 138141 Table of Contents Introduction... 1 Forecast Methodology
Table of Contents INTRODUCTION... 3 PROJECT STUDY AREA Figure 1 Vicinity Map Study Area... 4 EXISTING CONDITIONS... 5 TRAFFIC OPERATIONS...
 Crosshaven Drive Corridor Study City of Vestavia Hills, Alabama Table of Contents INTRODUCTION... 3 PROJECT STUDY AREA... 3 Figure 1 Vicinity Map Study Area... 4 EXISTING CONDITIONS... 5 TRAFFIC OPERATIONS...
Letter EL652 City of Mercer Island. Page 1. No comments n/a
 Letter EL652 City of Mercer Island Page 1 No comments n/a Page 2 Response to comment EL652 1 Section 4.5.3 of the Final EIS presents the range of potential impacts of the project. This project also lists
4.0 TIER 2 ALTERNATIVES
 4.0 TIER 2 ALTERNATIVES The Tier 2 Alternatives represent the highest performing Tier 1 Alternatives. The purpose of the Tier 2 Screening was to identify the LPA utilizing a more robust list of evaluation
Technical Memorandum Analysis Procedures and Mobility Performance Measures 100 Most Congested Texas Road Sections What s New for 2015
 Technical Memorandum Analysis Procedures and Mobility Performance Measures 100 Most Congested Texas Road Sections Prepared by Texas A&M Transportation Institute August 2015 This memo documents the analysis
Develop ground transportation improvements to make the Airport a multi-modal regional
 Project Overview TRANSPORTATION IMPROVEMENTS WHAT ARE THE PROJECT GOALS? Transportation transportation hub. Develop ground transportation improvements to make the Airport a multi-modal regional Land Use
RTID Travel Demand Modeling: Assumptions and Method of Analysis
 RTID Travel Demand Modeling: Assumptions and Method of Analysis Overall Model and Scenario Assumptions The Puget Sound Regional Council s (PSRC) regional travel demand model was used to forecast travel
IMPROVEMENT CONCEPTS
 IMPROVEMENT CONCEPTS for the South Novato Transit Hub Study Prepared by: January 11, 2010 DKS Associates With Wilbur Smith Associates IMPROVEMENT CONCEPTS Chapter 1: Introduction 1. INTRODUCTION The strategic
APPENDIX B Traffic Analysis
 APPENDIX B Traffic Analysis Rim of the World Unified School District Reconfiguration Prepared for: Rim of the World School District 27315 North Bay Road, Blue Jay, CA 92317 Prepared by: 400 Oceangate,
Preliminary Definition of Alternatives. 3.0 Preliminary Definition of Alternatives
 3.0 What preliminary alternatives are being evaluated? The alternatives for the East San Fernando Valley Transit Corridor project that were considered for screening include the No Build Alternative, Transportation
Chapter 1 Project Description
 Chapter 1 Project Description 1.1 INTRODUCTION The Metro Gold Line light rail transit (LRT) system currently extends from Los Angeles to Pasadena serving cities and communities along the alignment corridor.
CLAREMONT METROLINK STATION STUDY Claremont Town Hall Meeting December 11, 2017
 CLAREMONT METROLINK STATION STUDY Claremont Town Hall Meeting December 11, 2017 1 Welcome Larry Schroeder Claremont Mayor 2 Agenda 1. Introduction of Panelists 2. Background 3. Metro Board Motion - Metrolink
New Buck O Neil (U. S. 169) Crossing Benefit-Cost Analysis. Kansas City, Missouri
 Crossing Benefit-Cost Analysis. Kansas City, Missouri") New Buck O Neil (U. S. 169) Crossing Benefit-Cost Analysis Kansas City, Missouri New Buck O Neil (U. S. 169) Crossing Benefit-Cost Analysis prepared for Kansas City, Missouri prepared by Burns & McDonnell
New Buck O Neil (U. S. 169) Crossing Benefit-Cost Analysis Kansas City, Missouri New Buck O Neil (U. S. 169) Crossing Benefit-Cost Analysis prepared for Kansas City, Missouri prepared by Burns & McDonnell
INDUSTRIAL DEVELOPMENT
 INDUSTRIAL DEVELOPMENT Traffic Impact Study Plainfield, Illinois August 2018 Prepared for: Seefried Industrial Properties, Inc. TABLE OF CONTENTS Executive Summary 2 Introduction 3 Existing Conditions
CITY OF ANN ARBOR, MICHIGAN 301 E. Huron St., P.O. Box 8647 Ann Arbor, Michigan
 Date: Wednesday, June 24, 2014 Location: Ann Arbor District Library Attendees: 40 citizen attendees Ann Arbor Station Environmental Review Public Meeting Meeting Notes Meeting #2 The second public meeting
Open House. Highway212. Meetings. Corridor Access Management, Safety & Phasing Plan. 5:30 to 6:30 p.m. - Southwest Corridor Transportation Coalition
 Welcome Meetings 5:30 to 6:30 p.m. - Southwest Corridor Transportation Coalition 6:30 to 8:00 p.m. - Open House Why is Highway 212 Project Important? Important Arterial Route Local Support Highway 212
MEMORANDUM. Project Description. Operational Trip Generation. Construction Trip Generation. Date: August 12, 2014 TG: To: From: Subject:
 MEMORANDUM Date: August 12, 2014 TG: 13329.01 To: From: Subject: Jeremy Krout EPD Solutions Inc. Rafik Albert EPD Solutions Inc. Rawad Hani Transpo Group AP North Lake Solar Project Traffic Scoping The
The Highway Safety Manual: Will you use your new safety powers for good or evil? April 4, 2011
 The Highway Safety Manual: Will you use your new safety powers for good or evil? April 4, 2011 Introductions Russell Brownlee, M.A. Sc., FITE, P. Eng. Specialize in road user and rail safety Transportation
TORONTO TRANSIT COMMISSION REPORT NO.
 Form Revised: February 2005 TORONTO TRANSIT COMMISSION REPORT NO. MEETING DATE: October 24, 2012 SUBJECT: DOWNTOWN RAPID TRANSIT EXPANSION STUDY (DRTES) PHASE 1 STRATEGIC PLAN ACTION ITEM RECOMMENDATIONS
US 69/75 Controlled Access Highway and Grade Separations Benefit-Cost Analysis Narrative
 US 69/75 Controlled Access Highway and Grade Separations Introduction The Oklahoma Department of Transportation (ODOT) proposes to improve safety and efficiency of high volume freight traffic along the
Section 3.12 Traffic and Transportation
 Section. Traffic and Transportation SECTION SUMMARY This section describes existing ground transportation within the Port and surrounding area associated with implementation of the proposed Project. An
METRO Orange Line BRT American Boulevard Station Options
 METRO Orange Line BRT American Boulevard Station Options Bloomington City Council Work Session November 18, 2013 Christina Morrison BRT/Small Starts Project Office Coordinating Planning and Design AMERICAN
BROWARD BOULEVARD CORRIDOR TRANSIT STUDY
 BROWARD BOULEVARD CORRIDOR TRANSIT STUDY FM # 42802411201 EXECUTIVE SUMMARY July 2012 GOBROWARD Broward Boulevard Corridor Transit Study FM # 42802411201 Executive Summary Prepared For: Ms. Khalilah Ffrench,
TALMONT TOWNHOMES MADISON KENNETH SPA TRAFFIC IMPACT STUDY. Sacramento, CA. Prepared For: MBK Homes. Prepared By:
 TALMONT TOWNHOMES MADISON KENNETH SPA TRAFFIC IMPACT STUDY Sacramento, CA Prepared For: MBK Homes Prepared By: KD Anderson & Associates 3853 Taylor Road, Suite G Loomis, California 95650 (916) 660-1555
3.15 SAFETY AND SECURITY
 3.15 SAFETY AND SECURITY Introduction This section describes the environmental setting and potential effects of the alternatives analyzed in this EIR with regard to safety and security in the SantaClara-Alum
Chapter 7: Corridor Visions
 Chapter 7: Corridor Visions (see also Appendix 7 for Details) January 24, 2008 NOTE: This document has been prepared using Federal funding from the United States Department of Transportation. The United
Section 5.8 Transportation and Traffic
 Section 5.8 Transportation and Traffic 5.8 TRANSPORTATION AND TRAFFIC Generous This Section is based on the Topgolf Specific Plan Traffic Impact Analysis (RK Engineering Group, Inc., October 31, 2016);
Alternatives Analysis Findings Report
 6.0 This chapter presents estimates of the potential capital, operations and maintenance costs associated with the alternatives carried forward for detailed evaluation. The methodology used to develop
Energy Technical Memorandum
 Southeast Extension Project Lincoln Station to RidgeGate Parkway Prepared for: Federal Transit Administration Prepared by: Denver Regional Transportation District May 2014 Table of Contents Page No. Chapter
Goods Movement Plans. Summary of Needs Assessments. January 21, 2015 GOODS MOVEMENT COLLABORATIVE AND GOODS MOVEMENT PLAN 6
 Goods Movement Plans Summary of Needs Assessments January 21, 2015 GOODS MOVEMENT COLLABORATIVE AND GOODS MOVEMENT PLAN 6 Goods Movement Vision and Goals GOODS MOVEMENT COLLABORATIVE AND GOODS MOVEMENT
The Eastern Connector Study November, 2007 planning for the future
 The Eastern Connector Study November, 2007 planning for the future In late 2006, Albemarle County and the City of Charlottesville jointly initiated the Eastern Connector Corridor Study. The Project Team
CEDAR AVENUE TRANSITWAY Implementation Plan Update
 CEDAR AVENUE TRANSITWAY Implementation Plan Update EECUTIVE SUMMARY DECEMBER 2015 Executive Summary In 2013, the Twin Cities metropolitan area s first bus rapid transit (BRT) line, the METRO Red Line,
ALAMEDA CORRIDOR. A A Project of National Significance. TRB Summer Conference MTS as a Component of the Nation s Transportation System June 25, 2002
 ALAMEDA CORRIDOR A A Project of National Significance TRB Summer Conference MTS as a Component of the Nation s Transportation System June 25, 2002 Top U.S. Container Ports (2001) LOS ANGELES 5.18 LONG
APPENDIX H. Transportation Impact Study
 APPENDIX H Transportation Impact Study BUENA VISTA LAGOON ENHANCEMENT PROJECT TRANSPORTATION IMPACT STUDY Prepared for: San Diego Association of Governments Prepared by: VRPA Technologies, Inc. 9520 Padgett
TRANSPORTATION STUDY FOR THE 8899 BEVERLY BOULEVARD PROJECT
 DRAFT TRANSPORTATION STUDY FOR THE 8899 BEVERLY BOULEVARD PROJECT WEST HOLLYWOOD, CALIFORNIA NOVEMBER 2013 PREPARED FOR BEVERLY BOULEVARD ASSOCIATION PREPARED BY DRAFT TRANSPORTATION STUDY FOR THE 8899
Design of the High Speed Rail System in California. Orange County to Los Angeles Segment
 Andrew W. Sokol 1 Design of the High Speed Rail System in California Orange County to Los Angeles Segment Andrew W. Sokol, P.E. STV Incorporated 2009 AREMA Conference and Exposition Chicago, Illinois (total
PAPER FOR AREMA 2004 ANNUAL CONFERENCE LOS ANGELES UNION STATION RUN-THROUGH TRACKS. Paul Mak, PE, SE - DMJM HARRIS
 1 PAPER FOR AREMA 2004 ANNUAL CONFERENCE LOS ANGELES UNION STATION RUN-THROUGH TRACKS Paul Mak, PE, SE - DMJM HARRIS 515 S. Flower Street 9th Floor, Los Angeles, CA 90071. Tel 213-593-8337 Fax 213-593-8622
Bi-County Transitway/ Bethesda Station Access Demand Analysis
 Bi-County Transitway/ Bethesda Station Access Demand Analysis Prepared for: Washington Metropolitan Area Transit Authority Office of Planning and Project Development May 2005 Prepared by: in conjunction
Appendix G: Transportation/Traffic
 City of Irvine - William Lyon Homes: Vista Verde Draft EIR Appendix G: Transportation/Traffic Michael Brandman Associates H:\Client (PN-JN)\0006\00060034\EIR\3 - DEIR\00060034 Sec99-00 Appendix Dividers
Dixie Transportation Planning Office
 A project must be given a yes rating on items 1 & 2 in order to be prioritized. Sponsor: St. George City Project: Pioneer Parkway Type: Road Widening and Reconstruction Rev. 9/17/2010 Dixie Transportation
TABLE OF CONTENTS EXECUTIVE SUMMARY...1 INTRODUCTION...3 PROJECTED FUTURE GROWTH...3 ROADWAY IMPROVEMENT PROJECTS...4 POTENTIAL FUNDING SOURCES...
 Transportation Impact Fee Study September 2014 TABLE OF CONTENTS EXECUTIVE SUMMARY...1 INTRODUCTION...3 PROJECTED FUTURE GROWTH...3 ROADWAY IMPROVEMENT PROJECTS......4 POTENTIAL FUNDING SOURCES...7 PROPOSED
Clearlake Road (State Road 501) Project Development & Environment (PD&E) Study
 Project Development & Environment (PD&E) Study") Clearlake Road (State Road 501) Project Development & Environment (PD&E) Study FROM MICHIGAN AVENUE TO INDUSTRY ROAD BREVARD COUNTY, FLORIDA Financial Project ID No: 433605-1-22-01 Federal Aid Project
Clearlake Road (State Road 501) Project Development & Environment (PD&E) Study FROM MICHIGAN AVENUE TO INDUSTRY ROAD BREVARD COUNTY, FLORIDA Financial Project ID No: 433605-1-22-01 Federal Aid Project
PAPER FOR AREMA 2006 ANNUAL CONFERENCE LOS ANGELES UNION STATION RUN-THROUGH TRACKS UNION STATION TERMINAL IMPROVEMENTS. Paul Mak, PE, SE HDR Inc
 PAPER FOR AREMA 2006 ANNUAL CONFERENCE LOS ANGELES UNION STATION RUN-THROUGH TRACKS UNION STATION TERMINAL IMPROVEMENTS Paul Mak, PE, SE HDR Inc 801 S. Grand Ave. Suite 500, Los Angeles, CA 90017. Tel
TRAFFIC IMPACT ANALYSIS
 TRAFFIC IMPACT ANALYSIS Emerald Isle Commercial Development Prepared by SEPI Engineering & Construction Prepared for Ark Consulting Group, PLLC March 2016 I. Executive Summary A. Site Location The Emerald
Submission to Greater Cambridge City Deal
 What Transport for Cambridge? 2 1 Submission to Greater Cambridge City Deal By Professor Marcial Echenique OBE ScD RIBA RTPI and Jonathan Barker Introduction Cambridge Futures was founded in 1997 as a
Transit City Etobicoke - Finch West LRT
 Delcan Corporation Transit City Etobicoke - Finch West LRT APPENDIX D Microsimulation Traffic Modeling Report March 2010 March 2010 Appendix D CONTENTS 1.0 STUDY CONTEXT... 2 Figure 1 Study Limits... 2
Transportation & Traffic Engineering
 Transportation & Traffic Engineering 1) Project Description This report presents a summary of findings for a Traffic Impact Analysis (TIA) performed by A+ Engineering, Inc. for the Hill Country Family
Sepulveda Pass Corridor Systems Planning Study
 Los Angeles County Metropolitan Transportation Authority Sepulveda Pass Corridor Systems Planning Study Streets and Freeways Subcommittee January 17, 2013 1 Sepulveda Pass Study Corridor Extends for 30
5. OPPORTUNITIES AND NEXT STEPS
 5. OPPORTUNITIES AND NEXT STEPS When the METRO Green Line LRT begins operating in mid-2014, a strong emphasis will be placed on providing frequent connecting bus service with Green Line trains. Bus hours
Scope of Services January 26, Project Development and Conceptual Engineering for City of Lake Forest Amtrak Station
 203 North LaSalle Street, Suite 2100 Chicago, IL 60601 (312) 558-1345 Fax: (312) 346-9603 E-Mail: cquandel@quandelconsultants.com www.quandel.com Scope of Services January 26, 2010 Project Development
Parks and Transportation System Development Charge Methodology
 City of Sandy Parks and Transportation System Development Charge Methodology March, 2016 Background In order to implement a City Council goal the City of Sandy engaged FCS Group in January of 2015 to update
Green Line Long-Term Investments
 Enhancements Short-term improvements to keep Austin moving. Investments Long-term projects to support our future. Mobility Hubs MetroRapid MetroRail MetroExpress Connectors Circulators Project Connect
Southern California - CHSRA
 CALIFORNIA HIGH-SPEED RAIL Michael Gillam, Deputy Program Director Southern California - CHSRA CMAA - Construction Management Association of America July 19, 2012 CALIFORNIA S HIGH-SPEED TRAIN SYSTEM Largest
MINERVA PARK SITE TRAFFIC IMPACT STUDY M/I HOMES. September 2, 2015
 5500 New Albany Road Columbus, Ohio 43054 Phone: 614.775.4500 Fax: 614.775.4800 Toll Free: 1-888-775-EMHT emht.com 2015-1008 MINERVA PARK SITE TRAFFIC IMPACT STUDY M/I HOMES September 2, 2015 Engineers
Public Information Workshop
 Public Information Workshop Charlotte County-Punta Gorda MPO - Meeting Rooms A and B March 29, 2018 Welcome to the Public Information Workshop for Harborview Road Project Development and Environment (PD&E)
Challenges in a Post-Katrina Environment East-West Corridor Project Overview February, 2007
 EAST-WEST CORRIDOR Challenges in a Post-Katrina Environment East-West Corridor Project Overview February, 2007 Presentation Agenda Project Overview / Purpose and Need Highway Component Transit Component
Construction Management Association of America (CMAA) Thursday, August 18, 2011 Frank Quon, PE Lan Saadatnejadi, PE
 Thursday, August 18, 2011 Frank Quon, PE Lan Saadatnejadi, PE") Metro s Highway Program Construction Management Association of America (CMAA) Thursday, August 18, 2011 Frank Quon, PE Lan Saadatnejadi, PE Los Angeles County Sources: Metro 2009 Long Range Transportation
Metro s Highway Program Construction Management Association of America (CMAA) Thursday, August 18, 2011 Frank Quon, PE Lan Saadatnejadi, PE Los Angeles County Sources: Metro 2009 Long Range Transportation
3.17 Energy Resources
 3.17 Energy Resources 3.17.1 Introduction This section characterizes energy resources, usage associated with the proposed Expo Phase 2 project, and the net energy demand associated with changes to the
APPENDIX J LAKE WOHLFORD DAM REPLACEMENT PROJECT TRAFFIC IMPACT ANALYSIS (DAM REPLACEMENT) Lake Wohlford Dam Replacement Project EIR
 Lake Wohlford Dam Replacement Project EIR") APPENDIX J LAKE WOHLFORD DAM REPLACEMENT PROJECT TRAFFIC IMPACT ANALYSIS (DAM REPLACEMENT) Replacement Project EIR Appendices TRAFFIC IMPACT ANALYSIS LAKE WOHLFORD DAM Escondido, California December 19,
APPENDIX J LAKE WOHLFORD DAM REPLACEMENT PROJECT TRAFFIC IMPACT ANALYSIS (DAM REPLACEMENT) Replacement Project EIR Appendices TRAFFIC IMPACT ANALYSIS LAKE WOHLFORD DAM Escondido, California December 19,
CITY OF LONDON STRATEGIC MULTI-YEAR BUDGET ADDITIONAL INVESTMENTS BUSINESS CASE # 6
 2016 2019 CITY OF LONDON STRATEGIC MULTI-YEAR BUDGET ADDITIONAL INVESTMENTS BUSINESS CASE # 6 STRATEGIC AREA OF FOCUS: SUB-PRIORITY: STRATEGY: INITIATIVE: INITIATIVE LEAD(S): BUILDING A SUSTAINABLE CITY
Attachment F Transportation Technical Memorandum
 Attachment F Transportation Technical Memorandum Sounder Yard and Shops Facility Project Transportation Technical Memorandum March 25, 216 Prepared for: Sound Transit Prepared by: Parsons Brinckerhoff
MPO Staff Report Technical Advisory Committee: July 12, 2017
 MPO Staff Report Technical Advisory Committee: July 12, 2017 RECOMMENDED ACTION: 2 nd TAC Meeting with Kimley-Horn/WSB in Updating the Street/Highway Element of 2045 Metropolitan Transportation Plan. Matter
Town of Londonderry, New Hampshire NH Route 28 Western Segment Traffic Impact Fee Methodology
 Town of Londonderry, New Hampshire NH Route 28 Western Segment Traffic Impact Fee Methodology Prepared by the Londonderry Community Development Department Planning & Economic Development Division Based
City of Marina. Regional Roundabout Study Utilizing Caltrans Intersection Control Evaluation Section 4: Transportation Agency for Monterey County
 Regional Roundabout Study Utilizing Caltrans Intersection Control Evaluation Section 4: City of Marina Study Intersections: RESERVATION ROAD AT BEACH ROAD RESERVATION ROAD AT DEFOREST ROAD CARDOZA AVENUE