AIR QUALITY ROUTE 29 BYPASS PROJECT TECHNICAL REPORT STATE PROJECT: , P101; UPC Prepared for: From: Route 250 Bypass
|
|
|
- Willis McLaughlin
- 6 years ago
- Views:
Transcription


1 V I R G I N I A D E P A R T M E N T O F T R A N S P O R T A T I O N ROUTE 29 BYPASS PROJECT STATE PROJECT: , P101; UPC F I N A L AIR QUALITY TECHNICAL REPORT From: Route 250 Bypass To: U.S. Route 29 North of South Fork Rivanna River Albemarle County and City of Charlottesville, Virginia Prepared for: Virginia Department of Transportation Environmental Division 1401 East Broad Street Richmond, VA A U G U S T
2 Virginia Department of Transportation Route 29 Bypass Project State Project Number: , P101; UPC# From: Route 250 Bypass To: U.S. Route 29 North of South Fork Rivanna River Albemarle County and the City of Charlottesville FINAL - AIR QUALITY TECHNICAL REPORT Virginia Department of Transportation Environmental Division 1401 East Broad Street Richmond, Virginia August 2012
3 Table of Contents I. Introduction... 1 II. Project Description / Alternatives... 1 Figure 1 Regional Location Map... 3 III. Existing Conditions... 4 IV. Regulations / Criteria... 4 Table 1 National Ambient Air Quality Standards... 6 Table 2 Route 29 Bypass ADT Summary... 8 V. Carbon Monoxide Analysis... 9 Table 3 Inputs to MOBILE Table 4 CAL3QHC Worst-Case Inputs Table 5 MOBILE6.2 Output - Summary of CO Emission Rates Figure 2-8 Project Location Map Route 29 Bypass Project Figure 9 Hydraulic Road & Route Figure 10 Rio Road & Route Table 6 Carbon Monoxide Analysis Route 29 Bypass Corridor Table 7 Carbon Monoxide Analysis Signalized Intersection Summary VI. Fine Particulate Matter Analysis VII. Mobile Source Air Toxics (MSAT) Figure 11 National MSAT Emission Trends for Vehicles Operating on Roadways Using EPA s MOBILE6.2 Model VIII. Potential Greenhouse Gas Impacts IX. Construction Impacts X. Conformity Status of the Project XI. Conclusion Appendices Appendix A Mobile Input / Output Files Appendix B CAL3QHC Input / Output Files Appendix C Traffic Summary / SYNCHRO Reports Appendix D List of Assumptions Appendix E References Appendix F List of Preparers / Reviewers
4 I. Introduction Air quality became a national concern in the 1960s, leading to the passage of the Clean Air Act of This was followed by the Air Quality Act of 1967, the Clean Air Act of 1970, the Clean Air Act Amendments of 1977, and the Clean Air Act Amendments of With the passage of each piece of legislation, requirements for addressing and controlling air pollution became more stringent as prior legislation failed to achieve its intended purpose. Following the passage of the Federal Clean Air Act Amendments of 1990, states were mandated to implement additional steps to reduce airborne pollutants and improve local and regional conditions. Automobile emissions have been identified as a critical element in attaining federal air quality standards for carbon monoxide (CO), particulate matter (PM), and ozone (O 3 ). As a result of federal funding for this project, compliance is required with both the National Environmental Policy Act (NEPA) and the Clean Air Act. Highway agencies are required to consider the impacts of transportation improvement projects on both the local and regional level. Regional air quality, when located in ozone nonattainment and maintenance areas, is assessed by ensuring that region wide volatile organic compounds (VOC) and nitrogen oxide (NOx) emissions fall below the established motor vehicle emission budgets identified by the State Implementation Plan (SIP). When applicable, this assessment is performed by the Virginia Department of Transportation (VDOT) and / or Metropolitan Planning Organizations (MPOs) and documented in the Transportation Improvement Program (TIP) and Long Range Transportation Plan (LRTP). The project lies within an area designated as attainment for all criteria pollutants; therefore, the project is exempt from regional and project-level conformity requirements. Generally, local air quality is assessed on a micro-scale by evaluating CO concentrations at the project level. CO is a colorless, odorless, poisonous gas considered to be a serious threat to those who suffer from cardiovascular disease. High concentrations of CO tend to occur in areas of high traffic volumes or areas adjacent to a stationary source of the pollutant. CO emissions are associated with the incomplete combustion of fossil fuels in motor vehicles and are considered to be a good indicator of vehicle-induced air pollution. II. Project Description / Alternatives Project Study Area The Virginia Department of Transportation (VDOT), in cooperation with the Federal Highway Administration (FHWA), is studying potential environmental impacts as a result of a new four-lane divided, limited access bypass to the west of existing Route 29 in Albemarle County, Virginia. The proposed project is the product of many years of study and discussion with citizens and local officials. Among the studies conducted were Draft and Final Environmental Impact Statements documenting a major corridor study, Draft and Final Environmental Assessments documenting changes to the project termini, a Reevaluation to discuss changes to the project and their environmental consequences, and a Section 4(f) Evaluation to discuss new information received on Albemarle County school properties. A Supplemental Environmental Impact Statement (SEIS) was prepared to consider more fully the effects of the Selected Alternative on the South Fork Route 29 Bypass Project Final Air Quality Technical Report 1 Albemarle County and the City of Charlottesville, VA
5 Rivanna River Reservoir and its watershed and the effects of the project's northern terminus on archaeological resources. Due to recent actions to provide funding to advance the project for construction, another reevaluation is needed to address any changes to the project and any new information or circumstances relevant to environmental concerns and bearing on the proposed project and its impacts (e.g., changes to the affected environment and changes to applicable laws and regulations since completion of previous NEPA documents). Figure 1 shows the location of the project. The study area consists of lands surrounding the proposed project elements on which there are human activities that could potentially be affected by the project. In addition, the study also includes an assessment of air quality conditions along the existing U.S. 29 corridor at the two worst-case signalized intersections in the vicinity of the project area and the potential benefits in air quality as a result of the proposed improvements. ALTERNATIVES: No-Build Alternative Under the No-Build Alternative, it is assumed that all projects other than the proposed bypass that are funded for construction in the financially constrained long-range transportation plan (CLRP) would be in place by the design year Using this analysis approach and methodology, we are able to isolate the impact on traffic from the proposed project. UnJAM2035, the region's current CLRP, was adopted by the Charlottesville-Albemarle Metropolitan Planning Organization (MPO) Policy Board in May 2009 and amended in July By programming funds for construction on projects in the CLRP, the state and localities have demonstrated a commitment to implement those improvements. Note that the No-Build Alternative presented in this EA differs from the No-Build Alternative evaluated in the 1993 FEIS and 2003 SEIS as it includes projects programmed for construction in the current CLRP that may not have been identified in previous versions. Relevant roadway projects are the Berkmar Drive Extension, the Hillsdale Drive Extension, widening of Route 29 north of the proposed northern terminus of the Route 29 Bypass, improvements to Georgetown Road, a grade-separated interchange at Rio Road and Route 29, and interchange improvements at the Route 29/250 interchange. Also, the design year was 2010 for the 1993 FEIS and 2022 for the 2003 SEIS. Proposed Build Alternative The proposed project would provide a new four-lane divided, limited access bypass to the west of existing Route 29 in Albemarle County and the City of Charlottesville. Extending approximately 6.24 miles long, the project limits are from the Route 250 Bypass and the North Grounds of the University of Virginia on the south end to existing Route 29 north of the South Fork Rivanna River on the north end. A connector road into the North Grounds of the University of Virginia, located on the south side of the Route 250 Bypass, which was part of the project has already been constructed (Leonard Sandridge Road). Route 29 Bypass Project Final Air Quality Technical Report 2 Albemarle County and the City of Charlottesville, VA
6 Shenandoah National Park Greene County Orange County Albemarle County Charlottesville Fluvanna County MT HB 7/17/ :38:54 AM Figure 1 Regional Location Map Charlottesville Bypass Project Albemarle County and City of Charlottesville, Virginia Mile Route 29 Bypass Project Final Air Quality Technical Report 3 Albemarle County and the City of Charlottesville, VA
7 Access to the new highway would be via interchanges at both ends, with no intermediate access points to crossroads or adjacent properties. The typical cross section would include 12-foot-wide lanes, with shoulders and a variable-width graded median. The proposed improvements can be referenced in Figure 2 through Figure 8. III. Existing Conditions The proposed project is located in central Virginia in Albemarle County and within the City of Charlottesville. The area is best categorized as a humid subtropical climate that averages approximately 49 inches of precipitation per year, with May through September being the wettest. Winters are somewhat cool while the summers are typically hot and humid. Traffic Summary Information Traffic forecasts were developed for the project for Existing (2011), Interim/Opening Year No-Build (2015), Interim/Opening Year Build (2015), Design Year No-Build (2040), and Design Year Build (2040) conditions for the project locations. The traffic volumes used in the CO analysis are based on the preliminary AM and PM peak traffic volume projections used by the Project Team for the traffic analysis and were derived from the VDOT ENTRADA system. IV. Regulations / Criteria Under the National Environmental Policy Act (NEPA), federal agencies must consider environmental factors in the decision making process. Changes in air quality, and the effects of such changes on human health and welfare, are among the factors to be considered. A project level air quality analysis has been performed to assess the air quality impacts of the project, document the findings of the analysis, and make the findings available for review by the public and decisionmakers. The findings of the analysis, as presented in this report, are summarized in the NEPA documentation. As implemented by the Clean Air Act, the EPA is required to set the National Ambient Air Quality Standards (NAAQS) for pollutants considered harmful to public health and welfare. As shown in Table 1, there are currently two standards: Primary Standards to protect public health and Secondary Standards to protect the public welfare (e.g., to protect against damage to crops, vegetation, buildings and animals). Federal actions must not cause or contribute to any new violation of any standard, increase the frequency or severity of any existing violation, or delay timely attainment of any standard or required interim milestone. Geographic regions that do not meet NAAQS for one or more criteria pollutants are designated by EPA as nonattainment areas. Areas previously designated as nonattainment, but subsequently re-designated attainment because they no longer violate NAAQS, are designated as maintenance areas subject to maintenance plans to be developed and included in a state s SIP. However, this project is located in Albemarle County which is currently designated as attainment for the 8-hour ozone and fine Route 29 Bypass Project Final Air Quality Technical Report 4 Albemarle County and the City of Charlottesville, VA
8 particulate matter (PM 2.5 ). As a result of this attainment designation, the project is exempt from all regional and project-level conformity requirements. The federal conformity rule (40 CFR Parts 51 and 93) requires air quality conformity determinations for transportation plans, programs, and projects in non-attainment or maintenance areas for transportation-related criteria pollutants for which the area is designated nonattainment or has a maintenance plan (40 CFR (b)). Transportation-related criteria pollutants, as specified in the conformity rule, include ozone (O 3 ), carbon monoxide (CO), nitrogen dioxide (NO 2 ), and particulate matter less than 10 and 2.5 microns in diameter (PM 10 and PM 2.5, respectively). Regional conformity analysis requirements apply for plans and programs; hot-spot analysis requirements of 40 CFR and apply for projects. Modeling protocols for quantitative hot-spot analyses are to comply with the standards outlined in 40 CFR 51, Appendix W, Guideline on Air Quality Models, and guidelines in EPA s Guideline for Modeling Carbon Monoxide from Roadway Intersections (EPA-454/R ). EPA and FHWA issued joint guidance for conducting hot-spot analyses for particulate matter: Transportation Conformity Guidance for Qualitative Hot-Spot Analyses in PM 2.5 and PM 10 Nonattainment and Maintenance Areas (March 2006) commonly referred to as the Final Rule. While the project is not subject to the guidance because it is located in a PM 2.5 and PM 10 attainment area, the project was subjected to the guidance and is not considered a project of air quality concern. A detailed discussion can be found in Section VI of this report. As indicated in the Consultant Guide, on February 27, 2009, FHWA and VDOT completed the updated Memorandum of Understanding (MOU) addressing requirements on when a quantitative or qualitative CO hot-spot analysis is required. Under this revised agreement (original agreement was August 4, 2004) project-level air quality (hot-spot) analyses are conducted for CO for projects that meet traffic and related criteria as specified in the revised agreement. As shown in Table 2, Average Annual Daily Traffic (AADT) volumes do not exceed 59,000 AADT at the northern interchange area as well as signalized intersections along existing U.S. 29. The proposed Route 29 Bypass will carry approximately 27,800 AADT under a future 2040 Build condition. However, traffic volumes do exceed 59,000 in the vicinity of the southern interchange area, primarily along the Route 250 Bypass. As such, since 2040 AADT do exceed the threshold identified by the MOU, a quantitative CO analysis was performed for the entire project corridor for inclusion in the air study. On September 30, 2009, FHWA issued updated guidance titled Interim Guidance Update on Mobile Source Air Toxic Analysis in NEPA Documents. The guidance included specific criteria for determining which projects are to be considered exempt from mobile source air toxics (MSAT) analysis requirements and which may require a qualitative or quantitative analysis. Projects considered exempt under section 40 CFR of the federal conformity rule are also specifically designated as exempt from MSAT analysis requirements. This project does not create new capacity or add significant capacity to urban highways such as interstates, urban arterials, or urban collector-distributor routes with forecasted design year average annual daily traffic volumes in the range of 140,000 Route 29 Bypass Project Final Air Quality Technical Report 5 Albemarle County and the City of Charlottesville, VA
9 Table 1 National Ambient Air Quality Standards Primary Standards Secondary Standards Pollutant Level Averaging Time Level Averaging Time Carbon Monoxide Lead Nitrogen Dioxide Particulate Matter (PM 10 ) Particulate Matter (PM 2.5 ) Ozone Sulfur Dioxide 9 ppm (10 mg/m 3 ) 8-hour (1) None 35 ppm 1-hour (1) (40 mg/m 3 ) 0.15 µg/m 3 (2) Rolling 3-Month Same as Primary Average 1.5 µg/m 3 Quarterly Average Same as Primary ppm (100 µg/m 3 ) Annual (Arithmetic Mean) Same as Primary 150 µg/m 3 24-hour (3) Same as Primary 15.0 µg/m 3 Annual (4) (Arithmetic Mean) Same as Primary 35 µg/m 3 24-hour (5) Same as Primary ppm (2008 std) 8-hour (6) Same as Primary 0.08 ppm (1997 std) 8-hour (7) Same as Primary 0.12 ppm 1-hour (8) Same as Primary 0.03 ppm Annual 3-hour (1) (Arithmetic Mean) 0.14 ppm 24-hour (1) 0.5 ppm (1300 µg/m 3 ) (1) Not to be exceeded more than once per year. (2) Final rule signed October 15, (3) Not to be exceeded more than once per year on average over 3 years. (4) To attain this standard, the 3-year average of the weighted annual mean PM2.5 concentrations from single or multiple community-oriented monitors must not exceed 15.0 µg/m3. (5) To attain this standard, the 3-year average of the 98th percentile of 24-hour concentrations at each population-oriented monitor within an area must not exceed 35 µg/m3 (effective December 17, 2006). (6) To attain this standard, the 3-year average of the fourth-highest daily maximum 8-hour average ozone concentrations measured at each monitor within an area over each year must not exceed ppm. (effective May 27, 2008) (7) (a) To attain this standard, the 3-year average of the fourth-highest daily maximum 8- hour average ozone concentrations measured at each monitor within an area over each year must not exceed 0.08 ppm. (b) The 1997 standard and the implementation rules for that standard will remain in place for implementation purposes as EPA undertakes rulemaking to address the transition from the 1997 ozone standard to the 2008 ozone standard. (8) (a) The standard is attained when the expected number of days per calendar year with maximum hourly average concentrations above 0.12 ppm is < 1. (b) As of June 15, 2005 EPA has revoked the 1-hour ozone standard in all areas except the fourteen 8-hour ozone nonattainment Early Action Compact (EAC) Areas. For one of the 14 EAC areas (Denver, CO), the 1-hour standard was revoked on November 20, For the other 13 EAC areas, the 1-hour standard was revoked on April 15, Source: Table and footnotes above are excerpted from US Environmental Protection Agency website: Route 29 Bypass Project Final Air Quality Technical Report 6 Albemarle County and the City of Charlottesville, VA
10 to 150,000 or greater, and which is also in proximity to populated areas. As stipulated in the guidance, since the project does not meet the traffic criteria described above and is not considered exempt, it is best characterized as a project with low potential MSAT effects. As such, the project will include a qualitative assessment of MSAT to evaluate the anticipated changes in MSAT emissions between the No-Build and Build conditions, and also to compare anticipated future MSAT emissions to baseline conditions. Additionally, the updated guidance reflects recent regulatory changes, projects national MSAT emission trends out to 2050, and summarizes recent research efforts; however, it does not change any project analysis thresholds, recommendations, or guidelines. VDOT s May 2009 Consultant Guide, Air Quality Project-Level Analysis, Revision 18, provides guidelines and standards for conducting air quality analyses for transportation projects in Virginia. The guide complies with and supplements FHWA and EPA regulations and guidelines. The air quality analyses presented in this report are consistent with the guide. In 2009, the EPA released a new model called the Motor Vehicle Emissions Simulator (MOVES). This model will replace MOBILE6.2 for estimating on-road motor vehicle emissions. In March of 2010 the EPA published a Federal Register Notice of Availability that approved MOVES2010 as the EPA s tool for estimating emissions of volatile organic compounds (VOCs), nitrogen oxide (NOx), CO, PM 10, PM 2.5 and other pollutants. On February 27, 2012, EPA took final action to extend the original two-year grace period to March 2, 2013 before MOVES2010 is required for use in transportation conformity analysis. Again, the region is not subject to transportation conformity requirements. In August of 2010, EPA approved an updated version of the MOVES model (MOVES2010a) for official use. It incorporated new car and light truck greenhouse gas emission standards that were published May 2, 2010 as well as a number of other minor improvements. On December 20, 2010, EPA published a Federal Register Notice of Availability that officially announced a new EPA guidance document for completing project-level carbon monoxide analyses using MOVES. This notice also announced a two-year grace period before MOVES2010a is required to be used in quantitative CO and PM hot-spot analyses for project-level conformity determinations outside California. More recently, the latest version of MOVES, MOVES2010b, was released in April 2012 and provides more flexibility for varying inputs with increased functionality of the software. MOVES2010b does not significantly affect the criteria pollutant emissions results when compared to MOVES2010 or MOVES2010a, and is therefore not considered a new model that would restart a new two-year grace period. On December 20, 2010, EPA also released (as part of the same announcement) final guidance for conducting quantitative hot-spot analyses in PM 2.5 and PM 10 nonattainment and maintenance areas titled, Transportation Conformity Guidance for Quantitative Hotspot Analyses in PM 2.5 and PM 10 Nonattainment and Maintenance Areas, EPA-420-B Starting December 20, 2012, the new guidance must be used by state and local agencies to conduct quantitative PM hot-spot analyses for new or expanded highway or Route 29 Bypass Project Final Air Quality Technical Report 7 Albemarle County and the City of Charlottesville, VA
11 Table 2 - Route 29 Bypass - Average Daily Traffic (ADT) Summary Route 29 Bypass Corridor Segment Link Description 2011 Existing 2015 No-Build 2015 Build 2040 No-Build 2040 Build ADT % Trucks ADT % Trucks ADT % Trucks ADT % Trucks ADT % Trucks 67 Route 250 Bypass WB (btwn Hydraulic Rd & Emmet St) 11, % 12, , % 16, , Route 250 Bypass EB (btwn Hydraulic Rd & Emmet St) 11, % 12, , % 16, , Route 250 Bypass WB (btwn Emmet St & Barracks Rd) 19, % 20, , % 29, , Route 250 Bypass EB (btwn Emmet St & Barracks Rd) 19, % 20, , % 29, , L. Sandbridge Rd NB, south of % % 1, % 3, % 3, % 78 L. Sandbridge Rd SB, south of % % 1, % 3, % 3, % 109 Route 250 Bypass WB (btwn Barracks Rd & Prop Route 29 Bypass) 24, % 25, % 17, % 35, % 26, % 110 Route 250 Bypass EB (btwn Bararcks Rd & Prop Route 29 Bypass) 24, % 25, % 17, % 35, % 26, % NB south of the Bypass (between Fontaine and Ivy) 21, % 23, % 24, % 33, % 34, % SB south of the Bypass (between Fontaine and Ivy) 21, % 23, % 24, % 33, % 34, % 113 Ivy Rd EB (btwn Rt 250 Bypass & Alderman Rd) 8, % 7, % 7, % 6, % 5, % 114 Ivy Rd WB (btwn Rt 250 Bypass & Alderman Rd) 8, % 7, % 7, % 6, % 5, % 115 Ivy Rd WB (btwn Rt 846 & Golf Course Dr) 7, % 7, % 7, % 10, % 10, % 116 Ivy Rd EB (btwn Rt 846 & Golf Course Dr) 7, % 7, % 7, % 10, % 10, % 117 Old Ivy Rd EB (btwn Crestwood Rd & Harvest Dr) 2, % 2, % 2, % 2, % 2, % 118 Old Ivy Rd WB (btwn Crestwood Rd & Harvest Dr) 2, % 2, % 2, % 2, % 2, % 119 Proposed Bypass NB (South Terminus to North Terminus) 8, % 13, % 120 Proposed Bypass SB (North Terminus to South Terminus) 8, % 13, % 152 AB-AC: Off-Ramp from 29 NB to L. Sandridge Rd (diamond) % % 163 AB-AJ: 29 NB to Proposed Bypass NB (flyover) 8, % 10, % 153 AC-AD: On-Ramp from L. Sandridge Rd to 250 NB (diamond) % 1, % 154 AA-AD: 250 Bypass NB (thru lanes) from 29 NB Bypass diverge to On-Ramp from L. Sandridge Rd 16, % 24, % 157 AE-AH: 250 Bypass SB (thru lanes) from Off-Ramp to L. Sandridge Rd to 29 SB Bypass merge 16, % 23, % 158 AH-AG: 250 Bypass SB (thru lanes) from 29 SB Bypass merge to On-Ramp from L. Sandridge Rd 24, % 34, % 155 AE-AF: Off-Ramp from 250 SB to L. Sandridge Rd (diamond) % 3, % 156 AF-AG: On-Ramp from L. Sandridge Rd to 29 SB (diamond) % 1, % 164 AI-AH: Proposed Bypass SB to 29 SB (flyover) 8, % 11, % 151 AA-AB: 250 NB to Split 8, % 10, % 159 AC-AF: L. Sandridge Rd NB, between Ramps 1, % 3, % 160 AF-AC: L. Sandridge Rd SB, between Ramps % 4, % 161 AF-AJ: L. Sandridge Rd NB ramp to Proposed Bypass NB % 3, % 162 AI-AF: Proposed Bypass SB ramp to L. Sandridge Rd SB % 2, % 109 Route 250 SB/WB Mainline (btwn Ivy Rd & Barracks Rd) - Ex & NB 24, % 25, % 35, % 151 Route 250 SB/WB Mainline (btwn Ivy Rd & 29 Bypass) - Build 25, % 35, % 110 Route 250 NB/EB Mainline (btwn Ivy Rd & L. Sandridge Rd) - Ex & NB 24, % 25, % 35, % 110 Route 250 NB/EB Mainline (btwn L. Sandridge Rd & Barracks Rd) - Ex & NB 24, % 25, % 35, % 158 Route 250 NB/EB Mainline (btwn Ivy Rd & 29 Bypass) - Build 25, % 35, % 191 Route 250 SB Off-Ramp (loop) to Ivy Rd 6, % 6, % 5, % 6, % 6, % 192 Route 250 SB On-Ramp from Ivy Rd 3, % 3, % 4, % 5, % 5, % 193 Route 250 NB Off-Ramp to Ivy Rd 3, % 3, % 4, % 5, % 5, % 194 Route 250 NB On-Ramp (loop) from Ivy Rd 6, % 6, % 5, % 6, % 6, % 119 Proposed Bypass NB (South Terminus to North Terminus) 8, % 13, % 120 Proposed Bypass SB (North Terminus to South Terminus) 8, % 13, % 136 Ramp 136: Prop Bypass NB to US 29 SB % 4, % 135 Ramp 135: Prop Bypass NB to US 29 NB 7, % 9, % 133 Ramp 133: US 29 SB to Prop Bypass SB 7, % 9, % 134 Ramp 134: US 29 NB to Prop Bypass SB (left-exit ramp) 1, % 4, % 2 29 NB, north of Prop Bypass (south of Hollymead) 24, % 25, % 29, % 33, % 37, % 1 29 SB, north of Prop Bypass (south of Hollymead) 24, % 25, % 29, % 33, % 37, % 3 29 Seminole Tr: Polo Grounds Rd to Prop. Bypass (NB) 24, % 26, % 22, % 36, % 32, % 4 29 Seminole Tr: Polo Grounds Rd to Prop. Bypass (SB) 24, % 26, % 22, % 36, % 32, % Seminole Tr between ramps (NB) 8, % 13, % Seminole Tr between ramps (SB) 21, % 28, % Existing Route /250: Prop Bypass to Barracks Road (SB) 24, % 25, % 17, % 35, % 26, % 70 29/250: Barracks Road to Emmet Street (NB) 19, % 20, % 13, % 29, % 20, % 69 29/250: Barracks Road to Emmet Street (SB) 19, % 20, % 13, % 29, % 20, % Seminole Tr: US 250 to Angus Rd (NB) 26, % 28, % 18, % 42, % 32, % Seminole Tr: US 250 to Angus Rd (SB) 26, % 28, % 18, % 42, % 32, % Seminole Tr: Angus Rd to Hydraulic Rd (NB) 26, % 28, % 18, % 41, % 31, % Seminole Tr: Angus Rd to Hydraulic Rd (SB) 26, % 28, % 18, % 41, % 31, % Seminole Tr: Hydraulic Rd to Greenbrier Dr (NB) 28, % 30, % 22, % 41, % 33, % Seminole Tr: Hydraulic Rd to Greenbrier Dr (SB) 28, % 30, % 22, % 41, % 33, % Seminole Tr: Greenbrier Dr to Dominion Dr (NB) 28, % 30, % 20, % 42, % 31, % Seminole Tr: Greenbrier Dr to Dominion Dr (SB) 28, % 30, % 20, % 42, % 31, % Seminole Tr: Dominion Dr to Berkmar Dr (NB) 28, % 30, % 19, % 40, % 29, % Seminole Tr: Dominion Dr to Berkmar Dr (SB) 28, % 30, % 19, % 40, % 29, % Seminole Tr: Berkmar Dr to Rio Rd (NB) 24, % 25, % 18, % 32, % 25, % Seminole Tr: Berkmar Dr to Rio Rd (SB) 24, % 25, % 18, % 32, % 25, % 9 29 Seminole Tr: Rio Rd to Woodbrook Dr (NB) 24, % 26, % 20, % 40, % 34, % Seminole Tr: Rio Rd to Woodbrook Dr (SB) 24, % 26, % 20, % 40, % 34, % 7 29 Seminole Tr: Woodbrook to Carrsbrook/Hilton Hghts (NB) 24, % 26, % 20, % 38, % 32, % 8 29 Seminole Tr: Woodbrook to Carrsbrook/Hilton Hghts (SB) 24, % 26, % 20, % 38, % 32, % 5 29 Seminole Tr: Carrsbrook/Hilton Hghts to Polo Grounds (NB) 24, % 26, % 20, % 37, % 31, % 6 29 Seminole Tr: Carrsbrook/Hilton Hghts to Polo Grounds (SB) 24, % 26, % 20, % 37, % 31, % 3 29 Seminole Tr: Polo Grounds Rd to Prop. Bypass (NB) 24, % 26, % 22, % 36, % 32, % 4 29 Seminole Tr: Polo Grounds Rd to Prop. Bypass (SB) 24, % 26, % 22, % 36, % 32, % Route 29 Bypass Project Final Air Quality Technical Report 8 Albemarle County and the City of Charlottesville, VA
12 transit projects with significant levels of diesel traffic that are located in PM 2.5 and PM 10 nonattainment and maintenance areas. However, it was determined that this project is not considered to be a project of air quality concern and as such, is exempt from a hotspot analysis and has met all requirements of the March 2006 Final Rule. Addition documentation can be referenced in Section VI of this report. Transportation Conformity Rule EPA promulgated the Transportation Conformity Rule concerning the applicability, procedures, and criteria that transportation agencies must use in analyzing and determining conformity of transportation projects. The Transportation Conformity Rule applies to federally-funded transportation projects in certain areas that have violated one or more of the NAAQS (non-attainment/maintenance areas). As discussed previously, this project is located in an area designated as attainment for the 8-hour ozone standard as well as for PM 2.5. As such, the project is considered exempt from a regional and projectlevel conformity analysis and has met all conformity requirements as outlined by the Clean Air Act Amendments. The appropriate documentation can be referenced in Chapter XI of this report. V. Carbon Monoxide Analysis The purpose of this study is to identify worst-case carbon monoxide (CO) concentrations throughout the project corridor, as well as along existing Route 29 in order to determine if air quality exceedences would occur as a result of the proposed improvements. CO is a stable gas that disperses in predictable ways in the atmosphere. Therefore, computer modeling can be used to assess both existing and expected future atmospheric concentrations of CO at selected receptor sites. The modeling inputs and procedures were developed in accordance with EPA s Guideline for Modeling Carbon Monoxide from Roadway Intersections and VDOT s May 2009 Consultant Guide, Air Quality Project-Level Analysis, Revision 18. The air quality modeling approach includes the use of two computer programs. Based on traffic data and historic climatic data, CO emissions are calculated using the EPA MOBILE6.2 computer model. In order to streamline this approach, FHWA s EMIT model is used to calculate CO emission rates at varying speeds for each analysis year. The projected worst-case CO emission rates are then applied to the CAL3QHC computer model. This program is used to determine dispersion of CO from highway sources to air quality sensitive receptors by representing the geometric relationship between roadways and receptor sites. Factors taken into account in this model include pollutant source strength, wind speed, wind angle, atmospheric stability, roadway length and width, surface roughness, vehicle volume, emission factor, and background CO concentrations. This program is fully documented in the User s Guide to CAL3QHC, Version 2.0 (EPA- 454/R ), September After modeling Existing (2011), Interim/Opening Year No-Build (2015), Interim/Opening Year Build (2015), Design Year No-Build (2040), and Design Year Build (2040) CO concentrations, these levels are then compared to the NAAQS for CO. Route 29 Bypass Project Final Air Quality Technical Report 9 Albemarle County and the City of Charlottesville, VA
13 These standards are 35 ppm and 9 ppm for the second highest one-hour and eight-hour periods, respectively (shown in Table 1). These standards have been designed and adapted in an effort to protect public health and welfare. The air quality models were designed to replicate traffic operations associated with the existing and future conditions. All intersection areas were modeled under existing and future traffic conditions. As stipulated by EPA s Guideline for Modeling Carbon Monoxide from Roadway Intersections, each receptor represents an area where the public would have continuous access to the immediate vicinity. The greatest concentrations of CO tend to occur in the winter months, when automobiles experience incomplete combustion of fuel, due to low temperatures. For this reason all modeling was performed to represent wintertime (January) conditions. As specified in VDOT s Consultant Guide, input will include the most recent local vehicle registration data (2011), fuel quality (sulfur and Reid Vapor Pressure), and other applicable data. The average January minimum temperature will be used as specified in the guidance. Other applicable data will be kept at EPA defaults where appropriate and will represent worst-case modeling assumptions. The modeling inputs used for MOBILE6.2 and CAL3QHC are summarized in Table 3 and Table 4. Additionally, Table 5 summarizes the worst-case CO emission rates that were used for each analysis year to predict worst-case CO concentrations throughout the project corridor. Although the majority of the project is located outside the City of Charlottesville, those emission rates were higher than Albemarle County. As such, the higher emission rates generated for the City of Charlottesville area were used throughout the analysis to ensure worstcase concentrations were projected. CO Receptor Locations As stipulated by EPA s Guideline for Modeling Carbon Monoxide from Roadway Intersections, selection of potential air quality receptors used the following criteria: o Select areas of expected 1-hour and 8-hour maximum concentrations; o Select areas of where the general public has continuous access over specific time periods; o Reasonable receptor locations. As referenced in EPA s Guidance, each receptor represents an area where the public would have continuous access to the immediate vicinity. Areas were selected based on generalized assessments of where human activity is likely to coincide with the highest CO concentrations. The locations selected for analysis include: the St. Anne s Belfield School and associated outdoor facilities; the Albemarle High School, Mary Carr Greer Elementary School, Jack Jouett Middle School, Ivy Creek School, and associated outdoor facilities; the Agnor- Hurt Elementary School and associated outdoor facilities; and other residential and open areas along the proposed alignment where the public has access and maximum CO concentrations would be expected to occur. If the projected peak CO concentrations at the worst-case locations selected in the analysis are below the CO NAAQS, then it is assumed that all other locations within the project corridor will also remain below the CO Route 29 Bypass Project Final Air Quality Technical Report 10 Albemarle County and the City of Charlottesville, VA
14 Table 3 Inputs to MOBILE6.2 Parameter Data Evaluation Month January Evaluation Season 2 Min/Max Temperature (Fahrenheit) 30/30 Absolute Humidity 75 Gasoline Reid Vapor Pressure (RVP) pounds per square inch 13.5 Fuel Type Conventional East Source: VDOT s Consultant Guide Air Quality Project-Level Analysis, Revision 18 (May 2009). Table 4 CAL3QHC Worst-Case Inputs Surface Roughness Coefficient Surface Roughness Coefficient Parameter Background CO Concentrations (parts per million) (project located between Roanoke and Richmond) Wind Speed (meters per second) Stability Class Stability Class Mixing Height Receptor Height 1-hour 8-hour Data 175 cm (urban) 11 cm (rural) 3.0 ppm 2.2 ppm 1 m/s Urban - D Rural - E 1000 meters 5.9 feet Persistence Factor 0.7 Source: VDOT s Consultant Guide Air Quality Project-Level Analysis, Revision 18 (May 2009). Route 29 Bypass Project Final Air Quality Technical Report 11 Albemarle County and the City of Charlottesville, VA
15 Table 5 MOBILE6.2 Outputs Summary of CO Emission Rates Analysis Year Location Speed (mph) City of Charlottesville Albemarle County Notes: 1. Emission rates for speeds 25 to 55 mph are in units of grams per vehicle miles traveled (g/vmt). 2. Idle emission rates (2.5 mph) are in units of grams per vehicle hour (g/veh-hr). NAAQS. Figure 2 through Figure 8 show the sensitive receptor locations along the proposed build alternative selected for the air study. It should be noted that only the project corridor is highlighted yellow on Figure 2 through Figure 8 and that the conceptual design varies within the highlighted area. The study area includes a wide variety of land use types, roadway features, and areas where the public has continuous access adjacent to the proposed improvements. The area is comprised primarily of mixed commercial and residential land uses adjacent to the project corridor. The project area is comprised of a rural and urban environment, which consists of local street systems as well as collector-distributor roads paralleling the project corridor. In order to identify the worst-case intersections to be included in the air study, EPA guidance suggests ranking the top intersection locations based on traffic volumes and level of service (LOS). However, the proposed bypass will consist of a limited access highway with a northern and southern interchange area. As such, several receptors were selected adjacent to the northern and southern interchange areas where traffic has the largest potential to queue along the new project corridor. Therefore, for the purposes of this portion of the assessment, both the northern and southern interchange areas were included. Route 29 Bypass Project Final Air Quality Technical Report 12 Albemarle County and the City of Charlottesville, VA
16 04367_hb_Charlottesville_Bypass_11x17_cut_sheets_JC_ /1/2012 1:47:44 PM!E( Air Quality Modeling Receptor (5). A l b e m a r l e C o u n t y WV PA MD 95 DE Route 29 Bypass Project State Project # , P101; UPC Figure 2 Project Location Map Feet 29 ST 20 Albemarle County and Meters City of Charlottesville, Virginia NC Route 29 Bypass Project Final Air Quality Technical Report 13 Albemarle County and the City of Charlottesville, VA Virginia 95 Virginia Department of Transportation
17 04367_hb_Charlottesville_Bypass_11x17_cut_sheets_JC_ /1/2012 1:47:44 PM!E( Air Quality Modeling Receptor (2). A l b e m a r l e C o u n t y WV PA MD 95 DE Route 29 Bypass Project State Project # , P101; UPC Figure 3 Project Location Map Feet 29 ST 20 Albemarle County and Meters City of Charlottesville, Virginia NC Route 29 Bypass Project Final Air Quality Technical Report 14 Albemarle County and the City of Charlottesville, VA Virginia 95 Virginia Department of Transportation
18 04367_hb_Charlottesville_Bypass_11x17_cut_sheets_JC_ /1/2012 1:47:44 PM!E( Air Quality Modeling Receptor (3). A l b e m a r l e C o u n t y WV PA MD 95 DE Route 29 Bypass Project State Project # , P101; UPC Figure 4 Project Location Map Feet 29 ST 20 Albemarle County and Meters City of Charlottesville, Virginia NC Route 29 Bypass Project Final Air Quality Technical Report 15 Albemarle County and the City of Charlottesville, VA Virginia 95 Virginia Department of Transportation
19 04367_hb_Charlottesville_Bypass_11x17_cut_sheets_JC_ /1/2012 1:47:44 PM!E( Air Quality Modeling Receptor (4). A l b e m a r l e C o u n t y WV PA MD 95 DE Route 29 Bypass Project State Project # , P101; UPC Figure 5 Project Location Map Feet 29 ST 20 Albemarle County and Meters City of Charlottesville, Virginia NC Route 29 Bypass Project Final Air Quality Technical Report 16 Albemarle County and the City of Charlottesville, VA Virginia 95 Virginia Department of Transportation
20 04367_hb_Charlottesville_Bypass_11x17_cut_sheets_JC_ /1/2012 1:47:44 PM!E( Air Quality Modeling Receptor (4). A l b e m a r l e C o u n t y WV PA MD 95 DE Route 29 Bypass Project State Project # , P101; UPC Figure 6 Project Location Map Feet 29 ST 20 Albemarle County and Meters City of Charlottesville, Virginia NC Route 29 Bypass Project Final Air Quality Technical Report 17 Albemarle County and the City of Charlottesville, VA Virginia 95 Virginia Department of Transportation
21 04367_hb_Charlottesville_Bypass_11x17_cut_sheets_JC_ /1/2012 1:47:44 PM!E( Air Quality Modeling Receptor (6). A l b e m a r l e C o u n t y WV PA MD 95 DE Route 29 Bypass Project State Project # , P101; UPC Figure 7 Project Location Map Feet 29 ST 20 Albemarle County and Meters City of Charlottesville, Virginia NC Route 29 Bypass Project Final Air Quality Technical Report 18 Albemarle County and the City of Charlottesville, VA Virginia 95 Virginia Department of Transportation

22 04367_hb_Charlottesville_Bypass_11x17_cut_sheets_JC_ /1/2012 1:47:44 PM!E( Air Quality Modeling Receptor (3). A l b e m a r l e C o u n t y WV PA MD 95 DE Route 29 Bypass Project State Project # , P101; UPC Figure 8 Project Location Map Feet 29 ST 20 Albemarle County and Meters City of Charlottesville, Virginia NC Route 29 Bypass Project Final Air Quality Technical Report 19 Albemarle County and the City of Charlottesville, VA Virginia 95 Virginia Department of Transportation
23 Additionally, since the project will divert traffic off of Route 29 and is expected to improve air quality in the existing Route 29 corridor, the two worst-case signalized intersections along the existing project corridor were also included in the study for comparisons between No-Build and Build conditions. After review of the detailed traffic data, PM peak hour volumes are higher than AM peak hour volumes along the project corridor under Design Year 2040 conditions. As a result, Design Year No-Build (2015) and Design Year Build (2015) conditions, as well as Design Year No-Build (2040) and Design Year Build (2040) PM peak hour traffic volumes and level-of-service (LOS) were used as a worst-case assumption in the CO hotspot analysis and are included in Appendix C. For the purposes of the CO assessment, the two worst-case signalized intersections selected for the assessment, as well as the rank, are identified below: Hydraulic Road & Route 29 (Rank 1) Rio Drive & Route 29 (Rank 2) The intersections identified above were selected based on having the highest design year PM peak-hour traffic volumes along the existing Route 29 project corridor, as well as the worst-case intersection LOS and delay. A ranking of the signalized intersections along the existing Route 29 corridor in the vicinity of the project area was completed in accordance with EPA Guidance and is included in Appendix C. Although no improvements along the existing Route 29 project corridor are proposed as part of the project, all intersection modeling will include the existing footprint while modeling each analysis year. Additionally all modeling and receptor site selection will be in accordance with EPA s Guideline for Modeling Carbon Monoxide from Roadway Intersections. The air quality modeling receptors evaluated at each signalized intersection can be referenced on Figure 9 and Figure 10. Analysis Methodologies & Results The CAL3QHC computer dispersion model was used to predict the 1-hour CO concentrations at the receptor locations shown in Table 6 and Table 7, as well as Figure 2 through Figure 10 for Existing (2011), Interim/Opening Year No-Build (2015), Interim/Opening Year Build (2015), Design Year No-Build (2040), and Design Year Build (2040) conditions. All relevant traffic data used in the analysis was provided by VDOT traffic engineers. Worst-case traffic operations and atmospheric conditions were incorporated to predict worst-case CO concentrations. Based on review of the supplied traffic data, the CO modeling analysis for the project corridor focused on the PM-peak conditions. Maximum CO concentrations, calculated by adding together the background concentration to the projected peak CO concentration for all locations, scenarios, and years considered in the analysis area, are shown in Table 6 and Table 7. The 1-hour background concentration, 3.0 ppm, was derived from VDOT s Consultant Guide. In addition, a persistence factor of 0.7 was used to project the 8-hour CO concentrations as stipulated in EPA and VDOT guidance. Furthermore, to project worst-case CO concentrations, a surface roughness coefficient of 11 cm was assumed for areas along the proposed bypass due to rural conditions, while 175 cm was assumed for the two signalized intersections along existing Route 29 Bypass Project Final Air Quality Technical Report 20 Albemarle County and the City of Charlottesville, VA
24 04367_hb_Charlottesville_Bypass_11x17_cut_sheets_JC_ /1/2012 1:47:44 PM!E( Air Quality Modeling Receptor (28). A l b e m a r l e C o u n t y WV PA MD 95 DE Route 29 Bypass Project State Project # , P101; UPC Figure 9 Hydraulic Road / Route Feet 29 ST 20 Albemarle County and Meters City of Charlottesville, Virginia NC Route 29 Bypass Project Final Air Quality Technical Report 21 Albemarle County and the City of Charlottesville, VA Virginia 95 Virginia Department of Transportation
25 04367_hb_Charlottesville_Bypass_11x17_cut_sheets_JC_ /1/2012 1:47:44 PM!E( Air Quality Modeling Receptor (28). A l b e m a r l e C o u n t y WV PA MD 95 DE Route 29 Bypass Project State Project # , P101; UPC Figure 10 Rio Road / Route Feet 29 ST 20 Albemarle County and Meters City of Charlottesville, Virginia NC Route 29 Bypass Project Final Air Quality Technical Report 22 Albemarle County and the City of Charlottesville, VA Virginia 95 Virginia Department of Transportation
26 Table 6 Carbon Monoxide Analysis - Route 29 Bypass Corridor 1-Hour and 8-Hour CO Level Summary (ppm) Existing (2011) 2015 Interim/Opening Year No- Build 2015 Interim/Opening Year Build 2040 Design Year No-Build 2040 Design Year Build Receptor ID 1-Hour 8-Hour 1-Hour 8-Hour 1-Hour 8-Hour 1-Hour 8-Hour 1-Hour 8-Hour Route 29 Bypass Corridor R R R R R R R R R R R R R R R R R R R R R R R R R R Notes: 1. 1-Hour and 8-Hour concentrations shown above are in parts per million (ppm) Hour concentrations predicted using CAL3QHC computer dispersion model and assumes a background concentration of 3.0 ppm Hour concentrations were calculated by applying a persistence factor of 0.7 to the 1-Hour concentration, as per the VDOT Consultant Guide, Air Quality Project Level Analysis, Revision 18, May The persistence factor of 0.7 is based on the guidance in the Guideline for Modeling Carbon Monoxide from Roadway Intersections, EPA, November Highlighted cells represent highest CO concentrations per analysis year. Route 29 Bypass Project Final Air Quality Technical Report 23 Albemarle County and the City of Charlottesville, VA
27 Figure 9 - Hydraulic Road & US 29 Signalized Intersection Figure 10 - Rio Road & US 29 Signalized Intersection Receptor ID Existing (2011) A A A A A A A A A A A A A A A A A A A A A A A A A A B B B B B B B B Table 7 Carbon Monoxide Analysis - Signalized Intersection Summary 1-Hour and 8-Hour CO Level Summary (ppm) 2015 Interim/Opening Year No-Build 1-Hour 8-Hour 1-Hour 8-Hour A A B B B B B B B B B B B B B B B B B B B B Notes: 1. 1-Hour and 8-Hour concentrations shown above are in parts per million (ppm) Hour concentrations predicted using CAL3QHC computer dispersion model and assumes a background concentration of 3.0 ppm Hour concentrations were calculated by applying a persistence factor of 0.7 to the 1-Hour concentration, as per the VDOT Consultant Guide, Air Quality Project Level Analysis, Revision 18, May The persistence factor of 0.7 is based on the guidance in the Guideline for Modeling Carbon Monoxide from Roadway Intersections, EPA, November Highlighted cells represent highest CO concentrations per analysis year Interim/Opening Year Build Design Year No-Build 1-Hour 8-Hour 1-Hour 8-Hour Design Year Build 1-Hour 8-Hour Route 29 Bypass Project Final Air Quality Technical Report 24 Albemarle County and the City of Charlottesville, VA
28 US 29 which represent urban conditions. These surface roughness coefficients are documented in VDOT s Consultant Guide. Additional assumptions used of the analysis can be found in Appendix D of the air study. Table 6 provides a summary of the CO levels at sensitive receptors selected along the proposed project corridor for each analysis year. As shown in Table 6 (Figure 2 through Figure 8), the highest 1-hour and 8-hour CO concentrations under Existing (2011) conditions were projected at 6.9 and 4.8 ppm, respectively, including the assumed background concentration of 3.0 ppm for the 1-hour standard. Under Interim/Opening Year No-Build (2015) conditions, the highest 1-hour and 8-hour CO concentrations were projected to be 6.6 and 4.6 ppm, respectively. Under Interim/Opening Year Build (2015) conditions, the highest 1-hour and 8-hour CO concentrations were projected to be 4.7 and 3.3 ppm, respectively. Under Design Year No-Build (2040) conditions, the highest 1- hour and 8-hour CO concentrations were projected to be 7.0 and 4.9 ppm, respectively. Under Design Year Build (2040) conditions, the highest 1-hour and 8-hour CO concentrations were projected to be 4.8 and 3.4 ppm, respectively. The highest CO concentrations for all analysis years were projected at receptor site R21, which represents athletic fields at the St. Annes Belfield Lower School. CO levels decrease under both the Interim/Opening Year and Design Year Build conditions when compared to the respective No-Build condition as a result of the realignment of the existing Route 250 bypass further south and away from St. Annes Belfield Lower School. In addition to the selected receptors along the project corridor, additional CO hot-spot modeling was performed at the two worst-case signalized intersections along the Route 29 corridor in the vicinity of the project area. The results of the CO hot-spot modeling are summarized in the following paragraphs. The first signalized intersection included in the air study is located at Hydraulic Road & Route 29 (Figure 9). A summary of the CO concentrations at this intersection are shown in Table 7. Including the assumed background concentration of 3.0 ppm for the 1-hour standard, the highest 1-hour and 8-hour CO concentrations under Existing (2011) conditions were projected at 10.4 and 7.3 ppm, respectively. Under Interim/Opening Year No-Build (2015) conditions, the highest 1-hour and 8-hour CO concentrations were projected to be 9.0 and 6.3 ppm, respectively. Under Interim/Opening Year Build (2015) conditions, the highest 1-hour and 8-hour CO concentrations were projected to be 8.2 and 5.7 ppm, respectively. Under Design Year No-Build (2040) conditions, the highest 1- hour and 8-hour CO concentrations were projected to be 8.9 and 6.2 ppm, respectively. Under Design Year Build (2040) conditions, the highest 1-hour and 8-hour CO concentrations were projected to be 8.4 and 5.9 ppm, respectively. The highest CO concentration for Existing (2011) and Interim/Opening Year Build (2015) was projected at receptor site A-17, which represents a parking lot / open area. The highest CO concentrations for Interim/Opening Year No-Build (2015), Design Year No-Build (2040) and Design Year Build (2040) was projected at site A-25, which also represents an open area and parking lot. In addition, site A-3 also had the same predicted peak CO concentrations as site A-25 in Design Year No-Build (2040) condition. The second signalized intersection included in the air study is located at Rio Road & Route 29 (Figure 10). It should be noted that as part of another transportation improvement project identified in UnJAM2035, the proposed design elements at this intersection include a grade separated interchange. However, to assume a worst-case modeling condition, the existing footprint was modeled for each analysis scenario. In Route 29 Bypass Project Final Air Quality Technical Report 25 Albemarle County and the City of Charlottesville, VA
29 addition, the intersection was modeled as a signalized intersection using SYNCHRO model outputs for all dispersion modeling. It can be assumed that any improvement tied to the grade separation project will only further improve air quality and CO concentrations by removing all queuing and idling vehicles associated with a signalized intersection and move those vehicles through more efficiently under free-flow conditions. Therefore, the modeling presented in this study is considered a worst-case condition. A summary of the CO concentrations at this intersection are also shown in Table 7. Including the assumed background concentration of 3.0 ppm for the 1-hour standard, the highest 1-hour and 8-hour CO concentrations under Existing (2011) conditions were projected at 9.5 and 6.7 ppm, respectively. Under Interim/Opening Year No-Build (2015) conditions, the highest 1-hour and 8-hour CO concentrations were projected to be 8.5 and 6.0 ppm, respectively. Under Interim/Opening Year Build (2015) conditions, the highest 1-hour and 8-hour CO concentrations were projected to be 7.9 and 5.5 ppm, respectively. Under Design Year No-Build (2040) conditions, the highest 1-hour and 8- hour CO concentrations were projected to be 8.4 and 5.9 ppm, respectively. Under Design Year Build (2040) conditions, the highest 1-hour and 8-hour CO concentrations were projected to be 7.8 and 5.5 ppm, respectively. The highest CO concentration for Existing (2011), Interim/Opening Year No-Build (2015) and Interim/Opening Year Build (2015) conditions was projected at receptor site B-3, which represents an open area / parking lot. The highest CO concentrations for Design Year No-Build (2040) and Design Year Build (2040) conditions, was projected at site B-2, which also represents open areas and parking lots. Under all scenarios for each project location, the highest 1-hour and 8-hour CO concentrations are projected to be below the standards of 35 ppm and 9 ppm, respectively. Additionally, in all cases, the 1-hour and 8-hour CO projections improve along the existing U.S. 29 corridor when comparing No-Build to Build conditions. As such, the improvements in CO levels can be attributed to the reduction in congestion while improving traffic flow. Since the projected 1-hour and 8-hour CO concentrations do not exceed the NAAQS at each of the worst-case locations chosen for analysis throughout the existing and new Route 29 project corridors, then it is assumed that all other locations within the project corridors will also remain below the CO NAAQS. VI. Fine Particulate Matter Analysis Particle pollution is comprised of a mixture of solid particles and liquid droplets found in the atmosphere. The particles are a combination of several items including dust, dirt, soot, and smoke, and they can vary in size. Particulate matter (PM) created by human activity includes, but is not limited to, the following sources: wood stoves, industry and power plants, and emissions from motor vehicles. It can also be formed in the atmosphere from gases, including sulfur dioxide, nitrogen dioxide, and volatile organic compounds (VOC). Particle pollution includes "inhalable coarse particles" with diameters larger than 2.5 microns and smaller than 10 microns and "fine particles" with diameters 2.5 microns and smaller. The average human hair is about 70 microns in diameter making it 30 times larger than the largest fine particle. Route 29 Bypass Project Final Air Quality Technical Report 26 Albemarle County and the City of Charlottesville, VA
30 The project is located in Albemarle County and the City of Charlottesville, an area designated as attainment for PM 10 and for PM 2.5. Although the project is designated as attainment for PM 2.5 for regional conformity purposes, the project was still evaluated to determine whether it is a project of air quality concern. As per 40 CFR (b)(1) of the federal conformity rule, PM 10 and PM 2.5 hotspot analyses are generally required for the following types of projects: (i) New highway projects that have a significant number of diesel vehicles, and expanded highway projects that have a significant increase in the number of diesel vehicles; (ii) Projects affecting intersections that are at Level-of-Service D, E, or F with a significant number of diesel vehicles or those that will change to Level of Service D, E, or F because of increased traffic volumes from a significant number of diesel vehicles related to the project; (iii) New bus and rail terminals and transfer points that have a significant number of diesel vehicles congregating at a single location; (iv) Expanded bus and rail terminals and transfer points that significantly increase the number of diesel vehicles congregating at a single location; and (v) Projects in or affecting locations, areas, or categories of sites which are identified in the PM 10 or PM 2.5 applicable implementation plan or implementation plan submission, as appropriate, as sites of violation or possible violation. In addition, EPA guidance indicates that a project of air quality concern that would be covered by 40 CFR (b)(i) and (ii) would be a project on a new highway or expressway that serves a significant volume of diesel truck traffic, such as facilities with greater than 125,000 annual average daily traffic (AADT) and 8% or more or more of such AADT is diesel truck traffic. The study area includes a new highway project primarily servicing gasoline vehicle traffic and will not involve a significant number or increase in diesel vehicles. The proposed bypass is projected to carry only 27,800 vehicles per day with 3% diesel trucks. The project is also designed to improve traffic flow and vehicle speeds within the existing Route 29 corridor, and will not involve any increases in idling. In addition, the project does not affect intersections that are at LOS D, E or F with a significant number of diesel vehicles, or those that will change to LOS D, E or F because of increased traffic volumes from a significant number of diesel vehicles related to the project. Last, criteria (iii), (iv), and (v) noted above are not applicable to this project. Based on the above analysis, it was determined that the project is not considered to be a project of air quality concern with respect to particulate matter (PM). The project is located in a geographic area that is in attainment for particulate matter and was found to be in compliance with all applicable state and federal air quality requirements. As such, the project will not cause or contribute to a new violation of the PM NAAQS, increase the frequency or severity of a violation, or delay timely attainment of the PM NAAQS. Route 29 Bypass Project Final Air Quality Technical Report 27 Albemarle County and the City of Charlottesville, VA
31 VII. Mobile Source Air Toxics In addition to the criteria air pollutants for which there are NAAQS, EPA also regulates air toxics. Most air toxics originate from human-made sources, including on-road mobile sources, non-road mobile sources, and stationary sources (e.g., factories or refineries). MSAT are a subset of the 188 air toxics defined by the Clean Air Act. EPA has assessed this expansive list in their latest rule on the Control of Hazardous Air Pollutants from Mobile Sources (Federal Register, Vol. 72, No. 37, page 8430, February 26, 2007) and identified seven compounds of particular concern: acrolein, benzene, 1,3-butadiene, diesel particulate matter plus diesel exhaust organic gases (diesel PM), formaldehyde, naphthalene, and polycyclic organic matter. These are compounds that EPA s 1999 National-Scale Air Toxics Assessment (NATA) identified as the most significant contributors to cancer and non-cancer health risk from breathing outdoor air toxics, and that have a significant contribution from mobile sources. The 2007 EPA rule mentioned above requires controls that will dramatically decrease MSAT emissions through cleaner fuels and cleaner engines. According to an FHWA analysis using EPA's MOBILE6.2 model, even if vehicle activity (vehicle miles traveled, VMT) increases by 145 percent as assumed, a combined reduction of 72 percent in the total annual emission rates for the priority MSAT is projected from 1999 to 2050, as shown in Figure 11. On September 30, 2009, FHWA issued Interim Guidance Update on Mobile Source Air Toxic Analysis in NEPA Documents. This interim guidance update reflects recent regulatory changes; addresses stakeholder requests to broaden the horizon years of emission trends performed with MOBILE6.2; and updates stakeholders on the status of scientific research on air toxics. In accordance with the updated guidance, the project area is best characterized as a project with low potential MSAT effects since design year traffic is projected to be significantly less than 140,000 to 150,000 annual average daily traffic (AADT) thresholds. As a result, a qualitative assessment of emissions projections was prepared in accordance with Appendix B of the guidance. Project specific elements, including increased travel speeds and improvements to level-of-service (LOS) and the overall effects on MSAT emissions are discussed below. As stipulated in the guidance, additional discussion is required including information that is incomplete or unavailable for a project specific assessment of MSAT impacts. Additionally, air toxics is an emerging field and current scientific techniques, tools, and data are not sufficient to accurately estimate human health impacts that would result from the transportation project. Appendix C from the guidance is also included in the discussions below to satisfy this portion of the requirements. When analyzing the project, the amount of MSAT emissions emitted is generally proportional to the vehicle miles traveled, or VMT, assuming that other variables such as fleet mix and diesel vehicle percentages remain constant for each alternative. On a regional basis, 2040 VMT on the roadway network in the project area is only anticipated to increase 0.3% with the project in place when compared to the 2040 No-Build scenario. The Build VMT estimates are slightly higher than that for the No-Build alternative, because the project could facilitate new development that attracts trips that would not otherwise occur in the area. Route 29 Bypass Project Final Air Quality Technical Report 28 Albemarle County and the City of Charlottesville, VA
32 Figure 11 NATIONAL MSAT EMISSION TRENDS FOR VEHICLES OPERATING ON ROADWAYS USING EPA's MOBILE6.2 MODEL As such, regional MSAT emissions in the project area are expected to be insignificantly higher as a result of this project. Also, regardless of whether the project is built, MSAT emissions are anticipated to be significantly lower than present levels in the design year as a result of EPA's national control programs that are projected to reduce annual MSAT emissions by 72 percent from 1999 to Local conditions may differ from these national projections in terms of fleet mix and turnover, VMT growth rates, and local control measures. However, the magnitude of the EPA-projected reductions is so great (even after accounting for VMT growth) that a marginal increase in MSAT emissions in the study area due to the project will be significantly offset by EPA s national control programs. Under the Build alternative, there may be localized areas where VMT could increase and other areas where VMT could decrease. The localized increases in MSAT emissions would be most pronounced along the proposed bypass because it is on new location but as stated previously, any localized increase has a low potential for MSAT effects. In contrast, MSAT emissions are expected to decrease in the existing Route 29 corridor because VMT in the corridor would decrease as traffic shifts from the existing corridor to the bypass corridor. Regardless, even if localized increases do occur in some areas, total MSAT emissions will be substantially lower in future years due to fleet turnover and the implementation of EPA's vehicle and fuel regulations. Route 29 Bypass Project Final Air Quality Technical Report 29 Albemarle County and the City of Charlottesville, VA
33 In summary, for the design year Build scenario on the roadway network in the project area regional MSAT emissions are expected to be significantly lower than those emitted today even when taking into account the small projected increase in vehicle miles traveled. Additionally, the implementation of EPA s vehicle and fuel regulations will result in significantly lower MSAT levels for the area in the future than exist today, as shown in Figure 11. Incomplete or Unavailable Information for Project-Specific MSAT Health Impacts Analysis In FHWA's view, information is incomplete or unavailable to credibly predict the projectspecific health impacts due to changes in MSAT emissions associated with a proposed set differentiation of the MSAT health impacts among a set of project alternatives. These difficulties are magnified for lifetime (i.e., 70-year) assessments, particularly because unsupportable assumptions would have to be made regarding changes in travel patterns and vehicle technology (which affects emissions rates) over that time frame, since such information is unavailable. The results produced by the EPA's MOBILE6.2 model, the California EPA's Emfac2007 model, and the EPA's DraftMOVES2009 model in forecasting MSAT emissions are highly inconsistent. Indications from the development of the MOVES model are that MOBILE6.2 significantly underestimates diesel particulate matter (PM) emissions and significantly overestimates benzene emissions. Regarding air dispersion modeling, an extensive evaluation of EPA's guideline CAL3QHC model was conducted in an NCHRP study ( which documents poor model performance at ten sites across the country - three where intensive monitoring was conducted plus an additional seven with less intensive monitoring. The study indicates a bias of the CAL3QHC model to overestimate concentrations near highly congested intersections and underestimate concentrations near uncongested intersections. The consequence of this is a tendency to overstate the air quality benefits of mitigating congestion at intersections. Such poor model performance is less difficult to manage for demonstrating compliance with NAAQS for relatively short time frames than it is for forecasting individual exposure over an entire lifetime, especially given that some information needed for estimating 70-year lifetime exposure is unavailable. It is particularly difficult to reliably forecast MSAT exposure near roadways, and to determine the portion of time that people are actually exposed at a specific location. There are considerable uncertainties associated with the existing estimates of toxicity of the various MSAT, because of factors such as low-dose extrapolation and translation of occupational exposure data to the general population, a concern expressed by HEI ( As a result, there is no national consensus on air dose-response values assumed to protect the public health and welfare for MSAT compounds, and in particular for diesel PM. The EPA ( and the HEI ( have not established a basis for quantitative risk assessment of diesel PM in ambient settings. There is also the lack of a national consensus on an acceptable level of risk. The current context is the process used by the EPA as provided by the Clean Air Act to determine whether more stringent controls are required in order to provide an ample margin of Route 29 Bypass Project Final Air Quality Technical Report 30 Albemarle County and the City of Charlottesville, VA
34 safety to protect public health or to prevent an adverse environmental effect for industrial sources subject to the maximum achievable control technology standards, such as benzene emissions from refineries. The decision framework is a two-step process. The first step requires EPA to determine a "safe" or "acceptable" level of risk due to emissions from a source, which is generally no greater than approximately 100 in a million. Additional factors are considered in the second step, the goal of which is to maximize the number of people with risks less than 1 in a million due to emissions from a source. The results of this statutory two-step process do not guarantee that cancer risks from exposure to air toxics are less than 1 in a million; in some cases, the residual risk determination could result in maximum individual cancer risks that are as high as approximately 100 in a million. In a June 2008 decision, the U.S. Court of Appeals for the District of Columbia Circuit upheld EPA's approach to addressing risk in its two step decision framework. Information is incomplete or unavailable to establish that even the largest of highway projects would result in levels of risk greater than safe or acceptable. Because of the limitations in the methodologies for forecasting health impacts described, any predicted difference in health impacts between alternatives is likely to be much smaller than the uncertainties associated with predicting the impacts. Consequently, the results of such assessments would not be useful to decision makers, who would need to weigh this information against project benefits, such as reducing traffic congestion, accident rates, and fatalities plus improved access for emergency response, that are better suited for quantitative analysis. Moreover, EPA regulations for vehicle engines and fuels will cause overall MSAT emissions to decline significantly over the next several decades. This trend will both reduce the background level of MSAT as well as the possibility of even minor MSAT emission increases from this project. VIII. Potential Greenhouse Gas Impacts There are currently no federal or state requirements to analyze greenhouse gas emissions for individual transportation projects. Climate change is inherently a global issue that is more appropriately addressed, minimally, at the regional level or even more appropriately at the state or national level by assessing the impact of transportation systems as opposed to individual projects. Further, climate change does not readily lend itself to an analysis at the local level, and national air quality standards have not been established. Relative to the scope of global climate change, any change in greenhouse gas levels as a result of the project are likely to be insignificant, which can be concluded by comparing the anticipated VMT and speeds along the project corridor for both the build and no-build conditions. IX. Construction Impacts The temporary air quality impacts from construction are not expected to be significant. Emissions will be produced during the construction of this project by heavy equipment and vehicle travel to and from the site. Earthmoving and ground-disturbing operations will generate airborne dust. Construction emissions are short term or temporary in nature. In order to mitigate these emissions, all construction activities are to be performed in accordance with VDOT s Road and Bridge Specifications. These Route 29 Bypass Project Final Air Quality Technical Report 31 Albemarle County and the City of Charlottesville, VA
35 Specifications are approved as conforming to the State Implementation Plan and require compliance with all applicable local, state, and federal regulations. X. Conformity Status of the Project The project has also been evaluated with respect to regional air quality concerns. The Clean Air Act Amendments (CAAA) of 1990 mandate improvements to the nation s air quality. The final conformity regulations promulgated by the US EPA in 1997, as part of 40 CFR Part 93, require that transportation plans and programs conform to the State Implementation Plan (SIP). The final conformity rule requires that transportation plans in ozone nonattainment areas are consistent with the most recent estimates of mobile source emissions; provide for the expeditious implementation of transportation control measures in the applicable implementation plan; and contribute to annual emission reductions in ozone and carbon monoxide nonattainment areas. Based on the CAAA and most recent EPA classifications, Albemarle County and the City of Charlottesville have been designated as attainment for ozone and PM 2.5 ; therefore, the project is not subject to regional or project level conformity requirements. As such, since the project is located in an attainment area for the pollutants listed above, it has met all conformity requirements as outlined by the CAAA of XI. Conclusion Based on the results of the CO hotspot analysis, peak CO concentrations for the Build Alternatives are predicted to be below the CO NAAQS in both the Interim/Opening Year Build (2015) and Design Year Build (2040) scenarios for each of the worst-case locations analyzed along the proposed project corridor, as well as for the worst-case signalized intersections evaluated in the air study. Therefore, it is anticipated that all other locations within the project corridor will also remain below the CO NAAQS and no mitigation measures are required. Additionally, Albemarle County and the City of Charlottesville have been designated as attainment with the 8-hour ozone and fine particulate matter standards, and therefore transportation conformity requirements do not apply. The project was evaluated for fine particulate matter impacts and was found not to be a project of air quality concern. In addition, FHWA has determined that the Route 29 Bypass Project will generate minimal air quality impacts for CAAA criteria pollutants and has not been linked with any special MSAT concerns. As shown in Table 2, design year traffic is projected to be less than the 140,000 to 150,000 annual average daily traffic (AADT) thresholds identified in FHWA s guidance and as such, the project area is best characterized as a project with low potential MSAT effects. The temporary air quality impacts from construction are not expected to be significant. Construction activities are to be performed in accordance with VDOT s current Road and Bridge Specifications. Finally, the project is not expected to cause or contribute to any violations of the NAAQS, worsen any existing violations, or interfere with the attainment of any applicable NAAQS. Route 29 Bypass Project Final Air Quality Technical Report 32 Albemarle County and the City of Charlottesville, VA
36
37
38
39
40
41
42
43
44
45
46
47
48
49
50
51
52
53
54
55
56
57
58
59
60
61
62
63
64
65
66
67
68
69
70
71
72
73
74
75
76
77
78
79
80
81
82
83
84
85
86
87
88
89
90
91
92
93
94
95
96
97
98
99
100
101
102
103
104
105
106
107
108
109
110
111
112
113
114
115
116
117
118
119
120
121
122
123
124
125
126
127
128
129
130
131
132
133
134
135
136
137
138
139
140
141
142
143
144
145
146
147
148
149
150
151
152
153
154
155
156
157
158
159
160
161
162
163
164
165
166
167
168
169
170
171
172
173
174
175
176
177
178
179
180
181
182
183
184
185
186
187
188
189
190
191
192
193
194
195
196
197
198
199
200
201
202
203
204
205
206
207
208
209
210
211
212
213
214
215
216
217
218
219
220
221
222
223
224
225
226
227
228
229
230
231
232
233
234
235
236
237
238
239
240
241
242
243
244
245
246
247
248
249
250
251
252
253
254
255
256
257
258
259
260
261
262
263
264
265 APPENDIX C TRAFFIC SUMMARY / SYNCHRO REPORTS
266 Table 2 - Route 29 Bypass - Average Daily Traffic (ADT) Summary Route 29 Bypass Corridor Existing Route 29 Segment Link Description 2011 Existing 2015 No-Build 2015 Build 2040 No-Build 2040 Build ADT % Trucks ADT % Trucks ADT % Trucks ADT % Trucks ADT % Trucks 67 Route 250 Bypass WB (btwn Hydraulic Rd & Emmet St) 11, % 12, , % 16, , Route 250 Bypass EB (btwn Hydraulic Rd & Emmet St) 11, % 12, , % 16, , Route 250 Bypass WB (btwn Emmet St & Barracks Rd) 19, % 20, , % 29, , Route 250 Bypass EB (btwn Emmet St & Barracks Rd) 19, % 20, , % 29, , L. Sandbridge Rd NB, south of % % 1, % 3, % 3, % 78 L. Sandbridge Rd SB, south of % % 1, % 3, % 3, % 109 Route 250 Bypass WB (btwn Barracks Rd & Prop Route 29 Bypass) 24, % 25, % 17, % 35, % 26, % 110 Route 250 Bypass EB (btwn Bararcks Rd & Prop Route 29 Bypass) 24, % 25, % 17, % 35, % 26, % NB south of the Bypass (between Fontaine and Ivy) 21, % 23, % 24, % 33, % 34, % SB south of the Bypass (between Fontaine and Ivy) 21, % 23, % 24, % 33, % 34, % 113 Ivy Rd EB (btwn Rt 250 Bypass & Alderman Rd) 8, % 7, % 7, % 6, % 5, % 114 Ivy Rd WB (btwn Rt 250 Bypass & Alderman Rd) 8, % 7, % 7, % 6, % 5, % 115 Ivy Rd WB (btwn Rt 846 & Golf Course Dr) 7, % 7, % 7, % 10, % 10, % 116 Ivy Rd EB (btwn Rt 846 & Golf Course Dr) 7, % 7, % 7, % 10, % 10, % 117 Old Ivy Rd EB (btwn Crestwood Rd & Harvest Dr) 2, % 2, % 2, % 2, % 2, % 118 Old Ivy Rd WB (btwn Crestwood Rd & Harvest Dr) 2, % 2, % 2, % 2, % 2, % 119 Proposed Bypass NB (South Terminus to North Terminus) 8, % 13, % 120 Proposed Bypass SB (North Terminus to South Terminus) 8, % 13, % 152 AB-AC: Off-Ramp from 29 NB to L. Sandridge Rd (diamond) % % 163 AB-AJ: 29 NB to Proposed Bypass NB (flyover) 8, % 10, % 153 AC-AD: On-Ramp from L. Sandridge Rd to 250 NB (diamond) % 1, % 154 AA-AD: 250 Bypass NB (thru lanes) from 29 NB Bypass diverge to On-Ramp from L. Sandridge Rd 16, % 24, % 157 AE-AH: 250 Bypass SB (thru lanes) from Off-Ramp to L. Sandridge Rd to 29 SB Bypass merge 16, % 23, % 158 AH-AG: 250 Bypass SB (thru lanes) from 29 SB Bypass merge to On-Ramp from L. Sandridge Rd 24, % 34, % 155 AE-AF: Off-Ramp from 250 SB to L. Sandridge Rd (diamond) % 3, % 156 AF-AG: On-Ramp from L. Sandridge Rd to 29 SB (diamond) % 1, % 164 AI-AH: Proposed Bypass SB to 29 SB (flyover) 8, % 11, % 151 AA-AB: 250 NB to Split 8, % 10, % 159 AC-AF: L. Sandridge Rd NB, between Ramps 1, % 3, % 160 AF-AC: L. Sandridge Rd SB, between Ramps % 4, % 161 AF-AJ: L. Sandridge Rd NB ramp to Proposed Bypass NB % 3, % 162 AI-AF: Proposed Bypass SB ramp to L. Sandridge Rd SB % 2, % 109 Route 250 SB/WB Mainline (btwn Ivy Rd & Barracks Rd) - Ex & NB 24, % 25, % 35, % 151 Route 250 SB/WB Mainline (btwn Ivy Rd & 29 Bypass) - Build 25, % 35, % 110 Route 250 NB/EB Mainline (btwn Ivy Rd & L. Sandridge Rd) - Ex & NB 24, % 25, % 35, % 110 Route 250 NB/EB Mainline (btwn L. Sandridge Rd & Barracks Rd) - Ex & NB 24, % 25, % 35, % 158 Route 250 NB/EB Mainline (btwn Ivy Rd & 29 Bypass) - Build 25, % 35, % 191 Route 250 SB Off-Ramp (loop) to Ivy Rd 6, % 6, % 5, % 6, % 6, % 192 Route 250 SB On-Ramp from Ivy Rd 3, % 3, % 4, % 5, % 5, % 193 Route 250 NB Off-Ramp to Ivy Rd 3, % 3, % 4, % 5, % 5, % 194 Route 250 NB On-Ramp (loop) from Ivy Rd 6, % 6, % 5, % 6, % 6, % 119 Proposed Bypass NB (South Terminus to North Terminus) 8, % 13, % 120 Proposed Bypass SB (North Terminus to South Terminus) 8, % 13, % 136 Ramp 136: Prop Bypass NB to US 29 SB % 4, % 135 Ramp 135: Prop Bypass NB to US 29 NB 7, % 9, % 133 Ramp 133: US 29 SB to Prop Bypass SB 7, % 9, % 134 Ramp 134: US 29 NB to Prop Bypass SB (left-exit ramp) 1, % 4, % 2 29 NB, north of Prop Bypass (south of Hollymead) 24, % 25, % 29, % 33, % 37, % 1 29 SB, north of Prop Bypass (south of Hollymead) 24, % 25, % 29, % 33, % 37, % 3 29 Seminole Tr: Polo Grounds Rd to Prop. Bypass (NB) 24, % 26, % 22, % 36, % 32, % 4 29 Seminole Tr: Polo Grounds Rd to Prop. Bypass (SB) 24, % 26, % 22, % 36, % 32, % Seminole Tr between ramps (NB) 8, % 13, % Seminole Tr between ramps (SB) 21, % 28, % /250: Prop Bypass to Barracks Road (SB) 24, % 25, % 17, % 35, % 26, % 70 29/250: Barracks Road to Emmet Street (NB) 19, % 20, % 13, % 29, % 20, % 69 29/250: Barracks Road to Emmet Street (SB) 19, % 20, % 13, % 29, % 20, % Seminole Tr: US 250 to Angus Rd (NB) 26, % 28, % 18, % 42, % 32, % Seminole Tr: US 250 to Angus Rd (SB) 26, % 28, % 18, % 42, % 32, % Seminole Tr: Angus Rd to Hydraulic Rd (NB) 26, % 28, % 18, % 41, % 31, % Seminole Tr: Angus Rd to Hydraulic Rd (SB) 26, % 28, % 18, % 41, % 31, % Seminole Tr: Hydraulic Rd to Greenbrier Dr (NB) 28, % 30, % 22, % 41, % 33, % Seminole Tr: Hydraulic Rd to Greenbrier Dr (SB) 28, % 30, % 22, % 41, % 33, % Seminole Tr: Greenbrier Dr to Dominion Dr (NB) 28, % 30, % 20, % 42, % 31, % Seminole Tr: Greenbrier Dr to Dominion Dr (SB) 28, % 30, % 20, % 42, % 31, % Seminole Tr: Dominion Dr to Berkmar Dr (NB) 28, % 30, % 19, % 40, % 29, % Seminole Tr: Dominion Dr to Berkmar Dr (SB) 28, % 30, % 19, % 40, % 29, % Seminole Tr: Berkmar Dr to Rio Rd (NB) 24, % 25, % 18, % 32, % 25, % Seminole Tr: Berkmar Dr to Rio Rd (SB) 24, % 25, % 18, % 32, % 25, % 9 29 Seminole Tr: Rio Rd to Woodbrook Dr (NB) 24, % 26, % 20, % 40, % 34, % Seminole Tr: Rio Rd to Woodbrook Dr (SB) 24, % 26, % 20, % 40, % 34, % 7 29 Seminole Tr: Woodbrook to Carrsbrook/Hilton Hghts (NB) 24, % 26, % 20, % 38, % 32, % 8 29 Seminole Tr: Woodbrook to Carrsbrook/Hilton Hghts (SB) 24, % 26, % 20, % 38, % 32, % 5 29 Seminole Tr: Carrsbrook/Hilton Hghts to Polo Grounds (NB) 24, % 26, % 20, % 37, % 31, % 6 29 Seminole Tr: Carrsbrook/Hilton Hghts to Polo Grounds (SB) 24, % 26, % 20, % 37, % 31, % 3 29 Seminole Tr: Polo Grounds Rd to Prop. Bypass (NB) 24, % 26, % 22, % 36, % 32, % 4 29 Seminole Tr: Polo Grounds Rd to Prop. Bypass (SB) 24, % 26, % 22, % 36, % 32, %
267 ROUTE 29 BYPASS EA - AIR QUALITY ANALYSIS Intersection Hydraulic Road & Route 29 Greenbrier Drive & Route 29 Rio Drive & Route 29 Hilton Heights Road & Route 29 AM Peak Hour - Baseline Conditions Baseline AM Peak Hour EB WB NB SB Total Intersection LOS (Delay) 1,225 1,460 1,690 2,400 6,775 E (63.8) ,972 2,319 4,819 C (32.1) ,427 2,534 5,463 D (48.1) ,382 2,782 4,436 C (27.6) Intersection Hydraulic Road & Route 29 Greenbrier Drive & Route 29 Rio Drive & Route 29 Hilton Heights Road & Route 29 PM Peak Hour - Baseline Conditions Baseline PM Peak Hour EB WB NB SB Total Intersection LOS (Delay) 1,235 1,780 2,695 2,845 8,555 F (106.8) ,015 2,737 6,654 D (44.7) 796 1,470 2,938 2,388 7,592 F (129.7) ,823 1,769 5,369 D (47.2)
268 ROUTE 29 BYPASS EA - AIR QUALITY ANALYSIS Intersection Hydraulic Road & Route 29 Greenbrier Drive & Route 29 Rio Drive & Route 29 Hilton Heights Road & Route 29 AM Peak Hour Conditions 2015 No-Build AM Peak Hour Intersection 2015 Build AM Peak Hour EB WB NB SB Total LOS (Delay) EB WB NB SB Total Intersection LOS (Delay) 1,389 1,512 1,821 2,584 7,306 E (72.0) 1,077 1,493 1,166 1,909 5,645 D (52.7) ,073 2,644 5,254 D (35.2) ,557 1,765 4,080 D (39.2) 538 1,014 1,546 2,409 5,507 D (50.6) ,184 1,844 4,437 D (47.9) ,406 2,755 4,416 C (27.2) ,092 2,138 3,486 C (26.2) Intersection Hydraulic Road & Route 29 Greenbrier Drive & Route 29 Rio Drive & Route 29 Hilton Heights Road & Route 29 PM Peak Hour Conditions 2015 No-Build PM Peak Hour Intersection 2015 Build PM Peak Hour Intersection EB WB NB SB Total LOS (Delay) EB WB NB SB Total LOS (Delay) 1,403 1,904 2,663 2,685 8,655 F (115.4) 1,097 1,835 1,717 1,999 6,648 E (69.0) ,776 2,769 6,486 D (54.6) ,078 1,828 5,260 E (60.6) 749 1,537 2,757 1,869 6,912 F (97.5) 654 1,424 2,108 1,429 5,615 E (69.1) ,884 1,805 5,411 D (45.6) ,212 1,387 4,316 D (44.5)
269 ROUTE 29 BYPASS EA - AIR QUALITY ANALYSIS Intersection Hydraulic Road & Route 29 Greenbrier Drive & Route 29 Rio Drive & Route 29 Hilton Heights Road & Route 29 AM Peak Hour Conditions 2040 No-Build AM Peak Hour Intersection 2040 Build AM Peak Hour Intersection Rank EB WB NB SB Total LOS (Delay) EB WB NB SB Total LOS (Delay) Rank 2,220 1,774 2,667 3,521 10,182 F (189.9) 1 1,907 1,761 2,008 2,845 8,521 F (111.5) ,809 3,617 7,054 D (43.0) ,289 2,745 5,848 D (45.8) ,321 2,358 3,527 7,623 E (77.8) ,250 1,995 2,962 6,557 E (61.3) ,994 3,896 6,065 C (30.1) ,684 3,277 5,136 C (24.3) 4 Intersection Hydraulic Road & Route 29 Greenbrier Drive & Route 29 Rio Drive & Route 29 Hilton Heights Road & Route 29 PM Peak Hour Conditions 2040 No-Build PM Peak Hour Intersection 2040 Build PM Peak Hour Intersection Rank EB WB NB SB Total LOS (Delay) EB WB NB SB Total LOS (Delay) Rank 2,241 2,164 3,897 3,661 11,963 F (279.8) 1 1,936 2,157 2,949 2,974 10,016 F (180.9) ,769 3,798 8,694 F (120.9) 3 1, ,067 2,860 7,466 F (115.3) ,988 4,177 2,717 9,459 F (220.1) ,876 3,526 2,276 8,161 F (176.3) ,234 2,611 7,303 E (68.6) ,562 2,193 6,210 D (43.6) 4
270 Lanes, Volumes, Timings 3: Hydraulic Rd & Route 29 5/23/2012 Lane Group EBL EBT EBR WBL WBT WBR NBL NBT NBR SBL SBT SBR Lane Configurations Volume (vph) Ideal Flow (vphpl) Lane Width (ft) Grade (%) 0% 0% 0% 0% Storage Length (ft) Storage Lanes Taper Length (ft) Satd. Flow (prot) Flt Permitted Satd. Flow (perm) Right Turn on Red Yes Yes Yes Yes Satd. Flow (RTOR) Link Speed (mph) Link Distance (ft) Travel Time (s) Adj. Flow (vph) Lane Group Flow (vph) Turn Type pm+pt Perm pm+pt Perm Prot Prot Perm Protected Phases Permitted Phases Detector Phase Switch Phase Minimum Initial (s) Minimum Split (s) Total Split (s) Total Split (%) 10.0% 25.6% 25.6% 11.7% 27.2% 27.2% 18.3% 40.6% 0.0% 22.2% 44.4% 44.4% Yellow Time (s) All-Red Time (s) Lost Time Adjust (s) Total Lost Time (s) Lead/Lag Lead Lag Lag Lead Lag Lag Lead Lag Lead Lag Lag Lead-Lag Optimize? Recall Mode None None None None None None None C-Max None C-Max C-Max Act Effct Green (s) Actuated g/c Ratio v/c Ratio Control Delay Queue Delay Total Delay LOS E F D F E B F D F E B Approach Delay Approach LOS E D E E Intersection Summary Area Type: Other Cycle Length: 180 Actuated Cycle Length: 180 Offset: 0 (0%), Referenced to phase 2:NBT and 6:SBT, Start of Green Baseline Synchro 7 - Report %user_name% Page 1
271 Lanes, Volumes, Timings 3: Hydraulic Rd & Route 29 5/23/2012 Natural Cycle: 130 Control Type: Actuated-Coordinated Maximum v/c Ratio: 1.03 Intersection Signal Delay: 63.8 Intersection Capacity Utilization 98.6% Analysis Period (min) 15 Intersection LOS: E ICU Level of Service F Splits and Phases: 3: Hydraulic Rd & Route 29 Baseline Synchro 7 - Report %user_name% Page 2
272 Lanes, Volumes, Timings 9: Greenbrier Dr & 5/23/2012 Lane Group EBL EBT EBR WBL WBT WBR NBL NBT NBR SBL SBT SBR Lane Configurations Volume (vph) Ideal Flow (vphpl) Lane Width (ft) Grade (%) 0% 0% 0% 0% Storage Length (ft) Storage Lanes Taper Length (ft) Satd. Flow (prot) Flt Permitted Satd. Flow (perm) Right Turn on Red Yes Yes Yes Yes Satd. Flow (RTOR) Link Speed (mph) Link Distance (ft) Travel Time (s) Adj. Flow (vph) Lane Group Flow (vph) Turn Type pm+pt Perm pm+pt Prot Prot Perm Protected Phases Permitted Phases Detector Phase Switch Phase Minimum Initial (s) Minimum Split (s) Total Split (s) Total Split (%) 10.0% 13.9% 13.9% 17.2% 21.1% 0.0% 12.8% 55.6% 0.0% 13.3% 56.1% 56.1% Yellow Time (s) All-Red Time (s) Lost Time Adjust (s) Total Lost Time (s) Lead/Lag Lead Lag Lag Lead Lag Lead Lag Lead Lag Lag Lead-Lag Optimize? Recall Mode None None None None None None C-Max None C-Max C-Max Act Effct Green (s) Actuated g/c Ratio v/c Ratio Control Delay Queue Delay Total Delay LOS E F C E E F C F C A Approach Delay Approach LOS E E C C Intersection Summary Area Type: Other Cycle Length: 180 Actuated Cycle Length: 180 Offset: 0 (0%), Referenced to phase 2:NBT and 6:SBT, Start of Green Baseline Synchro 7 - Report %user_name% Page 3
273 Lanes, Volumes, Timings 9: Greenbrier Dr & 5/23/2012 Natural Cycle: 80 Control Type: Actuated-Coordinated Maximum v/c Ratio: 0.64 Intersection Signal Delay: 32.1 Intersection Capacity Utilization 70.1% Analysis Period (min) 15 Intersection LOS: C ICU Level of Service C Splits and Phases: 9: Greenbrier Dr & Baseline Synchro 7 - Report %user_name% Page 4
274 Lanes, Volumes, Timings 14: Rio Rd & Route 29 5/23/2012 Lane Group EBL EBT EBR WBL WBT WBR NBL NBT NBR SBL SBT SBR Lane Configurations Volume (vph) Ideal Flow (vphpl) Lane Width (ft) Grade (%) 0% 0% 0% 0% Storage Length (ft) Storage Lanes Taper Length (ft) Satd. Flow (prot) Flt Permitted Satd. Flow (perm) Right Turn on Red Yes Yes Yes Yes Satd. Flow (RTOR) Link Speed (mph) Link Distance (ft) Travel Time (s) Adj. Flow (vph) Lane Group Flow (vph) Turn Type Prot Perm Prot Perm Prot Perm Prot Perm Protected Phases Permitted Phases Detector Phase Switch Phase Minimum Initial (s) Minimum Split (s) Total Split (s) Total Split (%) 11.7% 18.3% 18.3% 15.0% 21.7% 21.7% 9.4% 28.9% 28.9% 37.8% 57.2% 57.2% Yellow Time (s) All-Red Time (s) Lost Time Adjust (s) Total Lost Time (s) Lead/Lag Lead Lag Lag Lead Lag Lag Lead Lag Lag Lead Lag Lag Lead-Lag Optimize? Recall Mode None None None None None None None C-Max C-Max None C-Max C-Max Act Effct Green (s) Actuated g/c Ratio v/c Ratio Control Delay Queue Delay Total Delay LOS F F B F E B F D A F C A Approach Delay Approach LOS F E D D Intersection Summary Area Type: Other Cycle Length: 180 Actuated Cycle Length: 180 Offset: 0 (0%), Referenced to phase 2:NBT and 6:SBT, Start of Green Baseline Synchro 7 - Report %user_name% Page 5
275 Lanes, Volumes, Timings 14: Rio Rd & Route 29 5/23/2012 Natural Cycle: 90 Control Type: Actuated-Coordinated Maximum v/c Ratio: 0.90 Intersection Signal Delay: 48.1 Intersection Capacity Utilization 79.8% Analysis Period (min) 15 Intersection LOS: D ICU Level of Service D Splits and Phases: 14: Rio Rd & Route 29 Baseline Synchro 7 - Report %user_name% Page 6
276 Lanes, Volumes, Timings 19: Hilton Heights Rd & Route 29 5/23/2012 Lane Group EBL EBT EBR WBL WBT WBR NBL NBT NBR SBL SBT SBR Lane Configurations Volume (vph) Ideal Flow (vphpl) Lane Width (ft) Grade (%) 0% 0% 0% 0% Storage Length (ft) Storage Lanes Taper Length (ft) Satd. Flow (prot) Flt Permitted Satd. Flow (perm) Right Turn on Red Yes Yes Yes Yes Satd. Flow (RTOR) Link Speed (mph) Link Distance (ft) Travel Time (s) Adj. Flow (vph) Lane Group Flow (vph) Turn Type Split Perm Split Prot Prot Perm Protected Phases Permitted Phases 4 6 Detector Phase Switch Phase Minimum Initial (s) Minimum Split (s) Total Split (s) Total Split (%) 13.9% 13.9% 13.9% 13.3% 13.3% 0.0% 14.4% 62.8% 0.0% 10.0% 58.3% 58.3% Yellow Time (s) All-Red Time (s) Lost Time Adjust (s) Total Lost Time (s) Lead/Lag Lead Lag Lead Lag Lag Lead-Lag Optimize? Recall Mode None None None None None None C-Max None C-Max C-Max Act Effct Green (s) Actuated g/c Ratio v/c Ratio Control Delay Queue Delay Total Delay LOS F F C F F B F C A Approach Delay Approach LOS E F C C Intersection Summary Area Type: Other Cycle Length: 180 Actuated Cycle Length: 180 Offset: 0 (0%), Referenced to phase 2:NBT and 6:SBT, Start of Green Baseline Synchro 7 - Report %user_name% Page 7
277 Lanes, Volumes, Timings 19: Hilton Heights Rd & Route 29 5/23/2012 Natural Cycle: 110 Control Type: Actuated-Coordinated Maximum v/c Ratio: 0.69 Intersection Signal Delay: 27.6 Intersection Capacity Utilization 68.8% Analysis Period (min) 15 Intersection LOS: C ICU Level of Service C Splits and Phases: 19: Hilton Heights Rd & Route 29 Baseline Synchro 7 - Report %user_name% Page 8
278 Lanes, Volumes, Timings 3: Hydraulic Rd & Route 29 5/23/2012 Lane Group EBL EBT EBR WBL WBT WBR NBL NBT NBR SBL SBT SBR Lane Configurations Volume (vph) Ideal Flow (vphpl) Lane Width (ft) Grade (%) 0% 0% 0% 0% Storage Length (ft) Storage Lanes Taper Length (ft) Lane Util. Factor Ped Bike Factor Frt Flt Protected Satd. Flow (prot) Flt Permitted Satd. Flow (perm) Right Turn on Red Yes Yes Yes Yes Satd. Flow (RTOR) Link Speed (mph) Link Distance (ft) Travel Time (s) Lane Group Flow (vph) Turn Type pm+pt Perm pm+pt Perm Prot Prot Perm Protected Phases Permitted Phases Detector Phase Switch Phase Minimum Initial (s) Minimum Split (s) Total Split (s) Total Split (%) 11.1% 21.7% 21.7% 12.2% 22.8% 22.8% 21.7% 43.3% 0.0% 22.8% 44.4% 44.4% Yellow Time (s) All-Red Time (s) Lost Time Adjust (s) Total Lost Time (s) Lead/Lag Lead Lag Lag Lead Lag Lag Lead Lag Lead Lag Lag Lead-Lag Optimize? Recall Mode None None None None None None None C-Max None C-Max C-Max Act Effct Green (s) Actuated g/c Ratio v/c Ratio Control Delay Queue Delay Total Delay LOS F F C F F D F F F E B Approach Delay Approach LOS F F F F Intersection Summary Area Type: Other Baseline Synchro 7 - Report %user_name% Page 1
279 Lanes, Volumes, Timings 3: Hydraulic Rd & Route 29 5/23/2012 Cycle Length: 180 Actuated Cycle Length: 180 Offset: 0 (0%), Referenced to phase 2:NBT and 6:SBT, Start of Green Natural Cycle: 150 Control Type: Actuated-Coordinated Maximum v/c Ratio: 1.35 Intersection Signal Delay: Intersection LOS: F Intersection Capacity Utilization 116.7% ICU Level of Service H Analysis Period (min) 15 Splits and Phases: 3: Hydraulic Rd & Route 29 Baseline Synchro 7 - Report %user_name% Page 2
280 Lanes, Volumes, Timings 9: Greenbrier Dr & 5/23/2012 Lane Group EBL EBT EBR WBL WBT WBR NBL NBT NBR SBL SBT SBR Lane Configurations Volume (vph) Ideal Flow (vphpl) Lane Width (ft) Grade (%) 0% 0% 0% 0% Storage Length (ft) Storage Lanes Taper Length (ft) Lane Util. Factor Ped Bike Factor Frt Flt Protected Satd. Flow (prot) Flt Permitted Satd. Flow (perm) Right Turn on Red Yes Yes Yes Yes Satd. Flow (RTOR) Link Speed (mph) Link Distance (ft) Travel Time (s) Lane Group Flow (vph) Turn Type pm+pt Perm pm+pt Prot Prot Perm Protected Phases Permitted Phases Detector Phase Switch Phase Minimum Initial (s) Minimum Split (s) Total Split (s) Total Split (%) 15.0% 16.1% 16.1% 13.9% 15.0% 0.0% 17.8% 60.6% 0.0% 9.4% 52.2% 52.2% Yellow Time (s) All-Red Time (s) Lost Time Adjust (s) Total Lost Time (s) Lead/Lag Lead Lag Lag Lead Lag Lead Lag Lead Lag Lag Lead-Lag Optimize? Recall Mode None None None None None None C-Max None C-Max C-Max Act Effct Green (s) Actuated g/c Ratio v/c Ratio Control Delay Queue Delay Total Delay LOS F F C F F F C F D B Approach Delay Approach LOS E F C D Intersection Summary Area Type: Other Baseline Synchro 7 - Report %user_name% Page 3
281 Lanes, Volumes, Timings 9: Greenbrier Dr & 5/23/2012 Cycle Length: 180 Actuated Cycle Length: 180 Offset: 0 (0%), Referenced to phase 2:NBT and 6:SBT, Start of Green Natural Cycle: 100 Control Type: Actuated-Coordinated Maximum v/c Ratio: 0.89 Intersection Signal Delay: 44.7 Intersection LOS: D Intersection Capacity Utilization 91.1% ICU Level of Service F Analysis Period (min) 15 Splits and Phases: 9: Greenbrier Dr & Baseline Synchro 7 - Report %user_name% Page 4
282 Lanes, Volumes, Timings 14: Rio Rd & Route 29 5/23/2012 Lane Group EBL EBT EBR WBL WBT WBR NBL NBT NBR SBL SBT SBR Lane Configurations Volume (vph) Ideal Flow (vphpl) Lane Width (ft) Grade (%) 0% 0% 0% 0% Storage Length (ft) Storage Lanes Taper Length (ft) Lane Util. Factor Ped Bike Factor Frt Flt Protected Satd. Flow (prot) Flt Permitted Satd. Flow (perm) Right Turn on Red Yes Yes Yes Yes Satd. Flow (RTOR) Link Speed (mph) Link Distance (ft) Travel Time (s) Lane Group Flow (vph) Turn Type Prot Perm Prot Perm Prot Perm Prot Perm Protected Phases Permitted Phases Detector Phase Switch Phase Minimum Initial (s) Minimum Split (s) Total Split (s) Total Split (%) 10.6% 15.6% 15.6% 12.8% 17.8% 17.8% 10.0% 39.4% 39.4% 32.2% 61.7% 61.7% Yellow Time (s) All-Red Time (s) Lost Time Adjust (s) Total Lost Time (s) Lead/Lag Lead Lag Lag Lead Lag Lag Lead Lag Lag Lead Lag Lag Lead-Lag Optimize? Recall Mode None None None None None None None C-Max C-Max None C-Max C-Max Act Effct Green (s) Actuated g/c Ratio v/c Ratio Control Delay Queue Delay Total Delay LOS F F C F F F F F B F C A Approach Delay Approach LOS F F F E Intersection Summary Area Type: Other Baseline Synchro 7 - Report %user_name% Page 5
283 Lanes, Volumes, Timings 14: Rio Rd & Route 29 5/23/2012 Cycle Length: 180 Actuated Cycle Length: 180 Offset: 0 (0%), Referenced to phase 2:NBT and 6:SBT, Start of Green Natural Cycle: 150 Control Type: Actuated-Coordinated Maximum v/c Ratio: 1.38 Intersection Signal Delay: Intersection LOS: F Intersection Capacity Utilization 120.0% ICU Level of Service H Analysis Period (min) 15 Splits and Phases: 14: Rio Rd & Route 29 Baseline Synchro 7 - Report %user_name% Page 6
284 Lanes, Volumes, Timings 19: Hilton Heights Rd & Route 29 5/23/2012 Lane Group EBL EBT EBR WBL WBT WBR NBL NBT NBR SBL SBT SBR Lane Configurations Volume (vph) Ideal Flow (vphpl) Lane Width (ft) Grade (%) 0% 0% 0% 0% Storage Length (ft) Storage Lanes Taper Length (ft) Lane Util. Factor Ped Bike Factor Frt Flt Protected Satd. Flow (prot) Flt Permitted Satd. Flow (perm) Right Turn on Red Yes Yes Yes Yes Satd. Flow (RTOR) Link Speed (mph) Link Distance (ft) Travel Time (s) Lane Group Flow (vph) Turn Type Split Perm Split Prot Prot Perm Protected Phases Permitted Phases 4 6 Detector Phase Switch Phase Minimum Initial (s) Minimum Split (s) Total Split (s) Total Split (%) 25.0% 25.0% 25.0% 14.4% 14.4% 0.0% 16.7% 52.8% 0.0% 7.8% 43.9% 43.9% Yellow Time (s) All-Red Time (s) Lost Time Adjust (s) Total Lost Time (s) Lead/Lag Lead Lag Lead Lag Lag Lead-Lag Optimize? Recall Mode None None None None None None C-Max None C-Max C-Max Act Effct Green (s) Actuated g/c Ratio v/c Ratio Control Delay Queue Delay Total Delay LOS F F B F F D F D B Approach Delay Approach LOS E F D D Intersection Summary Area Type: Other Baseline Synchro 7 - Report %user_name% Page 7
285 Lanes, Volumes, Timings 19: Hilton Heights Rd & Route 29 5/23/2012 Cycle Length: 180 Actuated Cycle Length: 180 Offset: 0 (0%), Referenced to phase 2:NBT and 6:SBT, Start of Green Natural Cycle: 105 Control Type: Actuated-Coordinated Maximum v/c Ratio: 0.87 Intersection Signal Delay: 47.2 Intersection LOS: D Intersection Capacity Utilization 75.9% ICU Level of Service D Analysis Period (min) 15 Splits and Phases: 19: Hilton Heights Rd & Route 29 Baseline Synchro 7 - Report %user_name% Page 8
286 Lanes, Volumes, Timings 3: Hydraulic Rd & Route 29 5/23/2012 Lane Group EBL EBT EBR WBL WBT WBR NBL NBT NBR SBL SBT SBR Lane Configurations Volume (vph) Ideal Flow (vphpl) Lane Width (ft) Grade (%) 0% 0% 0% 0% Storage Length (ft) Storage Lanes Taper Length (ft) Lane Util. Factor Ped Bike Factor Frt Flt Protected Satd. Flow (prot) Flt Permitted Satd. Flow (perm) Right Turn on Red Yes Yes Yes Yes Satd. Flow (RTOR) Link Speed (mph) Link Distance (ft) Travel Time (s) Lane Group Flow (vph) Turn Type pm+pt Perm pm+pt Perm Prot Prot Perm Protected Phases Permitted Phases Detector Phase Switch Phase Minimum Initial (s) Minimum Split (s) Total Split (s) Total Split (%) 10.6% 26.1% 26.1% 10.0% 25.6% 25.6% 19.4% 39.4% 0.0% 24.4% 44.4% 44.4% Yellow Time (s) All-Red Time (s) Lost Time Adjust (s) Total Lost Time (s) Lead/Lag Lead Lag Lag Lead Lag Lag Lead Lag Lead Lag Lag Lead-Lag Optimize? Recall Mode None None None None None None None C-Max None C-Max C-Max Act Effct Green (s) Actuated g/c Ratio v/c Ratio Control Delay Queue Delay Total Delay LOS F F D F F B F D F E B Approach Delay Approach LOS F E E E Intersection Summary Area Type: Other Baseline Synchro 7 - Report %user_name% Page 1
287 Lanes, Volumes, Timings 3: Hydraulic Rd & Route 29 5/23/2012 Cycle Length: 180 Actuated Cycle Length: 180 Offset: 0 (0%), Referenced to phase 2:NBT and 6:SBT, Start of Green Natural Cycle: 150 Control Type: Actuated-Coordinated Maximum v/c Ratio: 1.09 Intersection Signal Delay: 72.0 Intersection LOS: E Intersection Capacity Utilization 103.3% ICU Level of Service G Analysis Period (min) 15 Splits and Phases: 3: Hydraulic Rd & Route 29 Baseline Synchro 7 - Report %user_name% Page 2
288 Lanes, Volumes, Timings 9: Greenbrier Dr & 5/23/2012 Lane Group EBL EBT EBR WBL WBT WBR NBL NBT NBR SBL SBT SBR Lane Configurations Volume (vph) Ideal Flow (vphpl) Lane Width (ft) Grade (%) 0% 0% 0% 0% Storage Length (ft) Storage Lanes Taper Length (ft) Lane Util. Factor Ped Bike Factor Frt Flt Protected Satd. Flow (prot) Flt Permitted Satd. Flow (perm) Right Turn on Red Yes Yes Yes Yes Satd. Flow (RTOR) Link Speed (mph) Link Distance (ft) Travel Time (s) Lane Group Flow (vph) Turn Type pm+pt Perm pm+pt Prot Prot Perm Protected Phases Permitted Phases Detector Phase Switch Phase Minimum Initial (s) Minimum Split (s) Total Split (s) Total Split (%) 12.8% 18.9% 18.9% 12.8% 18.9% 0.0% 10.0% 51.7% 0.0% 16.7% 58.3% 58.3% Yellow Time (s) All-Red Time (s) Lost Time Adjust (s) Total Lost Time (s) Lead/Lag Lead Lag Lag Lead Lag Lead Lag Lead Lag Lag Lead-Lag Optimize? Recall Mode None None None None None None C-Max None C-Max C-Max Act Effct Green (s) Actuated g/c Ratio v/c Ratio Control Delay Queue Delay Total Delay LOS E E B E F F C F C A Approach Delay Approach LOS E F C C Intersection Summary Area Type: Other Baseline Synchro 7 - Report %user_name% Page 3
289 Lanes, Volumes, Timings 9: Greenbrier Dr & 5/23/2012 Cycle Length: 180 Actuated Cycle Length: 180 Offset: 0 (0%), Referenced to phase 2:NBT and 6:SBT, Start of Green Natural Cycle: 105 Control Type: Actuated-Coordinated Maximum v/c Ratio: 0.77 Intersection Signal Delay: 35.2 Intersection LOS: D Intersection Capacity Utilization 77.4% ICU Level of Service D Analysis Period (min) 15 Splits and Phases: 9: Greenbrier Dr & Baseline Synchro 7 - Report %user_name% Page 4
290 Lanes, Volumes, Timings 14: Rio Rd & Route 29 5/23/2012 Lane Group EBL EBT EBR WBL WBT WBR NBL NBT NBR SBL SBT SBR Lane Configurations Volume (vph) Ideal Flow (vphpl) Lane Width (ft) Grade (%) 0% 0% 0% 0% Storage Length (ft) Storage Lanes Taper Length (ft) Lane Util. Factor Ped Bike Factor Frt Flt Protected Satd. Flow (prot) Flt Permitted Satd. Flow (perm) Right Turn on Red Yes Yes Yes Yes Satd. Flow (RTOR) Link Speed (mph) Link Distance (ft) Travel Time (s) Lane Group Flow (vph) Turn Type Prot Perm Prot Perm Prot Perm Prot Perm Protected Phases Permitted Phases Detector Phase Switch Phase Minimum Initial (s) Minimum Split (s) Total Split (s) Total Split (%) 9.4% 17.2% 17.2% 20.0% 27.8% 27.8% 10.0% 30.0% 30.0% 32.8% 52.8% 52.8% Yellow Time (s) All-Red Time (s) Lost Time Adjust (s) Total Lost Time (s) Lead/Lag Lead Lag Lag Lead Lag Lag Lead Lag Lag Lead Lag Lag Lead-Lag Optimize? Recall Mode None None None None None None None C-Max C-Max None C-Max C-Max Act Effct Green (s) Actuated g/c Ratio v/c Ratio Control Delay Queue Delay Total Delay LOS F F B F E A F D A F C B Approach Delay Approach LOS E E D D Intersection Summary Area Type: Other Baseline Synchro 7 - Report %user_name% Page 5
291 Lanes, Volumes, Timings 14: Rio Rd & Route 29 5/23/2012 Cycle Length: 180 Actuated Cycle Length: 180 Offset: 0 (0%), Referenced to phase 2:NBT and 6:SBT, Start of Green Natural Cycle: 90 Control Type: Actuated-Coordinated Maximum v/c Ratio: 0.89 Intersection Signal Delay: 50.6 Intersection LOS: D Intersection Capacity Utilization 81.1% ICU Level of Service D Analysis Period (min) 15 Splits and Phases: 14: Rio Rd & Route 29 Baseline Synchro 7 - Report %user_name% Page 6
292 Lanes, Volumes, Timings 19: Hilton Heights Rd & Route 29 5/23/2012 Lane Group EBL EBT EBR WBL WBT WBR NBL NBT NBR SBL SBT SBR Lane Configurations Volume (vph) Ideal Flow (vphpl) Lane Width (ft) Grade (%) 0% 0% 0% 0% Storage Length (ft) Storage Lanes Taper Length (ft) Lane Util. Factor Ped Bike Factor Frt Flt Protected Satd. Flow (prot) Flt Permitted Satd. Flow (perm) Right Turn on Red Yes Yes Yes Yes Satd. Flow (RTOR) Link Speed (mph) Link Distance (ft) Travel Time (s) Lane Group Flow (vph) Turn Type Split Perm Split Prot Prot Perm Protected Phases Permitted Phases 4 6 Detector Phase Switch Phase Minimum Initial (s) Minimum Split (s) Total Split (s) Total Split (%) 13.9% 13.9% 13.9% 13.3% 13.3% 0.0% 14.4% 63.3% 0.0% 9.4% 58.3% 58.3% Yellow Time (s) All-Red Time (s) Lost Time Adjust (s) Total Lost Time (s) Lead/Lag Lead Lag Lead Lag Lag Lead-Lag Optimize? Recall Mode None None None None None None C-Max None C-Max C-Max Act Effct Green (s) Actuated g/c Ratio v/c Ratio Control Delay Queue Delay Total Delay LOS F F C F F B F C A Approach Delay Approach LOS E F C C Intersection Summary Area Type: Other Baseline Synchro 7 - Report %user_name% Page 7
293 Lanes, Volumes, Timings 19: Hilton Heights Rd & Route 29 5/23/2012 Cycle Length: 180 Actuated Cycle Length: 180 Offset: 0 (0%), Referenced to phase 2:NBT and 6:SBT, Start of Green Natural Cycle: 105 Control Type: Actuated-Coordinated Maximum v/c Ratio: 0.69 Intersection Signal Delay: 27.2 Intersection LOS: C Intersection Capacity Utilization 69.5% ICU Level of Service C Analysis Period (min) 15 Splits and Phases: 19: Hilton Heights Rd & Route 29 Baseline Synchro 7 - Report %user_name% Page 8
294 Lanes, Volumes, Timings 3: Hydraulic Rd & Route 29 5/23/2012 Lane Group EBL EBT EBR WBL WBT WBR NBL NBT NBR SBL SBT SBR Lane Configurations Volume (vph) Ideal Flow (vphpl) Lane Width (ft) Grade (%) 0% 0% 0% 0% Storage Length (ft) Storage Lanes Taper Length (ft) Satd. Flow (prot) Flt Permitted Satd. Flow (perm) Right Turn on Red Yes Yes Yes Yes Satd. Flow (RTOR) Link Speed (mph) Link Distance (ft) Travel Time (s) Adj. Flow (vph) Lane Group Flow (vph) Turn Type pm+pt Perm pm+pt Perm Prot Prot Perm Protected Phases Permitted Phases Detector Phase Switch Phase Minimum Initial (s) Minimum Split (s) Total Split (s) Total Split (%) 11.7% 25.0% 25.0% 13.3% 26.7% 26.7% 21.1% 40.6% 0.0% 21.1% 40.6% 40.6% Yellow Time (s) All-Red Time (s) Lost Time Adjust (s) Total Lost Time (s) Lead/Lag Lead Lag Lag Lead Lag Lag Lead Lag Lead Lag Lag Lead-Lag Optimize? Recall Mode None None None None None None None C-Max None C-Max C-Max Act Effct Green (s) Actuated g/c Ratio v/c Ratio Control Delay Queue Delay Total Delay LOS F F D F F C F F F F C Approach Delay Approach LOS F F F F Intersection Summary Area Type: Other Cycle Length: 180 Actuated Cycle Length: 180 Offset: 0 (0%), Referenced to phase 2:NBT and 6:SBT, Start of Green Baseline Synchro 7 - Report %user_name% Page 1
295 Lanes, Volumes, Timings 3: Hydraulic Rd & Route 29 5/23/2012 Natural Cycle: 150 Control Type: Actuated-Coordinated Maximum v/c Ratio: 1.32 Intersection Signal Delay: Intersection Capacity Utilization 118.0% Analysis Period (min) 15 Intersection LOS: F ICU Level of Service H Splits and Phases: 3: Hydraulic Rd & Route 29 Baseline Synchro 7 - Report %user_name% Page 2
296 Lanes, Volumes, Timings 9: Greenbrier Dr & 5/23/2012 Lane Group EBL EBT EBR WBL WBT WBR NBL NBT NBR SBL SBT SBR Lane Configurations Volume (vph) Ideal Flow (vphpl) Lane Width (ft) Grade (%) 0% 0% 0% 0% Storage Length (ft) Storage Lanes Taper Length (ft) Satd. Flow (prot) Flt Permitted Satd. Flow (perm) Right Turn on Red Yes Yes Yes Yes Satd. Flow (RTOR) Link Speed (mph) Link Distance (ft) Travel Time (s) Adj. Flow (vph) Lane Group Flow (vph) Turn Type pm+pt Perm pm+pt Prot Prot Perm Protected Phases Permitted Phases Detector Phase Switch Phase Minimum Initial (s) Minimum Split (s) Total Split (s) Total Split (%) 20.6% 24.4% 24.4% 12.8% 16.7% 0.0% 13.9% 50.6% 0.0% 12.2% 48.9% 48.9% Yellow Time (s) All-Red Time (s) Lost Time Adjust (s) Total Lost Time (s) Lead/Lag Lead Lag Lag Lead Lag Lead Lag Lead Lag Lag Lead-Lag Optimize? Recall Mode None None None None None None C-Max None C-Max C-Max Act Effct Green (s) Actuated g/c Ratio v/c Ratio Control Delay Queue Delay Total Delay LOS F E A D F F D F D B Approach Delay Approach LOS E F D D Intersection Summary Area Type: Other Cycle Length: 180 Actuated Cycle Length: 180 Offset: 0 (0%), Referenced to phase 2:NBT and 6:SBT, Start of Green Baseline Synchro 7 - Report %user_name% Page 3
297 Lanes, Volumes, Timings 9: Greenbrier Dr & 5/23/2012 Natural Cycle: 125 Control Type: Actuated-Coordinated Maximum v/c Ratio: 0.99 Intersection Signal Delay: 54.6 Intersection Capacity Utilization 96.4% Analysis Period (min) 15 Intersection LOS: D ICU Level of Service F Splits and Phases: 9: Greenbrier Dr & Baseline Synchro 7 - Report %user_name% Page 4
298 Lanes, Volumes, Timings 14: Rio Rd & Route 29 5/23/2012 Lane Group EBL EBT EBR WBL WBT WBR NBL NBT NBR SBL SBT SBR Lane Configurations Volume (vph) Ideal Flow (vphpl) Lane Width (ft) Grade (%) 0% 0% 0% 0% Storage Length (ft) Storage Lanes Taper Length (ft) Satd. Flow (prot) Flt Permitted Satd. Flow (perm) Right Turn on Red Yes Yes Yes Yes Satd. Flow (RTOR) Link Speed (mph) Link Distance (ft) Travel Time (s) Adj. Flow (vph) Lane Group Flow (vph) Turn Type Prot Perm Prot Perm Prot Perm Prot Perm Protected Phases Permitted Phases Detector Phase Switch Phase Minimum Initial (s) Minimum Split (s) Total Split (s) Total Split (%) 9.4% 15.6% 15.6% 17.8% 23.9% 23.9% 11.1% 37.8% 37.8% 28.9% 55.6% 55.6% Yellow Time (s) All-Red Time (s) Lost Time Adjust (s) Total Lost Time (s) Lead/Lag Lead Lag Lag Lead Lag Lag Lead Lag Lag Lead Lag Lag Lead-Lag Optimize? Recall Mode None None None None None None None C-Max C-Max None C-Max C-Max Act Effct Green (s) Actuated g/c Ratio v/c Ratio Control Delay Queue Delay Total Delay LOS F F C F F C F F B F C A Approach Delay Approach LOS F F F E Intersection Summary Area Type: Other Cycle Length: 180 Actuated Cycle Length: 180 Offset: 0 (0%), Referenced to phase 2:NBT and 6:SBT, Start of Green Baseline Synchro 7 - Report %user_name% Page 5
299 Lanes, Volumes, Timings 14: Rio Rd & Route 29 5/23/2012 Natural Cycle: 150 Control Type: Actuated-Coordinated Maximum v/c Ratio: 1.23 Intersection Signal Delay: 97.5 Intersection Capacity Utilization 112.0% Analysis Period (min) 15 Intersection LOS: F ICU Level of Service H Splits and Phases: 14: Rio Rd & Route 29 Baseline Synchro 7 - Report %user_name% Page 6
300 Lanes, Volumes, Timings 19: Hilton Heights Rd & Route 29 5/23/2012 Lane Group EBL EBT EBR WBL WBT WBR NBL NBT NBR SBL SBT SBR Lane Configurations Volume (vph) Ideal Flow (vphpl) Lane Width (ft) Grade (%) 0% 0% 0% 0% Storage Length (ft) Storage Lanes Taper Length (ft) Satd. Flow (prot) Flt Permitted Satd. Flow (perm) Right Turn on Red Yes Yes Yes Yes Satd. Flow (RTOR) Link Speed (mph) Link Distance (ft) Travel Time (s) Adj. Flow (vph) Lane Group Flow (vph) Turn Type Split Perm Split Prot Prot Perm Protected Phases Permitted Phases 4 6 Detector Phase Switch Phase Minimum Initial (s) Minimum Split (s) Total Split (s) Total Split (%) 23.3% 23.3% 23.3% 14.4% 14.4% 0.0% 15.6% 54.4% 0.0% 7.8% 46.7% 46.7% Yellow Time (s) All-Red Time (s) Lost Time Adjust (s) Total Lost Time (s) Lead/Lag Lead Lag Lead Lag Lag Lead-Lag Optimize? Recall Mode None None None None None None C-Max None C-Max C-Max Act Effct Green (s) Actuated g/c Ratio v/c Ratio Control Delay Queue Delay Total Delay LOS F F B F F D F D B Approach Delay Approach LOS E F D D Intersection Summary Area Type: Other Cycle Length: 180 Actuated Cycle Length: 180 Offset: 0 (0%), Referenced to phase 2:NBT and 6:SBT, Start of Green Baseline Synchro 7 - Report %user_name% Page 7
301 Lanes, Volumes, Timings 19: Hilton Heights Rd & Route 29 5/23/2012 Natural Cycle: 115 Control Type: Actuated-Coordinated Maximum v/c Ratio: 0.86 Intersection Signal Delay: 45.6 Intersection Capacity Utilization 75.6% Analysis Period (min) 15 Intersection LOS: D ICU Level of Service D Splits and Phases: 19: Hilton Heights Rd & Route 29 Baseline Synchro 7 - Report %user_name% Page 8
302 Lanes, Volumes, Timings 3: Hydraulic Rd & Route 29 5/23/2012 Lane Group EBL EBT EBR WBL WBT WBR NBL NBT NBR SBL SBT SBR Lane Configurations Volume (vph) Ideal Flow (vphpl) Lane Width (ft) Grade (%) 0% 0% 0% 0% Storage Length (ft) Storage Lanes Taper Length (ft) Satd. Flow (prot) Flt Permitted Satd. Flow (perm) Right Turn on Red Yes Yes Yes Yes Satd. Flow (RTOR) Link Speed (mph) Link Distance (ft) Travel Time (s) Adj. Flow (vph) Lane Group Flow (vph) Turn Type pm+pt Perm pm+pt Perm Prot Prot Perm Protected Phases Permitted Phases Detector Phase Switch Phase Minimum Initial (s) Minimum Split (s) Total Split (s) Total Split (%) 8.9% 31.7% 31.7% 14.4% 37.2% 37.2% 17.8% 27.8% 0.0% 26.1% 36.1% 36.1% Yellow Time (s) All-Red Time (s) Lost Time Adjust (s) Total Lost Time (s) Lead/Lag Lead Lag Lag Lead Lag Lag Lead Lag Lead Lag Lag Lead-Lag Optimize? Recall Mode None None None None None None None C-Max None C-Max C-Max Act Effct Green (s) Actuated g/c Ratio v/c Ratio Control Delay Queue Delay Total Delay LOS D E B E E A F E F D B Approach Delay Approach LOS E C E E Intersection Summary Area Type: Other Cycle Length: 180 Actuated Cycle Length: 180 Offset: 0 (0%), Referenced to phase 2:NBT and 6:SBT, Start of Green Baseline Synchro 7 - Report %user_name% Page 1
303 Lanes, Volumes, Timings 3: Hydraulic Rd & Route 29 5/23/2012 Natural Cycle: 90 Control Type: Actuated-Coordinated Maximum v/c Ratio: 0.87 Intersection Signal Delay: 52.7 Intersection Capacity Utilization 83.5% Analysis Period (min) 15 Intersection LOS: D ICU Level of Service E Splits and Phases: 3: Hydraulic Rd & Route 29 Baseline Synchro 7 - Report %user_name% Page 2
304 Lanes, Volumes, Timings 9: Greenbrier Dr & 5/23/2012 Lane Group EBL EBT EBR WBL WBT WBR NBL NBT NBR SBL SBT SBR Lane Configurations Volume (vph) Ideal Flow (vphpl) Lane Width (ft) Grade (%) 0% 0% 0% 0% Storage Length (ft) Storage Lanes Taper Length (ft) Satd. Flow (prot) Flt Permitted Satd. Flow (perm) Right Turn on Red Yes Yes Yes Yes Satd. Flow (RTOR) Link Speed (mph) Link Distance (ft) Travel Time (s) Adj. Flow (vph) Lane Group Flow (vph) Turn Type pm+pt Perm pm+pt Prot Prot Perm Protected Phases Permitted Phases Detector Phase Switch Phase Minimum Initial (s) Minimum Split (s) Total Split (s) Total Split (%) 12.2% 22.2% 22.2% 15.0% 25.0% 0.0% 17.2% 48.3% 0.0% 14.4% 45.6% 45.6% Yellow Time (s) All-Red Time (s) Lost Time Adjust (s) Total Lost Time (s) Lead/Lag Lead Lag Lag Lead Lag Lead Lag Lead Lag Lag Lead-Lag Optimize? Recall Mode None None None None None None C-Max None C-Max C-Max Act Effct Green (s) Actuated g/c Ratio v/c Ratio Control Delay Queue Delay Total Delay LOS E F B E F F C F C A Approach Delay Approach LOS D E C C Intersection Summary Area Type: Other Cycle Length: 180 Actuated Cycle Length: 180 Offset: 0 (0%), Referenced to phase 2:NBT and 6:SBT, Start of Green Baseline Synchro 7 - Report %user_name% Page 3
305 Lanes, Volumes, Timings 9: Greenbrier Dr & 5/23/2012 Natural Cycle: 85 Control Type: Actuated-Coordinated Maximum v/c Ratio: 0.80 Intersection Signal Delay: 39.2 Intersection Capacity Utilization 71.0% Analysis Period (min) 15 Intersection LOS: D ICU Level of Service C Splits and Phases: 9: Greenbrier Dr & Baseline Synchro 7 - Report %user_name% Page 4
306 Lanes, Volumes, Timings 14: Rio Rd & Route 29 5/23/2012 Lane Group EBL EBT EBR WBL WBT WBR NBL NBT NBR SBL SBT SBR Lane Configurations Volume (vph) Ideal Flow (vphpl) Lane Width (ft) Grade (%) 0% 0% 0% 0% Storage Length (ft) Storage Lanes Taper Length (ft) Satd. Flow (prot) Flt Permitted Satd. Flow (perm) Right Turn on Red Yes Yes Yes Yes Satd. Flow (RTOR) Link Speed (mph) Link Distance (ft) Travel Time (s) Adj. Flow (vph) Lane Group Flow (vph) Turn Type Prot Perm Prot Perm Prot Perm Prot Perm Protected Phases Permitted Phases Detector Phase Switch Phase Minimum Initial (s) Minimum Split (s) Total Split (s) Total Split (%) 8.3% 18.9% 18.9% 21.1% 31.7% 31.7% 8.9% 26.1% 26.1% 33.9% 51.1% 51.1% Yellow Time (s) All-Red Time (s) Lost Time Adjust (s) Total Lost Time (s) Lead/Lag Lead Lag Lag Lead Lag Lag Lead Lag Lag Lead Lag Lag Lead-Lag Optimize? Recall Mode None None None None None None None C-Max C-Max None C-Max C-Max Act Effct Green (s) Actuated g/c Ratio v/c Ratio Control Delay Queue Delay Total Delay LOS F F B F E A F D A F C A Approach Delay Approach LOS E E D D Intersection Summary Area Type: Other Cycle Length: 180 Actuated Cycle Length: 180 Offset: 0 (0%), Referenced to phase 2:NBT and 6:SBT, Start of Green Baseline Synchro 7 - Report %user_name% Page 5
307 Lanes, Volumes, Timings 14: Rio Rd & Route 29 5/23/2012 Natural Cycle: 90 Control Type: Actuated-Coordinated Maximum v/c Ratio: 0.87 Intersection Signal Delay: 47.9 Intersection Capacity Utilization 73.5% Analysis Period (min) 15 Intersection LOS: D ICU Level of Service D Splits and Phases: 14: Rio Rd & Route 29 Baseline Synchro 7 - Report %user_name% Page 6
308 Lanes, Volumes, Timings 19: Hilton Heights Rd & Route 29 5/23/2012 Lane Group EBL EBT EBR WBL WBT WBR NBL NBT NBR SBL SBT SBR Lane Configurations Volume (vph) Ideal Flow (vphpl) Lane Width (ft) Grade (%) 0% 0% 0% 0% Storage Length (ft) Storage Lanes Taper Length (ft) Satd. Flow (prot) Flt Permitted Satd. Flow (perm) Right Turn on Red Yes Yes Yes Yes Satd. Flow (RTOR) Link Speed (mph) Link Distance (ft) Travel Time (s) Adj. Flow (vph) Lane Group Flow (vph) Turn Type Split Perm Split Prot Prot Perm Protected Phases Permitted Phases 4 6 Detector Phase Switch Phase Minimum Initial (s) Minimum Split (s) Total Split (s) Total Split (%) 15.0% 15.0% 15.0% 14.4% 14.4% 0.0% 16.7% 59.4% 0.0% 11.1% 53.9% 53.9% Yellow Time (s) All-Red Time (s) Lost Time Adjust (s) Total Lost Time (s) Lead/Lag Lead Lag Lead Lag Lag Lead-Lag Optimize? Recall Mode None None None None None None C-Max None C-Max C-Max Act Effct Green (s) Actuated g/c Ratio v/c Ratio Control Delay Queue Delay Total Delay LOS F F C F F B F C A Approach Delay Approach LOS E F C C Intersection Summary Area Type: Other Cycle Length: 180 Actuated Cycle Length: 180 Offset: 0 (0%), Referenced to phase 2:NBT and 6:SBT, Start of Green Baseline Synchro 7 - Report %user_name% Page 7
309 Lanes, Volumes, Timings 19: Hilton Heights Rd & Route 29 5/23/2012 Natural Cycle: 95 Control Type: Actuated-Coordinated Maximum v/c Ratio: 0.67 Intersection Signal Delay: 26.2 Intersection Capacity Utilization 60.3% Analysis Period (min) 15 Intersection LOS: C ICU Level of Service B Splits and Phases: 19: Hilton Heights Rd & Route 29 Baseline Synchro 7 - Report %user_name% Page 8
310 Lanes, Volumes, Timings 3: Hydraulic Rd & Route 29 5/23/2012 Lane Group EBL EBT EBR WBL WBT WBR NBL NBT NBR SBL SBT SBR Lane Configurations Volume (vph) Ideal Flow (vphpl) Lane Width (ft) Grade (%) 0% 0% 0% 0% Storage Length (ft) Storage Lanes Taper Length (ft) Satd. Flow (prot) Flt Permitted Satd. Flow (perm) Right Turn on Red Yes Yes Yes Yes Satd. Flow (RTOR) Link Speed (mph) Link Distance (ft) Travel Time (s) Adj. Flow (vph) Lane Group Flow (vph) Turn Type pm+pt Perm pm+pt Perm Prot Prot Perm Protected Phases Permitted Phases Detector Phase Switch Phase Minimum Initial (s) Minimum Split (s) Total Split (s) Total Split (%) 10.6% 25.6% 25.6% 13.9% 28.9% 28.9% 20.6% 33.9% 0.0% 26.7% 40.0% 40.0% Yellow Time (s) All-Red Time (s) Lost Time Adjust (s) Total Lost Time (s) Lead/Lag Lead Lag Lag Lead Lag Lag Lead Lag Lead Lag Lag Lead-Lag Optimize? Recall Mode None None None None None None None C-Max None C-Max C-Max Act Effct Green (s) Actuated g/c Ratio v/c Ratio Control Delay Queue Delay Total Delay LOS F F B F F B F E F D B Approach Delay Approach LOS E E E E Intersection Summary Area Type: Other Cycle Length: 180 Actuated Cycle Length: 180 Offset: 0 (0%), Referenced to phase 2:NBT and 6:SBT, Start of Green Baseline Synchro 7 - Report %user_name% Page 1
311 Lanes, Volumes, Timings 3: Hydraulic Rd & Route 29 5/23/2012 Natural Cycle: 140 Control Type: Actuated-Coordinated Maximum v/c Ratio: 1.01 Intersection Signal Delay: 69.0 Intersection Capacity Utilization 99.7% Analysis Period (min) 15 Intersection LOS: E ICU Level of Service F Splits and Phases: 3: Hydraulic Rd & Route 29 Baseline Synchro 7 - Report %user_name% Page 2
312 Lanes, Volumes, Timings 9: Greenbrier Dr & 5/23/2012 Lane Group EBL EBT EBR WBL WBT WBR NBL NBT NBR SBL SBT SBR Lane Configurations Volume (vph) Ideal Flow (vphpl) Lane Width (ft) Grade (%) 0% 0% 0% 0% Storage Length (ft) Storage Lanes Taper Length (ft) Satd. Flow (prot) Flt Permitted Satd. Flow (perm) Right Turn on Red Yes Yes Yes Yes Satd. Flow (RTOR) Link Speed (mph) Link Distance (ft) Travel Time (s) Adj. Flow (vph) Lane Group Flow (vph) Turn Type pm+pt Perm pm+pt Prot Prot Perm Protected Phases Permitted Phases Detector Phase Switch Phase Minimum Initial (s) Minimum Split (s) Total Split (s) Total Split (%) 22.8% 31.7% 31.7% 12.8% 21.7% 0.0% 21.7% 46.7% 0.0% 8.9% 33.9% 33.9% Yellow Time (s) All-Red Time (s) Lost Time Adjust (s) Total Lost Time (s) Lead/Lag Lead Lag Lag Lead Lag Lead Lag Lead Lag Lag Lead-Lag Optimize? Recall Mode None None None None None None C-Max None C-Max C-Max Act Effct Green (s) Actuated g/c Ratio v/c Ratio Control Delay Queue Delay Total Delay LOS F E A D F F D F E B Approach Delay Approach LOS E F D E Intersection Summary Area Type: Other Cycle Length: 180 Actuated Cycle Length: 180 Offset: 0 (0%), Referenced to phase 2:NBT and 6:SBT, Start of Green Baseline Synchro 7 - Report %user_name% Page 3
313 Lanes, Volumes, Timings 9: Greenbrier Dr & 5/23/2012 Natural Cycle: 125 Control Type: Actuated-Coordinated Maximum v/c Ratio: 0.99 Intersection Signal Delay: 60.6 Intersection Capacity Utilization 96.6% Analysis Period (min) 15 Intersection LOS: E ICU Level of Service F Splits and Phases: 9: Greenbrier Dr & Baseline Synchro 7 - Report %user_name% Page 4
314 Lanes, Volumes, Timings 14: Rio Rd & Route 29 5/23/2012 Lane Group EBL EBT EBR WBL WBT WBR NBL NBT NBR SBL SBT SBR Lane Configurations Volume (vph) Ideal Flow (vphpl) Lane Width (ft) Grade (%) 0% 0% 0% 0% Storage Length (ft) Storage Lanes Taper Length (ft) Satd. Flow (prot) Flt Permitted Satd. Flow (perm) Right Turn on Red Yes Yes Yes Yes Satd. Flow (RTOR) Link Speed (mph) Link Distance (ft) Travel Time (s) Adj. Flow (vph) Lane Group Flow (vph) Turn Type Prot Perm Prot Perm Prot Perm Prot Perm Protected Phases Permitted Phases Detector Phase Switch Phase Minimum Initial (s) Minimum Split (s) Total Split (s) Total Split (%) 9.4% 16.7% 16.7% 18.9% 26.1% 26.1% 10.0% 33.3% 33.3% 31.1% 54.4% 54.4% Yellow Time (s) All-Red Time (s) Lost Time Adjust (s) Total Lost Time (s) Lead/Lag Lead Lag Lag Lead Lag Lag Lead Lag Lag Lead Lag Lag Lead-Lag Optimize? Recall Mode None None None None None None None C-Max C-Max None C-Max C-Max Act Effct Green (s) Actuated g/c Ratio v/c Ratio Control Delay Queue Delay Total Delay LOS F F B F E B F E B F C A Approach Delay Approach LOS F E E D Intersection Summary Area Type: Other Cycle Length: 180 Actuated Cycle Length: 180 Offset: 0 (0%), Referenced to phase 2:NBT and 6:SBT, Start of Green Baseline Synchro 7 - Report %user_name% Page 5
315 Lanes, Volumes, Timings 14: Rio Rd & Route 29 5/23/2012 Natural Cycle: 150 Control Type: Actuated-Coordinated Maximum v/c Ratio: 1.05 Intersection Signal Delay: 69.1 Intersection Capacity Utilization 99.1% Analysis Period (min) 15 Intersection LOS: E ICU Level of Service F Splits and Phases: 14: Rio Rd & Route 29 Baseline Synchro 7 - Report %user_name% Page 6
316 Lanes, Volumes, Timings 19: Hilton Heights Rd & Route 29 5/23/2012 Lane Group EBL EBT EBR WBL WBT WBR NBL NBT NBR SBL SBT SBR Lane Configurations Volume (vph) Ideal Flow (vphpl) Lane Width (ft) Grade (%) 0% 0% 0% 0% Storage Length (ft) Storage Lanes Taper Length (ft) Satd. Flow (prot) Flt Permitted Satd. Flow (perm) Right Turn on Red Yes Yes Yes Yes Satd. Flow (RTOR) Link Speed (mph) Link Distance (ft) Travel Time (s) Adj. Flow (vph) Lane Group Flow (vph) Turn Type Split Perm Split Prot Prot Perm Protected Phases Permitted Phases 4 6 Detector Phase Switch Phase Minimum Initial (s) Minimum Split (s) Total Split (s) Total Split (%) 26.7% 26.7% 26.7% 17.2% 17.2% 0.0% 15.6% 47.2% 0.0% 8.9% 40.6% 40.6% Yellow Time (s) All-Red Time (s) Lost Time Adjust (s) Total Lost Time (s) Lead/Lag Lead Lag Lead Lag Lag Lead-Lag Optimize? Recall Mode None None None None None None C-Max None C-Max C-Max Act Effct Green (s) Actuated g/c Ratio v/c Ratio Control Delay Queue Delay Total Delay LOS F F B F F C F D A Approach Delay Approach LOS E F D C Intersection Summary Area Type: Other Cycle Length: 180 Actuated Cycle Length: 180 Offset: 0 (0%), Referenced to phase 2:NBT and 6:SBT, Start of Green Baseline Synchro 7 - Report %user_name% Page 7
317 Lanes, Volumes, Timings 19: Hilton Heights Rd & Route 29 5/23/2012 Natural Cycle: 85 Control Type: Actuated-Coordinated Maximum v/c Ratio: 0.82 Intersection Signal Delay: 44.5 Intersection Capacity Utilization 66.6% Analysis Period (min) 15 Intersection LOS: D ICU Level of Service C Splits and Phases: 19: Hilton Heights Rd & Route 29 Baseline Synchro 7 - Report %user_name% Page 8
318 Lanes, Volumes, Timings 3: Hydraulic Rd & Route 29 5/23/2012 Lane Group EBL EBT EBR WBL WBT WBR NBL NBT NBR SBL SBT SBR Lane Configurations Volume (vph) Ideal Flow (vphpl) Lane Width (ft) Grade (%) 0% 0% 0% 0% Storage Length (ft) Storage Lanes Taper Length (ft) Satd. Flow (prot) Flt Permitted Satd. Flow (perm) Right Turn on Red Yes Yes Yes Yes Satd. Flow (RTOR) Link Speed (mph) Link Distance (ft) Travel Time (s) Adj. Flow (vph) Lane Group Flow (vph) Turn Type pm+pt Perm pm+pt Perm Prot Prot Perm Protected Phases Permitted Phases Detector Phase Switch Phase Minimum Initial (s) Minimum Split (s) Total Split (s) Total Split (%) 13.9% 30.6% 30.6% 7.2% 23.9% 23.9% 21.1% 43.3% 0.0% 18.9% 41.1% 41.1% Yellow Time (s) All-Red Time (s) Lost Time Adjust (s) Total Lost Time (s) Lead/Lag Lead Lag Lag Lead Lag Lag Lead Lag Lead Lag Lag Lead-Lag Optimize? Recall Mode None None None None None None None C-Max None C-Max C-Max Act Effct Green (s) Actuated g/c Ratio v/c Ratio Control Delay Queue Delay Total Delay LOS F F F F F D F E F F D Approach Delay Approach LOS F F F F Intersection Summary Area Type: Other Cycle Length: 180 Actuated Cycle Length: 180 Offset: 0 (0%), Referenced to phase 2:NBT and 6:SBT, Start of Green Baseline Synchro 7 - Report %user_name% Page 1
319 Lanes, Volumes, Timings 3: Hydraulic Rd & Route 29 5/23/2012 Natural Cycle: 150 Control Type: Actuated-Coordinated Maximum v/c Ratio: 1.62 Intersection Signal Delay: Intersection Capacity Utilization 141.4% Analysis Period (min) 15 Intersection LOS: F ICU Level of Service H Splits and Phases: 3: Hydraulic Rd & Route 29 Baseline Synchro 7 - Report %user_name% Page 2
320 Lanes, Volumes, Timings 9: Greenbrier Dr & 5/23/2012 Lane Group EBL EBT EBR WBL WBT WBR NBL NBT NBR SBL SBT SBR Lane Configurations Volume (vph) Ideal Flow (vphpl) Lane Width (ft) Grade (%) 0% 0% 0% 0% Storage Length (ft) Storage Lanes Taper Length (ft) Satd. Flow (prot) Flt Permitted Satd. Flow (perm) Right Turn on Red Yes Yes Yes Yes Satd. Flow (RTOR) Link Speed (mph) Link Distance (ft) Travel Time (s) Adj. Flow (vph) Lane Group Flow (vph) Turn Type pm+pt Perm pm+pt Prot Prot Perm Protected Phases Permitted Phases Detector Phase Switch Phase Minimum Initial (s) Minimum Split (s) Total Split (s) Total Split (%) 12.8% 12.8% 12.8% 12.8% 12.8% 0.0% 10.6% 60.6% 0.0% 13.9% 63.9% 63.9% Yellow Time (s) All-Red Time (s) Lost Time Adjust (s) Total Lost Time (s) Lead/Lag Lead Lag Lag Lead Lag Lead Lag Lead Lag Lag Lead-Lag Optimize? Recall Mode None None None None None None C-Max None C-Max C-Max Act Effct Green (s) Actuated g/c Ratio v/c Ratio Control Delay Queue Delay Total Delay LOS F F B E F F C F D A Approach Delay Approach LOS F F C D Intersection Summary Area Type: Other Cycle Length: 180 Actuated Cycle Length: 180 Offset: 0 (0%), Referenced to phase 2:NBT and 6:SBT, Start of Green Baseline Synchro 7 - Report %user_name% Page 3
321 Lanes, Volumes, Timings 9: Greenbrier Dr & 5/23/2012 Natural Cycle: 145 Control Type: Actuated-Coordinated Maximum v/c Ratio: 1.03 Intersection Signal Delay: 43.0 Intersection Capacity Utilization 96.6% Analysis Period (min) 15 Intersection LOS: D ICU Level of Service F Splits and Phases: 9: Greenbrier Dr & Baseline Synchro 7 - Report %user_name% Page 4
322 Lanes, Volumes, Timings 14: Rio Rd & Route 29 5/23/2012 Lane Group EBL EBT EBR WBL WBT WBR NBL NBT NBR SBL SBT SBR Lane Configurations Volume (vph) Ideal Flow (vphpl) Lane Width (ft) Grade (%) 0% 0% 0% 0% Storage Length (ft) Storage Lanes Taper Length (ft) Satd. Flow (prot) Flt Permitted Satd. Flow (perm) Right Turn on Red Yes Yes Yes Yes Satd. Flow (RTOR) Link Speed (mph) Link Distance (ft) Travel Time (s) Adj. Flow (vph) Lane Group Flow (vph) Turn Type Prot Perm Prot Perm Prot Perm Prot Perm Protected Phases Permitted Phases Detector Phase Switch Phase Minimum Initial (s) Minimum Split (s) Total Split (s) Total Split (%) 8.3% 12.8% 12.8% 23.3% 27.8% 27.8% 7.2% 32.2% 32.2% 31.7% 56.7% 56.7% Yellow Time (s) All-Red Time (s) Lost Time Adjust (s) Total Lost Time (s) Lead/Lag Lead Lag Lag Lead Lag Lag Lead Lag Lag Lead Lag Lag Lead-Lag Optimize? Recall Mode None None None None None None None C-Max C-Max None C-Max C-Max Act Effct Green (s) Actuated g/c Ratio v/c Ratio Control Delay Queue Delay Total Delay LOS F F D F E A F F C F D B Approach Delay Approach LOS F F F E Intersection Summary Area Type: Other Cycle Length: 180 Actuated Cycle Length: 180 Offset: 0 (0%), Referenced to phase 2:NBT and 6:SBT, Start of Green Baseline Synchro 7 - Report %user_name% Page 5
323 Lanes, Volumes, Timings 14: Rio Rd & Route 29 5/23/2012 Natural Cycle: 150 Control Type: Actuated-Coordinated Maximum v/c Ratio: 1.11 Intersection Signal Delay: 77.8 Intersection Capacity Utilization 104.4% Analysis Period (min) 15 Intersection LOS: E ICU Level of Service G Splits and Phases: 14: Rio Rd & Route 29 Baseline Synchro 7 - Report %user_name% Page 6
324 Lanes, Volumes, Timings 19: Hilton Heights Rd & Route 29 5/23/2012 Lane Group EBL EBT EBR WBL WBT WBR NBL NBT NBR SBL SBT SBR Lane Configurations Volume (vph) Ideal Flow (vphpl) Lane Width (ft) Grade (%) 0% 0% 0% 0% Storage Length (ft) Storage Lanes Taper Length (ft) Satd. Flow (prot) Flt Permitted Satd. Flow (perm) Right Turn on Red Yes Yes Yes Yes Satd. Flow (RTOR) Link Speed (mph) Link Distance (ft) Travel Time (s) Adj. Flow (vph) Lane Group Flow (vph) Turn Type Split Perm Split Prot Prot Perm Protected Phases Permitted Phases 4 6 Detector Phase Switch Phase Minimum Initial (s) Minimum Split (s) Total Split (s) Total Split (%) 12.8% 12.8% 12.8% 12.8% 12.8% 0.0% 7.2% 63.9% 0.0% 10.6% 67.2% 67.2% Yellow Time (s) All-Red Time (s) Lost Time Adjust (s) Total Lost Time (s) Lead/Lag Lead Lag Lead Lag Lag Lead-Lag Optimize? Recall Mode None None None None None None C-Max None C-Max C-Max Act Effct Green (s) Actuated g/c Ratio v/c Ratio Control Delay Queue Delay Total Delay LOS F F C F F B F C A Approach Delay Approach LOS E F B C Intersection Summary Area Type: Other Cycle Length: 180 Actuated Cycle Length: 180 Offset: 0 (0%), Referenced to phase 2:NBT and 6:SBT, Start of Green Baseline Synchro 7 - Report %user_name% Page 7
325 Lanes, Volumes, Timings 19: Hilton Heights Rd & Route 29 5/23/2012 Natural Cycle: 145 Control Type: Actuated-Coordinated Maximum v/c Ratio: 0.94 Intersection Signal Delay: 30.1 Intersection Capacity Utilization 79.9% Analysis Period (min) 15 Intersection LOS: C ICU Level of Service D Splits and Phases: 19: Hilton Heights Rd & Route 29 Baseline Synchro 7 - Report %user_name% Page 8
326 Lanes, Volumes, Timings 3: Hydraulic Rd & Route 29 5/23/2012 Lane Group EBL EBT EBR WBL WBT WBR NBL NBT NBR SBL SBT SBR Lane Configurations Volume (vph) Ideal Flow (vphpl) Lane Width (ft) Grade (%) 0% 0% 0% 0% Storage Length (ft) Storage Lanes Taper Length (ft) Satd. Flow (prot) Flt Permitted Satd. Flow (perm) Right Turn on Red Yes Yes Yes Yes Satd. Flow (RTOR) Link Speed (mph) Link Distance (ft) Travel Time (s) Adj. Flow (vph) Lane Group Flow (vph) Turn Type pm+pt Perm pm+pt Perm Prot Prot Perm Protected Phases Permitted Phases Detector Phase Switch Phase Minimum Initial (s) Minimum Split (s) Total Split (s) Total Split (%) 15.6% 31.7% 31.7% 8.9% 25.0% 25.0% 23.9% 43.9% 0.0% 15.6% 35.6% 35.6% Yellow Time (s) All-Red Time (s) Lost Time Adjust (s) Total Lost Time (s) Lead/Lag Lead Lag Lag Lead Lag Lag Lead Lag Lead Lag Lag Lead-Lag Optimize? Recall Mode None None None None None None None C-Max None C-Max C-Max Act Effct Green (s) Actuated g/c Ratio v/c Ratio Control Delay Queue Delay Total Delay LOS F F F F F E F F F F D Approach Delay Approach LOS F F F F Intersection Summary Area Type: Other Cycle Length: 180 Actuated Cycle Length: 180 Offset: 0 (0%), Referenced to phase 2:NBT and 6:SBT, Start of Green Baseline Synchro 7 - Report %user_name% Page 1
327 Lanes, Volumes, Timings 3: Hydraulic Rd & Route 29 5/23/2012 Natural Cycle: 150 Control Type: Actuated-Coordinated Maximum v/c Ratio: 1.88 Intersection Signal Delay: Intersection Capacity Utilization 159.6% Analysis Period (min) 15 Intersection LOS: F ICU Level of Service H Splits and Phases: 3: Hydraulic Rd & Route 29 Baseline Synchro 7 - Report %user_name% Page 2
328 Lanes, Volumes, Timings 9: Greenbrier Dr & 5/23/2012 Lane Group EBL EBT EBR WBL WBT WBR NBL NBT NBR SBL SBT SBR Lane Configurations Volume (vph) Ideal Flow (vphpl) Lane Width (ft) Grade (%) 0% 0% 0% 0% Storage Length (ft) Storage Lanes Taper Length (ft) Satd. Flow (prot) Flt Permitted Satd. Flow (perm) Right Turn on Red Yes Yes Yes Yes Satd. Flow (RTOR) Link Speed (mph) Link Distance (ft) Travel Time (s) Adj. Flow (vph) Lane Group Flow (vph) Turn Type pm+pt Perm pm+pt Prot Prot Perm Protected Phases Permitted Phases Detector Phase Switch Phase Minimum Initial (s) Minimum Split (s) Total Split (s) Total Split (%) 23.3% 23.3% 23.3% 13.3% 13.3% 0.0% 15.6% 54.4% 0.0% 8.9% 47.8% 47.8% Yellow Time (s) All-Red Time (s) Lost Time Adjust (s) Total Lost Time (s) Lead/Lag Lead Lag Lag Lead Lag Lead Lag Lead Lag Lag Lead-Lag Optimize? Recall Mode None None None None None None C-Max None C-Max C-Max Act Effct Green (s) Actuated g/c Ratio v/c Ratio Control Delay Queue Delay Total Delay LOS F E B D F F D F F C Approach Delay Approach LOS F F E F Intersection Summary Area Type: Other Cycle Length: 180 Actuated Cycle Length: 180 Offset: 0 (0%), Referenced to phase 2:NBT and 6:SBT, Start of Green Baseline Synchro 7 - Report %user_name% Page 3
329 Lanes, Volumes, Timings 9: Greenbrier Dr & 5/23/2012 Natural Cycle: 135 Control Type: Actuated-Coordinated Maximum v/c Ratio: 1.36 Intersection Signal Delay: Intersection Capacity Utilization 122.9% Analysis Period (min) 15 Intersection LOS: F ICU Level of Service H Splits and Phases: 9: Greenbrier Dr & Baseline Synchro 7 - Report %user_name% Page 4
330 Lanes, Volumes, Timings 14: Rio Rd & Route 29 5/23/2012 Lane Group EBL EBT EBR WBL WBT WBR NBL NBT NBR SBL SBT SBR Lane Configurations Volume (vph) Ideal Flow (vphpl) Lane Width (ft) Grade (%) 0% 0% 0% 0% Storage Length (ft) Storage Lanes Taper Length (ft) Satd. Flow (prot) Flt Permitted Satd. Flow (perm) Right Turn on Red Yes Yes Yes Yes Satd. Flow (RTOR) Link Speed (mph) Link Distance (ft) Travel Time (s) Adj. Flow (vph) Lane Group Flow (vph) Turn Type Prot Perm Prot Perm Prot Perm Prot Perm Protected Phases Permitted Phases Detector Phase Switch Phase Minimum Initial (s) Minimum Split (s) Total Split (s) Total Split (%) 6.7% 12.8% 12.8% 20.0% 26.1% 26.1% 10.6% 40.0% 40.0% 27.2% 56.7% 56.7% Yellow Time (s) All-Red Time (s) Lost Time Adjust (s) Total Lost Time (s) Lead/Lag Lead Lag Lag Lead Lag Lag Lead Lag Lag Lead Lag Lag Lead-Lag Optimize? Recall Mode None None None None None None None C-Max C-Max None C-Max C-Max Act Effct Green (s) Actuated g/c Ratio v/c Ratio Control Delay Queue Delay Total Delay LOS F F C F E F F F D F C A Approach Delay Approach LOS F F F F Intersection Summary Area Type: Other Cycle Length: 180 Actuated Cycle Length: 180 Offset: 0 (0%), Referenced to phase 2:NBT and 6:SBT, Start of Green Baseline Synchro 7 - Report %user_name% Page 5
331 Lanes, Volumes, Timings 14: Rio Rd & Route 29 5/23/2012 Natural Cycle: 150 Control Type: Actuated-Coordinated Maximum v/c Ratio: 1.86 Intersection Signal Delay: Intersection Capacity Utilization 149.4% Analysis Period (min) 15 Intersection LOS: F ICU Level of Service H Splits and Phases: 14: Rio Rd & Route 29 Baseline Synchro 7 - Report %user_name% Page 6
332 Lanes, Volumes, Timings 19: Hilton Heights Rd & Route 29 5/23/2012 Lane Group EBL EBT EBR WBL WBT WBR NBL NBT NBR SBL SBT SBR Lane Configurations Volume (vph) Ideal Flow (vphpl) Lane Width (ft) Grade (%) 0% 0% 0% 0% Storage Length (ft) Storage Lanes Taper Length (ft) Satd. Flow (prot) Flt Permitted Satd. Flow (perm) Right Turn on Red Yes Yes Yes Yes Satd. Flow (RTOR) Link Speed (mph) Link Distance (ft) Travel Time (s) Adj. Flow (vph) Lane Group Flow (vph) Turn Type Split Perm Split Prot Prot Perm Protected Phases Permitted Phases 4 6 Detector Phase Switch Phase Minimum Initial (s) Minimum Split (s) Total Split (s) Total Split (%) 12.8% 12.8% 12.8% 12.8% 12.8% 0.0% 10.0% 67.2% 0.0% 7.2% 64.4% 64.4% Yellow Time (s) All-Red Time (s) Lost Time Adjust (s) Total Lost Time (s) Lead/Lag Lead Lag Lead Lag Lag Lead-Lag Optimize? Recall Mode None None None None None None C-Max None C-Max C-Max Act Effct Green (s) Actuated g/c Ratio v/c Ratio Control Delay Queue Delay Total Delay LOS F F B F F F F C A Approach Delay Approach LOS F F F C Intersection Summary Area Type: Other Cycle Length: 180 Actuated Cycle Length: 180 Offset: 0 (0%), Referenced to phase 2:NBT and 6:SBT, Start of Green Baseline Synchro 7 - Report %user_name% Page 7
333 Lanes, Volumes, Timings 19: Hilton Heights Rd & Route 29 5/23/2012 Natural Cycle: 145 Control Type: Actuated-Coordinated Maximum v/c Ratio: 1.12 Intersection Signal Delay: 68.6 Intersection Capacity Utilization 88.0% Analysis Period (min) 15 Intersection LOS: E ICU Level of Service E Splits and Phases: 19: Hilton Heights Rd & Route 29 Baseline Synchro 7 - Report %user_name% Page 8
334 Lanes, Volumes, Timings 3: Hydraulic Rd & Route 29 5/23/2012 Lane Group EBL EBT EBR WBL WBT WBR NBL NBT NBR SBL SBT SBR Lane Configurations Volume (vph) Ideal Flow (vphpl) Lane Width (ft) Grade (%) 0% 0% 0% 0% Storage Length (ft) Storage Lanes Taper Length (ft) Satd. Flow (prot) Flt Permitted Satd. Flow (perm) Right Turn on Red Yes Yes Yes Yes Satd. Flow (RTOR) Link Speed (mph) Link Distance (ft) Travel Time (s) Adj. Flow (vph) Lane Group Flow (vph) Turn Type pm+pt Perm pm+pt Perm Prot Prot Perm Protected Phases Permitted Phases Detector Phase Switch Phase Minimum Initial (s) Minimum Split (s) Total Split (s) Total Split (%) 13.9% 32.2% 32.2% 7.8% 26.1% 26.1% 20.0% 38.3% 0.0% 21.7% 40.0% 40.0% Yellow Time (s) All-Red Time (s) Lost Time Adjust (s) Total Lost Time (s) Lead/Lag Lead Lag Lag Lead Lag Lag Lead Lag Lead Lag Lag Lead-Lag Optimize? Recall Mode None None None None None None None C-Max None C-Max C-Max Act Effct Green (s) Actuated g/c Ratio v/c Ratio Control Delay Queue Delay Total Delay LOS F F F F F C F E F F C Approach Delay Approach LOS F F F F Intersection Summary Area Type: Other Cycle Length: 180 Actuated Cycle Length: 180 Offset: 0 (0%), Referenced to phase 2:NBT and 6:SBT, Start of Green Baseline Synchro 7 - Report %user_name% Page 1
335 Lanes, Volumes, Timings 3: Hydraulic Rd & Route 29 5/23/2012 Natural Cycle: 150 Control Type: Actuated-Coordinated Maximum v/c Ratio: 1.29 Intersection Signal Delay: Intersection Capacity Utilization 119.5% Analysis Period (min) 15 Intersection LOS: F ICU Level of Service H Splits and Phases: 3: Hydraulic Rd & Route 29 Baseline Synchro 7 - Report %user_name% Page 2
336 Lanes, Volumes, Timings 9: Greenbrier Dr & 5/23/2012 Lane Group EBL EBT EBR WBL WBT WBR NBL NBT NBR SBL SBT SBR Lane Configurations Volume (vph) Ideal Flow (vphpl) Lane Width (ft) Grade (%) 0% 0% 0% 0% Storage Length (ft) Storage Lanes Taper Length (ft) Satd. Flow (prot) Flt Permitted Satd. Flow (perm) Right Turn on Red Yes Yes Yes Yes Satd. Flow (RTOR) Link Speed (mph) Link Distance (ft) Travel Time (s) Adj. Flow (vph) Lane Group Flow (vph) Turn Type pm+pt Perm pm+pt Prot Prot Perm Protected Phases Permitted Phases Detector Phase Switch Phase Minimum Initial (s) Minimum Split (s) Total Split (s) Total Split (%) 15.6% 19.4% 19.4% 12.8% 16.7% 0.0% 16.1% 55.6% 0.0% 12.2% 51.7% 51.7% Yellow Time (s) All-Red Time (s) Lost Time Adjust (s) Total Lost Time (s) Lead/Lag Lead Lag Lag Lead Lag Lead Lag Lead Lag Lag Lead-Lag Optimize? Recall Mode None None None None None None C-Max None C-Max C-Max Act Effct Green (s) Actuated g/c Ratio v/c Ratio Control Delay Queue Delay Total Delay LOS E E B E F F C F D B Approach Delay Approach LOS D F D D Intersection Summary Area Type: Other Cycle Length: 180 Actuated Cycle Length: 180 Offset: 0 (0%), Referenced to phase 2:NBT and 6:SBT, Start of Green Baseline Synchro 7 - Report %user_name% Page 3
337 Lanes, Volumes, Timings 9: Greenbrier Dr & 5/23/2012 Natural Cycle: 125 Control Type: Actuated-Coordinated Maximum v/c Ratio: 0.89 Intersection Signal Delay: 45.8 Intersection Capacity Utilization 90.6% Analysis Period (min) 15 Intersection LOS: D ICU Level of Service E Splits and Phases: 9: Greenbrier Dr & Baseline Synchro 7 - Report %user_name% Page 4
338 Lanes, Volumes, Timings 14: Rio Rd & Route 29 5/23/2012 Lane Group EBL EBT EBR WBL WBT WBR NBL NBT NBR SBL SBT SBR Lane Configurations Volume (vph) Ideal Flow (vphpl) Lane Width (ft) Grade (%) 0% 0% 0% 0% Storage Length (ft) Storage Lanes Taper Length (ft) Satd. Flow (prot) Flt Permitted Satd. Flow (perm) Right Turn on Red Yes Yes Yes Yes Satd. Flow (RTOR) Link Speed (mph) Link Distance (ft) Travel Time (s) Adj. Flow (vph) Lane Group Flow (vph) Turn Type Prot Perm Prot Perm Prot Perm Prot Perm Protected Phases Permitted Phases Detector Phase Switch Phase Minimum Initial (s) Minimum Split (s) Total Split (s) Total Split (%) 7.2% 12.8% 12.8% 24.4% 30.0% 30.0% 8.3% 30.0% 30.0% 32.8% 54.4% 54.4% Yellow Time (s) All-Red Time (s) Lost Time Adjust (s) Total Lost Time (s) Lead/Lag Lead Lag Lag Lead Lag Lag Lead Lag Lag Lead Lag Lag Lead-Lag Optimize? Recall Mode None None None None None None None C-Max C-Max None C-Max C-Max Act Effct Green (s) Actuated g/c Ratio v/c Ratio Control Delay Queue Delay Total Delay LOS F F B F D A F F B F D B Approach Delay Approach LOS F E E D Intersection Summary Area Type: Other Cycle Length: 180 Actuated Cycle Length: 180 Offset: 0 (0%), Referenced to phase 2:NBT and 6:SBT, Start of Green Baseline Synchro 7 - Report %user_name% Page 5
339 Lanes, Volumes, Timings 14: Rio Rd & Route 29 5/23/2012 Natural Cycle: 150 Control Type: Actuated-Coordinated Maximum v/c Ratio: 1.01 Intersection Signal Delay: 61.3 Intersection Capacity Utilization 96.8% Analysis Period (min) 15 Intersection LOS: E ICU Level of Service F Splits and Phases: 14: Rio Rd & Route 29 Baseline Synchro 7 - Report %user_name% Page 6
340 Lanes, Volumes, Timings 19: Hilton Heights Rd & Route 29 5/23/2012 Lane Group EBL EBT EBR WBL WBT WBR NBL NBT NBR SBL SBT SBR Lane Configurations Volume (vph) Ideal Flow (vphpl) Lane Width (ft) Grade (%) 0% 0% 0% 0% Storage Length (ft) Storage Lanes Taper Length (ft) Satd. Flow (prot) Flt Permitted Satd. Flow (perm) Right Turn on Red Yes Yes Yes Yes Satd. Flow (RTOR) Link Speed (mph) Link Distance (ft) Travel Time (s) Adj. Flow (vph) Lane Group Flow (vph) Turn Type Split Perm Split Prot Prot Perm Protected Phases Permitted Phases 4 6 Detector Phase Switch Phase Minimum Initial (s) Minimum Split (s) Total Split (s) Total Split (%) 12.8% 12.8% 12.8% 12.8% 12.8% 0.0% 9.4% 63.9% 0.0% 10.6% 65.0% 65.0% Yellow Time (s) All-Red Time (s) Lost Time Adjust (s) Total Lost Time (s) Lead/Lag Lead Lag Lead Lag Lag Lead-Lag Optimize? Recall Mode None None None None None None C-Max None C-Max C-Max Act Effct Green (s) Actuated g/c Ratio v/c Ratio Control Delay Queue Delay Total Delay LOS F F C F F B F C A Approach Delay Approach LOS E F B C Intersection Summary Area Type: Other Cycle Length: 180 Actuated Cycle Length: 180 Offset: 0 (0%), Referenced to phase 2:NBT and 6:SBT, Start of Green Baseline Synchro 7 - Report %user_name% Page 7
341 Lanes, Volumes, Timings 19: Hilton Heights Rd & Route 29 5/23/2012 Natural Cycle: 135 Control Type: Actuated-Coordinated Maximum v/c Ratio: 0.78 Intersection Signal Delay: 24.3 Intersection Capacity Utilization 70.9% Analysis Period (min) 15 Intersection LOS: C ICU Level of Service C Splits and Phases: 19: Hilton Heights Rd & Route 29 Baseline Synchro 7 - Report %user_name% Page 8
342 Lanes, Volumes, Timings 3: Hydraulic Rd & Route 29 5/23/2012 Lane Group EBL EBT EBR WBL WBT WBR NBL NBT NBR SBL SBT SBR Lane Configurations Volume (vph) Ideal Flow (vphpl) Lane Width (ft) Grade (%) 0% 0% 0% 0% Storage Length (ft) Storage Lanes Taper Length (ft) Satd. Flow (prot) Flt Permitted Satd. Flow (perm) Right Turn on Red Yes Yes Yes Yes Satd. Flow (RTOR) Link Speed (mph) Link Distance (ft) Travel Time (s) Adj. Flow (vph) Lane Group Flow (vph) Turn Type pm+pt Perm pm+pt Perm Prot Prot Perm Protected Phases Permitted Phases Detector Phase Switch Phase Minimum Initial (s) Minimum Split (s) Total Split (s) Total Split (%) 15.0% 31.1% 31.1% 12.2% 28.3% 28.3% 22.8% 37.2% 0.0% 19.4% 33.9% 33.9% Yellow Time (s) All-Red Time (s) Lost Time Adjust (s) Total Lost Time (s) Lead/Lag Lead Lag Lag Lead Lag Lag Lead Lag Lead Lag Lag Lead-Lag Optimize? Recall Mode None None None None None None None C-Max None C-Max C-Max Act Effct Green (s) Actuated g/c Ratio v/c Ratio Control Delay Queue Delay Total Delay LOS F F E F F D F F F F D Approach Delay Approach LOS F F F F Intersection Summary Area Type: Other Cycle Length: 180 Actuated Cycle Length: 180 Offset: 0 (0%), Referenced to phase 2:NBT and 6:SBT, Start of Green Baseline Synchro 7 - Report %user_name% Page 1
343 Lanes, Volumes, Timings 3: Hydraulic Rd & Route 29 5/23/2012 Natural Cycle: 150 Control Type: Actuated-Coordinated Maximum v/c Ratio: 1.59 Intersection Signal Delay: Intersection Capacity Utilization 134.9% Analysis Period (min) 15 Intersection LOS: F ICU Level of Service H Splits and Phases: 3: Hydraulic Rd & Route 29 Baseline Synchro 7 - Report %user_name% Page 2
344 Lanes, Volumes, Timings 9: Greenbrier Dr & 5/23/2012 Lane Group EBL EBT EBR WBL WBT WBR NBL NBT NBR SBL SBT SBR Lane Configurations Volume (vph) Ideal Flow (vphpl) Lane Width (ft) Grade (%) 0% 0% 0% 0% Storage Length (ft) Storage Lanes Taper Length (ft) Satd. Flow (prot) Flt Permitted Satd. Flow (perm) Right Turn on Red Yes Yes Yes Yes Satd. Flow (RTOR) Link Speed (mph) Link Distance (ft) Travel Time (s) Adj. Flow (vph) Lane Group Flow (vph) Turn Type pm+pt Perm pm+pt Prot Prot Perm Protected Phases Permitted Phases Detector Phase Switch Phase Minimum Initial (s) Minimum Split (s) Total Split (s) Total Split (%) 24.4% 27.8% 27.8% 12.8% 16.1% 0.0% 21.1% 50.6% 0.0% 8.9% 38.3% 38.3% Yellow Time (s) All-Red Time (s) Lost Time Adjust (s) Total Lost Time (s) Lead/Lag Lead Lag Lag Lead Lag Lead Lag Lead Lag Lag Lead-Lag Optimize? Recall Mode None None None None None None C-Max None C-Max C-Max Act Effct Green (s) Actuated g/c Ratio v/c Ratio Control Delay Queue Delay Total Delay LOS F E C D F F D F F C Approach Delay Approach LOS F F F F Intersection Summary Area Type: Other Cycle Length: 180 Actuated Cycle Length: 180 Offset: 0 (0%), Referenced to phase 2:NBT and 6:SBT, Start of Green Baseline Synchro 7 - Report %user_name% Page 3
345 Lanes, Volumes, Timings 9: Greenbrier Dr & 5/23/2012 Natural Cycle: 145 Control Type: Actuated-Coordinated Maximum v/c Ratio: 1.42 Intersection Signal Delay: Intersection Capacity Utilization 123.8% Analysis Period (min) 15 Intersection LOS: F ICU Level of Service H Splits and Phases: 9: Greenbrier Dr & Baseline Synchro 7 - Report %user_name% Page 4
346 Lanes, Volumes, Timings 14: Rio Rd & Route 29 5/23/2012 Lane Group EBL EBT EBR WBL WBT WBR NBL NBT NBR SBL SBT SBR Lane Configurations Volume (vph) Ideal Flow (vphpl) Lane Width (ft) Grade (%) 0% 0% 0% 0% Storage Length (ft) Storage Lanes Taper Length (ft) Satd. Flow (prot) Flt Permitted Satd. Flow (perm) Right Turn on Red Yes Yes Yes Yes Satd. Flow (RTOR) Link Speed (mph) Link Distance (ft) Travel Time (s) Adj. Flow (vph) Lane Group Flow (vph) Turn Type Prot Perm Prot Perm Prot Perm Prot Perm Protected Phases Permitted Phases Detector Phase Switch Phase Minimum Initial (s) Minimum Split (s) Total Split (s) Total Split (%) 6.1% 12.8% 12.8% 21.1% 27.8% 27.8% 8.9% 37.2% 37.2% 28.9% 57.2% 57.2% Yellow Time (s) All-Red Time (s) Lost Time Adjust (s) Total Lost Time (s) Lead/Lag Lead Lag Lag Lead Lag Lag Lead Lag Lag Lead Lag Lag Lead-Lag Optimize? Recall Mode None None None None None None None C-Max C-Max None C-Max C-Max Act Effct Green (s) Actuated g/c Ratio v/c Ratio Control Delay Queue Delay Total Delay LOS F F C F E D F F D F C A Approach Delay Approach LOS F F F F Intersection Summary Area Type: Other Cycle Length: 180 Actuated Cycle Length: 180 Offset: 0 (0%), Referenced to phase 2:NBT and 6:SBT, Start of Green Baseline Synchro 7 - Report %user_name% Page 5
347 Lanes, Volumes, Timings 14: Rio Rd & Route 29 5/23/2012 Natural Cycle: 150 Control Type: Actuated-Coordinated Maximum v/c Ratio: 1.67 Intersection Signal Delay: Intersection Capacity Utilization 136.5% Analysis Period (min) 15 Intersection LOS: F ICU Level of Service H Splits and Phases: 14: Rio Rd & Route 29 Baseline Synchro 7 - Report %user_name% Page 6
348 Lanes, Volumes, Timings 19: Hilton Heights Rd & Route 29 5/23/2012 Lane Group EBL EBT EBR WBL WBT WBR NBL NBT NBR SBL SBT SBR Lane Configurations Volume (vph) Ideal Flow (vphpl) Lane Width (ft) Grade (%) 0% 0% 0% 0% Storage Length (ft) Storage Lanes Taper Length (ft) Satd. Flow (prot) Flt Permitted Satd. Flow (perm) Right Turn on Red Yes Yes Yes Yes Satd. Flow (RTOR) Link Speed (mph) Link Distance (ft) Travel Time (s) Adj. Flow (vph) Lane Group Flow (vph) Turn Type Split Perm Split Prot Prot Perm Protected Phases Permitted Phases 4 6 Detector Phase Switch Phase Minimum Initial (s) Minimum Split (s) Total Split (s) Total Split (%) 12.8% 12.8% 12.8% 14.4% 14.4% 0.0% 10.0% 64.4% 0.0% 8.3% 62.8% 62.8% Yellow Time (s) All-Red Time (s) Lost Time Adjust (s) Total Lost Time (s) Lead/Lag Lead Lag Lead Lag Lag Lead-Lag Optimize? Recall Mode None None None None None None C-Max None C-Max C-Max Act Effct Green (s) Actuated g/c Ratio v/c Ratio Control Delay Queue Delay Total Delay LOS F F B F F D F C A Approach Delay Approach LOS F F D C Intersection Summary Area Type: Other Cycle Length: 180 Actuated Cycle Length: 180 Offset: 0 (0%), Referenced to phase 2:NBT and 6:SBT, Start of Green Baseline Synchro 7 - Report %user_name% Page 7
349 Lanes, Volumes, Timings 19: Hilton Heights Rd & Route 29 5/23/2012 Natural Cycle: 145 Control Type: Actuated-Coordinated Maximum v/c Ratio: 0.97 Intersection Signal Delay: 43.6 Intersection Capacity Utilization 80.2% Analysis Period (min) 15 Intersection LOS: D ICU Level of Service D Splits and Phases: 19: Hilton Heights Rd & Route 29 Baseline Synchro 7 - Report %user_name% Page 8
350 Segment Charlottesville Bypass Traffic - Northern Terminus Area Link Description Diurnal Curve 2011 Existing AM Peak Hour PM Peak Hour ADT % T % of ADT Total Vol Total Truck cars MT HT % of ADT Total Vol Total Truck cars MT HT 119 Proposed Bypass NB (South Terminus to North Terminus) K2 120 Proposed Bypass SB (North Terminus to South Terminus) K1 136 Ramp 136: Prop Bypass NB to US 29 SB K2 135 Ramp 135: Prop Bypass NB to US 29 NB K2 133 Ramp 133: US 29 SB to Prop Bypass SB K1 134 Ramp 134: US 29 NB to Prop Bypass SB (left-exit ramp) K NB, north of Prop Bypass (south of Hollymead) K1 24, % 6.2% 1, , % 2, , SB, north of Prop Bypass (south of Hollymead) K2 24, % 7.2% 1, , % 1, , Seminole Tr: Polo Grounds Rd to Prop. Bypass (NB) K2 24, % 7.2% 1, , % 1, , Seminole Tr: Polo Grounds Rd to Prop. Bypass (SB) K1 24, % 6.2% 1, , % 2, , Seminole Tr between ramps (NB) K Seminole Tr between ramps (SB) K2 MT = Medium Truck (2 axles with 6 wheels) HT = Heavy Truck (3 or more axles) Assume 25% of trucks are MT, and the rest are HT AM Peak Hour is 8:00 AM to 9:00 AM PM Peak Hour is 5:00 PM to 6:00 PM
351 Segment Charlottesville Bypass Traffic - Northern Terminus Area Link Description 119 Proposed Bypass NB (South Terminus to North Terminus) 120 Proposed Bypass SB (North Terminus to South Terminus) 136 Ramp 136: Prop Bypass NB to US 29 SB 135 Ramp 135: Prop Bypass NB to US 29 NB 133 Ramp 133: US 29 SB to Prop Bypass SB 134 Ramp 134: US 29 NB to Prop Bypass SB (left-exit ramp) 2 29 NB, north of Prop Bypass (south of Hollymead) 1 29 SB, north of Prop Bypass (south of Hollymead) 3 29 Seminole Tr: Polo Grounds Rd to Prop. Bypass (NB) 4 29 Seminole Tr: Polo Grounds Rd to Prop. Bypass (SB) Seminole Tr between ramps (NB) Seminole Tr between ramps (SB) 2015 No-Build AM Peak Hour PM Peak Hour ADT % T % of ADT Total Vol Total Truck cars MT HT % of ADT Total Vol Total Truck cars MT HT 25, % 6.2% 1, , % 2, , , % 7.2% 1, , % 1, , , % 7.2% 1, , % 2, , , % 6.2% 1, , % 2, , MT = Medium Truck (2 axles with 6 wheels) HT = Heavy Truck (3 or more axles) Assume 25% of trucks are MT, and the rest are HT AM Peak Hour is 8:00 AM to 9:00 AM PM Peak Hour is 5:00 PM to 6:00 PM
352 Segment Charlottesville Bypass Traffic - Northern Terminus Area Link Description 119 Proposed Bypass NB (South Terminus to North Terminus) 120 Proposed Bypass SB (North Terminus to South Terminus) 136 Ramp 136: Prop Bypass NB to US 29 SB 135 Ramp 135: Prop Bypass NB to US 29 NB 133 Ramp 133: US 29 SB to Prop Bypass SB 134 Ramp 134: US 29 NB to Prop Bypass SB (left-exit ramp) 2 29 NB, north of Prop Bypass (south of Hollymead) 1 29 SB, north of Prop Bypass (south of Hollymead) 3 29 Seminole Tr: Polo Grounds Rd to Prop. Bypass (NB) 4 29 Seminole Tr: Polo Grounds Rd to Prop. Bypass (SB) Seminole Tr between ramps (NB) Seminole Tr between ramps (SB) 2015 Build AM Peak Hour PM Peak Hour ADT % T % of ADT Total Vol Total Truck cars MT HT % of ADT Total Vol Total Truck cars MT HT 8, % 7.2% % , % 6.2% % % 7.2% % , % 7.2% % , % 6.2% % , % 6.2% % , % 6.2% 1, , % 2, , , % 7.2% 2, , % 2, , , % 7.2% 1, , % 1, , , % 6.2% 1, , % 2, , , % 6.2% % , % 7.2% 1, , % 1, , MT = Medium Truck (2 axles with 6 wheels) HT = Heavy Truck (3 or more axles) Assume 25% of trucks are MT, and the rest are HT AM Peak Hour is 8:00 AM to 9:00 AM PM Peak Hour is 5:00 PM to 6:00 PM
353 Segment Charlottesville Bypass Traffic - Northern Terminus Area Link Description 119 Proposed Bypass NB (South Terminus to North Terminus) 120 Proposed Bypass SB (North Terminus to South Terminus) 136 Ramp 136: Prop Bypass NB to US 29 SB 135 Ramp 135: Prop Bypass NB to US 29 NB 133 Ramp 133: US 29 SB to Prop Bypass SB 134 Ramp 134: US 29 NB to Prop Bypass SB (left-exit ramp) 2 29 NB, north of Prop Bypass (south of Hollymead) 1 29 SB, north of Prop Bypass (south of Hollymead) 3 29 Seminole Tr: Polo Grounds Rd to Prop. Bypass (NB) 4 29 Seminole Tr: Polo Grounds Rd to Prop. Bypass (SB) Seminole Tr between ramps (NB) Seminole Tr between ramps (SB) 2040 No-Build AM Peak Hour PM Peak Hour ADT % T % of ADT Total Vol Total Truck cars MT HT % of ADT Total Vol Total Truck cars MT HT 33, % 6.2% 2, , % 3, , , % 7.2% 2, , % 2, , , % 7.2% 2, , % 2, , , % 6.2% 2, , % 3, , MT = Medium Truck (2 axles with 6 wheels) HT = Heavy Truck (3 or more axles) Assume 25% of trucks are MT, and the rest are HT AM Peak Hour is 8:00 AM to 9:00 AM PM Peak Hour is 5:00 PM to 6:00 PM
354 Segment Charlottesville Bypass Traffic - Northern Terminus Area Link Description 119 Proposed Bypass NB (South Terminus to North Terminus) 120 Proposed Bypass SB (North Terminus to South Terminus) 136 Ramp 136: Prop Bypass NB to US 29 SB 135 Ramp 135: Prop Bypass NB to US 29 NB 133 Ramp 133: US 29 SB to Prop Bypass SB 134 Ramp 134: US 29 NB to Prop Bypass SB (left-exit ramp) 2 29 NB, north of Prop Bypass (south of Hollymead) 1 29 SB, north of Prop Bypass (south of Hollymead) 3 29 Seminole Tr: Polo Grounds Rd to Prop. Bypass (NB) 4 29 Seminole Tr: Polo Grounds Rd to Prop. Bypass (SB) Seminole Tr between ramps (NB) Seminole Tr between ramps (SB) 2040 Build AM Peak Hour PM Peak Hour ADT % T % of ADT Total Vol Total Truck cars MT HT % of ADT Total Vol Total Truck cars MT HT 13, % 7.2% 1, % 1, , , % 6.2% % 1, , , % 7.2% % , % 7.2% % , % 6.2% % , % 6.2% % , % 6.2% 2, , % 3, , , % 7.2% 2, , % 2, , , % 7.2% 2, , % 2, , , % 6.2% 2, , % 3, , , % 6.2% % 1, , , % 7.2% 2, , % 2, , MT = Medium Truck (2 axles with 6 wheels) HT = Heavy Truck (3 or more axles) Assume 25% of trucks are MT, and the rest are HT AM Peak Hour is 8:00 AM to 9:00 AM PM Peak Hour is 5:00 PM to 6:00 PM
355 Charlottesville Bypass Traffic - Southern Terminus Area Segment Link Description Diurnal Curve 2011 Existing AM Peak Hour PM Peak Hour ADT % T % of ADT Total Vol Total Truck cars MT HT % of ADT Total Vol Total Truck cars MT HT 67 Route 250 Bypass WB (btwn Hydraulic Rd & Emmet St) K8 11, , , Route 250 Bypass EB (btwn Hydraulic Rd & Emmet St) K7 11, , , Route 250 Bypass WB (btwn Emmet St & Barracks Rd) K6 19, , , , , Route 250 Bypass EB (btwn Emmet St & Barracks Rd) K5 19, , , , , L. Sandbridge Rd NB, south of 29 K % 12.9% % L. Sandbridge Rd SB, south of 29 K % 5.1% % Route 250 Bypass WB (btwn Barracks Rd & Prop Route 29 Bypass) K6 24, % 7.5% 1, , % 2, , Route 250 Bypass EB (btwn Bararcks Rd & Prop Route 29 Bypass) K5 24, % 10.1% 2, , % 2, , NB south of the Bypass (between Fontaine and Ivy) K5 21, % 10.1% 2, , % 2, , SB south of the Bypass (between Fontaine and Ivy) K6 21, % 7.5% 1, , % 2, , Ivy Rd EB (btwn Rt 250 Bypass & Alderman Rd) K5 8, % 10.1% % Ivy Rd WB (btwn Rt 250 Bypass & Alderman Rd) K6 8, % 7.5% % Ivy Rd WB (btwn Rt 846 & Golf Course Dr) K6 7, % 7.5% % Ivy Rd EB (btwn Rt 846 & Golf Course Dr) K5 7, % 10.1% % Old Ivy Rd EB (btwn Crestwood Rd & Harvest Dr) K5 2, % 10.1% % Old Ivy Rd WB (btwn Crestwood Rd & Harvest Dr) K6 2, % 7.5% % Proposed Bypass NB (South Terminus to North Terminus) K2 120 Proposed Bypass SB (North Terminus to South Terminus) K1 152 AB-AC: Off-Ramp from 29 NB to L. Sandridge Rd (diamond) K2 163 AB-AJ: 29 NB to Proposed Bypass NB (flyover) K2 153 AC-AD: On-Ramp from L. Sandridge Rd to 250 NB (diamond) K2 154 AA-AD: 250 Bypass NB (thru lanes) from 29 NB Bypass diverge to On-Ramp from L. Sa K5 157 AE-AH: 250 Bypass SB (thru lanes) from Off-Ramp to L. Sandridge Rd to 29 SB Bypas K6 158 AH-AG: 250 Bypass SB (thru lanes) from 29 SB Bypass merge to On-Ramp from L. Sa K6 155 AE-AF: Off-Ramp from 250 SB to L. Sandridge Rd (diamond) K1 156 AF-AG: On-Ramp from L. Sandridge Rd to 29 SB (diamond) K1 164 AI-AH: Proposed Bypass SB to 29 SB (flyover) K1 151 AA-AB: 250 NB to Split K2 159 AC-AF: L. Sandridge Rd NB, between Ramps K2 160 AF-AC: L. Sandridge Rd SB, between Ramps K1 161 AF-AJ: L. Sandridge Rd NB ramp to Proposed Bypass NB K2 162 AI-AF: Proposed Bypass SB ramp to L. Sandridge Rd SB K1 109 Route 250 SB/WB Mainline (btwn Ivy Rd & Barracks Rd) - Ex & NB K6 24, % 7.5% 1, , % 2, , Route 250 SB/WB Mainline (btwn Ivy Rd & 29 Bypass) - Build K2 110 Route 250 NB/EB Mainline (btwn Ivy Rd & L. Sandridge Rd) - Ex & NB K5 24, % 10.1% 2, , % 2, , Route 250 NB/EB Mainline (btwn L. Sandridge Rd & Barracks Rd) - Ex & NB K5 24, % 10.1% 2, , % 2, , Route 250 NB/EB Mainline (btwn Ivy Rd & 29 Bypass) - Build K6 191 Route 250 SB Off-Ramp (loop) to Ivy Rd K6 6, % 7.5% % Route 250 SB On-Ramp from Ivy Rd K6 3, % 7.5% % Route 250 NB Off-Ramp to Ivy Rd K5 3, % 10.1% % Route 250 NB On-Ramp (loop) from Ivy Rd K5 6, % 10.1% % MT = Medium Truck (2 axles with 6 wheels) HT = Heavy Truck (3 or more axles) Assume 25% of trucks are MT, and the rest are HT AM Peak Hour is 8:00 AM to 9:00 AM PM Peak Hour is 5:00 PM to 6:00 PM Blue Text indicates segments added ( )
356 Charlottesville Bypass Traffic - Southern Terminus Area Segment 67 Route 250 Bypass WB (btwn Hydraulic Rd & Emmet St) 68 Route 250 Bypass EB (btwn Hydraulic Rd & Emmet St) 69 Route 250 Bypass WB (btwn Emmet St & Barracks Rd) 70 Route 250 Bypass EB (btwn Emmet St & Barracks Rd) 77 L. Sandbridge Rd NB, south of L. Sandbridge Rd SB, south of 29 Link Description 109 Route 250 Bypass WB (btwn Barracks Rd & Prop Route 29 Bypass) 110 Route 250 Bypass EB (btwn Bararcks Rd & Prop Route 29 Bypass) NB south of the Bypass (between Fontaine and Ivy) SB south of the Bypass (between Fontaine and Ivy) 113 Ivy Rd EB (btwn Rt 250 Bypass & Alderman Rd) 114 Ivy Rd WB (btwn Rt 250 Bypass & Alderman Rd) 115 Ivy Rd WB (btwn Rt 846 & Golf Course Dr) 116 Ivy Rd EB (btwn Rt 846 & Golf Course Dr) 117 Old Ivy Rd EB (btwn Crestwood Rd & Harvest Dr) 118 Old Ivy Rd WB (btwn Crestwood Rd & Harvest Dr) 119 Proposed Bypass NB (South Terminus to North Terminus) 120 Proposed Bypass SB (North Terminus to South Terminus) 2015 No-Build AM Peak Hour PM Peak Hour ADT % T % of ADT Total Vol Total Truck cars MT HT % of ADT Total Vol Total Truck cars MT HT 12, , , , , , , , , , , , , , , , , , % 12.9% % % 5.1% % , % 7.5% 1, , % 2, , , % 10.1% 2, , % 2, , , % 10.1% 2, , % 2, , , % 7.5% 1, , % 2, , , % 10.1% % , % 7.5% % , % 7.5% % , % 10.1% % , % 10.1% % , % 7.5% % AB-AC: Off-Ramp from 29 NB to L. Sandridge Rd (diamond) 163 AB-AJ: 29 NB to Proposed Bypass NB (flyover) 153 AC-AD: On-Ramp from L. Sandridge Rd to 250 NB (diamond) 154 AA-AD: 250 Bypass NB (thru lanes) from 29 NB Bypass diverge to On-Ramp from L. Sa 157 AE-AH: 250 Bypass SB (thru lanes) from Off-Ramp to L. Sandridge Rd to 29 SB Bypas 158 AH-AG: 250 Bypass SB (thru lanes) from 29 SB Bypass merge to On-Ramp from L. Sa 155 AE-AF: Off-Ramp from 250 SB to L. Sandridge Rd (diamond) 156 AF-AG: On-Ramp from L. Sandridge Rd to 29 SB (diamond) 164 AI-AH: Proposed Bypass SB to 29 SB (flyover) 151 AA-AB: 250 NB to Split 159 AC-AF: L. Sandridge Rd NB, between Ramps 160 AF-AC: L. Sandridge Rd SB, between Ramps 161 AF-AJ: L. Sandridge Rd NB ramp to Proposed Bypass NB 162 AI-AF: Proposed Bypass SB ramp to L. Sandridge Rd SB 109 Route 250 SB/WB Mainline (btwn Ivy Rd & Barracks Rd) - Ex & NB 151 Route 250 SB/WB Mainline (btwn Ivy Rd & 29 Bypass) - Build 110 Route 250 NB/EB Mainline (btwn Ivy Rd & L. Sandridge Rd) - Ex & NB 110 Route 250 NB/EB Mainline (btwn L. Sandridge Rd & Barracks Rd) - Ex & NB 158 Route 250 NB/EB Mainline (btwn Ivy Rd & 29 Bypass) - Build 191 Route 250 SB Off-Ramp (loop) to Ivy Rd 192 Route 250 SB On-Ramp from Ivy Rd 193 Route 250 NB Off-Ramp to Ivy Rd 194 Route 250 NB On-Ramp (loop) from Ivy Rd 25, % 7.5% 1, , % 2, , , % 10.1% 2, , % 2, , , % 10.1% 2, , % 2, , , % 7.5% % , % 7.5% % , % 10.1% % , % 10.1% % MT = Medium Truck (2 axles with 6 wheels) HT = Heavy Truck (3 or more axles) Assume 25% of trucks are MT, and the rest are HT AM Peak Hour is 8:00 AM to 9:00 AM PM Peak Hour is 5:00 PM to 6:00 PM Blue Text indicates segments added ( )
357 Charlottesville Bypass Traffic - Southern Terminus Area Segment 67 Route 250 Bypass WB (btwn Hydraulic Rd & Emmet St) 68 Route 250 Bypass EB (btwn Hydraulic Rd & Emmet St) 69 Route 250 Bypass WB (btwn Emmet St & Barracks Rd) 70 Route 250 Bypass EB (btwn Emmet St & Barracks Rd) 77 L. Sandbridge Rd NB, south of L. Sandbridge Rd SB, south of 29 Link Description 109 Route 250 Bypass WB (btwn Barracks Rd & Prop Route 29 Bypass) 110 Route 250 Bypass EB (btwn Bararcks Rd & Prop Route 29 Bypass) NB south of the Bypass (between Fontaine and Ivy) SB south of the Bypass (between Fontaine and Ivy) 113 Ivy Rd EB (btwn Rt 250 Bypass & Alderman Rd) 114 Ivy Rd WB (btwn Rt 250 Bypass & Alderman Rd) 115 Ivy Rd WB (btwn Rt 846 & Golf Course Dr) 116 Ivy Rd EB (btwn Rt 846 & Golf Course Dr) 117 Old Ivy Rd EB (btwn Crestwood Rd & Harvest Dr) 118 Old Ivy Rd WB (btwn Crestwood Rd & Harvest Dr) 119 Proposed Bypass NB (South Terminus to North Terminus) 120 Proposed Bypass SB (North Terminus to South Terminus) 2015 Build AM Peak Hour PM Peak Hour ADT % T % of ADT Total Vol Total Truck cars MT HT % of ADT Total Vol Total Truck cars MT HT 11, , , , , , , , , , , , , , , % 12.9% % , % 5.1% % , % 7.5% 1, , % 1, , , % 10.1% 1, , % 1, , , % 10.1% 2, , % 2, , , % 7.5% 1, , % 2, , , % 10.1% % , % 7.5% % , % 7.5% % , % 10.1% % , % 10.1% % , % 7.5% % , % 7.2% % , % 6.2% % AB-AC: Off-Ramp from 29 NB to L. Sandridge Rd (diamond) 163 AB-AJ: 29 NB to Proposed Bypass NB (flyover) 153 AC-AD: On-Ramp from L. Sandridge Rd to 250 NB (diamond) 154 AA-AD: 250 Bypass NB (thru lanes) from 29 NB Bypass diverge to On-Ramp from L. Sa 157 AE-AH: 250 Bypass SB (thru lanes) from Off-Ramp to L. Sandridge Rd to 29 SB Bypas 158 AH-AG: 250 Bypass SB (thru lanes) from 29 SB Bypass merge to On-Ramp from L. Sa 155 AE-AF: Off-Ramp from 250 SB to L. Sandridge Rd (diamond) 156 AF-AG: On-Ramp from L. Sandridge Rd to 29 SB (diamond) 164 AI-AH: Proposed Bypass SB to 29 SB (flyover) % 7.2% % , % 7.2% % % 7.2% % , % 10.1% 1, , % 1, , , % 7.5% 1, , % 1, , , % 7.5% 1, , % 2, , % 6.2% % % 6.2% % , % 6.2% % AA-AB: 250 NB to Split 159 AC-AF: L. Sandridge Rd NB, between Ramps 160 AF-AC: L. Sandridge Rd SB, between Ramps 161 AF-AJ: L. Sandridge Rd NB ramp to Proposed Bypass NB 162 AI-AF: Proposed Bypass SB ramp to L. Sandridge Rd SB 109 Route 250 SB/WB Mainline (btwn Ivy Rd & Barracks Rd) - Ex & NB 151 Route 250 SB/WB Mainline (btwn Ivy Rd & 29 Bypass) - Build 110 Route 250 NB/EB Mainline (btwn Ivy Rd & L. Sandridge Rd) - Ex & NB 110 Route 250 NB/EB Mainline (btwn L. Sandridge Rd & Barracks Rd) - Ex & NB 158 Route 250 NB/EB Mainline (btwn Ivy Rd & 29 Bypass) - Build 191 Route 250 SB Off-Ramp (loop) to Ivy Rd 192 Route 250 SB On-Ramp from Ivy Rd 193 Route 250 NB Off-Ramp to Ivy Rd 194 Route 250 NB On-Ramp (loop) from Ivy Rd 8, % 7.2% % , % 7.2% % % 6.2% % % 7.2% % % 6.2% % , % 7.2% 1, , % 1, , , % 7.5% 1, , % 2, , , % 7.5% % , % 7.5% % , % 10.1% % , % 10.1% % MT = Medium Truck (2 axles with 6 wheels) HT = Heavy Truck (3 or more axles) Assume 25% of trucks are MT, and the rest are HT AM Peak Hour is 8:00 AM to 9:00 AM PM Peak Hour is 5:00 PM to 6:00 PM Blue Text indicates segments added ( )
358 Charlottesville Bypass Traffic - Southern Terminus Area Segment 67 Route 250 Bypass WB (btwn Hydraulic Rd & Emmet St) 68 Route 250 Bypass EB (btwn Hydraulic Rd & Emmet St) 69 Route 250 Bypass WB (btwn Emmet St & Barracks Rd) 70 Route 250 Bypass EB (btwn Emmet St & Barracks Rd) 77 L. Sandbridge Rd NB, south of L. Sandbridge Rd SB, south of 29 Link Description 109 Route 250 Bypass WB (btwn Barracks Rd & Prop Route 29 Bypass) 110 Route 250 Bypass EB (btwn Bararcks Rd & Prop Route 29 Bypass) NB south of the Bypass (between Fontaine and Ivy) SB south of the Bypass (between Fontaine and Ivy) 113 Ivy Rd EB (btwn Rt 250 Bypass & Alderman Rd) 114 Ivy Rd WB (btwn Rt 250 Bypass & Alderman Rd) 115 Ivy Rd WB (btwn Rt 846 & Golf Course Dr) 116 Ivy Rd EB (btwn Rt 846 & Golf Course Dr) 117 Old Ivy Rd EB (btwn Crestwood Rd & Harvest Dr) 118 Old Ivy Rd WB (btwn Crestwood Rd & Harvest Dr) 119 Proposed Bypass NB (South Terminus to North Terminus) 120 Proposed Bypass SB (North Terminus to South Terminus) 2040 No-Build AM Peak Hour PM Peak Hour ADT % T % of ADT Total Vol Total Truck cars MT HT % of ADT Total Vol Total Truck cars MT HT 16, , , , , , , , , , , , , , , , , , , , , % 12.9% % , % 5.1% % , % 7.5% 2, , % 3, , , % 10.1% 3, , % 3, , , % 10.1% 3, , % 3, , , % 7.5% 2, , % 3, , , % 10.1% % , % 7.5% % , % 7.5% % 1, , , % 10.1% 1, , % , % 10.1% % , % 7.5% % AB-AC: Off-Ramp from 29 NB to L. Sandridge Rd (diamond) 163 AB-AJ: 29 NB to Proposed Bypass NB (flyover) 153 AC-AD: On-Ramp from L. Sandridge Rd to 250 NB (diamond) 154 AA-AD: 250 Bypass NB (thru lanes) from 29 NB Bypass diverge to On-Ramp from L. Sa 157 AE-AH: 250 Bypass SB (thru lanes) from Off-Ramp to L. Sandridge Rd to 29 SB Bypas 158 AH-AG: 250 Bypass SB (thru lanes) from 29 SB Bypass merge to On-Ramp from L. Sa 155 AE-AF: Off-Ramp from 250 SB to L. Sandridge Rd (diamond) 156 AF-AG: On-Ramp from L. Sandridge Rd to 29 SB (diamond) 164 AI-AH: Proposed Bypass SB to 29 SB (flyover) 151 AA-AB: 250 NB to Split 159 AC-AF: L. Sandridge Rd NB, between Ramps 160 AF-AC: L. Sandridge Rd SB, between Ramps 161 AF-AJ: L. Sandridge Rd NB ramp to Proposed Bypass NB 162 AI-AF: Proposed Bypass SB ramp to L. Sandridge Rd SB 109 Route 250 SB/WB Mainline (btwn Ivy Rd & Barracks Rd) - Ex & NB 151 Route 250 SB/WB Mainline (btwn Ivy Rd & 29 Bypass) - Build 110 Route 250 NB/EB Mainline (btwn Ivy Rd & L. Sandridge Rd) - Ex & NB 110 Route 250 NB/EB Mainline (btwn L. Sandridge Rd & Barracks Rd) - Ex & NB 158 Route 250 NB/EB Mainline (btwn Ivy Rd & 29 Bypass) - Build 191 Route 250 SB Off-Ramp (loop) to Ivy Rd 192 Route 250 SB On-Ramp from Ivy Rd 193 Route 250 NB Off-Ramp to Ivy Rd 194 Route 250 NB On-Ramp (loop) from Ivy Rd 35, % 7.5% 2, , % 3, , , % 10.1% 3, , % 3, , , % 10.1% 3, , % 3, , , % 7.5% % , % 7.5% % , % 10.1% % , % 10.1% % MT = Medium Truck (2 axles with 6 wheels) HT = Heavy Truck (3 or more axles) Assume 25% of trucks are MT, and the rest are HT AM Peak Hour is 8:00 AM to 9:00 AM PM Peak Hour is 5:00 PM to 6:00 PM Blue Text indicates segments added ( )
359 Charlottesville Bypass Traffic - Southern Terminus Area Segment 67 Route 250 Bypass WB (btwn Hydraulic Rd & Emmet St) 68 Route 250 Bypass EB (btwn Hydraulic Rd & Emmet St) 69 Route 250 Bypass WB (btwn Emmet St & Barracks Rd) 70 Route 250 Bypass EB (btwn Emmet St & Barracks Rd) 77 L. Sandbridge Rd NB, south of L. Sandbridge Rd SB, south of 29 Link Description 109 Route 250 Bypass WB (btwn Barracks Rd & Prop Route 29 Bypass) 110 Route 250 Bypass EB (btwn Bararcks Rd & Prop Route 29 Bypass) NB south of the Bypass (between Fontaine and Ivy) SB south of the Bypass (between Fontaine and Ivy) 113 Ivy Rd EB (btwn Rt 250 Bypass & Alderman Rd) 114 Ivy Rd WB (btwn Rt 250 Bypass & Alderman Rd) 115 Ivy Rd WB (btwn Rt 846 & Golf Course Dr) 116 Ivy Rd EB (btwn Rt 846 & Golf Course Dr) 117 Old Ivy Rd EB (btwn Crestwood Rd & Harvest Dr) 118 Old Ivy Rd WB (btwn Crestwood Rd & Harvest Dr) 119 Proposed Bypass NB (South Terminus to North Terminus) 120 Proposed Bypass SB (North Terminus to South Terminus) 2040 Build AM Peak Hour PM Peak Hour ADT % T % of ADT Total Vol Total Truck cars MT HT % of ADT Total Vol cars MT HT 15, , , ,431 1, , , , ,329 1, , , , ,225 2, , , , ,944 1, , % 12.9% % , % 5.1% % , % 7.5% 1, , % 2,909 2, , % 10.1% 2, , % 2,541 2, , % 10.1% 3, , % 3,325 3, , % 7.5% 2, , % 3,806 3, , % 10.1% % , % 7.5% % , % 7.5% % 1,121 1, , % 10.1% 1, , % , % 10.1% % , % 7.5% % , % 7.2% 1, % 1,080 1, , % 6.2% % 1,290 1, AB-AC: Off-Ramp from 29 NB to L. Sandridge Rd (diamond) 163 AB-AJ: 29 NB to Proposed Bypass NB (flyover) 153 AC-AD: On-Ramp from L. Sandridge Rd to 250 NB (diamond) 154 AA-AD: 250 Bypass NB (thru lanes) from 29 NB Bypass diverge to On-Ramp from L. Sa 157 AE-AH: 250 Bypass SB (thru lanes) from Off-Ramp to L. Sandridge Rd to 29 SB Bypas 158 AH-AG: 250 Bypass SB (thru lanes) from 29 SB Bypass merge to On-Ramp from L. Sa 155 AE-AF: Off-Ramp from 250 SB to L. Sandridge Rd (diamond) 156 AF-AG: On-Ramp from L. Sandridge Rd to 29 SB (diamond) 164 AI-AH: Proposed Bypass SB to 29 SB (flyover) % 7.2% % , % 7.2% % , % 7.2% % , % 10.1% 2, , % 2,348 2, , % 7.5% 1, , % 2,524 2, , % 7.5% 2, , % 3,757 3, , % 6.2% % , % 6.2% % , % 6.2% % 1,045 1, AA-AB: 250 NB to Split 159 AC-AF: L. Sandridge Rd NB, between Ramps 160 AF-AC: L. Sandridge Rd SB, between Ramps 161 AF-AJ: L. Sandridge Rd NB ramp to Proposed Bypass NB 162 AI-AF: Proposed Bypass SB ramp to L. Sandridge Rd SB 109 Route 250 SB/WB Mainline (btwn Ivy Rd & Barracks Rd) - Ex & NB 151 Route 250 SB/WB Mainline (btwn Ivy Rd & 29 Bypass) - Build 110 Route 250 NB/EB Mainline (btwn Ivy Rd & L. Sandridge Rd) - Ex & NB 110 Route 250 NB/EB Mainline (btwn L. Sandridge Rd & Barracks Rd) - Ex & NB 158 Route 250 NB/EB Mainline (btwn Ivy Rd & 29 Bypass) - Build 191 Route 250 SB Off-Ramp (loop) to Ivy Rd 192 Route 250 SB On-Ramp from Ivy Rd 193 Route 250 NB Off-Ramp to Ivy Rd 194 Route 250 NB On-Ramp (loop) from Ivy Rd 10, % 7.2% % , % 7.2% % , % 6.2% % , % 7.2% % , % 6.2% % , % 7.2% 2, , % 2,755 2, , % 7.5% 2, , % 3,881 3, , % 7.5% % , % 7.5% % , % 10.1% % , % 10.1% % MT = Medium Truck (2 axles with 6 wheels) HT = Heavy Truck (3 or more axles) Assume 25% of trucks are MT, and the rest are HT AM Peak Hour is 8:00 AM to 9:00 AM PM Peak Hour is 5:00 PM to 6:00 PM Blue Text indicates segments added ( )
360 Charlottesville Bypass Traffic - Cross Streets Segment Link Description Diurnal Curve 2011 Existing AM Peak Hour PM Peak Hour ADT % T % of ADT Total Vol Total Truck cars MT HT % of ADT Total Vol Total Truck cars MT HT 84 Barracks Road EB (Btwn Garth Rd & Georgetown Rd) K5 3, % 10.1% % Barracks Road WB (Btwn Garth Rd & Georgetown Rd) K6 3, % 7.5% % Lambs Road NB (Btwn Hydraulic Rd & Ivy Ridge Rd) K10 2, % 5.1% % Lambs Road SB (Btwn Hydraulic Rd & Ivy Ridge Rd) K9 2, % 12.9% % Roslyn Ridge Rd [NOT IN MODEL] % 10.0% % Earlysville Rd NB (Btwn Hydraulic Rd & Woodland Rd) K10 6, % 5.1% % Earlysville Rd SB (Btwn Hydraulic Rd & Woodland Rd) K9 6, % 12.9% % Woodburn Road [NOT IN MODEL] % 10.0% % Parallel Routes 41 Berkmar Drive NB (Btwn Woodbrook Dr & Hilton Heights Rd) K10 4, % 5.1% % Berkmar Drive SB (Btwn Woodbrook Dr & Hilton Heights Rd) K9 4, % 12.9% % Berkmar Drive SB (btwn Woodbrook Dr & Rio Road) K9 9, % 12.9% 1, , % Berkmar Drive NB (btwn Woodbrook Dr & Rio Road) K10 9, % 5.1% % 1, , Rio Road EB (btwn 4 Seasons Dr & Berkmar Dr) K5 8, % 10.1% % Rio Road WB (btwn 4 Seasons Dr & Berkmar Dr) K6 8, % 7.5% % Hydraulic Road SB (Btwn Earlysville Rd & Lambs Rd) K5 10, % 10.1% 1, , % 1, Hydraulic Road NB (Btwn Earlysville Rd & Lambs Rd) K6 10, % 7.5% % 1, , Rio Rd EB (Btwn Earlysville Rd & 4 Seasons Dr) K5 8, % 10.1% % Rio Rd WB (Btwn Earlysville Rd & 4 Seasons Dr) K6 8, % 7.5% % MT = Medium Truck (2 axles with 6 wheels) HT = Heavy Truck (3 or more axles) Assume 25% of trucks are MT, and the rest are HT AM Peak Hour is 8:00 AM to 9:00 AM PM Peak Hour is 5:00 PM to 6:00 PM Blue Text indicates segments added ( )
361 Charlottesville Bypass Traffic - Cross Streets Segment Link Description 2015 No-Build AM Peak Hour PM Peak Hour ADT % T % of ADT Total Vol Total Truck cars MT HT % of ADT Total Vol Total Truck cars MT HT 84 Barracks Road EB (Btwn Garth Rd & Georgetown Rd) 83 Barracks Road WB (Btwn Garth Rd & Georgetown Rd) 99 Lambs Road NB (Btwn Hydraulic Rd & Ivy Ridge Rd) 100 Lambs Road SB (Btwn Hydraulic Rd & Ivy Ridge Rd) Roslyn Ridge Rd [NOT IN MODEL] 105 Earlysville Rd NB (Btwn Hydraulic Rd & Woodland Rd) 106 Earlysville Rd SB (Btwn Hydraulic Rd & Woodland Rd) Woodburn Road [NOT IN MODEL] Parallel Routes 39 Berkmar Drive Extended NB (btwn Hilton Heights Rd & Rio Mills Rd) 40 Berkmar Drive Extended SB (btwn Hilton Heights Rd & Rio Mills Rd) 41 Berkmar Drive NB (Btwn Woodbrook Dr & Hilton Heights Rd) 42 Berkmar Drive SB (Btwn Woodbrook Dr & Hilton Heights Rd) 45 Berkmar Drive SB (btwn Woodbrook Dr & Rio Road) 46 Berkmar Drive NB (btwn Woodbrook Dr & Rio Road) 51 Rio Road EB (btwn 4 Seasons Dr & Berkmar Dr) 52 Rio Road WB (btwn 4 Seasons Dr & Berkmar Dr) 101 Hydraulic Road SB (Btwn Earlysville Rd & Lambs Rd) 102 Hydraulic Road NB (Btwn Earlysville Rd & Lambs Rd) 103 Rio Rd EB (Btwn Earlysville Rd & 4 Seasons Dr) 104 Rio Rd WB (Btwn Earlysville Rd & 4 Seasons Dr) 4, % 10.1% % , % 7.5% % , % 5.1% % , % 12.9% % % 10.0% % , % 5.1% % , % 12.9% % % 10.0% % , % 5.1% % 1, , , % 12.9% 1, , % , % 5.1% % , % 12.9% % , % 12.9% 1, , % , % 5.1% % 1, , , % 10.1% % , % 7.5% % , % 10.1% 1, , % 1, , , % 7.5% % 1, , , % 10.1% % , % 7.5% % MT = Medium Truck (2 axles with 6 wheels) HT = Heavy Truck (3 or more axles) Assume 25% of trucks are MT, and the rest are HT AM Peak Hour is 8:00 AM to 9:00 AM PM Peak Hour is 5:00 PM to 6:00 PM Blue Text indicates segments added ( )
362 Charlottesville Bypass Traffic - Cross Streets Segment Link Description 2015 Build AM Peak Hour PM Peak Hour ADT % T % of ADT Total Vol Total Truck cars MT HT % of ADT Total Vol Total Truck cars MT HT 84 Barracks Road EB (Btwn Garth Rd & Georgetown Rd) 83 Barracks Road WB (Btwn Garth Rd & Georgetown Rd) 99 Lambs Road NB (Btwn Hydraulic Rd & Ivy Ridge Rd) 100 Lambs Road SB (Btwn Hydraulic Rd & Ivy Ridge Rd) Roslyn Ridge Rd [NOT IN MODEL] 105 Earlysville Rd NB (Btwn Hydraulic Rd & Woodland Rd) 106 Earlysville Rd SB (Btwn Hydraulic Rd & Woodland Rd) Woodburn Road [NOT IN MODEL] Parallel Routes 39 Berkmar Drive Extended NB (btwn Hilton Heights Rd & Rio Mills Rd) 40 Berkmar Drive Extended SB (btwn Hilton Heights Rd & Rio Mills Rd) 41 Berkmar Drive NB (Btwn Woodbrook Dr & Hilton Heights Rd) 42 Berkmar Drive SB (Btwn Woodbrook Dr & Hilton Heights Rd) 45 Berkmar Drive SB (btwn Woodbrook Dr & Rio Road) 46 Berkmar Drive NB (btwn Woodbrook Dr & Rio Road) 51 Rio Road EB (btwn 4 Seasons Dr & Berkmar Dr) 52 Rio Road WB (btwn 4 Seasons Dr & Berkmar Dr) 101 Hydraulic Road SB (Btwn Earlysville Rd & Lambs Rd) 102 Hydraulic Road NB (Btwn Earlysville Rd & Lambs Rd) 103 Rio Rd EB (Btwn Earlysville Rd & 4 Seasons Dr) 104 Rio Rd WB (Btwn Earlysville Rd & 4 Seasons Dr) 4, % 10.1% % , % 7.5% % , % 5.1% % , % 12.9% % % 10.0% % , % 5.1% % , % 12.9% % % 10.0% % , % 5.1% % , % 12.9% % , % 5.1% % , % 12.9% % , % 12.9% % , % 5.1% % , % 10.1% % , % 7.5% % , % 10.1% % , % 7.5% % 1, , % 10.1% % , % 7.5% % MT = Medium Truck (2 axles with 6 wheels) HT = Heavy Truck (3 or more axles) Assume 25% of trucks are MT, and the rest are HT AM Peak Hour is 8:00 AM to 9:00 AM PM Peak Hour is 5:00 PM to 6:00 PM Blue Text indicates segments added ( )
363 Charlottesville Bypass Traffic - Cross Streets Segment Link Description 2040 No-Build AM Peak Hour PM Peak Hour ADT % T % of ADT Total Vol Total Truck cars MT HT % of ADT Total Vol Total Truck cars MT HT 84 Barracks Road EB (Btwn Garth Rd & Georgetown Rd) 83 Barracks Road WB (Btwn Garth Rd & Georgetown Rd) 99 Lambs Road NB (Btwn Hydraulic Rd & Ivy Ridge Rd) 100 Lambs Road SB (Btwn Hydraulic Rd & Ivy Ridge Rd) Roslyn Ridge Rd [NOT IN MODEL] 105 Earlysville Rd NB (Btwn Hydraulic Rd & Woodland Rd) 106 Earlysville Rd SB (Btwn Hydraulic Rd & Woodland Rd) Woodburn Road [NOT IN MODEL] Parallel Routes 39 Berkmar Drive Extended NB (btwn Hilton Heights Rd & Rio Mills Rd) 40 Berkmar Drive Extended SB (btwn Hilton Heights Rd & Rio Mills Rd) 41 Berkmar Drive NB (Btwn Woodbrook Dr & Hilton Heights Rd) 42 Berkmar Drive SB (Btwn Woodbrook Dr & Hilton Heights Rd) 45 Berkmar Drive SB (btwn Woodbrook Dr & Rio Road) 46 Berkmar Drive NB (btwn Woodbrook Dr & Rio Road) 51 Rio Road EB (btwn 4 Seasons Dr & Berkmar Dr) 52 Rio Road WB (btwn 4 Seasons Dr & Berkmar Dr) 101 Hydraulic Road SB (Btwn Earlysville Rd & Lambs Rd) 102 Hydraulic Road NB (Btwn Earlysville Rd & Lambs Rd) 103 Rio Rd EB (Btwn Earlysville Rd & 4 Seasons Dr) 104 Rio Rd WB (Btwn Earlysville Rd & 4 Seasons Dr) 8, % 10.1% % , % 7.5% % , % 5.1% % , % 12.9% % % 10.0% % , % 5.1% % , % 12.9% % % 10.0% % , % 5.1% % 1, , , % 12.9% 1, , % , % 5.1% % 1, , , % 12.9% 1, , % , % 12.9% 1, , % , % 5.1% % 1, , , % 10.1% % , % 7.5% % , % 10.1% 1, , % 1, , , % 7.5% % 1, , , % 10.1% % , % 7.5% % MT = Medium Truck (2 axles with 6 wheels) HT = Heavy Truck (3 or more axles) Assume 25% of trucks are MT, and the rest are HT AM Peak Hour is 8:00 AM to 9:00 AM PM Peak Hour is 5:00 PM to 6:00 PM Blue Text indicates segments added ( )
364 Charlottesville Bypass Traffic - Cross Streets Segment Link Description 2040 Build AM Peak Hour PM Peak Hour ADT % T % of ADT Total Vol Total Truck cars MT HT % of ADT Total Vol Total Truck cars MT HT 84 Barracks Road EB (Btwn Garth Rd & Georgetown Rd) 83 Barracks Road WB (Btwn Garth Rd & Georgetown Rd) 99 Lambs Road NB (Btwn Hydraulic Rd & Ivy Ridge Rd) 100 Lambs Road SB (Btwn Hydraulic Rd & Ivy Ridge Rd) Roslyn Ridge Rd [NOT IN MODEL] 105 Earlysville Rd NB (Btwn Hydraulic Rd & Woodland Rd) 106 Earlysville Rd SB (Btwn Hydraulic Rd & Woodland Rd) Woodburn Road [NOT IN MODEL] Parallel Routes 39 Berkmar Drive Extended NB (btwn Hilton Heights Rd & Rio Mills Rd) 40 Berkmar Drive Extended SB (btwn Hilton Heights Rd & Rio Mills Rd) 41 Berkmar Drive NB (Btwn Woodbrook Dr & Hilton Heights Rd) 42 Berkmar Drive SB (Btwn Woodbrook Dr & Hilton Heights Rd) 45 Berkmar Drive SB (btwn Woodbrook Dr & Rio Road) 46 Berkmar Drive NB (btwn Woodbrook Dr & Rio Road) 51 Rio Road EB (btwn 4 Seasons Dr & Berkmar Dr) 52 Rio Road WB (btwn 4 Seasons Dr & Berkmar Dr) 101 Hydraulic Road SB (Btwn Earlysville Rd & Lambs Rd) 102 Hydraulic Road NB (Btwn Earlysville Rd & Lambs Rd) 103 Rio Rd EB (Btwn Earlysville Rd & 4 Seasons Dr) 104 Rio Rd WB (Btwn Earlysville Rd & 4 Seasons Dr) 8, % 10.1% % , % 7.5% % , % 5.1% % , % 12.9% % % 10.0% % , % 5.1% % , % 12.9% % % 10.0% % , % 5.1% % , % 12.9% % , % 5.1% % , % 12.9% % , % 12.9% % , % 5.1% % , % 10.1% % , % 7.5% % , % 10.1% 1, % , % 7.5% % 1, , , % 10.1% % , % 7.5% % MT = Medium Truck (2 axles with 6 wheels) HT = Heavy Truck (3 or more axles) Assume 25% of trucks are MT, and the rest are HT AM Peak Hour is 8:00 AM to 9:00 AM PM Peak Hour is 5:00 PM to 6:00 PM Blue Text indicates segments added ( )
365 Charlottesville Bypass Traffic - Existing Route 29 Segment Link Description Diurnal Curve 2011 Existing AM Peak Hour PM Peak Hour ADT Total Vol cars MT HT Total Vol cars MT HT /250: Prop Bypass to Barracks Road (NB) K5 24,000 2,429 2, ,296 2, /250: Prop Bypass to Barracks Road (SB) K6 24,000 1,793 1, ,629 2, /250: Barracks Road to Emmet Street (NB) K5 19,000 1,923 1, ,818 1, /250: Barracks Road to Emmet Street (SB) K6 19,000 1,419 1, ,081 2, Seminole Tr: US 250 to Angus Rd (NB) K2 26,000 1,872 1, ,021 1, Seminole Tr: US 250 to Angus Rd (SB) K1 26,000 1,604 1, ,413 2, Seminole Tr: Angus Rd to Hydraulic Rd (NB) K2 26,000 1,872 1, ,021 1, Seminole Tr: Angus Rd to Hydraulic Rd (SB) K1 26,000 1,604 1, ,413 2, Seminole Tr: Hydraulic Rd to Greenbrier Dr (NB) K2 28,500 2,052 1, ,215 2, Seminole Tr: Hydraulic Rd to Greenbrier Dr (SB) K1 28,500 1,758 1, ,645 2, Seminole Tr: Greenbrier Dr to Dominion Dr (NB) K2 28,500 2,052 1, ,215 2, Seminole Tr: Greenbrier Dr to Dominion Dr (SB) K1 28,500 1,758 1, ,645 2, Seminole Tr: Dominion Dr to Berkmar Dr (NB) K2 28,500 2,052 1, ,215 2, Seminole Tr: Dominion Dr to Berkmar Dr (SB) K1 28,500 1,758 1, ,645 2, Seminole Tr: Berkmar Dr to Rio Rd (NB) K2 24,000 1,728 1, ,865 1, Seminole Tr: Berkmar Dr to Rio Rd (SB) K1 24,000 1,480 1, ,228 2, Seminole Tr: Rio Rd to Woodbrook Dr (NB) K2 24,000 1,728 1, ,865 1, Seminole Tr: Rio Rd to Woodbrook Dr (SB) K1 24,000 1,480 1, ,228 2, Seminole Tr: Woodbrook to Carrsbrook/Hilton Hghts (NB) K2 24,000 1,728 1, ,865 1, Seminole Tr: Woodbrook to Carrsbrook/Hilton Hghts (SB) K1 24,000 1,480 1, ,228 2, Seminole Tr: Carrsbrook/Hilton Hghts to Polo Grounds (NB) K2 24,000 1,728 1, ,865 1, Seminole Tr: Carrsbrook/Hilton Hghts to Polo Grounds (SB) K1 24,000 1,480 1, ,228 2, Seminole Tr: Polo Grounds Rd to Prop. Bypass (NB) K2 24,000 1,728 1, ,865 1, Seminole Tr: Polo Grounds Rd to Prop. Bypass (SB) K1 24,000 1,480 1, ,228 2, MT = Medium Truck (2 axles with 6 wheels) HT = Heavy Truck (3 or more axles) Assume 25% of trucks are MT, and the rest are HT AM Peak Hour is 8:00 AM to 9:00 AM PM Peak Hour is 5:00 PM to 6:00 PM
366 Charlottesville Bypass Traffic - Existing Route 29 Segment Link Description /250: Prop Bypass to Barracks Road (NB) /250: Prop Bypass to Barracks Road (SB) 70 29/250: Barracks Road to Emmet Street (NB) 69 29/250: Barracks Road to Emmet Street (SB) Seminole Tr: US 250 to Angus Rd (NB) Seminole Tr: US 250 to Angus Rd (SB) Seminole Tr: Angus Rd to Hydraulic Rd (NB) Seminole Tr: Angus Rd to Hydraulic Rd (SB) Seminole Tr: Hydraulic Rd to Greenbrier Dr (NB) Seminole Tr: Hydraulic Rd to Greenbrier Dr (SB) Seminole Tr: Greenbrier Dr to Dominion Dr (NB) Seminole Tr: Greenbrier Dr to Dominion Dr (SB) Seminole Tr: Dominion Dr to Berkmar Dr (NB) Seminole Tr: Dominion Dr to Berkmar Dr (SB) Seminole Tr: Berkmar Dr to Rio Rd (NB) Seminole Tr: Berkmar Dr to Rio Rd (SB) 9 29 Seminole Tr: Rio Rd to Woodbrook Dr (NB) Seminole Tr: Rio Rd to Woodbrook Dr (SB) 7 29 Seminole Tr: Woodbrook to Carrsbrook/Hilton Hghts (NB) 8 29 Seminole Tr: Woodbrook to Carrsbrook/Hilton Hghts (SB) 5 29 Seminole Tr: Carrsbrook/Hilton Hghts to Polo Grounds (NB) 6 29 Seminole Tr: Carrsbrook/Hilton Hghts to Polo Grounds (SB) 3 29 Seminole Tr: Polo Grounds Rd to Prop. Bypass (NB) 4 29 Seminole Tr: Polo Grounds Rd to Prop. Bypass (SB) MT = Medium Truck (2 axles with 6 wheels) HT = Heavy Truck (3 or more axles) Assume 25% of trucks are MT, and the rest are HT 2015 No-Build AM Peak Hour PM Peak Hour ADT Total Vol cars MT HT Total Vol cars MT HT 25,888 2,620 2, ,477 2, ,888 1,934 1, ,835 2, ,717 2,097 2, ,982 1, ,717 1,547 1, ,269 2, ,827 2,076 2, ,241 2, ,827 1,778 1, ,676 2, ,609 2,060 1, ,224 2, ,609 1,765 1, ,655 2, ,692 2,210 2, ,386 2, ,692 1,893 1, ,849 2, ,780 2,217 2, ,392 2, ,780 1,899 1, ,857 2, ,446 2,193 2, ,366 2, ,446 1,878 1, ,826 2, ,498 1,836 1, ,982 1, ,498 1,573 1, ,367 2, ,753 1,927 1, ,079 2, ,753 1,650 1, ,483 2, ,389 1,900 1, ,051 1, ,389 1,628 1, ,449 2, ,307 1,895 1, ,045 1, ,307 1,623 1, ,442 2, ,089 1,879 1, ,028 1, ,089 1,609 1, ,422 2, AM Peak Hour is 8:00 AM to 9:00 AM PM Peak Hour is 5:00 PM to 6:00 PM
367 Charlottesville Bypass Traffic - Existing Route 29 Segment Link Description /250: Prop Bypass to Barracks Road (NB) /250: Prop Bypass to Barracks Road (SB) 70 29/250: Barracks Road to Emmet Street (NB) 69 29/250: Barracks Road to Emmet Street (SB) Seminole Tr: US 250 to Angus Rd (NB) Seminole Tr: US 250 to Angus Rd (SB) Seminole Tr: Angus Rd to Hydraulic Rd (NB) Seminole Tr: Angus Rd to Hydraulic Rd (SB) Seminole Tr: Hydraulic Rd to Greenbrier Dr (NB) Seminole Tr: Hydraulic Rd to Greenbrier Dr (SB) Seminole Tr: Greenbrier Dr to Dominion Dr (NB) Seminole Tr: Greenbrier Dr to Dominion Dr (SB) Seminole Tr: Dominion Dr to Berkmar Dr (NB) Seminole Tr: Dominion Dr to Berkmar Dr (SB) Seminole Tr: Berkmar Dr to Rio Rd (NB) Seminole Tr: Berkmar Dr to Rio Rd (SB) 9 29 Seminole Tr: Rio Rd to Woodbrook Dr (NB) Seminole Tr: Rio Rd to Woodbrook Dr (SB) 7 29 Seminole Tr: Woodbrook to Carrsbrook/Hilton Hghts (NB) 8 29 Seminole Tr: Woodbrook to Carrsbrook/Hilton Hghts (SB) 5 29 Seminole Tr: Carrsbrook/Hilton Hghts to Polo Grounds (NB) 6 29 Seminole Tr: Carrsbrook/Hilton Hghts to Polo Grounds (SB) 3 29 Seminole Tr: Polo Grounds Rd to Prop. Bypass (NB) 4 29 Seminole Tr: Polo Grounds Rd to Prop. Bypass (SB) MT = Medium Truck (2 axles with 6 wheels) HT = Heavy Truck (3 or more axles) Assume 25% of trucks are MT, and the rest are HT 2015 Build AM Peak Hour PM Peak Hour ADT Total Vol cars MT HT Total Vol cars MT HT 17,122 1,733 1, ,638 1, ,122 1,279 1, ,875 1, ,026 1,318 1, ,246 1, , ,427 1, ,671 1,345 1, ,451 1, ,671 1,152 1, ,733 1, ,506 1,333 1, ,438 1, ,506 1,142 1, ,718 1, ,902 1,649 1, ,780 1, ,902 1,413 1, ,126 2, ,063 1,445 1, ,559 1, ,063 1,238 1, ,862 1, ,519 1,406 1, ,517 1, ,519 1,204 1, ,812 1, ,108 1,304 1, ,407 1, ,108 1,117 1, ,681 1, ,522 1,478 1, ,595 1, ,522 1,266 1, ,905 1, ,267 1,460 1, ,575 1, ,267 1,250 1, ,881 1, ,230 1,457 1, ,572 1, ,230 1,248 1, ,878 1, ,255 1,603 1, ,730 1, ,255 1,373 1, ,066 2, AM Peak Hour is 8:00 AM to 9:00 AM PM Peak Hour is 5:00 PM to 6:00 PM
368 Charlottesville Bypass Traffic - Existing Route 29 Segment Link Description /250: Prop Bypass to Barracks Road (NB) /250: Prop Bypass to Barracks Road (SB) 70 29/250: Barracks Road to Emmet Street (NB) 69 29/250: Barracks Road to Emmet Street (SB) Seminole Tr: US 250 to Angus Rd (NB) Seminole Tr: US 250 to Angus Rd (SB) Seminole Tr: Angus Rd to Hydraulic Rd (NB) Seminole Tr: Angus Rd to Hydraulic Rd (SB) Seminole Tr: Hydraulic Rd to Greenbrier Dr (NB) Seminole Tr: Hydraulic Rd to Greenbrier Dr (SB) Seminole Tr: Greenbrier Dr to Dominion Dr (NB) Seminole Tr: Greenbrier Dr to Dominion Dr (SB) Seminole Tr: Dominion Dr to Berkmar Dr (NB) Seminole Tr: Dominion Dr to Berkmar Dr (SB) Seminole Tr: Berkmar Dr to Rio Rd (NB) Seminole Tr: Berkmar Dr to Rio Rd (SB) 9 29 Seminole Tr: Rio Rd to Woodbrook Dr (NB) Seminole Tr: Rio Rd to Woodbrook Dr (SB) 7 29 Seminole Tr: Woodbrook to Carrsbrook/Hilton Hghts (NB) 8 29 Seminole Tr: Woodbrook to Carrsbrook/Hilton Hghts (SB) 5 29 Seminole Tr: Carrsbrook/Hilton Hghts to Polo Grounds (NB) 6 29 Seminole Tr: Carrsbrook/Hilton Hghts to Polo Grounds (SB) 3 29 Seminole Tr: Polo Grounds Rd to Prop. Bypass (NB) 4 29 Seminole Tr: Polo Grounds Rd to Prop. Bypass (SB) MT = Medium Truck (2 axles with 6 wheels) HT = Heavy Truck (3 or more axles) Assume 25% of trucks are MT, and the rest are HT 2040 No-Build AM Peak Hour PM Peak Hour ADT Total Vol cars MT HT Total Vol cars MT HT 35,325 3,576 3, ,380 3, ,325 2,639 2, ,869 3, ,329 2,969 2, ,806 2, ,329 2,191 2, ,212 3, ,939 3,092 2, ,337 3, ,939 2,649 2, ,986 3, ,646 2,999 2, ,237 3, ,646 2,569 2, ,866 3, ,642 2,999 2, ,237 3, ,642 2,569 2, ,865 3, ,180 3,038 2, ,278 3, ,180 2,602 2, ,915 3, ,158 2,892 2, ,121 3, ,158 2,477 2, ,727 3, ,973 2,375 2, ,563 2, ,973 2,034 1, ,061 2, ,528 2,919 2, ,150 3, ,528 2,500 2, ,762 3, ,339 2,761 2, ,980 2, ,339 2,365 2, ,559 3, ,832 2,725 2, ,941 2, ,832 2,334 2, ,512 3, ,539 2,631 2, ,840 2, ,539 2,254 2, ,392 3, AM Peak Hour is 8:00 AM to 9:00 AM PM Peak Hour is 5:00 PM to 6:00 PM
369 Charlottesville Bypass Traffic - Existing Route 29 Segment Link Description /250: Prop Bypass to Barracks Road (NB) /250: Prop Bypass to Barracks Road (SB) 70 29/250: Barracks Road to Emmet Street (NB) 69 29/250: Barracks Road to Emmet Street (SB) Seminole Tr: US 250 to Angus Rd (NB) Seminole Tr: US 250 to Angus Rd (SB) Seminole Tr: Angus Rd to Hydraulic Rd (NB) Seminole Tr: Angus Rd to Hydraulic Rd (SB) Seminole Tr: Hydraulic Rd to Greenbrier Dr (NB) Seminole Tr: Hydraulic Rd to Greenbrier Dr (SB) Seminole Tr: Greenbrier Dr to Dominion Dr (NB) Seminole Tr: Greenbrier Dr to Dominion Dr (SB) Seminole Tr: Dominion Dr to Berkmar Dr (NB) Seminole Tr: Dominion Dr to Berkmar Dr (SB) Seminole Tr: Berkmar Dr to Rio Rd (NB) Seminole Tr: Berkmar Dr to Rio Rd (SB) 9 29 Seminole Tr: Rio Rd to Woodbrook Dr (NB) Seminole Tr: Rio Rd to Woodbrook Dr (SB) 7 29 Seminole Tr: Woodbrook to Carrsbrook/Hilton Hghts (NB) 8 29 Seminole Tr: Woodbrook to Carrsbrook/Hilton Hghts (SB) 5 29 Seminole Tr: Carrsbrook/Hilton Hghts to Polo Grounds (NB) 6 29 Seminole Tr: Carrsbrook/Hilton Hghts to Polo Grounds (SB) 3 29 Seminole Tr: Polo Grounds Rd to Prop. Bypass (NB) 4 29 Seminole Tr: Polo Grounds Rd to Prop. Bypass (SB) MT = Medium Truck (2 axles with 6 wheels) HT = Heavy Truck (3 or more axles) Assume 25% of trucks are MT, and the rest are HT 2040 Build AM Peak Hour PM Peak Hour ADT Total Vol cars MT HT Total Vol cars MT HT 26,559 2,688 2, ,541 2, ,559 1,984 1, ,909 2, ,315 2,056 1, ,944 1, ,315 1,517 1, ,225 2, ,783 2,361 2, ,548 2, ,783 2,022 1, ,043 2, ,544 2,272 2, ,452 2, ,544 1,946 1, ,928 2, ,852 2,438 2, ,631 2, ,852 2,088 2, ,142 3, ,463 2,266 2, ,445 2, ,463 1,941 1, ,920 2, ,231 2,105 2, ,272 2, ,231 1,803 1, ,713 2, ,583 1,842 1, ,988 1, ,583 1,578 1, ,375 2, ,297 2,470 2, ,666 2, ,297 2,116 2, ,183 3, ,217 2,320 2, ,504 2, ,217 1,987 1, ,990 2, ,755 2,287 2, ,468 2, ,755 1,959 1, ,948 2, ,705 2,355 2, ,542 2, ,705 2,017 1, ,036 2, AM Peak Hour is 8:00 AM to 9:00 AM PM Peak Hour is 5:00 PM to 6:00 PM


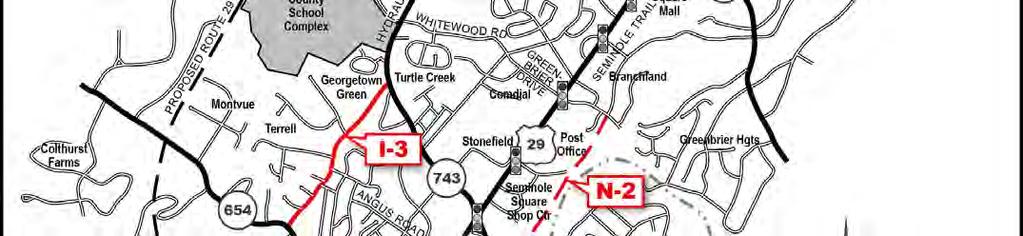

370
TRAFFIC AND TRANSPORTATION TECHNICAL REPORT
 TRAFFIC AND TRANSPORTATION TECHNICAL REPORT for ENVIRONMENTAL ASSESSMENT Route 29 Bypass State Project No.: 0029-002-844, P101; UPC 102419 Federal Project Number: TBD From: Route 250 Bypass To: U.S. Route
CHAPTER 7: EMISSION FACTORS/MOVES MODEL
 CHAPTER 7: EMISSION FACTORS/MOVES MODEL 7.1 Overview This chapter discusses development of the regional motor vehicle emissions analysis for the North Central Texas nonattainment area, including all key
APPENDIX C1 TRAFFIC ANALYSIS DESIGN YEAR TRAFFIC ANALYSIS
 APPENDIX C1 TRAFFIC ANALYSIS DESIGN YEAR TRAFFIC ANALYSIS DESIGN YEAR TRAFFIC ANALYSIS February 2018 Highway & Bridge Project PIN 6754.12 Route 13 Connector Road Chemung County February 2018 Appendix
CR 510/85 Street from CR 512 to 58 Avenue
 Date: November 14, 2017 To: CR 510/ 85 Street PD& Project File From: Metric ngineering, Inc. Subject: FM No.: 405606-2-22-02 Air Quality Screening Test CR 510/85 Street from CR 512 to 58 Avenue Indian
The major roadways in the study area are State Route 166 and State Route 33, which are shown on Figure 1-1 and described below:
 3.5 TRAFFIC AND CIRCULATION 3.5.1 Existing Conditions 3.5.1.1 Street Network DRAFT ENVIRONMENTAL IMPACT REPORT The major roadways in the study area are State Route 166 and State Route 33, which are shown
The Eastern Connector Study November, 2007 planning for the future
 The Eastern Connector Study November, 2007 planning for the future In late 2006, Albemarle County and the City of Charlottesville jointly initiated the Eastern Connector Corridor Study. The Project Team
Proposed location of Camp Parkway Commerce Center. Vicinity map of Camp Parkway Commerce Center Southampton County, VA
 Proposed location of Camp Parkway Commerce Center Vicinity map of Camp Parkway Commerce Center Southampton County, VA Camp Parkway Commerce Center is a proposed distribution and industrial center to be
Alpine Highway to North County Boulevard Connector Study
 Alpine Highway to North County Boulevard Connector Study prepared by Avenue Consultants March 16, 2017 North County Boulevard Connector Study March 16, 2017 Table of Contents 1 Summary of Findings... 1
EXECUTIVE SUMMARY. The following is an outline of the traffic analysis performed by Hales Engineering for the traffic conditions of this project.
 EXECUTIVE SUMMARY This study addresses the traffic impacts associated with the proposed Shopko redevelopment located in Sugarhouse, Utah. The Shopko redevelopment project is located between 1300 East and
APPENDIX E. Traffic Analysis Report
 APPENDIX E Traffic Analysis Report THIS PAGE INTENTIONALLY BLANK EAGLE RIVER TRAFFIC MITIGATION PHASE I OLD GLENN HIGHWAY/EAGLE RIVER ROAD INTERSECTION IMPROVEMENTS TRAFFIC ANALYSIS Eagle River, Alaska
Energy Technical Memorandum
 Southeast Extension Project Lincoln Station to RidgeGate Parkway Prepared for: Federal Transit Administration Prepared by: Denver Regional Transportation District May 2014 Table of Contents Page No. Chapter
Table of Contents INTRODUCTION... 3 PROJECT STUDY AREA Figure 1 Vicinity Map Study Area... 4 EXISTING CONDITIONS... 5 TRAFFIC OPERATIONS...
 Crosshaven Drive Corridor Study City of Vestavia Hills, Alabama Table of Contents INTRODUCTION... 3 PROJECT STUDY AREA... 3 Figure 1 Vicinity Map Study Area... 4 EXISTING CONDITIONS... 5 TRAFFIC OPERATIONS...
1.1 Purpose of This Environmental Impact Report EIR Process Use of This Report Report Organization...
 Table of Contents SUMMARY PAGE S.1 Project Location and Project Characteristics... S-1 S.2 Project Objectives... S-9 S.3 Project Approvals... S-11 S.4 Impacts and Mitigation Measures... S-12 S.5 Alternatives...
I-820 (East) Project Description. Fort Worth District. Reconstruct Southern I-820/SH 121 Interchange
 Project Description. Fort Worth District. Reconstruct Southern I-820/SH 121 Interchange") I-820 (East) Project Description Fort Worth District Reconstruct Southern I-820/SH 121 Interchange I-820 from approximately 2,000 feet north of Pipeline Road/Glenview Drive to approximately 3,200 feet
I-820 (East) Project Description Fort Worth District Reconstruct Southern I-820/SH 121 Interchange I-820 from approximately 2,000 feet north of Pipeline Road/Glenview Drive to approximately 3,200 feet
Traffic Impact Statement (TIS)
") Traffic Impact Statement (TIS) Vincentian PUDA Collier County, FL 10/18/2013 Prepared for: Global Properties of Naples Prepared by: Trebilcock Consulting Solutions, PA 2614 Tamiami Trail N, Suite 615 1205
Traffic Impact Statement (TIS) Vincentian PUDA Collier County, FL 10/18/2013 Prepared for: Global Properties of Naples Prepared by: Trebilcock Consulting Solutions, PA 2614 Tamiami Trail N, Suite 615 1205
TRAFFIC AND TRANSPORTATION TECHNICAL MEMORANDUM
 TRAFFIC AND TRANSPORTATION TECHNICAL MEMORANDUM for ENVIRONMENTAL ASSESSMENT US 460 Bypass Interchange and Southgate Drive Relocation State Project No.: 0460-150-204, P101, R201, C501, B601; UPC 99425
Craig Scheffler, P.E., PTOE HNTB North Carolina, P.C. HNTB Project File: Subject
 TECHNICAL MEMORANDUM To Kumar Neppalli Traffic Engineering Manager Town of Chapel Hill From Craig Scheffler, P.E., PTOE HNTB North Carolina, P.C. Cc HNTB Project File: 38435 Subject Obey Creek TIS 2022
MILLERSVILLE PARK TRAFFIC IMPACT ANALYSIS ANNE ARUNDEL COUNTY, MARYLAND
 MILLERSVILLE PARK TRAFFIC IMPACT ANALYSIS ANNE ARUNDEL COUNTY, MARYLAND Prepared for: Department of Public Works Anne Arundel County Prepared by: URS Corporation 4 North Park Drive, Suite 3 Hunt Valley,
City of Pacific Grove
 Regional Study Utilizing Caltrans Intersection Evaluation Section 7: City of Pacific Grove s: FIRST STREET AT CENTRAL AVENUE Transportation Agency for Monterey County Prepared by Transportation Agency
To: File From: Adrian Soo, P. Eng. Markham, ON File: Date: August 18, 2015
 Memo To: From: Adrian Soo, P. Eng. Markham, ON : 165620021 Date: Reference: E.C. Row Expressway, Dominion Boulevard Interchange, Dougall Avenue Interchange, and Howard 1. Review of Interchange Geometry
RTE. 1 at RTE. 637 & RTE. 639
 INTERSECTION SAFETY STUDY Prepared for: Virginia Department of Transportation Central Region Operations Traffic Engineering (UPC #81378, TO 12-092) DAVENPORT Project Number: 13-368 / /2014 RTE. 1 at RTE.
TIMBERVINE TRANSPORTATION IMPACT STUDY FORT COLLINS, COLORADO JANUARY Prepared for:
 TIMBERVINE TRANSPORTATION IMPACT STUDY FORT COLLINS, COLORADO JANUARY 2014 Prepared for: Hartford Companies 1218 W. Ash Street Suite A Windsor, Co 80550 Prepared by: DELICH ASSOCIATES 2272 Glen Haven Drive
STATE IMPLEMENTATION PLAN CREDIT FOR EMISSION REDUCTIONS GENERATED THROUGH INCENTIVE PROGRAMS (Adopted June 20, 2013)
") RULE 9610 STATE IMPLEMENTATION PLAN CREDIT FOR EMISSION REDUCTIONS GENERATED THROUGH INCENTIVE PROGRAMS (Adopted June 20, 2013) 1.0 Purpose The purpose of this rule is to provide an administrative mechanism
RULE 9610 STATE IMPLEMENTATION PLAN CREDIT FOR EMISSION REDUCTIONS GENERATED THROUGH INCENTIVE PROGRAMS (Adopted June 20, 2013) 1.0 Purpose The purpose of this rule is to provide an administrative mechanism
Highway 18 BNSF Railroad Overpass Feasibility Study Craighead County. Executive Summary
 Highway 18 BNSF Railroad Overpass Feasibility Study Craighead County Executive Summary October 2014 Highway 18 BNSF Railroad Overpass Feasibility Study Craighead County Executive Summary October 2014 Prepared
La Canada Flintridge Parents for Healthy Air November 1, 2018 Presented by Elizabeth Krider, Ph.D., Esther Kornfeld and Tamar Tujian
 Concerns regarding the Devil s Gate Sediment Removal Project 1. New science demands new assessment of health risks to 3,000 sensitive receptors nearby. a. Air pollution is the new tobacco health crisis,
LAWRENCE TRANSIT CENTER LOCATION ANALYSIS 9 TH STREET & ROCKLEDGE ROAD / 21 ST STREET & IOWA STREET LAWRENCE, KANSAS
 LAWRENCE TRANSIT CENTER LOCATION ANALYSIS 9 TH STREET & ROCKLEDGE ROAD / 21 ST STREET & IOWA STREET LAWRENCE, KANSAS TRAFFIC IMPACT STUDY FEBRUARY 214 OA Project No. 213-542 TABLE OF CONTENTS 1. INTRODUCTION...
Public Information Workshop
 Public Information Workshop Charlotte County-Punta Gorda MPO - Meeting Rooms A and B March 29, 2018 Welcome to the Public Information Workshop for Harborview Road Project Development and Environment (PD&E)
Richmond, Virginia 8-Hour Ozone Maintenance Area Transportation Conformity Analysis
 , Virginia 8-Hour Ozone Maintenance Area Transportation Conformity Analysis FY 09-12 TIP and 2031 Long Range Transportation Plan DRAFT Report Prepared by: Virginia Department of Transportation April 2008
REASONABLE FURTHER PROGRESS REPORT FOR THE MONO BASIN PM-10 STATE IMPLEMENTATION PLAN
 REASONABLE FURTHER PROGRESS REPORT FOR THE MONO BASIN PM-10 STATE IMPLEMENTATION PLAN September 2001 This document provides a progress report on air quality trends in the Mono Basin federal PM-10 1 nonattainment
RTID Travel Demand Modeling: Assumptions and Method of Analysis
 RTID Travel Demand Modeling: Assumptions and Method of Analysis Overall Model and Scenario Assumptions The Puget Sound Regional Council s (PSRC) regional travel demand model was used to forecast travel
Technical Feasibility Report
 Prepared For: Bow Concord I-93 Improvements Project Bow and Concord, NH Prepared By: 53 Regional Drive Concord, NH 03301 NHDOT Project # 13742 Federal Project #T-A000(018) September 2018 TABLE OF CONTENTS
Clean Harbors Canada, Inc.
 Clean Harbors Canada, Inc. Proposed Lambton Landfill Expansion Environmental Assessment Terms of Reference Transportation Assessment St. Clair Township, Ontario September 2009 itrans Consulting Inc. 260
Interstate Operations Study: Fargo-Moorhead Metropolitan Area Simulation Output
 NDSU Dept #2880 PO Box 6050 Fargo, ND 58108-6050 Tel 701-231-8058 Fax 701-231-6265 www.ugpti.org www.atacenter.org Interstate Operations Study: Fargo-Moorhead Metropolitan Area 2015 Simulation Output Technical
Date: February 7, 2017 John Doyle, Z-Best Products Robert Del Rio. T.E. Z-Best Traffic Operations and Site Access Analysis
 Memorandum Date: February 7, 07 To: From: Subject: John Doyle, Z-Best Products Robert Del Rio. T.E. Z-Best Traffic Operations and Site Access Analysis Introduction Hexagon Transportation Consultants, Inc.
Open House. Highway212. Meetings. Corridor Access Management, Safety & Phasing Plan. 5:30 to 6:30 p.m. - Southwest Corridor Transportation Coalition
 Welcome Meetings 5:30 to 6:30 p.m. - Southwest Corridor Transportation Coalition 6:30 to 8:00 p.m. - Open House Why is Highway 212 Project Important? Important Arterial Route Local Support Highway 212
Traffic Engineering Study
 Traffic Engineering Study Bellaire Boulevard Prepared For: International Management District Technical Services, Inc. Texas Registered Engineering Firm F-3580 November 2009 Executive Summary has been requested
Interstate Operations Study: Fargo-Moorhead Metropolitan Area Simulation Results
 NDSU Dept #2880 PO Box 6050 Fargo, ND 58108-6050 Tel 701-231-8058 Fax 701-231-6265 www.ugpti.org www.atacenter.org Interstate Operations Study: Fargo-Moorhead Metropolitan Area 2025 Simulation Results
Bennett Pit. Traffic Impact Study. J&T Consulting, Inc. Weld County, Colorado. March 3, 2017
 Bennett Pit Traffic Impact Study J&T Consulting, Inc. Weld County, Colorado March 3, 217 Prepared By: Sustainable Traffic Solutions, Inc. http://www.sustainabletrafficsolutions.com/ Joseph L. Henderson,
Appendix C SIP Creditable Incentive-Based Emission Reductions Moderate Area Plan for the 2012 PM2.5 Standard
 Appendix C SIP Creditable Incentive-Based Emission Reductions This page intentionally blank. Appendix C: SIP Creditable Incentive-Based Emission Reductions Appendix C: SIP Creditable Incentive-Based Emission
Section 5.0 Traffic Information
 Section 5.0 Traffic Information 10.0 TRANSPORTATION MDM Transportation Consultants, Inc. (MDM) has prepared an evaluation of transportation impacts for the proposed evaluation for the expansion of the
3.17 Energy Resources
 3.17 Energy Resources 3.17.1 Introduction This section characterizes energy resources, usage associated with the proposed Expo Phase 2 project, and the net energy demand associated with changes to the
ELECTRICAL GENERATING STEAM BOILERS, REPLACEMENT UNITS AND NEW UNITS (Adopted 1/18/94; Rev. Adopted & Effective 12/12/95)
") RULE 69. ELECTRICAL GENERATING STEAM BOILERS, REPLACEMENT UNITS AND NEW UNITS (Adopted 1/18/94; Rev. Adopted & Effective 12/12/95) (a) APPLICABILITY (1) Except as provided in Section (b) or otherwise specified
RULE 69. ELECTRICAL GENERATING STEAM BOILERS, REPLACEMENT UNITS AND NEW UNITS (Adopted 1/18/94; Rev. Adopted & Effective 12/12/95) (a) APPLICABILITY (1) Except as provided in Section (b) or otherwise specified
Regulatory Announcement
 EPA Finalizes More Stringent Emissions Standards for Locomotives and Marine Compression-Ignition Engines The U.S. Environmental Protection Agency (EPA) is adopting standards that will dramatically reduce
MEMO VIA . Ms. Amy Roth DPS Director, City of Three Rivers. To:
 MEMO To: Ms. Amy Roth DPS Director, City of Three Rivers VIA EMAIL From: Michael J. Labadie, PE Julie M. Kroll, PE, PTOE Brandon Hayes, PE, P.Eng. Fleis & VandenBrink Date: January 5, 2017 Re: Proposed
Mr. Kyle Zimmerman, PE, CFM, PTOE County Engineer
 Los Alamos County Engineering Division 1925 Trinity Drive, Suite B Los Alamos, NM 87544 Attention: County Engineer Dear Kyle: Re: NM 502 Transportation Corridor Study and Plan Peer Review Los Alamos, New
Review of the SMAQMD s Construction Mitigation Program Enhanced Exhaust Control Practices February 28, 2018, DRAFT for Outreach
 ABSTRACT The California Environmental Quality Act (CEQA) review process requires projects to mitigate their significant impacts. The Sacramento Metropolitan Air Quality Management District (SMAQMD or District)
CLRP. Performance Analysis of The Draft 2014 CLRP. Long-Range Transportation Plan For the National Capital Region
 NATIONAL CAPITAL REGION TRANSPORTATION PLANNING BOARD Item 12 CLRP Financially Constrained Long-Range Transportation Plan For the National Capital Region 2014 Performance Analysis of The Draft 2014 CLRP
Safety Assessment. Intersection of Route 29 (Seminole Trail) and Ashwood Blvd (Route 1670). Albemarle County
 and Ashwood Blvd (Route 1670). Albemarle County") Safety Assessment for Intersection of Route 29 (Seminole Trail) and Ashwood Blvd (Route 1670). Albemarle County Prepared by: VIRGINIA DEPARTMENT OF TRANSPORTATION Northwestern Regional Operations - Traffic
Safety Assessment for Intersection of Route 29 (Seminole Trail) and Ashwood Blvd (Route 1670). Albemarle County Prepared by: VIRGINIA DEPARTMENT OF TRANSPORTATION Northwestern Regional Operations - Traffic
TRAFFIC IMPACT STUDY VICDOM BROCK ROAD PIT EXPANSION
 TRAFFIC IMPACT STUDY VICDOM BROCK ROAD PIT EXPANSION TOWNSHIP OF UXBRIDGE P/N 05-1993 June 2011 Revised -August 2011 Prepared by: Skelton, Brumwell & Associates Inc. 93 Bell Farm Road, Suite 107 Barrie,
APPENDIX B Traffic Analysis
 APPENDIX B Traffic Analysis Rim of the World Unified School District Reconfiguration Prepared for: Rim of the World School District 27315 North Bay Road, Blue Jay, CA 92317 Prepared by: 400 Oceangate,
Town of Londonderry, New Hampshire NH Route 28 Western Segment Traffic Impact Fee Methodology
 Town of Londonderry, New Hampshire NH Route 28 Western Segment Traffic Impact Fee Methodology Prepared by the Londonderry Community Development Department Planning & Economic Development Division Based
Regulatory and Permitting Requirements of Stationary Generators In Delaware
 Regulatory and Permitting Requirements of Stationary Generators In Delaware Delaware - DNREC Air Quality Management February 7, 2006 Mark A. Prettyman and Guadalupe J. Reynolds Outline Regulation No. 1144
2012 Air Emissions Inventory
 SECTION 6 HEAVY-DUTY VEHICLES This section presents emissions estimates for the heavy-duty vehicles (HDV) source category, including source description (6.1), geographical delineation (6.2), data and information
MEMORANDUM. Figure 1. Roundabout Interchange under Alternative D
 MEMORANDUM Date: To: Liz Diamond, Dokken Engineering From: Subject: Dave Stanek, Fehr & Peers Western Placerville Interchanges 2045 Analysis RS08-2639 Fehr & Peers has completed a transportation analysis
Merger of the generator interconnection processes of Valley Electric and the ISO;
 California Independent System Operator Corporation Memorandum To: ISO Board of Governors From: Karen Edson Vice President, Policy & Client Services Date: August 18, 2011 Re: Decision on Valley Electric
Table Existing Traffic Conditions for Arterial Segments along Construction Access Route. Daily
 5.8 TRAFFIC, ACCESS, AND CIRCULATION This section describes existing traffic conditions in the project area; summarizes applicable regulations; and analyzes the potential traffic, access, and circulation
Metro and you, building together.
 metro.net Metro and you, building together. Compliance Guide to Construction Vehicles and Equipment Off-Road off-road equipment Idling effective June 15, 2008 requirement ARB s regulation, Title 13, CCR,
MAP OR PHOTO. Public Meeting & Open House July 23, Project Roadway Limits From: FM 1957 To: FM 471. Counties Bexar & Medina
 Public Meeting & Open House July 23, 2013 Project Roadway Limits From: FM 1957 To: FM 471 MAP OR PHOTO Counties Bexar & Medina 1 I. Project History II. III. IV. Project Overview Project Alternatives Response
AIR QUALITY PERMIT. 7 Foundation Drive Savannah, Georgia (Chatham County)
") AIR QUALITY PERMIT Permit No. Effective Date April 11, 2016 In accordance with the provisions of the Georgia Air Quality Act, O.C.G.A. Section 12-9-1, et seq and the Rules, Chapter 391-3-1, adopted pursuant
AIR QUALITY PERMIT Permit No. Effective Date April 11, 2016 In accordance with the provisions of the Georgia Air Quality Act, O.C.G.A. Section 12-9-1, et seq and the Rules, Chapter 391-3-1, adopted pursuant
Sound Transit East Link: Bus/LRT System Integration Study
 Sound Transit East Link: Bus/LRT System Integration Study Prepared For: Sound Transit King County Metro Mercer Island WSDOT Prepared By: CH2M HILL July, 2014 1 SOUND TRANSIT EAST LINK: BUS/LRT SYSTEMES
V. DEVELOPMENT OF CONCEPTS
 Martin Luther King, Jr. Drive Extension FINAL Feasibility Study Page 9 V. DEVELOPMENT OF CONCEPTS Throughout the study process several alternative alignments were developed and eliminated. Initial discussion
CHARACTERIZATION AND DEVELOPMENT OF TRUCK LOAD SPECTRA FOR CURRENT AND FUTURE PAVEMENT DESIGN PRACTICES IN LOUISIANA
 CHARACTERIZATION AND DEVELOPMENT OF TRUCK LOAD SPECTRA FOR CURRENT AND FUTURE PAVEMENT DESIGN PRACTICES IN LOUISIANA LSU Research Team Sherif Ishak Hak-Chul Shin Bharath K Sridhar OUTLINE BACKGROUND AND
Ambient PM 10 Monitoring Sechelt, B.C Update
 Ministry of Environment LOWER MAINLAND REGION Ambient PM 10 Monitoring Sechelt, B.C. 2004-2005 Update E N V I R O N M E N T A L Q U A L I T Y Library and Archives Canada Cataloguing in Publication Data
Air Quality Benefits from Tier 3 Low Sulfur Gasoline Program Arthur Marin, NESCAUM
 Air Quality Benefits from Tier 3 Low Sulfur Gasoline Program Arthur Marin, NESCAUM MWAQC Meeting Washington, DC December 14, 2011 Presentation Overview EPA s expected Tier 3 low sulfur gasoline proposal
Letter of Transmittal
 Letter of Transmittal To: Chris Lovell City of Richmond Hill Date: 5/2/6 Job 2582 Re: Richmond Hill-South Bryan County Transportation STudy WE ARE SENDING YOU THE FOLLOWING ITEMS ( attached) ( under separate
Transportation & Traffic Engineering
 Transportation & Traffic Engineering 1) Project Description This report presents a summary of findings for a Traffic Impact Analysis (TIA) performed by A+ Engineering, Inc. for the Hill Country Family
BROWARD BOULEVARD CORRIDOR TRANSIT STUDY
 BROWARD BOULEVARD CORRIDOR TRANSIT STUDY FM # 42802411201 EXECUTIVE SUMMARY July 2012 GOBROWARD Broward Boulevard Corridor Transit Study FM # 42802411201 Executive Summary Prepared For: Ms. Khalilah Ffrench,
This is a new permit condition titled, "2D.1111 Subpart ZZZZ, Part 63 (Existing Non-Emergency nonblack start CI > 500 brake HP)"
") This is a new permit condition titled, "2D.1111 Subpart ZZZZ, Part 63 (Existing Non-Emergency nonblack start CI > 500 brake HP)" Note to Permit Writer: This condition is for existing engines (commenced
This is a new permit condition titled, "2D.1111 Subpart ZZZZ, Part 63 (Existing Non-Emergency nonblack start CI > 500 brake HP)" Note to Permit Writer: This condition is for existing engines (commenced
Key Project Elements Status Report
 Los Angeles County Metropolitan Transportation Authority Key Project Elements Status Report presented to the Corridor Advisory Committee August 18, 2016 Background Motion 22.1 elements are grouped into
Rocky Mount. Transportation Plan. Transportation Planning Division. Virginia Department of Transportation
 2020 Transportation Plan Developed by the Transportation Planning Division of the Virginia Department of Transportation in cooperation with the U.S. Department of Transportation, Federal Highway Administration
Shirk Road at State Route 198 Interchange Analysis Tulare County, California
 Shirk Road at State Route 198 Interchange Analysis Tulare County, California DRAFT REPORT Prepared By Tulare County Association of Governments (TCAG) April 2013 Table of Contents Introduction:... 3 Project
EPA Tier 4 and the Electric Power Industry
 EPA Tier 4 and the Electric Power Industry The initiative to lower diesel engine emissions started with on-highway engines in 1973 and now extends to non-road mobile equipment, marine and locomotive engines,
INTERSECTION CONTROL EVALUATION
 INTERSECTION CONTROL EVALUATION Trunk Highway 22 and CSAH 21 (E Hill Street/Shanaska Creek Road) Kasota, Le Sueur County, Minnesota November 2018 Trunk Highway 22 and Le Sueur CSAH 21 (E Hill Street/Shanaska
Southern Windsor County 2016 Traffic Count Program Summary April 2017
 Southern Windsor County 2016 Traffic Count Program Summary April 2017 The Southern Windsor County Regional Planning Commission (the RPC ) has been monitoring traffic at 19 locations throughout the southern
Facility Name: Georgia-Pacific Consumer Products LP Savannah River Mill City: Rincon County: Effingham AIRS #: Application #: 40890
 Facility Name: Georgia-Pacific Consumer Products LP Savannah River Mill City: Rincon County: Effingham AIRS #: 04-13-103-00007 Application #: 40890 Date SIP Application Received: March 7, 2016 Date Title
TRAFFIC IMPACT STUDY DERRY GREEN CORPORATE BUSINESS PARK MILTON SECONDARY PLAN MODIFICATION
 TRAFFIC IMPACT STUDY DERRY GREEN CORPORATE BUSINESS PARK MILTON SECONDARY PLAN MODIFICATION TRAFFIC IMPACT STUDY DERRY GREEN CORPORATE BUSINESS PARK MILTON SECONDARY PLAN MODIFICATION DECEMBER 24 UPDATED
GEORGIA DEPARTMENT OF TRANSPORTATION
 GEORGIA DEPARTMENT OF TRANSPORTATION Statewide Truck Lanes Needs Identification Study SR 21 CORRIDOR NEEDS ANALYSIS PREPARED FOR Georgia Department of Transportation Office of Planning #2 Capitol Square
TRAFFIC IMPACT ANALYSIS
 TRAFFIC IMPACT ANALYSIS Emerald Isle Commercial Development Prepared by SEPI Engineering & Construction Prepared for Ark Consulting Group, PLLC March 2016 I. Executive Summary A. Site Location The Emerald
4 COSTS AND OPERATIONS
 4 COSTS AND OPERATIONS 4.1 INTRODUCTION This chapter summarizes the estimated capital and operations and maintenance (O&M) costs for the Modal and High-Speed Train (HST) Alternatives evaluated in this
March 2, 2017 Integrating Transportation Planning, Project Development, and Project Programming
 COORDINATION WITH VDOT DISTRICTS TO DELIVER IMPLEMENTABLE IMPROVEMENT PROJECTS March 2, 2017 Integrating Transportation Planning, Project Development, and Project Programming PRESENTATION OUTLINE What
Additional $200 Speeding Fine Signs
 CITY OF CHARLOTTESVILLE, VIRGINIA CITY COUNCIL AGENDA Agenda Date: June 18, 2007 Action Required: Presenter: Staff Contacts: Title: Adopt Ordinance Jeanie Alexander, P.E. Jeanie Alexander Additional $200
Zorik Pirveysian, Air Quality Policy and Management Division Manager Policy and Planning Department
 Environment Committee Meeting: April 11, 2006 To: From: Environment Committee Zorik Pirveysian, Air Quality Policy and Management Division Manager Policy and Planning Department Date: March 20, 2006 Subject:
Mobile Source Air Toxics: Overview and Regulatory Background
 Mobile Source Air Toxics: Overview and Regulatory Background Melanie Zeman USEPA Region 2 Northern Transportation & Air Quality Summit August 14, 2008 About MSATs More than 1000 compounds have been identified
CO 2 Emissions from Cars, Trucks & Buses in the Metropolitan Washington Region
 CO 2 Emissions from Cars, Trucks & Buses in the Metropolitan Washington Region Presentation to the COG Climate Change Steering Committee Ronald F. Kirby Director of Transportation Planning June 27, 2007
Travel Forecasting Methodology
 Travel Forecasting Methodology Introduction This technical memorandum documents the travel demand forecasting methodology used for the SH7 BRT Study. This memorandum includes discussion of the following:
REMOTE SENSING DEVICE HIGH EMITTER IDENTIFICATION WITH CONFIRMATORY ROADSIDE INSPECTION
 Final Report 2001-06 August 30, 2001 REMOTE SENSING DEVICE HIGH EMITTER IDENTIFICATION WITH CONFIRMATORY ROADSIDE INSPECTION Bureau of Automotive Repair Engineering and Research Branch INTRODUCTION Several
Pollution from ships in Copenhagen Port and the effect on city air quality
 June 4, 2014 Pollution from ships in Copenhagen Port and the effect on city air quality Helge Rørdam Olesen DCE Danish Centre for Environment and Energy Department of Environmental Science With input from
Craigieburn Employment Precinct North and English Street
 Craigieburn Employment Precinct North and English Street METROPOLITAN PLANNING AUTHORITY Intersection Analyses 7 February 2014 Intersection Analyses Craigieburn Employment Precinct North and English Street
Evolution Of Tier 4 Regulations & Project Specific Diesel Engine Emissions Requirements
 Evolution Of Tier 4 Regulations & Project Specific Diesel Engine Emissions Requirements Association of Equipment Managers (AEM) CONEXPO / CON-AGG 2014 Las Vegas, NV March 5, 2014 1 1 Topics To Be Covered
King County Metro. Columbia Street Transit Priority Improvements Alternative Analysis. Downtown Southend Transit Study. May 2014.
 King County Metro Columbia Street Transit Priority Improvements Alternative Analysis Downtown Southend Transit Study May 2014 Parametrix Table of Contents Introduction... 1 Methodology... 1 Study Area...
AASHTO Policy on Geometric Design of Highways and Streets
 AASHTO Policy on Geometric Design of Highways and Streets 2001 Highlights and Major Changes Since the 1994 Edition Jim Mills, P.E. Roadway Design Office 605 Suwannee Street MS-32 Tallahassee, FL 32399-0450
This rule shall apply to any stationary source which is a major source of regulated air pollutants or of hazardous air pollutants.
 RULE 2530 FEDERALLY ENFORCEABLE POTENTIAL TO EMIT (Adopted June 15, 1995; Amended April 25, 2002; Amended December 18, 2008, but not in effect until June 10, 2010) 1.0 Purpose The purpose of this rule
Report Addendum. Terry Keller, SDDOT. Noise Study Technical Report I-29 from Tea Interchange to Skunk Creek Sioux Falls, South Dakota
 Report Addendum To: Terry Keller, SDDOT From: HDR Project: Noise Study Technical Report I-29 from Tea Interchange to Skunk Creek Sioux Falls, South Dakota cc: file Date: May 28, 2010; rev July 16, July
Escondido Marriott Hotel and Mixed-Use Condominium Project TRAFFIC IMPACT ANALYSIS REPORT
 Escondido Marriott Hotel and Mixed-Use Condominium Project TRAFFIC IMPACT ANALYSIS REPORT Prepared for Phelps Program Management 420 Sixth Avenue, Greeley, CO 80632 Prepared by 5050 Avenida Encinas, Suite
Operating & Maintenance Cost Results Report
 Operating & Maintenance Cost Results Report Prepared for: Hennepin County Regional Railroad Authority Prepared by: Connetics Transportation Group Under Contract To: Kimley-Horn and Associates FINAL June
A IR Q UALITY A PPENDIX
 A P P E N D I X B A IR Q UALITY A PPENDIX... CO EWP Petaluma East Washington Place, Petaluma CARBON MONOXIDE ANALYSIS PM Peak Hour Assumes worst case of all intersections based on total volume, LOS and
TALMONT TOWNHOMES MADISON KENNETH SPA TRAFFIC IMPACT STUDY. Sacramento, CA. Prepared For: MBK Homes. Prepared By:
 TALMONT TOWNHOMES MADISON KENNETH SPA TRAFFIC IMPACT STUDY Sacramento, CA Prepared For: MBK Homes Prepared By: KD Anderson & Associates 3853 Taylor Road, Suite G Loomis, California 95650 (916) 660-1555
Speed measurements were taken at the following three locations on October 13 and 14, 2016 (See Location Map in Exhibit 1):
:") 2709 McGraw Drive Bloomington, Illinois 61704 p 309.663.8435 f 309.663.1571 www.f-w.com www.greennavigation.com November 4, 2016 Mr. Kevin Kothe, PE City Engineer City of Bloomington Public Works Department
2709 McGraw Drive Bloomington, Illinois 61704 p 309.663.8435 f 309.663.1571 www.f-w.com www.greennavigation.com November 4, 2016 Mr. Kevin Kothe, PE City Engineer City of Bloomington Public Works Department
Mississauga Bus Rapid Transit Preliminary Design Project
 Mississauga Bus Rapid Transit Preliminary Design Project PUBLIC INFORMATION CENTRE OCTOBER 2008 WELCOME The Mississauga Bus Rapid Transit (BRT) Project Thank you for attending this Public Information Centre.
Public Works and Infrastructure Committee. General Manager, Transportation Services and Treasurer. P:\2015\Internal Services\rev\pw15018rev (AFS20761)
") Increases to Parking Ticket Set Fines STAFF REPORT ACTION REQUIRED Date: September 14, 2015 To: From: Wards: Reference Number: Public Works and Infrastructure Committee General Manager, Transportation
Increases to Parking Ticket Set Fines STAFF REPORT ACTION REQUIRED Date: September 14, 2015 To: From: Wards: Reference Number: Public Works and Infrastructure Committee General Manager, Transportation