CLRP. Performance Analysis of The Draft 2014 CLRP. Long-Range Transportation Plan For the National Capital Region
|
|
|
- Jared Baker
- 6 years ago
- Views:
Transcription

1 NATIONAL CAPITAL REGION TRANSPORTATION PLANNING BOARD Item 12 CLRP Financially Constrained Long-Range Transportation Plan For the National Capital Region 2014 Performance Analysis of The Draft 2014 CLRP Presentation to the Transportation Planning Board September 17, 2014
2 What is the Long-Range Transportation Plan (CLRP)?»» The CLRP identifies regionally significant transportation projects and programs that are planned between now and Over 500 Projects are included from simple highway landscaping projects to billion-dollar highway and transit projects (includes 7% more lane miles of roadway, and 15% more miles of transit rail) Funding for programs that aim to make the transportation system in Metropolitan Washington better and more efficient»» Some specific projects in the CLRP include: Metro s Silver Line and Columbia Pike Streetcar (in VA) The Purple Line and the Corridor Cities Transitway (in MD) The H. St. / Benning Rd. Streetcar (in DC) Approx. 1,200 new lane-miles of roadway including Express Toll lanes on I-95 in VA 25 improved highway interchanges Clrp Long-Range Transportation Plan For a complete listing of projects and programs in the CLRP, visit: 2
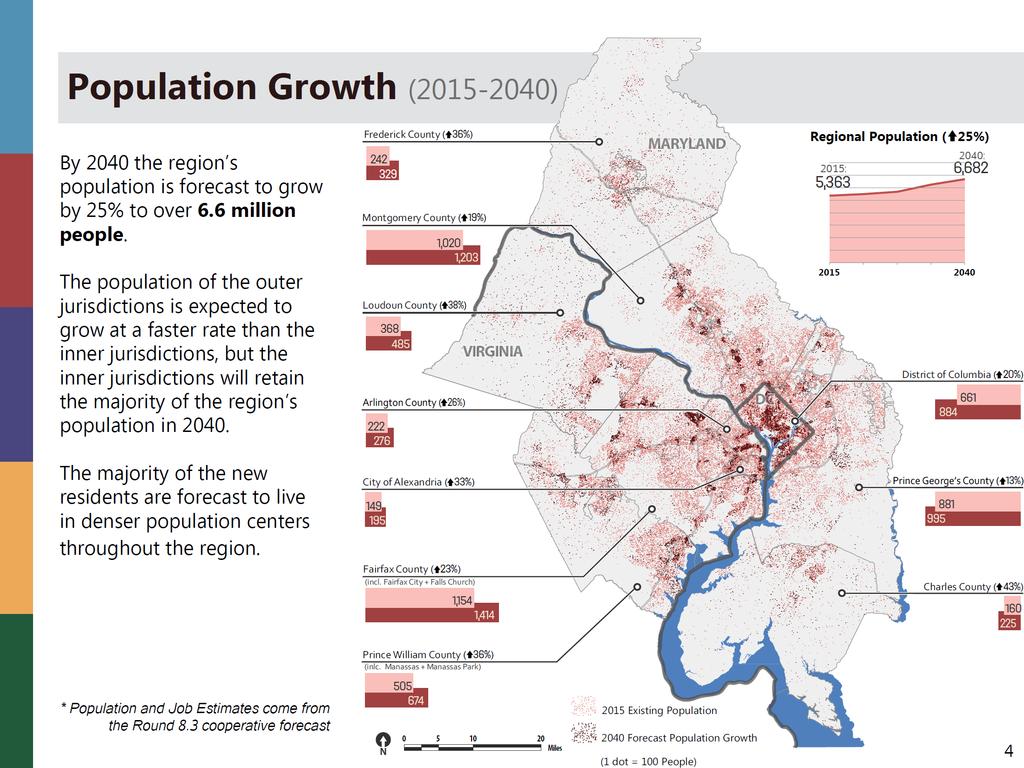
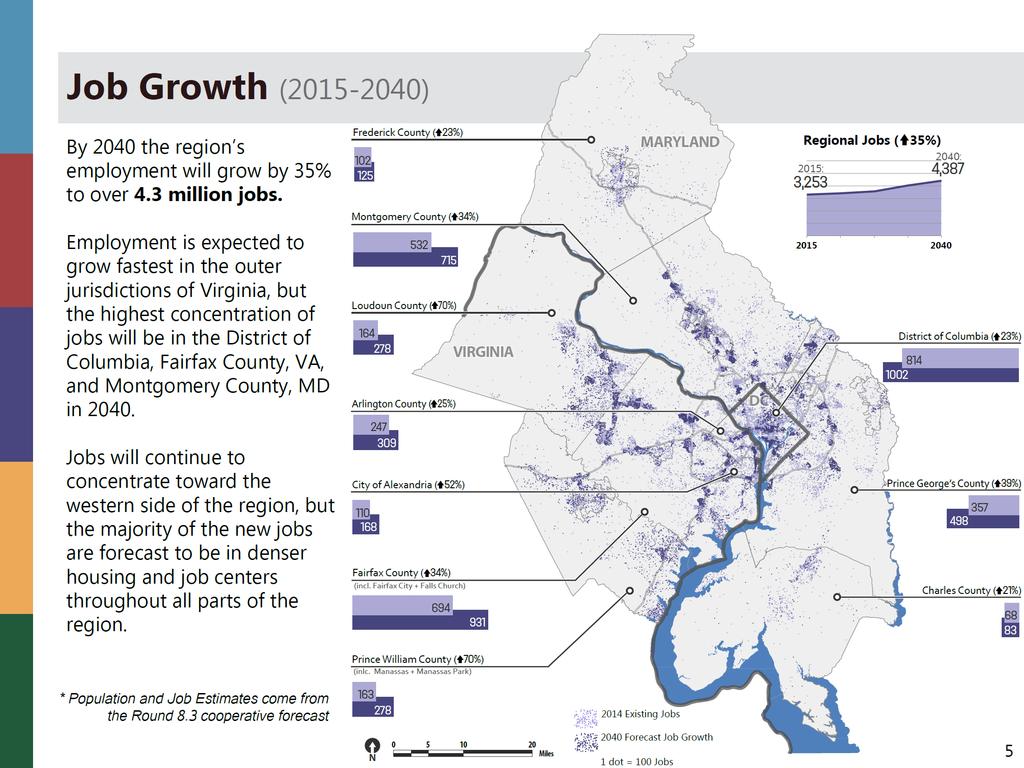
3 2014 CLRP Performance Summary (-) Population Employment Lane Miles All Trips Vehicle Miles Travelled (VMT) VMT per capita Share of Lane Miles Congested (AM Peak) +7% Transit Rail Miles +15% (Metro, MARC/VRE, Light Rail) -3% +20% +25% +24% +35% Transit Trips +32% Share of VMT on Congested Roadways (AM Peak) Changes in Land Use, Transportation Network, and Travel Demand - Truck Trips +22% +42% +63% 0% 20% 40% 60% % Change The region is forecast to be home to 25% more residents and 35% more jobs in. To accommodate growth, 7% more lane miles of roadway and 15% more transit rail miles are planned to be constructed. The total number of trips taken is expected to increase by 24%, while transit trips are expected to rise faster than overall trips. The overall amount of driving (VMT) is expected to grow by 20%. This slightly less than forecast population growth, which means that VMT per capita is expected to drop by 3%. The increase in demand on the roadways is forecast to out-pace the increase in supply, leading to a significant increase in congestion. 3
4
5
6 Growth in Activity Centers (-) Population 1,320,000 New People Jobs 1,134,000 New Jobs Outside of ACs 42% 58% Inside of ACs Outside of ACs 24% 76% Inside of ACs % 40% % 24% Households (in 1000s) Inside Centers Outside of Centers Inside Outside of Centers Centers Jobs (in 1000s) The majority of new jobs and population are forecast to be in housing and job centers referred to as Regional Activity Centers. Though the majority of the regional population will remain outside of Activity Centers in, population is forecast to increase at a faster rate inside Activity Centers over the next 25 years. The majority of jobs today are located in Activity Centers, and this trend will continue in the future. 6
7 Daily Travel - Mode Share (-) 40% 7% 40% 7% 17,000,000 Trips/Day 11% 21,000,000 Trips/Day 14% 42% 39% Single Driver HOV + Carpool Bus + Rail Transit Walk + Bicycle In, 4 million more trips are forecast to be taken everyday using all modes on the region s transportations system. By, the share of trips made by drivers of single-occupant vehicles are expected to drop by a few percentage points, while the share of carpool trips and non-motorized vehicle trips are expected to increase slightly. 7
8 Daily Travel - Trips by Mode (-) 25,000 20,000 15,000 10, trips in 1000 s 1,942 1,172 6,814 7,079 2,899 1,544 8,504 8, , % From more trips 372,000 more trips 1,690,000 more trips 1,076,000 more trips Walk + Bicycle Transit HOV + Carpool Single Driver +32% From +25% From +15% From Although mode share is not forecast to change significantly, the number of trips taken using each mode will rise substantially. The number of single driver trips is expected to increase by 15%, which is slower than all other modes in the model, while carpooling is expected to increase by 25%. The transit system is forecast to accommodate 32% more trips, which is just over 370,000 new trips per day. And a nearly 1 million new non-motorzied trips are expected, which is a 49% increase from today. 8
9 Daily Travel - Mode Share by Core, Inner, & Outer suburbs Regional Core 30% 27% 19% 26% 26% 25% 18% 32% Total: 2,986 Total: 3,691 Single Driver HOV + Carpool Bus + Rail Transit 39% Walk + Bicycle Inner Suburbs 42% 42% 6% 10% Total: 9,263 39% 42% 7% 12% Total: 11,056 1% 7% Outer Suburbs trips in 1000 s 48% 45% 44% Total: 3,724 45% 2% 8% Total: 5, ,000 12,000 In the regional core, the share of single driver trips are expected to decrease in favor of more nonmotorized trips. In the inner suburbs the share of single driver trips are expected to drop slightly while of transit and non-motorized trips increases slightly. In the outer suburbs, the share of single driver trips are expected to go down while transit, carpool, and non-motorized trips are expected to increase slightly. 9
10 New Trips in Activity Centers (-) Share of New Trips Beginning in Activity Centers By Mode (-) 56% of all new SOV trips will begin in AC Share of New Trips Ending in Activity Centers By Mode (-) 67% of all new SOV trips will end in ACs Single Driver 2,267 Single Driver 2,267 52% of all new Carpool/HOV trips will begin in AC 64% of all new Carpool/HOV trips will end in ACs HOV + Carpool HOV + Carpool 69% of all new Transit trips will begin in AC 88% of all new Transit trips will end in ACs Transit Walk + Bicycle % of New Trips 68% of all new Walk/Bike trips will begin in AC 25% 50% 75% 100% Transit Walk + Bicycle % of New Trips 68% of all new Walk/Bike trips will end in ACs 25% 50% 75% 100% The majority of new trips on all modes are forecast to begin and end in Activity Centers, which are expected to be well served by transit and provide an environment that is friendly to walking and biking. Though 58% of the new population is expected in Activity Centers, 69% of new transit trips and 68% of new walk/bike trips are expected to begin in these places. Since these places are forecast to be well served by transit and have a variety of destinations to travel to, 88% of all new transit trips are expected to end in Activity Centers. 10
11 New Transit in Activity Centers (-) Activity Centers with High Capacity Transit : 53% : 66% Most of the new transit projects included in the 2014 CLRP will serve Regional Activity Centers throughout the region. In, 66% of Activity Centers are expected to be served by high capacity transit compared to 53% today. 11
12 Commute Travel - Mode Share (-) 11% 24% 13% 25% 3,500,000 Trips/Day 4% 4,500,000 Trips/Day 5% 61% 57% Single Driver HOV + Carpool Bus + Rail Transit Walk + Bicycle Population and job growth region-wide will lead to an increase of approximately 1 million new commute trips. Commute trips are expected to account for 20% of all travel, but 40% of all vehicle miles traveled. The share of work trips taken by single-occupant vehicles is expected to drop slightly, while carpool/hov, bus and rail transit, and non-motorized trips are expected to increase slightly. 12
13 Commute Travel - Trips by Mode (-) trips in 1000 s , , , , % From more trips 259,000 more trips 177,000 more trips 400,000 more trips Walk + Bicycle Transit HOV + Carpool Single Driver +31% From +44% From +19% From Although commute mode share is also not forecast to change significantly, the number of trips taken using each mode will rise. Single driver commute trips are expected to rise at the slowest rate (19%) of all modes modeled, followed by transit (31%), HOV/Carpool (44%), and walking/biking (69%). Though commute mode share is only expected to go up by one percentage point, regional transit systems will accommodate more than 250,000 additional commute trips per day. 13
14 Commute Travel - Mode Share by Core, Inner, & Outer Suburbs Regional Core Inner Suburbs 23% 5% 14% 24% 56% 5% Total: % 18% Total: % 11% Single Driver 23% HOV + Carpool 3% Total: 1,746 61% 11% 24% 4% Bus + Rail Transit Total: 2,140 39% Walk + Bicycle 6% 1% Outer Suburbs 79% 14% 72% Total: % 9% Total: 983 2% trips in 1000 s In the regional core the share of single driver trips is forecast to drop in favor of more walk and bike trips. In the inner suburbs the share of single driver trips is expected to drop slightly in favor of higher shares of transit and non-motorized trips. And in the outer suburbs, the share of single driver trips is expected to go down while the shares of transit and carpool trips are expected to increase. The increase in transit mode share is forecast to be greatest in the outer suburbs. 14
15 Transit Congestion (2011-) Line 2011 Red Blue Orange/ Silver Yellow Green with 50% 8-car* with 100% 8-car Satisfactory (<100 people per car) Congested ( people per car) Highly Congested (>120 people per car) *The 2014 CLRP assumes 50% 8-car trains in The Metrorail system will likely reach capacity on trips to and through the regional core, due to lack of funding for capacity enhancements. Without additional rail cars beyond those currently funded, 4 out of 5 lines entering the core will become congested by. 15
16 Unconstrained Transit (-) Number of Transit Work Trips in Constrained vs. Unconstrained Constrained Unconstrained 1,095 1, ,000 Additional Trips trips in 1000 s To address the lack of identified funding for 8-car trains and core capacity station improvements, Metrorail ridership to or through the core area was constrained to 2020 levels. When this constraint on Metrorail trips is lifted, there is an increase of 34,000 transit work trips in. This brings the commute mode share for transit up slightly. 16
17 Roadway Congestion (-) Share of AM Peak Hour Lane Miles that Are Congested by regional Core, Inner, and Outer Suburbs Regional Core Inner Suburbs Outer Suburbs Lanes Miles 15% of lane miles congested 22% 5% 12% 2,267 2,300 2,300 13% 19% +45% in share of lane miles that are congested 5,600 6, % % 9,000 9,700 in share of lane miles that are congested in share of lane miles that are congested region-wide +51% in share of lane miles that are congested * Lane mile measure includes all facilities except local roads in both directions. * Roads are congested if Volume/Capacity>1.00 Overall, congested lane miles are a relatively small proportion of the total lane miles in the region both today and in. However, the total number of congested lane miles is forecast to go up in all 3 sub-areas with the greatest expected increase in the inner suburbs. The share of lane miles that are congested is also expected to increase in all sub-areas, but the highest rate of increase is expected in the outer suburbs. 17
18 Roadway Congestion (-) Share of AM Peak Hour Vehicle Miles Travelled (VMT) on Congested Roadways by regional Core, Inner, and Outer Suburbs Regional Core Inner Suburbs Outer Suburbs 30% of vehicle miles travelled that are congested 1,140 38% 16% 1,263 30% +29% 26% 2,473 in share of VMT on congested roadways 35% 3, % 5, % in share of VMT on congested roadways +33% 6,806 in share of VMT on congested roadways region-wide in share of VMT on congested roadways * AM peak period VMT converted to AM peak hour * Roads are congested if Volume/Capacity>1.00 Vehicle Miles Travelled (VMT) in 1000s Though a relatively small share of lane miles are currently congested, a higher share of Vehicle Miles Traveled (VMT) is currently on congested roadways. This indicates that the roadways that are congested are some of the more heavily traveled in the region. In, VMT on congested roadways is expected to increase in each sub-area as well as the share of VMT on congested roadways. 18
 Accessibility = [Number")
![of Jobs Within 45 Minute Commute] Jobs are considered to be accessible if](/docs-images/74/70799912/images/19-2.jpg "they are within a Jobs are considered to be accessible if they are within a")
19 Accessibility to Jobs What is Job Accessibility? Location of Jobs + Travel Time (by auto or transit) Accessibility = [Number of Jobs Within 45 Minute Commute] Jobs are considered to be accessible if they are within a Jobs are considered to be accessible if they are within a 45 minute commute range 19
20 Accessibility to Jobs (-) By Automobile Frederick (in 1000s) : The average number of jobs accessible within a 45 minute automobile commute is expected to go up slightly. The greatest reductions in job accessibility are expected to be on the eastern side of the region, due to increases in congestion system-wide and a higher concentration of future jobs on the west side. Average number of Jobs Accessible ( 1%) MARYLAND : Loudoun VIRGINIA Montgomery DC Change in # of Jobs within 45 Minutes Significant Loss <-300, Moderate Loss -300,000 to -100, Fairfax 66 1 Prince George s Minimal Impact -100,000 to 100,000 Moderate Gain 100,000 to 300,000 Significant Gain > 300,000 Prince William 95 Major Highway Improvements New Road 301 Charles Widen / Improve Existing Road Add HOT Lanes (High Occupancy Toll) or HOV Lanes (High Occupancy Vehicle) Remove Existing Road Intersection Improvement Miles N 20
21 Accessibility to Jobs (-) By Transit Frederick Average number of Jobs Accessible ( 27%) MARYLAND (in 1000s) : : Average accessibility by transit is forecast to increase, but will remain significantly lower than by automobile because transit does not reach all people or jobs in the region Loudoun VIRGINIA Montgomery DC Change in # of Jobs within 45 Minutes Significant Loss <-300, Moderate Loss -300,000 to -100, Fairfax 66 1 Prince George s Minimal Impact -100,000 to 100,000 Moderate Gain 100,000 to 300,000 Significant Gain > 300,000 Prince William 95 Major Transit Improvements 301 New Transit Charles Transit Improvement Add HOT Lanes (High Occupancy Toll) or HOV Lanes (High Occupancy Vehicle) New Transit Station Miles N 21
22 Air Quality (-) The CLRP shows reductions in all main pollutants through 2020, with a very small uptick between 2030 and. Estimated emissions are within the approved budget for each pollutant through Attainment Budget: Tons/Day Mobile Source NOx Emissions (1997 PM2.5 NAAQS, 15 mg/m3) 2010 Contingency Budget: Tons/Day Ozone Season VOC Emissions (1997 PM2.5 NAAQS, 15 mg/m3) 2009 Attainment Budget: 66.5 Tons/Day Tons/Day Tons/Day
23 Air Quality (-) PM2.5 Direct Emissions (1997 PM2.5 NAAQS, 15 mg/m3) Precursor NOx Emissions (1997 PM2.5 NAAQS, 15 mg/m3) 2, ,000 1,926 1,787 Tons/Day Tons/Day 1,500 1,000 1,696 1,350 Tons/Day 1,279 1,255 1, Tons/Day Tons/Year Tons/Year in 1000s
24 Carbon Dioxide (2005-) Total CO2 Emissions CO2 Emission Per Capita 5 2 CO2 in 1,000,000s (Tons/ Year) CO2 Per Capita (Tons/Year) * * Year 2020 figures developed though interpolation between 2017 and 2025 Per capita CO2 emissions are forecast to decrease by 17% between and. Total CO2 emissions are forecast to increase by 5% between and, while the region will be accommodating 25% more people and a 35% more jobs. When the emissions reduction benefits from CAFE and TIER 3 standards are included in the analysis, total CO2 emissions and CO2 emissions per capita are expected to decrease over this time period. 24
25 Key Findings»» Daily auto trips to increase by 17%, truck trips by 22% and transit trips by 32%.»» VMT per capita to decline by about 3%.»» More than half the total population growth and three quarters of the employment growth to occur in 141 activity centers.»» Share of daily single driver trips to decrease by 3%, share of walking and biking to increase by 3%.»» Share of single driver commuting trips to decrease 4%, share by carpooling to increase by 2%, transit share increase by 1% and walk and bike share by 1%. 25
26 Key Findings (Cont d)»» Two-thirds of the activity centers to have high capacity transit service.»» State of Good Repair on region s highway and transit system achieved, but increased AM peak hour congestion on both systems.»» Accessibility to jobs to increase by 27% for transit, but only by 1% for autos.»» All air quality conformity requirements are met. 26
27
ITEM 9 Information October 19, Briefing on the Performance Analysis of the Draft 2016 CLRP Amendment
 ITEM 9 Information October 19, 2016 Briefing on the Performance Analysis of the Draft 2016 CLRP Amendment Staff Recommendation: Issues: Background: Receive briefing None The board will be briefed on a
CO 2 Emissions from Cars, Trucks & Buses in the Metropolitan Washington Region
 CO 2 Emissions from Cars, Trucks & Buses in the Metropolitan Washington Region Presentation to the COG Climate Change Steering Committee Ronald F. Kirby Director of Transportation Planning June 27, 2007
TPB CLRP Aspirations Scenario
 TPB CLRP Aspirations Scenario Streamlined Variably Priced Lane Network Sensitivity Test Ron Kirby Erin Morrow Department of Transportation Planning Presentation to the Transportation Planning Board October
ConnectGreaterWashington: Can the Region Grow Differently?
 Washington Metropolitan Area Transit Authority ConnectGreaterWashington: Can the Region Grow Differently? Transportation Planning Board (TPB) Travel Forecasting Subcommittee July 17, 2015 1 Alternatives
Transportation 2040: Plan Performance. Transportation Policy Board September 14, 2017
 Transportation 2040: Plan Performance Transportation Policy Board September 14, 2017 Today Background Plan Performance Today s Meeting Background Board and Committee Direction 2016-2017 Transportation
Is The Dulles Corridor Metrorail Project the answer?
 Is The Dulles Corridor Metrorail Project the answer? Shigenori Hiraoka Contributed to by Bill Gouse & Claire Felbinger 10/27/2006 Japan International Transport Institute JITI Seminars are fully supported
Janice Fortunato Senior Director Business Partnerships
 Janice Fortunato Senior Director Business Partnerships What are Megaprojects? They are large-scale projects distinguished by cost, complexity and the potential impact on the community. Collectively, these
Transportation: On the Road to Cleaner Air Did you know?
 Opposite and above State transportation officials are urging commuters to use mass transit, carpool, ride a bike, or to telecommute, in a campaign to help communities get cleaner air. Cities are also turning
Maryland Gets to Work
 I-695/Leeds Avenue Interchange Reconstruction Baltimore County Reconstruction of the I-695/Leeds Avenue interchange including replacing the I-695 Inner Loop bridges over Benson Avenue, Amtrak s Northeast
RTSP Phase II Update
 Washington Metropolitan Area Transit Authority RTSP Phase II Update Presentation to the Technical Advisory Group July 18, 2013 Meeting 1 Presentation Outline RTSP Integration with Momentum RTSP Process
WMATA CONNECTGREATERWASHINGTON
 WMATA CONNECTGREATERWASHINGTON CGW Policy Alternatives: Task 7 Comparison Measures Technical Memorandum February 2015 (This page intentionally left blank) TableofContents CGW Policy Alternatives 1. Introduction...
NEW YORK SUBURBAN RAIL SUMMARY (COMMUTER RAIL, REGIONAL RAIL)
") NEW YORK SUBURBAN RAIL SUMMARY (COMMUTER RAIL, REGIONAL RAIL) October 2003 New York: The New York commuter rail service area consists of 20.3 million people, spread over 4,700 square miles at an average
NEW YORK SUBURBAN RAIL SUMMARY (COMMUTER RAIL, REGIONAL RAIL) October 2003 New York: The New York commuter rail service area consists of 20.3 million people, spread over 4,700 square miles at an average
Executive Summary. Draft Environmental Impact Statement/Environmental Impact Report ES-1
 Executive Summary Introduction The Eastside Transit Corridor Phase 2 Project is a vital public transit infrastructure investment that would provide a transit connection to the existing Metro Gold Line
METRO Orange Line BRT American Boulevard Station Options
 METRO Orange Line BRT American Boulevard Station Options Bloomington City Council Work Session November 18, 2013 Christina Morrison BRT/Small Starts Project Office Coordinating Planning and Design AMERICAN
San Francisco Transportation Plan Update
 San Francisco Transportation Plan Update SPUR August 1, 2011 www.sfcta.org/movesmartsf twitter.com/sanfranciscota www.facebook.com/movesmartsf How does the RTP relate to the SFTP? Regional Transportation
San Francisco Transportation Plan
 San Francisco Transportation Plan Overview and Findings to Date November 13, 2012 www.sfcta.org/movesmartsf twitter.com/sanfranciscota www.facebook.com/movesmartsf Purpose of the SFTP San Francisco s long-range
Bi-County Transitway/ Bethesda Station Access Demand Analysis
 Bi-County Transitway/ Bethesda Station Access Demand Analysis Prepared for: Washington Metropolitan Area Transit Authority Office of Planning and Project Development May 2005 Prepared by: in conjunction
Volume XXIII, Issue 3 October CLRP Amendment Awaits Final Approval The 2015 amendment to the region s Financially
 TPBnews A Publication of the National Capital Region Transportation Planning Board Volume XXIII, Issue 3 October 2015 2015 CLRP Amendment Awaits Final Approval The 2015 amendment to the region s Financially
Green Line Long-Term Investments
 Enhancements Short-term improvements to keep Austin moving. Investments Long-term projects to support our future. Mobility Hubs MetroRapid MetroRail MetroExpress Connectors Circulators Project Connect
TORONTO TRANSIT COMMISSION REPORT NO.
 Form Revised: February 2005 TORONTO TRANSIT COMMISSION REPORT NO. MEETING DATE: October 24, 2012 SUBJECT: DOWNTOWN RAPID TRANSIT EXPANSION STUDY (DRTES) PHASE 1 STRATEGIC PLAN ACTION ITEM RECOMMENDATIONS
Basic Project Information
 FY 2015-16 PROJECT DESCRIPTION FORM (7B) Submitting Agency: Fairfax County Basic Project Information Project Title: South Van Dorn Street and Franconia Road Interchange 7B Project Type (check one): Roadway
UCLA Lake Arrowhead Conference. October 18, 2010
 BART Click to Capacity edit Master Overview title style for UCLA Lake Arrowhead Conference October 18, 2010 0 BART Basics 360,000 daily riders 104 miles 43 stations 1.3 billion annual passenger miles 1
QUALITY OF LIFE EXECUTIVE SUMMARY REPORT I O N S TAT I O N
 QUALITY OF LIFE EXECUTIVE SUMMARY REPORT UN I O N S TAT I O N T R AV E L by TR A I N Published September 2017 2015 PROGRESS MAP This document reports FasTracks progress through 2015 BACKGROUND RTD The
3.1 Introduction Transportation Elements and Study Area Meeting the Need for the Project
 Chapter 3 Transportation Environment and Consequences 3. Introduction This chapter summarizes the characteristics of the transportation system in the East Link Project vicinity and discusses potential
HOT Lanes: Congestion Relief and Better Transit
 HOT Lanes: Congestion Relief and Better Transit Robert W. Poole, Jr. Director of Transportation Studies Reason Foundation www.reason.org/transportation Basic Thesis: Current Transportation Plans Need Rethinking
UCLA Lake Arrowhead Conference. October 18, 2010
 BART Click to Capacity edit Master Overview title style for UCLA Lake Arrowhead Conference October 18, 2010 0 BART Basics 360,000 daily riders 104 miles 43 stations 1.3 billion annual passenger miles 1
UCLA Lake Arrowhead Conference. October 18, 2010
 BART Click to Capacity edit Master Overview title style for UCLA Lake Arrowhead Conference October 18, 2010 0 BART Basics 360,000 daily riders 104 miles 43 stations 1.3 billion annual passenger miles 1
Funding Scenario Descriptions & Performance
 Funding Scenario Descriptions & Performance These scenarios were developed based on direction set by the Task Force at previous meetings. They represent approaches for funding to further Task Force discussion
Facts and Figures. October 2006 List Release Special Edition BWC National Benefits and Related Facts October, 2006 (Previous Versions Obsolete)
") Facts and Figures Date October 2006 List Release Special Edition BWC National Benefits and Related Facts October, 2006 (Previous Versions Obsolete) Best Workplaces for Commuters - Environmental and Energy
Facts and Figures Date October 2006 List Release Special Edition BWC National Benefits and Related Facts October, 2006 (Previous Versions Obsolete) Best Workplaces for Commuters - Environmental and Energy
V03. APTA Multimodal Operations Planning Workshop August Green Line LRT
 V03 APTA Multimodal Operations Planning Workshop August 2016 Green Line LRT 2 Presentation Outline Past Present Future 3 16/03/2016 RouteAhead Update 4 4 16/03/2016 RouteAhead Update 5 5 16/03/2016 6 6
Rapid Transit and Land-Use Integration a Reality
 City of Charlotte Rapid Transit and Land-Use Integration a Reality Transportation Oversight Committee Carolyn Flowers CEO Charlotte Area Transit System April 29, 2010 Charlotte Region Statistics Mecklenburg
A Transit Plan for the Future. Draft Network Plan
 A Transit Plan for the Future Draft Network Plan Project Overview and Status Completed Market Analysis and Service Evaluation. Developed Plan Framework and Guiding Principles. Developed a draft Five Year
Chapter 7: Travel Demand Analysis. Chapter 8. Plan Scenarios. LaSalle Community Center. Image Credit: Town of LaSalle
 Chapter 7: Travel Demand Analysis Chapter 8 Plan Scenarios LaSalle Community Center. Image Credit: Town of LaSalle 164 Chapter 8: Plan Scenarios Moving Ahead for Progress in the 21 st Century Act (MAP
Basic Project Information
 FY 2015-16 PROJECT DESCRIPTION FORM (9F) Submitting Agency: Arlington County Basic Project Information Project Title: Glebe Road Corridor Intelligent Transportation Systems (9F) Project Type (check one):
Sales and Use Transportation Tax Implementation Plan
 Sales and Use Transportation Tax Implementation Plan Transportation is more than just a way of getting from here to there. Reliable, safe transportation is necessary for commerce, economic development,
Executive Summary. Treasure Valley High Capacity Transit Study Priority Corridor Phase 1 Alternatives Analysis October 13, 2009.
 Treasure Valley High Capacity Transit Study Priority Corridor Phase 1 Alternatives Analysis October 13, 2009 Background As the Treasure Valley continues to grow, high-quality transportation connections
UTA Transportation Equity Study and Staff Analysis. Board Workshop January 6, 2018
 UTA Transportation Equity Study and Staff Analysis Board Workshop January 6, 2018 1 Executive Summary UTA ranks DART 6 th out of top 20 Transit Agencies in the country for ridership. UTA Study confirms
Transportation Demand Management Element
 Transportation Demand Management Element Over the years, our reliance on the private automobile as our primary mode of transportation has grown substantially. Our dependence on the automobile is evidenced
Performance Measure Summary - Washington DC-VA-MD. Performance Measures and Definition of Terms
 Performance Measure Summary - Washington DC-VA-MD There are several inventory and performance measures listed in the pages of this Urban Area Report for the years from 1982 to 2014. There is no single
Hillsborough County MPO Transit Study. Transit Concept for 2050 October 17, 2007
 Hillsborough County MPO Transit Study Transit Concept for 2050 October 17, 2007 Transit Technologies Technologies Considered Bus Light Rail Commuter Rail Bus Standard or articulated high-capacity vehicles
Submission to Greater Cambridge City Deal
 What Transport for Cambridge? 2 1 Submission to Greater Cambridge City Deal By Professor Marcial Echenique OBE ScD RIBA RTPI and Jonathan Barker Introduction Cambridge Futures was founded in 1997 as a
2030 Multimodal Transportation Study
 2030 Multimodal Transportation Study City of Jacksonville Planning and Development Department Prepared by Ghyabi & Associates April 29,2010 Introduction Presentation Components 1. Study Basis 2. Study
DRAFT BUS TRANSFORMATION PROJECT
 BUS TRANSFORMATION PROJECT Bus System Today October 2018 The current regional system includes nine bus service providers: WMATA Loudoun County Transit The Bus Fairfax County Connector RideOn ART DASH CUE
MPO Transit Study. Transit Concept for 2050 November 5, Transit Technologies
 Hillsborough County MPO Transit Study Transit Concept for 2050 November 5, 2007 Transit Technologies 1 Technologies Considered Bus Light Rail Commuter Rail Bus Standard or articulated high-capacity vehicles
Road Map for Sustainable Transport Strategy for Colombo Metropolitan Region with Cleaner Air, through Experience
 Workshop on Air Quality and Environmentally Sustainable Transport April 28 th 2011 Don S. Jayaweera Road Map for Sustainable Transport Strategy for Colombo Metropolitan Region with Cleaner Air, through
2 VALUE PROPOSITION VALUE PROPOSITION DEVELOPMENT
 2 VALUE PROPOSITION The purpose of the Value Proposition is to define a number of metrics or interesting facts that clearly demonstrate the value of the existing Xpress system to external audiences including
Reston Transportation Strategy July 9, 2018
 Reston Transportation Strategy July 9, 2018 Background: On February 11, 2014, the Board of Supervisors adopted the Reston Phase I Comprehensive Plan Amendment for the core areas of Reston between Sunset
Transit in Bay Area Blueprint
 Rail~Volution 2010 Click to edit Master title style Transit in Bay Area Blueprint October 21, 2010 0 Bottom Line State-of-Good Repair essential for reliable transit service large funding shortfalls BART
US 29 Bus Rapid Transit Planning Board Briefing. February 16, 2017
 US 29 Bus Rapid Transit Planning Board Briefing February 16, 2017 Project Goals Improve the quality of transit service Improve mobility opportunities and choices Enhance quality of life Support master
Metropolitan Council Budget Overview SFY
 Metropolitan Council Budget Overview SFY 2016-2017 H T t ti C itt House Transportation Committee February 4, 2015 Transit connects us to the places that matter Transportation Needs Grow as the Region Grows
Metro Reimagined. Project Overview October 2017
 Metro Reimagined Project Overview October 2017 Reimagining Metro Transit Continuing our Commitment to: Provide mobility based on existing and future needs Value the role of personal mobility in the quality
PHILADELPHIA SUBURBAN RAIL SUMMARY (COMMUTER RAIL, REGIONAL RAIL)
") PHILADELPHIA SUBURBAN RAIL SUMMARY (COMMUTER RAIL, REGIONAL RAIL) October 2003 The Philadelphia commuter rail service area consists of 5.1 million people, spread over 1,800 square miles at an average population
PHILADELPHIA SUBURBAN RAIL SUMMARY (COMMUTER RAIL, REGIONAL RAIL) October 2003 The Philadelphia commuter rail service area consists of 5.1 million people, spread over 1,800 square miles at an average population
Travel Time Savings Memorandum
 04-05-2018 TABLE OF CONTENTS 1 Background 3 Methodology 3 Inputs and Calculation 3 Assumptions 4 Light Rail Transit (LRT) Travel Times 5 Auto Travel Times 5 Bus Travel Times 6 Findings 7 Generalized Cost
Streamlining the District s Nightlife Curbside Access. Managing High-Demand Curbside Passenger Loading Zones
 Streamlining the District s Nightlife Curbside Access Managing High-Demand Curbside Passenger Loading Zones Washington, DC Regional Setting 68.3 square miles DC metropolitan area Population 6.1 million
Alternatives Analysis Findings Report
 6.0 This chapter presents estimates of the potential capital, operations and maintenance costs associated with the alternatives carried forward for detailed evaluation. The methodology used to develop
Perry City 1200 West Walking/ Biking Path Project Type Pedestrian/ Bike
 Perry City 1200 West Walking/ Biking Path Project Type Pedestrian/ Bike 3275 South to 2625 South $ 839,800 $ 666,408 The 1200 West roadway is a very narrow road just enough for two lanes of traffic and
THE WILSHIRE CORRIDOR: RAIL AND ITS ALTERNATIVES. Prepared By: Jacki Murdock Transportation and Environmental Planner
 THE WILSHIRE CORRIDOR: RAIL AND ITS ALTERNATIVES Prepared By: Jacki Murdock Transportation and Environmental Planner December 13 th, 2012 Overview Characteristics of Wilshire Boulevard Overview of the
7 COMPARATIVE EVALUATION OF ALTERNATIVES
 7 COMPARATIVE EVALUATION OF ALTERNATIVES 7.1 INTRODUCTION This chapter presents the comparative analysis of the four Level 2 build alternatives along with a discussion of the relative performance of the
Economy. 38% of GDP in 1970; 33% of GDP in 1998 Most significant decline in Manufacturing 47% to 29%
 Economy MCMA as important, but declining, force in national economy 38% of GDP in 1970; 33% of GDP in 1998 Most significant decline in Manufacturing 47% to 29% Relatively constant contribution of Financial
Caltrain Downtown Extension Study Ridership Forecast Summary
 Caltrain Downtown Extension Study Ridership Forecast Summary presented to Transbay Joint Powers Authority presented by Cambridge Systematics date: March 12, 2009 Transportation leadership you can trust.
Regional Inventory of Projects Planned High Capacity Surface Transit Improvements in the WMATA Service Area. DRAFT Project Summaries
 Regional Inventory of Projects Planned High Capacity Surface Transit Improvements in the WMATA Service Area DRAFT Project Summaries May 2009 TABLE OF CONTENTS 1.0 INTRODUCTION... 1 2.0 PROJECTS... 3 2.1
CITY OF LONDON STRATEGIC MULTI-YEAR BUDGET ADDITIONAL INVESTMENTS BUSINESS CASE # 6
 2016 2019 CITY OF LONDON STRATEGIC MULTI-YEAR BUDGET ADDITIONAL INVESTMENTS BUSINESS CASE # 6 STRATEGIC AREA OF FOCUS: SUB-PRIORITY: STRATEGY: INITIATIVE: INITIATIVE LEAD(S): BUILDING A SUSTAINABLE CITY
Charlotte-Mecklenburg Region Rapid Transit and Land-Use Integration
 Charlotte-Mecklenburg Region Rapid Transit and Land-Use Integration Legislative Committee on Urban Growth and Infrastructure Carolyn Flowers CEO Charlotte Area Transit System March 23, 2010 Charlotte Region
Jeff s House. Downtown Charlottesville. PEC Office
 Jeff s House Downtown Charlottesville PEC Office Year 2000 US Census Data Employed persons over 16 Percentage of Employed Persons Locality Avg Commute (in minutes) Drove Public Transit Walk/Bike Other
Needs and Community Characteristics
 Needs and Community Characteristics Anticipate Population and Job Growth in the City Strongest density of population and jobs in Ann Arbor are within the Study Area Population expected to grow 8.4% by
The City of Toronto s Transportation Strategy July 2007
 The City of Toronto s Transportation Strategy July 2007 Presentation Outline Transportation Statistics Transportation Building Blocks Toronto s Official Plan Transportation and City Building Vision Projects
AMTRAK ENVISIONS WORLD CLASS HIGH-SPEED RAIL Washington to Boston in about three hours at up to 220 mph (354 kph)
") FOR IMMEDIATE RELEASE September 28, 2010 ATK-10-130a Contact: Media Relations 202 906.3860 AMTRAK ENVISIONS WORLD CLASS HIGH-SPEED RAIL Washington to Boston in about three hours at up to 220 mph (354 kph)
FOR IMMEDIATE RELEASE September 28, 2010 ATK-10-130a Contact: Media Relations 202 906.3860 AMTRAK ENVISIONS WORLD CLASS HIGH-SPEED RAIL Washington to Boston in about three hours at up to 220 mph (354 kph)
Transit Access to the National Harbor
 Transit Access to the National Harbor December 2014 Table of Contents Executive Summary... 3 Introduction and Project Purpose... 6 Methodology.. 9 Definition of Alternatives..... 9 Similar Project Implementation
Customer Services, Operations, and Safety Committee Board Information Item III-D May 13, 2010 Rail Fleet Plan
 Customer Services, Operations, and Safety Committee Board Information Item III-D May 13, 2010 Rail Fleet Plan Page 54 of 96 Washington Metropolitan Area Transit Authority Board Action/Information Summary
Getting Parking Right in Emerging Mixed Use Environments
 Getting Parking Right in Emerging Mixed Use Environments Shana R. Johnson, AICP Senior Transportation Planner Foursquare ITP Makeover Montgomery 2 May 9, 2014 1 Parking today White Flint Mall Photo Source:
The Screening and Selection of Regionally Significant Projects
 The Screening and Selection of Regionally Significant Projects UTC 2018 Seminar Series March 15, 2018 Claire Bozic Martin Menninger ON TO 2050 CMAP is the Region s MPO, seven county region Land use and
Performance Measures and Definition of Terms
 Performance Measure Summary - All 471 Areas Sum There are several inventory and performance measures listed in the pages of this Urban Area Report for the years from 1982 to 2014. There is no single performance
MetroExpress Improvements
 Improvements Enhancements Short-term improvements to keep Austin moving. Investments Long-term projects to support our future. Mobility Hubs MetroRapid MetroRail Commuters Connectors Circulators Project
Dulles Corridor Air Rights Study Investigation
 Dulles Corridor Air Rights Study Investigation Fairfax County Board of Supervisors Transportation Committee September 17, 2013 1 On March 19, 2013 the Fairfax County Board of Supervisors asked FCDOT staff
I-35W Past, Present, and Future: METRO Orange Line
 I-35W Past, Present, and Future: METRO Orange Line 2018 State Public Transportation Partnerships Conference Charles Carlson Director, BRT Projects Metro Transit Charles.Carlson@metrotransit.org Metro Transit:
Presentation A Blue Slides 1-5.
 Presentation A Blue Slides 1-5. 1 Presentation A Blue Slides 1-5. 2 Presentation A Blue Slides 1-5. 3 Presentation A Blue Slides 1-5. 4 Presentation A Blue Slides 1-5. 5 Transit Service right. service
KANSAS CITY STREETCAR
 KANSAS CITY STREETCAR KAREN CLAWSON MID-AMERICA REGIONAL COUNCIL KANSAS CITY STREETCAR Regional Context Alternatives Analysis Kansas City Streetcar Project KANSAS CITY REGION KANSAS CITY REGION KANSAS
Art Griffith, Capital Projects Manager, ,
 Part 1 Base Information 1. Project Title Broadway & Highlands Ranch Pkwy. Intersection Capacity and Safety Improvement Project 2. Project Start/End points or Geographic Area Provide a map with submittal,
Subarea Study. Manning Avenue (CSAH 15) Corridor Management and Safety Improvement Project. Final Version 1. Washington County.
 Corridor Management and Safety Improvement Project. Final Version 1. Washington County.") Subarea Study Manning Avenue (CSAH 15) Corridor Management and Safety Improvement Project Final Version 1 Washington County June 12, 214 SRF No. 138141 Table of Contents Introduction... 1 Forecast Methodology
Subarea Study Manning Avenue (CSAH 15) Corridor Management and Safety Improvement Project Final Version 1 Washington County June 12, 214 SRF No. 138141 Table of Contents Introduction... 1 Forecast Methodology
Back to the Future? Land Use, Mobility & Accessibility in Metropolitan China Day 23 C. Zegras. Contents
 Back to the Future? Land Use, Mobility & Accessibility in Metropolitan China 11.953 Day 23 C. Zegras Contents Remember the Developing World..? Motorization! China: Motorization and its Challenges Land
Kenosha-Racine-Milwaukee (KRM)
") Kenosha-Racine-Milwaukee (KRM) Commuter Rail #147925 November 6, 2009 1 Guidance of KRM Commuter Rail Studies Intergovernmental Partnership Technical Steering Committee Temporary and Limited Authority
Kenosha-Racine-Milwaukee (KRM) Commuter Rail #147925 November 6, 2009 1 Guidance of KRM Commuter Rail Studies Intergovernmental Partnership Technical Steering Committee Temporary and Limited Authority
Stakeholders Advisory Working Groups (SAWGs) Traffic and Transit SAWG Meeting #7
 Traffic and Transit SAWG Meeting #7") Presentation Tappan Zee Bridge/I-287 Corridor Environmental Review December 4, 2008 Slide 1 Title Slide Slide 2 This presentation discusses the contents of the Transit Mode Selection Report. Slide 3 The
Presentation Tappan Zee Bridge/I-287 Corridor Environmental Review December 4, 2008 Slide 1 Title Slide Slide 2 This presentation discusses the contents of the Transit Mode Selection Report. Slide 3 The
RTID Travel Demand Modeling: Assumptions and Method of Analysis
 RTID Travel Demand Modeling: Assumptions and Method of Analysis Overall Model and Scenario Assumptions The Puget Sound Regional Council s (PSRC) regional travel demand model was used to forecast travel
Vehicle Miles Traveled in Massachusetts: Who is driving and where are they going?
 Vehicle Miles Traveled in Massachusetts: Who is driving and where are they going? A presentation to the House Committee on Global Warming and Climate Change Representative Frank Smizik, Chair April 13,
CEDAR AVENUE TRANSITWAY Implementation Plan Update
 CEDAR AVENUE TRANSITWAY Implementation Plan Update EECUTIVE SUMMARY DECEMBER 2015 Executive Summary In 2013, the Twin Cities metropolitan area s first bus rapid transit (BRT) line, the METRO Red Line,
Your comments count!
 WELCOME Identifying Solutions Between I-495 and the Roosevelt Bridge Schedule 6:30-8:30 p.m. Open House Review the presentation boards and talk to the project s technical staff about the study in an open
The Community of Yesteryear
 The Community of Yesteryear Charles, Calvert, & St. Mary s County are generally considered Southern Maryland. In years past, residents made a living growing tobacco or working the waters of the Chesapeake.
TRAVEL DEMAND FORECASTS
 Jiangxi Ji an Sustainable Urban Transport Project (RRP PRC 45022) TRAVEL DEMAND FORECASTS A. Introduction 1. The purpose of the travel demand forecasts is to assess the impact of the project components
Transit Access Study
 West of Hudson Regional Transit Access Study Open House presentation July 20, 2010 1 Agenda Progress To date Summary of Level 2 Alternatives and Screening Service Plans Bus and Rail Operating and Capital
Breakout Session. The Mobility Challenges of Our Growing & Sprawling Upstate
 Breakout Session The Mobility Challenges of Our Growing & Sprawling Upstate The Mobility Challenges of Our Growing & Sprawling Upstate Why is our suburban and sprawling development pattern a challenge
The USDOT Congestion Pricing Program: A New Era for Congestion Management
 The USDOT Congestion Pricing Program: A New Era for Congestion Management Patrick DeCorla-Souza, AICP Federal Highway Administration Presentation at Congestion Pricing Discovery Workshop Los Angeles, CA
Washington Metropolitan Area Transit Authority
 Executive Summary: Metrobus Network Evaluation and Future Fleet Needs Presented to: Washington Metropolitan Area Transit Authority Submitted by: In Association with P 2 D Joint Venture Introduction Metrobus
How to Create Exponential Decline in Car Use in Australian Cities. By Peter Newman, Jeff Kenworthy and Gary Glazebrook.
 How to Create Exponential Decline in Car Use in Australian Cities By Peter Newman, Jeff Kenworthy and Gary Glazebrook. Curtin University and University of Technology Sydney. Car dependent cities like those
TEXAS CITY PARK & RIDE RIDERSHIP ANALYSIS
 TEXAS CITY PARK & RIDE RIDERSHIP ANALYSIS This document reviews the methodologies and tools used to calculate the projected ridership and parking space needs from the proposed Texas City Park & Ride to
Unified Corridor Investment Study DRAFT Step 2 Scenario Analysis Report
 Unified Corridor Investment Study DRAFT Step 2 Scenario Analysis Report REVISIONS 1. Table 39: New Public Investments for Operation and Maintenance Costs 2. Appendix A-10: Passenger Rail Service - Operations
I-26 Fixed Guideway Alternatives Analysis
 I-26 Fixed Guideway Alternatives Analysis Steering & Technical Advisory Committees Joint Meeting January 15, 2016 @ 10:00 AM SC/TAC Meeting Winter 2016 Agenda I. Welcome & Introductions II. III. Project
Treasure Island Mobility Management Program
 Treasure Island Mobility Management Program Preliminary Toll Policy Recommendations For Buildout Year (2030) Draft SAN FRANCISCO COUNTY TRANSPORTATION AUTHORITY May 20, 2015 About the Treasure Island Mobility
Performance Measure Summary - Large Area Sum. Performance Measures and Definition of Terms
 Performance Measure Summary - Large Area Sum There are several inventory and performance measures listed in the pages of this Urban Area Report for the years from 1982 to 2014. There is no single performance
Performance Measure Summary - Medium Area Sum. Performance Measures and Definition of Terms
 Performance Measure Summary - Medium Area Sum There are several inventory and performance measures listed in the pages of this Urban Area Report for the years from 1982 to 2014. There is no single performance
More persons in the cars? Status and potential for change in car occupancy rates in Norway
 Author(s): Liva Vågane Oslo 2009, 57 pages Norwegian language Summary: More persons in the cars? Status and potential for change in car occupancy rates in Norway Results from national travel surveys in