Overview. Mercury Monitoring. Regulatory drivers Technology Overview Pros and Cons Alternative Hybrid Approach
|
|
|
- Sheena Jennings
- 5 years ago
- Views:
Transcription
1 Mercury Compliance Monitoring in 2015 and Beyond Volker Schmid Clean Air Engineering March 28, 2013


2 Overview Mercury Monitoring Regulatory drivers Technology Overview Pros and Cons Alternative Hybrid Approach
3 Acknowledgements Tim Rodak Jim Wright CleanAir Joseph Siperstein Ohio Lumex Corporation


4 Regulatory Drivers
5 Regulatory Drivers National Emissions Standard for Hazardous Air Pollutants from Portland Cement Manufacturing Industry (40 CFR 63 Subpart LLL)
6 PC MACT Regulatory Drivers
7 Regulatory Drivers PC MACT Published September 9, 2010 Amended June 22, 2012 Final February 12, 2013
8 Regulatory Drivers PC MACT Electric Generating Utility Mercury and Air Toxics Standards (40 CFR 63, Subpart UUUUU)
9 Regulatory Drivers PC MACT EGU MATS
10 Regulatory Drivers PC MACT EGU MATS Published February 16, 2012 Final April 16, 2012 Reconsideration July, 27, 2012 Proposed Updates November 16, 2012 Final (?) March, 2013

11 Compliance Dates


12 PC MACT Emission Limits Existing Kilns: 12 μg/m 3 New Kilns: 5 μg/m 3

13 MATS Hg Emission Limits Existing Plants: 1.4 μg/m 3 New Plants: μg/m μg/m 3
14 Monitoring Options Continuous Mercury Monitoring System (CMMS) Sorbent Trap Mercury Monitoring System (STMMS)
15 CMMS Performance Specification 12A Procedure 5 (Part 60, Appendix F) PC MACT Appendix A to Subpart UUUUU MATS
 PC")


16 CMMS Performance Specification 12A Procedure 5 (Part 60, Appendix F) PC MACT Appendix A to Subpart UUUUU MATS Real time data Daily calibration error tests Weekly system integrity checks Quarterly Linearity checks Annual RATA

17 The History of CMMS 2003 CAMR Two T s Expensive Complex Sensitivity?

18 Source: USEPA
19 NIST Calibrators Today 0 10 μg/dscm low point of 2.7 Today Source: EPRI CEMS, 2012, Thermo Supergroup
20 NIST Calibrators Today 0 10 μg/dscm low point of 2.7 Someday 0 1 μg/dscm low point of 0.2 Today Someday Source: EPRI CEMS, 2012, Thermo Supergroup
21 NIST Calibrators Today 0 10 μg/dscm low point of 2.7 Someday 0 1 μg/dscm low point of 0.2 MATS Limit = Today Someday MATS Limit Source: EPRI CEMS, 2012, Thermo Supergroup
22 The status of Hg CEMS Getting better all the time More options Believable to around 0.2 μg/dscm


23 The status of Hg CEMS Getting better all the time More options Believable to around 0.2 μg/dscm Still expensive Still complex Calibration
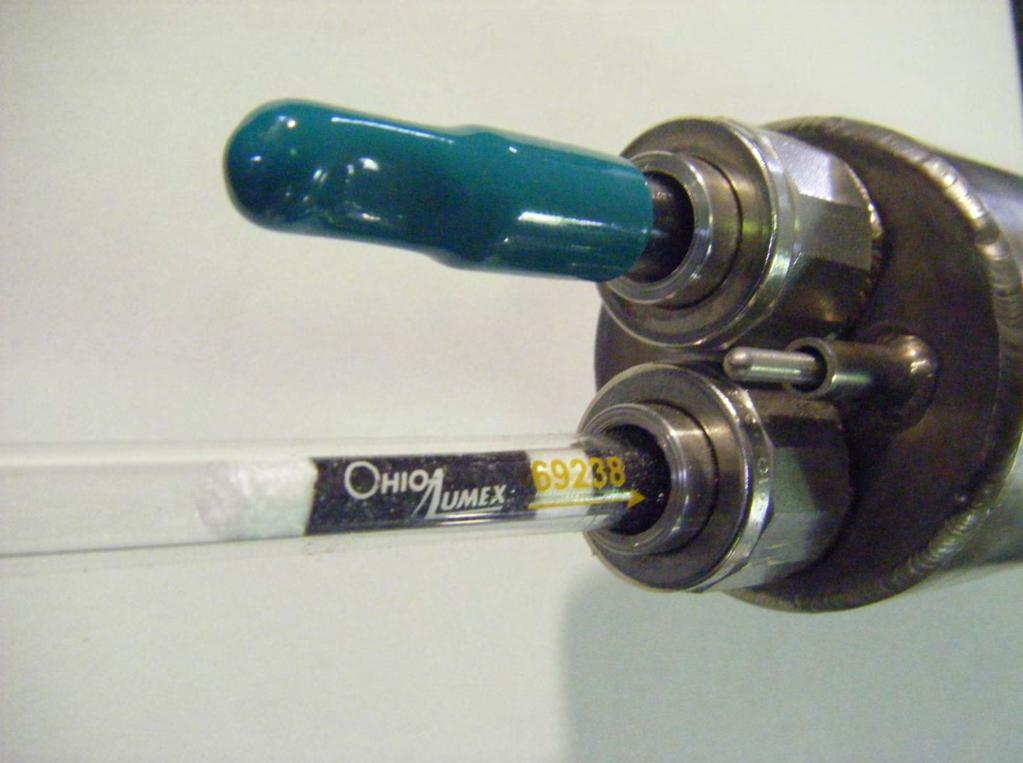

24 STMMS


25
26 2010 PC MACT
27 2005 CAMR 2010 PC MACT
28 2003 EU MACT 2005 CAMR 2010 PC MACT
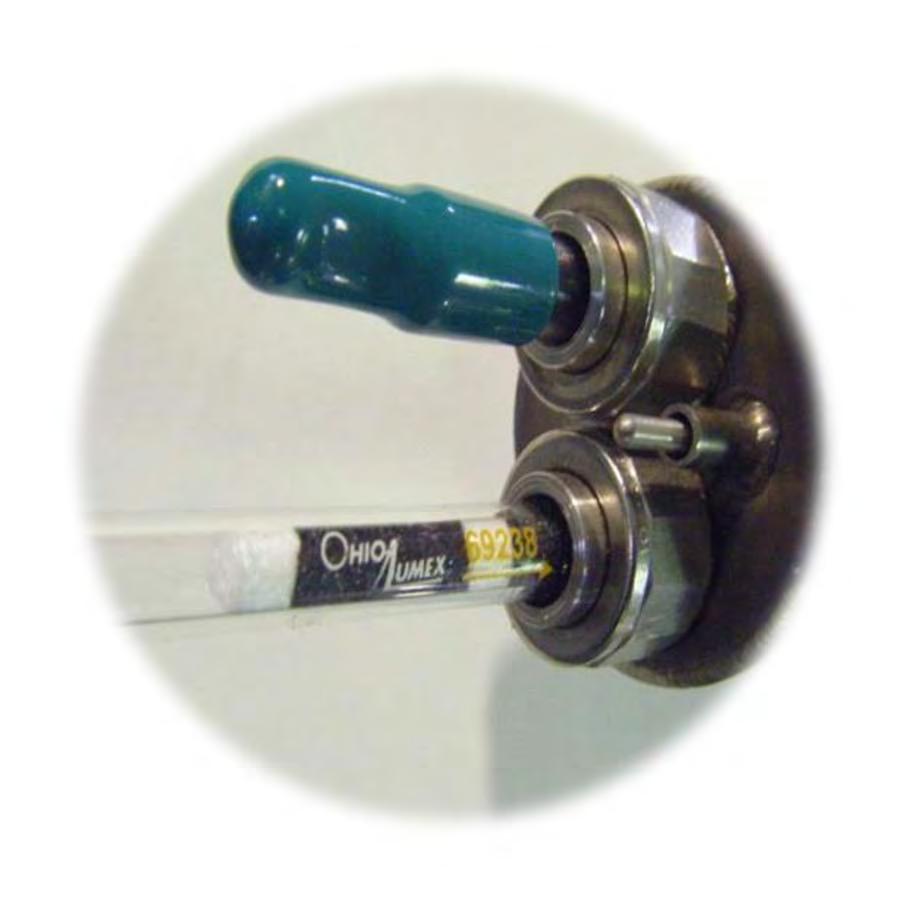
29 STMMS
30 STMMS 1. Capture mercury in situ on a sorbent
31 STMMS 2. Sample over a period of several days
32 STMMS 3. Recover traps and send to lab
33 STMMS 4. Analyze for total mercury collected

34 STMMS 5. Calculate emissions

35 6. Repeat STMMS

36 STMMS Purpose An Evolution CMMS Back up CMMS Alternative

37 Simplicity NIST Traceability It works Cost Effectiveness


38 Simplicity Simple mechanical equipment


39 Simplicity No on site Hg calibration materials
40 Certification Requirements CMMS versus STMMS CMMS 7 day calibration error test Linearity test 3 level system integrity check Cycle time test RATA
41 Certification Requirements CMMS versus STMMS CMMS 7 day calibration error test Linearity test 3 level system integrity check Cycle time test RATA STMMS RATA

42 NIST Traceability Meter Calibrations Analytical SRMs Factory Spikes
43 It works No Hg transport issues Very low MDL possible Built in QA/QC


44 It works No Hg transport issues Very low MDL possible Built in QA/QC Spike recovery Breakthrough Paired trap agreement Proportional sampling

45 Cost Effectiveness Hardware about ⅓ the cost of CMMS Operating costs about ½ cost of CMMS

46 STMMS Performance How accurate is it? How reproducible is it? How reliable is it? How low can we go? 2012 Clean Air Engineering
47 Accuracy Hg conc. (μg/dscm) RM MET80 RATA Results Run* C RM - Avg C CMMS-AVG DIFF %DIFF % % % % % % % % % % % All data (n=11) % Hg Conc. (ug/dscm)*** RM 30B MET Run I.D.* 2012 Clean Air Engineering
48 Accuracy Hg conc. (μg/dscm) RM MET80 RATA Results Run* C RM - Avg C CMMS-AVG DIFF %DIFF % % % % % % % % % % % All data (n=11) % Hg Conc. (ug/dscm)*** RM 30B MET Run I.D.* 2012 Clean Air Engineering


49 Reproducibility 0.7% Difference 64 trap pairs 2.4% Difference 47 trap pairs 2012 Clean Air Engineering


50 Reliability


51 Reliability Case study Dominion Salem Harbor Compliance monitoring since 2008 Three MET 80 systems 2012 Clean Air Engineering
52 MET 80 Data Validity Unit 1 Valid Invalid Apr 08 Jul 08 Oct 08 Feb 09 May 09 Aug 09 Nov 09 Mar 10 Jun 10 Sep Clean Air Engineering
53 MET 80 Data Validity Unit 1 Valid Leak check Breakthrough < 5% Spike Recovery = % Proportional Flow Rate =± 25% Relative Deviation < 20% Invalid Apr 08 Jul 08 Oct 08 Feb 09 May 09 Aug 09 Nov 09 Mar 10 Jun 10 Sep Clean Air Engineering
54 MET 80 Data Validity Unit 1 Valid Leak check Breakthrough < 5% Spike Recovery = % Proportional Flow Rate =± 25% Relative Deviation < 20% Invalid Apr 08 Jul 08 Oct 08 Feb 09 May 09 Aug 09 Nov 09 Mar 10 Jun 10 Sep Clean Air Engineering 94% reported availability

55 MET 80 Data Validity Unit 1 Valid Mean = 0.4 μg/dscm Invalid Apr 08 Jul 08 Oct 08 Feb 09 May 09 Aug 09 Nov 09 Mar 10 Jun 10 Sep Clean Air Engineering 94% reported availability
56 MET 80 Data Validity Unit 2 Valid Mean = 0.5 μg/dscm Invalid Mar 08 Jul 08 Oct 08 Jan 09 May 09 Aug 09 Nov 09 Feb 10 Jun Clean Air Engineering 91% reported availability

57 MET 80 Data Validity Unit 3 Valid Mean = 0.8 μg/dscm Invalid Jul 08 Nov 08 Feb 09 May 09 Aug 09 Dec 09 Mar 10 Jun 10 Oct Clean Air Engineering 96% reported availability
58 2012 Clean Air Engineering How low can we go?
59 2012 Clean Air Engineering
60 2012 Clean Air Engineering
61 Western Bituminous 2012 Clean Air Engineering

62 Western Bituminous 2012 Clean Air Engineering


63 μg/scm Clean Air Engineering

64 Problem with Sorbent Traps Real Time Data


65
66 Need for Real Time Data COMPLIANCE CONTROL Active Hg control Process Hg control
67 Hybrid System Advantages Real time CMMS trending data NIST traceable STMMS compliance data


68 A Hybrid Approach Process Hg Analyzer Internal zero/cal Compliance Analyzer check


69 Questions? cleanair.com Clean Air Engineering
Commercial-in-Confidence Ashton Old Baths Financial Model - Detailed Cashflow
 Year 0 1 2 3 4 5 6 7 8 9 10 11 12 13 Oct-16 Nov-16 Dec-16 Jan-17 Feb-17 Mar-17 Apr-17 May-17 Jun-17 Jul-17 Aug-17 Sep-17 Oct-17 2,038 2,922 4,089 4,349 6,256 7,124 8,885 8,885 8,885 8,885 8,885 8,885 9,107
COMPARISON OF FIXED & VARIABLE RATES (25 YEARS) CHARTERED BANK ADMINISTERED INTEREST RATES - PRIME BUSINESS*
 CHARTERED BANK ADMINISTERED INTEREST RATES - PRIME BUSINESS*") COMPARISON OF FIXED & VARIABLE RATES (25 YEARS) 2 Fixed Rates Variable Rates For Internal Use Only. FIXED RATES OF THE PAST 25 YEARS AVERAGE RESIDENTIAL MORTGAGE LENDING RATE - 5 YEAR* (Per cent) Year
COMPARISON OF FIXED & VARIABLE RATES (25 YEARS) 2 Fixed Rates Variable Rates For Internal Use Only. FIXED RATES OF THE PAST 25 YEARS AVERAGE RESIDENTIAL MORTGAGE LENDING RATE - 5 YEAR* (Per cent) Year
COMPARISON OF FIXED & VARIABLE RATES (25 YEARS) CHARTERED BANK ADMINISTERED INTEREST RATES - PRIME BUSINESS*
 CHARTERED BANK ADMINISTERED INTEREST RATES - PRIME BUSINESS*") COMPARISON OF FIXED & VARIABLE RATES (25 YEARS) 2 Fixed Rates Variable Rates FIXED RATES OF THE PAST 25 YEARS AVERAGE RESIDENTIAL MORTGAGE LENDING RATE - 5 YEAR* (Per cent) Year Jan Feb Mar Apr May Jun
COMPARISON OF FIXED & VARIABLE RATES (25 YEARS) 2 Fixed Rates Variable Rates FIXED RATES OF THE PAST 25 YEARS AVERAGE RESIDENTIAL MORTGAGE LENDING RATE - 5 YEAR* (Per cent) Year Jan Feb Mar Apr May Jun
Up and Down Months of the Stock Market
 Up and Down Months of the Stock Market 1926-2017 Positive years (66) in the stock market were not good all year long and losing years (24) were not losers throughout the year. Winning years produce losing
Glendale Water & Power Smart Grid Project
 Glendale Water & Power Smart Grid Project Key Dates in Project History Key Dates Project History On July 10, 2007, City Council directed GWP to develop a long term plan for smart meters On October 23,
Inventory Levels - All Prices. Inventory Levels - By Price Range
 Inventory Levels - All Prices Idaho Falls Bonneville Total 3-Mar-17 152 108 260 2-Mar-18 109 78 187-28% Inventory Levels - By Price Range 3-Mar-17 2-Mar-18 0-100,000 41 6 100,001-125,000 19 8 125,001-150,000
Inventory Levels - All Prices. Inventory Levels - By Price Range
 Inventory Levels - All Prices Idaho Falls Bonneville Total 7-Apr-17 154 111 265 6-Apr-18 113 91 204-23% Inventory Levels - By Price Range 7-Apr-17 6-Apr-18 0-100,000 36 10 100,001-125,000 13 9 125,001-150,000
Bulk Storage Containers
 UCSB AST SPCC SELF-INSPECTION CHECKLIST Year: Responsible Department: Tank Location: Tank ID: Bulk Storage Containers Total tank capacity: Petroleum type and amount: Secondary containment type: (diesel,
FOR IMMEDIATE RELEASE
 Article No. 7761 Available on www.roymorgan.com Roy Morgan Unemployment Profile Monday, 8 October 2018 Unemployment down to 9.4% in September off two-year high Australian employment has grown solidly over
The Peoples Gas Light and Coke Company
 History of Gas Charges Due to the Operation of Rider 2 (Cents per Therm) Factors for Transportation Customers (Riders FST, SST, P, CFY and AGG) Non- Total Standby Standby Aggregation Commodity Commodity
Total Production by Month (Acre Feet)
") Production by Month (acre-feet) 2008 2009 2010 2011 2012 2013 2014 2015 2016 January 25 339.10 228.90 249.50 297.99 243.06 327.14 247.66 212.37 February 234.00 218.80 212.10 241.52 245.82 279.08 234.16
Production by Month (acre-feet) 2008 2009 2010 2011 2012 2013 2014 2015 2016 January 25 339.10 228.90 249.50 297.99 243.06 327.14 247.66 212.37 February 234.00 218.80 212.10 241.52 245.82 279.08 234.16
GAZIFÈRE INC. Prime Rate Forecasting Process 2017 Rate Case
 Overview A consensus forecast is used to estimate the prime rate charged by commercial banks. As the prime rate is subject to competitive pressures faced by individual lenders and is set on an individual
FOR IMMEDIATE RELEASE
 Article No. 7845 Available on www.roymorgan.com Roy Morgan Unemployment Profile Friday, 18 January 2019 Unemployment in December is 9.7% and under-employment is 8.8% FOR IMMEDIATE RELEASE Australian unemployment
FOR IMMEDIATE RELEASE
 Article No. 7353 Available on www.roymorgan.com Roy Morgan Unemployment Profile Wednesday, 11 October 2017 2.498 million Australians (18.9%) now unemployed or under-employed In September 1.202 million
FOR IMMEDIATE RELEASE
 Article No. 5842 Available on www.roymorgan.com Roy Morgan Unemployment Profile Thursday, 2 October 2014 Unemployment climbs to 9.9% in September as full-time work lowest since October 2011; 2.2 million
ENVIRONMENTAL & ENGINEERING SERVICES DEPARTMENT
 CITY OF LONDON ENVIRONMENTAL & ENGINEERING SERVICES DEPARTMENT WASTEWATER TREATMENT OPERATIONS VAUXHALL WASTEWATER TREATMENT PLANT 2013 ANNUAL REPORT FEBRUARY 2014 Vauxhall Wastewater Treatment Plant 2013
Inventory Levels - All Prices. Inventory Levels - By Price Range
 Inventory Levels - All Prices Idaho Falls Bonneville Total 3-Nov-17 198 128 326 2-Nov-18 155 134 289-11% Inventory Levels - By Price Range 3-Nov-17 2-Nov-18 0-100,000 17 11 100,001-125,000 15 9 125,001-150,000
IOWA MOLD TOOLING CO., INC. BOX 189, GARNER, IA TEL: IMT PART NUMBER
 CRANE LOG CALENDAR YEAR CRANE MODEL Daily Inspections Weekly Inspections Monthly Inspections Lubrication Record Maintenance Record Damage & Repair Record Modification Record Reference Specifications CRANE
Automated Occupancy Detection October 2015 (Phase I) Demonstration Results Presented by Kathy McCune
 Demonstration Results Presented by Kathy McCune") Automated Occupancy Detection October 2015 (Phase I) Demonstration Results Presented by Kathy McCune 2016 TRB Managed Lanes Conference May 5th, Session 6 Presentation Background Outline Metro ExpressLanes
Automated Occupancy Detection October 2015 (Phase I) Demonstration Results Presented by Kathy McCune 2016 TRB Managed Lanes Conference May 5th, Session 6 Presentation Background Outline Metro ExpressLanes
ANCR CRU Statistics February 2007 to December 2007
 ANCR CRU Statistics February 2007 to December 2007 o Jan/07 Feb/07* Mar/07 Apr/07 May/07 Jun/07 Jul/07 Aug/07 Sep/07 Oct/07 Nov/07 Dec/07 Total notes data from Perimeter phone system unavailable prior
D G A G R I D A S H B O A R D : A P P L E S
 75 79 60 56 49 74 65 59 54 42 76 63 58 53 78 55 42 43 79 44 81 63 47 83 64 59 53 48 Sources: Eurostat, MSs notifications, DG Agri, Comext, Comtrade, GTA, ITC, AMI, Expert groups, Freshfel, Wapa. 89 68
Operational Overview. Operational Forum, 24 th March 2010
 Operational Overview Operational Forum, 24 th March 21 Weather Weather February 21 The cold weather continued throughout February with all but one day being colder than the 17-year seasonal normal CWV.
NJ Solar Market Update As of 6/30/15
 NJ Solar Market Update As of 6/30/ Prepared by Charlie Garrison July 17, 20 SOLAR INSTALLED CAPACITY DATA The preliminary installed solar capacity as of 6/30/ is approximately 1,500.7 MW. Approximately
METROPOLITAN COAL ENVIRONMENTAL PROTECTION LICENCE MONITORING SUMMARY
 Introduction The Protection of the Environment Operations Act 1997 (POEO Act) requires that holders of an environment protection licence make their pollution monitoring data publicly available in a timely
1. Trends in the current fiscal year and previous fiscal year 3. Business overview 2. Secular trends in first quarter financial results
 FY2/19 (March 2018~May 2018) Fact Book 1. Trends in the current fiscal year and previous fiscal year 3. Business overview (1) Performance overview P. 1 (1) No. of students at the end of month P. 6 (2)
FOR IMMEDIATE RELEASE
 Article No. 7433 Available on www.roymorgan.com Roy Morgan Unemployment Profile Friday, 12 January 2018 2.6m Australians unemployed or under-employed in December The latest data for the Roy Morgan employment
O&M Plan Template For PCMACT
 Crafting an O&M Plan Template For PCMACT Presented to: IEEE IAS/PCACement IAS/PCA Cement Conference April 29, 2015 Presented by: Lynne Spector Zephyr Environmental Corporation Regulatory Background Subpart
Sound Transit Operations July 2016 Service Performance Report. Ridership
 Ridership Total Boardings by Mode Mode Jul-15 Jul-16 % YTD-15 YTD-16 % ST Express 1,618,779 1,545,852-4.5% 10,803,486 10,774,063-0.3% Sounder 333,000 323,233-2.9% 2,176,914 2,423,058 11.3% Tacoma Link
Price Category Breakdown - February 2010
 SINGLE FAMILY RESIDENTIAL BREAKDOWN ruary 21 ruary Sales and Average Price Increase Annually TORONTO - Wednesday, March 3, 21 7.3 % 24.6 % 1.8 % 7.3%.2%.1 % Greater Toronto REALTORS reported 7,291 sales
MARKET RATES UPDATE Paula Gold-Williams Cory Kuchinsky
 MARKET RATES UPDATE I N T R O D U C T I O N BY: Paula Gold-Williams President & Chief Executive Officer (CEO) P R E S E N T E D BY: Cory Kuchinsky Interim Vice President, Financial Services September 24,
Industrial, Commercial and Institutional Boilers at Area Source Facilities (Boiler GACT) Final Reconsidered Rule Requirements Summary
 Final Reconsidered Rule Requirements Summary") Industrial, Commercial and Institutional Boilers at Area Facilities (Boiler GACT) Final Reconsidered Rule Requirements Summary Federal Regulation NESHAP, 40 CFR 63, Subpart JJJJJJ Proposed rule published
Industrial, Commercial and Institutional Boilers at Area Facilities (Boiler GACT) Final Reconsidered Rule Requirements Summary Federal Regulation NESHAP, 40 CFR 63, Subpart JJJJJJ Proposed rule published
D G A G R I D A S H B O A R D : A P P L E S
 Sources: Eurostat, MSs notifications, DG Agri, Comext, Comtrade, GTA, ITC, AMI, Expert groups, Freshfel, Wapa. 000 tonnes 39 41 31 22 29 22 32 27 17 18 9 27 15 12 6 6 6 4 5 6 5 4 11 25 15 9 9 93 62 51
November 2018 Customer Switching Report for the Electricity and Gas Retail Markets
 An Coimisiún um Rialáil Fóntas Commission for Regulation of Utilities November 2018 Customer Switching Report for the Electricity and Gas Retail Markets Information Paper Reference: CRU18266 Date Published:
FOR IMMEDIATE RELEASE
 Article No. 6928 Available on www.roymorgan.com Roy Morgan Unemployment Profile Wednesday, 17 August 2016 Australian real unemployment jumps to 10.5% (up 0.9%) in July during post-election uncertainty
Regulation Update. Operating Committee September 12, PJM 2017
 Regulation Update Operating Committee September 12, 2017 Regulation Market Clearing Price *Data up to Aug 22 2 Mileage Ratio Mileage Ratio has increased since the new signal implementation Larger Utilization
NJ Solar Market Update As of 2/29/16
 NJ Solar Market Update As of 2/29/16 Prepared by Charlie Garrison March 24, 2016 SOLAR INSTALLED CAPACITY DATA The installed solar capacity as of 2/29/16 is approximately 1,644.3 MW. Approximately 20.3
Date Event or Holiday :Sun, 2:Mon North Orchard Delong Preschool North Orchard Delong Preschool
 2018 6 1 1:Sun, 2:Mon 2018-2019 Date Event or Holiday Aug 16 Board Meeting 6pm Aug 23 Open House June 2018 July 2018 August 2018 Sep 06 Board Meeting 6pm Su M Tu W Th F Sa Su M Tu W Th F Sa Su M Tu W Th
Englewood Area Board of Realtors Monthly Sales Trend Indicator 2017 Sales by Price Range - Single Family Homes & Villa s
 Englewood Area Board of Realtors Englewood Area Board of Realtors Sales by Price Range - Single Family Homes & Villa s Price Range Jan-17 Feb-17 Mar-17 Apr-17 May-17 Jun-17 Jul-17 Aug-17 Sep-17 Oct-17
increase of over four per cent compared to the average of $409,058 reported in January 2010.
 SINGLE FAMILY RESIDENTIAL BREAKDOWN uary 211 26.8 % 1.7 % 7.%.4%.1 % Good Start to 211 TORONTO - February 4, 211 Greater Toronto REALTORS reported 4,337 transactions through the TorontoMLS system in uary
Graph #1. Micro-Generation Generating Units in Alberta 20
 2, Graph #1. Micro-Generation Generating Units in Alberta 2 Cumulative # of Generating Units 1,9 1,8 1,7 1,6 1,5 1,4 1,3 1,2 1,1 1, 9 8 7 6 5 4 3 2 Number of MGG Units as of 216 Mar 31 Number of Solar
WIM #37 was operational for the entire month of September Volume was computed using all monthly data.
 SEPTEMBER 2016 WIM Site Location WIM #37 is located on I-94 near Otsego in Wright county. The WIM is located only on the westbound (WB) side of I-94, meaning that all data mentioned in this report pertains
Electricity Industry Code Minimum Service Standards & Guaranteed Service Levels Quarterly Report July September 2008
 Electricity Industry Code Minimum Service Standards & Guaranteed Service Levels Quarterly Report July September 2008 2 Table of Contents Administrative Data...3 Network Performance...3 Reliability Measures
Algebra II Pacing Guide
 Unit 13: Exploring a Business Venture (10 days) 8 May 13 - May 24 n/a MISD Pacing Guide Date Range Unit 01: Introduction to Functions in 15 Aug. 21 - Sept. 11 Sept. 12 Unit 02: Absolute Value Functions,,
Docket No. DE Dated: 05/04/2015 Attachment CJG-1 Page 1
 Docket No. DE - Dated: 0/0/0 Attachment CJG- Page 8 9 Summary of Forecasted Energy Service 0 Cost For January 0 Through December 0 TOTAL COST Cents per KWH Reference Fossil energy costs $ 9,9 $. Attachment
Florida Courts E-Filing Authority Board. Service Desk Report October 2018
 Florida Courts E-Filing Authority Board Service Desk Report October 218 Customer Service Incidents October 218 Status August 218 September 218 October 218 Incidents Received 3,157 2,685 3,779 Incidents
Year to Date Summary. Average and Median Sale Prices
 A Publication of RMLS, The Source for Real Estate Statistics in Your Community Residential Review: Southwest Washington September 2018 Reporting Period September Residential Highlights Southwest Washington
TECHNICAL SERVICE BULLETIN
 TECHNICAL SERVICE BULLETIN To: Minuteman Dealers and Customers From: Minuteman Technical Support Date: 1/12/2011 Subject: TSB for the KIT # K-FRSPEEDSWT. For the FR17115, FR17220, FR20115 and FR20220 models.
FOR IMMEDIATE RELEASE
 Article No. 7137 Available on www.roymorgan.com Roy Morgan Unemployment Profile Wednesday, 8 February 2017 Over 12 million Australians have jobs for the first time including over 8 million full-time jobs,
August 2018 MLS Statistical Report
 January February March April May June July August Septem October Novem Decem August 218 MLS Statistical Report Total Sales Overall, sales are down 3%; however, total volume sold is up 7% and Median Sale
NJ Solar Market Update
 NJ Solar Market Update April 16, 20 Renewable Energy Committee Meeting Trenton, NJ Prepared by Charlie Garrison Solar Installed Capacity Data The preliminary installed solar capacity as of 3/31/ is approximately
Macroeconomic Outlook. Presented by Dr. Bruce A. Scherr Chairman of the Board Chief Executive Officer Emeritus
 Macroeconomic Outlook Presented by Dr. Bruce A. Scherr Chairman of the Board Chief Executive Officer Emeritus Waterways Symposium Cincinnati, OH November 15-17, 2016 Topics Energy Macro Implications Inflation
M onthly arket. Jan Table of Contents. Monthly Highlights
 Table of Contents Market Inventory...2 www.gaar.com Monthly Highlights January 2014 had a 12.29% increase in the number of homes sales when compared to same time last year. The average sale price of single-family
November 2017 Customer Switching Report for the Electricity and Gas Retail Markets
 An Coimisiún um Rialáil Fóntas Commission for Regulation of Utilities November 2017 Customer Switching Report for the Electricity and Gas Retail Markets Information Paper Reference: CRU18011 Date Published:
Massachusetts Electric Company and Nantucket Electric Company, Docket No. D.T.E
 Amy G. Rabinowitz Counsel April 3, 2003 By Hand Mary L. Cottrell, Secretary Department of Telecommunications and Energy One South Station, 2 nd Floor Boston, MA 02110 Re: Massachusetts Electric Company
September 2016 Water Production & Consumption Data
 September 2016 Water Production & Consumption Data September 2016 monthly water production (288.48 AF) was lowest in at least 17 years. Monthly water production has increased slightly each month since
Presentation to the Customer Service, Operations and Safety Committee OPERATIONS PERFORMANCE INDICATORS
 Presentation to the Customer Service, Operations and Safety Committee OPERATIONS PERFORMANCE INDICATORS May 19, 2005 Department of Operations 100 95 90 85 80 75 70 65 A B C D RAIL PERFORMANCE INDEX FY
D G A G R I D A S H B O A R D : T O M A T O E S Last update: EU AVG PRICES
 tonnes Weightedaverages by volume of production per MS Ongoing adjustments on weights by variety group 000 tonnes D G A G R I D A S H B O A R D : T O M A T O E S Last update: 20.04.2018 EU AVG PRICES MS
FY2/18 2Q(March 2017~August 2018)
") FY2/18 2Q(March 2017~August 2018) Fact Book 1. Trends in the current fiscal year and previous fiscal year 3. Business overview (1) Performance overview P.1 (1) No. of students at the end of month P.7 (2)
FY2/18 2Q(March 2017~August 2018) Fact Book 1. Trends in the current fiscal year and previous fiscal year 3. Business overview (1) Performance overview P.1 (1) No. of students at the end of month P.7 (2)
2017 Adjusted Count Report February 12, 2018
 A statewide multi-use trail user study and volunteer data collection program 2017 Adjusted Count Report February 12, 2018 The following report includes the final adjusted infrared (IR) counter data at
2014 Meteorological and Oceanographic Summary for the Bocas del Toro Research Station. Prepared by: Steven Paton
 0 2014 Meteorological and Oceanographic Summary for the Bocas del Toro Research Station Prepared by: Steven Paton 1 Introduction This is the second of a series of yearly reports summarising the past year
TABLE C-43. Manufacturers' new and unfilled orders, {Amounts in millions of dollars] Nondurable. Capital goods. Total. goods.
![TABLE C-43. Manufacturers' new and unfilled orders, {Amounts in millions of dollars] Nondurable. Capital goods. Total. goods.](/thumbs/93/112603708.jpg "TABLE C-43. Manufacturers' new and unfilled orders, {Amounts in millions of dollars] Nondurable. Capital goods. Total. goods.") TABLE C-43. Manufacturers' new and unfilled orders, -74 {Amounts in millions of dollars] New orders t, I960. 27, 559 26, 903 30,672 30,115 31,086 33,005 35,322 37,952 41, 803 45, 944 46,763 50, 243 53,
TABLE C-43. Manufacturers' new and unfilled orders, -74 {Amounts in millions of dollars] New orders t, I960. 27, 559 26, 903 30,672 30,115 31,086 33,005 35,322 37,952 41, 803 45, 944 46,763 50, 243 53,
January During JANUARY. Sunday Monday Tuesday Wednesday Thursday Friday Saturday 1 Dec Feb 2011
 January 2011 1 Dec 2010 Feb 2011 During JANUARY Happy New Year! -- Appoint Company Nominating Committee 1 2 3 4 -- Camp report to Company - Jan 155 6 7 8 9 10 11 6 7 8 9 10 11 12 12 13 14 15 16 17 18 13
Design Criteria Data
 PHOENIX/SKY HARBOR AZ Latitude = 33.43 N WMO No. 72278 Longitude =112. W Elevation = 116 feet Period of Record = 1973 to 1996 Average Pressure = 28.72 inches Hg Design Criteria Data Mean Coincident (Average)
Streetcar Update. Review of December 2018
 Streetcar Update Review of December 2018 Number of Incidents Safety Metrics: Near Miss Near Miss Incident Breakdown 19% decrease near-miss events year over year (2017 versus 2018) 66% decrease at 5 th
Hospitality & Tourism Management January 2015 Calendar Sunday Monday Tuesday Wednesday Thursday Friday Saturday 1 2 3
 Jan-14 Week 1 Week 2 January 2015 Calendar 1 2 3 New Year's Day - 4 5 6 7 8 9 10 New Intake-L4 (EFTH) Assign-Presentation L4 Assign-Presentation L5 Last Exam Reg- CTH Assign Marking Assign Marking Module-
Preston s Edmond Market Report
 Preston s Edmond arket Report April 2 Prepared By Brian Preston RE/AX Associates obile: 45-826-5725 Office: 45-359-87 bpreston88@sbcglobal.net www.edmond4sale.com Realtor of the Year 1995 & 22 Lifetime
Florida Courts E-Filing Authority Board. Service Desk Report December 2018
 Florida Courts E-Filing Authority Board Service Desk Report December 218 Customer Service Incidents December 218 Status October 218 November 218 December 218 Incidents Received 3,779 2,632 2,376 Incidents
Commuter Rail Update. October 25, 2018
 Commuter Rail Update October 25, 2018 2 page page 3 State of Commuter Rail Network, July 2014 The 2014 Commuter Rail network had multiple issues and a history of neglect & under-investment FIRST UP? UPGRADES
ANCR CRU Statistics Februa.. to December 2007
 ANCR CRU Statistics Februa.. to December 2007 Jan/07 Feb/07* Mar/07 Apr/07 May/07 Jun/07 Jul/07 Aug/07 Sep/07 Oct/07 Nov/07 Dec/07 Total notes Answered dato from Perimeter phone system unavailable prior
BizJet International Sales & Support, Inc. FAA Certificated Repair Station Number IY2R915K CAPABILITY LIST. Revision Number: 38
 BizJet International Sales and Support, Inc. FAA Certificated Repair Station Number IY2R915K CAPABILITY LIST Revision Number: 38 Current Revision Date: 26 July 2017 BizJet International Sales & Support,
1996, or for which modification is commenced on or before March 16, 1998, shall not exceed the
 15A NCAC 02D.1206 HOSPITAL, MEDICAL, AND INFECTIOUS WASTE INCINERATORS (a) Applicability. This Rule applies to any hospital, medical, and infectious waste incinerator (HMIWI), except: (1) any HMIWI required
ELECTRICAL UTILITY COST REDUCTION THROUGH PREDICTIVE CONTROL BACKGROUND
 ELECTRICAL UTILITY COST REDUCTION THROUGH PREDICTIVE CONTROL Project Manager: Chris Hayes BACKGROUND Kraft Foods 35 Reduction of Energy Costs Over The Next 5 Yrs. (5 Benchmark) Kraft Foods Financial Model
STATISTICS BOTSWANA ELECTRICITY GENERATION & DISTRIBUTION 2016/2 STATS BRIEF, FIRST QUARTER Copyrights Statistics Botswana 2016
 2016/2 ELECTRICITY GENERATION & DISTRIBUTION STATS BRIEF, FIRST QUARTER 2016 Copyrights Statistics Botswana 2016 Statistics Botswana. Private Bag 0024 Botswana Tel: (267) 367 1300. Fax: (267) 395 2201.
/ PRELIMINARY STEEL IMPORTS INCREASE 2% IN MAY Import Market Share 23% in May
 News Release FOR IMMEDIATE RELEASE June 25, 2013 CONTACT Lisa Harrison 202.452.7115/ lharrison@steel.org PRELIMINARY STEEL IMPORTS INCREASE 2% IN MAY Import Market Share 23% in May Washington, D.C. Based
Lakeland Association of Realtors Monthly Sales Trend Indicator 2016 Sales by Price Range - Condominiums, Townhouses and Co-Op's
 akeland Association of Realtors9 Lakeland Association of Realtors Sales by Price Range - Single Family Homes & Villa s rice Range Jan-16 Feb-16 Mar-16 Apr-16 May-16 Jun-16 Jul-16 Aug-16 Sep-16 Oct-16 Nov-16
COMPILED BY GLASS S. Auction Report - LCV November 2013
 GLASS S Auction Report - LCV November 2013 Contents Market Commentary Page 3 Whole Market Summary Page 8 Average Sales Price Year on Year Page 9 Sales Price Compared to Number of Entries (all ages) Page
NEW HAMPSHIRE GAS CORPORATION WINTER PERIOD ORIGINAL FILING CONTENTS 3. CONVERSION OF GAS COSTS - GALLONS TO THERMS SCHEDULE A
 NEW HAMPSHIRE GAS CORPORATION COST OF GAS RATE FILING - DG 13- WINTER PERIOD 2013-2014 ORIGINAL FILING CONTENTS 1. TARIFF PAGE - COST OF GAS RATE 2. MARKED TARIFF PAGE - COST OF GAS RATE 3. CONVERSION
Irish History & Finance Check
 Irish History & Finance Check Date Of Report - vember 15th, 2017 Summary Report Registration Number Report Type 08D20364 Irish History & Finance Check apparent cause for concern Vehicle Details Make Model
FY2/18 (March 2017~February 2018)
") FY2/18 (March 2017~February 2018) Fact Book 1. Trends in the current fiscal year and previous fiscal year 3. Business overview (1) Performance overview P. 1 (1) No. of students at the end of month P. 6
FY2/18 (March 2017~February 2018) Fact Book 1. Trends in the current fiscal year and previous fiscal year 3. Business overview (1) Performance overview P. 1 (1) No. of students at the end of month P. 6
A 3-Year Case Study of a Residential Photovoltaic System with Microinverters
 A 3-Year Case Study of a Residential Photovoltaic System with Microinverters Clifford K. Ho Sandia National Laboratories, Albuquerque, NM Sandia National Laboratories is a multi-program laboratory managed
Construction Sector Indices
 STATISTICAL RELEASE UGANDA BUREAU OF STATISTICS January to April 212 Construction Sector Indices HIGHLIGHTS Annual Changes show that the prices for the Whole Construction Sector (covering material prices,
University of Michigan Eco-Driving Index (EDI) Latest data: October 2017
 Latest data: October 2017") University of Michigan Eco-Driving Index () http://www.ecodrivingindex.org Latest data: October 2017 Developed and issued monthly by Michael Sivak and Brandon Schoettle Sustainable Worldwide Transportation
University of Michigan Eco-Driving Index () http://www.ecodrivingindex.org Latest data: October 2017 Developed and issued monthly by Michael Sivak and Brandon Schoettle Sustainable Worldwide Transportation
Fort York Food Bank Monthly Performance Report (FYFB)
") September 2012 Current Month Fort York Food Bank Monthly Performance Report (FYFB) 2010 2011 2012 % change 2010 2011 2012 2009 2010 2011 2012 % change Food Baskets Distributed (3 days of meals/basket)
September 2012 Current Month Fort York Food Bank Monthly Performance Report (FYFB) 2010 2011 2012 % change 2010 2011 2012 2009 2010 2011 2012 % change Food Baskets Distributed (3 days of meals/basket)
Design Criteria Data
 OKLAHOMA CITY OK Latitude = 35.4 N WMO No. 72353 Longitude = 97.6 W Elevation = 133 feet Period of Record = 1973 to 1996 Average Pressure = 28.62 inches Hg Design Criteria Data Mean Coincident (Average)
Ameren Missouri. AMENDED Renewable Energy Standard Compliance Report Prepared in Compliance with 4 CSR
 Ameren Missouri AMENDED Renewable Energy Standard Compliance Report 2015 Prepared in Compliance with 4 CSR 240-20.100 June 23, 2016 NP Table of Contents Page INTRODUCTION...4 SECTION (8) (A) 1 A: TOTAL
Local Market Update 2012 Year In Review
 Northwest Area Home Sales for the Year 2012 Sales of single-family homes reported in Toledo and the surrounding area by the Toledo Board of REALTORS totaled 6,793. This was an increase of 6% compared to
FY2/17 3Q(March 2016~November2016)
") FY2/17 (March 2016~November2016) Fact Book 1. Trends in the current fiscal year and previous fiscal year 3. Business overview (1) Performance overview P. 1 (1) No. of students at the end of month P. 7
FY2/17 (March 2016~November2016) Fact Book 1. Trends in the current fiscal year and previous fiscal year 3. Business overview (1) Performance overview P. 1 (1) No. of students at the end of month P. 7
Design Criteria Data
 MEDFORD/JACKSON CO. OR Latitude = 42.37 N WMO No. 72597 Longitude =122.8 W Elevation = 1329 feet Period of Record = 1973 to 1996 Average Pressure = 28.61 inches Hg Design Criteria Data Mean Coincident
Daily Trends and Source Apportionment of Ultrafine Particulate Mass (PM 0.1 ) Over an Annual Cycle in a Typical California City
 Over an Annual Cycle in a Typical California City") Daily Trends and Source Apportionment of Ultrafine Particulate Mass (PM 0.1 ) Over an Annual Cycle in a Typical California City Toshihiro Kuwayama, Chris R. Ruehl, and Michael J. Kleeman* Department of
Daily Trends and Source Apportionment of Ultrafine Particulate Mass (PM 0.1 ) Over an Annual Cycle in a Typical California City Toshihiro Kuwayama, Chris R. Ruehl, and Michael J. Kleeman* Department of
Status report / Activity Plan of OBD Task Force
 -20-12e Status report / Activity Plan of OBD Task Force 26 th Sep., 2017 Mayumi Sophie Morimoto (JASIC) OBD TF Goal agreed at 1 st OBD TF (15 th Dec. 2016) Develop harmonized OBD GTR by end of 2018*. *Approved
HELICOPTER OPERATIONS WITHIN THE LONDON HEATHROW AND LONDON CITY CONTROL ZONES
 Column Title Explanation 1 2 Total daily number of helicopter flights recorded within the London Heathrow and London City CTRs. 3 to 6 Total daily number of helicopter flights recorded within the London
Energy Markets in Turmoil The Consumer Perspective
 Energy Markets in Turmoil The Consumer Perspective Sonny Popowsky Consumer Advocate of Pennsylvania Illinois State University Institute for Regulatory Policy Studies 63682 Springfield, IL May 17, 2001
Design Criteria Data
 DES MOINES IA Latitude = 41.53 N WMO No. 72546 Longitude = 93.65 W Elevation = 965 feet Period of Record = 1973 to 1996 Average Pressure = 28.96 inches Hg Design Criteria Data Mean Coincident (Average)
M o n. a t i s t i c s. M o n t h l y NOVEMBER 2009
 M o n t h l y M o n t S h l t y a t i s t i c s NOVEMBER 29 For Immediate Release December 7, 29 CONTACT: Kimberly Clifton, President (52) 954-8 Wes Wiggins Vice President, MLS (52) 82-8792 Cheri Meadows
Multiple Listing Service
 For Immediate Release: January 7, 21 CONTACT: Dan Santa Maria MLS President (52) 795-1492 Wes Wiggins Vice President, MLS (52) 382-8792 Cheri Meadows Senior Vice President, TAR (52) 327-4218 For Tucson
Georgia Pacific Crossett Operations Hydrogen Sulfide and Meteorological Monitoring Program
 Results you can rely on Georgia Pacific Crossett Operations Hydrogen Sulfide and Meteorological Monitoring Program 6-Month Report for October 1, 2014 through March 31, 2015 TRC Project Number: 222437.0000.0000
PA RACT 2. Reasonably Available Control Technology. Presented by Suzanne Dibert
 PA RACT 2 Reasonably Available Control Technology Presented by Suzanne Dibert Affected Facilities Facilities with potential emissions that exceed 100 tons per year (tpy) for NOx (nitrogen oxide) and 50
VEHICLE / PEDESTRIAN COLLISIONS
 Info item No. 1 Crosswalk Safety Advisory Committee March 31, 2016 VEHICLE / PEDESTRIAN COLLISIONS HRM: January December 20 DISCLAIMER: All figures presented in this report reflect the information held
January-March 2017 Customer Switching Report for the Electricity and Gas Retail Markets
 January- Customer Switching Report for the Electricity and Gas Retail Markets DOCUMENT TYPE: REFERENCE: Information Note CER/17102 DATE PUBLISHED: QUERIES TO: 28th April 2017 gkelly@cer.ie The Commission
Monthly Statistics November 2011
 For Immediate Release: December 9, 211 CONTACT: Greg Hollman MLS President (52) 577-7433 Tucson Association of REALTORS Multiple Listing Service Monthly Statistics November 211 Below are some highlights