Annual Fish Passage Report 2012 Columbia and Snake River Projects
|
|
|
- Albert Reeves
- 5 years ago
- Views:
Transcription

1 US Army Corps of Engineers Portland District Walla Walla District Annual Fish Passage Report 2012 Columbia and Snake River Projects
2
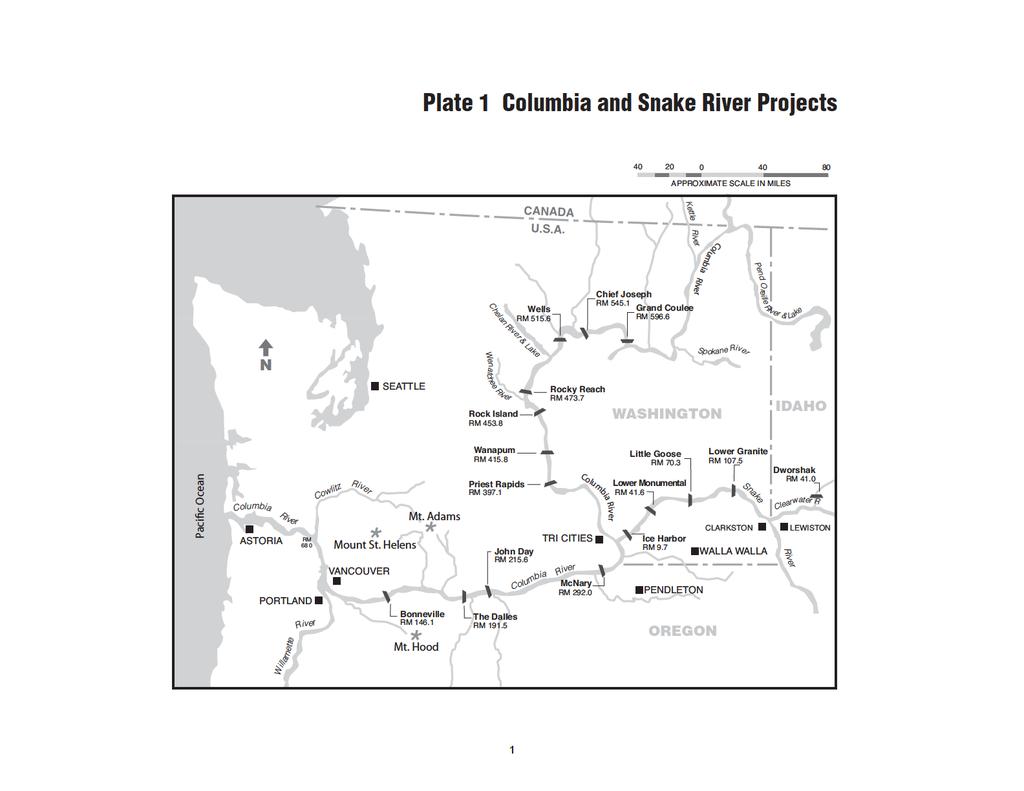
3 2012 ANNUAL FISH PASSAGE REPORT COLUMBIA AND SNAKE RIVERS for SALMON, STEELHEAD, SHAD, AND LAMPREY BONNEVILLE DAM THE DALLES DAM JOHN DAY DAM McNARY DAM ICE HARBOR DAM LOWER MONUMENTAL DAM LITTLE GOOSE DAM LOWER GRANITE DAM PRIEST RAPIDS DAM ROCK ISLAND DAM ROCKY REACH DAM WELLS DAM NORTHWESTERN DIVISION U.S. ARMY CORPS OF ENGINEERS Prepared By: U.S. Army Engineer Districts Portland and Walla Walla
4
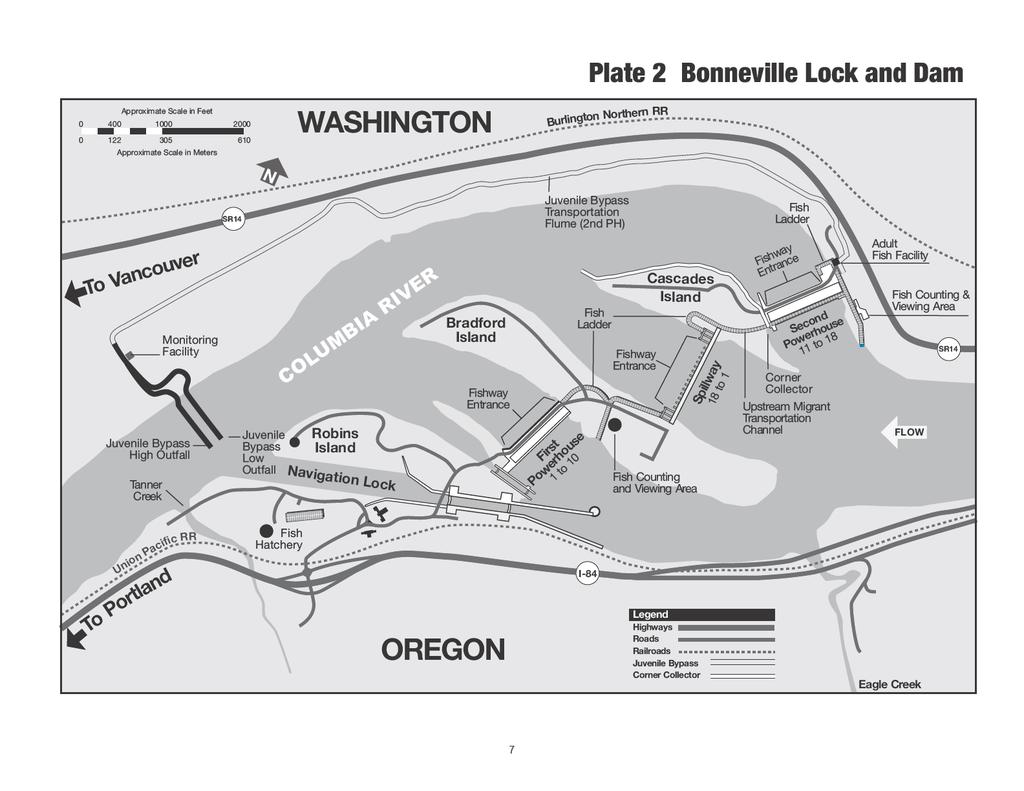
5 TABLE OF CONTENTS General Plate 1. Columbia and Snake River Projects...1 Table 1. Fish Escapement at Main Stem Dams Columbia and Snake Rivers: Table 2. Fish Escapement at Mid Columbia River Dams: Table 3. Steelhead over Columbia and Snake River Dams : by Run-Year Table 4. Steelhead over Mid Columbia River Dams : by Run-Year...6 Columbia River Corps of Engineers Projects BONNEVILLE DAM Plate 2. Bonneville Dam General Site Map, Fish Passage Facilities...7 Fish Counting Schedule...8 Fish Facilities Operation Schedule...8 Fishway Activities Table 5. Monthly Totals of Salmonids, Shad, and Lamprey: Table Monthly Discharge, Water Quality Data, and Fish Count January through December: Table 18a. Yearly Totals of Salmonids: Table 18b. Yearly Totals of Salmonids (Daytime Counts): Table 19. Monthly Count of Chinook Salmon: Table 20. Monthly Count of Sockeye Salmon: Table 21. Monthly Count of Coho Salmon: Table 22. Monthly Count of Steelhead: Table 23. Monthly Count of Shad: Table 24a. Monthly Count of Lamprey Table 24b Night Count of Lamprey THE DALLES DAM Plate 3. The Dalles Dam General Site Map, Fish Passage Facilities...41 Fish Counting Schedule...42 Fishway Operating Schedule...42 i
6 TABLE OF CONTENTS (Continued) Fish Related Dewaterings Table 25. Monthly Totals of Salmonids, Shad, and Lamprey: Table Monthly Discharge, Water Quality, and Fish Counts January through December: Table 37. Yearly totals of Salmonids: Table 38. Monthly Count of Chinook Salmon: Table 39. Monthly Count of Sockeye Salmon: Table 40. Monthly Count of Coho Salmon: Table 41. Monthly Count of Steelhead: JOHN DAY DAM Plate 4. John Day Dam General Site Map, Fish Passage Facilities...63 Fish Counting Schedule...64 Fishway Operating Schedule...64 Fish Related Dewaterings Table 42. Monthly Totals of Salmonids, Shad, and Lamprey: Table Monthly Discharge, Water Quality, and Fish Counts January through December: Table 52. Yearly totals of Salmonids: Table 53. Monthly Count of Chinook Salmon: Table 54. Monthly Count of Sockeye Salmon: Table 55. Monthly Count of Coho Salmon: Table 56. Monthly Count of Steelhead: McNARY DAM Plate 5. McNary Dam General Site Map, Fish Passage Facilities...82 Fish Counting Schedule...83 Fish Ladder Operating Schedule...83 Fishway Activities Table 57. Monthly Totals of Salmonids, Shad, and Lamprey: Table Monthly Discharge, Water Quality, and Fish Counts January through December: ii
7 TABLE OF CONTENTS (Continued) Table 69. Yearly totals of Salmonids: Table 70. Monthly Count of Chinook Salmon: Table 71. Monthly Count of Sockeye Salmon: Table 72. Monthly Count of Coho Salmon: Table 73. Monthly Count of Steelhead: Table 74. Night Count of Lamprey Snake River Corps of Engineers Projects ICE HARBOR DAM Plate 6. Ice Harbor Dam General Site Map, Fish Passage Facilities Fish Counting Schedule Fish Ladder Operating Schedule Fishway Activities Table 75. Monthly Totals of Salmonids, Shad, and Lamprey: Table Monthly Discharge, Water Quality, and Fish Counts January through December: Table 85. Yearly totals of Salmonids: Table 86. Monthly Count of Chinook Salmon: Table 87. Monthly Count of Steelhead: LOWER MONUMENTAL DAM Plate 7. Lower Monumental Dam General Site Map, Fish Passage Facilities Fish Counting Schedule Fish Ladder Operating Schedule Fishway Activities Table 88. Monthly Totals of Salmonids, Shad, and Lamprey: Table Monthly Discharge, Water Quality, and Fish Counts January through December: Table 98. Yearly totals of Salmonids: Table 99. Monthly Count of Chinook Salmon: iii
8 TABLE OF CONTENTS (Continued) Table 100. Monthly Count of Steelhead: LITTLE GOOSE DAM Plate 8. Little Goose Dam General Site Map, Fish Passage Facilities Fish Counting Schedule Fish Ladder Operating Schedule Fishway Activities Table 101. Monthly Totals of Salmonids, Shad, and Lamprey: Table Monthly Discharge, Water Quality, and Fish Counts January through December: Table 111. Yearly totals of Salmonids: , Table 112. Monthly Count of Chinook Salmon: , Table 113. Monthly Count of Steelhead: , LOWER GRANITE DAM Plate 9. Lower Granite Dam General Site Map, Fish Passage Facilities Fish Counting Schedule Fish Ladder Operating Schedule Fishway Activities Table 114. Monthly Totals of Salmonids, Shad, and Lamprey: Table Monthly Discharge, Water Quality, and Fish Counts January through December: Table 126. Yearly totals of Salmonids: Table 127. Monthly Count of Chinook Salmon: Table 128. Monthly Count of Steelhead: Table 129. Night Count of Sockeye Table 130. Night Count of Lamprey iv
9 TABLE OF CONTENTS (Continued) Mid - Columbia River Public Utility District Projects PRIEST RAPIDS AND WANAPUM DAMS Fishway Counting Schedule Fish Ladder Operating and Maintenance Schedule Fishway Activities Table 131. Monthly Totals of Salmonids, Shad, and Lamprey: Table Monthly Discharge, Water Quality, and Fish Counts April through November: Table 140. Yearly totals of Salmonids: Table 141. Monthly Count of Steelhead: ROCK ISLAND DAM Fish Counting Schedule Fish Ladder Operating Schedule Fishway Activities Table 142. Monthly Totals of Salmonids and Lamprey: Table Monthly Discharge, Water Quality, and Fish Counts April through November: Table 151. Monthly Count of Steelhead: ROCKY REACH DAM Fish Counting Schedule Fish Ladder Operating Schedule Fishway Activities Table 152. Monthly Totals of Salmonids and Lamprey: Table Monthly Discharge, Water Quality, and Fish Counts April through November: Table 161. Monthly Count of Steelhead: v
10 TABLE OF CONTENTS (Continued) WELLS DAM Fish Counting Schedule Fish Ladder Operating Schedule..207 Juvenile Passage Facilities Table 162. Monthly Totals of Salmonids and Lamprey: Table Monthly Discharge, Water Quality, and Fish Counts May through November: Table 170. Monthly Count of Steelhead: vi
11
12 TABLE 1 FISH ESCAPEMENT AT MAIN STEM DAMS ON THE COLUMBIA AND SNAKE RIVERS: LOWER LITTLE LOWER SPECIES BONNEVILLE THE DALLES JOHN DAY MCNARY ICE HARBOR MONUMENTAL GOOSE GRANITE 2008 CHINOOK* 587, , , , , , , ,632 Spring* 143, ,239 96,697 80,213 60,899 61,397 58,201 61,092 Summer* 89,892 77,279 77,329 65,974 28,657 30,233 26,559 27,684 Fall* 354, , , ,792 33,451 31,388 24,193 26,856 Jacks 68,480 66,298 60,788 43,295 24,265 20,240 18,674 26,246 STEELHEAD 356, , , , , , , ,421 SOCKEYE 213, , , , COHO* 145,913 42,682 44,898 21,806 3,003 4,513 3,806 4,770 Adults 135,399 37,982 39,975 18,756 2,889 4,143 3,440 3,458 Jacks 10,514 4,700 4,923 3, ,312 SHAD 2,144,756 1,805,516 ** 623, ,312 ** ** 3,573 LAMPREY 14,562 4,599 6,625 1, CHINOOK* 698, , , , , , , ,032 Spring* 181, , , ,741 83,658 86,940 76,973 80,731 Summer* 119, ,794 99,136 78,319 33,256 35,086 31,547 30,849 Fall* 398, , , ,445 63,435 61,425 55,042 56,452 Jacks 218, , , ,411 76,234 70,983 67,460 88,716 STEELHEAD 603, , , , , , , ,527 SOCKEYE 177, , , , ,162 1,061 1,219 COHO* 234,347 77,492 71,739 37,270 5,436 5,617 5,239 4,912 Adults 224,597 68,940 64,893 33,358 4,947 4,583 4,548 4,629 Jacks 9,750 8,552 6,846 3, , SHAD 1,373,738 1,641,362 ** 486,725 79,496 ** ** 3,457 LAMPREY 8,622 2,318 2, CHINOOK* 902, , , , , , , ,394 Spring* 256, , , , , ,232 98, ,612 Summer* 113,207 93,820 83,430 74,589 33,086 39,459 36,378 34,072 Fall* 531, , , ,154 58,771 58,126 54,627 54,710 Jacks 92,609 75,458 69,502 44,681 21,780 25,668 20,912 24,598 STEELHEAD 412, , , , , , , ,333 SOCKEYE 386, , , ,799 1,302 1,652 1,658 2,201 COHO* 127,142 31,374 23,269 15,089 1,735 2,003 2,008 1,902 Adults 120,223 29,091 21,506 13,673 1,521 1,707 1,727 1,509 Jacks 6,919 2,283 1,763 1, SHAD 1,042,471 1,241,769 ** 276,673 70,853 ** ** 3,279 LAMPREY 6,237 1,726 1, CHINOOK* 862, , , , , , , ,498 Spring* 218, , , ,995 87,467 87,926 90,813 81,405 Summer* 159, , , ,786 39,136 44,906 60,425 53,189 Fall* 485, , , ,646 50,983 45,449 46,186 44,904 Jacks 185, , , ,370 50,117 49,679 58,970 58,141 STEELHEAD 366, , , , , , , ,522 SOCKEYE 185, , , ,952 1,141 1,395 1,436 1,502 COHO* 149,710 76,753 65,668 44,304 6,727 4,829 4,851 5,348 Adults 145,138 72,120 62,795 42,220 5,914 4,579 4,445 5,057 Jacks 4,572 4,633 2,873 2, SHAD 948,070 ** ** 224,905 37,409 ** ** 174 LAMPREY 18,305 4,997 3, CHINOOK* 733, , , , , , , ,449 Spring* 165, , , ,550 74,862 71,499 71,696 69,891 Summer* 93,898 79,614 71,229 69,532 15,663 16,761 16,361 14,880 Fall* 474, , , ,727 60,100 56,401 54,062 56,678 Jacks 143, , ,693 63,146 25,940 27,385 24,281 27,232 STEELHEAD 233, , , , , ,523 98, ,675 SOCKEYE 515, , , , COHO* 59,921 33,898 33,859 18,201 2,985 2,501 2,662 2,635 Adults 54,882 31,037 30,216 16,776 2,653 2,216 2,402 2,433 Jacks 5,039 2,861 3,643 1, SHAD 2,432,394 ** ** 675, ,936 ** ** 7,413 LAMPREY 29,223 6,241 4, ASSUMED DATES FOR CHINOOK RUN (MAY VARY FROM PREVIOUS YEARS) SPRING 15 MARCH - 1 APRIL - 1 APR - 1 APR - 1 APR - 1 APR - 1 APR - 1 MAR - 31 MAY 3 JUNE 5 JUN 8 JUN 11 JUN 13 JUN 15-Jun 17 JUN SUMMER 1 JUN - 4 JUN - 6 JUN - 9 JUN - 12 JUN - 14 JUN - 16 JUN - 18 JUN - 31 JUL 3 AUG 5 AUG 8 AUG 11 AUG 13 AUG 15-Aug 17 AUG FALL 1 AUG - 4 AUG - 6 AUG - 9 AUG - 12 AUG - 14 AUG - 16 AUG - 18 AUG - 15 NOV 31 OCT 31 OCT 31 OCT 31 OCT 31 OCT 31 OCT 15 DEC *Includes Jack Counts. Changes reflect counts updated on the electronic data base after the 2007 AFPR publication. 2
13 TABLE 2 FISH ESCAPEMENT AT MID COLUMBIA RIVER DAMS: PRIEST ROCK ROCKY SPECIES RAPIDS ISLAND REACH WELLS 2008 CHINOOK* 104,001 68,075 48,135 31,992 Spring* 12,798 15,095 4,605 3,134 Summer* 42,616 41,877 33,861 22,435 Fall* 48,587 11,103 9,669 6,423 Jacks 18,637 8,019 6,202 4,261 STEELHEAD 16,725 16,288 13,871 9,808 SOCKEYE 196, , , ,334 COHO* 6,022 8,393 3,726 1,196 Adults 5,592 6,736 2,944 1,191 Jacks 430 1, SHAD 340 ** ** ** LAMPREY 5, CHINOOK* 114,137 87,420 59,348 44,027 Spring* 16,379 24,027 8,707 8,174 Summer* 51,534 50,263 41,298 29,525 Fall* 46,224 13,130 9,343 6,328 Jacks 10,426 17,449 8,951 7,779 STEELHEAD 40,093 37,800 29,547 25,443 SOCKEYE 153, , , ,937 COHO* 11,293 21,905 5,937 3,014 Adults 10,884 19,805 5,611 2,985 Jacks 409 2, SHAD 295 ** ** ** LAMPREY 2, CHINOOK* 124,443 96,670 55,883 41,463 Spring* 31,471 33,063 9,489 8,257 Summer* 50,482 51,698 37,239 28,950 Fall* 42,490 11,909 9,155 4,256 Jacks 6,025 8,315 3,860 3,669 STEELHEAD 26,476 22,179 17,871 12,929 SOCKEYE 357, , , ,766 COHO* 2,655 7,695 2,691 1,234 Adults 2,389 6,209 2,181 1,224 Jacks 266 1, SHAD 1,815 ** ** ** LAMPREY 1, CHINOOK* 116,914 94,490 63,711 51,745 Spring* 21,276 23,916 11,304 8,122 Summer* 55,088 60,843 49,841 38,286 Fall* 40,550 9,731 2,566 5,337 Jacks 15,767 28,116 15,338 14,882 STEELHEAD 20,757 19,024 15,280 12,069 SOCKEYE 145, , , ,508 COHO* 23,392 31,045 7,951 5,796 Adults 22,098 30,341 7,812 5,784 Jacks 1, SHAD 271 ** ** ** LAMPREY 3, CHINOOK* 138,487 92,074 68,059 52,846 Spring* 20,510 21,889 7,011 6,011 Summer* 52,661 57,485 50,748 41,859 Fall* 65,316 12,700 10,300 4,976 Jacks 13,500 9,661 7,457 5,388 STEELHEAD 17,230 15,454 13,100 9,778 SOCKEYE 408, , , ,107 COHO* 9,957 8,277 2,440 2,042 Adults 8,380 8,115 2,397 2,035 Jacks 1, SHAD 1,939 ** ** ** LAMPREY 4,025 1, ASSUMED DATES FOR CHINOOK RUNS (MAY VARY FROM PREVIOUS YEARS) SPRING 15 APR - 14 APR - 14 APR - 1 MAY - 13 JUN 23 JUN 23 JUN 28 JUN SUMMER 14 JUN 24 JUN - 24 JUN - 29 JUN - 13 AUG 1 SEP 1 SEP 28 AUG FALL 14 AUG - 2 SEP - 2 SEP - 29 AUG - 15 NOV 15 NOV 15 NOV 15 NOV *Includes Jack counts. 3
14 TABLE 3 and TABLE 4 STEELHEAD OVER COLUMBIA AND SNAKE RIVER DAMS BY RUN-YEAR (JUNE 1 - MAY 31) Information Below Concerns the Following Two Tables Estimating the size of the upriver steelhead run has previously been hampered because of the calendar year approach used in the summary tables. Problems in accountability arise due to over wintering behavior of summer steelhead, especially Snake River stocks, which often have sizeable proportions of the run remaining below mainstem projects during the winter months. Migration of these steelhead commences again the following spring when warming reservoir temperatures trigger upstream movement. For this reason, an additional table has been prepared that summarizes steelhead trout counts at each project on a "fish year basis: June 1 - May 31. Because all stocks of steelhead cross Bonneville Dam during the calendar year, those summary counts have not been modified. Footnotes for the Following Two Tables *Because counting started at each dam early in the year after construction was complete, these figures are for the latter part of the run year only. That part of the run year starting after June 1st of the previous 'year passed the dams without being counted. **1981 was the last year visual counts were made at Little Goose Project until
15 TABLE 3 STEELHEAD OVER COLUMBIA AND SNAKE RIVER DAMS BY RUN-YEAR (JUNE 1 - MAY 31) THE JOHN ICE LOWER LITTLE LOWER RUN-YEAR DALLES DAY MCNARY HARBOR MONUMENTAL GOOSE** GRANITE ,252 * , , ,531 * 40, , , ,170 87, , , ,955 95, , ,679 9,474 * , , , , ,676 76, ,509 99,872 58, , ,469 62, , ,461 64, ,231 6,598 * , , , ,806 85,273 16,240 * ,617 81,623 74,933 58,172 63,269 9,256 * ,319 81,238 68,598 54,445 58,430 54, , , ,450 66,196 68,704 70, , ,704 95,837 63,584 66,650 63, ,924 93,951 62,158 37,245 38,288 37, ,336 40,868 26,191 12,170 14,851 13,818 2,789 * ,695 33,640 25,150 15,895 17,236 15,177 16, ,194 59,368 54,409 24,140 21,801 21,109 22, , ,193 86,962 54,911 48,160 47,617 57, ,995 43,554 34,580 27,252 19,849 24,050 26, ,317 59,825 54,213 26,790 20,073 23,816 28, ,309 77,113 63,957 47,778 32,599 36,680 37, ,265 96,663 62,955 43,274 37,755 36,896 42, , ,438 72,246 70,236 60,775 ** 72, , , ,706 90,030 82,555 88, , , , ,008 92, , , , , , , , , , , , , , , , ,587 77,565 64,717 71, , , ,361 98,950 81,324 87, , , , , ,050 ** 131, , ,117 94,522 54,370 44,518 1,070 56, , , , ,874 97,454 96,421 99, , , , , , , , ,449 94,080 90,359 68,568 65,883 58,747 59, ,378 92,362 92,568 49,450 48,231 46,258 47, , , ,813 91,938 89,953 77,417 79, , , , ,384 96,785 82,573 86, , , , ,220 85,959 74,845 86, , ,628 98,606 84,135 65,173 62,641 70, , ,239 84,413 84,253 73,135 65,505 73, , , , , , , , , , , , , , , , , , , , , , , , , , , , , , , , , , , , , , , , , , , , , , , , , , , , , , , , , , , , , , , , , , , , , , , , , , , , , , , , , , , , ,285 Total 9,945,476 7,786,894 7,733,470 5,157,233 4,394,568 3,292,237 4,109, Year Average 307, , , , , , ,907 *Partial year ** 1981 was the last year visual counts were made at Little Goose Project until Note: Extended video counts from participating projects included for
16 TABLE 4 STEELHEAD OVER MID COLUMBIA RIVER DAMS BY RUN-YEAR (JUNE 1 - MAY 31) PRIEST ROCK ROCKY RUN-YEAR RAPIDS ISLAND REACH WELLS * , , , , , , , , , , , , , , , , * ,490 4, ,632 5, ,479 1, ,704 3, ,308 3, ,122 7,607 5,567 4, ,948 9,737 6,037 7, ,103 29,885 19,864 19, ,566 25,287 17,349 16, ,007 31,813 22,621 19, ,332 22,766 15,060 13, ,054 12,887 7,243 5, ,138 9,100 5,573 4, ,720 9,244 5,991 4, ,858 6,926 5,023 3, ,047 11,125 7,788 7, ,596 12,382 7,429 7, ,405 4,689 2,738 2, ,710 5,633 2,825 2, ,357 4,168 1, ,323 7,295 5,780 4, ,942 7,718 6,756 4, ,846 4,968 4,404 2, ,267 6,346 4,848 3, ,341 10,565 8,307 6, ,102 28,614 22,114 18, ,867 15,243 11,718 9, ,729 17,633 13,919 10, ,655 19,448 14,624 9, ,502 12,413 9,498 7, ,415 9,371 8,141 6, ,257 13,516 10,487 7, ,658 16,119 13,798 9, ,121 37,821 29,481 25, ,431 22,129 18,091 12, ,806 19,123 15,418 12,047 Total 653, , , , Year Average 19,444 18,282 14,518 11,042 *Partial year 6
17
18 BONNEVILLE DAM FISH COUNTING SCHEDULE Jan 1 Mar 31 Apr 1 Oct 31 Jun 1 Sep 30 Nov 1 Dec 31 Video counting daily hours (PST) Visual counting daily hours (DST) Video Lamprey counting hours (DST) Video counting daily hours (PST) FISH FACILITIES OPERATION SCHEDULE Fish Facility OOS Date 2011 In Service Date 2012 OOS Date 2012 BI Lamprey Passage Structure 09 Nov May Nov 12 Winter maintenance CI Lamprey Passage Structure 15 Sep May Sep 12 Winter maintenance WS Lamprey Passage Structure 09 Nov May Nov 12 Winter maintenance Reason for Outage Bradford Island Ladder 13 Dec Feb 12 N/A Winter maintenance A-branch Ladder 14 Dec Feb 12 N/A Winter maintenance 17 Sep Feb Sep 12 Early outage for emergency erosion repair/winter Maintenance B-branch Ladder (2011); FV4-4 repairs (2012) Cascades Island ladder N/A 08 Nov 12 N/A CI exit opened in lieu of early WA Shore ladder outage UMT N/A N/A 13 Nov 12 Winter maintenance and LPS construction on N monolith WS Ladder N/A N/A 13 Nov 12 Winter maintenance and LPS construction on N monolith DSM 2 03 Nov Feb Nov 12 Winter maintenance and LPS construction on N monolith B2CC 01 Sep Mar Sep 12 Closed for winter maintenance until 2012 fish passage season, Kelt trigger reached on 19 March, closed for repairs on 16 Sept AFF 12 Oct Apr Nov 12 Early 2012 outage for WA Shore LPS construction JMF 31 Oct Mar Oct 12 System in bypass for winter FISHWAY ACTIVITIES The following are fishway modifications for the 2011/2012 passage year: Replaced PIT tag antenna in Bradford Island serpentine section. Dredged along the exit channel for the Bradford Island fishladder. Spillway erosion hole and ogee repair. 8
19 Bradford Island fishway picket lead modifications to insure one inch spacing between leads and sill plate and prevent lead bending. Spacers installed. Cascades Island lamprey passage system (LPS) extension into the forebay and conversion to volitional passage system. Repairs to the south monolith gates and guides on B-valves 3 and 4. Debris removal from the Washington shore AWS and accompanying diffusers. B2CC bulkhead converted to permanent hoist with automatic control. B2CC joint repair to fix spalling and decrease channel roughness. Construction of new lamprey passage system at NDE on the north monolith. Washington shore picket lead modifications to insure 1 ½ inch spacing between leads and sill plate and prevent lead bending. Spacers installed. FISH REMOVAL Fish passage facilities and turbine units are taken out of service and dewatered to allow for inspection, preventative maintenance, repairs, and modifications. As facilities and turbine units are dewatered, project biologists, outside agency personnel, and other project personnel follow procedures outlined in the Fish Passage Plan and detailed in the Fish Salvage Plan to minimize impacts on fish. Fish recovered are typically released into the forebay above the new navigation lock. Salvaged sturgeon and juvenile salmonids, however, are released below the dam at Hamilton Island. The following is a summary of the number of fish that were removed during facility and turbine unit dewaterings. All fish were recovered in good condition unless otherwise noted. Unit 5 draft tube (12/08/11): 1 sturgeon. Bradford Island ladder (12/14/11): 9 shad, 4 rainbow trout, 1 peamouth, 2 adult steelhead, and 14 juvenile salmonids from the junction pool; and 7 steelhead and 1 shad were recovered from the A-branch ladder. Unit 18 Scroll case (12/22/11): white sturgeon. These fish were released into the forebay of PH2 in fair to poor condition. More information can be found in MFR BON BON U18 Scroll Case. Navlock 2 (03/07/12): 12 yearling chinook, 20 sculpin, 7 small mouth bass, and 25 crayfish. Unit 11 draft tube (5/16/12): 19 white sturgeon, 3 adult Chinook. Unit 6 head gate (05/22/12): 15 juvenile steelhead, 25 yearling Chinook. Unit 6 head gate (05/23/12): 66 juvenile salmonids (primarily yearling Chinook, some steelhead and sockeye). Unit 4 head gate (06/04/12): 175 juvenile salmonids (Chinook, coho, steelhead, sockeye). 9
20 Unit 1 scroll case (06/05/12): 1000 juvenile salmonids (Chinook, coho, steelhead, sockeye), 1 adult Chinook. Unit 1 draft tube (06/05/12): 35 lamprey, 3 juvenile Chinook, 1 white sturgeon, 2 adult Chinook. Unit 11 tail logs (06/08/12): 2 lamprey, 20 sculpin, 1 catfish. Unit 14 draft tube (06/12/12): 2 white sturgeon, 36 lamprey, and 1 juvenile salmonid. Unit 1 tail logs (06/13/12): 4 white sturgeon, 5 juvenile salmonids, 2 bass, 1 crayfish, and approximately 50 sculpin. Unit 11 tail logs (06/26/12): 3 sculpin, 1 catfish, 1 crayfish. Unit 10 head gate (07/09/12): 50 subyearling Chinook, 5 mini-jacks. Unit 10 scroll case (07/09/12): 600 subyearling Chinook, 15 American shad, 30 Chinook minijacks. Unit 10 draft tube (07/10/12): 15 white sturgeon, 30 lamprey, 20 subyearling Chinook. Unit 11 draft tube (07/24/12): 17 lamprey, 5 white sturgeon, 2 channel catfish, 12 bullhead catfish. Tainter valve 3 (08/06/12): 80 American shad, 1 carp. Unit 11 tail logs (8/28/12): 1 smallmouth bass. Unit 10 tail logs (8/29/12): 2 white sturgeon, 12 sculpin, 10 crayfish. Unit 14 tail logs (9/5/12): 1 smallmouth bass, 25 sculpin. Unit 17 tail logs (9/20/12): 1 smallmouth bass, 26 sculpin, 1 lamprey. Unit 11 draft tube (9/25/12): white sturgeon. B-branch fish ladder (9/25/12): salmonids. B-branch entrance bay (9/27/12): 1 adult Chinook and 1 Largescale sucker. Unit 3 draft tube (10/3/12): 17 white sturgeon. Unit 3 tail logs (11/8/12): 30 white sturgeon, 21 sculpin. AFF fish ladder (11/8/12): 2 white sturgeon, 12 lamprey, 10 suckers, 13 peamouth. 10
21 WA shore to TW (11/13/12): 9 adult Chinook, 4 adult steelhead, 6 lamprey, 2 small-mouth bass, 12 suckers, 10 peamouth. WA shore entrance pool (11/15/12): 3 white sturgeon, 1 adult Chinook, 1 trout, 4 small-mouth bass, 9 shad, 10 suckers. PH2CC south entrance pool (11/20/12): 5 suckers, 1 small-mouth bass. Unit 13 tail logs (11/21/12): 12 sculpin. 11
22 TABLE 5 MONTHLY TOTALS OF SALMONID, SHAD, LAMPREY, STURGEON, AND BULL TROUT COUNTED OVER BONNEVILLE DAM SPECIES JAN FEB MAR APR MAY JUN JUL AUG SEP OCT NOV DEC TOTAL CHINOOK* , ,939 62,450 31,448 86, ,800 31,073 1, ,930 STEELHEAD ,940 1,312 1,703 7,943 72,994 86,419 49,966 10,478 1, ,303 SOCKEYE , , ,673 COHO* 3 6,162 37,556 15, ,023 CHUM PINK TOTAL ,979 25, , , , , ,329 56,911 3, ,544,995 SHAD 18,446 2,331,533 79,282 3,133 2,432,394 LAMPREY 20 1,141 8,073 10,780 6,555 2, ,224 STURGEON BULL TROUT 0 *Jacks included note: Counts were taken from PST Jan 1 - Dec 31. Visual counting occurred Apr 1 - Oct 31. Video counting occurred Jan 1 - Mar 31 and Nov 1 - Dec
23 TABLE 6 MONTHLY FISH PASSAGE SUMMARY REPORT U.S. ARMY ENGINEER DISTRICT, PORTLAND BONNEVILLE PROJECT - FISH COUNTS JANUARY 2012 CHINOOK ADULT CHINOOK COHO COHO unclipped DISCH SPILL TURBIDITY DATE SPRING SUMMER FALL JACK ADULT JACK SOCKEYE STEELHEAD STEELHEAD PINK CHUM SHAD LAMPREY STURGEON KCFS KCFS SECCHI DEG F Jan Jan Jan Jan Jan Jan Jan Jan Jan Jan Jan Jan Jan Jan Jan Jan Jan Jan Jan Jan Jan Jan Jan Jan Jan Jan Jan * 38.0 Jan Jan Jan Jan TOTAL AVG *Data unavailable Note: January 1 to March 31 counts were from video tape. The counts are 16-hour counts and occurred between the hours of PST. 13
24 TABLE 7 MONTHLY FISH PASSAGE SUMMARY REPORT U.S. ARMY ENGINEER DISTRICT, PORTLAND BONNEVILLE PROJECT - FISH COUNTS FEBRUARY 2012 CHINOOK ADULT CHINOOK COHO unclipped DISCH SPILL TURBIDITY DATE SPRING SUMMER FALL JACK ADULT JACK SOCKEYE STEELHEAD STEELHEAD PINK CHUM SHAD LAMPREY STURGEON KCFS KCFS SECCHI DEG F Feb Feb Feb Feb Feb Feb Feb Feb Feb Feb Feb Feb Feb Feb Feb Feb Feb Feb Feb Feb Feb Feb Feb Feb Feb Feb Feb Feb Feb TOTAL AVG Note: January 1 to March 31 counts were from video tape. The counts are 16-hour counts and occurred between the hours of PST. 14
25 TABLE 8 MONTHLY FISH PASSAGE SUMMARY REPORT U.S. ARMY ENGINEER DISTRICT, PORTLAND BONNEVILLE PROJECT - FISH COUNTS MARCH 2012 CHINOOK ADULT CHINOOK COHO COHO unclipped DISCH SPILL TURBIDITY DATE SPRING SUMMER FALL JACK ADULT JACK SOCKEYE STEELHEAD STEELHEAD PINK CHUM SHAD LAMPREY STURGEON KCFS KCFS SECCHI DEG F Mar Mar Mar Mar Mar Mar Mar Mar Mar Mar Mar Mar Mar Mar Mar Mar Mar Mar Mar Mar Mar Mar Mar Mar Mar Mar Mar Mar Mar Mar Mar TOTAL , AVG Note: January 1 to March 31 counts were from video tape. The counts are 16-hour counts and occurred between the hours of PST. Visual counting started April 1. Official Spring Chinook run started March 15. January, February, and March 1-14 Chinook counts were not added to spring totals 15
26 TABLE 9 MONTHLY FISH PASSAGE SUMMARY REPORT U.S. ARMY ENGINEER DISTRICT, PORTLAND BONNEVILLE PROJECT - FISH COUNTS APRIL 2012 CHINOOK ADULT CHINOOK COHO COHO unclipped DISCH SPILL TURBIDITY DATE SPRING SUMMER FALL JACK ADULT JACK SOCKEYE STEELHEAD STEELHEAD PINK CHUM SHAD LAMPREY STURGEON KCFS KCFS SECCHI DEG F Apr Apr Apr Apr Apr Apr Apr Apr Apr Apr Apr Apr Apr Apr Apr Apr Apr Apr Apr Apr Apr 21 1, Apr 22 2, Apr 23 4, Apr 24 4, Apr 25 2, Apr 26 1, Apr Apr Apr Apr 30 1, TOTAL 23, , AVG RUN YEAR CHINOOK CHINOOK unclipped TOTALS TO DATE ADULT JACK SOCKEYE STEELHEAD STEELHEAD LAMPREY SPRING 23, ,
27 TABLE 10 MONTHLY FISH PASSAGE SUMMARY REPORT U.S. ARMY ENGINEER DISTRICT, PORTLAND BONNEVILLE PROJECT - FISH COUNTS MAY 2012 CHINOOK ADULT CHINOOK COHO COHO unclipped DISCH SPILL TURBIDITY DATE SPRING SUMMER FALL JACK ADULT JACK SOCKEYE STEELHEAD STEELHEAD PINK CHUM SHAD LAMPREY STURGEON KCFS KCFS SECCHI DEG F May 1 2, May 2 1, May 3 2, May 4 3, May 5 3, May 6 5, May 7 9, May 8 12, May 9 18, May 10 7, May 11 5, May 12 7, May 13 8, May 14 8, May 15 7, May 16 4, May 17 4, May 18 3, May 19 2, , May 20 2, , May 21 1, May 22 1, May May 24 1, May 25 1, , May 26 1, , May 27 1, , May 28 1, , May 29 1, May 30 1, May 31 2, , TOTAL 134,587 7, , ,446 1,141-1 AVG 4, RUN YEAR CHINOOK CHINOOK unclipped TOTALS TO DATE ADULT JACK SOCKEYE STEELHEAD STEELHEAD SHAD LAMPREY STURGEON SPRING 158,075 7, ,335 1,280 18,446 1,
28 TABLE 11 MONTHLY FISH PASSAGE SUMMARY REPORT U.S. ARMY ENGINEER DISTRICT, PORTLAND BONNEVILLE PROJECT - FISH COUNTS JUNE 2012 CHINOOK ADULT CHINOOK COHO COHO unclipped DISCH SPILL TURBIDITY DATE SPRING SUMMER FALL JACK ADULT JACK SOCKEYE STEELHEAD STEELHEAD PINK CHUM SHAD LAMPREY STURGEON KCFS KCFS SECCHI DEG F Jun 1 2, , Jun 2 2, , Jun 3 1, , Jun 4 1, , Jun 5 1, , Jun 6 1, , Jun 7 1, , Jun 8 1, , , Jun 9 1, , , Jun 10 1, , , Jun 11 1, , , Jun 12 1, , , Jun 13 2, , , Jun 14 2, , , Jun 15 2, , , Jun 16 2, , , Jun 17 2, , , Jun 18 2, , , Jun 19 2, , , Jun 20 2, , , Jun 21 2, , , Jun 22 1, , , Jun 23 1, , , Jun 24 1, , , Jun 25 1, , , Jun 26 1, , , Jun 27 1, , , Jun 28 1, , , Jun 29 1, , , Jun 30 1, , , TOTAL 55,856 6, ,529 7,943 2,586 2,331,533 8,073 AVG 1, , , RUN YEAR CHINOOK CHINOOK unclipped TOTALS TO DATE ADULT JACK SOCKEYE STEELHEAD STEELHEAD SHAD LAMPREY STURGEON SPRING 158,075 7, ,609 12,278 3,866 2,349,979 9,233-1 SUMMER 55,856 6,594 TOTAL 213,931 14,185 18
29 TABLE 12 MONTHLY FISH PASSAGE SUMMARY REPORT U.S. ARMY ENGINEER DISTRICT, PORTLAND BONNEVILLE PROJECT - FISH COUNTS JULY 2012 CHINOOK ADULT CHINOOK COHO COHO unclipped DISCH SPILL TURBIDITY DATE SPRING SUMMER FALL JACK ADULT JACK SOCKEYE STEELHEAD STEELHEAD PINK CHUM SHAD LAMPREY STURGEON KCFS KCFS SECCHI DEG F Jul 1 1, , , Jul 2 1, , , Jul 3 1, , , Jul 4 1, , , Jul 5 1, , , Jul 6 1, , , Jul 7 1, ,139 1, , Jul 8 1, ,619 1, , Jul ,390 1, , Jul 10 1, ,079 1, Jul 11 1, ,921 1, Jul 12 1, ,675 1, , Jul 13 1, ,479 2,277 1, , Jul ,414 2,407 1, , Jul ,131 2,480 1, , Jul ,697 1, , Jul ,920 1, , Jul ,847 1, , Jul ,112 1, , Jul ,585 1, , Jul ,706 1, Jul ,713 1, Jul ,019 1, Jul ,672 1, Jul ,989 1, Jul ,756 1, Jul ,464 1, Jul ,378 1, Jul ,905 1, Jul ,695 1, Jul ,675 1, TOTAL 25,807 5, ,889 72,994 33, ,282 10,780 2 AVG ,287 2,355 1, , RUN YEAR CHINOOK CHINOOK COHO COHO unclipped TOTALS TO DATE ADULT JACK ADULT JACK SOCKEYE STEELHEAD STEELHEAD CHUM SHAD LAMPREY STURGEON SPRING 158,075 7, ,498 85,272 37, ,429,261 20,013 1 SUMMER 81,663 12,235 TOTAL 239,738 19,826 19
30 TABLE 13 MONTHLY FISH PASSAGE SUMMARY REPORT U.S. ARMY ENGINEER DISTRICT, PORTLAND BONNEVILLE PROJECT - FISH COUNTS AUGUST 2012 CHINOOK ADULT CHINOOK COHO COHO unclipped DISCH SPILL TURBIDITY DATE SPRING SUMMER FALL JACK ADULT JACK SOCKEYE STEELHEAD STEELHEAD PINK CHUM SHAD LAMPREY STURGEON KCFS KCFS SECCHI DEG F Aug ,356 2, Aug ,738 1, Aug ,441 1, Aug ,595 1, Aug ,141 1, Aug ,904 1, Aug ,899 1, Aug ,976 1, Aug ,279 1, Aug ,313 1, Aug , Aug , Aug ,943 1, Aug ,413 1, Aug ,494 1, * 72.0 Aug ,188 1, * 72.0 Aug , * 72.0 Aug 18 1, , * 73.0 Aug 19 1, , * 72.0 Aug , * 72.0 Aug , * 72.0 Aug 22 2, , * 71.0 Aug 23 3, , * 70.0 Aug 24 3, , Aug 25 3, , Aug 26 4, , Aug 27 6,033 1, , Aug 28 7,375 1, , Aug 29 6,928 1, , Aug 30 7,207 1, , Aug 31 12,390 2,292 1, , TOTAL 70,881 15,397 5, ,419 29,670 3,133 6,555 0 AVG 2, , RUN YEAR CHINOOK CHINOOK COHO COHO unclipped *Data unavailable TOTALS TO DATE ADULT JACK ADULT JACK SOCKEYE STEELHEAD STEELHEAD CHUM SHAD LAMPREY STURGEON SPRING 158,075 7,591 5, , ,691 66, ,432,394 26,568 1 SUMMER 81,663 12,235 FALL 70,881 15,397 TOTAL 310,619 35,223 20
31 TABLE 14 MONTHLY FISH PASSAGE SUMMARY REPORT U.S. ARMY ENGINEER DISTRICT, PORTLAND BONNEVILLE PROJECT - FISH COUNTS SEPTEMBER 2012 CHINOOK ADULT CHINOOK COHO COHO unclipped DISCH SPILL TURBIDITY DATE SPRING SUMMER FALL JACK ADULT JACK SOCKEYE STEELHEAD STEELHEAD PINK CHUM SHAD LAMPREY STURGEON KCFS KCFS SECCHI DEG F Sep 1 14,015 2,869 2, , Sep 2 12,686 2,824 2, , Sep 3 11,946 3,078 2, , Sep 4 10,828 2,402 2, , Sep 5 9,967 2,312 1, , Sep 6 11,487 2,545 1, , Sep 7 12,511 3,677 1, , * 69.0 Sep 8 14,186 3,989 1, , * 69.0 Sep 9 14,675 4, , * 69.0 Sep 10 13,256 3, , * 68.0 Sep 11 8,165 2, , Sep 12 7,102 2, , Sep 13 14,112 3,281 1, , Sep 14 18,027 5,672 3, , Sep 15 15,424 6,230 3, , Sep 16 11,797 4,916 2, , Sep 17 7,687 4, , Sep 18 6,578 3, , Sep 19 6,088 3, , Sep 20 4,917 3, , Sep 21 6,602 4, , Sep 22 4,059 2, , Sep 23 4,577 2, , Sep 24 2,639 1, Sep 25 2,901 2, Sep 26 3,933 3, , Sep 27 3,606 2, , Sep 28 3,335 2, , Sep 29 1,957 1, Sep 30 1,363 1, TOTAL 260,426 95,374 35,482 2, ,966 14, , AVG 8,681 3,179 1, , RUN YEAR CHINOOK CHINOOK COHO COHO unclipped *Data unavailable TOTALS TO DATE ADULT JACK ADULT JACK SOCKEYE STEELHEAD STEELHEAD PINK CHUM SHAD LAMPREY STURGEON SPRING 158,075 7,591 41,087 2, , ,657 81, ,432,394 29, SUMMER 81,663 12,235 FALL 331, ,771 TOTAL 571, ,597 21
32 TABLE 15 MONTHLY FISH PASSAGE SUMMARY REPORT U.S. ARMY ENGINEER DISTRICT, PORTLAND BONNEVILLE PROJECT - FISH COUNTS OCTOBER 2012 CHINOOK ADULT CHINOOK COHO COHO unclipped DISCH SPILL TURBIDITY DATE SPRING SUMMER FALL JACK ADULT JACK SOCKEYE STEELHEAD STEELHEAD PINK CHUM SHAD LAMPREY STURGEON KCFS KCFS SECCHI DEG F Oct 1 1,432 1, Oct 2 2,082 1, Oct 3 2,284 1, Oct 4 1, Oct Oct Oct 7 1, Oct Oct 9 1, Oct Oct Oct Oct Oct Oct Oct Oct Oct Oct Oct Oct Oct Oct Oct Oct Oct Oct Oct Oct Oct Oct TOTAL 18,041 13,032 13,050 2,295 10,478 3, AVG RUN YEAR CHINOOK CHINOOK COHO COHO unclipped TOTALS TO DATE ADULT JACK ADULT JACK SOCKEYE STEELHEAD STEELHEAD PINK CHUM SHAD LAMPREY STURGEON SPRING 158,075 7,591 54,137 4, , ,135 84, ,432,394 29, SUMMER 81,663 12,235 FALL 349, ,803 TOTAL 589, ,629 22
33 TABLE 16 MONTHLY FISH PASSAGE SUMMARY REPORT U.S. ARMY ENGINEER DISTRICT, PORTLAND BONNEVILLE PROJECT - FISH COUNTS NOVEMBER 2012 CHINOOK ADULT CHINOOK COHO COHO unclipped DISCH SPILL TURBIDITY DATE SPRING SUMMER FALL JACK ADULT JACK SOCKEYE STEELHEAD STEELHEAD PINK CHUM SHAD LAMPREY STURGEON KCFS KCFS SECCHI DEG F Nov Nov Nov Nov Nov Nov Nov Nov Nov Nov Nov Nov Nov Nov Nov Nov Nov Nov Nov Nov Nov Nov Nov Nov Nov Nov Nov * 51.0 Nov Nov Nov TOTAL , AVG *Data unavailable RUN YEAR CHINOOK CHINOOK COHO COHO unclipped TOTALS TO DATE ADULT JACK ADULT JACK SOCKEYE STEELHEAD STEELHEAD PINK CHUM SHAD LAMPREY STURGEON SPRING 158,075 7,591 54,882 5, , ,002 84, ,432,394 29, SUMMER 81,663 12,235 FALL 350, ,115 TOTAL 589, ,941 Note: November 1 to December 31 counts were from video tape. The counts are 16-hour counts and occurred between PST. Visual counting ended October 31. Official Fall Chinook run ended November 15. Counts on November are not included in fall totals. Pink, chum, and sturgeon counts are totals for the entire calendar year. 23
34 TABLE 17 MONTHLY FISH PASSAGE SUMMARY REPORT U.S. ARMY ENGINEER DISTRICT, PORTLAND BONNEVILLE PROJECT - FISH COUNTS DECEMBER 2012 CHINOOK ADULT CHINOOK COHO COHO unclipped DISCH SPILL TURBIDITY DATE SPRING SUMMER FALL JACK ADULT JACK SOCKEYE STEELHEAD STEELHEAD PINK CHUM SHAD LAMPREY STURGEON KCFS KCFS SECCHI DEG F Dec Dec Dec Dec Dec Dec Dec Dec Dec Dec Dec Dec Dec Dec Dec Dec Dec Dec Dec Dec Dec Dec Dec Dec Dec Dec Dec Dec Dec Dec Dec TOTAL AVG RUN YEAR CHINOOK CHINOOK COHO COHO unclipped TOTALS TO DATE ADULT JACK ADULT JACK SOCKEYE STEELHEAD STEELHEAD PINK CHUM SHAD LAMPREY STURGEON SPRING 158,075 7,591 54,882 5, , ,002 84, ,432,394 29, SUMMER 81,663 12,235 FALL 350, ,115 TOTAL 589, ,941 Note: November 1 to December 31 counts were from video tape. The counts are 16-hour counts and occurred between PST. Visual counting ended October 31. Official Fall Chinook run ended November 15. December counts were not added to fall totals. Pink, chum, and sturgeon counts are totals for the entire calendar year 24
35 TABLE 18a YEARLY TOTALS OF SALMONIDS COUNTED OVER BONNEVILLE DAM TOTAL YEAR CHINOOK* STEELHEAD SOCKEYE COHO* CHUM PINK SALMONID , ,003 75,040 15,185 2, , , ,032 73,382 14,383 1, , , , ,807 11,917 1, , , ,089 65,741 17,911 5, , , ,800 55,464 12,402 1, , ,123 92,133 39,845 2, , , ,518 15,072 4, , , ,133 9, , , ,807 74,376 3,898 1, , , , ,139 11, , , , ,541 4,081 3, , , ,285 51,444 1,004 2, , , ,087 77,993 10,151 1, , , , ,428 5,201 1, , , , ,645 7,768 1, , , , ,215 13,018 1, , , , ,107 4,062 1, , , , ,748 3, , , , ,418 6, , , ,183 82,915 4, , , , ,389 3, , , ,026 86,560 2, , , ,676 59,713 3,268 1, , , ,719 17,111 3, , , ,025 28,179 14,788 1, , , ,418 60,319 12, , , ,252 99,856 53, , , ,453 55,125 76, , , , ,661 71, , , , ,158 96, , , , ,207 63, , , ,782 59,636 49, , , ,510 70,762 80, , , ,966 87,447 75, , , ,886 56,323 65, , , ,823 58,979 54, , , ,054 43,837 60, , ,566 85,540 58,212 58, , , ,177 43,611 53, , , ,437 99,829 19, , , ,431 18,436 52, , , ,979 52,628 45, , , ,254 58,882 22, ,750 25
36 TABLE 18a (continued) YEARLY TOTALS OF SALMONIDS COUNTED OVER BONNEVILLE DAM TOTAL YEAR CHINOOK* STEELHEAD SOCKEYE COHO* CHUM PINK SALMONID , ,270 56,037 30, , , ,640 50,219 73, , , , ,545 15, , , , ,541 29, , , , ,340 56, ,031, , ,891 58, , ,139, , , ,993 27, , , ,072 79,714 39, , , ,798 41,884 39, , , ,027 49,581 24, , , ,545 76,481 64, , , ,975 84,992 18, , , ,386 80,178 11, , , ,124 13,154 22, , , ,071 9,135 12, , , ,475 31,093 19, , , ,536 48,342 27, , , ,501 13,613 49, , , ,118 18,304 45, , , ,935 97,541 99, , ,037, , , , ,115, , ,680 51, , ,628, , ,821 39, , ,536, , , , , ,462, , ,650 72,971 88, ,077, , ,301 37, , ,013, , ,450 24, , , , , , , ,305, , , , , ,716, , , , , ,833, , , , , ,828 1,572, , , ,673 60, ,544,995 Total 31,700,309 15,850,072 7,128,525 3,683,744 40,461 6,944 58,410, Year Average 717, , , , ,387,351 *Jacks included Note: Totals from include nighttime video and 24-hour video as described in the footnotes of the monthly count tables 26
37 TABLE 18b YEARLY TOTALS OF SALMONIDS COUNTED OVER BONNEVILLE DAM -- DAYTIME COUNTS TOTAL YEAR CHINOOK* STEELHEAD SOCKEYE COHO* CHUM PINK SALMONID , ,003 75,040 15,185 2, , , ,032 73,382 14,383 1, , , , ,807 11,917 1, , , ,089 65,741 17,911 5, , , ,800 55,464 12,402 1, , ,123 92,133 39,845 2, , , ,518 15,072 4, , , ,133 9, , , ,807 74,376 3,898 1, , , , ,139 11, , , , ,541 4,081 3, , , ,285 51,444 1,004 2, , , ,087 77,993 10,151 1, , , , ,428 5,201 1, , , , ,645 7,768 1, , , , ,215 13,018 1, , , , ,107 4,062 1, , , , ,748 3, , , , ,418 6, , , ,183 82,915 4, , , , ,389 3, , , ,026 86,560 2, , , ,676 59,713 3,268 1, , , ,719 17,111 3, , , ,025 28,179 14,788 1, , , ,418 60,319 12, , , ,252 99,856 53, , , ,453 55,125 76, , , , ,661 71, , , , ,158 96, , , , ,207 63, , , ,782 59,636 49, , , ,510 70,762 80, , , ,966 87,447 75, , , ,886 56,323 65, , , ,823 58,979 54, , , ,054 43,837 60, , ,566 85,540 58,212 58, , , ,177 43,611 53, , , ,437 99,829 19, , , ,431 18,436 52, , , ,979 52,628 45, , , ,254 58,882 22, ,750 27
38 TABLE 18b (continued) YEARLY TOTALS OF SALMONIDS COUNTED OVER BONNEVILLE DAM -- DAYTIME COUNTS TOTAL YEAR CHINOOK* STEELHEAD SOCKEYE COHO* CHUM PINK SALMONID , ,270 56,037 30, , , ,640 50,219 73, , , , ,545 15, , , , ,541 29, , , , ,340 56, ,031, , ,891 58, , ,139, , , ,993 27, , , ,072 79,714 39, , , ,798 41,884 39, , , ,027 49,581 24, , , ,545 76,481 64, , , ,975 84,992 18, , , ,386 80,178 11, , , ,978 12,678 22, , , ,448 8,774 12, , , ,213 30,252 18, , , ,385 47,008 27, , , ,094 13,218 49, , , ,488 17,877 45, , , ,178 93,398 97, , , , , , ,985, , ,309 49,610 94, ,549, , ,821 39, , ,536, , , , , ,462, , ,650 72,971 88, ,077, , ,301 37, , ,013, , ,450 24, , , , , , , ,305, , , , , ,716, , , , , ,833, , , , , ,828 1,572, , , ,673 60, ,544,995 Total 31,548,453 15,719,005 7,110,476 3,661,821 40,461 6,944 58,087, Year Average 717, , , , ,387,351 *Jacks included Note: These totals are for daytime counts and do not include night counting or 24 hour video counts. 28
39 TABLE 19 MONTHLY COUNT OF CHINOOK SALMON SPRING SUMMER FALL BONNEVILLE DAM Jan 1- Jun 1- Aug 1- YEAR JAN FEB MAR APR MAY JUN JUL AUG SEP OCT NOV DEC TOTAL* May 31 Jul 31 Dec ,371 8,221 6,556 34, ,294 2, ,799 22,371 14, , ,410 25,159 5,602 17,828 32, ,851 2, ,189 76,708 23, , ,253 28,621 7,027 14,938 58, ,515 3, ,587 66,378 21, , ,360 51,486 19,445 7,013 9,395 12, ,967 7, ,443 72,295 16, , ,506 30,915 11,816 12,821 27, ,995 4, ,998 40,471 24, , ,172 53,268 5,440 8,044 28, ,414 3, ,123 65,500 13, , ,671 15,127 4,363 8,241 55, ,254 2, ,764 30,866 12, , ,148 26,276 11,293 16,317 32, ,675 4, ,478 43,515 27, , ,196 53,313 30,253 20,967 45, ,152 4, ,052 67,537 51, , ,520 49,899 25,502 13,358 43, ,385 3, , ,562 38, , ,205 20,262 44,137 23,100 35, ,238 3, ,555 41,728 67, , ,765 44,304 24,232 22,500 41, ,599 1, ,697 50,074 46, , ,630 50,638 16,667 32,937 40, ,521 4, ,375 57,289 49, , ,801 86,055 54,889 24,394 33,785 97,131 6, , ,888 79, , , ,807 62,491 21,800 82, ,053 2, , ,192 84, , , ,450 42,583 27,228 30,593 27,398 75,145 1, , ,287 57, , ,877 51,230 46,801 32,596 24,969 80,426 1, , ,766 79, , ,391 84,436 85,769 45,502 37,437 32,833 70,558 1, , ,596 82, , ,850 54,438 64,262 36,938 42,203 92,030 1, ,917 63, , , ,984 45, ,243 30,790 34,829 95,457 1, , , , , ,361 59,377 74,375 27,524 19, ,504 1, ,419 75, , , ,944 34,007 39,581 49,371 24, ,187 1, ,028 61,133 88, , ,064 32,349 65,247 19,923 22,719 76,327 2, ,049 69,597 85, , ,526 25,693 41,302 25,159 22,675 90,688 3, ,980 98,695 66, , ,278 56,201 33,637 52,392 25,093 23,526 91,320 2, ,625 91,116 77, , ,802 43,859 28,810 36,836 27,178 28, ,415 5, ,560 75,471 64, , ,418 69,031 19,979 35,814 44,717 26, ,525 4, ,422 91,428 80, , ,238 47,083 35,945 38,482 37,515 38, ,664 6, ,957 84,266 75, , ,168 92,637 17,864 40,233 31,764 20, ,421 6, , ,669 71, , ,620 71,957 11,358 41,847 53,812 25, ,323 5, ,237 84,935 95, , ,342 69,420 28,425 46,793 36,126 27, ,994 4, ,154 99,187 82, , ,910 65, ,281 59,177 42,976 38, ,502 5, , , , , ,020 78,605 30,351 35,091 29,811 44, ,710 4, , ,976 64, , ,849 63,985 37,757 40,154 26, ,346 8, , ,517 77, , ,443 31,271 36,758 34,072 23, ,820 3, , ,140 70, , , ,495 12,068 24,164 21,196 31, ,895 8, , ,148 45, , ,516 76,585 13,424 32,472 15, ,543 13, , ,535 45, , ,295 55,647 16,989 27,362 37, ,145 4, , ,104 44, , ,978 53,883 39,130 29,883 48, ,615 13, , ,448 69, , ,569 98,710 17,229 21,790 19,233 21, ,303 11,805 1, , ,508 41, , , ,712 44,860 27,125 17,198 23, ,411 11, , ,863 44, , ,751 20,921 15,924 18,293 41, ,241 6, ,306 51,462 34, , ,732 29,720 15,384 15,681 26, ,669 8, ,518 60,987 31, ,466 29
40 (Continued) MONTHLY COUNT OF CHINOOK SALMON SPRING SUMMER FALL BONNEVILLE DAM Jan 1- Jun 1- Aug 1- YEAR JAN FEB MAR APR MAY JUN JUL AUG SEP OCT NOV DEC TOTAL* May 31 Jul 31 Dec ,853 41,917 21,239 13,262 13,667 32, ,696 6, ,650 65,009 26, , ,282 45,450 15,439 11,175 34, ,348 11, ,809 76,044 26, , ,423 31,154 12,793 10,665 26, ,879 20, ,346 56,721 23, , ,185 23,509 13,060 15,447 41, ,867 21, ,425 51,045 28, , ,036 52,145 36,780 16,763 13,107 64, ,020 22,099 1, ,873 90,961 29, , ,292 82,356 38,395 18,365 12,676 38, ,721 39, , ,043 31, , ,727 68,866 30,214 22,728 14,979 82, ,865 25,614 1, , ,807 37, , ,663 69,689 22,394 18,191 18, , ,662 13, ,025 94,746 36, , ,583 30,640 15,659 17, , ,691 11, ,117 87,259 32, , ,536 28,039 16,990 11,031 59, ,404 8, ,990 96,252 28, , ,431 19,196 12,755 9,198 21, ,068 10, ,622 61,228 21, , ,188 68,073 20,321 11,871 7,374 28, ,620 10, ,299 90,582 19, , ,174 34,772 15,968 7,648 37,893 97,693 6, , ,172 23, , ,499 6,562 9,743 10,458 47, ,801 9, ,320 20,566 20, , ,144 5,511 8,565 9,226 47, ,990 15, ,250 12,861 17, , ,923 35,571 11,136 7,768 58, ,420 10, ,962 56,608 18, , ,577 49,921 20,162 10,943 82, ,589 9, , ,964 31, , ,549 14,587 14,500 10,396 58, ,716 11, ,292 39,832 24, , ,016 28,831 14,830 16,121 66, ,880 14, ,486 48,100 30, , , ,193 71,222 25,864 19, , ,073 11, , ,585 45, , , ,800 98,080 53,860 45, , ,892 25,875 3, ,037, ,558 99, , , , ,894 91,120 47, , ,941 20,509 5, , , , , , ,626 70,020 81,333 46,833 90, ,913 30,440 2, , , , , ,978 73,605 69,622 35, , ,727 34,858 1, , , , , ,504 46,793 52,917 30,786 47, ,426 25,199 1, ,415 78,341 83, , ,030 92,300 71,473 30,401 55, ,605 28,653 4, ,538 99, , , ,919 51,256 39,619 21,949 53, ,977 23, ,867 83,252 61, , , ,419 67,117 22, , ,385 15, , ,139 89, , , ,489 88,523 30, , ,702 17, , , , , , ,101 82,577 30, , ,450 32,845 1, , , , , , , ,352 52,378 68, ,184 43,169 1, , , , , , ,939 62,450 31,448 86, ,800 31,073 1, , ,681 93, ,351 TOTAL ,260 4,297,188 3,644,836 2,639,204 1,801,175 3,723,237 14,614, ,844 49,087 1,706 31,700,309 8,043,823 4,440,379 19,216, Year Average 2,105 55, ,070 72,298 33,344 88, ,217 28,351 1, , , , ,407 *Jacks included TABLE counts include nighttime video counts during the hours of PST June 1 through August counts include nighttime video counts during the hours of 2000 and 0400 PST April 1 through November hour counts November 16 through December counts include 24 hour video counts January 1 through March 15 and November 16 through Dec 31. From March 16 through November 15, video counts took place between 2000 and 0400 hours PST counts include 16 hour video counts between PST January 1 through March 31 and November 1 through December
41 TABLE 20 MONTHLY COUNT OF SOCKEYE SALMON BONNEVILLE DAM YEAR JAN FEB MAR APR MAY JUN JUL AUG SEP OCT NOV DEC TOTAL ,025 17,811 53,864 2, , ,386 43, , ,639 85,885 3, , ,052 23,536 39,193 1, , ,624 41,301 1, , ,525 33,613 1, , ,099 11, , ,507 6, , ,815 64,715 1, , , ,175 3, , , ,652 1, , ,013 41, , ,784 1, , ,045 87,104 1, , ,939 47, , , ,933 1, , ,359 76,505 1, , , , , , ,185 1, , ,616 43, , ,736 82, , ,155 75, , ,758 17, , ,960 9, , ,713 18, , ,010 34, , ,079 66, , ,860 31, , ,509 97, , , , , ,226 33, , ,238 34, , ,977 46,062 1, , ,789 72, , ,505 37,939 1, , ,314 29, , ,073 35, , ,961 40, , ,532 20, , ,551 25, , ,442 5, , ,474 26, , ,949 35, ,882 31
42 TABLE 20 (Continued) MONTHLY COUNT OF SOCKEYE SALMON BONNEVILLE DAM YEAR JAN FEB MAR APR MAY JUN JUL AUG SEP OCT NOV DEC TOTAL ,931 19, , ,731 29, , ,134 48, , ,892 45, , ,054 53, , ,303 30, , ,674 40, , ,409 35, , ,638 17, , ,141 23, , ,318 53, , ,292 30, , ,667 30, , ,835 3, , ,924 3, , ,005 8, , ,559 24, , ,796 5, , ,613 9, , ,479 13, , ,570 20, , ,760 18, , ,432 12, , ,702 22, , ,093 25, , ,398 9, , ,742 5, , ,756 24, , ,543 36, , ,778 88, , ,794 97, , , , ,673 TOTAL ,683 3,563,333 3,507,907 45,109 2, ,128, Year Average ,877 45, , counts include nighttime video counts during the hours of PST June 1 through August counts include nighttime video counts during the hours of 2000 and 0400 PST April 1 through November hour counts November 16 through December counts include 24 hour video counts January 1 through March 15 and November 16 through Dec 31. From March 16 through November 15, video counts took place between 2000 and 0400 hours PST counts include video counts which took place between PST January 1 through March 31 and November 1 through December
43 TABLE 21 MONTHLY COUNT OF COHO SALMON BONNEVILLE DAM YEAR JAN FEB MAR APR MAY JUN JUL AUG SEP OCT NOV DEC TOTAL* JACKS ,070 10, , ,811 12, , ,451 10, , ,317 16, , ,193 11, , , , ,052 3, , , , , , , , , ,570 8, , , , ,581 5, , ,094 5, , , , , , ,158 4, , ,564 3, , , , , , , , , , ,116 13, , ,071 8,664 2, , ,776 46,535 3, , ,911 61,335 8, , ,921 59,457 6, ,891 34, ,814 87,254 4, ,488 47, ,450 50,900 1, ,488 20, ,671 41,176 2, ,378 25, ,604 70,631 2, ,116 25, ,292 58,235 9, ,989 22, ,481 52,456 3, ,932 31, ,656 33,736 6, ,609 28, ,805 40,761 8,631 2,219 60,955 29, ,373 39,167 11,892 1,819 58,307 25, ,970 40,505 5,417 1,115 53,150 16, ,134 15,163 2, ,408 10, ,643 38,308 10,531 1,105 52,590 22, ,324 28,732 7,583 1,621 45,328 15, ,601 3,327 4,333 22,052 9,078 33
44 TABLE 21 (Continued) MONTHLY COUNT OF COHO SALMON BONNEVILLE DAM YEAR JAN FEB MAR APR MAY JUN JUL AUG SEP OCT NOV DEC TOTAL* JACKS ,162 23,962 3, ,510 8, ,687 55,743 13,182 1,141 73,832 18, ,237 5,020 2,553 15,173 6, ,394 20,174 6,229 1,649 29,487 12, ,977 46,749 5, ,857 18, , ,714 14,436 3, ,853 22, ,364 21,002 3, ,635 9, ,377 26,303 8,614 1,248 39,620 12, ,353 24,089 9,543 3,236 39,281 11, ,202 5, ,845 13, ,331 13,713 3,067 64,057 5, ,304 5,953 1,628 18,126 3, ,191 2, ,732 1, ,608 12,521 8, ,794 2, ,049 3, ,572 1, ,413 7, ,077 3, ,441 19,412 6, ,919 3, ,245 13, ,488 3, ,901 9, ,805 4, ,348 55,550 29, ,660 11, , ,352 34,401 3, ,934 6, ,742 54,917 38,184 2, ,835 6, ,389 86,621 35, ,874 8, ,171 78,512 29, ,851 4, ,487 64,253 20, ,791 5, ,771 58,048 35,014 4, ,054 7, ,888 55,968 32,607 3, ,725 12, ,335 84,639 51,771 1, ,059 68, , ,294 89,979 2, ,669 9, ,365 53,947 62,961 3, ,644 6, , ,156 28, ,883 4, ,162 37,556 15, ,023 5,039 TOTAL , ,830 2,520, ,191 63, ,683, , Year Average 4 11,988 73,199 40,135 1, ,157 13,370 *Jacks included Notes: 1995 counts include nighttime video counts during the hours of 2000 and 0400 PST April 1 through November hour counts November 16 through December counts include 24 hour video counts January 1 through March 15 and November 16 through Dec 31. From March 16 through November 15, video counts took place between 2000 and 0400 hours PST counts include 16 hour video counts between PST January 1 through March 31 and November 1 through December
45 TABLE 22 MONTHLY COUNT OF STEELHEAD BONNEVILLE DAM A-Run B-Run Jan 1- Aug 26- YEAR JAN FEB MAR APR MAY JUN JUL AUG SEP OCT NOV DEC TOTAL Aug 25 Dec ,622 2,382 19,455 29,231 46,618 2, ,003 49,306 57, ,110 1,587 1,490 36,681 38,062 33,891 1, ,032 80,096 41, ,688 4, ,489 61,188 46,071 64,377 1, , ,724 78, ,641 6,392 1, ,940 29,600 50,542 3,980 1, ,089 58,109 59, ,642 4,159 1,588 19,905 41,973 77,076 2, ,800 65,219 86, ,374 4,698 1,564 7,755 29,894 41,051 2, ,133 41,219 50, ,019 6,142 2,224 1,169 21,868 24,508 35,907 6,129 1, ,518 51,585 48, ,003 1,078 3,008 4,685 1,557 1,109 24,537 40,593 40,194 1, ,133 72,685 47, ,040 9,839 5,482 3,265 20,600 58,466 38,399 2, ,807 93,422 49, ,968 6,889 2,025 1,595 28,134 40,819 50,025 2, ,444 75,035 60, ,631 4,473 1,170 1,895 33,191 53,621 40,609 1, ,062 87,453 51, ,689 3,293 1,712 1,264 34,314 54,281 20,786 1, ,285 90,762 28, ,156 4,537 1, ,142 53,904 24,226 1, ,087 80,191 33, ,338 1,568 5,187 74,980 39,712 15, , ,100 19, ,248 1,751 8, ,110 79,735 48,293 2, , ,012 70, ,310 5,308 1,456 5, ,712 64,006 36,107 2, , ,135 50, ,511 1,571 6,115 59,443 65,234 34,941 2, , ,085 50, ,006 2,100 1,149 2,418 79,124 84,746 24,239 3, , ,614 36, ,409 2,718 1,582 3,122 48,306 47,148 23,343 2, ,116 99,692 31, , ,434 66,738 34,915 24,029 1, , ,179 34, ,457 5,645 53,734 22,827 44,478 1, ,437 79,533 51, ,236 2,562 60,549 38,417 23,579 1, ,026 98,198 30, ,090 4,314 44,026 33,571 28,058 1, ,676 77,141 36, , ,246 44,379 41,237 47,409 1, ,719 79,269 60, ,957 1,491 3,737 49,789 40,177 64,084 1, ,025 86,990 77, ,035 1,385 4,192 51,951 31,441 35,446 2, ,418 83,858 45, , ,940 50,640 26,892 32,406 1, ,252 76,135 41, ,516 1,419 4,265 89,405 29,506 37,529 1, , ,560 45, ,682 2,389 13,051 57,975 25,779 37,733 2, ,661 97,545 46, , ,062 40,881 36,787 35,472 2, ,872 78,794 43, ,315 3,664 29,773 41,006 27,865 1, ,974 68,423 38, ,164 2,897 6,889 63,222 36,077 26,565 1, , ,051 36, ,267 1,331 4,208 30,866 46,307 27,073 1, ,510 78,106 35, ,377 1,810 4,469 84,877 58,249 38,619 3, , ,054 52, ,562 2,137 3,444 59,933 48,223 65,523 3, , ,227 78, ,534 1,367 5,360 53,820 46,399 43,275 3, , ,011 57, ,292 4,127 5,547 6,349 57,212 44,266 14,654 3, ,054 84,402 52, ,080 4,284 4,324 6,058 30,823 28,623 9, ,540 71,586 13, ,285 3,459 3,677 9,130 38,907 44,204 21,084 1, ,177 92,370 31, ,159 4,121 4,115 11,395 67,554 35,161 66,084 3, , ,682 79, ,750 3,327 4,587 10,883 25,284 25,637 30,461 2, ,431 64,188 40, ,333 1,905 1,785 7,585 33,379 39,399 23,592 4, ,979 79,472 34, ,139 3,378 1,409 7,790 28,448 51,073 32,277 3, ,254 85,010 44,244 35
46 TABLE 22 (Continued) MONTHLY COUNT OF STEELHEAD BONNEVILLE DAM Jan 1- Aug 26- YEAR JAN FEB MAR APR MAY JUN JUL AUG SEP OCT NOV DEC TOTAL Aug 25 Dec ,031 3,812 3,887 12,628 56,787 52,435 25,737 2, , ,785 37, ,239 4,188 5,335 8,636 39,159 51,329 44,456 3, , ,159 54, ,253 1,638 6,017 69,036 86,066 48,920 4, , ,853 69, ,106 4,216 14,454 92,546 93, ,877 4, , , , ,956 3,997 13, , ,455 63,575 4, , ,723 92, ,712 3,674 4,500 16, , ,089 76,532 9, , , , ,189 2,112 3,233 12, , ,481 58,815 4, , ,013 79, ,158 3,728 5,016 13,615 72, ,791 63,864 4, , ,030 89, ,213 3,343 10,176 62, ,686 84,665 5, , , , ,563 4,501 11,643 37,140 52,327 65,813 7, ,027 89,144 93, ,082 2,196 6,601 52, ,027 93,152 6, , , , ,964 3,239 9,708 55, , ,792 4, , , , ,744 2,691 9,923 34,148 64,062 69,129 5, ,386 99,941 88, ,976 3,132 7,511 27,202 59,157 54,856 8, ,124 83,968 79, ,257 6,419 29, ,812 48,781 6,691 1,104 1, , ,537 82, ,862 1,776 2,424 6,912 40, ,200 48,397 6, , ,999 70, ,966 1,950 2,485 7,696 57, ,882 53,571 18,428 2, , ,381 89, ,655 7,236 36,437 60,403 76,293 12, ,501 89, , ,308 5,157 48, ,610 46,200 6, , ,245 70, ,495 1,235 2,006 13,864 80, ,918 68,407 7, , ,821 93, ,196 2,043 3,331 24, , , ,434 21,542 4,343 2, , , , , ,770 2,918 2,752 19, , , ,807 24,004 4, , , , ,728 2,264 1,474 1,714 10,966 95, ,612 95,759 12,467 3, , , , ,799 1,815 2,947 16,183 66, ,886 94,482 15, , , , ,064 1,517 9,286 84, ,487 83,450 21,694 2, , , , , ,174 1,537 7,172 46, , ,659 13,400 5,750 1, , , , ,514 1,020 1,666 6,789 58, ,281 54,543 13,096 1, , ,586 92, ,427 1,896 12, , , ,693 6,053 1, , , , ,547 2,395 9, , ,478 97,236 17,535 1, , , , ,529 2,567 3,388 23, , ,354 75,509 8,898 1, , , , ,267 1,385 1,558 6,807 96, ,287 78,963 7,651 1, , , , ,940 1,312 1,703 7,943 72,994 86,419 49,966 10,478 1, , ,509 74,794 TOTAL 10,357 10,036 79, , , ,761 4,531,430 5,772,199 4,026, ,988 63,466 16,682 15,850,072 10,303,295 5,549, Year Average 1,382 1,479 2,032 11,091 92, ,577 84,226 12,630 2, , , , counts include nighttime video counts during the hours of PST June 1 through August counts include nighttime video counts during the hours of 2000 and 0400 PST April 1 through November hour counts November 16 through December counts includes 24 hour video counts January 1 through March 15 and November 16 through Dec 31. From March 16 through November 15, video counts took place between 2000 and 0400 hours PST counts include 16 hour video counts between PST January 1 through March 31 and November 1 through December
47 TABLE 23 MONTHLY COUNT OF SHAD at BONNEVILLE DAM YEAR JAN FEB MAR APR MAY JUN JUL AUG SEP OCT NOV DEC TOTAL ,184 1, , ,539 3, , ,931 9, , ,417 16, , ,341 1, , , , , , ,801 90, , ,895 16, , ,645 20, , ,458 1, , ,647 19, , , , ,269 6, , , , ,856 1, , ,848 1, , ,411 1, , ,838 1, , ,695 11, , ,885 6, , , , ,259 57, , , ,471 1, , , ,554 4, , , ,466 4, , , ,321 13, , , ,432 12, , , ,643 7, , , ,681 2, , , ,878 1, , ,018 81,159 2, , ,519 99, , , , , , ,608 5, , , ,830 24, , ,122 91,302 1, , , ,133 1, , , ,994 2, , , ,540 11, , ,110 57, , ,253 43, ,039, , , , ,390 37
48 TABLE 23 (Continued) MONTHLY COUNT OF SHAD at BONNEVILLE DAM YEAR JAN FEB MAR APR MAY JUN JUL AUG SEP OCT NOV DEC TOTAL , , ,730 1, , , , , , ,105 1,224, ,975 1, ,422, , ,526 4, ,275, , ,288 55,233 1, , , ,443 29,622 1, , , ,850 10, , , ,635 20, ,164, ,327 1,651,338 24,697 2,041 1,877, ,617 2,296, ,799 2,347 2,947, ,677 1,566, ,835 1,971 1,914, ,939 1,767,696 93,446 4,102 2,551, ,459 1,883, ,900 3,463 2,166, ,547 1,223, ,894 1,640 1,557, ,973 1,289, ,091 1,724 1,716, ,653 1,676, ,795 1,514 1,924, ,507 1,760, , ,171, ,810 1,660,405 44, ,890, ,782 1,374, ,625 1,043 1,638, , ,587 52, ,244, ,104 1,550,639 41,596 1,611 2,297, ,611 2,670, , ,164, ,265 4,025, ,226 4,195 4,558, ,249 4,544, ,236 6,792 5,355, ,233 3,768, ,603 2,893 4,242, ,664 3,555, ,303 6,400 3,965, ,605 1,763, ,508 3,438 2,575, ,013 1,856, ,538 3,763 2,144, ,849 1,028,718 30, ,373, , ,332 53,049 1,052 1,042, , , ,334 2, , ,446 2,331,533 79,282 3,133 2,432,394 TOTAL ,558,352 59,014,903 8,318, ,756 4, ,047, Year - Average 271,822 2,458, ,065 3,501 2,863,832 38
49 TABLE 24a MONTHLY COUNT OF LAMPREY at BONNEVILLE DAM , The counts in the following table represent an approximation of trends, only. Lamprey are difficult to count. They move back and forth in the count window, spend long periods of time resting and are more likely to pass at night than salmonids. In addition, it is known that lamprey do not always use the fish ladder and may pass over a dam through several routes including the navigation lock and the auxiliary water supply. Year JAN FEB MAR APR MAY JUN JUL AUG SEP OCT NOV DEC TOTAL ,027 95, ,726 14,403 3, , ,551 40,642 67,760 20,554 2, , ,428 7,449 6,960 34,952 12,801 1, , ,302 3,457 28,641 16,270 2, , ,684 3,539 14,332 26,508 5, , ,189 1,411 19,288 11,853 1, , ,676 4,365 16,395 11,533 2, , ,834 42,772 15,820 1, , ,183 7,563 54,032 17,680 3,566 2, , ,744 79,507 44,511 4, , ,105 5,678 41,438 8,264 1, , ,073 6,702 22,128 2, , ,001 8,554 25, , ,674 13,854 7,462 1, , ,917 26,053 1, , ,001 10,303 26,535 2, , ,368 21,765 3, , ,987 10,181 1, , ,698 28,506 5, , ,092 79,548 7,448 1, ,115 98, , ,104 79,976 4,006 1, , ,521 12, ,962 30,751 7, , , , ,438 20, , ,573 49,868 30,253 7, , ,827 5,803 28,348 24,639 7, , ,575 17,796 39,223 41,214 3, , ,674 8,886 71,027 16,949 4, , ,562 11,772 25,813 20,543 2, , ,416 6,348 38,591 14,792 1, , ,698 18,389 57,011 17, , , ,096 87,769 32,908 4, ,509 *** Counting lamprey was stopped after It was resumed again in *** ,691 3 ##### 1,939 9,783 8, , ,213 12,851 14,548 5,304 2, , ,780 8,801 12,047 7,584 3, , ,204 7,953 4,184 3,408 1, , ,075 11,143 9,895 4, , ,280 34,070 39,405 17,380 7, , ,874 50,875 45,863 13,230 3, , ,670 27,515 23,607 6,644 2, , ,706 12,271 2, , ,874 18,603 6,868 4, , ,397 12,948 2, , ,942 6,276 3, , ,740 3,819 1, , ,285 2,793 1, , ,210 9,408 5,987 1, , ,141 8,073 10,780 6,555 2, ,224 TOTAL 3 4, , ,036 1,797, , ,661 12,268 1,245 3,800, Year Average ,762 14,637 5,035 1,658 34,068 1 No data are available for Because of changes in the Washington shore counting station, lamprey counts from cannot be compared with counts from 1950 on. 3 Because of the heavy shad run, fish counters were not asked to count lamprey from June 1 through July
50 TABLE 24b NIGHT COUNT OF LAMPREY - BONNEVILLE DAM Day JUN JUL AUG SEP Day JUN JUL AUG SEP Day JUN JUL AUG SEP Day JUN JUL AUG SEP TOTALS 995 4, TOTALS 826 2, TOTALS 1,517 9,275 5,889 2,176 TOTALS 4,984 10,277 5, Note: video counting for night lamprey passage at Bonneville June 15 - September 30 Not included with the Daytime total lamprey counts. Video is eight hours from 2000 to 0400 Pacific standard time 40

51
52 THE DALLES DAM FISH COUNTING SCHEDULE Apr 1 Oct 31 Visual counting daily hours Pacific Standard Time. FISHWAY OPERATING SCHEDULE The following information includes fishway operation for calendar year Total length of time for annual fishway outages can be determined by referring to previous years annual reports. East Adult Fishway Jan 1 Jan 31 Feb 1 Dec 2 Aug 1 Dec 2 Dec 31 Dewatered for winter maintenance In full operation with attraction water Attraction water off half day for required ROV grating inspection Dewatered for winter maintenance North Adult Fishway Jan 1- Feb 1 In full operation with attraction water Feb 2 Feb 23 Dewatered for winter maintenance Feb 24 Dec 31 In full operation with attraction water Aug 1 Attraction water off half day for required ROV grating inspection Ice/Trash Sluiceway (Juvenile) Jan 1- Mar 8 OOS, end gate closed Mar 1 Dec 15 In service with skimmer gates Dec 16 Dec 31 OOS, end gate closed Spillway Jan 1 April 10 April 10 Aug 31 Sept 1 Dec 31 Closed, all gates on seal Spill 40%, 24/7 for juvenile passage Closed, all gates on seal FISH RELATED DEWATERINGS FISHWAY DEWATERING PROCEDURES Bulkheads are installed and drain valves open to dewater various areas of fishways. Fisheries personnel enter these areas to salvage fish that become entrapped. Minimal handling of fish is applied. Fish that are reluctant to vacate an area are captured and transported to the forebay or tailwater, depending on circumstances such as fish species, age class and stress levels. A follow up inspection is made to account for possible missed fish. Efforts are made to provide continual 42
53 water supply during the entire operation to reduce fish stranding. Fishway areas not included on this list are inspected by ROV. Fish Ladder Dewatering Results Key; adult=a, juvenile=j, carp=cp, catfish=ca, sculpin=sp, shad=sh, small mouth bass=smb, crappie=cr, pikeminnow=pm, whitefish=wf ate Event Steelhead Lamprey Shad Sturgeon Other Comments Mort s 2/1/12 N. upper 1a, 3j ) 0 12/3/12 E. upper 1a,1j 8a 230 4a 1cp,7wf,1pm 2.) 0 12/11/12 E. lower 1j 5 0 4j 2wf None 0 12/12/12 E. Lower 4j 29a 0 1j 2wf 3.) 1lamprey 1.) Five adult lamprey and one adult steelhead was bagged and released to forebay. Three wild juvenile steelhead were bagged and released to tailwater. 2.) Tally included: 230 adult shad, 1 carp, 7 whitefish, 1 pikeminnow, 1 steelhead, 1 rainbow trout, 3 juvenile salmonids captured and returned to tailwater. Four adult sturgeon were pushed to tailwater from section below the 180 bend. Eight adult lamprey captured for Nez Perce. 3.) 29 adult lamprey captured for Nez Perce to augment Pacific Lamprey production in the Lower Snake/Clearwater Basins; all other fish released to tailwater. TURBINE DEWATERING PROCEDURES Turbine dewatering for routine maintenance usually involves low numbers of fish, due in part to operational guidelines. The most important guideline includes immediate tail log installation after unit shut down. If a turbine unit fails, dewatering guidelines cannot always be followed, which usually results in higher numbers of fish entrapment. Removal of fish from these areas has a greater fish stress risk due to handling. Procedures are continually analyzed to determine the best method for preventing fish stress or loss. Fish are removed from scroll case (sc) and draft tubes (dt) by fish bags. If numbers of fish are higher than two bags, transport tanks are placed in the draft tube gallery for transport by crane. Fish are released to tailwater either with bag and rope or tank and crane. Turbine Dewatering Results Key; adult=a, juvenile=j, scroll case=sc, draft tube=dt, catfish=ca, sculpin=sp, crappie=cr, small mouth bass=smb Date Event Chinook Steelhead Sturgeon Other Comments Morts 1/9/12 MU13 sc ) 0 1/10/12 MU13 dt None 0 2/22/12 MU11 sc None 0 3/1/12 MU12 sc None 0 3/1/12 MU12 dt None 0 3/20/12 MU19 sc None 0 3/20/12 MU19 dt None 0 5/22/12 MU9 dt 5j 1j ) 5 7/30/12 MU11 sc None 2j 7/30/12 MU11 dt ca None 1ca 9/18/12 MU15 sc None 0 10/2/12 MU2 sc None 0 10/3/12 MU2 dt 0 0 3j 8 3.) 0 12/5/12 FU1sc None 0 43
54 1.) Sturgeon ~2' in length released to tailwater. 2.) Two sturgeon and one CH1 successfully released. Three CH1 fresh mort, one CH1 old dead. 1 clipped SH fresh mort 3.) Eight (8) channel catfish and three (3) juvenile channel cat fish salvaged and released to tail water. When a unit is taken out of service for maintenance, the cooling water strainers are sometimes disassembled. Due to the concern of juvenile lamprey entrainment and the threat of zebra/quagga mussels, this area is inspected. Fisheries staff was not always notified when these are disassembled. Therefore it has been put into the preventative maintenance program as a reminder to maintenance staff. MAIN TURBINE UNITS THIRD FLOOR COOLING WATER STRAINERS Date MU Lamprey Quagga Mussels Zebra Mussels Comments 9/3/12 MU None Dewatering Fish Salvage Discussion All efforts are made to prevent fish mortalities. When mortalities occur, procedures are analyzed to determine how to correct for future dewaterings. One lamprey mortality from the east ladder lower dewatering occurred from being stepped on. Two juvenile salmonid mortalities in unit 11 were from unknown causes. Sufficient water was available. TRIBAL SHAD FISHERY Yakima tribal fishermen did not conduct a shad fishery for Alternative fishing methods were explored in other locations. There has been no indication of revisiting the east fishway exit as a fishing site again, mainly due to the documented fallback behavior of spring Chinook during the fishing activity. RESEARCH The following are a list of fish related research and contract personnel that were on site during the 2012 passage season. Battelle (PNNL) - Conducted juvenile passage acoustic telemetry (JSAT) monitoring of powerhouse, spillway and sluiceway as part of the overall performance testing program for the spring but were unable to complete the summer testing due to flood conditions in Summer performance testing resumed for University of Idaho Study involved the monitoring of movements of adult Pacific lamprey outfitted with half-duplex PIT tags at The Dalles Dam. Oregon Dept of Fish and Wildlife Captured via electro-shocking and fishing directly into BRZ areas using hook and line, tagged, and collected biological data from northern pikeminnow, 44
55 smallmouth bass, and walleye as part of the ODFW Northern Pikeminnow Management Program. Oregon Department of Fish and Wildlife Continued to provide once monthly fishway inspections of adult and juvenile systems. Washington Department of Fish and Wildlife Performed dam angling from various locations on the dam to remove northern pikeminnow. Washington Department of Fish and Wildlife Continued to perform fish counting at the north and east fishways via count stations. Pacific States Marine Fish Commission Sampled North Wasco PUD turbine juvenile bypass system per FERC requirement. Pacific States Marine Fisheries Commission - Participated in the Northern Pikeminnow Management Program (NPMP) dam angling fishery. Angling activities in support of study included hook and line capture, holding, PIT-tagging, examination, and gastric lavage of encountered smallmouth bass. Fisheries Field Unit Provided over site and standardization to the piscivorous bird monitoring program at the project. Fisheries Field Unit Evaluation of interaction between overwintering American bald eagles and the avian array at The Dalles Dam. U.S. Dept of Agriculture Provided avian hazing April 15 to July via pyrotechnics and avian lines prior to juvenile passage season at Nav-lock peninsula. U.S. Fish and Wildlife Service Continued evaluation of adult lamprey passage and behavior using underwater video cameras and Dual Frequency Identification Sonar (DIDSON) camera to document adult lamprey as they negotiate the fish count station in the north and east fishways and the upper section of the north fishway at The Dalles Dam from 1 June through 30 October Umatilla Tribe Trapped lamprey between count stations picketed leads and areas of the fishway for restoring lamprey to the Umatilla Basin. Confederated Tribes of the Umatilla Indian Reservation Captured adult Pacific lamprey as part of the on-going project to restore lamprey to the tribes ceded waters. CTUIR worked with the Nez Perce and Warm Springs tribes to help with lamprey collection efforts. 45
56 TABLE 25 MONTHLY TOTALS OF SALMONIDS, SHAD, LAMPREY, STURGEON, AND BULL TROUT COUNTED OVER THE DALLES DAM 2012 SPECIES JAN FEB MAR APR MAY JUN JUL AUG SEP OCT NOV DEC TOTAL CHINOOK* 18 8, ,476 52,142 31,102 44, ,070 33,903 2, ,930 STEELHEAD ,809 49,514 54,567 71,995 18,065 2, ,640 SOCKEYE , , ,099 COHO* 8 2,262 28,707 2, ,019 CHUM 7 7 PINK TOTAL 968 9, , , , , ,775 54,889 1,185,697 LAMPREY 140 2,362 2, ,241 STURGEON BULL TROUT 0 *Jacks included Shad no longer counted at The Dalles Dam. 46
57 TABLE 26 DISCHARGE AND WATER QUALITY DATA THE DALLES PROJECT 2012 JANUARY FEBRUARY DISCH SPILL TURBIDITY DISCH SPILL TURBIDITY DATE KCFS KCFS SECCHI DEG F DATE KCFS KCFS SECCHI *DEG F Jan Feb Jan Feb Jan Feb Jan Feb Jan Feb Jan Feb Jan Feb Jan Feb Jan Feb Jan Feb Jan Feb Jan Feb Jan Feb Jan Feb Jan Feb Jan Feb Jan Feb Jan Feb Jan Feb Jan Feb Jan Feb Jan Feb Jan Feb Jan Feb Jan Feb Jan Feb Jan Feb Jan Feb Jan Feb Jan Jan AVG AVG *Data unavailable 47
58 TABLE 27 MONTHLY FISH PASSAGE SUMMARY REPORT U.S. ARMY ENGINEER DISTRICT, PORTLAND THE DALLES PROJECT - FISH COUNTS MARCH 2012 CHINOOK ADULT CHINOOK COHO COHO TOTAL unclipped DISCH SPILL TURBIDITY DATE SPRING SUMMER FALL JACK ADULT JACK SOCKEYE STEELHEAD STEELHEAD PINK CHUM LAMPREY STURGEON KCFS KCFS SECCHI DEG F Mar Mar Mar Mar Mar Mar Mar Mar Mar Mar Mar Mar Mar Mar Mar Mar Mar Mar Mar Mar Mar Mar Mar Mar Mar Mar Mar Mar Mar Mar Mar TOTAL AVG Note: From February 20 to March 31, counts were from video tape. The counts are 16-hour counts and occurred between the hours of PST. Video disruption occurred resulting in a loss of 7 hours at the north ladder. Official Spring Chinook run started April 1. February and March Chinook counts were not added to spring totals. 48
59 TABLE 28 MONTHLY FISH PASSAGE SUMMARY REPORT U.S. ARMY ENGINEER DISTRICT, PORTLAND THE DALLES PROJECT - FISH COUNTS APRIL 2012 CHINOOK ADULT CHINOOK COHO COHO TOTAL unclipped DISCH SPILL TURBIDITY DATE SPRING SUMMER FALL JACK ADULT JACK SOCKEYE STEELHEAD STEELHEAD PINK CHUM LAMPREY STURGEON KCFS KCFS SECCHI DEG F Apr Apr Apr Apr Apr Apr Apr Apr Apr Apr Apr Apr Apr Apr Apr Apr Apr Apr Apr Apr Apr Apr Apr Apr Apr 25 1, Apr Apr 27 1, Apr Apr Apr 30 1, TOTAL 8, AVG Note: Visual counts occurred April 1 through October 31. The counts are 16-hour counts and occurred between the hours of PST. Shad counting discontinued. 49
60 TABLE 29 MONTHLY FISH PASSAGE SUMMARY REPORT U.S. ARMY ENGINEER DISTRICT, PORTLAND THE DALLES PROJECT - FISH COUNTS MAY 2012 CHINOOK ADULT CHINOOK COHO COHO TOTAL unclipped DISCH SPILL TURBIDITY DATE SPRING SUMMER FALL JACK ADULT JACK SOCKEYE STEELHEAD STEELHEAD PINK CHUM LAMPREY STURGEON KCFS KCFS SECCHI DEG F May May May May May 5 1, May 6 1, May 7 1, May 8 6, May 9 4, May 10 10, May 11 12, May 12 6, May 13 5, May 14 6, May 15 7, May 16 5, May 17 4, May 18 4, May 19 2, May 20 3, May 21 2, May 22 1, May 23 1, May 24 1, May 25 1, May May 27 1, May May 29 1, May 30 1, May 31 1, TOTAL 103,906 6, AVG. 3, RUN YEAR CHINOOK CHINOOK TOTAL unclipped TOTALS TO DATE ADULT JACK SOCKEYE STEELHEAD STEELHEAD STURGEON SPRING 112,305 6,
61 TABLE 30 MONTHLY FISH PASSAGE SUMMARY REPORT U.S. ARMY ENGINEER DISTRICT, PORTLAND THE DALLES PROJECT - FISH COUNTS JUNE 2012 CHINOOK ADULT CHINOOK COHO COHO TOTAL unclipped DISCH SPILL TURBIDITY DATE SPRING SUMMER FALL JACK ADULT JACK SOCKEYE STEELHEAD STEELHEAD PINK CHUM LAMPREY STURGEON KCFS KCFS SECCHI DEG F Jun 1 1, Jun 2 1, Jun 3 1, Jun 4 1, Jun 5 2, Jun 6 1, Jun 7 1, Jun 8 1, Jun Jun 10 1, Jun 11 1, , Jun 12 1, , Jun 13 1, , Jun 14 1, , Jun 15 1, , Jun 16 1, , Jun 17 2, , Jun 18 2, , Jun 19 1, , Jun 20 1, , Jun 21 1, , Jun 22 1, , Jun 23 1, , Jun 24 1, , Jun 25 1, , Jun 26 1, , Jun , Jun 28 1, , Jun 29 1, , Jun 30 1, , TOTAL 4,766 42,218 5, ,789 2, AVG. 1, , RUN YEAR CHINOOK CHINOOK TOTAL unclipped TOTALS TO DATE ADULT JACK SOCKEYE STEELHEAD STEELHEAD LAMPREY STURGEON SPRING 117,071 7, ,804 3,698 1, SUMMER 42,218 4,818 TOTAL 159,289 11,991 51
62 TABLE 31 MONTHLY FISH PASSAGE SUMMARY REPORT U.S. ARMY ENGINEER DISTRICT, PORTLAND THE DALLES PROJECT - FISH COUNTS JULY 2012 CHINOOK ADULT CHINOOK COHO COHO TOTAL unclipped DISCH SPILL TURBIDITY DATE SPRING SUMMER FALL JACK ADULT JACK SOCKEYE STEELHEAD STEELHEAD PINK CHUM LAMPREY STURGEON KCFS KCFS SECCHI DEG F Jul 1 1, , Jul 2 1, , Jul 3 1, , Jul 4 1, , Jul , Jul , Jul 7 1, , Jul 8 1, , Jul 9 1, , Jul , Jul , Jul 12 1, , Jul , Jul 14 1, ,173 1, Jul ,856 1, Jul ,192 1, Jul , Jul , Jul ,102 1, Jul ,310 1, Jul ,625 1, Jul ,379 1, Jul ,451 1, Jul ,621 1, Jul ,572 1, Jul ,642 1, Jul ,908 1, Jul ,930 1, Jul ,848 1, Jul ,087 1, Jul ,174 1, TOTAL 25,878 5, ,045 49,514 23,516 2, AVG ,485 1, RUN YEAR CHINOOK CHINOOK COHO TOTAL unclipped TOTALS TO DATE ADULT JACK ADULT SOCKEYE STEELHEAD STEELHEAD LAMPREY STURGEON SPRING 117,071 7, ,849 53,212 24,718 2, SUMMER 68,096 10,042 TOTAL 185,167 17,215 52
63 TABLE 32 MONTHLY FISH PASSAGE SUMMARY REPORT U.S. ARMY ENGINEER DISTRICT, PORTLAND THE DALLES PROJECT - FISH COUNTS AUGUST 2012 CHINOOK ADULT CHINOOK COHO COHO TOTAL unclipped DISCH SPILL TURBIDITY DATE SPRING SUMMER FALL JACK ADULT JACK SOCKEYE STEELHEAD STEELHEAD PINK CHUM LAMPREY STURGEON KCFS KCFS SECCHI DEG F Aug , Aug ,001 1, Aug ,347 1, Aug ,056 1, Aug ,544 1, Aug ,075 1, Aug , Aug ,524 1, Aug ,235 1, Aug , Aug , Aug , Aug , Aug , Aug , Aug , Aug , Aug Aug Aug Aug Aug Aug Aug 24 1, Aug 25 2, , Aug 26 2, , Aug 27 2, , Aug 28 2, , Aug 29 3, , Aug 30 3, , Aug 31 5, , TOTAL 1,126 34,199 9,124 1, ,567 20, , AVG , RUN YEAR CHINOOK CHINOOK COHO COHO TOTAL unclipped TOTALS TO DATE ADULT JACK ADULTS JACKS SOCKEYE STEELHEAD STEELHEAD PINK LAMPREY STURGEON SPRING 117,071 7,173 1, , ,779 45, , SUMMER 69,222 10,392 FALL 34,199 8,774 TOTAL 220,492 26,339 53
64 TABLE 33 MONTHLY FISH PASSAGE SUMMARY REPORT U.S. ARMY ENGINEER DISTRICT, PORTLAND THE DALLES PROJECT - FISH COUNTS SEPTEMBER 2012 CHINOOK ADULT CHINOOK COHO COHO TOTAL unclipped DISCH SPILL TURBIDITY DATE SPRING SUMMER FALL JACK ADULT JACK SOCKEYE STEELHEAD STEELHEAD PINK CHUM LAMPREY STURGEON KCFS KCFS SECCHI DEG F Sep 1 5,157 1, , Sep 2 8,112 1,676 1, , Sep 3 6,398 2,221 1, , Sep 4 6,687 2,332 1, , Sep 5 5,256 2,153 1, , Sep 6 5,873 2,228 1, , Sep 7 5,283 2,078 1, , Sep 8 6,581 2, , Sep 9 8,611 2,677 1, , Sep 10 8,515 3,279 1, , Sep 11 8,661 3, , Sep 12 7,170 2, , Sep 13 4,698 2, , Sep 14 6,115 2, , Sep 15 11,345 3,364 1, , Sep 16 11,141 5,152 1, , Sep 17 9,932 5,559 2, , Sep 18 6,617 4,909 1, , Sep 19 4,975 3,405 1, , Sep 20 4,118 3, , Sep 21 4,330 3, , Sep 22 3,651 3, , Sep 23 4,546 3, ,564 1, Sep 24 3,153 2, , Sep 25 3,490 2, , Sep 26 2,225 1, , Sep 27 2,189 1, Sep 28 3,014 2, Sep 29 2,903 2, , Sep 30 2,212 1, , TOTAL 172,958 84,112 26,527 2, ,995 18, AVG. 5,765 2, , RUN YEAR CHINOOK CHINOOK COHO COHO TOTAL unclipped TOTALS TO DATE ADULT JACK ADULT JACK SOCKEYE STEELHEAD STEELHEAD PINK LAMPREY STURGEON SPRING 117,071 7,173 28,356 2, , ,774 63, , SUMMER 69,222 10,392 FALL 207,157 92,886 TOTAL 393, ,451 54
65 TABLE 34 MONTHLY FISH PASSAGE SUMMARY REPORT U.S. ARMY ENGINEER DISTRICT, PORTLAND THE DALLES PROJECT - FISH COUNTS OCTOBER 2012 CHINOOK ADULT CHINOOK COHO COHO TOTAL unclipped DISCH SPILL TURBIDITY DATE SPRING SUMMER FALL JACK ADULT JACK SOCKEYE STEELHEAD STEELHEAD PINK CHUM LAMPREY STURGEON KCFS KCFS SECCHI DEG F Oct 1 1, , Oct 2 1, , Oct 3 1, Oct 4 1, Oct 5 1, , Oct 6 1, Oct Oct Oct Oct Oct Oct Oct Oct Oct Oct Oct Oct Oct Oct Oct Oct Oct Oct Oct Oct Oct Oct Oct Oct Oct TOTAL 18,755 15,148 2, ,065 6, AVG RUN YEAR CHINOOK CHINOOK COHO COHO TOTAL unclipped TOTALS TO DATE ADULT JACK ADULT JACK SOCKEYE STEELHEAD STEELHEAD PINK LAMPREY STURGEON SPRING 117,071 7,173 31,037 2, , ,839 69, , SUMMER 69,222 10,392 FALL 225, ,034 TOTAL 412, ,599 Note: Visual counts ended October
66 TABLE 35 MONTHLY FISH PASSAGE SUMMARY REPORT THE DALLES PROJECT U.S. ARMY ENGINEER DISTRICT, PORTLAND NOVEMBER 2012 FISH COUNTS RIVER CONDITIONS CHINOOK ADULT CHINOOK COHO COHO TOTAL unclipped DISCH SPILL TURBIDITY DATE SPRING SUMMER FALL JACK ADULT JACK SOCKEYE STEELHEAD STEELHEAD PINK CHUM LAMPREY STURGEON KCFS KCFS SECCHI DEG F Nov Nov Nov Nov Nov Nov Nov Nov Nov Nov Nov Nov Nov Nov Nov Nov Nov Nov Nov Nov Nov Nov Nov Nov Nov Nov Nov Nov Nov Nov TOTAL 1, ,631 1, AVG RUN YEAR CHINOOK CHINOOK COHO COHO TOTAL unclipped TOTALS TO DATE ADULT JACK ADULT JACK SOCKEYE STEELHEAD STEELHEAD PINK CHUM LAMPREY STURGEON SPRING 117,071 7,173 31,037 2, , ,839 69, , SUMMER 69,222 10,392 FALL 225, ,034 TOTAL 412, ,599 Note: Video counts occurred from November 1 through December 7. The counts are 16-hour counts and occurred between the hours of PST. Official Fall chinook run ended October 31st. November and December totals were not added to fall totals except Pink, chum, and sturgeon counts are totals for entire calendar year 56
67 TABLE 36 MONTHLY FISH PASSAGE SUMMARY REPORT THE DALLES PROJECT U.S. ARMY ENGINEER DISTRICT, PORTLAND DECEMBER 2012 FISH COUNTS RIVER CONDITIONS CHINOOK ADULT CHINOOK COHO COHO TOTAL unclipped DISCH SPILL TURBIDITY DATE SPRING SUMMER FALL JACK ADULT JACK SOCKEYE STEELHEAD STEELHEAD PINK CHUM LAMPREY STURGEON KCFS KCFS SECCHI DEG F Dec Dec Dec Dec Dec Dec Dec Dec Dec Dec Dec Dec Dec Dec Dec Dec Dec Dec Dec Dec Dec Dec Dec Dec Dec Dec Dec Dec Dec Dec Dec TOTAL AVG RUN YEAR CHINOOK CHINOOK COHO COHO TOTAL unclipped TOTALS TO DATE ADULT JACK ADULT JACK SOCKEYE STEELHEAD STEELHEAD PINK CHUM LAMPREY STURGEON SPRING 117,071 7,173 31,037 2, , ,839 69, , SUMMER 69,222 10,392 FALL 225, ,034 TOTAL 412, ,599 Note: Video counts occurred from November 1 through December 7. The counts are 16-hour counts and occurred between the hours of PST. Official Fall chinook run ended October 31st. November and December totals were not added to fall totals except Pink, chum, and sturgeon counts are totals for entire calendar year 57
68 TABLE 37 YEAR CHINOOK* STEELHEAD SOCKEYE COHO* CHUM PINK TOTALS , ,361 90,201 6, , , , ,039 2, , , ,090 86,259 2, , , ,189 59,441 3, , , ,572 16,689 2, , , ,301 27,127 3, , , ,957 56,931 3, , , ,033 79,042 5, , , ,052 44,279 17, , , , ,886 32, , , , ,589 32, , , , ,897 42, , , ,529 37,226 17, , ,457 99,187 77,678 23, , , ,348 76,103 29, , , ,303 44,671 16, , , ,082 52,303 11, , ,181 70,875 28,827 14, , ,283 57,675 43,198 13, , ,163 82,568 27,747 19, , , ,882 86,252 10, , ,228 60,485 11,845 18, , ,647 83,364 32,791 8, , ,951 93,963 42,088 6, , , ,268 35,447 6, , , ,434 33,331 7, , , ,055 84,204 3, , , , ,177 3, , , , ,254 4, , , ,953 48,477 4, , , ,768 87,599 3, , , ,499 55,802 9, , , ,639 39,672 12, , , ,271 40,230 4, , , ,853 63,405 9, , , ,179 66,384 3, , , ,829 62,252 4, , , ,254 9,356 4, , , ,844 7,166 3, , , ,456 25,055 4, , , ,756 32,430 4, , , ,682 8,826 8, , , ,874 13,715 15, , , ,241 73,383 29, , , , ,562 64,557 1,299, , ,920 40,554 12,786 1,024, , ,574 34,180 46, , , , ,466 41, , , ,213 65,273 36, , , ,223 30,026 34, , , ,960 19,124 32, , , , ,984 42, , , , ,591 77, ,274, , , ,133 31, ,308, , , ,293 76, ,158 1,107, , , ,099 34, ,185,697 Totals 16,162,215 10,145,277 4,128,559 1,023, ,557 31,461, Year Average 484, , ,317 45, ,881 *Jacks included YEARLY TOTALS OF SALMONIDS COUNTED OVER THE DALLES DAM
69 TABLE 38 MONTHLY COUNT OF CHINOOK SALMON THE DALLES DAM SPRING SUMMER FALL 1 JAN- 4 JUN- 4 AUG- YEAR JAN FEB MAR APR MAY JUN JUL AUG SEP OCT NOV DEC TOTAL* 3 JUN 3 AUG 31 DEC JACKS ,161 59,410 86,096 35,643 28,828 56,753 3, , , ,661 86,294 37, ,268 47,862 59,955 24,381 17, ,262 2, ,960 61,747 80, ,074 19, ,771 32,634 27,799 42,817 20,142 65,229 2, ,461 50,874 71,362 85,225 39, ,073 40,091 52,577 22,549 15,225 46,453 2, ,962 58,406 75,315 63,241 30, ,822 35,059 24,478 24,596 16,866 53,371 3, ,335 79,183 50,824 71,328 35, ,069 35,629 34,488 21,515 13,461 46,135 2, ,132 69,139 57,007 60,986 17, ,119 33,207 25,063 20,414 21,865 57,248 4, ,969 52,937 47,333 80,699 54, ,551 24,447 16,801 37,697 17,452 49,811 1, ,842 60,691 56,360 66,791 30, ,870 24,930 17,900 31,072 25,119 74,904 3, ,049 43,617 50, ,905 67, ,068 72,267 22,837 25,530 33,712 14,978 65,380 4, ,671 96,628 61,062 82,981 36, ,744 22,817 24,718 45,346 23, ,427 7, ,112 71,976 72, ,554 98, ,144 45,057 32,827 33,272 22,361 72,209 4, ,975 98,742 67,391 96,842 64, ,025 80,162 33,432 27,750 29, ,890 5, , ,482 61, ,798 96, ,370 29,670 22,903 23,318 34,906 93,633 3, ,457 83,549 48, ,793 85, ,227 44,181 22,011 29,655 16, ,370 6, ,528 73,655 51, ,026 75, ,955 33,508 17,354 29,756 21,828 91,666 5, , ,107 48, ,861 81, ,334 15,040 19,548 19,181 23, ,771 7, , ,088 38, ,083 72, ,415 41,902 7,141 22,709 13, ,804 14, ,181 56,397 30, ,511 79, ,526 32,869 12,155 26,447 28,973 90,193 8, ,283 52,483 39, ,738 74, ,266 35,434 17,828 20,129 17,278 90,933 14, ,163 56,570 38, ,860 74, ,726 16,672 22,084 22,059 12,266 69,927 9, ,950 90,373 44,378 90,199 55, ,425 30,472 19,477 15,978 11,251 57,786 11, ,228 84,924 34,396 79,908 32, ,993 12,569 14,310 17,687 20,458 61,757 9, ,647 27,297 32,298 91,052 42, ,434 15,441 7,948 12,832 12,881 43,675 8, ,951 28,237 21,133 64,581 20, ,227 16,335 8,491 10,779 15,802 53,840 5, ,176 41,160 19,676 74,340 33, ,569 33,296 10,058 9,554 17,466 79,487 12, ,682 44,750 19, ,590 60, ,270 22,893 8,766 8,430 12,501 73,942 16, ,190 36,856 17, ,283 41, ,326 23,784 9,992 12,332 23, ,786 19, ,920 33,848 22, ,600 70, ,035 39,173 15,785 10,332 37, ,470 27,058 1, ,982 76,514 25, , , ,892 36,928 14,175 10,452 22, ,091 45, ,013 87,004 24, , , ,812 27,586 17,923 12,145 50, ,216 27, ,190 77,453 30, ,933 65, ,680 20,756 16,644 13,494 66, ,490 15, ,080 73,663 29, ,525 69, ,474 27,477 15,539 13,899 58, ,931 10, ,168 53,014 30, ,599 28, ,062 20,749 13,390 9,099 22,152 96,538 9, ,556 57,424 22, ,517 32, ,513 17,313 10,949 7,638 8,384 84,861 9, ,023 32,359 18, ,197 36, ,141 19,414 9,595 5,797 14,589 71,281 9, ,507 58,451 14,976 95,080 27, ,391 25,824 14,165 6,481 19,297 71,395 5, ,953 69,356 20,063 95,534 12, ,573 4,938 7,376 8,360 22,910 98,997 12, ,758 11,798 15, ,963 25, ,008 4,244 6,176 7,111 23,094 82,723 15, ,793 7,553 13, ,682 32, ,631 20,896 8,018 6,718 26,505 90,762 9, ,911 27,127 14, ,296 5, ,639 42,467 14,718 8,011 23, ,652 8, ,801 69,740 21, ,704 16, ,927 10,488 10,289 6,702 20,129 78,191 13, ,132 25,743 16, ,483 20, ,396 17,579 10,972 13,864 30, ,411 13, ,491 23,743 24, ,811 28, ,618 47,131 20,878 15,442 57,600 97,042 10, , ,749 35, ,507 63, ,568 79,627 50,030 35,889 38, ,871 23, , ,865 80, ,081 72, , ,008 76,400 45,761 63, ,956 19, , , , ,297 42, ,227 84,312 54,173 70,347 43,926 42, ,091 33,070 3, , , , ,574 62, ,705 59,127 59,859 30,999 41, ,434 32,361 2, , ,229 87, ,583 48, ,797 41,560 48,505 27,685 25, ,518 23, ,905 64,219 73, ,550 24, ,006 61,711 58,394 26,404 24, ,212 26,060 2, ,371 64,012 84, ,520 27, ,338 46,147 34,405 19,510 21,415 93,517 17,883 1, ,613 68,253 52, ,298 65, ,531 86,590 58,430 21,041 46, ,583 15, , ,239 77, ,248 66, , ,674 83,688 30,189 74, ,655 19, , , , , , , ,482 72,234 29,689 45, ,464 32, , ,385 93, ,494 75, , ,084 76,725 47,267 37, ,089 41, , , , , , , ,476 52,142 31,102 44, ,070 33,903 2, , ,262 79, , ,554 Total 9,818 2,024,302 2,337,830 1,629,481 1,226,617 1,561,789 6,593, ,167 14,868 16,162,215 4,369,748 2,706,702 8,770,725 3,218, Year Average 32,913 85,102 61,473 30,781 40, ,763 27, , ,343 88, ,740 82,269 *Jacks included 59
70 TABLE 39 MONTHLY COUNT OF SOCKEYE SALMON THE DALLES DAM YEAR JAN FEB MAR APR MAY JUN JUL AUG SEP OCT NOV DEC TOTAL ,476 54,294 2, , ,854 80,324 1, , ,176 76,347 2, , ,907 22, , ,863 10, , ,333 18, , ,914 38, , ,984 68, , ,023 31,622 1, , , ,167 2, , , , , ,878 38, , ,165 21, , ,309 56,903 2, , ,887 66, , ,276 34, , ,510 32, , ,935 24, , ,679 35, , ,988 16, , ,049 26, , ,158 4, , ,750 17, , ,096 30, , ,692 17, , ,430 21, , ,684 49, , ,500 37, , ,603 41, , ,224 30, , ,798 38, , ,443 25, , ,196 17, , ,603 22, , ,106 48, , ,319 27, , ,517 25, , ,752 2, , ,195 2, , ,013 7, , ,707 20, , ,777 3, , ,210 8, , ,980 11, , ,939 16, , ,714 17, , ,233 12, , ,332 22, , ,474 26, , ,817 9, , ,475 5, , ,255 25, , ,162 41, , ,935 88, , ,335 87, , , , ,099 Total 2 1,666 2,125,671 1,976,337 23,779 1, ,128, Year Average ,181 45, ,317 60
71 TABLE 40 MONTHLY COUNT OF COHO SALMON THE DALLES DAM: YEAR JAN FEB MAR APR MAY JUN JUL AUG SEP OCT NOV DEC TOTAL* JACKS , , , , , , , , , , , , , , , , ,064 4,197 17, ,850 25,476 2,728 32, ,860 3,469 32,015 20, ,319 36,568 2, ,687 13, ,179 2,493 17,054 11, ,064 19,983 1,076 23,219 11, ,589 26,066 1,405 29,061 11, ,090 14, ,562 10, , ,152 5, ,715 3,418 14,655 9, ,356 3,155 13,976 8, ,609 4,175 19,392 13, ,131 1,798 10,021 6, ,069 5,453 18,877 13, ,109 1, ,726 4, , ,326 2, , ,941 4, ,792 1,255 7,383 3, ,343 1,051 3,459 2, , ,142 1, , ,625 1, ,772 1,067 4,842 1, , ,310 1, ,082 1,912 9,226 2, ,027 3, ,611 4, ,229 1,356 4,645 2, ,714 1,857 9,601 1, , ,825 1, ,256 1,086 4,360 3, ,922 1,332 4, ,013 1,046 3, , , ,649 1,045 4, ,520 5,443 8, ,456 3,548 15,041 1, ,248 20,526 6,762 29,536 4, ,351 36,099 27,107 64,557 2, ,286 4,225 12,786 3, ,084 29,129 15, ,101 2, ,591 10,408 1, ,645 1, ,376 13,814 1, ,129 2, ,541 18,080 12,574 2, ,339 2, ,545 14, ,961 2, ,369 26,714 14,599 42,682 4, ,214 29,912 39,362 77,492 8, ,082 20,090 10,202 31,374 75, ,172 52,196 21,383 76,753 4, ,262 28,707 2, ,019 2,861 Total 1,584 45, , ,994 6, ,023, , Year Average 2,032 27,234 15,503 45,350 10,773 *Includes Jacks 61
72 TABLE 41 MONTHLY COUNT OF STEELHEAD THE DALLES DAM YEAR JAN FEB MAR APR MAY JUN JUL AUG SEP OCT NOV DEC TOTAL , ,782 45,445 33,319 35,396 6, , ,898 4,906 20,384 11,442 75,036 6, , ,227 46,271 60,841 41,026 4, , ,591 28,218 32,667 42,447 4, , ,396 21,906 17,850 87,344 5, , ,068 36,609 31,507 87,463 5, , ,361 30,485 25,360 48,066 13, , ,773 31,742 38,197 2, , ,522 21,132 53,389 4, , ,816 52,975 26,382 53,721 6, , ,914 22,746 56,082 13, , ,974 58,866 57,666 7, , ,442 33,952 22,963 44,146 8, , ,905 32,752 44,823 4,465 99, ,712 31,812 69,602 7, , ,569 30,631 63,748 4, , ,981 29,067 25,437 38,017 4, , ,362 1,859 24,779 21,835 15,059 5,452 70, ,018 1,334 1,973 18,046 20,531 11,519 3,254 57, ,604 3,357 22,021 30,386 21,586 2,846 82, ,666 1,332 5,038 42,859 13,022 61,678 8, , ,378 3,459 13,493 11,457 26,189 3,675 60, ,942 23,054 21,974 20,961 14, , , ,134 15,114 30,755 34,447 7,838 93, ,389 1,632 3,768 34,242 36,537 26,837 8, , ,289 2,710 22,607 31,410 49,050 9, , ,492 37,029 47,521 75,210 9, , ,715 52,825 36, ,377 16, , ,405 1,511 5,679 41, , ,574 13,337 1, , , ,492 78,494 60, ,066 24, , , ,280 55,395 58,850 76,461 22, , , ,984 34,612 54,986 85,061 16, , , ,950 35,167 45, ,322 25,880 2, , ,169 1, ,078 17,942 17,772 58,805 28, , , ,755 25,686 37, ,833 27, , , ,494 18,753 37, ,216 13, , , ,847 17,962 20,194 61,600 18, , , ,263 11,434 11,703 55,247 29, , ,329 11,953 46,428 59,604 24, , ,981 20,317 61,136 65,400 12, , ,187 18,916 34,055 84,006 24, , ,433 9,911 12,180 62,331 28, , ,625 25,277 56,665 60,762 11, , ,467 37,760 48,697 96,040 15, , , ,501 95, ,711 65, , , ,027 67,132 84, ,382 56, , , ,882 36,960 35, ,525 36,458 6, , ,072 1, ,116 23,581 30, ,302 23,099 1, , ,483 33,476 33, ,710 41,174 3, , ,241 15,892 43, ,845 33,537 12, , ,948 1, ,155 25,008 66, ,058 26,079 2, , , ,847 69,771 47, ,616 22, , ,181 51, , ,187 58, , , , ,984 55, ,816 31, , , ,611 56, ,161 91,517 21, , ,809 49,514 54,567 71,995 18,065 2, ,640 Total 13,099 53,178 35, ,579 1,985,596 2,365,380 4,503, ,438 35,358 10,145, Year Average 1, ,467 46,710 65, ,457 31, ,052 62
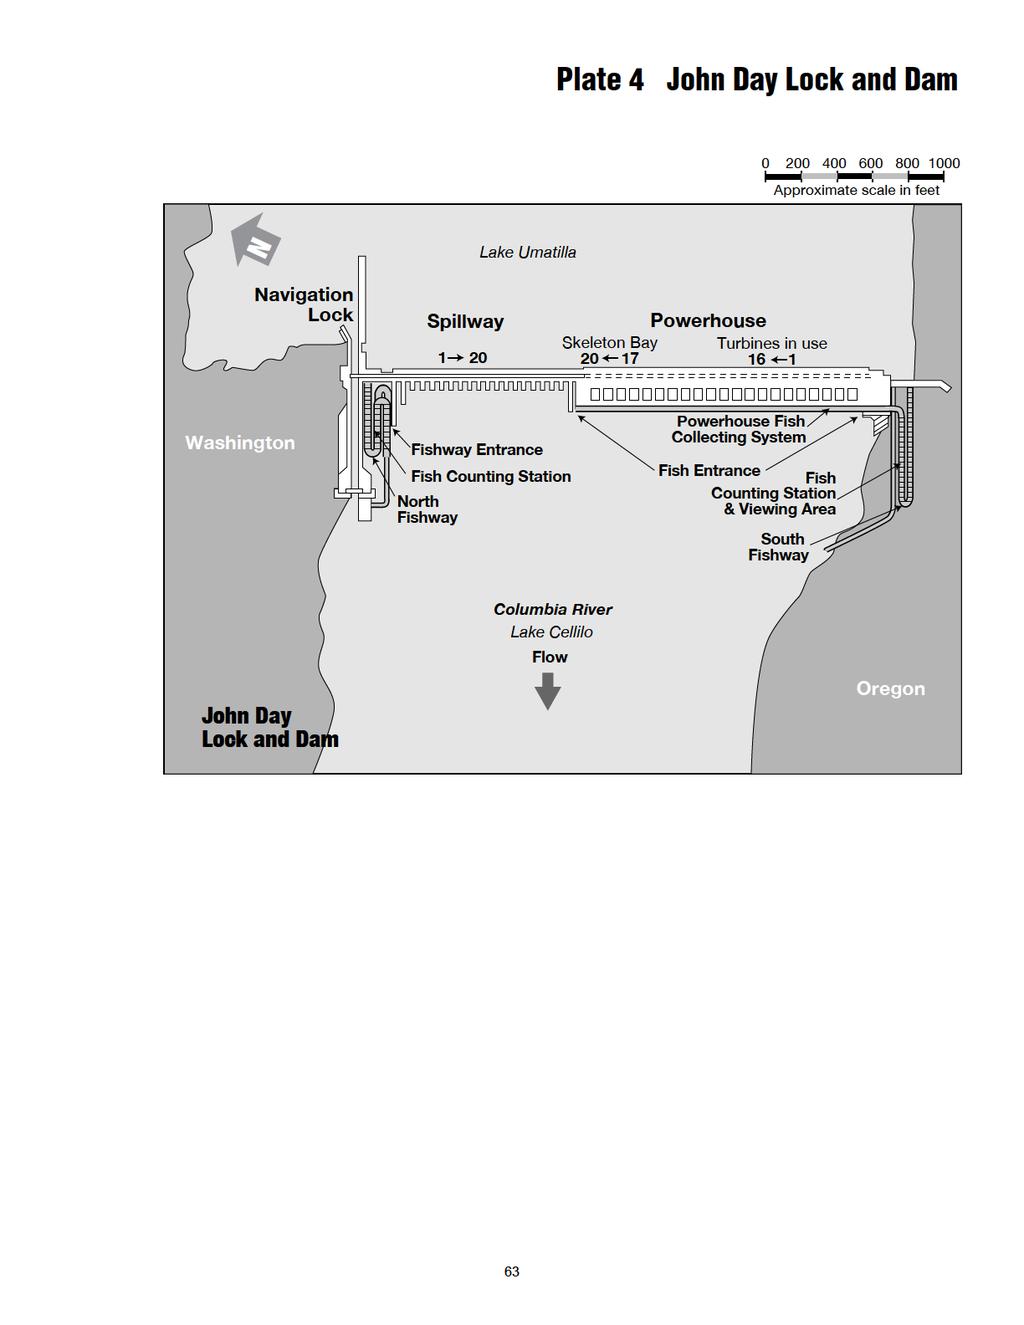
73
74 JOHN DAY DAM FISH COUNTING SCHEDULE Apr 1 Oct 31 Visual counting daily hours Pacific Standard Time. FISHWAY OPERATING SCHEDULE The following information includes fishway operation for calendar year Total length of time for annual fishway outages can be determined by referring to the2010 annual report. North Adult Fishway Jan 1 Mar 10 Mar Mar 31 Nov 3 Aug 2 Nov 5 Dec 31 South Adult Fishway Jan 1 29 Jan 31 Feb 13 Feb 14 Apr 05 Apr Apr 12 Dec 31 Aug 1 Dewatered for winter maintenance In service with mostly orifice flow (AWS pump testing) In service with attraction water Attraction water off half day for required ROV grating inspection Dewatered for winter maintenance In service with 2 AWS turbines (#3 rehab) Dewatered for winter maintenance In service with 2 AWS turbines (#3 rehab) Orifice flow (return #3 AWS turbine back to service) In service with attraction water Attraction water off half day for required ROV grating inspection Smolt Monitoring Facility Jan 1- March 30 Dewatered Mar 31 Aug 12 In full operation with juvenile sampling Aug Water temperature 70 F. Condition sampling of 100 fish on Monday and Thursday. System in bypass at switch gate on other days. Aug 26 Sep 15 In full operation with juvenile sampling Sep 16 Nov 28 System in bypass for full flow PIT tag detection. Nov 29 Dec 31 System dewatered for winter maintenance. Juvenile Bypass System Jan 1- Feb 7 1/3 gatewell orifice open, rotated twice weekly Feb 8 Mar 16 Dewatered for winter maintenance Mar 17 Mar 30 1/3 gatewell orifice open, rotated twice weekly Apr 1-Dec 15 Full operation Dec /3 gatewell orifice open, rotated twice weekly Spillway Jan 1 Apr 9 Apr 10 Aug 31 Sept 1 Nov 30 Dec 1 Dec 31 Closed Spill (TSW evaluation) Bay 2 only, 1.5 KCFS daylight hours only (attraction water for north fishway) Closed 64
75 FISH RELATED DEWATERINGS FISHWAY DEWATERING PROCEDURES Bulkheads are installed and drain valves open to dewater various areas of fishways. Fisheries personnel enter these areas to salvage fish that become stranded and /or trapped in shallow pools behind weirs. Minimal handling of fish is applied. Fish that are reluctant to vacate an area are captured and transported to the forebay or tailwater, depending on circumstances such as fish species, age class and stress levels. A follow up inspection is made to account for possible missed fish. Efforts are made to provide continual water supply during the entire operation to reduce fish stranding. Fishway areas not included on this list are inspected by ROV. Fish Ladder Dewatering Results Key:a=adult, j=juvenile catfish=ca, mountain whitefish=mw, common carp=cc, sucker species=su, bass=ba, blue gill=bg Date Event Steelhead Lamprey Other Morts Cause 1/31/ SFL 12 j, 3a 10a 0 11/5 NFL upper 20 shad dewater 11/19 NFL entrance 11/ shad NFL AWS conduit 1ca,1bg,2sp 0 dewater Smolt Monitoring Facility Dewatering Results Key:a=adult, j=juvenile catfish=ca, mountain whitefish=mw, common carp=cc, sucker species=su, bass=ba, sculpin=sp Date Event Chinook Steelhead Lamprey Sturgeon Other Morts 2/7 JBS Channel 1a 0 11/29 PDS 6a, 1j 20a 45a 12 1ba,24ca 0 TURBINE DEWATERING PROCEDURES Turbine dewatering for routine maintenance usually involves low numbers of fish, due to operational guidelines. If a turbine unit fails, operational guidelines cannot always be followed, which usually results in higher numbers of fish entrapment. Removal of fish from these areas has a greater fish stress risk due to handling. Procedures are continually analyzed to determine the best method for preventing fish stress or loss. Fish are removed from scroll case and draft tubes by fish bags. If numbers of fish are higher than two bags, transport tanks are placed in the draft tube gallery for transport by crane. Fish are released to tailwater either with bag and rope or tank and crane. 65
76 Turbine Dewatering Results Key: scroll case=sc, draft tube=dt, catfish=ca, steelhead=sh,shad=sd, common carp=cc, sucker species=su, bass=ba, crappie=cp Date Event Steelhead Sockeye Sturgeon Other Comments Morts Cause 1/18 MU3 sc 1sh,8sd unkn 1/27 MU11 dt 1 15ca 0 2/26 MU3 sc No Fish 0 2/27 MU3 dt 14a 0 6/26 MU13 sc No Fish 0 7/10 MU5 sc 1a 0 7/10 MU5 dt 14ca 5lg,9small 0 7/31 MU5 sc No Fish 0 8/1 MU5 dt 37ca 0 8/10 MU12 sc 1ca,1cp 0 8/10 MU12 dt No Fish 0 12/22 MU2 sc 1ca,1bg 3 a. sd unkn 12/22 MU2 dt 1a 30j 20ca 0 Discussion 2012 was a good year for the JD fish passage as all JD Fishways performed well and without a major failure. There has been a significant improvement in the Turbine Trashrack Drawdown, which declined in 2012 to 0 from 3.5 % OOC in This was due to an increased monitoring by JD Fisheries and intensive/ proactive raking of MUs trashracks by JD Structural crew. JD North Fishway s Entrance Differential was OOC 4.2 % of time in 2012, but this was due to problems created by an intermediate/incomplete stage of the two years construction schedule for its entrance improvements contract. Specifically, the mid channel velocities were lower than anticipated in September 2012 (related to low tailrace levels that time of year,) and the only practical remedy, was to run the ladder with an increased entrance differential (> 2.0,) which showed an improved fish passage. It is expected that the completion of the JD N Entrance improvements in early 2013, will eliminate the above mentioned ladder velocities issues. JD South Fishway s Entrance Differentials OOCs (SE1, NE1 & 2) were related to the necessary outage of the AWS in April 2012, when AWS turbine 3 was returning back to service after a three years long overhaul. Unit Priority OOCs were a result of the necessary, biannual Line 1 maintenance outage, resulting in MU 1-4 OOS in October
77 TABLE 42 SPECIES JAN FEB MAR APR MAY JUN JUL AUG SEP OCT NOV DEC TOTAL* CHINOOK* 5, ,761 47,139 30,572 27, ,132 28, ,136 STEELHEAD 1, ,995 27,799 34,466 67,996 27, ,083 SOCKEYE 2 241, , ,166 COHO* 9 1,393 28,826 3,631 33,859 CHUM 0 PINK TOTAL 6, , , ,884 63, ,987 59,975 1,034,259 LAMPREY ,710 2, ,587 STURGEON BULL TROUT *Jacks Included MONTHLY TOTALS OF SALMONIDS, LAMPREY, STURGEON, AND BULL TROUT COUNTED OVER JOHN DAY DAM
78 TABLE 43 DISCHARGE AND WATER QUALITY DATA JOHN DAY PROJECT 2012 JANUARY FEBRUARY MARCH DISCH SPILL TURBIDITY DISCH SPILL TURBIDITY DISCH SPILL TURBIDITY DATE KCFS KCFS SECCHI DEG F DATE KCFS KCFS SECCHI DEG F DATE KCFS KCFS SECCHI DEG F Jan Feb Mar Jan Feb Mar Jan Feb Mar Jan Feb Mar Jan Feb Mar Jan Feb Mar Jan Feb Mar Jan Feb Mar Jan Feb Mar Jan Feb Mar Jan Feb Mar Jan Feb Mar Jan * Feb Mar Jan * Feb Mar Jan * Feb Mar Jan * Feb Mar Jan * Feb Mar Jan * Feb Mar Jan * Feb Mar Jan Feb Mar Jan Feb Mar Jan Feb Mar Jan Feb Mar Jan Feb Mar Jan Feb Mar Jan Feb Mar Jan Feb Mar Jan Feb Mar Jan Feb Mar Jan Mar Jan Mar AVG AVG AVG *Data unavailable 68
79 TABLE 44 MONTHLY FISH PASSAGE SUMMARY REPORT U.S. ARMY ENGINEER DISTRICT, PORTLAND JOHN DAY PROJECT - FISH COUNTS APRIL 2012 CHINOOK ADULT CHINOOK COHO COHO unclipped DISCH SPILL TURBIDITY DATE SPRING SUMMER FALL JACK ADULT JACK SOCKEYE STEELHEAD STEELHEAD PINK LAMPREY STURGEON KCFS KCFS SECCHI DEG F Apr Apr Apr Apr Apr Apr Apr Apr Apr Apr Apr Apr Apr Apr Apr Apr Apr Apr Apr Apr Apr Apr Apr Apr Apr Apr Apr Apr Apr 29 1, Apr TOTAL 4, ,657 1,139 1 AVG Note: Visual counts occurred April 1 through October 31. The counts are 16-hour counts and occurred between the hours of PST. Official Spring Chinook run started April 1. 69
80 TABLE 45 MONTHLY FISH PASSAGE SUMMARY REPORT U.S. ARMY ENGINEER DISTRICT, PORTLAND JOHN DAY PROJECT - FISH COUNTS MAY 2012 CHINOOK ADULT CHINOOK COHO COHO unclipped DISCH SPILL TURBIDITY DATE SPRING SUMMER FALL JACK ADULT JACK SOCKEYE STEELHEAD STEELHEAD PINK LAMPREY STURGEON KCFS KCFS SECCHI DEG F May 1 1, May May May May May May May 8 1, May 9 4, May 10 3, May 11 9, May 12 10, May 13 8, May 14 5, May 15 5, May 16 6, May 17 6, May 18 4, May 19 3, May 20 2, May 21 2, May 22 1, May 23 1, May 24 1, May 25 1, May 26 1, May May 28 1, May 29 1, May May 31 1, TOTAL 94,893 5, AVG RUN YEAR CHINOOK CHINOOK unclipped TOTALS TO DATE ADULT JACK SOCKEYE STEELHEAD STEELHEAD LAMPREY SPRING 99,702 6, ,934 1,
81 TABLE 46 MONTHLY FISH PASSAGE SUMMARY REPORT U.S. ARMY ENGINEER DISTRICT, PORTLAND JOHN DAY PROJECT - FISH COUNTS JUNE 2012 CHINOOK ADULT CHINOOK COHO COHO unclipped DISCH SPILL TURBIDITY DATE SPRING SUMMER FALL JACK ADULT JACK SOCKEYE STEELHEAD STEELHEAD PINK LAMPREY STURGEON KCFS KCFS SECCHI DEG F Jun 1 1, Jun 2 1, Jun 3 1, Jun 4 1, Jun 5 2, Jun 6 1, Jun 7 1, Jun 8 1, Jun 9 1, Jun Jun 11 1, Jun , Jun , Jun 14 1, , Jun 15 1, , Jun 16 1, , Jun 17 1, , Jun 18 1, , Jun 19 2, , Jun 20 1, , Jun 21 1, , Jun 22 2, , Jun 23 1, , Jun 24 1, , Jun 25 1, , Jun 26 1, , Jun , Jun , Jun 29 1, , Jun 30 1, , TOTAL 7,953 34,070 5, ,353 1, AVG , , RUN YEAR CHINOOK CHINOOK unclipped TOTALS TO DATE ADULT JACK SOCKEYE STEELHEAD STEELHEAD LAMPREY SPRING 107,655 6, ,355 3,929 2, SUMMER 34,070 4,491 TOTAL 141,725 11,246 * One bull trout counted on Jun 21 71
82 TABLE 47 MONTHLY FISH PASSAGE SUMMARY REPORT U.S. ARMY ENGINEER DISTRICT, PORTLAND JOHN DAY PROJECT - FISH COUNTS JULY 2012 CHINOOK ADULT CHINOOK COHO COHO unclipped DISCH SPILL TURBIDITY DATE SPRING SUMMER FALL JACK ADULT JACK SOCKEYE STEELHEAD STEELHEAD PINK LAMPREY STURGEON KCFS KCFS SECCHI DEG F Jul 1 1, , Jul 2 1, , Jul 3 1, , Jul , Jul , Jul , Jul , Jul 8 1, , Jul 9 1, , Jul 10 1, , Jul , Jul 12 1, , Jul , Jul 14 1, , Jul 15 1, , Jul , Jul , Jul Jul , Jul , Jul , Jul , Jul , Jul , Jul , Jul , Jul , Jul , Jul , Jul , Jul , TOTAL 25,108 5, ,501 27,799 13, ,710 1 AVG , RUN YEAR CHINOOK CHINOOK COHO unclipped TOTALS TO DATE ADULT JACK ADULT SOCKEYE STEELHEAD STEELHEAD PINK LAMPREY STURGEON SPRING 107,655 6, ,856 31,728 15, ,748 1 SUMMER 59,178 9,955 TOTAL 166,833 16,710 72
83 TABLE 48 MONTHLY FISH PASSAGE SUMMARY REPORT U.S. ARMY ENGINEER DISTRICT, PORTLAND JOHN DAY PROJECT - FISH COUNTS AUGUST 2012 CHINOOK ADULT CHINOOK COHO COHO unclipped DISCH SPILL TURBIDITY DATE SPRING SUMMER FALL JACK ADULT JACK SOCKEYE STEELHEAD STEELHEAD PINK LAMPREY STURGEON KCFS KCFS SECCHI DEG F Aug , Aug , Aug , Aug , Aug , Aug , Aug , Aug , Aug ,569 1, Aug , Aug , Aug , Aug Aug , Aug Aug Aug Aug Aug Aug Aug Aug Aug Aug Aug 25 1, Aug 26 1, Aug 27 1, Aug 28 1, Aug 29 2, Aug 30 1, Aug 31 3,431 1, , TOTAL 1,636 19,223 6,154 1, ,466 14, ,087 3 AVG , RUN YEAR CHINOOK CHINOOK COHO COHO unclipped TOTALS TO DATE ADULT JACK ADULT JACK SOCKEYE STEELHEAD STEELHEAD PINK LAMPREY STURGEON SPRING 107,655 6,755 1, ,141 66,194 29, ,835 4 SUMMER 60,814 10,415 FALL 19,223 5,694 TOTAL 187,692 22,864 *One bull trout counted on Aug 10 73
84 TABLE 49 MONTHLY FISH PASSAGE SUMMARY REPORT U.S. ARMY ENGINEER DISTRICT, PORTLAND JOHN DAY PROJECT - FISH COUNTS SEPTEMBER 2012 CHINOOK ADULT CHINOOK COHO COHO unclipped DISCH SPILL TURBIDITY DATE SPRING SUMMER FALL JACK ADULT JACK SOCKEYE STEELHEAD STEELHEAD PINK LAMPREY STURGEON KCFS KCFS SECCHI DEG F Sep 1 4,066 1, , Sep 2 4,345 1,127 1, , Sep 3 5,610 1, , Sep 4 5,067 1,674 1, , Sep 5 3,866 1, , Sep 6 4,305 1,955 1, , Sep 7 4,577 2,341 1, , Sep 8 3,143 1, , Sep 9 6,155 2,509 1, , Sep 10 6,603 3,032 1, , Sep 11 6,240 2,752 1, , Sep 12 5,520 2,158 1, , Sep 13 4,765 2, , Sep 14 3,338 1, , Sep 15 4,171 1, , Sep 16 8,177 3, , Sep 17 8,190 4,367 1, , Sep 18 6,960 4,078 1, , Sep 19 5,132 3,606 1, , Sep 20 4,504 3,392 1, , Sep 21 3,409 3,313 1, , Sep 22 3,159 2, , Sep 23 3,015 3,001 1, ,048 1, Sep 24 3,458 2, , Sep 25 3,116 2, ,512 1, Sep 26 2,692 1, , Sep 27 1,985 1, , Sep 28 1,796 1, Sep 29 2,433 2, , Sep 30 2,510 2, , TOTAL 132,307 72,825 25,796 3, ,996 20, AVG. 4,410 2, , RUN YEAR CHINOOK CHINOOK COHO COHO unclipped TOTALS TO DATE ADULT JACK ADULT JACK SOCKEYE STEELHEAD STEELHEAD PINK LAMPREY STURGEON SPRING 107,655 6,755 26,883 3, , ,190 50, ,547 5 SUMMER 60,814 10,415 FALL 151,530 78,519 TOTAL 319,999 95,689 74
85 TABLE 50 MONTHLY FISH PASSAGE SUMMARY REPORT U.S. ARMY ENGINEER DISTRICT, PORTLAND JOHN DAY PROJECT - FISH COUNTS OCTOBER 2012 CHINOOK ADULT CHINOOK COHO COHO unclipped DISCH SPILL TURBIDITY DATE SPRING SUMMER FALL JACK ADULT JACK SOCKEYE STEELHEAD STEELHEAD PINK LAMPREY STURGEON KCFS KCFS SECCHI DEG F Oct 1 1, , Oct 2 1, , Oct , Oct 4 1, , Oct 5 1, Oct Oct Oct Oct Oct Oct , Oct 12 1, , Oct , Oct , Oct Oct , Oct , Oct , Oct , Oct , Oct Oct Oct Oct Oct Oct Oct Oct Oct Oct Oct TOTAL 15,444 13,004 3, ,893 10, AVG RUN YEAR CHINOOK CHINOOK COHO COHO unclipped TOTALS TO DATE ADULT JACK ADULT JACK SOCKEYE STEELHEAD STEELHEAD PINK LAMPREY STURGEON SPRING 107,655 6,755 30,216 3, , ,083 61, ,587 5 SUMMER 60,814 10,415 FALL 166,974 91,523 TOTAL 335, ,693 Note: Visual counts ended October
86 NOVEMBER TABLE 51 DISCHARGE AND WATER QUALITY DATA JOHN DAY PROJECT 2012 DECEMBER DISCH SPILL TURBIDITY DISCH SPILL TURBIDITY DATE KCFS KCFS SECCHI DEG F DATE KCFS KCFS SECCHI DEG F Nov Dec Nov Dec Nov Dec Nov Dec Nov Dec Nov Dec Nov Dec Nov Dec Nov Dec Nov Dec Nov Dec Nov Dec Nov Dec Nov Dec Nov Dec Nov Dec Nov Dec Nov Dec Nov Dec Nov Dec Nov Dec Nov Dec Nov Dec Nov Dec Nov Dec Nov Dec Nov Dec Nov Dec Nov Dec Nov Dec Dec AVG AVG
87 TABLE 52 YEARLY TOTALS OF SALMONIDS COUNTED OVER JOHN DAY DAM YEAR CHINOOK* STEELHEAD SOCKEYE COHO* TOTAL , ,256 87,847 38, , ,051 86,348 39,847 13, , ,506 82,440 78,133 19, , , ,977 72,232 40, , , ,628 51,793 17, , , ,440 64,744 13, , ,888 43,756 33,121 14, , ,079 32,651 50,774 6, , ,911 59,808 30,446 5, , , ,558 85,701 1, , ,852 44,188 13,778 8, , ,154 55,877 43,630 5, , ,664 78,199 50,675 1, , ,359 95,172 46,146 2, , , ,603 37,970 4, , , ,425 91,917 1, , , , ,951 2, , , , ,941 1, , , ,010 46,327 1, , , ,654 75,529 3, , , ,650 48,095 6, , , ,460 39,374 9, , , ,849 42,077 3, , , ,257 63,760 8, , , ,194 69,731 2, , ,705 95,642 61,218 2, , ,645 93,075 11,170 2, , , ,246 8,667 2, , , ,002 25,698 4, , , ,038 35,830 4, , , ,547 9,837 8, , , ,314 14,809 13, , , ,328 88,372 23, , , , ,869 51,181 1,153, , ,300 41,915 9, , , ,042 35,417 38, , , , ,497 35, , , ,103 69,770 36, , , ,355 35,387 38, , , ,517 24,277 39, , , , ,409 44, , , , ,402 71,739 1,262, , , ,128 23,272 1,165, , , ,605 65, , , , ,166 33,859 1,034,259 TOTALS 11,217,419 7,947,043 3,392, ,086 23,342, Year Average 402, , ,106 42, ,134 *Jacks included Total includes 1 pink Total includes 12 pinks Total includes 1 chum and 3 pinks Total includes 698 pinks Total includes 15 pinks 77
88 TABLE 53 MONTHLY COUNT OF CHINOOK SALMON JOHN DAY DAM SPRING SUMMER FALL Apr 1- Jun 6- Aug 6- YEAR JAN FEB MAR APR MAY JUN JUL AUG SEP OCT NOV DEC TOTAL* Jun 5 Aug 5 Oct 31 JACKS ,973 46,272 30,702 42,212 16,726 62,709 4, ,654 77,482 75,494 80,678 67, ,266 72,966 35,899 31,071 18, ,778 9, ,051 81,724 64, ,595 93, ,750 35,248 20,439 21,542 24,784 80,969 3, ,506 72,555 43, ,858 74, ,995 40,620 24,364 25,692 10,403 73,157 5, ,881 56,625 50,030 87,226 61, ,535 41,882 15,833 27,484 14,208 90,181 7, ,631 71,569 44, ,520 82, ,467 27,091 18,972 15,067 16,995 89,913 13, ,492 96,710 34, ,576 73, ,174 38,058 8,115 18,985 8,112 77,296 12, ,888 46,191 25,865 95,832 61, ,727 27,989 11,058 21,359 18,250 65,367 7, ,079 37,716 32,179 89,184 62, ,428 32,985 17,836 18,506 10,114 72,467 13, ,911 45,419 36,037 94,455 62, ,061 19,422 15,674 13,764 7,853 71,302 11, ,931 75,782 29,194 89,955 60, ,735 35,206 15,104 16,764 8,149 52,975 11, ,852 72,723 30,371 71,758 36, ,224 12,568 9,537 13,580 14,128 50,977 8, ,154 21,981 23,572 72,601 41, ,995 18,311 7,125 12,522 9,063 37,023 8, ,664 27,202 19,664 53,798 25, ,178 18,325 7,292 8,992 8,524 44,626 8, ,359 37,677 15,813 60,869 34, ,396 30,444 11,031 7,359 10,881 67,271 13, ,082 36,530 16,360 91,192 56, ,123 25,391 7,990 7,064 8,195 66,078 18, ,866 33,480 14,834 91,552 43, ,329 26,561 9,706 12,892 15,422 96,399 22, ,373 32,035 22, ,543 69, ,539 42,487 15,585 9,663 27, ,322 34,192 2, ,624 72,389 23, , , ,075 37,959 13,227 9,703 10, ,928 41, ,700 77,884 22, , , ,985 26,852 13,641 8,948 24, ,596 23, ,752 62,313 22, ,195 53, ,323 20,170 14,731 9,648 37, ,553 14, ,251 55,195 23, ,487 51, ,510 23,983 12,793 10,124 35, ,794 11, ,254 37,773 23, ,613 25, ,689 18,854 11,209 9,199 13,542 71,508 8, ,313 43,127 20,532 92,654 22, ,419 13,668 8,868 8,390 4,879 64,950 10, ,921 21,847 16,872 80,202 28, ,538 16,623 9,452 5,263 7,677 58,140 7, ,025 45,457 13,910 72,658 22, ,309 28,204 13,295 6,311 10,703 51,667 5, ,705 56,144 18,364 67,197 9, ,436 4,937 6,305 6,397 13,345 79,538 11, ,645 9,745 12, ,965 18, ,034 3,378 4,977 6,273 14,694 61,273 14, ,277 5,776 11,476 90,025 24, ,860 18,616 7,419 6,356 18,550 68,198 9, ,602 21,599 13,148 95,855 12, ,579 45,408 16,551 8,328 10,355 81,039 9, ,240 62,580 21, ,891 1, ,279 12,439 10,076 7,535 11,073 62,107 17, ,028 22,177 17,780 90,071 13, ,008 16,517 10,206 14,226 20,201 86,380 12, ,282 20,498 24, ,070 19, ,176 47,705 19,201 13,579 44,377 86,737 9, ,371 98,710 31, ,605 56, ,104 74,233 46,449 33,904 20, ,230 20, , ,385 74, ,367 57, ,677 99,270 69,941 44,890 37, ,126 16, , , , ,470 37, ,951 61,184 45,880 62,159 45,782 22, ,192 28,666 1, , , , ,828 54, ,999 50,288 55,728 30,998 24, ,606 29,301 1, , ,520 83, ,723 47, ,680 39,563 45,107 28,340 15, ,917 21, ,991 58,742 69, ,382 37, ,051 50,206 28,688 14, ,233 27,015 1, ,161 52,406 77, ,064 28, ,080 40,896 30,282 19,378 12,140 81,091 17,462 1, ,876 57,042 47, ,379 61, ,050 77,177 58,652 22,929 29, ,961 13, ,952 96,697 77, ,926 60, , ,503 75,623 31,549 51, ,522 20, , ,539 99, , , , ,746 64,519 30,528 29, ,139 34, , ,240 83, ,577 69, , ,343 70,070 46,154 26, ,441 37, , , , , , , ,761 47,139 30,572 27, ,132 28, , ,410 71, , ,693 TOTAL 4,123 1,127,265 1,856,850 1,130, , ,177 4,683, ,108 10,066 11,217,419 3,119,752 1,907,791 6,179,331 2,518, Year Average 24,837 75,621 55,949 31,492 25, ,923 25, , ,046 82, ,330 77,152 *Jacks included 78
89 TABLE 54 MONTHLY COUNT OF SOCKEYE SALMON JOHN DAY DAM YEAR JAN FEB MAR APR MAY JUN JUL AUG SEP OCT NOV DEC TOTAL ,175 44, , ,383 26, , ,029 58,176 1, , ,219 66, , ,762 43,704 1, , ,283 42, , ,024 30, , ,154 44, , ,907 21, , ,852 32, , ,633 8, , ,466 29, , ,596 40, , ,064 28, , ,708 28, , ,372 63, , ,975 51,728 1, , ,326 46, , ,472 32, , ,022 39, , ,001 22, , ,883 20, , ,247 26, , ,917 52, , ,618 30, , ,668 30, , ,004 4, , ,242 4, , ,316 10, , ,605 23, , ,371 5, , ,803 9, , ,119 15, , ,624 21, , ,044 21, , ,260 16, , ,659 28, , ,616 33, , ,279 14, , ,083 7, , ,928 42, , ,136 57, , ,244 97, , , , , , , ,166 TOTAL 103 1,743,296 1,631,703 17, ,392, Year Average 93,641 55, ,106 79
90 TABLE 55 MONTHLY COUNT OF COHO SALMON JOHN DAY DAM YEAR JAN FEB MAR APR MAY JUN JUL AUG SEP OCT NOV DEC TOTAL* ,311 32,882 3, , ,879 3,377 13, ,026 17,272 1,231 19, ,401 3,485 40, ,253 14,965 1,315 17, ,350 1,221 13, ,253 2,668 14, ,266 1,954 6, ,739 2,010 5, , ,676 5,673 8, ,853 1, , , , , , , , , , , , , , , , , , ,170 1,399 6, ,832 2,567 9, ,890 1,132 3, ,140 1,876 8, , , , , , , , , , , ,860 1,368 4, ,806 5,673 8, ,471 3,753 13, ,355 7,691 23, ,204 27,448 51, ,101 4,105 9, ,786 13, , ,884 9, , ,981 12,882 2, , ,825 12,340 4, , ,179 17, , ,451 14,637 44, ,826 29,003 37,909 71, ,126 8,761 23, ,234 37,683 25,751 65, ,393 28,826 3,631 33,859 TOTAL , , ,012 8, , Year Average 1,128 25,174 15,693 42,772 *Jacks included 80
91 TABLE 56 MONTHLY COUNT OF STEELHEAD JOHN DAY DAM YEAR JAN FEB MAR APR MAY JUN JUL AUG SEP OCT NOV DEC TOTAL ,939 2, ,094 26,824 68,791 11,405 1, , ,986 3, ,004 13,267 40,082 12,290 86, ,987 1, ,373 19,412 46,036 6,100 82, , ,459 19,693 63,868 12, , ,523 1, ,656 20,502 78,138 21, , ,019 3, ,134 15,608 46,566 14, , ,713 2,363 1,361 9,713 8,419 12,479 7,708 43, ,251 8,583 9,977 6,004 32, ,248 1,868 9,254 17,964 22,754 5,791 59, , ,341 18,366 7,088 56,134 16, , ,601 5,573 6,911 22,896 5,835 44, ,012 10,717 16,202 18,072 1,883 55, , ,850 18,114 34,700 14,272 78, ,061 1,539 2,515 15,999 18,283 34,098 20,677 95, ,393 1,698 1,167 10,168 19,693 50,725 21, , , ,088 31,453 83,215 22, , ,316 1,787 2,101 21,442 19, ,437 46,506 5, , ,821 1,723 3,583 19,631 64, ,488 37,227 4, , ,611 2, ,362 37,732 31, ,002 52, , , ,614 34,203 69,585 39, , , ,188 17,649 25,741 81,859 32, , , ,445 18,254 22, ,521 42, , , ,902 10,544 9,445 42,888 39, , , ,256 12,827 18,310 87,277 37, , , ,337 10,732 17, ,823 19, , , ,845 9,434 11,018 46,447 21,637 95, , ,647 6,961 7,140 44,175 30,453 93, , ,757 7,755 26,450 45,087 40, , , ,576 11,885 42,853 67,171 30, , , ,021 12,847 22,179 75,119 41, , ,367 1,018 2,460 9,827 9,053 67,322 64, , , ,975 17,083 42,160 72,719 27, , , ,500 23,496 37, ,619 37, , , ,031 52,946 50, , , , , ,875 42,167 59, , , , ,792 1, ,888 28,019 23, ,058 50,975 7,666 1, , ,591 1, ,840 20,250 24, ,241 28,300 3, , , ,424 24,705 27, ,336 49,965 6, , ,252 2, ,575 15,719 25, ,323 46,050 12, , ,584 1, ,450 16,497 43, ,499 42,809 5, , ,363 1,004 5,973 45,572 41, ,781 35, , , ,136 43, , , , , , ,589 73,271 36, ,408 40, , , ,090 32, ,526 83,950 35, , , ,995 27,799 34,466 67,996 27, ,083 TOTAL 23, ,954 41, , ,842 1,340,371 3,832,863 1,555,466 48,905 7,947, YR Average 1, ,196 32,802 52, ,597 45, ,150 81
92
93 McNARY DAM FISH COUNTING SCHEDULE Washington Ladder Schedule 1 January 31 March No counting. 1 April 31 October Visual counts daily hours PST. 1 July 30 September Night Video Lamprey counts. 1 November 31 December Counts by video tape review. Oregon Ladder Schedule 1 January - 31 March No counting. 1 April 31 October Visual counting daily hours PST. 1 July 30 September Night video lamprey counts. 1 November 31 December Counts by video tape review. FISH LADDER OPERATING SCHEDULE Washington Ladder 1 January - 2 February Ladder in service. 2 February 16 February Ladder dewatered for annual maintenance. 16 February - 31 December Ladder in service. Oregon Ladder 1 January - 4 January Ladder in service. 4 January 31 January Ladder in orifice flow for annual maintenance, not dewatered due to failed exit crane. 31 January - 31 December Ladder in service. FISHWAY ACTIVITIES Both ladders had new electrical wiring installed for the exit cranes. New cranes will be installed the winter of Washington ladder maintenance activities consisted of a camera inspection of diffuser gratings with maintenance performed on all above-water structures and in the ladder to tailwater elevation. The junction pool still can not be dewatered due to problems with the concrete spillway bulkheads. The Wasco county PUD was out of service from 31 January to 17 February for annual maintenance. 83
94 Due to failure of the exit crane, the Oregon ladder was not dewatered. Activities consisted of annual maintenance performed on above water structures, all regulating equipment and the exit traveling screens. PIT tag detectors were replaced at the count station. For lamprey passage, the project installed stilts on SFEW2. Camera inspections of all diffuser gratings were completed. Fish pump 2 remains out of service for major overhaul. Fish pumps 1 and 3 were out of service from 4 January to 31 January for annual maintenance. Both pumps were operational from 1 March to 31 December. The 1000 cfs gravity conduit was never closed due to failure of the exit crane which is required to close the Tainter valve at the conduit s intake and/or failure of the roto-valves which are at the conduit s discharges which also need to be replaced. We were able to modify the SeaSnake camera to conduct the required ladder diffuser inspection. The juvenile bypass channel was operated for both juvenile and adult fallback passage, from 29 March to 20 December. From 3 to 9 April, the system was in emergency bypass due to failure of rectangular screen cleaning device which was repaired and for repainting the main full flow flume. From 6 November to 20 December, the system was in emergency bypass again due to failure of the rectangular screen cleaning device. When in emergency bypass, the system does not provide auxiliary flow to the Oregon ladder s north powerhouse entrances. 84
95 TABLE 57 MONTHLY TOTALS OF SALMONIDS, SHAD, LAMPREY, STURGEON, AND BULL TROUT COUNTED OVER McNARY DAM 2012 SPECIES JAN FEB MAR APR MAY JUN JUL AUG SEP OCT NOV DEC TOTAL* CHINOOK* 1,877 94,385 45,725 31,612 19, ,650 36,164 1, ,202 STEELHEAD 3,009 1, ,744 18,373 33,983 62,318 28,580 4,931 2, ,018 SOCKEYE 1 165, , ,147 COHO* ,779 2, ,801 CHUM 0 PINK 0 TOTAL 3,009 3,398 94, , ,022 54, ,761 67, ,168 SHAD , ,616 19, ,421 LAMPREY STURGEON 0 BULL TROUT 0 *Jacks Included Count began March
96 TABLE 58 DISCHARGE AND WATER QUALITY DATA MCNARY PROJECT 2012 JANUARY FEBRUARY DISCH SPILL TURBIDITY DISCH SPILL TURBIDITY DATE KCFS KCFS SECCHI DEG F DATE KCFS KCFS SECCHI DEG F Jan Feb Jan Feb Jan Feb Jan Feb Jan Feb Jan Feb Jan Feb Jan Feb Jan Feb Jan Feb Jan Feb Jan Feb Jan Feb Jan Feb Jan Feb Jan Feb Jan Feb Jan Feb Jan Feb Jan Feb Jan Feb Jan Feb Jan Feb Jan Feb Jan Feb Jan Feb Jan Feb Jan Feb N/A 40.0 Jan Feb Jan Jan AVG AVG
97 TABLE 59 MONTHLY FISH PASSAGE SUMMARY REPORT U.S. ARMY ENGINEER DISTRICT, PORTLAND MCNARY PROJECT - FISH COUNTS MARCH 2012 CHINOOK ADULT CHINOOK COHO COHO TOTAL unclipped DISCH SPILL TURBIDITY DATE SPRING SUMMER FALL JACK ADULT JACK SOCKEYE STEELHEAD STEELHEAD PINK SHAD LAMPREY KCFS KCFS SECCHI DEG F Mar Mar Mar N/A 39.0 Mar N/A 40.0 Mar Mar Mar Mar Mar Mar Mar Mar Mar Mar Mar Mar Mar Mar Mar Mar Mar Mar Mar Mar Mar Mar Mar Mar Mar Mar Mar TOTAL 3,009 1,224 AVG Note: March counts were from video tape. The counts are 16-hour counts and occurred between the hours of PST. Official Spring Chinook run started April 1. March chinook counts were not added to spring totals. 87
98 TABLE 60 MONTHLY FISH PASSAGE SUMMARY REPORT U.S. ARMY ENGINEER DISTRICT, PORTLAND MCNARY PROJECT - FISH COUNTS APRIL 2012 CHINOOK ADULT CHINOOK COHO COHO TOTAL unclipped DISCH SPILL TURBIDITY DATE SPRING SUMMER FALL JACK ADULT JACK SOCKEYE STEELHEAD STEELHEAD PINK SHAD LAMPREY KCFS KCFS SECCHI DEG F Apr Apr Apr Apr Apr N/A 43.0 Apr Apr Apr Apr Apr Apr Apr Apr Apr Apr Apr Apr Apr Apr Apr Apr Apr Apr Apr Apr Apr Apr N/A 50.0 Apr Apr Apr TOTAL 1, , AVG Note: Visual counts occurred April 1 through October 31. The counts are 16-hour counts and occurred between the hours of PST. Official Spring Chinook run started April 1. 88
99 TABLE 61 MONTHLY FISH PASSAGE SUMMARY REPORT U.S. ARMY ENGINEER DISTRICT, PORTLAND MCNARY PROJECT - FISH COUNTS MAY 2012 CHINOOK ADULT CHINOOK COHO COHO TOTAL unclipped DISCH SPILL TURBIDITY DATE SPRING SUMMER FALL JACK ADULT JACK SOCKEYE STEELHEAD STEELHEAD PINK SHAD LAMPREY KCFS KCFS SECCHI DEG F May May May May May May May May May 9 1, May 10 1, May 11 3, May 12 3, May 13 8, May 14 10, May 15 9, May 16 6, May 17 5, May 18 6, May 19 5, May 20 4, May 21 2, May 22 2, May 23 1, May 24 1, May 25 2, May 26 1, May 27 1, May 28 1, May 29 1, May 30 1, May 31 1, TOTAL 90,169 4, AVG. 2, RUN YEAR CHINOOK CHINOOK TOTAL unclipped TOTALS TO DATE ADULT JACK SOCKEYE STEELHEAD STEELHEAD SHAD LAMPREY SPRING 92,027 4, ,
100 TABLE 62 MONTHLY FISH PASSAGE SUMMARY REPORT U.S. ARMY ENGINEER DISTRICT, PORTLAND MCNARY PROJECT - FISH COUNTS JUNE 2012 CHINOOK ADULT CHINOOK COHO COHO TOTAL unclipped DISCH SPILL TURBIDITY DATE SPRING SUMMER FALL JACK ADULT JACK SOCKEYE STEELHEAD STEELHEAD PINK SHAD LAMPREY KCFS KCFS SECCHI DEG F Jun 1 1, Jun Jun Jun 4 1, Jun 5 1, Jun 6 1, Jun 7 1, Jun 8 1, Jun 9 1, Jun 10 1, Jun 11 1, , Jun 12 1, , Jun 13 1, , Jun 14 1, , Jun 15 1, , , Jun 16 1, , , Jun 17 1, , , Jun 18 1, , , Jun 19 1, , , Jun 20 1, , , Jun 21 1, , , Jun 22 1, , , Jun 23 1, , , Jun 24 1, , , Jun 25 2, , , Jun 26 1, , , Jun 27 1, , , Jun 28 1, , , Jun 29 1, , , Jun 30 1, , , TOTAL 10,736 32,383 2, ,803 1, ,763 0 AVG. 1,342 1, , , RUN YEAR CHINOOK CHINOOK TOTAL unclipped TOTALS TO DATE ADULT JACK SOCKEYE STEELHEAD STEELHEAD SHAD LAMPREY SPRING 102,763 4, ,804 3,499 1, ,792 5 SUMMER 32,383 2,054 TOTAL 135,146 6,841 90
101 TABLE 63 MONTHLY FISH PASSAGE SUMMARY REPORT U.S. ARMY ENGINEER DISTRICT, PORTLAND MCNARY PROJECT - FISH COUNTS JULY 2012 CHINOOK ADULT CHINOOK COHO COHO TOTAL unclipped DISCH SPILL TURBIDITY DATE SPRING SUMMER FALL JACK ADULT JACK SOCKEYE STEELHEAD STEELHEAD PINK SHAD LAMPREY KCFS KCFS SECCHI DEG F Jul 1 1, , , Jul 2 1, , , Jul 3 1, , , Jul 4 1, , , Jul , , Jul 6 1, , , Jul , , Jul 8 1, , , Jul 9 1, , , Jul 10 1, , , Jul 11 1, , , Jul , , Jul 13 1, , , NA 63.0 Jul 14 1, , , Jul , , Jul 16 1, , , Jul 17 1, , , Jul 18 1, , , Jul 19 1, , , Jul , Jul , Jul , Jul , Jul , Jul , Jul , Jul , , Jul , , Jul , , Jul , , Jul , , TOTAL 29,033 2, ,037 18,373 7, , AVG , , RUN YEAR CHINOOK CHINOOK TOTAL unclipped TOTALS TO DATE ADULT JACK SOCKEYE STEELHEAD STEELHEAD SHAD LAMPREY SPRING 102,763 4, ,841 21,872 9, , SUMMER 61,416 4,633 TOTAL 164,179 9,420 91
102 TABLE 64 MONTHLY FISH PASSAGE SUMMARY REPORT U.S. ARMY ENGINEER DISTRICT, PORTLAND MCNARY PROJECT - FISH COUNTS AUGUST 2012 CHINOOK ADULT CHINOOK COHO COHO TOTAL unclipped DISCH SPILL TURBIDITY DATE SPRING SUMMER FALL JACK ADULT JACK SOCKEYE STEELHEAD STEELHEAD PINK SHAD LAMPREY KCFS KCFS SECCHI DEG F Aug , , Aug , , Aug , , Aug , , Aug , , Aug , , Aug , , Aug , , Aug , Aug , Aug , Aug , Aug , Aug , Aug , Aug , Aug , Aug Aug Aug Aug Aug Aug Aug Aug Aug Aug 27 1, Aug 28 1, Aug 29 1, Aug 30 1, Aug 31 1, TOTAL 3,012 13,472 2, ,983 13,441 19, AVG , RUN YEAR CHINOOK CHINOOK COHO COHO TOTAL unclipped TOTALS TO DATE ADULT JACK ADULT JACK SOCKEYE STEELHEAD STEELHEAD SHAD LAMPREY SPRING 102,763 4, ,133 55,855 22, , SUMMER 64,428 5,104 FALL 13,472 2,441 TOTAL 180,663 12,332 92
103 TABLE 65 MONTHLY FISH PASSAGE SUMMARY REPORT U.S. ARMY ENGINEER DISTRICT, PORTLAND MCNARY PROJECT - FISH COUNTS SEPTEMBER 2012 CHINOOK ADULT CHINOOK COHO COHO TOTAL unclipped DISCH SPILL TURBIDITY DATE SPRING SUMMER FALL JACK ADULT JACK SOCKEYE STEELHEAD STEELHEAD PINK SHAD LAMPREY KCFS KCFS SECCHI DEG F Sep 1 2, Sep 2 3, , Sep 3 4, , Sep 4 4, , Sep 5 4, , Sep 6 3, , Sep 7 4,431 1, , Sep 8 3, , Sep 9 5,097 1, , Sep 10 4,893 1, , Sep 11 6,515 1, , Sep 12 6,463 1, , Sep 13 4, , Sep 14 4,792 1, , Sep 15 4,908 1, , Sep 16 4,727 1, , Sep 17 4,516 1, , Sep 18 5,026 1, , Sep 19 7,406 1, , Sep 20 6,732 1, , Sep 21 5,261 2, , Sep 22 4,187 1, , Sep 23 6,151 2, , Sep 24 4,585 2, , Sep 25 3,648 1, , Sep 26 5,404 1, ,791 1, Sep 27 3,365 1, , Sep 28 1, , Sep 29 1, , Sep 30 2,888 1, , TOTAL 136,480 38,170 13, ,318 17, AVG. 4, , RUN YEAR CHINOOK CHINOOK COHO COHO TOTAL unclipped TOTALS TO DATE ADULT JACK ADULT JACK SOCKEYE STEELHEAD STEELHEAD SHAD LAMPREY SPRING 102,763 4,787 14,196 1, , ,173 40, , SUMMER 64,428 5,104 FALL 149,952 40,611 TOTAL 317,143 50,502 93
104 TABLE 66 MONTHLY FISH PASSAGE SUMMARY REPORT U.S. ARMY ENGINEER DISTRICT, PORTLAND MCNARY PROJECT - FISH COUNTS OCTOBER 2012 CHINOOK ADULT CHINOOK COHO COHO TOTAL unclipped DISCH SPILL TURBIDITY DATE SPRING SUMMER FALL JACK ADULT JACK SOCKEYE STEELHEAD STEELHEAD PINK SHAD LAMPREY KCFS KCFS SECCHI DEG F Oct 1 3,121 1, , Oct 2 1, , Oct 3 1,999 1, , Oct Oct 5 1,535 1, , Oct 6 1, , Oct 7 1, , Oct Oct 9 1, Oct , Oct , Oct Oct , Oct , Oct , Oct , Oct Oct Oct Oct , Oct ,397 1, Oct Oct Oct Oct Oct Oct Oct Oct Oct Oct TOTAL 23,520 12,644 2, ,580 9, AVG RUN YEAR CHINOOK CHINOOK COHO COHO TOTAL unclipped TOTALS TO DATE ADULT JACK ADULT JACK SOCKEYE STEELHEAD STEELHEAD SHAD LAMPREY SPRING 102,763 4,787 16,776 1, , ,753 49, , SUMMER 64,428 5,104 FALL 173,472 53,255 TOTAL 340,663 63,146 Note: Visual counts ended October 31. Official Fall Chinook run ended October
105 TABLE 67 MONTHLY FISH PASSAGE SUMMARY REPORT U.S. ARMY ENGINEER DISTRICT, PORTLAND MCNARY PROJECT - FISH COUNTS NOVEMBER 2012 CHINOOK ADULT CHINOOK COHO COHO TOTAL unclipped DISCH SPILL TURBIDITY DATE SPRING SUMMER FALL JACK ADULT JACK SOCKEYE STEELHEAD STEELHEAD PINK SHAD LAMPREY KCFS KCFS SECCHI DEG F Nov Nov Nov Nov Nov Nov Nov Nov Nov Nov Nov Nov Nov Nov Nov Nov Nov Nov Nov Nov Nov Nov Nov Nov Nov Nov Nov Nov Nov Nov TOTAL ,931 1,116 AVG RUN YEAR CHINOOK CHINOOK COHO COHO TOTAL unclipped TOTALS TO DATE ADULT JACK ADULT JACK SOCKEYE STEELHEAD STEELHEAD SHAD LAMPREY SPRING 102,763 4,787 16,776 1, , ,753 49, , SUMMER 64,428 5,104 FALL 173,472 53,255 TOTAL 340,663 63,146 Note: November counts were from video tape. The counts are 16-hour counts and occurred between the hours of PST. Official Fall Chinook run ended October 31. November and December chinook counts were not added to fall totals. 95
106 TABLE 68 MONTHLY FISH PASSAGE SUMMARY REPORT U.S. ARMY ENGINEER DISTRICT, PORTLAND MCNARY PROJECT - FISH COUNTS DECEMBER 2012 CHINOOK ADULT CHINOOK COHO COHO TOTAL unclipped DISCH SPILL TURBIDITY DATE SPRING SUMMER FALL JACK ADULT JACK SOCKEYE STEELHEAD STEELHEAD PINK SHAD LAMPREY KCFS KCFS SECCHI DEG F Dec Dec Dec Dec Dec Dec Dec Dec Dec Dec Dec Dec Dec Dec Dec Dec Dec Dec Dec Dec Dec Dec Dec Dec Dec Dec Dec Dec Dec Dec Dec TOTAL , AVG RUN YEAR CHINOOK CHINOOK COHO COHO TOTAL unclipped TOTALS TO DATE ADULT JACK ADULT JACK SOCKEYE STEELHEAD STEELHEAD SHAD LAMPREY SPRING 102,763 4,787 16,776 1, , ,753 49, , SUMMER 64,428 5,104 FALL 173,472 53,255 TOTAL 340,663 63,146 Note: December counts were from video tape. The counts are 16-hour counts and occurred between the hours of PST. Official Fall Chinook run ended October 31. November and December chinook counts were not added to fall totals. 96
107 TABLE 69 YEARLY TOTALS OF SALMONIDS COUNTED OVER McNARY DAM YEAR CHINOOK* STEELHEAD SOCKEYE COHO* TOTALS* ,555 75, , , ,915 85, , , ,342 42, , , , ,728 85,460 2, , ,092 87, ,397 1, , , ,475 83,977 1, , ,767 96,895 55,372 1, , , ,743 16,388 2, , , ,181 29,372 3, , , ,646 59,744 3, , , ,742 83,931 3, , , ,960 42,052 2, , , , ,028 8, , ,653 77, ,635 27, , , , ,007 39, , ,407 76,681 29,787 53, , ,892 69,759 59,636 36, , , ,630 52,867 39, , ,821 93,820 26,422 45, , ,112 64,620 42,731 17, , ,858 26,932 26,505 13, , ,150 23,663 43,143 3, , ,314 54,000 24,632 7, , ,581 87,712 80,781 4, , ,148 34,740 18,511 20, , ,275 50,304 37,792 12, , ,773 66,524 44, , ,619 61,985 26,644 3, , ,225 75,099 15,077 3, , , ,254 40,903 2, , , ,515 56,906 2, , , ,204 98,457 6, , , ,481 46,443 1, , , ,811 72, , , ,765 50,080 2, , , ,467 41,318 3, , ,439 95,061 46,145 2, , , ,962 69,365 2, , , ,026 68,737 1, , ,412 93,183 66, , ,868 94,427 10,603 1, , , ,910 8,320 1, , , ,177 28,585 1, , , ,817 38,043 2, , ,604 99,705 9,391 6, , ,946 84,088 11,884 4, , , ,332 60,242 11, , , ,784 97,188 24,730 1,010, , ,805 39,424 3, , , ,898 32,037 20, , , ,683 89,707 20, , , ,292 63,540 20, , , ,155 29,295 13, , , ,534 18,175 22, , , , ,924 21, , , , ,672 37, , , , ,799 15,089 1,019, , , ,952 44, , , , ,147 18, ,168 Totals 12,062,156 7,969,672 4,070, ,936 24,783, Year Average 341, , ,825 23, ,321 *Jacks included 97
108 TABLE 70 MONTHLY COUNT OF CHINOOK SALMON McNARY DAM: SPRING SUMMER FALL MAR 15- JUN 9- AUG 9- YEAR JAN FEB MAR APR MAY JUN JUL AUG SEP OCT NOV DEC TOTAL* JUN 8 AUG 8 OCT ,625 28,510 35,993 9,287 8, ,555 52,014 61,065 13, ,778 26,125 46,021 14,773 7,220 1, ,915 21,309 71,180 16, ,746 34,360 50,409 11,073 5,636 1, ,342 12,717 90,335 11, ,489 67,939 91,473 41,485 25,621 48,685 2, ,696 99, ,578 70, ,864 36,684 61,898 25,140 11,120 82,890 6, ,092 54,910 73,654 97, ,914 31,923 23,461 51,478 14,929 42,756 3, ,490 40,775 74,985 55, ,808 44,721 49,506 25,710 13,376 35,329 3, ,767 52,490 76,940 47, ,669 44,260 19,722 23,192 10,661 31,447 4, ,996 68,539 45,257 41, ,527 44,053 28,621 21,008 11,751 33,541 3, ,756 55,884 52,756 44, ,765 42,804 22,454 18,659 13,757 43,731 5, ,459 52,336 44,760 57, ,856 33,310 10,893 39,334 14,930 45,514 4, ,934 54,279 55,062 58, ,114 20,559 14,094 28,599 12,856 60,185 8, ,907 29,206 45,375 76, ,484 32,282 21,161 35,895 13,811 58,275 8, ,141 87,195 60,827 75, ,790 28,174 13,244 44,612 10,788 54,314 11, ,653 62,591 59,975 73, ,328 51,443 20,456 37,127 15,713 53,597 8, ,488 67,092 60,639 72, ,241 39,074 30,556 12,200 59,889 10, ,407 70,079 63,953 79, ,015 34,027 18,661 23,132 13,773 44,635 6, ,892 63,982 43,356 61, ,642 32,688 24,007 35,152 9,680 55,297 8, ,448 42,601 59,129 69, ,911 41,609 12,553 35,322 10,154 37,131 6, ,821 69,023 50,491 49, ,878 31,727 16,836 14,520 10,400 57,716 8, ,112 79,047 31,812 73, ,918 34,767 7,976 18,181 6,251 45,845 12, ,858 40,037 25,812 62, ,694 24,752 11,590 20,497 12,485 53,125 6, ,150 32,718 31,713 68, ,868 30,435 16,714 19,821 9,143 64,863 17, ,314 38,505 36,818 87, ,692 23,895 16,768 16,256 7,348 64,785 13, ,581 66,934 32,277 84, ,191 37,613 14,505 18,095 7,799 30,273 7,296 1, ,148 68,414 31,589 44, ,424 13,696 9,763 14,601 8,030 34,702 8, ,275 21,153 24,161 49, ,481 18,108 6,705 12,166 7,001 24,409 8, ,773 23,001 18,862 38, ,923 16,904 8,288 8,243 5,584 23,323 4, ,619 32,330 15,141 33, ,638 23,487 10,357 8,749 5,091 44,276 8, ,225 28,352 16,574 57, ,481 25,074 9,202 7,882 5,217 54,339 15, ,636 31,636 16,199 73, ,772 23,806 9,235 12,256 8,845 79,004 23, ,076 27,474 21, , ,267 41,962 14,117 9,912 17, ,034 46, ,483 63,265 22, ,189 98
109 TABLE 70 (Continued) MONTHLY COUNT OF CHINOOK SALMON McNARY DAM: SPRING SUMMER FALL MAR 15- JUN 9- AUG 9- YEAR JAN FEB MAR APR MAY JUN JUL AUG SEP OCT NOV DEC TOTAL* JUN 8 AUG 8 OCT ,739 44,459 14,515 12,315 9, ,230 64, ,417 76,077 25, , ,258 32,171 12,889 11,219 19, ,410 33, ,638 60,396 25, , ,267 22,245 14,605 9,282 30, ,878 24, ,608 51,178 23, , ,625 24,281 12,484 11,112 23,034 80,089 15, ,407 35,954 24, , ,309 23,861 11,007 11,148 7,306 61,718 13, ,439 44,499 22,248 80, ,942 15,838 9,289 9,409 4,328 56,251 13,674 1, ,841 22,631 17,588 74, ,549 22,799 9,511 6,159 5,846 51,961 13, ,707 50,590 14,414 70, ,649 37,255 14,880 8,119 8,414 48,093 8, ,412 59,556 20,374 63, ,940 5,513 5,486 8,242 11,085 80,693 14, ,868 8,987 14, , ,392 3,871 4,343 8,270 13,224 61,633 20, ,354 5,930 13,219 94, ,212 8,242 8,206 13,964 56,847 12, ,947 17,832 15,102 82, ,529 44,264 18,384 10,584 6,892 63,484 12, ,946 56,826 23,649 82, ,645 11,964 9,965 8,249 5,652 50,987 21, ,604 19,752 17,634 77, ,193 10,841 7,570 13,475 15,402 59,360 14, ,946 13,232 21,618 87, ,136 46,396 16,096 13,641 27,931 50,138 11, ,231 75,644 27,696 87, ,846 86,605 50,064 36,562 16, ,369 23, , ,372 77, , , ,862 65,935 56,149 26, ,089 21, , , , , ,947 46,116 57,732 50,157 13, ,635 32,349 1, , , , , ,405 53,267 47,903 32,067 12, ,297 34,795 1, , ,251 74, , ,750 38,439 45,654 28,928 11, ,701 25, ,003 55,056 66, , ,778 40,077 27,708 10,210 71,105 24,186 1, ,191 48,363 65, , ,073 38,622 27,760 18,036 8,565 60,291 18,455 1, ,435 51,104 42,436 85, ,133 64,596 48,906 24,035 13,094 94,986 15, ,979 80,213 65, , ,821 98,882 63,510 26,828 30, ,844 19, , ,741 78, , ,451 98,345 58,192 30,587 18, ,173 42, , ,921 74, , ,537 64,599 46,170 21, ,223 44, , , , , ,877 94,385 45,725 31,612 19, ,650 36,164 1, , ,550 69, ,727 Total ,097 2,310,496 1,497,652 1,388, ,773 4,173, ,831 14, ,062,161 3,610,800 2,783,720 5,686, Year Average 18,126 69,497 50,006 31,613 15, ,691 29, , ,372 74, ,261 *Jacks included 99
110 TABLE 71 MONTHLY COUNT OF SOCKEYE SALMON McNARY DAM: YEAR JAN FEB MAR APR MAY JUN JUL AUG SEP OCT NOV DEC TOTAL ,107 93,452 11,382 2, , ,902 9, , ,352 6, , ,318 74,874 4, , ,542 82,547 5,474 1, , ,031 73,735 7, , ,374 43,749 2, , ,088 14,149 1, , ,721 27, , ,712 50, , ,536 1, , , , , ,267 4, , , ,044 2, , ,928 70,413 1, , ,787 23, , ,152 47,339 5, , ,568 1,982 52, ,452 1,604 26, ,011 32, , , , ,517 41, , ,461 19, , ,708 43, , ,211 10, ,583 2,627 18, ,317 29,571 1, , ,400 40, , ,419 22, , , , ,897 33, , ,762 37, , ,067 36, ,
111 TABLE 71 (Continued) MONTHLY COUNT OF SOCKEYE SALMON McNARY DAM; YEAR JAN FEB MAR APR MAY JUN JUL AUG SEP OCT NOV DEC TOTAL ,362 36, , ,742 42, , ,466 25, , ,721 26, , ,922 36, , ,509 61,780 1, , ,339 37, , ,492 39, , ,910 4, , ,001 5, , ,594 16, , ,706 29, , ,585 5, , ,842 8, , ,379 15, , ,327 26, , ,518 26, , ,277 18, , ,547 28, , ,341 36, , ,675 14, , ,087 6, , ,655 50, , ,066 59, , , , , ,773 92, , , , ,147 Total ,199,140 2,770,339 87,274 9,456 3, ,070, Year Average 3 63,935 61, ,
112 TABLE 72 MONTHLY COUNT OF COHO SALMON McNARY DAM: YEAR JAN FEB MAR APR MAY JUN JUL AUG SEP OCT NOV DEC TOTALS* , , , , , , , , , , , , , , , , , , , , ,492 4,712 27, ,010 36,260 2,248 39, ,643 45,497 6,576 53, ,576 31,161 1,662 36, ,828 4,603 39, ,433 38,747 4,455 45, ,768 14,452 1,396 17, ,160 10,052 2,534 13, , , ,201 1,965 7, ,698 1,648 4, ,445 7,459 2,313 20, ,058 2, , , , , , , , , , ,040 4, ,
113 TABLE 72 (Continued) MONTHLY COUNT OF COHO SALMON McNARY DAM; YEAR JAN FEB MAR APR MAY JUN JUL AUG SEP OCT NOV DEC TOTALS* , , , ,043 1,305 3, ,007 1,051 2, , , , , , , , , , , ,480 6, ,931 1,997 4, ,947 3,896 11, ,631 13,040 24, ,765 1,417 3, ,788 8, , ,954 6, , ,327 8, , ,893 5, , ,263 11, , ,588 7,155 21, ,193 16,626 19,451 37, ,555 5,480 15, ,682 18,705 44, ,779 2, ,801 TOTAL , , ,953 6, , Year Average ,646 9,302 23,542 *Jacks included 103
114 TABLE 73 MONTHLY COUNT OF STEELHEAD McNARY DAM: YEAR JAN FEB MAR APR MAY JUN JUL AUG SEP OCT NOV DEC TOTAL ,569 2, ,628 20,939 26,944 11,627 2,937 1,604 75, ,279 1, ,257 36,035 17,463 16,941 2, , ,365 1, ,440 14,492 8,245 6,787 2,349 42, , ,100 28,926 34,478 20, , , ,265 9,967 6,535 50,229 17,415 87, , ,508 32,872 49,542 14, , ,579 1, ,475 22,443 51,749 10,505 96, ,281 7,469 11,428 64,521 17, , , ,108 11,321 28,288 98,042 22, , ,751 2,639 8,252 26,282 47,982 25, , , ,602 25,918 53,180 10, , , ,749 31,155 54,450 19, , , ,476 18,241 26,062 71,180 24, , ,434 1, ,771 14,894 32,310 22,009 77, ,451 3, ,058 22,268 61,167 15, , ,304 1, ,668 13,641 35,836 14,729 76, ,347 1, ,183 15,236 39,150 7,502 69, ,931 21,324 62,083 15, , , ,155 20,548 46,393 16,587 93, , ,898 11,121 32,701 9,606 64, ,093 5,242 8,648 6,706 26, ,623 6,708 9,329 2,928 23, ,372 1,949 5,772 16,145 22,423 5,403 54, , ,916 13,132 7,833 43,792 17,322 87, , ,832 3,444 4,863 15,627 5,708 1,299 34, ,955 9,970 14,648 15,580 3,251 50, ,753 3, ,740 14,431 27,706 12,776 2,774 66, , ,212 12,839 19,961 15,652 2,294 61, ,530 1, ,279 12,621 36,282 17,477 75, , ,746 25,821 70,369 19, , , ,165 14,944 68,837 33,608 1, , ,583 6,483 1,383 2,949 13,818 46,632 87,026 28, ,
115 TABLE 73 (Continued) MONTHLY COUNT OF STEELHEAD McNARY DAM: YEAR JAN FEB MAR APR MAY JUN JUL AUG SEP OCT NOV DEC TOTALS* ,282 1, ,193 27,563 32,339 74,769 54, , , ,658 35,661 59,326 33, , ,176 1,095 2,117 11,609 25,875 69,259 37, , , ,921 16,002 20,819 87,722 40, , , ,489 9,105 10,368 33,452 37,233 95, , ,921 17,752 78,363 46,941 9,388 2, , , ,921 10,989 15, ,626 35, , , ,197 9,692 10,003 35,287 30,222 93, , ,169 7,436 5,468 40,871 36,525 94, ,042 21,720 45,237 37, , ,726 34,385 50,723 28, , , ,241 10,174 19,917 58,210 38, , , ,391 6,372 4,040 38,324 47,978 99, ,175 27,592 35,243 12,672 84, ,901 16,311 23,148 59,803 28, , , ,741 46,981 50, , , , , ,957 29,979 48, ,936 79, , ,696 1, ,298 20,439 15, ,321 51,722 6,307 1, , ,316 1, ,901 14,376 10, ,387 37,931 4,348 2, , , ,669 17,371 19, ,198 63,710 7, , ,388 2, ,272 9,214 14, ,009 52,826 17,808 2, , ,155 1, ,616 13,232 32, ,015 50,339 4,805 1, , , ,342 27,375 26, ,078 40, , , ,108 20,407 85, ,948 92, , , ,668 51,028 39, ,146 43, , , ,533 94,372 87,138 43, , ,009 1, ,744 18,373 33,983 62,318 28,580 4,931 2, ,018 Total 1, , ,742 41,767 80, ,735 1,384,804 3,760,207 1,737,737 74,211 17,392 7,969, Year Avg. 1, ,233 20,935 37, ,256 50, ,
116 TABLE 74 NIGHT COUNTS OF LAMPREY AT MCNARY DAM JUL AUG SEP JUL AUG SEP JUL AUG SEP JUL AUG SEP Day Day Day Day TOTALS TOTALS TOTALS TOTALS Note: video counting for night lamprey passage at McNaryDam (July 1 - September 30) Not included in daytime count totals for lamprey. 106
117
118 ICE HARBOR DAM FISH COUNTING SCHEDULE 1 January 31 March No counting 1 April 31 October Visual counting daily from hours PST 1 November 31 December No counting FISH LADDER OPERATING SCHEDULE North Ladder 1 January 27 January Ladder in service 28 January 22 February Ladder dewatered for annual maintenance 23 February 31 December Ladder in service South Ladder 1 January 2 January Ladder in service 3 January 26 January Ladder dewatered for annual maintenance 27 January 31 December Ladder in service FISHWAY ACTIVITIES Water temperatures were recorded hourly from both fish ladder exit pools and the downstream end of the juvenile collection channel. Hourly readings were taken June to October. The RSW operated 1 April until the end of the spill season 31 August. The juvenile fish facility was operated for juvenile fish bypass and adult fallbacks from 1 April to 18 December. Juvenile fish were sampled April 2 June 28. Modifications to aid lamprey passage were made at both the north and south shore adult fish ladders. The University of Idaho and the University of California at Davis monitored lamprey passage by video in the adult fish ladders. Pacific Northwest National Laboratory conducted pressure effects on fish tagging methods. Pacific Northwest National Laboratory conducted noise testing in the tailrace for hydro acoustic tagging research. 108
119 MONTHLY TOTALS OF SALMONIDS, SHAD, LAMPREY, STURGEON, AND BULL TROUT COUNTED OVER ICE HARBOR DAM 2012 SPECIES JAN FEB MAR APR MAY JUN JUL AUG SEP OCT NOV DEC TOTAL CHINOOK* ,407 22,704 3,337 4,531 51,132 5, ,625 STEELHEAD 2, ,875 5,820 64,613 28, ,269 SOCKEYE COHO* 2 2, ,985 PINK TOTAL 2,599 63,673 23,581 6,593 10, ,193 34, ,335 SHAD 0 66, ,608 1, ,936 LAMPREY STURGEON 0 BULL TROUT 0 *Jacks included TABLE
120 JANUARY TABLE 76 DISCHARGE AND WATER QUALITY DATA ICE HARBOR PROJECT 2012 FEBRUARY MARCH DISCH SPILL TURBIDITY DISCH SPILL TURBIDITY DISCH SPILL TURBIDITY DATE KCFS KCFS SECCHI DEG F DATE KCFS KCFS SECCHI DEG F DATE KCFS KCFS SECCHI DEG F Jan Feb Mar Jan Feb Mar Jan Feb Mar Jan Feb Mar Jan Feb Mar Jan Feb Mar Jan Feb Mar Jan Feb Mar Jan Feb Mar Jan Feb Mar Jan Feb Mar Jan Feb Mar Jan Feb Mar Jan Feb Mar Jan Feb Mar Jan Feb Mar Jan Feb Mar Jan Feb Mar Jan Feb Mar Jan Feb Mar Jan Feb Mar Jan Feb Mar Jan Feb Mar Jan Feb Mar Jan Feb Mar Jan Feb Mar Jan Feb Mar Jan Feb Mar Jan Feb Mar Jan Mar Jan Mar AVG AVG AVG
121 TABLE 77 MONTHLY FISH PASSAGE SUMMARY REPORT U.S. ARMY ENGINEER DISTRICT, PORTLAND ICE HARBOR PROJECT - FISH COUNTS APRIL 2012 CHINOOK ADULT CHINOOK COHO COHO TOTAL unclipped DISCH SPILL TURBIDITY DATE SPRING SUMMER FALL JACK ADULT JACK SOCKEYE STEELHEAD STEELHEAD PINK SHAD LAMPREY STURGEON KCFS KCFS SECCHI DEG F Apr Apr Apr Apr Apr Apr Apr Apr Apr Apr Apr Apr Apr Apr Apr Apr Apr Apr Apr Apr Apr Apr Apr Apr Apr Apr Apr Apr Apr Apr TOTAL , AVG Note: Visual counts occurred April 1 through October 31. The counts are 16-hour counts and occurred between the hours of PST. South shore ladder was counted by direct observation while the north shore ladder was by closed circuit TV. Official Spring Chinook run started April
122 TABLE 78 MONTHLY FISH PASSAGE SUMMARY REPORT U.S. ARMY ENGINEER DISTRICT, PORTLAND ICE HARBOR PROJECT - FISH COUNTS MAY 2012 CHINOOK ADULT CHINOOK COHO COHO TOTAL unclipped DISCH SPILL TURBIDITY DATE SPRING SUMMER FALL JACK ADULT JACK SOCKEYE STEELHEAD STEELHEAD PINK SHAD LAMPREY STURGEON KCFS KCFS SECCHI DEG F May May May May May May May May May May May May 12 1, May 13 2, May 14 4, May 15 7, May 16 6, May 17 4, May 18 2, May 19 4, May 20 4, May 21 3, May 22 2, May 23 1, May May 25 1, May May 27 1, May 28 1, May May May TOTAL 61,089 2, AVG RUN YEAR CHINOOK CHINOOK unclipped TOTALS TO DATE ADULT JACK STEELHEAD STEELHEAD SPRING 61,573 2,322 2,377 1,
123 TABLE 79 MONTHLY FISH PASSAGE SUMMARY REPORT U.S. ARMY ENGINEER DISTRICT, PORTLAND ICE HARBOR PROJECT - FISH COUNTS JUNE 2012 CHINOOK ADULT CHINOOK COHO COHO TOTAL unclipped DISCH SPILL TURBIDITY DATE SPRING SUMMER FALL JACK ADULT JACK SOCKEYE STEELHEAD STEELHEAD PINK SHAD LAMPREY STURGEON KCFS KCFS SECCHI DEG F Jun Jun 2 1, Jun Jun Jun Jun Jun Jun Jun 9 1, Jun 10 1, Jun Jun Jun Jun Jun Jun Jun Jun Jun Jun Jun , Jun , Jun , Jun , Jun , Jun , Jun , Jun , Jun , Jun , TOTAL 10,384 10,782 1, ,547 1 AVG , RUN YEAR CHINOOK CHINOOK unclipped TOTALS TO DATE ADULT JACK SOCKEYE STEELHEAD STEELHEAD SHAD LAMPREY SPRING 71,957 2, ,193 1,212 66,547 1 SUMMER 10, TOTAL 82,739 3,
124 TABLE 80 MONTHLY FISH PASSAGE SUMMARY REPORT U.S. ARMY ENGINEER DISTRICT, PORTLAND ICE HARBOR PROJECT - FISH COUNTS JULY 2012 CHINOOK ADULT CHINOOK COHO COHO TOTAL unclipped DISCH SPILL TURBIDITY DATE SPRING SUMMER FALL JACK ADULT JACK SOCKEYE STEELHEAD STEELHEAD PINK SHAD LAMPREY STURGEON KCFS KCFS SECCHI DEG F Jul , Jul , Jul , Jul , Jul , Jul , Jul , Jul , Jul , Jul , Jul , Jul , Jul , Jul , Jul , Jul , Jul , Jul , Jul Jul Jul Jul Jul Jul Jul Jul Jul Jul Jul Jul Jul TOTAL 2, , , AVG , RUN YEAR CHINOOK CHINOOK unclipped TOTALS TO DATE ADULT JACK SOCKEYE STEELHEAD STEELHEAD SHAD LAMPREY SPRING 71,957 2, ,068 2, , SUMMER 13,699 1,375 TOTAL 85,656 4,
125 TABLE 81 MONTHLY FISH PASSAGE SUMMARY REPORT U.S. ARMY ENGINEER DISTRICT, PORTLAND ICE HARBOR PROJECT - FISH COUNTS AUGUST 2012 CHINOOK ADULT CHINOOK COHO COHO TOTAL unclipped DISCH SPILL TURBIDITY DATE SPRING SUMMER FALL JACK ADULT JACK SOCKEYE STEELHEAD STEELHEAD PINK SHAD LAMPREY STURGEON KCFS KCFS SECCHI DEG F Aug Aug Aug Aug Aug Aug Aug Aug Aug Aug Aug Aug Aug Aug Aug Aug Aug Aug Aug Aug Aug Aug Aug Aug Aug Aug Aug Aug Aug Aug Aug TOTAL 483 3, ,820 1,680 1, AVG RUN YEAR CHINOOK CHINOOK COHO COHO unclipped TOTALS TO DATE ADULT JACK ADULT JACK SOCKEYE STEELHEAD STEELHEAD SHAD LAMPREY SPRING 71,957 2, ,888 3, , SUMMER 14,182 1,481 FALL 3, TOTAL 89,271 5,
126 TABLE 82 MONTHLY FISH PASSAGE SUMMARY REPORT U.S. ARMY ENGINEER DISTRICT, PORTLAND ICE HARBOR PROJECT - FISH COUNTS SEPTEMBER 2012 CHINOOK ADULT CHINOOK COHO COHO TOTAL unclipped DISCH SPILL TURBIDITY DATE SPRING SUMMER FALL JACK ADULT JACK SOCKEYE STEELHEAD STEELHEAD PINK SHAD LAMPREY STURGEON KCFS KCFS SECCHI DEG F Sep Sep Sep 3 1, Sep 4 1, Sep 5 1, , Sep 6 1, , Sep 7 1, , Sep 8 1, , Sep 9 1, , Sep 10 1, , Sep 11 1, , Sep 12 1, , Sep 13 1, , Sep 14 1, , Sep 15 1, , Sep 16 1, , Sep 17 1, , Sep 18 1, , Sep 19 1, , Sep 20 1,862 1, , Sep 21 1, , Sep 22 1, , Sep , Sep 24 1, , Sep , Sep , Sep , Sep , Sep , Sep , TOTAL 32,707 18,425 2, ,613 16, AVG , RUN YEAR CHINOOK CHINOOK COHO COHO unclipped TOTALS TO DATE ADULT JACK ADULT JACK SOCKEYE STEELHEAD STEELHEAD PINK SHAD LAMPREY SPRING 71,957 2,905 2, ,501 19, , SUMMER 14,182 1,481 FALL 35,839 19,235 TOTAL 121,978 23,
127 TABLE 83 MONTHLY FISH PASSAGE SUMMARY REPORT U.S. ARMY ENGINEER DISTRICT, PORTLAND ICE HARBOR PROJECT - FISH COUNTS OCTOBER 2012 CHINOOK ADULT CHINOOK COHO COHO TOTAL unclipped DISCH SPILL TURBIDITY DATE SPRING SUMMER FALL JACK ADULT JACK SOCKEYE STEELHEAD STEELHEAD PINK SHAD LAMPREY STURGEON KCFS KCFS SECCHI DEG F* Oct , Oct , Oct Oct , Oct , Oct , Oct Oct Oct Oct , Oct Oct , Oct , Oct , Oct , Oct , Oct Oct Oct Oct Oct Oct Oct Oct Oct Oct Oct Oct Oct Oct Oct TOTAL 2,707 2, ,768 7, AVG RUN YEAR CHINOOK CHINOOK COHO COHO unclipped TOTALS TO DATE ADULT JACK ADULT JACK SOCKEYE STEELHEAD STEELHEAD PINK SHAD LAMPREY SPRING 71,957 2,905 2, ,269 27, , SUMMER 14,182 1,481 FALL 38,546 21,554 TOTAL 124,685 25,940 Note: Visual counts occurred April 1 through October 31. The counts are 16-hour counts and occurred between the hours of PST. South shore ladder was counted by direct observation while the north shore ladder was by closed circuit TV. 117
128 NOVEMBER TABLE 84 DISCHARGE AND WATER QUALITY DATA ICE HARBOR PROJECT DECEMBER DISCH SPILL TURBIDITY DISCH SPILL TURBIDITY DATE KCFS KCFS SECCHI DEG F DATE KCFS KCFS SECCHI DEG F Nov Dec Nov Dec Nov Dec Nov Dec Nov Dec Nov Dec Nov Dec Nov Dec Nov Dec Nov Dec Nov Dec Nov Dec Nov Dec Nov Dec Nov Dec Nov Dec Nov Dec Nov Dec Nov Dec Nov Dec Nov Dec Nov Dec Nov Dec Nov Dec Nov Dec Nov Dec Nov Dec Nov Dec Nov Dec Nov Dec Dec AVG AVG
129 TABLE 85 YEAR CHINOOK* STEELHEAD SOCKEYE COHO* TOTALS* , , , , ,190 74,539 1,118 1, , ,097 58,860 1,276 2, , ,233 62, , ,882 65, , ,930 44, , , ,681 82,383 1,165 6, , ,514 63, , , ,698 53, , , ,248 67, , , ,632 63, , , ,821 38, , , ,444 12, ,334 46, ,686 16, ,559 49, ,556 23, ,991 63, ,514 54, , , ,352 27, , ,929 23, , ,717 50, , ,092 41, , ,646 73, , ,259 88, , ,757 94, , , , , , , , ,477 74, , ,066 99, , , , , ,841 54, , , , , , , , ,991 73, , ,577 51, , ,990 92, , , , , , , , ,117 85, , ,331 84, , , , , , , , , , , , , , , , , , , , , , , , , , , , , , , , , , , , , , , , , ,959 1,302 1, , , ,805 1,141 6, , , , , ,332 Totals 3,452,958 5,260,125 15,208 76,749 8,805, Year Average 128, , , ,230 *Jacks included YEARLY TOTALS OF SALMONIDS COUNTED OVER ICE HARBOR DAM These counts include the extended season videotaped counts that were made between 0600 and 1600 hours in November and December for the count seasons,
130 TABLE 86 MONTHLY COUNT OF CHINOOK SALMON ICE HARBOR DAM SPRING SUMMER FALL 1 APR- 12 JUN- 12 AUG- YEAR JAN FEB MAR APR MAY JUN JUL AUG SEP OCT NOV DEC TOTAL* 11 JUN 11 AUG 31 OCT ,579 28,951 23,250 8,315 3,547 20,578 7,081 94,301 33,613 30,639 30, ,434 21,790 14,001 7,591 1,415 9,342 2, ,190 26,778 20,875 13, ,048 19,611 5,409 18,832 2,161 8,159 1, ,097 24,304 24,696 11, ,677 9,649 5,072 10, ,318 2, ,233 12,178 14,701 12, ,382 19,294 10,611 7,166 1,933 10,756 2,740 75,882 43,881 16,983 15, ,973 18,137 9,020 22, ,947 6,815 84,930 35,593 30,315 19, ,595 41,398 12,119 17,751 3,433 16,588 5, ,681 44,773 29,531 24, ,181 24,918 12,861 2,369 12,027 3, ,514 52,090 30,917 17, ,167 33,881 12,338 8,185 1,747 7,702 1, ,698 47,931 19,382 10, ,104 25,089 19,265 13, ,960 1,593 70,248 32,638 26,606 11, ,535 34,734 7,544 15,177 1,869 6,089 2,684 82,632 50,350 22,846 9, ,277 23,627 10,925 4, ,657 1,241 81,821 60,639 12,829 8, ,670 5,315 6, , ,444 19,361 10,269 2, ,314 17,796 5,817 3, , ,686 21,401 7,727 2, ,146 19,269 8,544 3, , ,556 25,056 10,026 1, ,003 17,626 9,328 3, , ,514 44,421 10,337 1, ,891 29,333 9,999 4, , ,352 49,303 10,440 1, ,731 6,528 2,234 1, , ,929 9,247 2,608 2, ,678 7,321 2,285 1, , ,717 9,668 3,305 1, ,744 8,542 2,884 1, , ,092 16,167 3,814 2, ,543 4,522 2, , ,646 14,600 4,527 3, ,925 9,418 4,132 1, , ,259 12,602 4,922 2, ,292 5,353 1, , ,757 9,183 6,307 2, ,245 18,334 6,885 1, ,414 3,263 47,981 33,527 5,290 9, ,764 22,025 8,299 1, ,664 2,021 52,615 39,087 7,745 5, ,141 18,821 6,550 2, ,089 2,110 47,477 32,083 6,982 8, ,274 17,196 8,609 1, ,621 1,760 48,066 34,394 7,790 5, ,307 11,724 4,946 1, ,917 1,421 27,234 17,029 4,215 5, ,578 12,166 5,353 1, ,314 1,773 31,841 20,730 5,794 5, ,639 7,953 5,367 2, ,053 1,907 23,175 11,288 5,861 6, ,462 12,001 5,791 1, ,716 1,634 36,021 26,114 4,377 5, ,776 15,879 8,705 1, , ,991 24,935 6,919 3, ,268 1, ,693 1,257 7,577 3,472 1,003 3, , ,920 1,931 7,990 1, , ,254 3,954 1, , ,419 7,671 4,086 4, ,442 30,332 14,678 2, ,502 1, ,412 41,473 9,318 4, ,850 7,285 6,001 1, ,324 3, ,117 12,564 5,777 7, ,717 5,659 1, ,283 2, ,331 8,008 5,211 10, ,749 29,916 9,877 2,076 1,928 9,763 4, ,154 48,278 7,420 16, ,883 55,788 26,709 4,268 1,327 18,315 4, , ,199 17,667 23, ,016 71,511 33,555 5,750 2,752 15,874 2, ,507 87,033 29,044 21, ,343 34,581 28,636 5,732 1,286 23,445 7, ,329 86,190 25,344 31, ,168 37,934 19,580 4, ,998 4, ,218 81,752 16,185 32, ,763 20,798 14,089 2,323 1,389 14,672 3,327 58,361 29,306 9,817 19, ,660 11,042 2,438 1,534 11,976 3,822 52,501 26,309 9,085 17, ,277 27,506 11,597 3,167 1,984 17,456 4,118 69,106 35,355 10,599 23, ,447 45,174 34,258 5,381 3,461 26,145 4, ,007 60,899 28,657 33, ,173 65,190 40,728 9,465 10,549 49,471 3, ,349 83,658 33,256 63, ,517 66,010 34,208 6,921 5,381 45,279 8, , ,235 33,086 58, ,309 38,699 12,109 5,817 39,184 7, ,586 87,467 39,136 50, ,407 22,704 3,337 4,531 51,132 5, ,625 74,862 15,663 60,100 TOTAL ,256 1,273, , ,915 75, , ,072 3, ,452,958 1,992, , , Year Average 12,258 45,657 25,554 5,497 3,684 30,576 5, ,417 67,303 22,083 39,018 *Jacks included The 1996 through 2002 count seasons were extended to include video counts made between 0600 and 1600 hours daily from November 1 through December
131 TABLE 87 MONTHLY COUNT OF STEELHEAD ICE HARBOR DAM YEAR JAN FEB MAR APR MAY JUN JUL AUG SEP OCT NOV DEC TOTALS , ,384 7,450 75,924 20, , ,157 6,514 35,382 24,070 4, , , ,596 9,462 34,435 7,357 1, , , ,739 4,497 33,595 13,522 3,803 62, , ,383 2,517 40,185 18,329 65, , ,914 20,861 44, ,558 2, ,107 45,552 17,270 3, , ,971 2, ,348 5,715 27,219 14,953 3, , ,597 1, ,620 7,611 30,101 8,290 1, , , ,064 2,996 42,481 15,034 67, , ,062 6,503 34,134 17,336 63, , ,785 2,699 22,021 9,155 38, ,482 2,202 3,661 3,748 12, ,223 3,878 6,816 3,252 16, ,714 5,138 11,141 5,077 23, ,654 3,017 30,610 16,326 54, ,308 2,907 15,094 6, , ,995 1,778 6,136 9,717 2,325 23, ,420 2, ,303 4,333 22,064 15,424 2,279 50, , ,305 1,431 16,563 16,669 1,849 41, ,471 1, ,564 8,895 30,574 27,007 73, , ,773 9,875 48,519 25,121 88, , ,103 4,554 50,638 31,980 94, ,892 7, ,070 14,468 75,378 25, , ,561 1, ,600 8,679 63,598 60, , , ,292 4,972 28,491 35,103 74, , ,251 5,955 46,838 37,554 99, , ,399 8,916 80,799 48, , , ,631 2,000 18,728 28,206 54, , ,254 1,275 55,447 61, , , ,190 8,137 89,281 56, , , ,896 8,086 21,614 29,061 73, , ,295 3,162 16,702 24,985 51, ,699 14,521 39,494 32,207 92, ,427 15,391 48,722 28,657 2,303 1, , , ,323 11,522 40,238 37,036 8, , , ,226 3,114 25,408 43,844 5,400 2,078 85, ,784 16,120 40,424 18,887 2,809 1,087 84, ,202 11,684 65,713 33,899 5, , , ,682 17,607 27, ,208 68,837 22,449 5, , , ,760 30,321 87,357 66,151 8, , ,201 1, ,128 11,558 12, ,101 50, , ,483 1, ,467 9,875 6, ,826 37, , ,379 1, ,364 4,619 11,902 76,394 59, , ,181 2, ,797 7,265 67,556 42, , ,001 2, ,743 11,723 83,713 50, , , ,056 20,872 97,545 36, , , ,218 13,616 43, ,918 98, , , ,431 29,670 25, ,546 40, , , ,931 55,460 86,211 43, , , ,875 5,820 64,613 28, ,269 Totals , ,917 22,715 25, , ,673 2,633,622 1,573,220 81,529 14,043 5,260, Year Average 2, ,374 20,139 97,142 48, ,400 The 1996 through 2002 count seasons were extended to include video counts made between 0600 and 1600 hours daily, November 1 to December
132
133 LOWER MONUMENTAL DAM FISH COUNTING SCHEDULE 1 Apr 31 Oct Visual counting daily hours PST FISH LADDER OPERATING SCHEDULE North Ladder 1 Jan 3 Jan Ladder in service. 3 Jan 7 Feb Ladder dewatered for annual maintenance. 7 Feb 31 Dec Ladder in service. South Ladder 1 Jan 26 Jan Ladder in service. 26 Jan 27 Feb Ladder dewatered for annual maintenance. 27 Feb 31 Dec Ladder in service. FISHWAY ACTIVITIES Water temperatures were recorded hourly from north and south fish ladder exit pools and the downstream end of the primary dewaterer. Hourly readings were taken from June 20 to October 18. The purpose is to determine if summer spill has any effects on exit pool temperatures. All fish pumps were out of service from 1 January through 15 February. Additionally, fish pump 2 was out of service Feb 15 Apr 18 (misaligned diffuser), Aug (failed thrust pump cooling water flow meter), and Nov 21- present (shaft realignment and replacement of the bearing housing). Lamprey passage improvements were constructed in the upper fish ladder weirs during the last winter outage. These improvements included ramping the downstream access to raised orifices as well as excavating approximately 1.5 inch high by 12 inch wide orifices at the floor / weir intersection. These improvements allow adult lamprey an easier attachment transition through this challenging ladder section. The juvenile fish facility was operated for juvenile fish transport/bypass and adult fallbacks from 1 April to 17 December. LoMo s RSW was in service as per requirements of 2012 operating year. 123
134 TABLE 88 MONTHLY TOTALS OF SALMONIDS, LAMPREY, STURGEON, AND BULL TROUT COUNTED OVER LOWER MONUMENTAL DAM 2012 SPECIES JAN FEB MAR APR MAY JUN JUL AUG SEP OCT NOV DEC TOTAL CHINOOK* ,645 23,507 4,218 4,103 47,126 5, ,661 STEELHEAD 3, ,960 4,550 55,979 33, ,523 SOCKEYE COHO* 0 1, ,501 PINK 0 TOTAL 3,392 60,066 24,060 7,614 8, ,812 40, ,171 LAMPREY STURGEON 0 BULL TROUT *Jacks included 124
135 TABLE 89 DISCHARGE AND WATER QUALITY DATA LOWER MONUMENTAL PROJECT 2012 JANUARY FEBRUARY MARCH DISCH SPILL TURBIDITY DISCH SPILL TURBIDITY DISCH SPILL TURBIDITY DATE KCFS KCFS SECCHI DEG F DATE KCFS KCFS SECCHI DEG F DATE KCFS KCFS SECCHI DEG F Jan Feb Mar Jan Feb Mar Jan Feb Mar Jan Feb Mar Jan Feb Mar Jan Feb Mar Jan Feb Mar Jan Feb Mar Jan Feb Mar Jan Feb Mar Jan Feb Mar Jan Feb Mar Jan Feb Mar Jan Feb Mar Jan Feb Mar Jan Feb Mar Jan Feb Mar Jan Feb Mar Jan Feb Mar Jan Feb Mar Jan Feb Mar Jan Feb Mar Jan Feb Mar Jan Feb Mar Jan Feb Mar Jan Feb Mar Jan Feb Mar Jan Feb Mar Jan Feb Mar Jan Mar Jan Mar AVG AVG AVG
136 TABLE 90 MONTHLY FISH PASSAGE SUMMARY REPORT U.S. ARMY ENGINEER DISTRICT, PORTLAND LOWER MONUMENTAL PROJECT - FISH COUNTS APRIL 2012 CHINOOK ADULT CHINOOK COHO COHO TOTAL unclipped BULL DISCH SPILL TURBIDITY DATE SPRING SUMMER FALL JACK ADULT JACK SOCKEYE STEELHEAD STEELHEAD PINK STURGEON TROUT LAMPREY KCFS KCFS SECCH DEG F Apr Apr Apr Apr Apr Apr Apr Apr Apr Apr Apr Apr Apr Apr Apr Apr Apr Apr Apr Apr Apr Apr Apr Apr Apr Apr Apr Apr Apr Apr TOTAL ,189 1, AVG Note: Official Spring Chinook run started April
137 TABLE 91 MONTHLY FISH PASSAGE SUMMARY REPORT U.S. ARMY ENGINEER DISTRICT, PORTLAND LOWER MONUMENTAL PROJECT - FISH COUNTS MAY 2012 CHINOOK ADULT CHINOOK COHO COHO TOTAL unclipped BULL DISCH SPILL TURBIDITY DATE SPRING SUMMER FALL JACK ADULT JACK SOCKEYE STEELHEAD STEELHEAD PINK STURGEON TROUT LAMPREY KCFS KCFS SECCH DEG F May May May May May May May May May May May May May 13 1, May 14 2, May 15 4, May 16 7, May 17 6, May 18 4, May 19 3, May 20 4, May 21 3, May 22 3, May 23 2, May 24 1, May 25 1, May 26 1, May May 28 1, May 29 1, May 30 1, May TOTAL 57,381 2, AVG. 1, RUN YEAR CHINOOK CHINOOK unclipped BULL TOTALS TO DATE ADULT JACK STEELHEAD STEELHEAD TROUT LAMPREY SPRING 57,583 2,265 3,610 1,
138 TABLE 92 MONTHLY FISH PASSAGE SUMMARY REPORT U.S. ARMY ENGINEER DISTRICT, PORTLAND LOWER MONUMENTAL PROJECT - FISH COUNTS JUNE 2012 CHINOOK ADULT CHINOOK COHO COHO TOTAL unclipped BULL DISCH SPILL TURBIDITY DATE SPRING SUMMER FALL JACK ADULT JACK SOCKEYE STEELHEAD STEELHEAD PINK STURGEON TROUT LAMPREY KCFS KCFS SECCH DEG F Jun 1 1, Jun 2 1, Jun Jun Jun Jun Jun Jun Jun Jun 10 2, Jun Jun Jun Jun 14 1, Jun Jun Jun Jun Jun Jun Jun Jun Jun Jun Jun Jun Jun Jun Jun Jun TOTAL 11,025 11,002 1, AVG RUN YEAR CHINOOK CHINOOK TOTALS TO DATE ADULT JACK unclipped SOCKEYE STEELHEAD STEELHEAD BULL TROUT LAMPREY SPRING 68,608 2, ,128 2, SUMMER 11, TOTAL 79,610 3,
139 TABLE 93 MONTHLY FISH PASSAGE SUMMARY REPORT U.S. ARMY ENGINEER DISTRICT, PORTLAND LOWER MONUMENTAL PROJECT - FISH COUNTS JULY 2012 CHINOOK ADULT CHINOOK COHO COHO TOTAL unclipped BULL DISCH SPILL TURBIDITY DATE SPRING SUMMER FALL JACK ADULT JACK SOCKEYE STEELHEAD STEELHEAD PINK STURGEON TROUT LAMPREY KCFS KCFS SECCH DEG F Jul Jul Jul Jul Jul Jul Jul Jul Jul Jul Jul Jul Jul Jul Jul Jul Jul Jul Jul Jul Jul Jul Jul Jul Jul Jul Jul Jul Jul Jul Jul TOTAL 3, ,960 1, AVG RUN YEAR CHINOOK CHINOOK TOTALS TO DATE ADULT JACK unclipped SOCKEYE STEELHEAD STEELHEAD BULL TROUT LAMPREY SPRING 68,608 2, ,088 3, SUMMER 14,591 1,483 TOTAL 83,199 4,
140 TABLE 94 MONTHLY FISH PASSAGE SUMMARY REPORT U.S. ARMY ENGINEER DISTRICT, PORTLAND LOWER MONUMENTAL PROJECT - FISH COUNTS AUGUST 2012 CHINOOK ADULT CHINOOK COHO COHO TOTAL unclipped BULL DISCH SPILL TURBIDITY DATE SPRING SUMMER FALL JACK ADULT JACK SOCKEYE STEELHEAD STEELHEAD PINK STURGEON TROUT LAMPREY KCFS KCFS SECCH DEG F Aug Aug Aug Aug Aug Aug Aug Aug Aug Aug Aug Aug Aug Aug Aug Aug Aug Aug Aug Aug Aug Aug Aug Aug Aug Aug Aug Aug Aug Aug Aug TOTAL 559 2, ,550 1, AVG RUN YEAR CHINOOK CHINOOK unclipped BULL TOTALS TO DATE ADULT JACK SOCKEYE STEELHEAD STEELHEAD TROUT LAMPREY SPRING 68,608 2, ,638 4, SUMMER 15,150 1,611 FALL 2, TOTAL 86,408 5,
141 TABLE 95 MONTHLY FISH PASSAGE SUMMARY REPORT U.S. ARMY ENGINEER DISTRICT, PORTLAND LOWER MONUMENTAL PROJECT - FISH COUNTS SEPTEMBER 2012 CHINOOK ADULT CHINOOK COHO COHO TOTAL unclipped BULL DISCH SPILL TURBIDITY DATE SPRING SUMMER FALL JACK ADULT JACK SOCKEYE STEELHEAD STEELHEAD PINK STURGEON TROUT LAMPREY KCFS KCFS SECCH DEG F Sep Sep Sep Sep Sep 5 1, Sep 6 1, Sep 7 1, , Sep , Sep 9 2, , Sep 10 1, , Sep , Sep , Sep 13 1,014 1, , Sep 14 1, , Sep 15 1, , Sep 16 1, , Sep , Sep 18 1, , Sep , Sep 20 1, , Sep 21 1,459 1, , Sep 22 1, , Sep , Sep , Sep , Sep , Sep , Sep , Sep , Sep , TOTAL 27,965 19,161 1, ,979 14, AVG , RUN YEAR CHINOOK CHINOOK COHO COHO unclipped BULL TOTALS TO DATE ADULT JACK ADULT JACK SOCKEYE STEELHEAD STEELHEAD TROUT LAMPREY SPRING 68,608 2,891 1, ,617 19, SUMMER 15,150 1,611 FALL 30,615 19,927 TOTAL 114,373 24,
142 TABLE 96 MONTHLY FISH PASSAGE SUMMARY REPORT U.S. ARMY ENGINEER DISTRICT, PORTLAND LOWER MONUMENTAL PROJECT - FISH COUNTS OCTOBER 2012 CHINOOK ADULT CHINOOK COHO COHO TOTAL unclipped BULL DISCH SPILL TURBIDITY DATE SPRING SUMMER FALL JACK ADULT JACK SOCKEYE STEELHEAD STEELHEAD PINK STURGEON TROUT LAMPREY KCFS KCFS SECCH DEG F Oct , Oct , Oct , Oct , Oct , Oct , Oct Oct , Oct Oct Oct Oct Oct , Oct , Oct Oct , Oct , Oct Oct , Oct Oct , Oct Oct Oct Oct Oct Oct Oct Oct Oct Oct TOTAL 2,903 2, ,906 9,381 5 AVG , RUN YEAR CHINOOK CHINOOK COHO COHO unclipped BULL TOTALS TO DATE ADULT JACK ADULT JACK SOCKEYE STEELHEAD STEELHEAD TROUT LAMPREY SPRING 68,608 2,891 2, ,523 28, SUMMER 15,150 1,611 FALL 33,518 22,883 TOTAL 117,276 27,
143 TABLE 97 DISCHARGE AND WATER QUALITY DATA LOWER MONUMENTAL PROJECT 2012 NOVEMBER DECEMBER DISCH SPILL TURBIDITY DISCH SPILL TURBIDITY DATE KCFS KCFS SECCHI DEG F DATE KCFS KCFS SECCHI DEG F Nov Dec Nov Dec Nov Dec Nov Dec Nov Dec Nov Dec Nov Dec Nov Dec Nov Dec Nov Dec Nov Dec Nov Dec Nov Dec Nov Dec Nov Dec Nov Dec Nov Dec Nov Dec Nov Dec Nov Dec Nov Dec Nov Dec Nov Dec Nov Dec Nov Dec Nov Dec Nov Dec Nov Dec Nov Dec Nov Dec Dec AVG AVG
144 YEAR CHINOOK* STEELHEAD SOCKEYE COHO* TOTALS ,700 71,436 1,127 6, , ,310 62, , , ,885 70, , , ,220 66, , ,557 39, , , ,728 15, , ,013 17, , ,395 21, , ,301 47, , ,835 20, , ,288 17, , ,885 34, , ,991 35, , ,965 62, , ,082 80, , ,866 88, , , , , , , , ,434 62, , ,262 84, , , , , ,215 44, , ,210 98, , , , , ,195 70, , ,219 49, , ,883 90, , ,606 96, , ,556 85, , ,537 66, , ,271 72, , , , , , , , , , , , , , , , , , , , , , , , , , , , , , , , , , , , , ,275 1,162 5, , , ,811 1,652 2, , , ,272 1,395 4, , , , , ,171 Total 2,797,202 4,492,481 10,558 48,367 7,348, Year Average 124, , , ,837 *Jacks included TABLE 98 YEARLY TOTALS OF SALMONIDS COUNTED OVER LOWER MONUMENTAL DAM Includes 2001 extended season counts for November and December PST. Includes 2002 extended season counts for February and March PST and November and December PST. Includes 2003 and 2004 extended season counts for January, February, and March PST and November and December PST. 134
145 TABLE 99 MONTHLY COUNT OF CHINOOK SALMON LOWER MONUMENTAL DAM YEAR JAN FEB MAR APR MAY JUN JUL AUG SEP OCT NOV DEC TOTALS* ,702 25,289 13,832 1,776 5,069 1, , ,194 32,623 15,818 9,369 1,720 5,178 1, , ,340 23,842 14, ,599 1,397 68, ,838 36,448 6,989 15,501 1,835 3, , ,168 31,973 11,282 4, , , ,796 4,904 7, , , ,421 6,648 4, , , ,995 19,292 7,731 3, , , ,125 17,093 7,884 3, , , ,324 30,067 8,941 3, , ,332 5,637 2, , ,008 5,198 2,318 1, , ,039 9,012 3,349 1, , , ,319 5,031 2, , , ,250 10,262 3,841 2, , , ,186 6,297 2, , ,360 20,572 7,303 1, ,451 3,070 42, ,893 25,454 7,436 1, ,786 2,071 50, ,706 21,166 5,492 2, ,625 1,767 42, ,451 19,823 7,851 1, , , ,924 4,858 1, , , ,830 12,127 5,197 1, ,205 1,081 28, ,537 5,491 1, ,177 1,017 18, ,529 10,822 5,001 1, , , ,848 16,154 9,720 2, , , ,448 1, ,308 1,124 7, ,435 1, ,183 2,212 7, ,836 4,442 1, , , ,493 26,966 16,833 2, ,174 1,297 51, ,325 6,626 5,095 1, ,418 2,579 21, ,551 4,951 1, ,499 2,893 20, ,018 30,132 11,068 2,469 1,367 8,950 4,957 68, ,119 60,247 32,422 6,261 1,472 16,390 4, , ,881 60,767 31,795 6,496 2,367 15,707 3, , ,435 31,906 28,381 6, ,255 6, , ,462 36,732 18,114 3, ,620 3, , ,174 18,726 13,028 2, ,215 3,248 52, ,659 12,916 3,541 1,816 12,534 6,006 54, ,143 27,277 13,221 5,238 1,804 17,407 6,243 73, ,468 43,772 37,105 7,801 3,334 24,325 4, , ,754 45,527 10,839 7,310 49,587 4, , ,522 70,028 39,285 9,253 2,937 44,326 11, , ,045 44,773 15,764 4,502 34,401 7, , ,645 23,507 4,218 4,103 47,126 5, ,661 Total ,214 1,095, , ,404 48, , ,591 1, ,796, Year Average 9,309 44,154 27,586 6,956 2,827 27,880 5, ,751 *Jacks included Includes 2001 extended season counts for November and December PST. Includes 2002 extended season counts for February and March PST and November and December PST. Includes 2003 and 2004 extended season counts for January, February, and March PST and November and December PST. 135
146 TABLE 100 MONTHLY COUNT OF STEELHEAD LOWER MONUMENTAL DAM YEAR JAN FEB MAR APR MAY JUN JUL AUG SEP OCT NOV DEC TOTALS ,525 9,235 5, ,141 6,410 26,647 15,195 4, , ,025 1,519 3,143 2, ,989 7,947 30,701 11,194 1, , ,404 1, ,199 2,992 42,438 18,018 70, , ,336 7,184 32,417 21,908 66, , ,060 3,505 21,241 9,923 39, , ,237 2,835 4,929 4,644 15, ,417 7,437 3,423 17, ,092 4,409 10,328 4,785 21, ,026 2,991 22,494 18,070 47, , ,522 10,477 5,354 20, ,314 1,937 4,898 8,856 17, , ,725 14,078 12,655 34, ,783 1,632 12,416 18,700 35, ,026 1, ,851 7,373 22,426 27,938 62, , ,027 10,101 40,004 26,264 80, , ,150 4,820 42,788 34,700 88, , ,888 10,086 63,734 26, , , ,082 7,751 46,876 58, , , ,531 4,692 20,766 31,708 62, , ,903 5,725 35,290 36,539 84, , ,364 8,093 63,026 50, , , ,804 1,579 14,209 24,238 44, , ,275 1,497 41,894 50,080 98, , ,890 7,223 68,606 49, , , ,367 8,197 16,146 30,228 2,461 70, , ,595 2,998 14,901 26,317 49, , ,074 10,424 38,890 35,397 90, ,199 12,413 47,234 32,596 96, , ,422 9,326 34,521 36,950 85, , ,361 1,835 19,892 40,269 66, ,652 11,170 37,899 20,405 72, ,741 9,045 61,072 35, , , ,874 19,045 26, ,517 76,474 23,900 8, , ,687 1,858 3,429 4, ,901 25,998 94,310 75,670 9,028 2, , ,686 5,325 1, ,704 8,122 93,190 60,813 3,945 1, , ,036 2,619 1, ,052 6,477 4,020 90,900 45,380 4,101 1, , ,062 5,193 7,445 70,701 68, , , ,392 7,778 63,849 57, , , ,735 8,657 77,612 58, , , ,664 21,947 97,562 49, , , ,358 12,112 23, , , , , ,377 19,765 25, ,728 53, , , ,342 45,999 82,453 47, , , ,960 4,550 55,979 33, ,523 Total 4,829 7,610 14, ,939 21,387 17, , ,905 2,101,156 1,561,212 49,239 14,375 4,492, Year Average 2, ,334 15,779 90,965 58, ,553 Includes 2001 extended season counts for November and December PST. Includes 2002, '03, and '04 extended season counts for January through March PST and November and December PST. 136
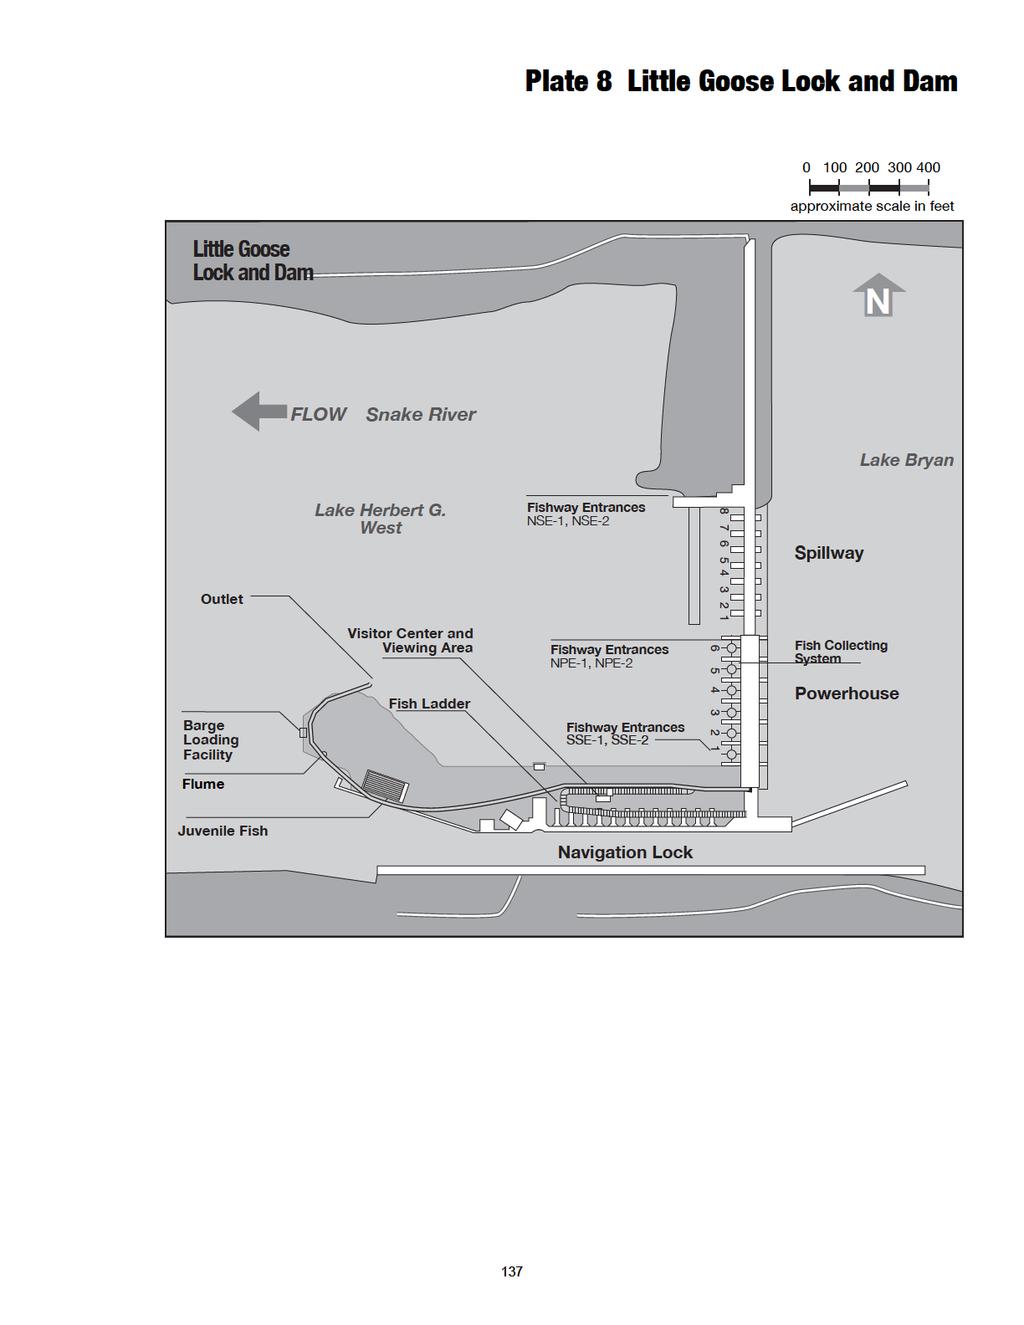
147
Appendix N. The 2006 Fish Passage Implementation Plan
 Appendix N The 2006 Fish Passage Implementation Plan 2006 Fish Passage Implementation Plan March 31, 2006 Background: The 2006 Fish Passage Implementation Plan describes the Corps plan for fish passage
2015 Fish Passage Plan
 March 1, 2015 2015 Fish Passage Plan Chapter 4 John Day Dam Table of Contents 1. FISH PASSAGE INFORMATION... 5 1.1. JUVENILE FISH.... 5 1.2. ADULT FISH.... 7 2. PROJECT OPERATIONS... 9 2.1. GENERAL....
Weekly Report #18 19
 Visit our Website at www.fpc.org Fish Passage Center Weekly Report #18 19 847 NE 19th Ave., Suite 250 Portland, OR 97232 (503) 833-3900 July 13, 2018 This Week s Highlights Water Supply Precipitation throughout
Weekly Report #18 16
 Visit our Website at www.fpc.org Fish Passage Center Weekly Report #18 16 847 NE 19th Ave., Suite 250 Portland, OR 97232 (503) 833-3900 June 22, 2018 This Week s Highlights Water Supply Precipitation throughout
On October 2, 2018, FPAC met via conference call for its weekly meeting. The following people participated in the meeting:
 FISH PASSAGE CENTER 847 NE 19 th Avenue, #250, Portland, OR 97232 Phone: (503) 833-3900 Fax: (503) 232-1259 www.fpc.org/ e-mail us at fpcstaff@fpc.org MEMORANDUM To: From: Fish Passage Advisory Committee
FISHWAY STATUS REPORT
 FISHWAY STATUS REPORT Date: 05/12/13 Inspection Period: 05/05-11/12 THE DALLES DAM The Dalles Project-Fisheries P.O. Box 564 The Dalles, OR 97058-9998 Phone: 541-506-3800 Fishways are inspected twice daily.
LAKE CHELAN ANNUAL FLOW AND WATER TEMPERATURE REPORT Final
 LAKE CHELAN ANNUAL FLOW AND WATER TEMPERATURE REPORT 2013 LICENSE ARTICLES 405 & 408 Final LAKE CHELAN HYDROELECTRIC PROJECT FERC Project No. 637 April 30, 2014 Public Utility District No. 1 of Chelan
Commercial-in-Confidence Ashton Old Baths Financial Model - Detailed Cashflow
 Year 0 1 2 3 4 5 6 7 8 9 10 11 12 13 Oct-16 Nov-16 Dec-16 Jan-17 Feb-17 Mar-17 Apr-17 May-17 Jun-17 Jul-17 Aug-17 Sep-17 Oct-17 2,038 2,922 4,089 4,349 6,256 7,124 8,885 8,885 8,885 8,885 8,885 8,885 9,107
Year to Date Summary. Average and Median Sale Prices
 A Publication of RMLS, The Source for Real Estate Statistics in Your Community Residential Review: Southwest Washington September 2018 Reporting Period September Residential Highlights Southwest Washington
COMPARISON OF FIXED & VARIABLE RATES (25 YEARS) CHARTERED BANK ADMINISTERED INTEREST RATES - PRIME BUSINESS*
 CHARTERED BANK ADMINISTERED INTEREST RATES - PRIME BUSINESS*") COMPARISON OF FIXED & VARIABLE RATES (25 YEARS) 2 Fixed Rates Variable Rates For Internal Use Only. FIXED RATES OF THE PAST 25 YEARS AVERAGE RESIDENTIAL MORTGAGE LENDING RATE - 5 YEAR* (Per cent) Year
COMPARISON OF FIXED & VARIABLE RATES (25 YEARS) 2 Fixed Rates Variable Rates For Internal Use Only. FIXED RATES OF THE PAST 25 YEARS AVERAGE RESIDENTIAL MORTGAGE LENDING RATE - 5 YEAR* (Per cent) Year
COMPARISON OF FIXED & VARIABLE RATES (25 YEARS) CHARTERED BANK ADMINISTERED INTEREST RATES - PRIME BUSINESS*
 CHARTERED BANK ADMINISTERED INTEREST RATES - PRIME BUSINESS*") COMPARISON OF FIXED & VARIABLE RATES (25 YEARS) 2 Fixed Rates Variable Rates FIXED RATES OF THE PAST 25 YEARS AVERAGE RESIDENTIAL MORTGAGE LENDING RATE - 5 YEAR* (Per cent) Year Jan Feb Mar Apr May Jun
COMPARISON OF FIXED & VARIABLE RATES (25 YEARS) 2 Fixed Rates Variable Rates FIXED RATES OF THE PAST 25 YEARS AVERAGE RESIDENTIAL MORTGAGE LENDING RATE - 5 YEAR* (Per cent) Year Jan Feb Mar Apr May Jun
Season Totals by Port for All Weeks
 Salmon Fishery Estimates for the Area from Cape Falcon to the Oregon/California Border No. Fish Harvested No. Fish Released Retained Catch Port Per Garibaldi 6,372 2,206 697 1,213 125 0.46 Pacific City
Total Production by Month (Acre Feet)
") Production by Month (acre-feet) 2008 2009 2010 2011 2012 2013 2014 2015 2016 January 25 339.10 228.90 249.50 297.99 243.06 327.14 247.66 212.37 February 234.00 218.80 212.10 241.52 245.82 279.08 234.16
Production by Month (acre-feet) 2008 2009 2010 2011 2012 2013 2014 2015 2016 January 25 339.10 228.90 249.50 297.99 243.06 327.14 247.66 212.37 February 234.00 218.80 212.10 241.52 245.82 279.08 234.16
2017 EXTENDED LOCK MAINTENANCE CLOSURE ON THE COLUMBIA SNAKE RIVER WATERWAY
 EXTENDED LOCK MAINTENANCE CLOSURE ON THE WATERWAY 2 2 2 8 11 12 12 13 12 13 12 Sheryl Carrubba Northwestern Division, Navigation Inland Waterways Users Board Meeting No. 84 19 July The views, opinions
*iiiii. May 31, 2017 VIA ELECTRONIC FILING
 *iiiii. PUBLIC UTILITY DISTRICT NO. I of CHELAN COUNTY P.O. Box 1231, Wenatchee, WA 98807-1231 327 N. Wenatchee Ave., Wenatchee, WA 98801 (509) 663-8121 Toll free 1-888-663-8121 www.chelanpud.org May 31,
Appendix E Water Supply Modeling
 Supply Modeling Modesto Irrigation District Treatment Plant Expansion Project Modeling I. Introduction The Modesto Irrigation District (MID) is situated adjacent to and north of the Tuolumne River. Over
McNary Northshore Fishway Hydro Project. History & Lessons Learned
 McNary Northshore Fishway Hydro Project History & Lessons Learned May 6, 2017 21 th Annual TECHNICAL SEMINAR Machines, Maintenance, and Management: Keeping Hydro Facilities Up and Running History & Lessons
ANCR CRU Statistics February 2007 to December 2007
 ANCR CRU Statistics February 2007 to December 2007 o Jan/07 Feb/07* Mar/07 Apr/07 May/07 Jun/07 Jul/07 Aug/07 Sep/07 Oct/07 Nov/07 Dec/07 Total notes data from Perimeter phone system unavailable prior
2017 Adjusted Count Report February 12, 2018
 A statewide multi-use trail user study and volunteer data collection program 2017 Adjusted Count Report February 12, 2018 The following report includes the final adjusted infrared (IR) counter data at
September 2016 Water Production & Consumption Data
 September 2016 Water Production & Consumption Data September 2016 monthly water production (288.48 AF) was lowest in at least 17 years. Monthly water production has increased slightly each month since
1999 Annual Report To the Oregon Department of Environmental Quality
 1999 Annual Report To the Oregon Department of Environmental Quality February 25, 2000 ODEQ Annual Report Table of Contents Introduction................................................................
Inventory Levels - All Prices. Inventory Levels - By Price Range
 Inventory Levels - All Prices Idaho Falls Bonneville Total 7-Apr-17 154 111 265 6-Apr-18 113 91 204-23% Inventory Levels - By Price Range 7-Apr-17 6-Apr-18 0-100,000 36 10 100,001-125,000 13 9 125,001-150,000
Inventory Levels - All Prices. Inventory Levels - By Price Range
 Inventory Levels - All Prices Idaho Falls Bonneville Total 3-Mar-17 152 108 260 2-Mar-18 109 78 187-28% Inventory Levels - By Price Range 3-Mar-17 2-Mar-18 0-100,000 41 6 100,001-125,000 19 8 125,001-150,000
Price Category Breakdown - February 2010
 SINGLE FAMILY RESIDENTIAL BREAKDOWN ruary 21 ruary Sales and Average Price Increase Annually TORONTO - Wednesday, March 3, 21 7.3 % 24.6 % 1.8 % 7.3%.2%.1 % Greater Toronto REALTORS reported 7,291 sales
IOWA MOLD TOOLING CO., INC. BOX 189, GARNER, IA TEL: IMT PART NUMBER
 CRANE LOG CALENDAR YEAR CRANE MODEL Daily Inspections Weekly Inspections Monthly Inspections Lubrication Record Maintenance Record Damage & Repair Record Modification Record Reference Specifications CRANE
The Peoples Gas Light and Coke Company
 History of Gas Charges Due to the Operation of Rider 2 (Cents per Therm) Factors for Transportation Customers (Riders FST, SST, P, CFY and AGG) Non- Total Standby Standby Aggregation Commodity Commodity
increase of over four per cent compared to the average of $409,058 reported in January 2010.
 SINGLE FAMILY RESIDENTIAL BREAKDOWN uary 211 26.8 % 1.7 % 7.%.4%.1 % Good Start to 211 TORONTO - February 4, 211 Greater Toronto REALTORS reported 4,337 transactions through the TorontoMLS system in uary
Date Event or Holiday :Sun, 2:Mon North Orchard Delong Preschool North Orchard Delong Preschool
 2018 6 1 1:Sun, 2:Mon 2018-2019 Date Event or Holiday Aug 16 Board Meeting 6pm Aug 23 Open House June 2018 July 2018 August 2018 Sep 06 Board Meeting 6pm Su M Tu W Th F Sa Su M Tu W Th F Sa Su M Tu W Th
April 10, Dear Customer:
 Dear Customer: April 10, Attached is the monthly water supply outlook and projected operations for Yellowtail Dam and Powerplant. If you have any questions or concerns, please feel free to call me at 406-247-7334
SNOHOMISH COUNTY PUBLIC UTILITY DISTRICT NO.1. Your Northwest renewables utility
 SNOHOMISH COUNTY PUBLIC UTILITY DISTRICT NO.1 Your Northwest renewables utility May 17, 2013 VIA ELECTRONIC FILING Kimberly D. Bose, Secretary Federal Energy Regulatory Commission (FERC) 888 First Street
ALBENI FALLS DAM AND LAKE PEND OREILLE
 ALBENI FALLS DAM AND LAKE PEND OREILLE Fall Public Meeting 237 237 237 217 217 217 200 200 200 0 0 0 163 163 163 131 132 122 Aug. 7, 2017 255 255 255 239 65 53 80 119 27 252 174.59 83 36 118 110 135 120
Inventory Levels - All Prices. Inventory Levels - By Price Range
 Inventory Levels - All Prices Idaho Falls Bonneville Total 3-Nov-17 198 128 326 2-Nov-18 155 134 289-11% Inventory Levels - By Price Range 3-Nov-17 2-Nov-18 0-100,000 17 11 100,001-125,000 15 9 125,001-150,000
Up and Down Months of the Stock Market
 Up and Down Months of the Stock Market 1926-2017 Positive years (66) in the stock market were not good all year long and losing years (24) were not losers throughout the year. Winning years produce losing
August 2018 MLS Statistical Report
 January February March April May June July August Septem October Novem Decem August 218 MLS Statistical Report Total Sales Overall, sales are down 3%; however, total volume sold is up 7% and Median Sale
Capacity Analysis Report. For. William E. Dunn Water Reclamation Facility 4111 Dunn Drive Palm Harbor, Florida 34683
 Capacity Analysis Report For William E. Dunn Water Reclamation Facility 4111 Dunn Drive Palm Harbor, Florida 34683 Florida Department of Environmental Protection Facility Identification No. FLA0128775
Action Requested From AMWG
 Action Requested From AMWG NONE, These Two Presentations Are For Information Transfer Only The information is derived from a multi-year synthesis research effort related to existing data on flow, sediment-transport
NEW HAMPSHIRE GAS CORPORATION WINTER PERIOD ORIGINAL FILING CONTENTS 3. CONVERSION OF GAS COSTS - GALLONS TO THERMS SCHEDULE A
 NEW HAMPSHIRE GAS CORPORATION COST OF GAS RATE FILING - DG 13- WINTER PERIOD 2013-2014 ORIGINAL FILING CONTENTS 1. TARIFF PAGE - COST OF GAS RATE 2. MARKED TARIFF PAGE - COST OF GAS RATE 3. CONVERSION
Bulk Storage Containers
 UCSB AST SPCC SELF-INSPECTION CHECKLIST Year: Responsible Department: Tank Location: Tank ID: Bulk Storage Containers Total tank capacity: Petroleum type and amount: Secondary containment type: (diesel,
Kelly Redmond Regional Climatologist, Western Regional Climate Center Atmospheric Sciences Division
 Kelly Redmond Regional Climatologist, Western Regional Climate Center Atmospheric Sciences Division Climate and the Colorado and Columbia River Basins Presented at The Aspen Global Change Institute June
Meridian Township Range Sections Seward 5N 4W 33,34 Seward 4N 4W 4,9
 ATTACHMENT A. RUSSIAN RIVER RESERVATION OF WATER APPLICATION. Page 1 LOCATION OF PROPOSED RESERVATION OF WATER Meridian Township Range Sections Seward 5N 4W 33,34 Seward 4N 4W 4,9 Russian River is located
Wheat Marketing Situation
 Wheat Marketing Situation Prepared by: Darrell L. Hanavan Executive Director Colorado Wheat Administrative Committee If you would like to receive an email when this report is updated, email gmostek@coloradowheat.org
University of Michigan Eco-Driving Index (EDI) Latest data: October 2017
 Latest data: October 2017") University of Michigan Eco-Driving Index () http://www.ecodrivingindex.org Latest data: October 2017 Developed and issued monthly by Michael Sivak and Brandon Schoettle Sustainable Worldwide Transportation
University of Michigan Eco-Driving Index () http://www.ecodrivingindex.org Latest data: October 2017 Developed and issued monthly by Michael Sivak and Brandon Schoettle Sustainable Worldwide Transportation
TABLE C-42. Sales and inventories in manufacturing and trade, [Amounts in millions of dollars] Manufacturing. Inventories Ratio 3.
![TABLE C-42. Sales and inventories in manufacturing and trade, [Amounts in millions of dollars] Manufacturing. Inventories Ratio 3.](/thumbs/80/81413912.jpg "TABLE C-42. Sales and inventories in manufacturing and trade, [Amounts in millions of dollars] Manufacturing. Inventories Ratio 3.") 1970 TABLE C-4. and inventories in manufacturing, 1947-69 Inyentories i 1947 1948 1949 1950 1951 195 1953 1954 1955 1956 1957 1958 1959 35,60 54,33 5,507 59,8 70,4 7,377,1 89,05 86,9 1.4 16,16 1,714,59
1970 TABLE C-4. and inventories in manufacturing, 1947-69 Inyentories i 1947 1948 1949 1950 1951 195 1953 1954 1955 1956 1957 1958 1959 35,60 54,33 5,507 59,8 70,4 7,377,1 89,05 86,9 1.4 16,16 1,714,59
LOCAL CLIMATOLOGICAL DATA
 ILLINOIS STATE WATER SURVEY DIVISION URBANA, ILLINOIS ISWS MP-21 Archive SWS0964 Illinois State Water Survey LOCAL CLIMATOLOGICAL DATA FDR HILLSBORO, IL. 1901-1962 LOCAL CLIMATOLOGICAL DATA 1901-1962 HILLSBORO
ENVIRONMENTAL & ENGINEERING SERVICES DEPARTMENT
 CITY OF LONDON ENVIRONMENTAL & ENGINEERING SERVICES DEPARTMENT WASTEWATER TREATMENT OPERATIONS VAUXHALL WASTEWATER TREATMENT PLANT 2013 ANNUAL REPORT FEBRUARY 2014 Vauxhall Wastewater Treatment Plant 2013
2014 Meteorological and Oceanographic Summary for the Bocas del Toro Research Station. Prepared by: Steven Paton
 0 2014 Meteorological and Oceanographic Summary for the Bocas del Toro Research Station Prepared by: Steven Paton 1 Introduction This is the second of a series of yearly reports summarising the past year
GAZIFÈRE INC. Prime Rate Forecasting Process 2017 Rate Case
 Overview A consensus forecast is used to estimate the prime rate charged by commercial banks. As the prime rate is subject to competitive pressures faced by individual lenders and is set on an individual
TRAFFIC VOLUME TRENDS
 Page 1 U. S. Department Transportation Federal Highway Administration Office Highway Policy Information TRAFFIC VOLUME TRENDS September Travel on all roads and streets changed by +2.5 (5.8 billion vehicle
2017 SC Producers Whole Farm Revenue Protection Expected Price Justification
 2017 SC Producers Whole Farm Revenue Protection Expected Price Justification RMA Projected Expected As of Average Futures Price Close As of RMA Projected Prices 4 Feb 2011 2015 % Differ 4 Feb Crop Contract
WIM #37 was operational for the entire month of September Volume was computed using all monthly data.
 SEPTEMBER 2016 WIM Site Location WIM #37 is located on I-94 near Otsego in Wright county. The WIM is located only on the westbound (WB) side of I-94, meaning that all data mentioned in this report pertains
CLIMATOLOGICAL SUMMARY
 DEPARTMENT OF REGISTRATION AND EDUCATION CTATP OF ILLINOIS ILLINOIS STATE WATER SURVEY DIVISION URBANA, ILLINOIS ISWS MP-19 Archive ISWS Illinois State Water Survey )CAL CLIMATOLOGICAL DATA MP-19 LOCAL
Algebra II Pacing Guide
 Unit 13: Exploring a Business Venture (10 days) 8 May 13 - May 24 n/a MISD Pacing Guide Date Range Unit 01: Introduction to Functions in 15 Aug. 21 - Sept. 11 Sept. 12 Unit 02: Absolute Value Functions,,
Presented by Eric Englert Puget Sound Energy September 11, 2002
 Results from PSE s First Year of Time of Use Program Presented by Eric Englert Puget Sound Energy September 11, 2002 Puget Sound Energy Overview 973,489 Total Electric Customers 908,949 are AMR Capable
VEHICLE / PEDESTRIAN COLLISIONS
 Info item No. 1 Crosswalk Safety Advisory Committee March 31, 2016 VEHICLE / PEDESTRIAN COLLISIONS HRM: January December 20 DISCLAIMER: All figures presented in this report reflect the information held
Units of Instruction MISD Pacing Guide Days Date Range Test Date
 MISD Pacing Guide Date Range Test Date Introduction: Processes of Investigations (1 day) Aug. 21 Unit 01: Matter (12 days) Aug. 22-Sept. 7 Sep. 10 Unit 02: Atomic Structure and the Periodic Table (15 days)
Civil Works Construction Cost Index System (CWCCIS)
") EM 1110-2-1304 31 March 2017 Amendment #1 Tables Revised as of 30 September 2017 Civil Works Construction Cost Index System (CWCCIS) EM 1110-2-1304 31 Mar 17 This Page Intentionally Left Blank DEPARTMENT
EM 1110-2-1304 31 March 2017 Amendment #1 Tables Revised as of 30 September 2017 Civil Works Construction Cost Index System (CWCCIS) EM 1110-2-1304 31 Mar 17 This Page Intentionally Left Blank DEPARTMENT
Regulation Update. Operating Committee September 12, PJM 2017
 Regulation Update Operating Committee September 12, 2017 Regulation Market Clearing Price *Data up to Aug 22 2 Mileage Ratio Mileage Ratio has increased since the new signal implementation Larger Utilization
Operational Overview. Operational Forum, 24 th March 2010
 Operational Overview Operational Forum, 24 th March 21 Weather Weather February 21 The cold weather continued throughout February with all but one day being colder than the 17-year seasonal normal CWV.
Revising the Historic Monthly Mean Niagara River Flow at Buffalo to Reflect Better Estimates of Maid-of-the-Mist Pool Outflows
 Revising the Historic Monthly Mean Niagara River Flow at Buffalo to Reflect Better Estimates of Maid-of-the-Mist Pool Outflows 1961-2007 Background The Niagara River flow at Buffalo is currently computed
NEU Electric and Natural Gas Price Update
 $ / MWH Jan-11 May-11 Sep-11 Sep-12 Jan-13 Electric: Short-Term Outlook The NYMEX Northern Illinois Hub 12-month forward price at the end of August 2016 for the September 2016 to August 2017 period was
2017 Meteorological and Oceanographic Summary for the Bocas del Toro Research Station. Prepared by: Steven Paton
 0 2017 Meteorological and Oceanographic Summary for the Bocas del Toro Research Station Prepared by: Steven Paton 1 Introduction This is the 5 th of a series of yearly reports summarising the past year
Local Climatological (Data Summary Molim, Illinois
 SWS Miscellaneous Publication 98-13 STATE OF ILLINOIS DEPARTMENT OF ENERGY AND NATURAL RESOURCES Local Climatological (Data Summary Molim, Illinois 1872-1992 by Audrey A. Bryan and Wayne Wendland Climatological
ANCR CRU Statistics Februa.. to December 2007
 ANCR CRU Statistics Februa.. to December 2007 Jan/07 Feb/07* Mar/07 Apr/07 May/07 Jun/07 Jul/07 Aug/07 Sep/07 Oct/07 Nov/07 Dec/07 Total notes Answered dato from Perimeter phone system unavailable prior
2013 / 2014 Revenue Comparison: OCTOBER
 CAR RENTAL GROSS REVENUES 2013 / Revenue Comparison: OCTOBER COMPANY 2013 incr./decr. % change Advantage 1,049,117.25 1,679,547.68 630,430.43 60.1% Alamo/National 5,448,360.80 8,262,318.28 2,813,957.48
FOR IMMEDIATE RELEASE
 Article No. 7761 Available on www.roymorgan.com Roy Morgan Unemployment Profile Monday, 8 October 2018 Unemployment down to 9.4% in September off two-year high Australian employment has grown solidly over
2016 Meteorological and Oceanographic Summary for the Bocas del Toro Research Station. Prepared by: Steven Paton
 0 2016 Meteorological and Oceanographic Summary for the Bocas del Toro Research Station Prepared by: Steven Paton 1 Introduction This is the forth of a series of yearly reports summarising the past year
M onthly arket. Jan Table of Contents. Monthly Highlights
 Table of Contents Market Inventory...2 www.gaar.com Monthly Highlights January 2014 had a 12.29% increase in the number of homes sales when compared to same time last year. The average sale price of single-family
November 2018 Customer Switching Report for the Electricity and Gas Retail Markets
 An Coimisiún um Rialáil Fóntas Commission for Regulation of Utilities November 2018 Customer Switching Report for the Electricity and Gas Retail Markets Information Paper Reference: CRU18266 Date Published:
Monthly Hog Market Update United States Hog Production
 This information is provided as a resource by Saskatchewan Agriculture staff All prices are in Canadian dollars unless otherwise noted. Please use this information at your own risk. Monthly Hog Market
TRAFFIC VOLUME TRENDS July 2002
 TRAFFIC VOLUME TRENDS July 2002 Travel on all roads and streets changed by +2.3 percent for July 2002 as compared to July 2001. Estimated Vehicle-Miles of Travel by Region - July 2002 - (in Billions) West
Design Criteria Data
 MEDFORD/JACKSON CO. OR Latitude = 42.37 N WMO No. 72597 Longitude =122.8 W Elevation = 1329 feet Period of Record = 1973 to 1996 Average Pressure = 28.61 inches Hg Design Criteria Data Mean Coincident
Design Criteria Data
 PHOENIX/SKY HARBOR AZ Latitude = 33.43 N WMO No. 72278 Longitude =112. W Elevation = 116 feet Period of Record = 1973 to 1996 Average Pressure = 28.72 inches Hg Design Criteria Data Mean Coincident (Average)
Thank you for requesting information on our utility auditing services!
 - EXHIBIT A - ELECTRIC - CLIENT INVOICE: EXAMPLE #1 If we moved a client from an electrical rate 6 to a rate 6L, and, as a result, changed their KWH rate from $.06 per Kilowatt Hour to $.05 per Kilowatt
TECHNICAL SERVICE BULLETIN
 TECHNICAL SERVICE BULLETIN To: Minuteman Dealers and Customers From: Minuteman Technical Support Date: 1/12/2011 Subject: TSB for the KIT # K-FRSPEEDSWT. For the FR17115, FR17220, FR20115 and FR20220 models.
[Amounts in millions of dollars] Nondurable. Total. goods. equipment 34,415 30,717 24,506 8,868 9,566 8,981
![[Amounts in millions of dollars] Nondurable. Total. goods. equipment 34,415 30,717 24,506 8,868 9,566 8,981](/thumbs/92/109418289.jpg "[Amounts in millions of dollars] Nondurable. Total. goods. equipment 34,415 30,717 24,506 8,868 9,566 8,981") 1970 TABLE C-44. Manufacturers 1 new and unfilled orders, 1947-69 Unfilled orders2 Unfilled orders-shipments Machinery and equipment 1947.. 1948.. 1949.. 23,53.3 3 3 4 3 1961 * 31,085 15,698 17,026 18,522
1970 TABLE C-44. Manufacturers 1 new and unfilled orders, 1947-69 Unfilled orders2 Unfilled orders-shipments Machinery and equipment 1947.. 1948.. 1949.. 23,53.3 3 3 4 3 1961 * 31,085 15,698 17,026 18,522
Appendix E Hydrology, Erosion and Sediment Transport Studies
 Appendix E Hydrology, Erosion and Sediment Transport Studies Hatch 2012/10 Appendix E1 EA Hydrology Memorandum February 2011 (Hatch. 2011a) Hatch 2012/10 Project Memo February 23, 2011 TO: Larry King FROM:
FOR IMMEDIATE RELEASE
 Article No. 5842 Available on www.roymorgan.com Roy Morgan Unemployment Profile Thursday, 2 October 2014 Unemployment climbs to 9.9% in September as full-time work lowest since October 2011; 2.2 million
DRAFT. Total Month Average Point (MAP) A Massage 4/30/2014 8/1/2015 A CENTER E
 A Massage 4/30/2014 8/1/2015 A CENTER E") Total Month Average Point (MAP) A Massage 4/30/2014 8/1/2015 A CENTER E 2.25 2.00 2.00 2.25 2.00 2.00 1.00 2.25 2.00 2.25 2.00 A Massage 10/31/2017 9/1/2015 B MEZZANINE 2.25 2.00 2.00 2.25 2.25 2.25 2.25
Total Month Average Point (MAP) A Massage 4/30/2014 8/1/2015 A CENTER E 2.25 2.00 2.00 2.25 2.00 2.00 1.00 2.25 2.00 2.25 2.00 A Massage 10/31/2017 9/1/2015 B MEZZANINE 2.25 2.00 2.00 2.25 2.25 2.25 2.25
EXECUTIVE SUMMARY ATLANTIC SALMON NO 03/06
 MARKET This table shows development in supply/consumption of Atlantic salmon in the main markets per month, in tonnes r.w The table contains preliminary figures and may diverge from same figures in the
Residential Load Profiles
 Residential Load Profiles TABLE OF CONTENTS PAGE 1 BACKGROUND... 1 2 DATA COLLECTION AND ASSUMPTIONS... 1 3 ANALYSIS AND RESULTS... 2 3.1 Load Profiles... 2 3.2 Calculation of Monthly Electricity Bills...
NJ Solar Market Update As of 6/30/15
 NJ Solar Market Update As of 6/30/ Prepared by Charlie Garrison July 17, 20 SOLAR INSTALLED CAPACITY DATA The preliminary installed solar capacity as of 6/30/ is approximately 1,500.7 MW. Approximately
Missouri River Mainstem Reservoirs Runoff Volumes for Annual Operating Plan Studies RCC Technical Report Jy-08
 Missouri River Region Since 1953 US Army Corps of Engineers Reservoir Control Center Missouri River Region Northwestern Division Reservoir Control Center July 2008 Missouri River Basin Fort Peck Montana
2017 Meteorological Summary for the Galeta Marine Island Laboratory. Prepared by: Steven Paton
 0 2017 Meteorological Summary for the Galeta Marine Island Laboratory Prepared by: Steven Paton 1 Introduction This is the 5 th in a series of yearly reports summarising the past year s Smithsonian Tropical
Design Criteria Data
 OKLAHOMA CITY OK Latitude = 35.4 N WMO No. 72353 Longitude = 97.6 W Elevation = 133 feet Period of Record = 1973 to 1996 Average Pressure = 28.62 inches Hg Design Criteria Data Mean Coincident (Average)
TABLE C-43. Manufacturers' new and unfilled orders, {Amounts in millions of dollars] Nondurable. Capital goods. Total. goods.
![TABLE C-43. Manufacturers' new and unfilled orders, {Amounts in millions of dollars] Nondurable. Capital goods. Total. goods.](/thumbs/93/112603708.jpg "TABLE C-43. Manufacturers' new and unfilled orders, {Amounts in millions of dollars] Nondurable. Capital goods. Total. goods.") TABLE C-43. Manufacturers' new and unfilled orders, -74 {Amounts in millions of dollars] New orders t, I960. 27, 559 26, 903 30,672 30,115 31,086 33,005 35,322 37,952 41, 803 45, 944 46,763 50, 243 53,
TABLE C-43. Manufacturers' new and unfilled orders, -74 {Amounts in millions of dollars] New orders t, I960. 27, 559 26, 903 30,672 30,115 31,086 33,005 35,322 37,952 41, 803 45, 944 46,763 50, 243 53,
Design Criteria Data
 COLUMBIA SC Latitude = 33.95 N WMO No. 7231 Longitude = 81.12 W Elevation = 226 feet Period of Record = 1973 to 1996 Average Pressure = 29.8 inches Hg Design Criteria Data Mean Coincident (Average) Values
Energy Conservation Efforts
 Hennepin County Property Services Energy Conservation Efforts MEPC Presentation September 2010 HENNEPIN COUNTY PROPERTY SERVICES DEPARTMENT MONTHLY ENERGY COSTS $1,200,000 $1,000,000 Cold 2009 October
Hospitality & Tourism Management January 2015 Calendar Sunday Monday Tuesday Wednesday Thursday Friday Saturday 1 2 3
 Jan-14 Week 1 Week 2 January 2015 Calendar 1 2 3 New Year's Day - 4 5 6 7 8 9 10 New Intake-L4 (EFTH) Assign-Presentation L4 Assign-Presentation L5 Last Exam Reg- CTH Assign Marking Assign Marking Module-
CEO PROGRAM September 2018
 CEO PROGRAM September 2018 1 Sept 17th: ALL! CEO High Orientation (Kiva 6pm 7:30pm) 2 3 4 5 6 7 8 Sept 18th: ALL! CEO Orientation (Kiva 6pm 7:30pm) 9 10 11 12 13 14 15 *Parents please drop off/pick up
All Annual Operating Plan Recipients
 To: All Annual Operating Plan Recipients From: Lower Colorado Region Boulder Canyon Operations Office River Operations Group Daniel Bunk P.O. Box 647 Boulder City, NV 896-47 Phone: 72-293-83 The operation
Design Criteria Data
 DES MOINES IA Latitude = 41.53 N WMO No. 72546 Longitude = 93.65 W Elevation = 965 feet Period of Record = 1973 to 1996 Average Pressure = 28.96 inches Hg Design Criteria Data Mean Coincident (Average)
FOR IMMEDIATE RELEASE
 Article No. 7845 Available on www.roymorgan.com Roy Morgan Unemployment Profile Friday, 18 January 2019 Unemployment in December is 9.7% and under-employment is 8.8% FOR IMMEDIATE RELEASE Australian unemployment
FOR IMMEDIATE RELEASE
 Article No. 7433 Available on www.roymorgan.com Roy Morgan Unemployment Profile Friday, 12 January 2018 2.6m Australians unemployed or under-employed in December The latest data for the Roy Morgan employment
Design Criteria Data
 SPOKANE WA Latitude = 47.63 N WMO No. 72785 Longitude =117.5 W Elevation = 2366 feet Period of Record = 1973 to 1996 Average Pressure = 27.5 inches Hg Design Criteria Data Mean Coincident (Average) Values
Design Criteria Data
 RAPID CITY SD Latitude = 44.5 N WMO No. 72662 Longitude =3. W Elevation = 3169 feet Period of Record = 1973 to 1996 Average Pressure = 26.67 inches Hg Design Criteria Data Mean Coincident (Average) Values
Government of Canada Hopper Car Fleet
 Government of Canada Hopper Car Fleet 2010 Annual Report Prairie and Northern Region TP 14995E Her Majesty the Queen in Right of Canada, represented by the Minister of Transport, the Honourable Denis Lebel
Meter Insights for Downtown Store
 Meter Insights for Downtown Store Commodity: Analysis Period: Prepared for: Report Date: Electricity 1 December 2013-31 December 2014 Arlington Mills 12 February 2015 Electricity use over the analysis
FOR IMMEDIATE RELEASE
 Article No. 6928 Available on www.roymorgan.com Roy Morgan Unemployment Profile Wednesday, 17 August 2016 Australian real unemployment jumps to 10.5% (up 0.9%) in July during post-election uncertainty
Design Criteria Data
 INDIANAPOLIS IN Latitude = 39.73 N WMO No. 72438 Longitude = 86.27 W Elevation = 87 feet Period of Record = 1973 to 1996 Average Pressure = 29.15 inches Hg Design Criteria Data Mean Coincident (Average)
Design Criteria Data
 DENVER/STAPLETON CO Latitude = 39.75 N WMO No. 72469 Longitude =14.8 W Elevation = 5332 feet Period of Record = 1973 to 1995 Average Pressure = 24.66 inches Hg Design Criteria Data Mean Coincident (Average)