LAKE CHELAN ANNUAL FLOW AND WATER TEMPERATURE REPORT Final
|
|
|
- Lily Snow
- 5 years ago
- Views:
Transcription


1

2 LAKE CHELAN ANNUAL FLOW AND WATER TEMPERATURE REPORT 2013 LICENSE ARTICLES 405 & 408 Final LAKE CHELAN HYDROELECTRIC PROJECT FERC Project No. 637 April 30, 2014 Public Utility District No. 1 of Chelan County Wenatchee, Washington
3
4 2013 Annual and Water Temperature Report TABLE OF CONTENTS SECTION 1: INTRODUCTION... 3 SECTION 2: CHELAN RIVER INSTREAM FLOWS Chelan River Instream s Chelan River Ramping Rates... 7 SECTION 3: POWERHOUSE TAILRACE SECURITY FLOWS Powerhouse Operations... 8 SECTION 4: WATER TEMPERATURE MONITORING Water Temperatures Released to Chelan River and Tailrace Water Temperatures in Chelan River Reaches Water Temperatures in Chelan River Reach 4 Habitat Channel Chelan River 7-DADMax Water Temperatures Top Reach 1 to Bottom Reach SECTION 5: WATER QUALITY ASSESSMENT Assessment of Dissolved Oxygen, ph and Turbidity in Reach 4 Habitat Channel Assessment of Total Dissolved Gas in Reach 1 Below Chelan Dam Spillway SECTION 6: SUMMARY APPENDIX A: DAILY AVERAGE LAKE CHELAN ELEVATIONS, POWERHOUSE FLOWS, TAILWATER ELEVATIONS AND CHELAN RIVER FLOWS FROM SPILL, LOW LEVEL OUTLET AND PUMPING STATION APPENDIX B: DAILY AVERAGE WATER TEMPERATURES APPENDIX C: MINIMUM FLOW DEVIATION REPORTS APPENDIX D: CONSULTATION RECORD Final Lake Chelan Project No. 637 April 30, 2014 Page i FN/42676
5 2013 Annual and Water Temperature Report LIST OF TABLES Table 2-1. Ramping Criteria (2013) Table 5-1. Water Quality Criteria for Salmonid Spawning, Rearing and Migration LIST OF FIGURES Figure 2-1. Releases to Reaches 1-3 of the Chelan River, Figure 2-2. Releases to Chelan River Reach 4, Figure 3-1. Chelan Powerhouse Daily Average s, Figure 3-2. Chelan Powerhouse Daily Average Tailwater Elevations, Figure 4-1. Low Level Outlet and Tailrace Daily Average Water Temperatures Figure 4-2. Chelan River Reaches 1-3 Daily Average Water Temperatures Figure 4-3. Reach 4 Habitat Channel Daily Average Water Temperatures Figure 4-4. The 7-DADMax Water Temperatures for Reaches Lake Chelan Project No. 637 Final FN/42676 Page ii April 30, 2014
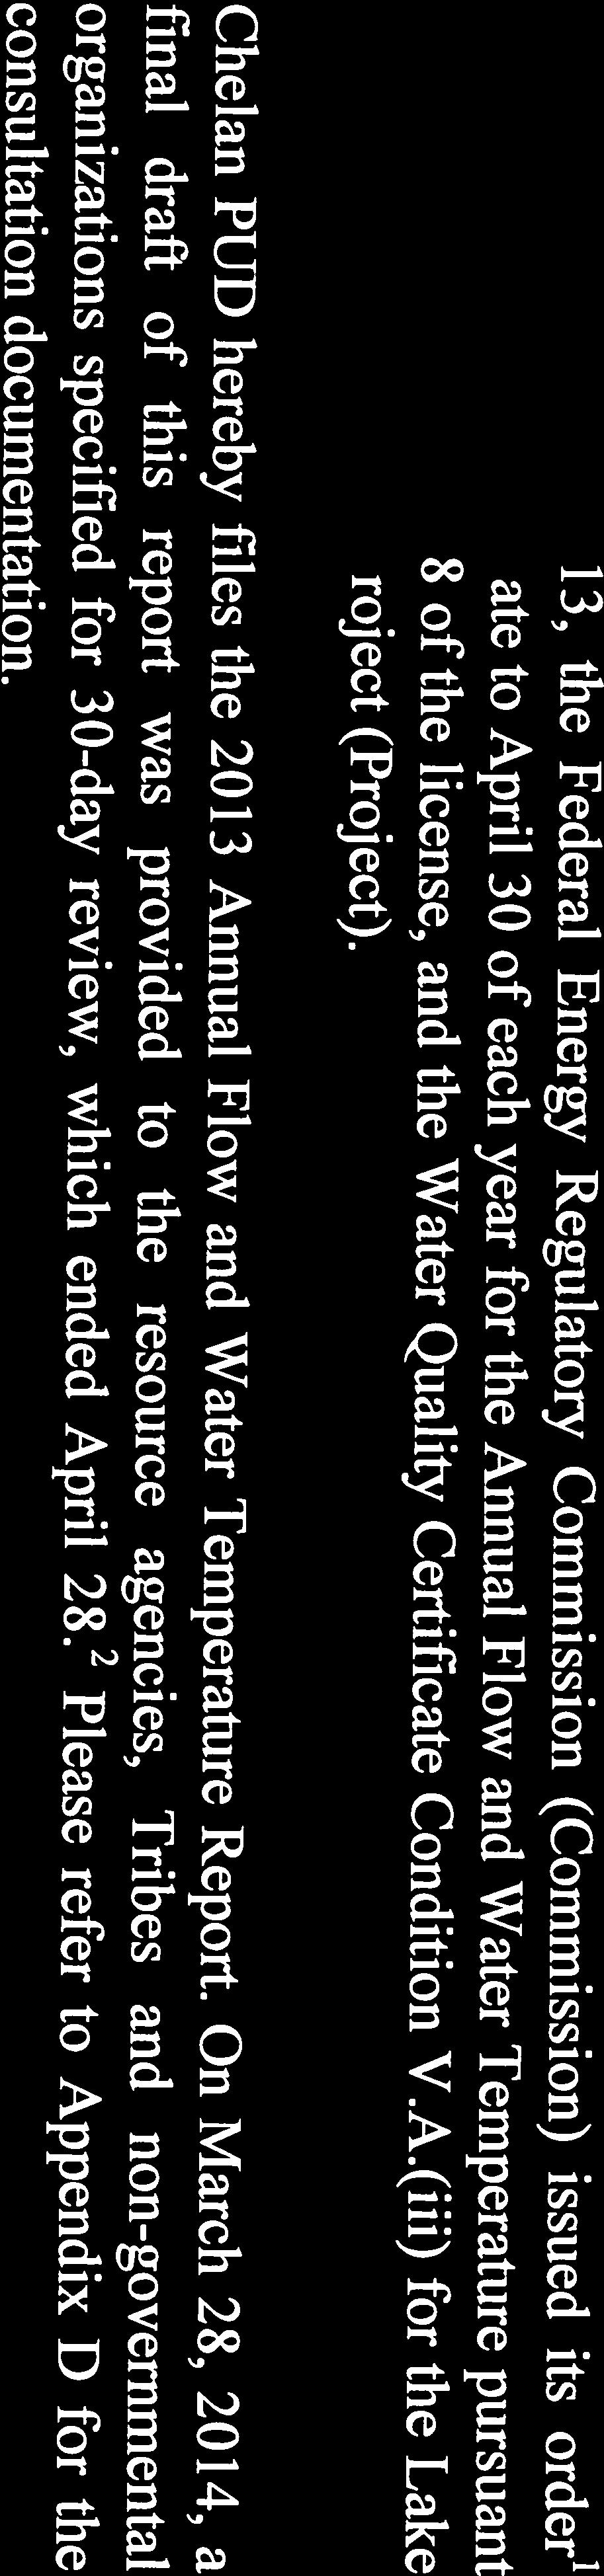
6 2013 Annual and Water Temperature Report EXECUTIVE SUMMARY Chelan PUD received a new license (License) from the Federal Energy Regulatory Commission (FERC) on November 6, 2006, authorizing Chelan PUD to operate the Lake Chelan dam and powerhouse for a period of 50 years. The License conditions require that Chelan PUD provide minimum flows to the Chelan River and monitor those flows and water temperatures at various locations. The License required the construction of a Low Level Outlet at Chelan Dam, a Reach 4 habitat channel and spawning areas in the tailrace, and operations to protect aquatic life through flow ramping rates and powerhouse operations. The License also requires that Chelan PUD file an Annual and Temperature Report with the FERC documenting compliance with these License requirements. releases were provided throughout the year from the Low Level Outlet for minimum flows of at least 80 cfs in Reaches 1-3. The runoff forecast for 2013 indicated an average water year, thus minimum flow releases to Reaches 1-3 were at least 200 cfs from May 15 July 15. Additional flow was provided from the Pump Station to the Reach 4 habitat channel for salmon and steelhead spawning during their respective spawning periods (October 15 November 30 and March 15 May 15). During the Chinook spawning period, the Chelan River Fishery Forum approved testing an alternative spawning flow using four instead of five pumps. The spawning flow levels during this test ranged from 279 cfs 292 cfs. There were two brief deviations below minimum spawning flow requirements in 2013 due to mechanical failures at the Pump Station. The FERC determined that these deviations did not constitute a violation of Article 405 of the license. s were released from the spillway, as needed for lake level control, from June 26 July 6 and July 10 July 13. Daily average flow releases for lake level control peaked at 2,987 cfs on July 3, whereas the highest hourly flows of 3,409 occurred during two hours on July 5. releases from the Low Level Outlet were also managed to provide whitewater boating flows on September s were ramped back down to minimum flows following the event, with ramping concluded on September 23. In 2013, Chelan PUD implemented operating criteria for compliance with the two inches per hour ramping rates that were refined in The refined criteria performed well in 2012 and 2013 during the adjustments of spill flows and when ramping down from flows provided for whitewater boating in September. No further adjustments to the ramping rate operating criteria were needed in There were 231 salmon redds with eggs incubating in the tailrace from spawning that occurred in Powerhouse operations for Chinook redd protection, based on results from the previous year s tests, were implemented and monitored to determine if adequate oxygen levels were maintained in Chinook salmon redds. During this study, the tests were designed to gradually approach testing periods of time with no powerhouse flow and the period of time with no powerhouse flow was limited to a maximum of three hours. The 2013 results indicated that dissolved oxygen levels above 6.0 mg/l can be maintained in most redds, even over repeating Final Lake Chelan Project No. 637 April 30, 2014 Page 1 FN/42676
7 2013 Annual and Water Temperature Report cycles of three hours with no flow followed by one hour at minimum generation. After these studies concluded on March 22, the powerhouse operated at full capacity until April 17, by which time emergence of Chinook salmon had concluded. The powerhouse was intermittently taken out of operation from April 18 May 4 in order to manage lake refill to meet target elevations for Lake Chelan, then for the most part operated at full capacity through the rest of May. Steelhead spawning was observed in the Reach 4 habitat channel between late March and late April, with 20 redds in the habitat channel and one in the tailrace in flows originating from the habitat channel. During the Chinook spawning period, powerhouse daily average flows were maintained above 2000 cfs from October 1 November 21. Powerhouse flows from November 22 December 1 remained above 850 cfs, with most daytime flows above 2000 cfs. A total count of 727 Chinook redds were estimated to have been deposited in the Chelan River Reach 4 (268), tailrace (319), and downstream in the Chelan/Columbia River confluence and Columbia River (140). Water temperatures were monitored at seven locations in the Chelan River and tailrace. Water temperatures neither increased nor decreased during transit through the Reach 4 habitat channel. The maximum daily average water temperatures measured from upstream to downstream locations were 23.7 C at the Low Level Outlet, 23.4 C from top of Reach 1 through end of Reach 3, 23.5 C at the bottom of Reach 4, and 24.1 C in the tailrace. The highest hourly temperatures recorded at these locations were 24.1 C, 26.1 C, 26.3 C and 24.5 C, respectively. The highest 7-DADMax temperatures recorded were 23.8 C at the top of Reach 1, 25.8 C and 25.5 C at the ends of Reaches 1 and 3, and 24.6 C at the bottom of Reach 4. Lake Chelan Project No. 637 Final FN/42676 Page 2 April 30, 2014
8 2013 Annual and Water Temperature Report SECTION 1: INTRODUCTION The Lake Chelan Hydroelectric Project (Project) is owned and operated by the Public Utility District No. 1 of Chelan County (Chelan PUD). The Federal Energy Regulatory Commission (FERC) license for operation of this project, issued on November 6, 2006, authorizes Chelan PUD to operate the Lake Chelan dam and powerhouse for a period of 50 years. As part of the normal operation of the Project, Chelan PUD withdraws water from Lake Chelan for power generation and discharges that water through the powerhouse into an excavated tailrace, which leads to the confluence of the Chelan River and the Columbia River. s released from the Chelan Dam follow the natural channel of the Chelan River, joining with the powerhouse tailrace flows and discharging to the Columbia River. As a requirement of the new License, minimum flows were established for the Chelan River and that flow was initiated on October 14, Chelan PUD filed an Operations Compliance Monitoring Plan (OCMP), as required in License Article 405, which describes how Chelan PUD operates to meet: (1) the instream flows, ramping rates, and tailrace flows as set forth in Article 7 of the Lake Chelan Settlement Agreement and Chapter 7 of the Comprehensive Plan attached to the Settlement Agreement; (2) and the lake levels as set forth in Article 8 of the Settlement Agreement and Chapter 8 of the Comprehensive Plan. The OCMP includes the specifics of flow measurement techniques, electronic flow data posting, quarterly and annual reporting requirements, and an implementation schedule. Chelan PUD filed a Threatened and Endangered Species Protection Plan (TESPP), as required in License Article 408, which describes: (1) how Chelan PUD implemented provisions for timely development of a system to release water at the Lake Chelan Dam or pump water from the project powerhouse tailrace to the Chelan River, and subsequent operation of that system to continuously maintain flows equal to or greater than the flows required for Chelan River Reach 4; and (2) methods and schedules for monitoring of flows in the project tailrace and in Reach 4 of the Chelan River and annual reporting of the monitoring results, as set forth in Article 7 of the Lake Chelan Settlement Agreement and Chapter 7 of the Comprehensive Plan attached to the Settlement Agreement, and (3) methods for timely determination of the need to take actions to improve water quality characteristics adversely affecting anadromous fish, and identification and implementation of appropriate actions. The OCMP and TESPP were submitted to the FERC on May 4, 2007 and the FERC issued an order approving the TESPP on November 28, 2007 and an order modifying and approving the OCMP on November 30, Both the OCMP and TESPP require the recording and reporting of flows in the Chelan River, to evaluate meeting minimum flow requirements, protection of fish habitat and protection of salmon and steelhead eggs incubating in the tailrace. The TESPP also includes annual reporting of water temperature monitoring required in the Lake Chelan Settlement Agreement. The order approving the OCMP requires that Chelan PUD shall file an Annual Report with the FERC by February 28 of each year. Due to weather and snow conditions that frequently prevented retrieval of temperature loggers in January and February, the FERC granted a request from Chelan PUD to change the filing date of these annual reports to April 30. This Annual and Temperature Report meets the flow and temperature reporting requirements of License Articles 405 and 408. Final Lake Chelan Project No. 637 April 30, 2014 Page 3 FN/42676
9 2013 Annual and Water Temperature Report Chelan PUD manages the level of Lake Chelan and flow releases through the powerhouse and into the Chelan River channel at the dam for power generation and other purposes. License Article 405 requires management of lake levels with priority given to maintaining minimum flows in the Chelan River (initiated in 2009) and reducing high spillway flows into the Chelan River to protect fish habitat. This report includes two sections that correspond to the flow reporting requirements of the FERC order: Section 2, Chelan River Instream s and Section 3, Powerhouse Tailrace Security s. Section 4 of this report contains the water temperature monitoring that was conducted in In addition, the FERC order requires that Chelan PUD conduct general water quality assessments in years 6 (2012) and 8 (2014) sufficient to demonstrate that the Chelan River meets water quality standards for dissolved oxygen, total dissolved gas, turbidity and ph. Section 5 of this report documents water quality assessments that address this requirement. Lake Chelan Project No. 637 Final FN/42676 Page 4 April 30, 2014
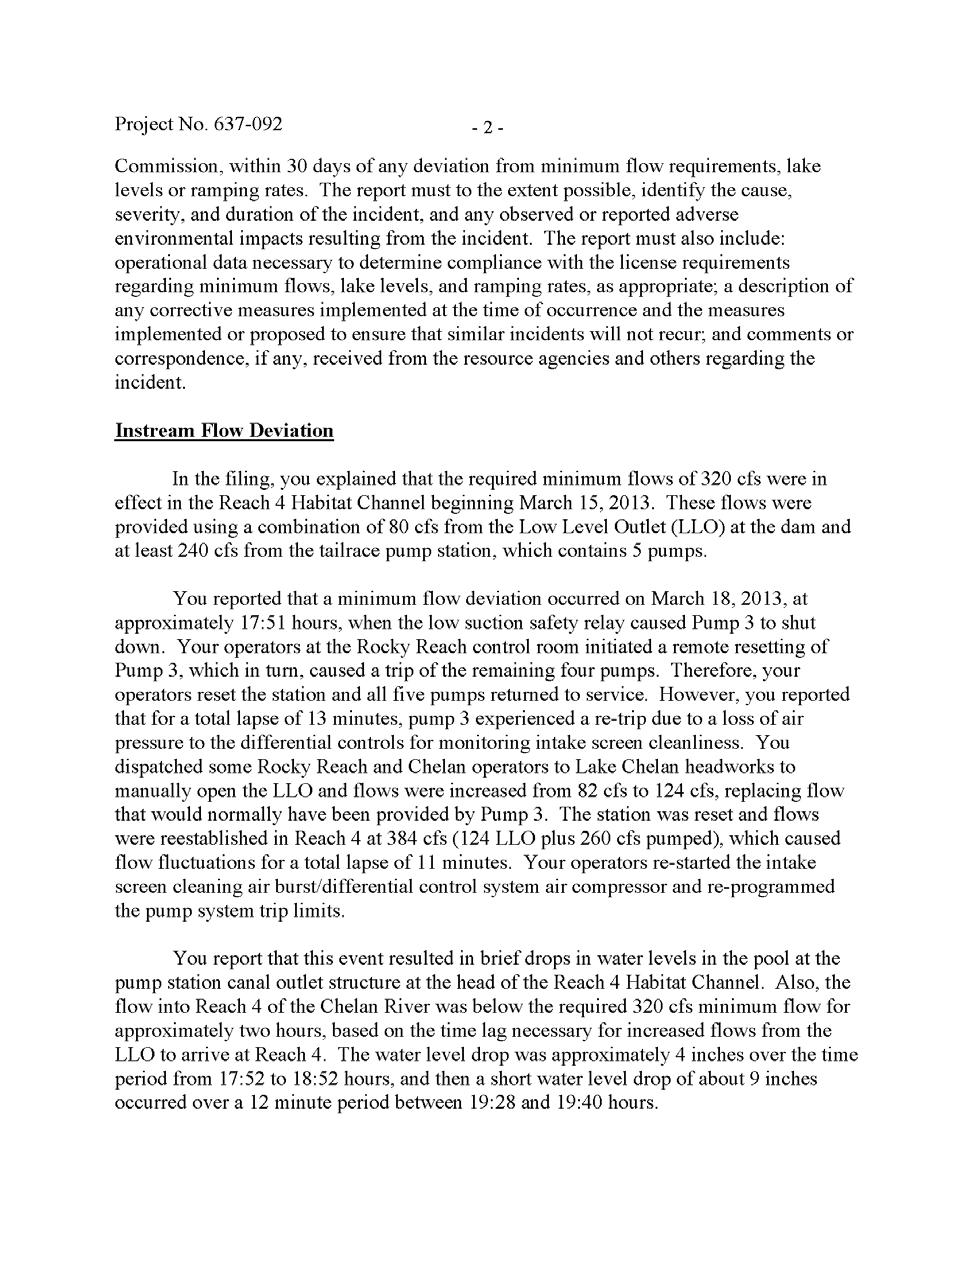
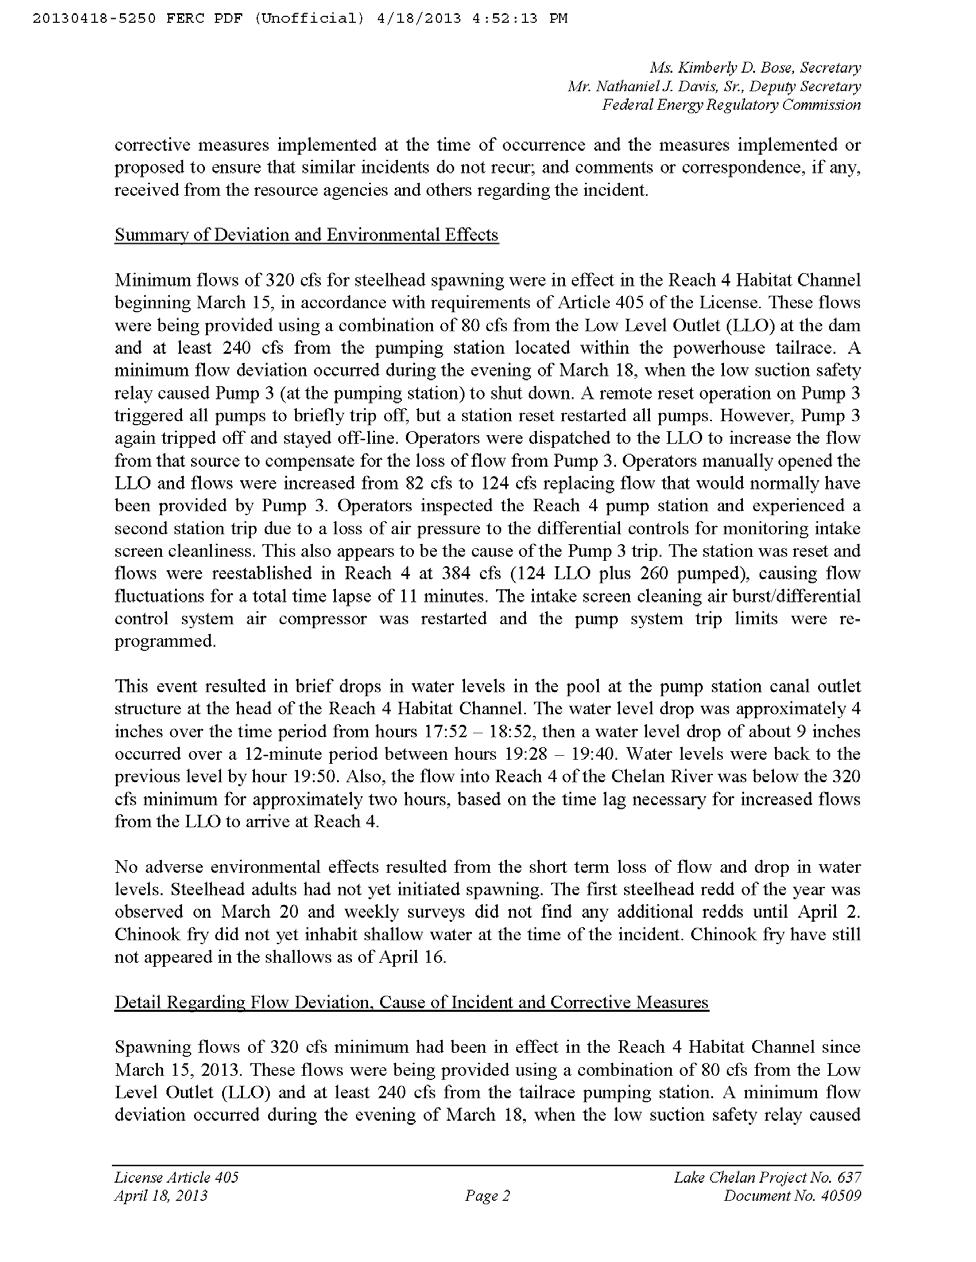
10 2013 Annual and Water Temperature Report SECTION 2: CHELAN RIVER INSTREAM FLOWS 2.1 Chelan River Instream s releases were provided throughout the year from the Low Level Outlet for minimum flows of at least 80 cfs in Reaches 1-3 (Figure 2-1). The runoff forecast for 2013 was 93 percent of average, which is classified as an average year for setting minimum flows during the annual runoff cycle. The 2013 minimum flow releases to Reaches 1-3 were at least 200 cfs from May 15 July 15. Additional flow was provided from the Pump Station to the Reach 4 habitat channel for salmon and steelhead spawning during their respective spawning periods (Figure 2-2). There were two deviations below minimum flow requirements to the Reach 4 habitat channel in 2013, both due to mechanical failures at the Pump Station. The first incident was on March 18, when a pump tripped off-line due to a faulty valve in the intake screen air burst cleaning system. The second incident was on May 2, due to failure of the water seal in a pump, which remained unavailable for the remainder of the spring spawning flow period. In both cases, additional flow was provided from the Low Level Outlet to supplement the flow from the Pump Station, but due to the two - three hour time lag for water from the Low Level Outlet to travel to the Reach 4 habitat channel, there were short-term deviations from the 320 cfs minimum spawning flow requirement. The FERC determined that neither deviation constituted a violation of Article 405 of the license (Appendix C). s were released from the spillway, as needed for lake level control, from June 26 July 6 and July 10 July 13. These flow releases were managed to meet lake level target elevations and to avoid high spill levels that could damage the Reach 4 habitat channel. Daily average flow releases for lake level control peaked at 2987 cfs on July 3, whereas the highest hourly flows of 3409 occurred during two hours on July 5. releases from the Low Level Outlet were also managed to provide whitewater boating flows on September s were ramped back down to minimum flows following the event, with ramping concluded on September 23. Spawning flows were provided for steelhead trout from March 15 May 14 and for Chinook salmon from October 15-November 30. The spawning flows were provided through the combination of the Low Level Outlet flows and Pump Station flows, maintaining flow levels of at least 320 cfs during the spring steelhead spawning period. During the Chinook spawning period, the Chelan River Fishery Forum approved testing an alternative spawning flow using four instead of five pumps. The spawning flow levels during this test ranged from 279 cfs 292 cfs. At the end of each spawning period, flows from the Pump Station were ramped down one pump at a time to avoid fish stranding. Steelhead trout adults were observed spawning in the Reach 4 habitat channel beginning March 20. Spawning continued until April 23, with 21 redds counted in No new steelhead redds were observed in May, although surveys continued through June 7. Chinook fry were observed rearing in the Reach 4 habitat channel from mid April through June. Chinook spawning began on October 10 and was completed prior to November 27. There were a total of 727 redds counted in the Chelan River Reach 4, the tailrace and Columbia River at the confluence. There were 268 redds in the Reach 4 habitat channel and upstream pool, 319 in the tailrace and 140 in the Columbia River in Chelan River currents below the confluence. Final Lake Chelan Project No. 637 April 30, 2014 Page 5 FN/42676
11 2013 Annual and Water Temperature Report A tabulation of average daily flows from the Low Level Outlet, Pump Station, combined flows into Reaches 1-3 and Reach 4, powerhouse discharge, spill discharge and hourly lake levels and powerhouse tailwater levels are presented in Appendix A. Quarterly hourly data is available at the internet site: Figure 2-1. Releases to Reaches 1-3 of the Chelan River, Daily Average Total Reach /1/2013 2/1/2013 3/1/2013 4/1/2013 5/1/2013 6/1/2013 7/1/2013 8/1/2013 9/1/ /1/ /1/ /1/2013 Date Figure 2-2. Releases to Chelan River Reach 4, Spillway s >1,000 cfs 800 Daily Average Reach /1/2013 2/1/2013 3/1/2013 4/1/2013 5/1/2013 6/1/2013 7/1/2013 8/1/2013 9/1/ /1/ /1/ /1/2013 Date Lake Chelan Project No. 637 Final FN/42676 Page 6 April 30, 2014
12 2013 Annual and Water Temperature Report 2.2 Chelan River Ramping Rates The Lake Chelan Settlement Agreement requires that ramping rates are to be established for the Chelan River to protect aquatic organisms from rapid fluctuations in water levels. The ramping rates for decreases in water levels are initially set at approximately two inches per hour during the period when juvenile salmon and steelhead fry may be present. The OCMP states that the two inches per hour ramping rates will remain in effect until biological evaluations have determined the actual ramping rates necessary to prevent stranding of fish in the Chelan River. The locations in the Chelan River where water level changes will be measured to determine operating criteria for compliance with ramping rates will be determined in consultation with the Chelan River Fishery Forum. A study is scheduled for 2014 to determine the operating criteria for changes in flow from the Low Level Outlet, spillway and Pump Station. The results of this study will establish ramping procedures in terms of allowable flow reductions per hour for these sources of flow releases. Biological evaluations will determine the periods of time during the year when ramping rates will be applied to protect fry from stranding. The year 2013 was the fourth full year of minimum flow operations for the Chelan River since completion of the Low Level Outlet, Reach 4 habitat channel, and Pump Station. Biological evaluations of fish populations with snorkel surveys in the Chelan River Reaches 1-3 and Reach 4 began in Results of those surveys have been provided to the Chelan River Fisheries Forum and were included in the 2013 Biological Objectives Status Report. Observations during the snorkel surveys, steelhead spawning surveys (weekly March 15-June 1), summer observations during temperature logger replacement (monthly July, August, September) and fall during Chinook spawning surveys (weekly October November) determined that Chinook salmon fry were present in the Reach 4 habitat channel during the months of April, May and June. No Chinook or steelhead fry were observed prior to mid April and after July. However, ramping rate operations for juvenile fish were followed throughout the year since the snorkel survey biological evaluations are just in their second year. In 2013, Chelan PUD implemented operating criteria for compliance with the two inches per hour ramping rates that were refined in 2011 and managed flow releases using those operating criteria in conjunction with onsite monitoring of actual water level changes. Implementation of the refined criteria was successful in 2012 and 2013 during the adjustments of spill flows and when ramping down from flows provided for whitewater boating in September. No further adjustments to the ramping rate operating criteria (Table 2-1) were needed in Final Lake Chelan Project No. 637 April 30, 2014 Page 7 FN/42676
13 2013 Annual and Water Temperature Report Table 2-1. Ramping Criteria (2013). Decreasing Spill Ramping Rate Restrictions Except for Plant Safety and System Reliability, the following are License Compliance ramping rate restrictions when reducing spill: Maximum Spill Reduction Ramping Rates Ramp Rate Total Spill* cfs cfs/hr 1000 < Total Spill < Total Spill <= < Total Spill <= < Total Spill <= < Total Spill <= * Total Spill = Low Level Outlet + Spill Gates Note: Only reduce spill during daylight hours (to aid fish movement from potential entrapment areas). SECTION 3: POWERHOUSE TAILRACE SECURITY FLOWS 3.1 Powerhouse Operations There were 231 salmon redds with eggs incubating in the tailrace from spawning that occurred in Powerhouse operations for Chinook redd protection, based on results from the previous year s tests, were implemented and monitored to determine if adequate oxygen levels were maintained in Chinook salmon redds. During this study, the tests were designed to gradually approach testing periods of time with no powerhouse flow and the period of time with no powerhouse flow was limited to a maximum of three hours. The test cycles began with short periods of only minimum generation (about 800 cfs) with full flow (2,500 cfs) most of the time, which then progressed to running full time at only 800 cfs, then cycles of two hours at 800 cfs, followed by two hours of no flow. The final tests consisted of extended periods where either two or three consecutive hours with no powerhouse flow were followed by only one hour with the powerhouse at minimum generation. The 2013 results indicated that dissolved oxygen levels above 6.0 mg/l can be maintained in most redds, even over repeating cycles of three hours with no flow followed by one hour at minimum generation. After these studies concluded on March 22, the powerhouse operated at full capacity until April 17, by which time emergence of Chinook salmon had concluded. The powerhouse was intermittently taken out of operation from April 18 May 4 in order to manage lake refill to meet target elevations for Lake Chelan. Lake Chelan Project No. 637 Final FN/42676 Page 8 April 30, 2014
14 2013 Annual and Water Temperature Report During the spawning period for steelhead, the powerhouse operated as previously described until May 4, then for the most part operated at full capacity through the rest of May. Steelhead spawning was observed in the Reach 4 habitat channel in 2013 between late March and late April. Twenty Steelhead redds were located in the habitat channel and one in the tailrace in flows originating from the habitat channel. During the Chinook spawning period in 2013, powerhouse daily average flows were maintained above 2000 cfs from October 1 November 21. Powerhouse flows from November 22 December 1 remained above 850 cfs, with most daytime flows above 2000 cfs. A total count of 727 Chinook redds were estimated to have been deposited in the Chelan River Reach 4 (268), tailrace (319), and downstream in the Chelan/Columbia River confluence and Columbia River (140). Powerhouse flows were above 850 cfs from December 1 31, with the exception of two daily periods of no flow (less than 3 hours each) from December for installation of oxygen monitoring equipment in Chinook redds and cylindrical egg tubes with Chinook eggs for egg-emergence survival studies. Water surface elevations in the tailrace can fluctuate by several feet over the course of a day due to changes in Columbia River flows that affect the backwater curve of the Rocky Reach reservoir. The water level fluctuations in the tailrace are reduced when the Chelan Powerhouse is operating. In past years, temporary dewatering of a few Chinook redds in shallow areas had been observed when the powerhouse was not operating and Columbia River flows were low. During tailrace spawning habitat construction in 2008 these areas were graded to prevent dewatering. The water levels in the tailrace remained above feet most of the time and never dropped below feet from January 1 May 31 and October 15 December 31. No dewatering of salmon redds was observed in The daily average tailwater levels measured at the powerhouse are shown in Figure 3-2. Final Lake Chelan Project No. 637 April 30, 2014 Page 9 FN/42676
15 2013 Annual and Water Temperature Report Figure 3-1. Chelan Powerhouse Daily Average s, Daily Average Powerhouse /1/2013 2/1/2013 3/1/2013 4/1/2013 5/1/2013 6/1/2013 7/1/2013 8/1/2013 9/1/ /1/ /1/ /1/2013 Date Figure 3-2. Chelan Powerhouse Daily Average Tailwater Elevations, Daily Average Tailwater Elevation (feet) /1/2013 2/1/2013 3/1/2013 4/1/2013 5/1/2013 6/1/2013 7/1/2013 8/1/2013 9/1/ /1/ /1/ /1/2013 Date Lake Chelan Project No. 637 Final FN/42676 Page 10 April 30, 2014
16 2013 Annual and Water Temperature Report SECTION 4: WATER TEMPERATURE MONITORING 4.1 Water Temperatures Released to Chelan River and Tailrace Automated water temperature monitoring equipment is installed at two locations, within the pipe that draws water from the base of the Chelan Dam and discharges to the Chelan River through the Low Level Outlet and in the Chelan Powerhouse Tailrace from a sensor mounted on the Pump Station intake screens. These monitoring locations measure the water temperatures that reflect the coolest water available for the Chelan River (Low Level Outlet temperature) and the average of water temperatures arriving at the face of Chelan Dam as drawn through the powerhouse intakes (Chelan Powerhouse Tailrace). Water temperatures measured in the tailrace also represent the temperature of water that is being discharged to the Reach 4 habitat channel when the Pump Station is in operation. Water temperatures from these sources (Figure 4-1) generally show little stratification in water temperatures at the face of Chelan Dam. The maximum daily average water temperature measured in the Low Level Outlet pipe was 23.7 C. Hourly water temperatures peaked at 24.1 C on July 26. Tailrace maximum daily average temperature was 24.1 C, while hourly temperatures peaked at 24.5 C on July 28, August 8 and August 14. Figure 4-1. Low Level Outlet and Tailrace Daily Average Water Temperatures Daily Average Water Temperature ( C) Temperature at LLO Temperature in Tailrace at Pump Station 0.0 1/1/2013 2/1/2013 3/1/2013 4/1/2013 5/1/2013 6/1/2013 7/1/2013 8/1/2013 9/1/ /1/ /1/ /1/2013 Date 4.2 Water Temperatures in Chelan River Reaches 1-3. Water temperatures are monitored at three locations with temperature recording data loggers (Onset HOBO Water Temp Pro v2) that are set to record the water temperature at hourly Final Lake Chelan Project No. 637 April 30, 2014 Page 11 FN/42676
17 2013 Annual and Water Temperature Report intervals. These locations are at the top of Reach 1, which measures the temperature of water entering the Chelan River from the Low Level Outlet and the spillway. The location of this temperature logger is set below the mixing zone for these sources of water. The second location is at the end of Reach 1, which is the reach of the Chelan River that has the lowest gradient and least profile shading, thus the greatest potential for water temperature heating during the spring and summer. The third location is at the end of Reach 3, where the Chelan River exits the series of cascades and falls that are the upstream barrier to anadromous fish. The temperature loggers at each location are exchanged several times during the year to retrieve the data. These data are reported quarterly during most of the year, with monthly reporting for July, August and September. These data reports are available at Documents-WaterQuality.cfm. The water temperatures recorded at the monitored Reaches in 2013 demonstrated small differences in daily average water temperature between Reaches (Figure 4-2). However, the daily maximum water temperature increased above the temperature at the Low Level Outlet during summer and decreased during the fall. This is not unexpected because the water exiting Lake Chelan is affected by the heat sink effect of the lake s large volume. Water in Lake Chelan is still warming from March August, but then retains this heat through the late summer and fall, thus water exiting the lake is cooler than sustainable at equilibrium with ambient solar and air temperature conditions through the summer, then tends to be warmer than sustainable through fall and early winter. The maximum daily average water temperatures recorded in 2013 were 23.4 C at all locations. The highest hourly temperatures recorded were 24.0 C, 26.1 C, and 25.9 C, respectively for the top of Reach 1, end of Reach 1 and end of Reach 3. The highest temperatures were recorded at the end of Reach 1 on July 25 and end of Reach 3 on July 23. Figure 4-2. Chelan River Reaches 1-3 Daily Average Water Temperatures Daily Average Water Temperature ( C) Temperature Top of R1 Temperature End of R1 Temperature End of R /1/2013 2/1/2013 3/1/2013 4/1/2013 5/1/2013 6/1/2013 7/1/2013 8/1/2013 9/1/ /1/ /1/ /1/2013 Date Lake Chelan Project No. 637 Final FN/42676 Page 12 April 30, 2014
18 2013 Annual and Water Temperature Report 4.3 Water Temperatures in Chelan River Reach 4 Habitat Channel. Water temperatures are monitored at hourly intervals at two locations (Onset HOBO Water Temp Pro v2), at the upper and lower end of the habitat channel. The upper location records either the water temperature exiting from the pool below the end of Reach 3 or the mixed flows from that source and the Pump Station canal outlet, when the pumps are in operation. The monitoring location at the end of the habitat channel is at the point where habitat channel flows enter into the tailrace, just upstream from where mixing of these flows is expected. The daily average water temperature data from these locations did not show any evidence of heating as water passed through the habitat channel, despite the lack of significant shade from vegetation under current conditions (Figure 4-3). The maximum daily average temperatures recorded were 23.4 C at the top and 23.5 C at the end of the habitat channel. The maximum hourly temperatures were 26.1 C and 26.3 C at the upper and lower ends of the habitat channel. These peak temperatures were recorded on July 23. Figure 4-3. Reach 4 Habitat Channel Daily Average Water Temperatures Daily Average Water Temperature ( C) Temperature Top of Habitat Channel Temperature End of Habitat Channel 0.0 1/1/2013 2/1/2013 3/1/2013 4/1/2013 5/1/2013 6/1/2013 7/1/2013 8/1/2013 9/1/ /1/ /1/ /1/2013 Date 4.4 Chelan River 7-DADMax Water Temperatures Top Reach 1 to Bottom Reach 4. Washington State water quality standards for temperature establish criteria based on the 7-DADMax (seven day average of daily maximum temperature). The 7-DADMax criterion for the Chelan River is currently 17.5 C (see Section 5, Table 5-1), with an allowable human effect of 0.3 C above natural conditions. Natural conditions have not been defined for the Chelan River due to its current status of a river in the initial stages of restoration. However, the temperature of water exiting Lake Chelan is the initial water temperature at the beginning of the Final Lake Chelan Project No. 637 April 30, 2014 Page 13 FN/42676
19 2013 Annual and Water Temperature Report Chelan River. This water is either provided exclusively from the Low Level Outlet, which draws the coolest water available at the face of the Chelan Dam, or is from a mix of water from the spillway and the Low Level Outlet. As water flows through the Chelan River, it either heats or cools, depending on the time of year, since water exiting Lake Chelan is thermally buffered from daily and seasonal environmental influences. The 7-DADMax from the fall through early spring may be warmer at the upper Chelan River (top of Reach 1) than at the lower end where it merges with the tailrace (end of Reach 4). As solar radiation and warmer air temperatures increase from spring through summer, the 7-DADMax will increase as water flows down the Chelan River. The 7-DADMax may be nearly identical at different locations, indicating that the water temperature had reach equilibrium with the external sources of heat gain or loss prior to reaching the downstream monitoring locations. The 7-DADMax water temperatures from four locations, top of Reach 1, end of Reach 1, end of Reach 3 and end of the Reach 4 Habitat Channel are shown in Figure 4-4. During the periods when flows in Reach 4 are increased for Chinook and steelhead spawning, the water temperatures measured at the end of the Reach 4 Habitat Channel reflects the mix of water from the tailrace and water exiting Reach 3. The difference in temperature is pronounced during the spring when steelhead spawning flows are provided by the pumping station (March 15 May 15). Prior to and after the spring pumping period, the 7-DADMax at the end of Reach 3 and at the end of the Reach 4 Habitat Channel are nearly identical (Figure 4-4). The 7-DADMax at the top of Reach 1 exceeded the 17.5 C criterion from June 7 October 1, reaching a peak of 23.8 C on August 13. The 7-DADMax at the end of Reach 4 exceeded the criterion from May 10 October 1. The highest 7-DADMax reached 25.8 C on July 27, 28 and 29. The highest 7-DADMax at the ends of Reach 1 and Reach 3 were 25.8 C and 25.5 C, respectively. Figure 4-4. The 7-DADMax Water Temperatures for Reaches Daily Average Water Temperature ( C) DADMax Top of R1 7-DADMax End of R1 7-DADMax End of R3 7-DADMax End of R /1/2013 2/1/2013 3/1/2013 4/1/2013 5/1/2013 6/1/2013 7/1/2013 8/1/2013 9/1/ /1/ /1/ /1/2013 Date Lake Chelan Project No. 637 Final FN/42676 Page 14 April 30, 2014
20 2013 Annual and Water Temperature Report SECTION 5: WATER QUALITY ASSESSMENT General water quality assessment data was not collected in The requirement for general water quality assessment is that Chelan PUD conduct general water quality assessments in years 6 (2012) and 8 (2014) sufficient to demonstrate that the Chelan River meets water quality standards for dissolved oxygen, total dissolved gas, turbidity and ph. The 401 Certification specifies that this information is to be collected in Reach 4 for dissolved oxygen, turbidity and ph, whereas the total dissolved gas measurements are to be made in Reach 1 below the spillway of the Chelan Dam. Water quality criteria currently applicable to the Chelan River, which has designated aquatic life uses of salmonid spawning, rearing and migration, are shown in Table 5-1. Table 5-1. Water Quality Criteria for Salmonid Spawning, Rearing and Migration. Criteria Allowable Human Effect Water Temperature 7-DADMax <=17.5 C 0.3 C above natural conditions Dissolved Oxygen 1 Day Min. 8.0 mg/l ph Units 0.2 mg/l < 0.5 Units Turbidity - 5 NTU when Background <= 50 NTU Total Dissolved Gas 110 % Saturation None 5.1 Assessment of Dissolved Oxygen, ph and Turbidity in Reach 4 Habitat Channel. There were no measurements for dissolved oxygen, ph and turbidity collected in Reach 4 during Assessment of Total Dissolved Gas in Reach 1 Below Chelan Dam Spillway. There were no measurements for total dissolved gas taken below the Chelan Dam spillway in When spill was initiated, no safe location could be found for placing an instrument. A secure and representative method for placing an instrument for measuring TDG will be investigated in SECTION 6: SUMMARY releases were provided throughout the year from the Low Level Outlet for minimum flows of at least 80 cfs in Reaches 1-3. The runoff forecast for 2013 indicated an average water year, thus minimum flow releases to Reaches 1-3 were at least 200 cfs from May 15 July 15. Additional flow was provided from the Pump Station to the Reach 4 habitat channel for salmon and steelhead spawning during their respective spawning periods (October 15 November 30 and March 15 May 15). During the Chinook spawning period, the Chelan River Fishery Forum Final Lake Chelan Project No. 637 April 30, 2014 Page 15 FN/42676
21 2013 Annual and Water Temperature Report approved testing an alternative spawning flow using four instead of five pumps. The spawning flow levels during this test ranged from 279 cfs 292 cfs. There were two brief deviations below minimum spawning flow requirements in 2013 due to mechanical failures at the Pump Station. The FERC determined that these deviations did not constitute a violation of Article 405 of the license. s were released from the spillway, as needed for lake level control, from June 26 July 6 and July 10 July 13. Daily average flow releases for lake level control peaked at 2987 cfs on July 3, whereas the highest hourly flows of 3409 occurred during two hours on July 5. releases from the Low Level Outlet were also managed to provide whitewater boating flows on September s were ramped back down to minimum flows following the event, with ramping concluded on September 23. In 2013, Chelan PUD implemented operating criteria for compliance with the two inches per hour ramping rates that were refined in 2011 and managed flow releases using those operating criteria in conjunction with onsite monitoring of actual water level changes. The refined criteria performed well in 2012 and 2013 during the adjustments of spill flows and when ramping down from flows provided for whitewater boating in September. No further adjustments to the ramping rate operating criteria (Table 2-1) were needed in There were 231 salmon redds with eggs incubating in the tailrace from spawning that occurred in Powerhouse operations for Chinook redd protection, based on results from the previous year s tests, were implemented and monitored to determine if adequate oxygen levels were maintained in Chinook salmon redds. During this study, the tests were designed to gradually approach testing periods of time with no powerhouse flow and the period of time with no powerhouse flow was limited to a maximum of three hours. The 2013 results indicated that dissolved oxygen levels above 6.0 mg/l can be maintained in most redds, even over repeating cycles of three hours with no flow followed by one hour at minimum generation. After these studies concluded on March 22, the powerhouse operated at full capacity until April 17, by which time emergence of Chinook salmon had concluded. The powerhouse was intermittently taken out of operation from April 18 May 4 in order to manage lake refill to meet target elevations for Lake Chelan, then for the most part operated at full capacity through the rest of May. Steelhead spawning was observed in the Reach 4 habitat channel in 2013 between late March and late April, with 20 redds in the habitat channel and one in the tailrace in flows originating from the habitat channel. During the Chinook spawning period in 2013, powerhouse daily average flows were maintained above 2000 cfs from October 1 November 21. Powerhouse flows from November 22 December 1 remained above 850 cfs, with most daytime flows above 2000 cfs. A total count of 727 Chinook redds were estimated to have been deposited in the Chelan River Reach 4 (268), tailrace (319), and downstream in the Chelan/Columbia River confluence and Columbia River (140). Water temperatures were monitored at seven locations in the Chelan River and tailrace. Water temperatures neither increased nor decreased during transit through the Reach 4 habitat channel. Lake Chelan Project No. 637 Final FN/42676 Page 16 April 30, 2014
22 2013 Annual and Water Temperature Report The maximum daily average water temperatures measured from upstream to downstream locations were 23.7 C at the Low Level Outlet, 23.4 C from top of Reach 1 through end of Reach 3, 23.5 C at the bottom of Reach 4, and 24.1 C in the tailrace. The highest hourly temperatures recorded at these locations were 24.1 C, 26.1 C, 26.3 C and 24.5 C, respectively. The highest 7-DADMax temperatures recorded were 23.8 C at the top of Reach 1, 25.8 C and 25.5 C at the ends of Reaches 1 and 3, and 24.6 C at the bottom of Reach 4. Final Lake Chelan Project No. 637 April 30, 2014 Page 17 FN/42676
23
24 APPENDIX A: DAILY AVERAGE LAKE CHELAN ELEVATIONS, POWERHOUSE FLOWS, TAILWATER ELEVATIONS AND CHELAN RIVER FLOWS FROM SPILL, LOW LEVEL OUTLET AND PUMPING STATION
25
26 Lake Chelan Elevation (ft) Powerhouse Tailrace Powerhouse Tailwater Elevation (ft) Low Level Outlet Spill Chelan River Reaches 1-3 Pump Station Chelan River Reach 4 Date 1/1/ /2/ /3/ /4/ /5/ /6/ /7/ /8/ /9/ /10/ /11/ /12/ /13/ /14/ /15/ /16/ /17/ /18/ /19/ /20/ /21/ /22/ /23/ /24/ /25/ /26/ /27/ /28/ /29/ /30/ /31/ /1/ /2/ /3/ /4/ /5/ /6/ /7/ /8/ /9/ /10/ /11/ /12/ /13/ /14/ /15/ /16/ /17/ /18/ /19/
27 Lake Chelan Elevation (ft) Powerhouse Tailrace Powerhouse Tailwater Elevation (ft) Low Level Outlet Spill Chelan River Reaches 1-3 Pump Station Chelan River Reach 4 Date 2/20/ /21/ /22/ /23/ /24/ /25/ /26/ /27/ /28/ /1/ /2/ /3/ /4/ /5/ /6/ /7/ /8/ /9/ /10/ /11/ /12/ /13/ /14/ /15/ /16/ /17/ /18/ /19/ /20/ /21/ /22/ /23/ /24/ /25/ /26/ /27/ /28/ /29/ /30/ /31/ /1/ /2/ /3/ /4/ /5/ /6/ /7/ /8/ /9/ /10/
28 Lake Chelan Elevation (ft) Powerhouse Tailrace Powerhouse Tailwater Elevation (ft) Low Level Outlet Spill Chelan River Reaches 1-3 Pump Station Chelan River Reach 4 Date 4/11/ /12/ /13/ /14/ /15/ /16/ /17/ /18/ /19/ /20/ /21/ /22/ /23/ /24/ /25/ /26/ /27/ /28/ /29/ /30/ /1/ /2/ /3/ /4/ /5/ /6/ /7/ /8/ /9/ /10/ /11/ /12/ /13/ /14/ /15/ /16/ /17/ /18/ /19/ /20/ /21/ /22/ /23/ /24/ /25/ /26/ /27/ /28/ /29/ /30/
29 Lake Chelan Elevation (ft) Powerhouse Tailrace Powerhouse Tailwater Elevation (ft) Low Level Outlet Spill Chelan River Reaches 1-3 Pump Station Chelan River Reach 4 Date 5/31/ /1/ /2/ /3/ /4/ /5/ /6/ /7/ /8/ /9/ /10/ /11/ /12/ /13/ /14/ /15/ /16/ /17/ /18/ /19/ /20/ /21/ /22/ /23/ /24/ /25/ /26/ /27/ /28/ /29/ /30/ /1/ /2/ /3/ /4/ /5/ /6/ /7/ /8/ /9/ /10/ /11/ /12/ /13/ /14/ /15/ /16/ /17/ /18/ /19/
30 Lake Chelan Elevation (ft) Powerhouse Tailrace Powerhouse Tailwater Elevation (ft) Low Level Outlet Spill Chelan River Reaches 1-3 Pump Station Chelan River Reach 4 Date 7/20/ /21/ /22/ /23/ /24/ /25/ /26/ /27/ /28/ /29/ /30/ /31/ /1/ /2/ /3/ /4/ /5/ /6/ /7/ /8/ /9/ /10/ /11/ /12/ /13/ /14/ /15/ /16/ /17/ /18/ /19/ /20/ /21/ /22/ /23/ /24/ /25/ /26/ /27/ /28/ /29/ /30/ /31/ /1/ /2/ /3/ /4/ /5/ /6/ /7/
31 Lake Chelan Elevation (ft) Powerhouse Tailrace Powerhouse Tailwater Elevation (ft) Low Level Outlet Spill Chelan River Reaches 1-3 Pump Station Chelan River Reach 4 Date 9/8/ /9/ /10/ /11/ /12/ /13/ /14/ /15/ /16/ /17/ /18/ /19/ /20/ /21/ /22/ /23/ /24/ /25/ /26/ /27/ /28/ /29/ /30/ /1/ /2/ /3/ /4/ /5/ /6/ /7/ /8/ /9/ /10/ /11/ /12/ /13/ /14/ /15/ /16/ /17/ /18/ /19/ /20/ /21/ /22/ /23/ /24/ /25/ /26/ /27/
32 Lake Chelan Elevation (ft) Powerhouse Tailrace Powerhouse Tailwater Elevation (ft) Low Level Outlet Spill Chelan River Reaches 1-3 Pump Station Chelan River Reach 4 Date 10/28/ /29/ /30/ /31/ /1/ /2/ /3/ /4/ /5/ /6/ /7/ /8/ /9/ /10/ /11/ /12/ /13/ /14/ /15/ /16/ /17/ /18/ /19/ /20/ /21/ /22/ /23/ /24/ /25/ /26/ /27/ /28/ /29/ /30/ /1/ /2/ /3/ /4/ /5/ /6/ /7/ /8/ /9/ /10/ /11/ /12/ /13/ /14/ /15/ /16/
33 Lake Chelan Elevation (ft) Powerhouse Tailrace Powerhouse Tailwater Elevation (ft) Low Level Outlet Spill Chelan River Reaches 1-3 Pump Station Chelan River Reach 4 Date 12/17/ /18/ /19/ /20/ /21/ /22/ /23/ /24/ /25/ /26/ /27/ /28/ /29/ /30/ /31/
34 APPENDIX B: DAILY AVERAGE WATER TEMPERATURES
35
36 Low Level Outlet Pipe -Auto- Top of Reach 1 ) End of Reach 1 End of Reach 3 Top of R4 Habitat Channel End of R4 Habitat Channel Tailrace at Pump Intake -Auto- Tailrace at Pump Intake Date 1/1/ /2/ /3/ /4/ /5/ /6/ /7/ /8/ /9/ /10/ /11/ /12/ /13/ /14/ /15/ /16/ /17/ /18/ /19/ /20/ /21/ /22/ /23/ /24/ /25/ /26/ /27/ /28/ /29/ /30/ /31/ /1/ /2/ /3/ /4/ /5/ /6/ /7/ /8/ /9/ /10/ /11/ /12/ /13/ /14/ /15/ /16/ /17/ /18/ /19/
37 Low Level Outlet Pipe -Auto- Top of Reach 1 ) End of Reach 1 End of Reach 3 Top of R4 Habitat Channel End of R4 Habitat Channel Tailrace at Pump Intake -Auto- Tailrace at Pump Intake Date 2/20/ /21/ /22/ /23/ /24/ /25/ /26/ /27/ /28/ /1/ /2/ /3/ /4/ /5/ /6/ /7/ /8/ /9/ /10/ /11/ /12/ /13/ /14/ /15/ /16/ /17/ /18/ /19/ /20/ /21/ /22/ /23/ /24/ /25/ /26/ /27/ /28/ /29/ /30/ /31/ /1/ /2/ /3/ /4/ /5/ /6/ /7/ /8/ /9/ /10/
38 Low Level Outlet Pipe -Auto- Top of Reach 1 ) End of Reach 1 End of Reach 3 Top of R4 Habitat Channel End of R4 Habitat Channel Tailrace at Pump Intake -Auto- Tailrace at Pump Intake Date 4/11/ /12/ /13/ /14/ /15/ /16/ /17/ /18/ /19/ /20/ /21/ /22/ /23/ /24/ /25/ /26/ /27/ /28/ /29/ /30/ /1/ /2/ /3/ /4/ /5/ /6/ /7/ /8/ /9/ /10/ /11/ /12/ /13/ /14/ /15/ /16/ /17/ /18/ /19/ /20/ /21/ /22/ /23/ /24/ /25/ /26/ /27/ /28/ /29/ /30/
39 Low Level Outlet Pipe -Auto- Top of Reach 1 ) End of Reach 1 End of Reach 3 Top of R4 Habitat Channel End of R4 Habitat Channel Tailrace at Pump Intake -Auto- Tailrace at Pump Intake Date 5/31/ /1/ /2/ /3/ /4/ /5/ /6/ /7/ /8/ /9/ /10/ /11/ /12/ /13/ /14/ /15/ /16/ /17/ /18/ /19/ /20/ /21/ /22/ /23/ /24/ /25/ /26/ /27/ /28/ /29/ /30/ /1/ /2/ /3/ /4/ /5/ /6/ /7/ /8/ /9/ /10/ /11/ /12/ /13/ /14/ /15/ /16/ /17/ /18/ /19/
40 Low Level Outlet Pipe -Auto- Top of Reach 1 ) End of Reach 1 End of Reach 3 Top of R4 Habitat Channel End of R4 Habitat Channel Tailrace at Pump Intake -Auto- Tailrace at Pump Intake Date 7/20/ /21/ /22/ /23/ /24/ /25/ /26/ /27/ /28/ /29/ /30/ /31/ /1/ /2/ /3/ /4/ /5/ /6/ /7/ /8/ /9/ /10/ /11/ /12/ /13/ /14/ /15/ /16/ /17/ /18/ /19/ /20/ /21/ /22/ /23/ /24/ /25/ /26/ /27/ /28/ /29/ /30/ /31/ /1/ /2/ /3/ /4/ /5/ /6/ /7/
41 Low Level Outlet Pipe -Auto- Top of Reach 1 ) End of Reach 1 End of Reach 3 Top of R4 Habitat Channel End of R4 Habitat Channel Tailrace at Pump Intake -Auto- Tailrace at Pump Intake Date 9/8/ /9/ /10/ /11/ /12/ /13/ /14/ /15/ /16/ /17/ /18/ /19/ /20/ /21/ /22/ /23/ /24/ /25/ /26/ /27/ /28/ /29/ /30/ /1/ /2/ /3/ /4/ /5/ /6/ /7/ /8/ /9/ /10/ /11/ /12/ /13/ /14/ /15/ /16/ /17/ /18/ /19/ /20/ /21/ /22/ /23/ /24/ /25/ /26/ /27/
42 Low Level Outlet Pipe -Auto- Top of Reach 1 ) End of Reach 1 End of Reach 3 Top of R4 Habitat Channel End of R4 Habitat Channel Tailrace at Pump Intake -Auto- Tailrace at Pump Intake Date 10/28/ /29/ /30/ /31/ /1/ /2/ /3/ /4/ /5/ /6/ /7/ /8/ /9/ /10/ /11/ /12/ /13/ /14/ /15/ /16/ /17/ /18/ /19/ /20/ /21/ /22/ /23/ /24/ /25/ /26/ /27/ /28/ /29/ /30/ /1/ /2/ /3/ /4/ /5/ /6/ /7/ /8/ /9/ /10/ /11/ /12/ /13/ /14/ /15/ /16/
43 Low Level Outlet Pipe -Auto- Top of Reach 1 ) End of Reach 1 End of Reach 3 Top of R4 Habitat Channel End of R4 Habitat Channel Tailrace at Pump Intake -Auto- Tailrace at Pump Intake Date 12/17/ /18/ /19/ /20/ /21/ /22/ /23/ /24/ /25/ /26/ /27/ /28/2013 N/A /29/2013 N/A /30/2013 N/A /31/2013 N/A
44 APPENDIX C: MINIMUM FLOW DEVIATION REPORTS
45
46
47
48

49
50
51
52
53
54
55
56
57
58

59
60
61
62
63

64
*iiiii. May 31, 2017 VIA ELECTRONIC FILING
 *iiiii. PUBLIC UTILITY DISTRICT NO. I of CHELAN COUNTY P.O. Box 1231, Wenatchee, WA 98807-1231 327 N. Wenatchee Ave., Wenatchee, WA 98801 (509) 663-8121 Toll free 1-888-663-8121 www.chelanpud.org May 31,
SNOHOMISH COUNTY PUBLIC UTILITY DISTRICT NO.1. Your Northwest renewables utility
 SNOHOMISH COUNTY PUBLIC UTILITY DISTRICT NO.1 Your Northwest renewables utility May 17, 2013 VIA ELECTRONIC FILING Kimberly D. Bose, Secretary Federal Energy Regulatory Commission (FERC) 888 First Street
Henry M. Jackson Hydroelectric Project (FERC No. 2157)
") Henry M. Jackson Hydroelectric Project (FERC No. 2157) License Article 401: Water Quality Monitoring Plan 2013 Annual Report Everett, WA Final This document has been prepared for the District. It has been
Henry M. Jackson Hydroelectric Project (FERC No. 2157) License Article 401: Water Quality Monitoring Plan 2013 Annual Report Everett, WA Final This document has been prepared for the District. It has been
Appendix N. The 2006 Fish Passage Implementation Plan
 Appendix N The 2006 Fish Passage Implementation Plan 2006 Fish Passage Implementation Plan March 31, 2006 Background: The 2006 Fish Passage Implementation Plan describes the Corps plan for fish passage
CUSHMAN HYDROELECTRIC PROJECT. Pat McCarty, Generation Manager
 CUSHMAN HYDROELECTRIC PROJECT Pat McCarty, Generation Manager AGENDA A picture tour of Cushman Relicense history Relicense requirements Fisheries Flows & reservoir elevations Cultural/historical resources
6.3 SUBSTRATE COMPOSITION AND QUALITY
 6.3 SUBSTRATE COMPOSITION AND QUALITY 6.3.1 METHODS The Wolman pebble count procedure (Wolman, 1954) is used to measure the diameter of the intermediate axis of 100 randomly selected stones along transects
Annual Fish Passage Report 2012 Columbia and Snake River Projects
 US Army Corps of Engineers Portland District Walla Walla District Annual Fish Passage Report 2012 Columbia and Snake River Projects 2012 ANNUAL FISH PASSAGE REPORT COLUMBIA AND SNAKE RIVERS for SALMON,
August 15, Please contact the undersigned directly with any questions or concerns regarding the foregoing.
 California Independent System Operator Corporation The Honorable Kimberly D. Bose Secretary Federal Energy Regulatory Commission 888 First Street, NE Washington, DC 20426 August 15, 2017 Re: California
March 14, Please contact the undersigned directly with any questions or concerns regarding the foregoing.
 California Independent System Operator Corporation The Honorable Kimberly D. Bose Secretary Federal Energy Regulatory Commission 888 First Street, NE Washington, DC 20426 March 14, 2017 Re: California
February 10, The Honorable Kimberly D. Bose Secretary Federal Energy Regulatory Commission 888 First Street, NE Washington, DC 20426
 California Independent System Operator Corporation February 10, 2016 The Honorable Kimberly D. Bose Secretary Federal Energy Regulatory Commission 888 First Street, NE Washington, DC 20426 Re: California
Solar Power. Demonstration Site. Annual Performance Report 2017
 Solar Power Demonstration Site Annual Performance Report 217 Version :1. July 12, 218 Solar Power Demonstration Site 217 Performance Report Introduction INTRODUCTION The Solar Power Demonstration Site
December 4, Docket: ER Energy Imbalance Market Special Report Transition Period July 2018 for Idaho Power Company
 California Independent System Operator Corporation December 4, 2018 The Honorable Kimberly D. Bose Secretary Federal Energy Regulatory Commission 888 First Street, NE Washington, DC 20426 Re: California
Appendix E Water Supply Modeling
 Supply Modeling Modesto Irrigation District Treatment Plant Expansion Project Modeling I. Introduction The Modesto Irrigation District (MID) is situated adjacent to and north of the Tuolumne River. Over
State of California The Resources Agency DEPARTMENT OF FISH AND GAME
 State of California The Resources Agency DEPARTMENT OF FISH AND GAME BUTTE CREEK SPRING-RUN CHINOOK SALMON, ONCORYHNCHUS TSHAWYTSCHA PRE-SPAWN MORTALITY EVALUATION 2013 By Clint E. Garman Inland Fisheries
Merger of the generator interconnection processes of Valley Electric and the ISO;
 California Independent System Operator Corporation Memorandum To: ISO Board of Governors From: Karen Edson Vice President, Policy & Client Services Date: August 18, 2011 Re: Decision on Valley Electric
Weekly Report #18 16
 Visit our Website at www.fpc.org Fish Passage Center Weekly Report #18 16 847 NE 19th Ave., Suite 250 Portland, OR 97232 (503) 833-3900 June 22, 2018 This Week s Highlights Water Supply Precipitation throughout
LONG RANGE PERFORMANCE REPORT. Study Objectives: 1. To determine annually an index of statewide turkey populations and production success in Georgia.
 State: Georgia Grant Number: 08-953 Study Number: 6 LONG RANGE PERFORMANCE REPORT Grant Title: State Funded Wildlife Survey Period Covered: July 1, 2010 - June 30, 2011 Study Title: Wild Turkey Production
McNary Northshore Fishway Hydro Project. History & Lessons Learned
 McNary Northshore Fishway Hydro Project History & Lessons Learned May 6, 2017 21 th Annual TECHNICAL SEMINAR Machines, Maintenance, and Management: Keeping Hydro Facilities Up and Running History & Lessons
Department of Market Quality and Renewable Integration November 2016
 Energy Imbalance Market March 23 June 3, 216 Available Balancing Capacity Report November 1, 216 California ISO Department of Market Quality and Renewable Integration California ISO i TABLE OF CONTENTS
REASONABLE FURTHER PROGRESS REPORT FOR THE MONO BASIN PM-10 STATE IMPLEMENTATION PLAN
 REASONABLE FURTHER PROGRESS REPORT FOR THE MONO BASIN PM-10 STATE IMPLEMENTATION PLAN September 2001 This document provides a progress report on air quality trends in the Mono Basin federal PM-10 1 nonattainment
October 17, Please contact the undersigned directly with any questions or concerns regarding the foregoing.
 California Independent System Operator Corporation The Honorable Kimberly D. Bose Secretary Federal Energy Regulatory Commission 888 First Street, NE Washington, DC 20426 October 17, 2017 Re: California
Omineca Region Stocked Lake Assessment Report
 Executive Mackenzie Lake #1 West 2004 Stocking assessments were conducted at Mackenzie Lake #1 West in 2000, 2003 and 2004 to determine the status of the fishery. Mackenzie Lake #1 West is 16.9 ha and
ALBENI FALLS DAM AND LAKE PEND OREILLE
 ALBENI FALLS DAM AND LAKE PEND OREILLE Fall Public Meeting 237 237 237 217 217 217 200 200 200 0 0 0 163 163 163 131 132 122 Aug. 7, 2017 255 255 255 239 65 53 80 119 27 252 174.59 83 36 118 110 135 120
2012 Water Consumption Statistics Report. Water Services Department
 212 Water Consumption Statistics Report Water Services Department Issued: December 213 TABLE OF CONTENTS 212 Water Consumption Statistics Report December 213 212 GVWD Statistics Book - Notes...3 Annual
ELECTRIC POWER BOARD OF THE METROPOLITAN GOVERNMENT OF NASHVILLE AND DAVIDSON COUNTY. Availability
 ELECTRIC POWER BOARD OF THE METROPOLITAN GOVERNMENT OF NASHVILLE AND DAVIDSON COUNTY MANUFACTURING SERVICE RATE--SCHEDULE MSD Availability This rate shall apply to the firm electric power requirements
ELECTRIC POWER BOARD OF THE METROPOLITAN GOVERNMENT OF NASHVILLE AND DAVIDSON COUNTY. LARGE MANUFACTURING SERVICE RATE SCHEDULES (November 2018)
") ELECTRIC POWER BOARD OF THE METROPOLITAN GOVERNMENT OF NASHVILLE AND DAVIDSON COUNTY LARGE MANUFACTURING SERVICE RATE SCHEDULES () Availability These rates shall apply to the firm electric power requirements
ELECTRIC POWER BOARD OF THE METROPOLITAN GOVERNMENT OF NASHVILLE AND DAVIDSON COUNTY LARGE MANUFACTURING SERVICE RATE SCHEDULES () Availability These rates shall apply to the firm electric power requirements
FLORENCE ELECTRICITY DEPARTMENT. MANUFACTURING SERVICE RATE--SCHEDULE TDMSA (October 2015) Availability
 Availability") FLORENCE ELECTRICITY DEPARTMENT MANUFACTURING SERVICE RATE--SCHEDULE TDMSA () Availability This rate shall apply to the firm electric power requirements where (a) a customer s currently effective onpeak
FLORENCE ELECTRICITY DEPARTMENT MANUFACTURING SERVICE RATE--SCHEDULE TDMSA () Availability This rate shall apply to the firm electric power requirements where (a) a customer s currently effective onpeak
Large General Service Time-of-Use Storage Program
 Large General Service Time-of-Use Storage Program AVAILABILITY Available throughout the Company s entire electric service area where the facilities of the Company are of adequate capacity and are adjacent
Emerald People s Utility District RATE SCHEDULES. Rate Schedules Effective April 1, 2018
 Emerald People s Utility District RATE SCHEDULES 2018 Rate Schedules Effective April 1, 2018 Connect With Us 33733 Seavey Loop, Eugene, OR 97405 Phone: 541-746-1583 Toll-free: 800-422-4086 Fax: 866-284-7953
January 18, Docket: ER Energy Imbalance Market Special Report Transition Period August 2018 for Idaho Power Company
 California Independent System Operator Corporation January 18, 2019 The Honorable Kimberly D. Bose Secretary Federal Energy Regulatory Commission 888 First Street, NE Washington, DC 20426 Re: California
Meridian Township Range Sections Seward 5N 4W 33,34 Seward 4N 4W 4,9
 ATTACHMENT A. RUSSIAN RIVER RESERVATION OF WATER APPLICATION. Page 1 LOCATION OF PROPOSED RESERVATION OF WATER Meridian Township Range Sections Seward 5N 4W 33,34 Seward 4N 4W 4,9 Russian River is located
Act 229 Evaluation Report
 R22-1 W21-19 W21-20 Act 229 Evaluation Report Prepared for Prepared by Table of Contents 1. Documentation Page 3 2. Executive Summary 4 2.1. Purpose 4 2.2. Evaluation Results 4 3. Background 4 4. Approach
LONG RANGE PERFORMANCE REPORT. Study Objectives: 1. To determine annually an index of statewide turkey populations and production success in Georgia.
 State: Georgia Grant Number: 8-1 Study Number: 6 LONG RANGE PERFORMANCE REPORT Grant Title: State Funded Wildlife Survey Period Covered: July 1, 1998 - June 30, 1999 Study Title: Wild Turkey Production
A Guide to the medium General Service. BC Hydro Last Updated: February 24, 2012
 A Guide to the medium General Service Conservation Rate BC Hydro Last Updated: February 24, 2012 Executive summary The way Medium General Service (MGS) accounts pay for electricity is changing. MGS is
1999 Annual Report To the Oregon Department of Environmental Quality
 1999 Annual Report To the Oregon Department of Environmental Quality February 25, 2000 ODEQ Annual Report Table of Contents Introduction................................................................
Weekly Report #18 19
 Visit our Website at www.fpc.org Fish Passage Center Weekly Report #18 19 847 NE 19th Ave., Suite 250 Portland, OR 97232 (503) 833-3900 July 13, 2018 This Week s Highlights Water Supply Precipitation throughout
Element #2: Additional analysis of Tuolumne River below La Grange Dam (USGS # );
;") Districts Response to NMFS-4, Element 1 through 6 Effects of Don Pedro Project and Related Facilities on Hydrology for Anadromous Fish: Magnitude, Timing, Duration, and Rate of Change 1.0 Background On
Districts Response to NMFS-4, Element 1 through 6 Effects of Don Pedro Project and Related Facilities on Hydrology for Anadromous Fish: Magnitude, Timing, Duration, and Rate of Change 1.0 Background On
Brake Pad Copper Reduction - Metrics for Tracking Progress
 Brake Pad Copper Reduction - Metrics for Tracking Progress Technical Memo California Stormwater Quality Association tdc environmental MEMO TO: CASQA DATE: FROM: Kelly D. Moran, Ph.D. PROJECT: 79 SUBJECT:
Action Requested From AMWG
 Action Requested From AMWG NONE, These Two Presentations Are For Information Transfer Only The information is derived from a multi-year synthesis research effort related to existing data on flow, sediment-transport
MONTHLY NEW RESIDENTIAL SALES, AUGUST 2017
 FOR RELEASE AT 10:00 AM EDT, TUESDAY, SEPTEMBER 26, MONTHLY NEW RESIDENTIAL SALES, AUGUST Release Number: CB17-161 Notice: For information on the impact of Hurricanes Harvey and Irma on the compilation
Missouri River Mainstem Reservoir System Hydrologic Statistics on Inflows Technical Report
 Missouri River Mainstem Reservoir System Hydrologic Statistics on Inflows Technical Report Fort Peck Garrison Oahe Big Bend Fort Randall Gavins Point Missouri River Basin Water Management Division Omaha,
Worcester Public Schools Student Transportation Contract Proposed Bid Specification Change Summary Sheet
 Worcester Public Schools 2020-2022 Student Transportation Contract Proposed Bid Specification Change Summary Sheet 1 for a five-year period beginning the First Day of Summer School 2015 and ending on the
Water Consumption Statistics Report
 Water Consumption Statistics Report Operations and Maintenance Department 29 Edition TABLE OF CONTENTS 29 Water Consumption Statistics Report October 21 SYSTEM AND MUNICIPAL CONSUMPTION 29 GVWD Statistics
Docket No. ER June 2018 Informational Report Energy Imbalance Market Transition Period Report Idaho Power Company
 California Independent System Operator Corporation August 21, 2018 The Honorable Kimberly D. Bose Secretary Federal Energy Regulatory Commission 888 First Street, NE Washington, DC 20426 Re: California
A9 Data Monitoring and Analysis Report. January Content. 1. Executive Summary. 2. Overview. 3. Purpose. 4. Baseline Data Sources
 A9 Data Monitoring and Analysis Report January 2018 Content 1. Executive Summary 2. Overview 3. Purpose 4. Baseline Data Sources 5. Casualty Analysis 6. Vehicle Speed Data 7. Incident Frequency & Impact
CAPACITY LIMITED RESOURCES (CLR) / ENERGY LIMITED RESOURCES (ELR)
 / ENERGY LIMITED RESOURCES (ELR)") CAPACITY LIMITED RESOURCES (CLR) / ENERGY LIMITED RESOURCES (ELR) 1 INTRODUCTION A new bidding mechanism is available for qualified generators which allows them to offer generation in the New York market
CAPACITY LIMITED RESOURCES (CLR) / ENERGY LIMITED RESOURCES (ELR) 1 INTRODUCTION A new bidding mechanism is available for qualified generators which allows them to offer generation in the New York market
A REPORT TO. Electrical. Mechanical. Civil. Protection & Control. Transmission & Distribution. Telecontrol. System Planning
 A REPORT TO THE BOARD OF COMMISSIONERS OF PUBLIC UTILITIES Electrical 4v ^c 0:01'1 S0^O c.. ^ '^ W E. G. PIERCY i^ x zoto/off/zq,.'ftrif4^#ft^^,' r Mechanical Civil Protection & Control Transmission &
5. Effective Date: On the first day of the first quarter, after applicable regulatory approval.
 A. Introduction 1. Title: System Operating Limits 2. Number: TOP-007-WECC-1a 3. Purpose: When actual flows on Major WECC Transfer Paths exceed System Operating Limits (SOL), their associated schedules
2016 Meteorological Summary for the Galeta Marine Island Laboratory. Prepared by: Steven Paton
 0 2016 Meteorological Summary for the Galeta Marine Island Laboratory Prepared by: Steven Paton 1 Introduction This is the fourth in a series of yearly reports summarising the past year s Smithsonian Tropical
2017 Adjusted Count Report February 12, 2018
 A statewide multi-use trail user study and volunteer data collection program 2017 Adjusted Count Report February 12, 2018 The following report includes the final adjusted infrared (IR) counter data at
Capacity Market Rules for Energy Storage Resources
 Capacity Market Rules for Energy Storage Resources Zachary T Smith Manager, Capacity Market Design ICAPWG August 23 rd, 2018 Agenda Background Energy Storage Resource (ESR) overview Capacity Market Rules
FINAL LICENSE APPLICATION Exhibit A Description of Project
 FINAL LICENSE APPLICATION Exhibit A Description of Project PacifiCorp Portland, Oregon April 2004 Copyright 2004 by PacifiCorp Reproduction in whole or in part without the written consent of PacifiCorp
Appendix E Hydrology, Erosion and Sediment Transport Studies
 Appendix E Hydrology, Erosion and Sediment Transport Studies Hatch 2012/10 Appendix E1 EA Hydrology Memorandum February 2011 (Hatch. 2011a) Hatch 2012/10 Project Memo February 23, 2011 TO: Larry King FROM:
January 18, Docket: ER Energy Imbalance Market Special Report Transition Period September 2018 for Idaho Power Company
 California Independent System Operator Corporation January 18, 2019 The Honorable Kimberly D. Bose Secretary Federal Energy Regulatory Commission 888 First Street, NE Washington, DC 20426 Re: California
October 1, Docket: ER Energy Imbalance Market Special Report Transition Period June 2018 for Powerex Corp.
 California Independent System Operator Corporation The Honorable Kimberly D. Bose Secretary Federal Energy Regulatory Commission 888 First Street, NE Washington, DC 20426 October 1, 2018 Re: California
New Jersey State Report
 New Jersey State Report July 2017 Table of Contents 1. Planning Generation Portfolio Analysis Transmission Analysis Load Forecast 2. Markets Capacity Market Results Market Analysis 3. Operations Emissions
Portland General Electric Company Eleventh Revision of Sheet No. 7-1 P.U.C. Oregon No. E-18 Canceling Tenth Revision of Sheet No.
 Portland General Electric Company Eleventh Revision of Sheet No. 7-1 P.U.C. Oregon No. E-18 Canceling Tenth Revision of Sheet No. 7-1 AVAILABLE In all territory served by the Company. APPLICABLE To Residential
Rate Schedules. Effective 1/1/2019
 Rate Schedules 2019 Effective 1/1/2019 SUMMARY OF RATE SCHEDULES REVISIONS FOR RATES EFFECTIVE JANUARY 1, 2019 (1) Rate component changes for Residential and Heating Service rate schedules. (2) General
Thirty Years of Climatological Data: 1969 to 1998
 Thirty Years of Climatological Data: 1969 to 1998 NMSU's Agricultural Science Center at Farmington, New Mexico Agricultural Experiment Station Research Report 744 College of Agriculture and Home Economics
ENVIRONMENTAL & ENGINEERING SERVICES DEPARTMENT
 CITY OF LONDON ENVIRONMENTAL & ENGINEERING SERVICES DEPARTMENT WASTEWATER TREATMENT OPERATIONS VAUXHALL WASTEWATER TREATMENT PLANT 2013 ANNUAL REPORT FEBRUARY 2014 Vauxhall Wastewater Treatment Plant 2013
ELECTRIC POWER BOARD OF THE METROPOLITAN GOVERNMENT OF NASHVILLE AND DAVIDSON COUNTY. Availability
 ELECTRIC POWER BOARD OF THE METROPOLITAN GOVERNMENT OF NASHVILLE AND DAVIDSON COUNTY GENERAL POWER RATE--SCHEDULE GSB Availability This rate shall apply to the firm electric power requirements where a
BEFORE THE CANTERBURY REGIONAL COUNCIL. Act 1991 AND. of Plan Change 3 to the Waitaki Catchment Water Allocation Regional Plan
 BEFORE THE CANTERBURY REGIONAL COUNCIL IN THE MATTER of the Resource Management Act 1991 AND IN THE MATTER of Change 3 to the Waitaki Catchment Water Allocation Regional STATEMENT OF EVIDENCE OF DAVID
Project Description - 1 -
 Project Description The Mother Ann Lee Hydroelectric Station is located at Lock and Dam 7 on the Kentucky River. This dam is part of a system of 14 lock and dams installed on the Kentucky River between
2017 Meteorological Summary for the Galeta Marine Island Laboratory. Prepared by: Steven Paton
 0 2017 Meteorological Summary for the Galeta Marine Island Laboratory Prepared by: Steven Paton 1 Introduction This is the 5 th in a series of yearly reports summarising the past year s Smithsonian Tropical
Expansion Projects Description
 Expansion Projects Description The Turnpike expansion program was authorized by the Florida Legislature in 1990 to meet the State s backlog of needed highway facilities. The Legislature set environmental
SUBJECT: Russell Hill Subway Train Accident Of August 11, 1995 Due Diligence Checklist Update
 MEETING DATE: August 31, 2005 SUBJECT: Russell Hill Subway Train Accident Of August 11, 1995 Due Diligence Checklist Update RECOMMENDATION It is recommended that the Commission: i) Receive for information
To: Honorable Public Utilities Board Submitted by: /s/ Barry Leska AGM Energy Resources Planning. From: Sarah Liuba Approved by: /s/
 AGENDA ITEM NO.: 4.G. To: Honorable Public Utilities Board Submitted by: /s/ Barry Leska AGM Energy Resources Planning From: Sarah Liuba Approved by: /s/ Energy Resources Analyst Nicolas Procos General
FLORENCE ELECTRICITY DEPARTMENT. GENERAL POWER RATE--SCHEDULE GSC (October 2015) Availability
 Availability") FLORENCE ELECTRICITY DEPARTMENT GENERAL POWER RATE--SCHEDULE GSC () Availability This rate shall apply to the firm electric power requirements where a customer s currently effective onpeak or offpeak contract
FLORENCE ELECTRICITY DEPARTMENT GENERAL POWER RATE--SCHEDULE GSC () Availability This rate shall apply to the firm electric power requirements where a customer s currently effective onpeak or offpeak contract
FITCHBURG GAS AND ELECTRIC LIGHT COMPANY NET METERING SCHEDULE NM
 Sheet 1 FITCHBURG GAS AND ELECTRIC LIGHT COMPANY SCHEDULE NM Applicability The following tariff provisions shall be applicable to a Host Customer, as defined herein, that requests net metering services
Section 5. Crude Oil and Natural Gas Resource Development
 Section 5. Crude Oil and Natural Gas Resource Development The September 4 rotary rig count was 1,4, slightly higher than the count in August 4 and 13 percent higher than the count in September 3. Of the
2015 Fish Passage Plan
 March 1, 2015 2015 Fish Passage Plan Chapter 4 John Day Dam Table of Contents 1. FISH PASSAGE INFORMATION... 5 1.1. JUVENILE FISH.... 5 1.2. ADULT FISH.... 7 2. PROJECT OPERATIONS... 9 2.1. GENERAL....
A9 Data Monitoring and Analysis Report. March Content. 1. Executive Summary and Key Findings. 2. Overview. 3. Purpose
 A9 Data Monitoring and Analysis Report March 2018 Content 1. Executive Summary and Key Findings 2. Overview 3. Purpose 4. Baseline Data Sources and Methodology 5. Casualty Analysis 6. Vehicle Speed Data
Determination of Monthly Means of Daily Solar Radiation and its Variability: A Summary (continued)
") Introduction Section 5.3 MONTHLY MEANS OF DAILY SOLAR RADIATION AND ITS VARIABILITY R.E. Schulze, M. Maharaj and R.D. Chapman The maps and statistics of solar radiation in this Section supersede the ones
Introduction Section 5.3 MONTHLY MEANS OF DAILY SOLAR RADIATION AND ITS VARIABILITY R.E. Schulze, M. Maharaj and R.D. Chapman The maps and statistics of solar radiation in this Section supersede the ones
DRIVER SPEED COMPLIANCE WITHIN SCHOOL ZONES AND EFFECTS OF 40 PAINTED SPEED LIMIT ON DRIVER SPEED BEHAVIOURS Tony Radalj Main Roads Western Australia
 DRIVER SPEED COMPLIANCE WITHIN SCHOOL ZONES AND EFFECTS OF 4 PAINTED SPEED LIMIT ON DRIVER SPEED BEHAVIOURS Tony Radalj Main Roads Western Australia ABSTRACT Two speed surveys were conducted on nineteen
Memorandum October 5, 2017
 614 Magnolia Avenue Ocean Springs, Mississippi 39564 228.818.9626 Memorandum October 5, 2017 To: Gary Miller, U.S. Environmental Protection Agency From: David Keith, John Laplante, Matt Henderson, and
September 2016 Water Production & Consumption Data
 September 2016 Water Production & Consumption Data September 2016 monthly water production (288.48 AF) was lowest in at least 17 years. Monthly water production has increased slightly each month since
2016 Meteorological and Oceanographic Summary for the Bocas del Toro Research Station. Prepared by: Steven Paton
 0 2016 Meteorological and Oceanographic Summary for the Bocas del Toro Research Station Prepared by: Steven Paton 1 Introduction This is the forth of a series of yearly reports summarising the past year
Investigation of the Impact the I-94 ATM System has on the Safety of the I-94 Commons High Crash Area
 Investigation of the Impact the I-94 ATM System has on the Safety of the I-94 Commons High Crash Area John Hourdos and Stephen Zitzow Minnesota Traffic Observatory Overview Project Objectives I- 94 High
ELECTRIC SCHEDULE AG-ICE Sheet 1 AGRICULTURAL INTERNAL COMBUSTION ENGINE CONVERSION INCENTIVE RATE - EXPIRATION TRANSITION RATE
 Revised Cal. P.U.C. Sheet No. 36458-E Cancelling Revised Cal. P.U.C. Sheet No. 36036-E ELECTRIC SCHEDULE AG-ICE Sheet 1 APPLICABILITY: This rate schedule is available to agricultural customers who currently
Residential Load Profiles
 Residential Load Profiles TABLE OF CONTENTS PAGE 1 BACKGROUND... 1 2 DATA COLLECTION AND ASSUMPTIONS... 1 3 ANALYSIS AND RESULTS... 2 3.1 Load Profiles... 2 3.2 Calculation of Monthly Electricity Bills...
NORTHEAST NEBRASKA PUBLIC POWER DISTRICT RATE SCHEDULE LP-2 Large Power Service. Effective: For bills rendered on and after January 1, 2014.
 NORTHEAST NEBRASKA PUBLIC POWER DISTRICT RATE SCHEDULE LP-2 Large Power Service Effective: For bills rendered on and after January 1, 2014. SECTION 1. AVAILABILITY AND APPLICABILITY 1.1 This Rate Schedule
Meter Insights for Downtown Store
 Meter Insights for Downtown Store Commodity: Analysis Period: Prepared for: Report Date: Electricity 1 December 2013-31 December 2014 Arlington Mills 12 February 2015 Electricity use over the analysis
GENERAL INFORMATION 15. MARKET SUPPLY CHARGE ("MSC")
") P.S.C. NO. 3 ELECTRICITY LEAF: 214 ORANGE AND ROCKLAND UTILITIES, INC. REVISION: 3 INITIAL EFFECTIVE DATE: November 1, 2015 SUPERSEDING REVISION: 1 Issued in compliance with Order in Case 14-E-0493 dated
P.S.C. NO. 3 ELECTRICITY LEAF: 214 ORANGE AND ROCKLAND UTILITIES, INC. REVISION: 3 INITIAL EFFECTIVE DATE: November 1, 2015 SUPERSEDING REVISION: 1 Issued in compliance with Order in Case 14-E-0493 dated
NORTHEAST NEBRASKA PUBLIC POWER DISTRICT RATE SCHEDULE LP-2 Large Power Service. Effective: For bills rendered on and after February 1, 2019.
 NORTHEAST NEBRASKA PUBLIC POWER DISTRICT RATE SCHEDULE LP-2 Large Power Service Effective: For bills rendered on and after February 1, 2019. SEDC:60/7/8/9 SECTION 1. AVAILABILITY AND APPLICABILITY 1.1
Decision on Merced Irrigation District Transition Agreement
 California Independent System Operator Corporation Memorandum To: ISO Board of Governors From: Karen Edson, Vice President Policy & Client Services Date: March 13, 2013 Re: Decision on Merced Irrigation
Taxis and Accessible Services Division Medallion Reform Background May 1, 2018
 Introduction: Taxis and Accessible Services Division Medallion Reform Background May 1, 2018 SFMTA s Taxis and Accessible Services Division is responsible for the regulation of the private businesses that
Flows Atlas. Compilation of instream flow & estuary inflow statistics for the Sabine and Neches River Basins and Sabine Lake
 Compilation of instream flow & estuary inflow statistics for the Sabine and Neches River Basins and Sabine Lake April 2010 FLOWS ATLAS Compilation of instream flow & estuary inflow statistics for the Sabine
UC Santa Cruz TAPS 3-Year Fee & Fare Proposal, through
 UC Santa Cruz TAPS 3-Year Fee & Fare Proposal, 2016-17 through 2018-19 Introduction Transportation and Parking Services (TAPS) proposes a three-year series of annual increases to most Parking fees and
FOR IMMEDIATE RELEASE
 Article No. 5842 Available on www.roymorgan.com Roy Morgan Unemployment Profile Thursday, 2 October 2014 Unemployment climbs to 9.9% in September as full-time work lowest since October 2011; 2.2 million
LOCAL CLIMATOLOGICAL DATA
 ILLINOIS STATE WATER SURVEY DIVISION URBANA, ILLINOIS ISWS MP-21 Archive SWS0964 Illinois State Water Survey LOCAL CLIMATOLOGICAL DATA FDR HILLSBORO, IL. 1901-1962 LOCAL CLIMATOLOGICAL DATA 1901-1962 HILLSBORO
Summary. IEEJ: November 2011 All Rights Reserved. Yu Nagatomi *
 Estimate of the Electricity-Saving Effects Taking Account of Change Effects in the Service Areas of Tokyo Electric Power Company and Tohoku Electric Power Company Yu Nagatomi * Summary Power generation
3.17 Energy Resources
 3.17 Energy Resources 3.17.1 Introduction This section characterizes energy resources, usage associated with the proposed Expo Phase 2 project, and the net energy demand associated with changes to the
2017 Meteorological and Oceanographic Summary for the Bocas del Toro Research Station. Prepared by: Steven Paton
 0 2017 Meteorological and Oceanographic Summary for the Bocas del Toro Research Station Prepared by: Steven Paton 1 Introduction This is the 5 th of a series of yearly reports summarising the past year
Downtown Lee s Summit Parking Study
 Downtown Lee s Summit Parking Study As part of the Downtown Lee s Summit Master Plan, a downtown parking and traffic study was completed by TranSystems Corporation in November 2003. The parking analysis
SEAPA Board of Director s Meeting Director of Special Projects Report Petersburg, Alaska September 14, 2015
 SEAPA Board of Director s Meeting Director of Special Projects Report Petersburg, Alaska September 14, 2015 Dam Powerhouse Falls Cr. Discharge into Carroll Inlet Photo Taken May 2015 9/15/2015 SEAPA Board
NPCC Natural Gas Disruption Risk Assessment Background. Summer 2017
 Background Reliance on natural gas to produce electricity in Northeast Power Coordinating Council (NPCC) Region has been increasing since 2000. The disruption of natural gas pipeline transportation capability
Ambient PM 10 Monitoring Sechelt, B.C Update
 Ministry of Environment LOWER MAINLAND REGION Ambient PM 10 Monitoring Sechelt, B.C. 2004-2005 Update E N V I R O N M E N T A L Q U A L I T Y Library and Archives Canada Cataloguing in Publication Data
MONTHLY NEW RESIDENTIAL SALES, SEPTEMBER 2018
 FOR RELEASE AT 10:00 AM EDT, WEDNESDAY, OCTOBER 24, MONTHLY NEW RESIDENTIAL SALES, SEPTEMBER Release Number: CB18 160 October 24, The U.S. Census Bureau and the U.S. Department of Housing and Urban Development
Consolidated Edison Company of New York, Inc.
 PSC NO: 11 Electricity Leaf: 1 Initial Superseding Economic Development Delivery Service No. 2 Consolidated Edison Company of New York, Inc. Schedule For Economic Development Delivery Service Subsequent
Presentation to: Cedar Hills City Council Division of Water Quality Utah Department of Environmental Quality
 American Fork Canyon Water Quality Presentation to: Cedar Hills City Council Utah Department of Environmental Quality Meeting Purpose 1. Provide an overview of general water quality conditions in American