ALBENI FALLS DAM AND LAKE PEND OREILLE
|
|
|
- Felix Norton
- 6 years ago
- Views:
Transcription
1 ALBENI FALLS DAM AND LAKE PEND OREILLE Fall Public Meeting Aug. 7, The views, opinions and findings contained in this report are those of the authors(s) and should not be construed as an official Department of the Army position, policy or decision, unless so designated by other official documentation


2 AGENDA Introductions Public Agencies, Commissions, and Elected Officials Hydrology and forecasts Albeni Falls Dam and Lake Pend Oreille Operations Topics of Interest 2

3 ALBENI FALLS AND LAKE PEND OREILLE OPERATIONS 3

4 FCRPS PROJECTS Albeni Falls Dam 20-25% of GCL average inflow 1 of forebay = 1 of forebay at GCL 1 unit of water produces 2 MW at site 1 unit of water produces up to 60 MW for D/S Fed projects 4

5 Lake Pend Oreille Dover location of transition from Lake to River. AFD is ~27 miles downstream of the lake Where lake elevation is measured
 Spillway has 10 gates and 420,000 cfs capacity During large snowpack years not uncommon to go on freeflow ~1 MAF of storage in Lake Pend Oreille")
6 Operate top 11.5 feet of the Lake (2051 to feet) Spillway has 10 gates and 420,000 cfs capacity During large snowpack years not uncommon to go on freeflow ~1 MAF of storage in Lake Pend Oreille Downstream flood flow is 95,000 cfs but control point is at Sandpoint as measured at the Hope Gage of feet.
7 LAKE PEND OREILLE PRE AND POST DAM
8 June 7 th, 2013 No freeflow Hope feet Forebay feet Outflow 56.0 kcfs Albeni Falls June 7 th, 2014 On freeflow Dover Hope feet Forebay feet Outflow 82.3 kcfs
9 COLUMBIA RIVER PROJECTS STORAGE VS SPRING RUNOFF
10 WATER SUPPLY & LAKE ELEVATIONS Hold Summer Operating pool till Sept 18 The Apr WSF was 129% of Average Total Apr-Jul Volume was 121% of average Dam on freeflow from April 18 th to June 12 th Refilled to above 2062 ft on June 24 th Summer Operating pool reached June 24th 2061 ft end of Sept Rowing Regatta Sept 30 10
11 Rank PEND OREILLE - ALBENI FALLS DAM (ALFW1) Period Rankings to 2017 APR-JUL Normal (KAF) Year Period Volume (KAF) Percent of Normal Lake PO Reached 2062 ft May 16 - FF June 7 FF June 15 - FF June 1 - FF June 3 - FF June June June June June June June June July June June June May 24 - FF June June May 28 - FF June June June June 9 Ranked Volumes into the Pend Oreille the last 47 years FF Freeflow Only years that refilled before June 1 were years Albeni Falls was on freeflow Refilled in early June were years either on freeflow or dry years 11
12 12

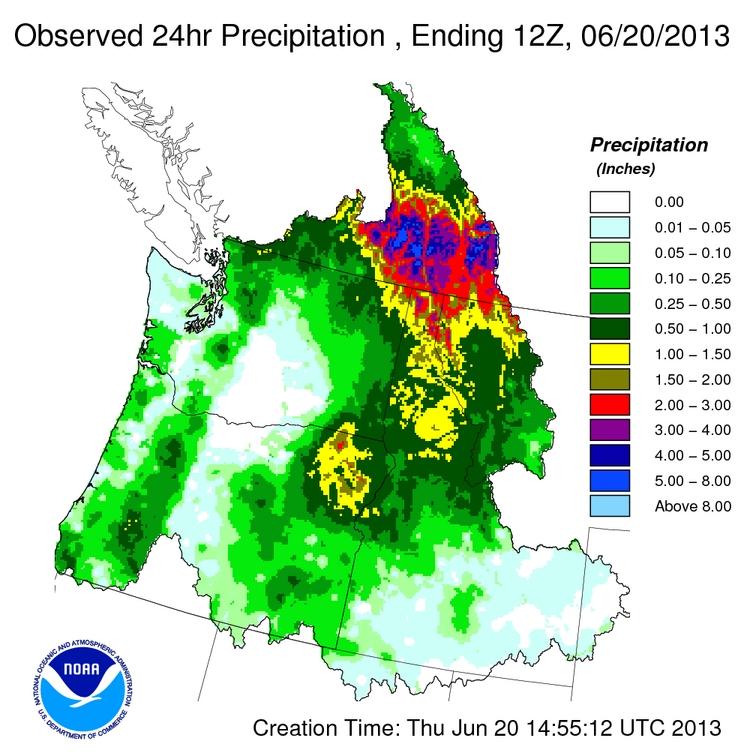
13 EARLY JUNE PRECIPITATION EVENT 13

14 EARLY JUNE PRECIPITATION EVENT 14
15 INFLOWS TO LAKE PEND OREILLE 15
16 RELEASES FROM ALBENI FALLS DAM 16
17 THIS UPCOMING FALL AND WINTER Lake elevations Above 2062 ft through Sept 18 th Target 2061 ft on Sept 30 th Winter minimum elevation 2051 ft mid-november Expect low flows in August since conditions have dried up dramatically Bank Stability work Riley Creek part 2 Starts in mid-december for 2 to 3 weeks limits Lake elevations to 2052 ft Winter Elevations minimum 2051 ft No limitations on Lake Pend Oreille fo FWPO
18 UPDATES AND LAKE LEVEL QUERIES For s regarding release changes and Lake level updates General Queries call (206)
19 ALBENI FALLS MASTER PLAN Will provide guidance for future development and maintenance of recreation and wildlife management areas on Corps Albeni Falls Dam lands A planning document that deals in concepts, not in details of design or administration Plan is flexible and subject to revisions as dictated by changing needs and conditions. What the Master Plan does NOT do: Does not address hydropower operations, reservoir level management, regional water quality, shoreline management, or the operation and maintenance of project operations facilities (i.e. dam, powerhouse, and/or spillway). 19
20 ALBENI FALLS MASTER PLAN This fall, a draft Environmental Assessment and the draft Master Plan will be made available for a 30-day public comment period. (~ Nov. 2017) Topical areas for substantive Master Plan comments: Conversion of dirt trails or roads to paved surfaces - for mobility, dust control, etc. Installation of signs along trails for interpretation - creation of Nature Trails Full electrical hook-ups at campsites Construction of additional fishing piers in parks or wildlife management areas without one Installation of lights along campground trails More shower houses Create off-leash dog play areas For more information and to be added to the AFD Master Plan list, please contact Beth McCasland at AlbeniFalls.MasterPlan@usace.army.mil 20
21 QUESTIONS? 21
All Annual Operating Plan Recipients
 To: All Annual Operating Plan Recipients From: Lower Colorado Region Boulder Canyon Operations Office River Operations Group Daniel Bunk P.O. Box 647 Boulder City, NV 896-47 Phone: 72-293-83 The operation
April 10, Dear Customer:
 Dear Customer: April 10, Attached is the monthly water supply outlook and projected operations for Yellowtail Dam and Powerplant. If you have any questions or concerns, please feel free to call me at 406-247-7334
Appendix E Water Supply Modeling
 Supply Modeling Modesto Irrigation District Treatment Plant Expansion Project Modeling I. Introduction The Modesto Irrigation District (MID) is situated adjacent to and north of the Tuolumne River. Over
Projected 2011 Missouri River Flood Elevations
 Projected 2011 Missouri River Flood Elevations Kansas City District, US Army Corps of Engineers The following table presents two water surface profiles based on the likely range of flows that are expected
Missouri River Mainstem Reservoir System Hydrologic Statistics on Inflows Technical Report
 Missouri River Mainstem Reservoir System Hydrologic Statistics on Inflows Technical Report Fort Peck Garrison Oahe Big Bend Fort Randall Gavins Point Missouri River Basin Water Management Division Omaha,
Weekly Report #18 16
 Visit our Website at www.fpc.org Fish Passage Center Weekly Report #18 16 847 NE 19th Ave., Suite 250 Portland, OR 97232 (503) 833-3900 June 22, 2018 This Week s Highlights Water Supply Precipitation throughout
Appendix N. The 2006 Fish Passage Implementation Plan
 Appendix N The 2006 Fish Passage Implementation Plan 2006 Fish Passage Implementation Plan March 31, 2006 Background: The 2006 Fish Passage Implementation Plan describes the Corps plan for fish passage
CUSHMAN HYDROELECTRIC PROJECT. Pat McCarty, Generation Manager
 CUSHMAN HYDROELECTRIC PROJECT Pat McCarty, Generation Manager AGENDA A picture tour of Cushman Relicense history Relicense requirements Fisheries Flows & reservoir elevations Cultural/historical resources
Missouri River Mainstem Reservoirs Runoff Volumes for Annual Operating Plan Studies RCC Technical Report Jy-08
 Missouri River Region Since 1953 US Army Corps of Engineers Reservoir Control Center Missouri River Region Northwestern Division Reservoir Control Center July 2008 Missouri River Basin Fort Peck Montana
Weekly Report #18 19
 Visit our Website at www.fpc.org Fish Passage Center Weekly Report #18 19 847 NE 19th Ave., Suite 250 Portland, OR 97232 (503) 833-3900 July 13, 2018 This Week s Highlights Water Supply Precipitation throughout
2017 EXTENDED LOCK MAINTENANCE CLOSURE ON THE COLUMBIA SNAKE RIVER WATERWAY
 EXTENDED LOCK MAINTENANCE CLOSURE ON THE WATERWAY 2 2 2 8 11 12 12 13 12 13 12 Sheryl Carrubba Northwestern Division, Navigation Inland Waterways Users Board Meeting No. 84 19 July The views, opinions
Project Description - 1 -
 Project Description The Mother Ann Lee Hydroelectric Station is located at Lock and Dam 7 on the Kentucky River. This dam is part of a system of 14 lock and dams installed on the Kentucky River between
Revising the Historic Monthly Mean Niagara River Flow at Buffalo to Reflect Better Estimates of Maid-of-the-Mist Pool Outflows
 Revising the Historic Monthly Mean Niagara River Flow at Buffalo to Reflect Better Estimates of Maid-of-the-Mist Pool Outflows 1961-2007 Background The Niagara River flow at Buffalo is currently computed
City of Peachtree City
 City of Peachtree City Lake Peachtree Spillway Replacement City Council Update September 15, 2016 Project Team Integrated Science & Engineering 1 Spillway Alternatives Analysis Spillway Alternatives Evaluated
Annual Fish Passage Report 2012 Columbia and Snake River Projects
 US Army Corps of Engineers Portland District Walla Walla District Annual Fish Passage Report 2012 Columbia and Snake River Projects 2012 ANNUAL FISH PASSAGE REPORT COLUMBIA AND SNAKE RIVERS for SALMON,
Missouri River Incremental Flows Below Gavins Point Technical Report
 Missouri River Incremental Flows Below Gavins Point Technical Report Fort Peck Garrison Oahe Big Bend Fort Randall Gavins Point Missouri River Basin Water Management Division Omaha, Nebraska July 214 Missouri
AOP. Final Missouri River Mainstem System Annual Operating Plan
 US Army Corps of Engineers Northwestern Division Missouri River Basin Water Management Division Final AOP 2009-2010 Missouri River Mainstem System 2009-2010 Annual Operating Plan Fort Peck Garrison Oahe
Missouri River Mainstem System Annual Operating Plan. Garrison. Oahe
 Missouri River Basin Water Management Division Final AOP 2012-2013 Missouri River Mainstem System 2012-2013 Annual Operating Plan Fort Peck Garrison Oahe Big Bend Fort Randall Gavins Point Annual Operating
LAKE CHELAN ANNUAL FLOW AND WATER TEMPERATURE REPORT Final
 LAKE CHELAN ANNUAL FLOW AND WATER TEMPERATURE REPORT 2013 LICENSE ARTICLES 405 & 408 Final LAKE CHELAN HYDROELECTRIC PROJECT FERC Project No. 637 April 30, 2014 Public Utility District No. 1 of Chelan
NORTHERN INDIANA PUBLIC SERVICE COMPANY NORWAY AND OAKDALE HYDRO ELECTRIC PLANTS MONTICELLO, INDIANA
 NORTHERN INDIANA PUBLIC SERVICE COMPANY NORWAY AND OAKDALE HYDRO ELECTRIC PLANTS MONTICELLO, INDIANA INTRODUCTION: NIPSCO is the proud owner of two Hydro Electric Plants located near Monticello, Indiana.
NASHVILLE DISTRICT UPDATE TRVA ANNUAL CONFERENCE
 NASHVILLE DISTRICT UPDATE TRVA ANNUAL CONFERENCE 1 LTC Cullen A. Jones, P.E., PMP Nashville District Commander Great Lakes and Ohio River Division US Army Corps of Engineers (USACE) 10 October 2017 The
LAX Specific Plan Amendment Study. CONCEPT DEVELOPMENT Public Meeting Series #5 August 23 & 26, 2006
 LAX Specific Plan Amendment Study CONCEPT DEVELOPMENT Public Meeting Series #5 August 23 & 26, 2006 Agenda Background on public planning process Regional planning update LAWA progress on settlement commitments
Element #2: Additional analysis of Tuolumne River below La Grange Dam (USGS # );
;") Districts Response to NMFS-4, Element 1 through 6 Effects of Don Pedro Project and Related Facilities on Hydrology for Anadromous Fish: Magnitude, Timing, Duration, and Rate of Change 1.0 Background On
Districts Response to NMFS-4, Element 1 through 6 Effects of Don Pedro Project and Related Facilities on Hydrology for Anadromous Fish: Magnitude, Timing, Duration, and Rate of Change 1.0 Background On
Kelly Redmond Regional Climatologist, Western Regional Climate Center Atmospheric Sciences Division
 Kelly Redmond Regional Climatologist, Western Regional Climate Center Atmospheric Sciences Division Climate and the Colorado and Columbia River Basins Presented at The Aspen Global Change Institute June
2017 Adjusted Count Report February 12, 2018
 A statewide multi-use trail user study and volunteer data collection program 2017 Adjusted Count Report February 12, 2018 The following report includes the final adjusted infrared (IR) counter data at
Peninsula Corridor Electrification Project (PCEP)
") Peninsula Corridor Electrification Project (PCEP) Q4 Quarterly Update #11 April 1 June 30, 2017 JPB Board Meeting August 3, 2017 Agenda Item # 8a Electrification - Infrastructure Design Build Contract
Peninsula Corridor Electrification Project (PCEP) Q4 Quarterly Update #11 April 1 June 30, 2017 JPB Board Meeting August 3, 2017 Agenda Item # 8a Electrification - Infrastructure Design Build Contract
Alternative Delivery as a Form of Risk Mitigation
 Alternative Delivery as a Form of Risk Mitigation Erika P. Moonin, P.E. Lake Mead Intake No. 3 Access Shaft - 400 Low feet Lake deep Level Pumping Station November 29, 2017 Outline Project Background -
Memorandum October 5, 2017
 614 Magnolia Avenue Ocean Springs, Mississippi 39564 228.818.9626 Memorandum October 5, 2017 To: Gary Miller, U.S. Environmental Protection Agency From: David Keith, John Laplante, Matt Henderson, and
Appendix G Aquilla Lake Pool Rise Recreational Resources
 Appendix G Aquilla Lake Pool Rise Recreational Resources 1. INTRODUCTION The purpose of this appendix is to document the impacts of a 2.5 ft (Alternative A), 4.5 ft (Alternative B), and 6.5 ft. (Alternative
2019 Tide Tables. Volume 1 of 2
 2019 Tide Tables Volume 1 of 2 Created: 12/1/2018 PREFACE: These tables depict the predicted times and heights of the high and low waters for each day of the year for the following locations: Publication
TACOMA HYDROELECTRIC PROJECT PROJECT EFFECTS ON THE WATER QUANTITY AND QUALITY OF THE ANIMAS RIVER
 TACOMA HYDROELECTRIC PROJECT PROJECT EFFECTS ON THE WATER QUANTITY AND QUALITY OF THE ANIMAS RIVER Prepared for: PUBLIC SERVICE CO. OF COLORADO Durango, Colorado Prepared by: DEVINE TARBELL & ASSOCIATES,
FINAL LICENSE APPLICATION Exhibit A Description of Project
 FINAL LICENSE APPLICATION Exhibit A Description of Project PacifiCorp Portland, Oregon April 2004 Copyright 2004 by PacifiCorp Reproduction in whole or in part without the written consent of PacifiCorp
DRAFT REPORT TXDOT SH 183 MASTER DRAINAGE STUDY HYDRAULIC ANALYSIS OF ELM FORK OF TRINITY RIVER CROSSING AT SH 183 WITHIN THE ELM FORK WATERSHED
 DRAFT REPORT TXDOT SH 183 MASTER DRAINAGE STUDY HYDRAULIC ANALYSIS OF ELM FORK OF TRINITY RIVER CROSSING AT SH 183 WITHIN THE ELM FORK WATERSHED FOR TEXAS DEPARTMENT OF TRANSPORTATION DALLAS DISTRICT CONTRACT
Wheat Marketing Situation
 Wheat Marketing Situation Prepared by: Darrell L. Hanavan Executive Director Colorado Wheat Administrative Committee If you would like to receive an email when this report is updated, email gmostek@coloradowheat.org
STRUCTURE S-13. Revised 2/21/02
 STRUCTURE S-13 This structure is a pumping station with a gated spillway which can control flows which bypass the pumps. The structure is located in Canal 11 (South New River Canal) about 300 feet west
Design Criteria Data
 OKLAHOMA CITY OK Latitude = 35.4 N WMO No. 72353 Longitude = 97.6 W Elevation = 133 feet Period of Record = 1973 to 1996 Average Pressure = 28.62 inches Hg Design Criteria Data Mean Coincident (Average)
Action Requested From AMWG
 Action Requested From AMWG NONE, These Two Presentations Are For Information Transfer Only The information is derived from a multi-year synthesis research effort related to existing data on flow, sediment-transport
Design Criteria Data
 MEDFORD/JACKSON CO. OR Latitude = 42.37 N WMO No. 72597 Longitude =122.8 W Elevation = 1329 feet Period of Record = 1973 to 1996 Average Pressure = 28.61 inches Hg Design Criteria Data Mean Coincident
Southern Nevada Water Authority Lake Mead Intake No. 3. The Last Straw?
 Southern Nevada Water Authority Lake Mead Intake No. 3 The Last Straw? WESTCAS October 29, 2015 Underlying Intake No. 3 Factors Lake Mead is the primary water source for So. Nevada 90% of supply No guarantees
CCoWS. Central Coast Watershed Studies. Summary of Precipitation and Streamflow for Potrero and San Clemente Creeks in Water-Year 2007
 Central Coast Watershed Studies CCoWS Summary of Precipitation and Streamflow for Potrero and San Clemente Creeks in Water-Year 2007 Santa Lucia Preserve Monterey County, California Publication No. WI-2008-01
Design Criteria Data
 DES MOINES IA Latitude = 41.53 N WMO No. 72546 Longitude = 93.65 W Elevation = 965 feet Period of Record = 1973 to 1996 Average Pressure = 28.96 inches Hg Design Criteria Data Mean Coincident (Average)
Henry M. Jackson Hydroelectric Project (FERC No. 2157)
") Henry M. Jackson Hydroelectric Project (FERC No. 2157) License Article 401: Water Quality Monitoring Plan 2013 Annual Report Everett, WA Final This document has been prepared for the District. It has been
Henry M. Jackson Hydroelectric Project (FERC No. 2157) License Article 401: Water Quality Monitoring Plan 2013 Annual Report Everett, WA Final This document has been prepared for the District. It has been
Sprinkler System Waiver Application Packet
 Sprinkler System Waiver Application Packet According to the City s municipal code, use of sprinklers is conditional upon use of a water budget and the City continues to discourage customers from irrigating
*iiiii. May 31, 2017 VIA ELECTRONIC FILING
 *iiiii. PUBLIC UTILITY DISTRICT NO. I of CHELAN COUNTY P.O. Box 1231, Wenatchee, WA 98807-1231 327 N. Wenatchee Ave., Wenatchee, WA 98801 (509) 663-8121 Toll free 1-888-663-8121 www.chelanpud.org May 31,
Mobility Management: Caltrain
 Mobility Management: Caltrain Community Relations Committee October 4, 2017 Agenda Item 7 Presentation Outline Operating Statistics Ridership On-time Performance Fleet Reliability Capital Program Review
Design Criteria Data
 LAS VEGAS/MCCARRAN NV Latitude = 36.8 N WMO No. 72386 Longitude =115.1 W Elevation = 2179 feet Period of Record = 1973 to 1996 Average Pressure = 27.67 inches Hg Design Criteria Data Mean Coincident (Average)
Design Criteria Data
 PHOENIX/SKY HARBOR AZ Latitude = 33.43 N WMO No. 72278 Longitude =112. W Elevation = 116 feet Period of Record = 1973 to 1996 Average Pressure = 28.72 inches Hg Design Criteria Data Mean Coincident (Average)
Design Criteria Data
 COLUMBIA SC Latitude = 33.95 N WMO No. 7231 Longitude = 81.12 W Elevation = 226 feet Period of Record = 1973 to 1996 Average Pressure = 29.8 inches Hg Design Criteria Data Mean Coincident (Average) Values
State of California The Resources Agency DEPARTMENT OF FISH AND GAME
 State of California The Resources Agency DEPARTMENT OF FISH AND GAME BUTTE CREEK SPRING-RUN CHINOOK SALMON, ONCORYHNCHUS TSHAWYTSCHA PRE-SPAWN MORTALITY EVALUATION 2013 By Clint E. Garman Inland Fisheries
Presented by Eric Englert Puget Sound Energy September 11, 2002
 Results from PSE s First Year of Time of Use Program Presented by Eric Englert Puget Sound Energy September 11, 2002 Puget Sound Energy Overview 973,489 Total Electric Customers 908,949 are AMR Capable
CCoWS. Central Coast Watershed Studies. Summary of Precipitation and Streamflow for Potrero and San Clemente Creeks in Water-Year 2008
 Central Coast Watershed Studies CCoWS Summary of Precipitation and Streamflow for Potrero and San Clemente Creeks in Water-Year 2008 Santa Lucia Preserve Monterey County, California Publication No. WI-2009-01
Monitoring Bank Erosion On the Missouri River, Lower Brule Reservation
 Monitoring Bank Erosion On the Missouri River, Lower Brule Reservation A cooperative study between the Lower Brule Sioux Tribe s Environmental Protection Office and the U.S. Geological Survey, with assistance
LICENSE ARTICLE 410 LOWER COWLITZ RIVER SECOND ANNUAL WATER QUALITY REPORT COWLITZ RIVER PROJECT (FERC NO. 2016)
") Inc. 18300 NE Union Hill Road, Suite 200 Redmond, Washington 9802 elephone: (42) 883 0777 Fa: (42) 882 498 LICENSE ARICLE 410 LOWER COWLIZ RIVER SECON ANNUAL WAER QUALIY REPOR COWLIZ RIVER PROJEC (FERC
Inc. 18300 NE Union Hill Road, Suite 200 Redmond, Washington 9802 elephone: (42) 883 0777 Fa: (42) 882 498 LICENSE ARICLE 410 LOWER COWLIZ RIVER SECON ANNUAL WAER QUALIY REPOR COWLIZ RIVER PROJEC (FERC
Crane Inspection Log. Mailing Address: P.O. Box Tulsa, OK Phone: (918) Fax: (918)
 Fax: (918)") 999978000 Crane Inspection Log Mailing Address: P.O. Box 581510 Tulsa, OK 74158-1510 Physical Address: 4707 North Mingo Road Tulsa, OK 74117-5904 Phone: (918) 836-0463 Fax: (918) 834-5979 www.autocrane.com
999978000 Crane Inspection Log Mailing Address: P.O. Box 581510 Tulsa, OK 74158-1510 Physical Address: 4707 North Mingo Road Tulsa, OK 74117-5904 Phone: (918) 836-0463 Fax: (918) 834-5979 www.autocrane.com
Thirty Years of Climatological Data: 1969 to 1998
 Thirty Years of Climatological Data: 1969 to 1998 NMSU's Agricultural Science Center at Farmington, New Mexico Agricultural Experiment Station Research Report 744 College of Agriculture and Home Economics
Snowmobile Capital Grants and Program Presentation
 Snowmobile Capital Grants and Program Presentation 2015 Colorado Parks and Wildlife Snowmobile Capital Grant Program Acquisition and maintenance of equipment to support Snowmobile Clubs and volunteers
BEFORE THE CANTERBURY REGIONAL COUNCIL. Act 1991 AND. of Plan Change 3 to the Waitaki Catchment Water Allocation Regional Plan
 BEFORE THE CANTERBURY REGIONAL COUNCIL IN THE MATTER of the Resource Management Act 1991 AND IN THE MATTER of Change 3 to the Waitaki Catchment Water Allocation Regional STATEMENT OF EVIDENCE OF DAVID
Total Production by Month (Acre Feet)
") Production by Month (acre-feet) 2008 2009 2010 2011 2012 2013 2014 2015 2016 January 25 339.10 228.90 249.50 297.99 243.06 327.14 247.66 212.37 February 234.00 218.80 212.10 241.52 245.82 279.08 234.16
Production by Month (acre-feet) 2008 2009 2010 2011 2012 2013 2014 2015 2016 January 25 339.10 228.90 249.50 297.99 243.06 327.14 247.66 212.37 February 234.00 218.80 212.10 241.52 245.82 279.08 234.16
DVD Backup Technical Information Web Site Gregg Maroney, Web Master Service Magazines
 DVD Backup Technical Information Web Site Gregg Maroney, Web Master http://www.hudsonterraplane.com/tech/tech_index.htm 1934-1944 Service Magazines 1934 Series Vol. 1, No. 3 - April-July Vol. 1, No. 1
Michigan Avenue Corridor Study. Joint Policy / Technical Committee Meeting Wednesday, June 8, 2016
 Michigan Avenue Corridor Study Joint Policy / Technical Committee Meeting Wednesday, June 8, 2016 Agenda 1. Welcome and Introductions 2. Project Update 3. Recap from May 11 Joint Committee Meetings 4.
NJ Solar Market Update As of 10/31/15
 NJ Solar Market Update As of 10/31/15 Prepared by Charlie Garrison Renewable Energy Committee Meeting November 10, 2015 SOLAR INSTALLED CAPACITY DATA The preliminary installed solar capacity as of 10/31/15
SELF-STORAGE FOR SALE
 PURCHASE PRICE: $525,000 OCCUPANCY: 62.2% NOI: $50,600 LOT SIZE: 2.0 acres BLDG CLASS: C OVERVIEW 90 unit, multi-building storage facility in a stable region of North Central Texas. This well-maintained,
TRAFFIC VOLUME TRENDS July 2002
 TRAFFIC VOLUME TRENDS July 2002 Travel on all roads and streets changed by +2.3 percent for July 2002 as compared to July 2001. Estimated Vehicle-Miles of Travel by Region - July 2002 - (in Billions) West
Inventory Levels - All Prices. Inventory Levels - By Price Range
 Inventory Levels - All Prices Idaho Falls Bonneville Total 7-Apr-17 154 111 265 6-Apr-18 113 91 204-23% Inventory Levels - By Price Range 7-Apr-17 6-Apr-18 0-100,000 36 10 100,001-125,000 13 9 125,001-150,000
Design Criteria Data
 BURLINGTON VT Latitude = 44.47 N WMO No. 72617 Longitude = 73.15 W Elevation = 341 feet Period of Record = 1973 to 1996 Average Pressure = 29.61 inches Hg Design Criteria Data Mean Coincident (Average)
Design Criteria Data
 RAPID CITY SD Latitude = 44.5 N WMO No. 72662 Longitude =3. W Elevation = 3169 feet Period of Record = 1973 to 1996 Average Pressure = 26.67 inches Hg Design Criteria Data Mean Coincident (Average) Values
MAP OR PHOTO. Public Meeting & Open House July 23, Project Roadway Limits From: FM 1957 To: FM 471. Counties Bexar & Medina
 Public Meeting & Open House July 23, 2013 Project Roadway Limits From: FM 1957 To: FM 471 MAP OR PHOTO Counties Bexar & Medina 1 I. Project History II. III. IV. Project Overview Project Alternatives Response
Design Criteria Data
 PHILADELPHIA PA Latitude = 39.88 N WMO No. 7248 Longitude = 75.25 W Elevation = 3 feet Period of Record = 1973 to 1996 Average Pressure = 29.98 inches Hg Design Criteria Data Mean Coincident (Average)
Design Criteria Data
 MACON/LEWIS WILSON GA Latitude = 32.7 N WMO No. 72217 Longitude = 83.65 W Elevation = 361 feet Period of Record = 1973 to 1996 Average Pressure = 29.66 inches Hg Design Criteria Data Mean Coincident (Average)
Design Criteria Data
 HONOLULU/OAHU HI Latitude = 21.35 N WMO No. 91182 Longitude =157.9 W Elevation = 16 feet Period of Record = 1967 to 1996 Average Pressure = 29.96 inches Hg Design Criteria Data Mean Coincident (Average)
Design Criteria Data
 PIERRE SD Latitude = 44.38 N WMO No. 726686 Longitude =1.2 W Elevation = 1742 feet Period of Record = 1973 to 1996 Average Pressure = 28.1 inches Hg Design Criteria Data Mean Coincident (Average) Values
Design Criteria Data
 INDIANAPOLIS IN Latitude = 39.73 N WMO No. 72438 Longitude = 86.27 W Elevation = 87 feet Period of Record = 1973 to 1996 Average Pressure = 29.15 inches Hg Design Criteria Data Mean Coincident (Average)
Design Criteria Data
 ANCHORAGE AK Latitude = 61.17 N WMO No. 7273 Longitude =15. W Elevation = 131 feet Period of Record = 1973 to 1996 Average Pressure = 29.6 inches Hg Design Criteria Data Mean Coincident (Average) Values
NJ Solar Market Update As of 6/30/15
 NJ Solar Market Update As of 6/30/ Prepared by Charlie Garrison July 17, 20 SOLAR INSTALLED CAPACITY DATA The preliminary installed solar capacity as of 6/30/ is approximately 1,500.7 MW. Approximately
Year to Date Summary. Average and Median Sale Prices
 A Publication of RMLS, The Source for Real Estate Statistics in Your Community Residential Review: Southwest Washington September 2018 Reporting Period September Residential Highlights Southwest Washington
Design Criteria Data
 DENVER/STAPLETON CO Latitude = 39.75 N WMO No. 72469 Longitude =14.8 W Elevation = 5332 feet Period of Record = 1973 to 1995 Average Pressure = 24.66 inches Hg Design Criteria Data Mean Coincident (Average)
Design Criteria Data
 JACKSONVILLE FL Latitude = 3.5 N WMO No. 7226 Longitude = 81.7 W Elevation = 3 feet Period of Record = 1973 to 1996 Average Pressure = 3.1 inches Hg Design Criteria Data Mean Coincident (Average) Values
Design Criteria Data
 SPOKANE WA Latitude = 47.63 N WMO No. 72785 Longitude =117.5 W Elevation = 2366 feet Period of Record = 1973 to 1996 Average Pressure = 27.5 inches Hg Design Criteria Data Mean Coincident (Average) Values
Design Criteria Data
 LOUISVILLE/STANDIFORD KY Latitude = 38.18 N WMO No. 72423 Longitude = 85.73 W Elevation = 489 feet Period of Record = 1973 to 1996 Average Pressure = 29.49 inches Hg Design Criteria Data Mean Coincident
Design Criteria Data
 DAYTON/JAMES M COX OH Latitude = 39.9 N WMO No. 72429 Longitude = 84.2 W Elevation = 14 feet Period of Record = 1973 to 1996 Average Pressure = 28.95 inches Hg Design Criteria Data Mean Coincident (Average)
Design Criteria Data
 SPRINGFLD MO Latitude = 37.23 N WMO No. 7244 Longitude = 93.38 W Elevation = 127 feet Period of Record = 1973 to 1996 Average Pressure = 28.66 inches Hg Design Criteria Data Mean Coincident (Average) Values
Design Criteria Data
 BIRMINGHAM AL Latitude = 33.57 N WMO No. 72228 Longitude = 86.75 W Elevation = 63 feet Period of Record = 1973 to 1996 Average Pressure = 29.36 inches Hg Design Criteria Data Mean Coincident (Average)
MUSKRAT FALLS PROJECT OVERVIEW
 CIMFP Exhibit P-00136 Page 1 MUSKRAT FALLS PROJECT OVERVIEW Stan Marshall, Nalcor CEO Presentation to MF Public Inquiry September 19, 2018 AGENDA CIMFP Exhibit P-00136 Page 2 Electrical System Basics Churchill
Shaping our utility to do the best, for the most, for the longest.
 2016-2017 Public Power Benefit Projects October 17, 2016 - BOARD UPDATE Shaping our utility to do the best, for the most, for the longest. Public Power Benefit Projects (Approved projects) 1. Fiber Expansion
Business Advisory Committee. July 7, 2015
 Business Advisory Committee July 7, 2015 1 Today s Topics Outreach Update TI #1 and 2: Target Field Station Connection to I-94: Recommendation 85 th Station Configuration 93 rd Station Configuration DEIS
Design Criteria Data
 BOSTON/LOGAN MA Latitude = 42.37 N WMO No. 7259 Longitude = 71.3 W Elevation = 3 feet Period of Record = 1967 to 1996 Average Pressure = 29.95 inches Hg Design Criteria Data Mean Coincident (Average) Values
Design Criteria Data
 MIDLAND TX Latitude = 31.95 N WMO No. 72265 Longitude =2. W Elevation = 2861 feet Period of Record = 1973 to 1996 Average Pressure = 27.3 inches Hg Design Criteria Data Mean Coincident (Average) Values
Design Criteria Data
 MINNEAPOLIS-ST PAUL MN Latitude = 44.88 N WMO No. 72658 Longitude = 93.22 W Elevation = 837 feet Period of Record = 1973 to 1996 Average Pressure = 29.7 inches Hg Design Criteria Data Mean Coincident (Average)
Design Criteria Data
 NEW YORK/JOHN F KENNEDY NY Latitude = 4.65 N WMO No. 74486 Longitude = 73.78 W Elevation = 23 feet Period of Record = 1973 to 1996 Average Pressure = 29.98 inches Hg Design Criteria Data Mean Coincident
Design Criteria Data
 WASHINGTON/DULLES VA Latitude = 38.95 N WMO No. 7243 Longitude = 77.45 W Elevation = 322 feet Period of Record = 1973 to 1996 Average Pressure = 29.68 inches Hg Design Criteria Data Mean Coincident (Average)
State Regulatory Affairs and Local Relations Update. ATC Customer Meeting November 19, 2009
 State Regulatory Affairs and Local Relations Update ATC Customer Meeting November 19, 2009 Project Certification Steve Parker Manager State Regulatory Affairs CA/CPCN Applications (Filed/Ordered/Under
Design Criteria Data
 LANDER/HUNT WY Latitude = 42.82 N WMO No. 72576 Longitude =18.7 W Elevation = 5558 feet Period of Record = 1973 to 1996 Average Pressure = 24.44 inches Hg Design Criteria Data Mean Coincident (Average)
Design Criteria Data
 ALBUQUERQUE NM Latitude = 35.5 N WMO No. 72365 Longitude =16.6 W Elevation = 5315 feet Period of Record = 1967 to 1996 Average Pressure = 24.72 inches Hg Design Criteria Data Mean Coincident (Average)
Design Criteria Data
 DULUTH MN Latitude = 46.83 N WMO No. 72745 Longitude = 92.18 W Elevation = 1417 feet Period of Record = 1973 to 1996 Average Pressure = 28.43 inches Hg Design Criteria Data Mean Coincident (Average) Values
Design Criteria Data
 MINOT AFB ND Latitude = 48.42 N WMO No. 727675 Longitude =11.3 W Elevation = 1667 feet Period of Record = 1967 to 1996 Average Pressure = 28.16 inches Hg Design Criteria Data Mean Coincident (Average)
SUMMARY CHANGES FOR NCHRP REPORT 350 GUIDELINES [NCHRP (02)] Keith A. Cota, Chairman Technical Committee on Roadside Safety June 14, 2007
![SUMMARY CHANGES FOR NCHRP REPORT 350 GUIDELINES [NCHRP (02)] Keith A. Cota, Chairman Technical Committee on Roadside Safety June 14, 2007](/thumbs/87/97351925.jpg "SUMMARY CHANGES FOR NCHRP REPORT 350 GUIDELINES [NCHRP (02)] Keith A. Cota, Chairman Technical Committee on Roadside Safety June 14, 2007") SUMMARY CHANGES FOR NCHRP REPORT 350 GUIDELINES [NCHRP 22-14 (02)] Keith A. Cota, Chairman Technical Committee on Roadside Safety June 14, 2007 BACKGROUND Circular 482 (1962) First full scale crash test
SUMMARY CHANGES FOR NCHRP REPORT 350 GUIDELINES [NCHRP 22-14 (02)] Keith A. Cota, Chairman Technical Committee on Roadside Safety June 14, 2007 BACKGROUND Circular 482 (1962) First full scale crash test
Design Criteria Data
 CHARLESTON/KANAWHA WV Latitude = 38.37 N WMO No. 72414 Longitude = 81.6 W Elevation = 981 feet Period of Record = 1973 to 1996 Average Pressure = 29. inches Hg Design Criteria Data Mean Coincident (Average)
Lake Mead Intake No. 3
 Lake Mead Intake No. 3 1 Lake Mead Intake No. 3 Total Project Scope INTAKE STRUCTURE PUMPING STATION ACCESS SHAFTS WATER TREATMENT FACILITY CONNECTOR TUNNEL INTAKE 1 INTAKE 2 C-2 Lake Mead Intake No. 3
2019 Western North Carolina Weather Calendar. Department of Atmospheric Sciences The University of North Carolina at Asheville
 209 Western North Carolina Weather Calendar Department of Atmospheric Sciences The University of North Carolina at Asheville www.atms.unca.edu 209 Western North Carolina Weather Calendar Climatological
Update: Estimated GHG Increase from Obama Administration Inaction on the 2014 RFS
 Update: Estimated GHG Increase from Obama Administration Inaction on the 2014 The blend wall should not be a consideration for setting the, because the United States is using more transportation fuel in