Weekly Report #18 19
|
|
|
- Marshall Weaver
- 5 years ago
- Views:
Transcription
 833-3900 July 13, 2018 This Week s Highlights Water Supply Precipitation throughout the Columbia Basin has varied between 0% and 67% of average at individual")
1 Visit our Website at Fish Passage Center Weekly Report # NE 19th Ave., Suite 250 Portland, OR (503) July 13, 2018 This Week s Highlights Water Supply Precipitation throughout the Columbia Basin has varied between 0% and 67% of average at individual subbasins over early July. Precipitation above The Dalles has been 28% of average over July. Over the 2018 water year, precipitation has ranged between 87% and 113% of average. Table 1. Summary of July precipitation and cumulative October through July precipitation with respect to average ( ), at select locations within the Columbia and Snake River Basins. Water Year 2018 Water Year 2018 October 1, 2017 to July 1-12, 2018 July 12, 2018 Location Observed (inches) % Average Observed (inches) % Average Columbia Above Coulee Snake River Above Ice Harbor Columbia Above The Dalles Kootenai Clark Fork Flathead Pend Oreille River Basin above Waneta Dam Salmon River Basin Upper Snake Tributaries Clearwater Willamette River above Portland Grand Coulee Reservoir is at feet ( ) and has refilled 1.6 feet over the last week. Outflows at Grand Coulee have ranged between 82.0 Kcfs and Kcfs over the last week. The Libby Reservoir is currently at elevation feet ( ) and has refilled 2.7 feet over the past week. Daily average outflows at Libby Dam have been between 9.0 Kcfs and 9.5 Kcfs over the last week. Hungry Horse is currently at an elevation of feet ( ) and has refilled 0.5 feet last week. Outflows at Hungry Horse have been Kcfs over the last week. Dworshak is currently at an elevation of feet ( ) and has drafted 6.6 feet over the last week. Dworshak outflows have been Kcfs. The Brownlee Reservoir was at an elevation of feet on July 12 th, 2018 and has drafted 1.5 feet over the last week. Outflows at Hells Canyon have ranged between 9.8 and 21.8 Kcfs over the last four days. The Biological Opinion flow period began on April 3rd in the lower Snake River (Lower Granite). According to the April Final Water Supply Forecast (April 4 th, 2018), the flow objective this spring was 100 Kcfs at Lower Granite. Flows at Lower Granite Dam have averaged Kcfs over the spring season. The summer biological flow period began on June 21 st, 2018 at Lower Granite (Flow Objective = 53.3 Kcfs), flows have averaged 50.8 Kcfs over the summer period and 42.3 Kcfs last week. Based on the April Final Water Supply Forecast, the Spring Biological Opinion Flow Objective is 260 Kcfs at McNary Dam and 135 Kcfs at Priest Rapids Dam. Flows at McNary averaged 343 Kcfs over the spring season; at Priest Rapids flows averaged Kcfs over the spring season. The summer flow period began on July 1, 2018 at McNary Dam, with a flow objective of 200 Kcfs. Flows at McNary have averaged Kcfs since the start of the summer period.
2 Page 2 Spill Flows in the Lower Snake River remained relatively steady this week, when compared to the previous week. Daily average flows at Lower Granite Dam ranged from 41.2 to 43.4 Kcfs this week. Daily average flows at McNary and Rock Island dams ranged from to Kcfs and to Kcfs this week, respectively. Current forecasts for Lower Granite Dam show flows declining slightly over the next week while forecasts for McNary Dam show flows remaining relatively stable over the next week. Dworshak is currently in its summer draft operation, with daily average discharge ranging from 8.3 to 12.8 Kcfs over the last week. Unit 3 was returned to service last week. With the return of Unit 3, the powerhouse at Dworshak is at full capacity, which is approximately 9.5 Kcfs. Therefore, summer draft operations will no longer be limited to Kcfs, as they have the last two summer draft seasons. Hells Canyon Complex flows have remained steady this week, with daily average outflows at Hells Canyon Dam ranging from 13.3 to 15.6 Kcfs over the last week. The daily average temperature for July 12 th at the Lower Granite tailrace was 66.7 F. The 2018 spill for fish passage program at the lower Snake River and Mid-Columbia FCRPS projects began just after midnight on April 3 rd and April 10 th, respectively. Spring spill operations at these projects ran through June 15 th in the Mid-Columbia and June 20 th in the Snake River. According to the Fish Operations Plan, summer spill operations began at 0001 on June 16 th at the Mid-Columbia River sites and 0001 on June 21 st at the Snake River sites. These summer spill operations will run through August 31 st at all eight FCRPS projects. A summary of summer spill operations is provided in Table 2. Table 2. Summer spill operations at FCRPS projects. Project Summer Spill Level (Day/Night) Lower Granite 18 Kcfs/18 Kcfs Little Goose 30%/30% Lower Monumental 17 Kcfs/17 Kcfs Ice Harbor Jun. 21-Jul. 13: 45 Kcfs/Gas Cap or 30%/30% Jul. 13-Aug. 31: 45 Kcfs/Gas Cap McNary 50%/50% John Day Jun. 16-Jul. 20: 30%/30% or 40%/40% Jul. 20-Aug. 31: 30%/30% The Dalles 40%/40% Bonneville 95 Kcfs/95 Kcfs or 85 Kcfs/121 Kcfs The summer spill operation for Lower Granite Dam is 18 Kcfs, 24-hours per day. Summer spill volumes at LGR were met this week and there were no exceedences in total dissolved gas (TDG) waiver limits in the LGR tailrace or the Little Goose (LGS) forebay. The summer spill operation for LGS is 30%, 24-hours per day. Summer spill volumes at LGS were met this week and there were no exceedences in TDG waiver limits in the LGS tailrace or Lower Monumental (LMN) forebay. The summer spill operation for LMN is 17 Kcfs, 24-hours per day. Summer spill volumes at LMN were met this week and there were no exceedences in TDG waiver limits in the LMN tailrace or the Ice Harbor (IHR) forebay. The summer spill operation for IHR alternates between 30% (24-hours per day) and 45 Kcfs during the day and gas cap spill at night. These two operations will alternate in two-day blocks through July 12 th. From July 13 th to August 31 st, the operation at IHR will be 45 Kcfs during the day and gas cap spill at night. Summer spill volumes at IHR were met this week. However, due to low flows, the nighttime spill to the gas cap has not been possible. Instead, spill during these periods was all flows in excess of powerhouse minimum requirements. There were no exceedences in TDG waiver limits in the IHR tailrace or the McNary (MCN) forebay this week. Summer spill at McNary (MCN) is 50%, 24-hours per day. This summer spill operation has been met this week and there have been no exceedences of TDG waiver limits in the MCN tailrace or the John Day (JDA) forebay. The summer spill operation at JDA alternates between 30% (24-hours) and 40% (24-hours). These two treatments will alternate in two-day blocks.
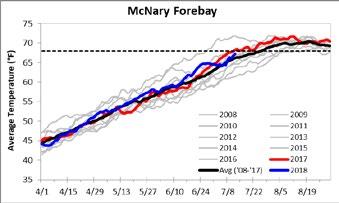
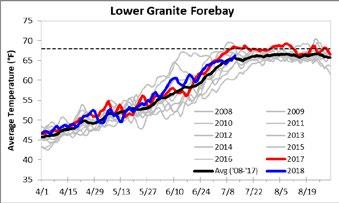
3 Page 3 This summer spill operation at JDA has been met this week and there were no exceedances of TDG waivers in the JDA tailrace or The Dalles (TDA) forebay this week. The summer spill operation at TDA is 40%, 24-hours per day. This summer spill operation has been met this week and there were no exceedences of TDG waivers in the TDA tailrace or the Bonneville (BON) forebay this week. Finally, the summer spill operation at BON alternates between 95 Kcfs (24-hours) and 85 Kcfs during the day and 121 Kcfs at night. These two treatments will alternate in 2-day blocks. This summer spill operation has been met this week. The tailrace monitor at Cascades Island was out of service from May 13 th to July 10 th, but has recently been restored. The 12-hour average TDG at this monitor has been 117% over the last two days. Note: The State of Oregon TDG waiver only requires compliance with 120% TDG in the tailrace, while the State of Washington requires compliance with both a 115% TDG forebay requirement and a 120% tailrace TDG requirement. The State of Oregon and the State of Washington also use different methodologies to estimate the 12-hour average TDG. For Oregon, the 12-hour average is based on the 12 highest hourly TDG measurements in a single calendar day (not necessarily consecutive). For Washington, the 12-hour average is based on 12-hour rolling averages. The highest of the rolling averages is what is reported as the 12-hour average for a given day. The location of a TDG monitor will dictate which of these methodologies is used for compliance monitoring. The Washington methodology will apply to all the lower Snake River projects, as well as the middle Columbia River forebay monitors. On any given day the compliance of the tailrace monitors at the middle Columbia River projects will be determined using either the Washington or Oregon methodology, whichever is the most restrictive, and spill will be decreased if needed. Gas bubble trauma (GBT) monitoring in smolts took place at Little Goose, Lower Monumental, Rock Island, McNary, and Bonneville dams this week. GBT monitoring at Lower Granite did not occur this week and will likely not occur the rest of this season. Signs of fin GBT were observed in two of the eight GBT samples conducted this week (July 6-12). Bonneville observed zero signs of fin GBT in their samples on July 7 th and July 10 th. This week s samples (July 10 th and July 12 th ) at Rock Island each had four fish (4%) with signs of fin GBT. Of the four fish observed with fin GBT, each sample had three had Rank 1 signs and one with Rank 2 signs. McNary observed no signs of fin GBT in their samples on July 7 th and July 9 th. Little Goose and Lower Monumental observed zero signs of fin GBT in their samples on July 9 th and July 11 th, respectively. It should be noted that the last two GBT samples at Lower Monumental Dam have not met sample the size requirement. If fish numbers continue to decline, and TDG levels remain low, sampling at this site may be terminated for the season. The action criteria for interruption of the voluntary spill for fish passage program is defined as either 15% of examined fish showing signs of GBT in their non-paired fins, or 5% of the fish examined showing severe signs of GBT in their non-paired fins. Severe signs of GBT are defined as more than 25% of the surface area of the fin is occluded by gas bubbles, which corresponds to a rank of 3 or 4. Neither of these action criteria were met this week. Temperature Forebay temperatures are now being reported for Lower Granite, Ice Harbor, McNary and Bonneville dams. Currently, forebay temperatures at Bonneville Dam are slight higher than the 10-year average for this time of year. The daily average temperature for July 12 th at Bonneville was 67.8 F. The current 10- year average for the Bonneville forebay at this time of year is 66.8 F. The current forebay temperature at McNary Dam is also slightly higher than the current 10-year average. The daily average temperature for July 12 th in the McNary forebay was 67.2 F and the 10-year average for that date is 66.2 F. The forebay temperature at Ice Harbor Dam is less than a degree higher than the current 10-year average. The daily average temperature for July 12 th in the Ice Harbor forebay was 68.0 F and the current 10-year average for that date is 67.1 F. The forebay temperature at Lower Granite Dam is very close to the current 10-year average. The daily average temperature for July 12 th in the Lower Granite forebay was 66.2 F and the current 10-year average for that date is 65.6 F. Smolt Monitoring Smolt Monitoring Program (SMP) activities continued at all bypass facilities this week. Sampling also continued at the Imnaha River trap this week. This week s samples were dominated by subyearling Chinook at all seven SMP bypass facilities. Passage of
4 Page 4 spring migrants (yearling Chinook, coho, sockeye, and steelhead) remained low at all bypass facilities. This week s samples at Bonneville Dam (BON) were dominated by subyearling Chinook. This week s daily average passage index for subyearling Chinook was about 11,500 per day, which is a decrease from last week s daily average passage index of about 22,500 per day. Passage of spring migrants (yearling Chinook, coho, sockeye, and steelhead) remained low this week. Pacific lamprey macropthalmia were encountered in only two of this week s samples while ammocoetes were not encountered this week. Similar to the last two years, sampling at John Day Dam (JDA) is every-other-day. Subyearling Chinook again dominated the samples at JDA this week. This week s daily average passage index for subyearling Chinook was about 35,700 per day, which is a slight increase from last week s daily average passage index of 32,600 per day. No spring migrants were encountered in this week s samples at JDA. No Pacific lamprey macropthalmia or ammocoetes were encountered in this week s samples. Sampling at McNary (MCN) is also every-otherday. Subyearling Chinook dominated this week s samples at MCN. This week s daily average passage index for subyearling Chinook was about 83,600 per day, which is an increase from last week s daily average passage index of nearly 67,000 per day. Passage of spring migrants remained low this week. In fact, the only spring migrants that were encountered in this week s samples were yearling Chinook and sockeye. Finally, Pacific lamprey macropthalmia were encountered in two of this week s four samples and no ammocoetes were encountered this week. Subyearling Chinook continued to dominate the samples at Lower Granite Dam (LGR) this week. This week s daily average passage index for subyearling Chinook was about 2,900 per day, which is similar to last week s daily average passage index of about 3,500 per day. Passage of spring migrants remained low this week. Finally, one Pacific lamprey macropthalmia was sampled on July 9 th while Pacific lamprey ammocoetes were encountered in five of this week s samples. When present, this week s daily sample counts for Pacific ammocoetes were low, ranging from one to three per day. Similar to recent years, sampling at Little Goose Dam (LGS) began as every-other-day but was increased to every day when transportation stated on April 23 rd. Subyearling Chinook continued to dominate the samples at LGS this week. This week s daily average passage index for subyearling Chinook was about 4,000 per day, which is similar to last week s daily average passage index of about 4,350 per day. Passage of spring migrants remained low this week. This week s daily average passage indices for spring migrants were all less than 100 per day. Finally, no Pacific lamprey macropthalmia were encountered in this week s samples while ammocoetes were encountered in five of this week s samples. Sampling at Lower Monumental Dam (LMN) was every-third-day through April 14 th, transitioned to everyother-day through April 23 rd, and then transitioned to every day with the start of transportation. This week s samples at LMN were dominated by subyearling Chinook. This week s daily average passage index for subyearling Chinook was about 2,200 per day, which is a slight decrease from last week s daily average passage index of about 3,100 per day. Passage of spring migrants remained low this week. Finally, Pacific lamprey macropthalmia were encountered in three of this week s samples and ammocoetes were encountered in only one of this week s samples. Subyearling Chinook continued to dominate the samples at Rock Island Dam (RIS). This week s daily average passage index for subyearling Chinook was about 500 per day, which is an increase over last week s daily average passage index of about 300 per day. Passage of spring migrants was very low this week. Pacific lamprey macropthalmia were encountered in three of this week s samples while no ammocoetes were encountered this week. The Imnaha River Trap (IMN) is located at river kilometer 7 of the Imnaha River and is operated by the Nez Perce Tribe. Sampling at the Imnaha River Trap is year round. For 2018, the FPC currently has data from IMN for the period of February 15 through July 9 th. However, the trap was not operated for several days over the last two weeks due to holidays and high temperatures. Yearling Chinook and steelhead continue to be collected at the trap, although in relatively low numbers.
5 Page 5 Hatchery Releases FPC has not received preliminary data from some hatcheries as of, therefore, this hatchery release schedule represents the most up to date accounting that are available, but should not be considered a finalized record of hatchery releases. Snake River Zone: The Snake River Zone encompasses the Snake River and its tributaries from its confluence with the Columbia River to Hells Canyon Dam. In the past week there were no scheduled releases into this zone, nor are there any scheduled for the next two. Upper Columbia Zone: The Upper Columbia Zone encompasses the area of the Columbia River and its tributaries from Priest Rapids Dam to Chief Joseph Dam. In the past week there were no scheduled releases into this zone, nor are there any scheduled for the next two. Middle Columbia Zone: The Middle Columbia Zone is defined as the Columbia River and its tributaries from Bonneville Dam to Priest Rapids Dam (excluding the Snake River. In the past week there were three scheduled releases into this zone, all occurring in the Little White Salmon River. On July 9-11 th, a release of 950,000 subyearling fall Chinook were released at the mouth of the Little White Salmon River. On the 10 th, 950,000 more were released at the Willard NFH, and another 3.86 million were released at the Little White Salmon NFH on July 11 th. In the next two weeks, there are no scheduled releases into this zone. Lower Columbia Zone: The Lower Columbia Zone is defined as the Columbia River and its tributaries below Bonneville Dam. In the past week there were no scheduled releases into this zone, nor are there any scheduled for the next two. Adult Passage The summer Chinook count began June 1st at Bonneville Dam. Daily passage numbers at Bonneville Dam ranged between 532 and 888 adult summer Chinook in the last week. The 2018 summer Chinook count of 54,004 is about 70.1% of the 2017 count and 62.1% of the 10-year average. The 2018 summer Chinook jack count of 3,547 is about 38.5% of the 2017 count and 19.1% of the 10- year average count. At Willamette Falls, 23,906 adult spring Chinook have been counted so far this year. In 2017, 32,638 adult spring Chinook were counted at Willamette Falls. This year s count is about 73.2% of the 2017 count and 69.7% of the 10-year average count of 34,279. As of July 12th, a total of 35,726 adult summer Chinook have been counted at McNary Dam and 6,183 have been counted at Lower Granite Dam. The 2018 McNary Dam adult summer Chinook count is about 74.1% of the 2017 count and 61.5% the 10-year average count. The 2018 Lower Granite Dam adult summer Chinook count is about 87.2% of the 2017 count and 49.2% fewer fish than the 10-year average count. The 2018 Bonneville Dam adult steelhead count of 14,662 is about 1.9 times greater than the 2017 count of 7,519, while being 47.2% of the 10- year average count of 31,086. The 2018 Bonneville Dam adult unclipped steelhead count of 6,930 is about 2.4 times greater than the 2017 count of 3,082, while being 50% of the 10- year average count of 13,744. This year s Lower Granite steelhead count of 4,901 is about 66.6% of the 2017 count of 7,361 and 51.5% of the 10-year average count of 9,514. The 2018 Lower Granite Dam adult unclipped steelhead count of 1,461 has 1,621 fewer fish than the 2017 count of 3,082 and has 2,477 fewer fish than the 10-year average count of 3,938. At Willamette Falls, the 2018 count for steelhead was 10,174 as of July 10th. This year s steelhead count is about 4 times greater than the 2017 count of 2,557, while being about 52.7% of the 10-year average count of 19,276. Daily adult sockeye passage numbers at Bonneville Dam ranged between 927 and 4,508 last week. The 2018 adult sockeye count at Bonneville Dam of 186,367 is about 2.2 times greater than the 2017 count, while being about 60.6% of the 10-year average count. A total of 28,823 lampreys have been counted at
6 Bonneville Dam so far this year. The Bonneville 2018 lamprey count is about 53.3% of the 2017 count of 54,122, while being about 1.9 times greater than the 10- year average count of 15,011. Page 6
7 Page 7 Hatchery Releases Last Two Weeks Hatchery Release Summary From: 6/30/2018 to Agency Hatchery Species Race MigYr NumRel RelStart RelEnd RelSite RelRiver Zone Little White Salmon Little White Salmon U.S. Fish and Wildlife Service Little White Salmon NFH CH0 FA ,860, River River MCOL U.S. Fish and Wildlife Service Willard Hatchery CH0 FA 2018 Little White Salmon 950, River Little White Salmon River MCOL U.S. Fish and Wildlife Service Willard Hatchery CH0 FA , Willard Hatchery Little White Salmon River MCOL U.S. Fish and Wildlife Service Total 5,760,000 Washington Dept. of Fish and Wildlife Fallert Creek Hatchery CH0 FA ,500, Fallert Creek Hatchery Kalama River LCOL Washington Dept. of Fish and Wildlife Kalama Falls Hatchery CH0 FA ,500, Kalama Falls Hatchery Kalama River LCOL Washington Dept. of Fish and Wildlife North Toutle Hatchery CH0 FA , Green River Cowlitz River LCOL Washington Dept. of Fish and Wildlife Total 7,830,000 Grand Total 13,590,000 Hatchery Releases Next Two Weeks Hatchery Release Summary From: 7/14/2018 to 7/27/2018 Agency Hatchery Species Race MigYr NumRel RelStart RelEnd RelSite RelRiver Zone No Releases Scheduled CH = Chinook, ST = Steelhead, CO = Coho, SO = Sockeye, CT = Cutthroat Trout, CM = Chum
8 Daily Average Flow and Spill (in Kcfs) at Mid-Columbia Projects Grand Chief Rocky Rock Priest Coulee Joseph Wells Reach Island Wanapum Rapids Flow Spill Flow Spill Flow Spill Flow Spill Flow Spill Flow Spill Flow Spill / / / / / / / / / / / / / /12/ Daily Average Flow and Spill (in Kcfs) at Snake Basin Projects Hells Lower Little Lower Ice Dworshak Brownlee Canyon Granite Goose Monumental Harbor Flow Spill Inflow Outflow Flow Spill Flow Spill Flow Spill Flow Spill / / / / / / / / / / / / / /12/ Daily Average Flow and Spill (in Kcfs) at Lower Columbia Projects McNary John Day The Dalles Bonneville Flow Spill Flow Spill Flow Spill Flow Spill PH1 PH2 / / / / / / / / / / / / / /12/ Page 8
9 Page 9 Gas Bubble Trauma Monitoring Results from Representative Sites on the Snake River and Columbia River Number of Fish with Fin GBT Listed by Highest Rank Number of Number w/ Number w/ % Fin % Severe Rank Rank Rank Rank Site & Species Fish GBT signs Fin Signs GBT Fin GBT Lower Granite Dam Little Goose Dam /18 Chinook + Steelhead 80* /18 Chinook + Steelhead % 0.00% Lower Monumental Dam /18 Chinook + Steelhead 75* /18 Chinook + Steelhead 55* McNary Dam /18 Chinook + Steelhead % 0.00% /18 Chinook + Steelhead % 0.00% /18 Chinook + Steelhead % 0.00% /18 Chinook + Steelhead % 0.00% Bonneville Dam /18 Chinook + Steelhead % 0.00% /18 Chinook + Steelhead % 0.00% /18 Chinook + Steelhead % 0.00% /18 Chinook + Steelhead % 0.00% Rock Island Dam /18 Chinook + Steelhead % 0.00% /18 Chinook + Steelhead % 0.00% /18 Chinook + Steelhead % 0.00% /12/18 Chinook + Steelhead % 0.00% Samples marked with an asterisk indicate the sample size criteria of 100 fish was not met due to insufficient numbers of fish to sample that day. The inability to collect an adequate sample precludes the accurate estimation of the percentage of fish with GBT, and no estimate is provided. The action criteria for interruption of the voluntary spill for fish program is defined as either 15% of examined fish showing signs of gas bubble trauma in their non-paired fins, or 5% of the fish examined showing severe signs of gas bubble trauma in their nonpaired fins where severe signs constitute >25% of the surface area of the fin is occluded by gas bubbles, corresponding to ranks of 3 or 4.
10 Page 10 FISH PASSAGE CENTER 7/12/2018 5:15:10 PM Total Dissolved Gas Saturation(%) - Average of 12 Highest Hours, 24 Hours Average and 24 Hours High (Washington Calculation) Page 1 of 4 [INTERNAL PURPOSES ONLY] Total Dissolved Gas Data at Upper Columbia Sites Hungry H. Dnst Boundary Grand Coulee Grand C. Tlwr Chief Joseph Chief J. Dnst Total Dissolved Gas Data at Upper Columbia Sites Wells Wells Dwnstrm Rocky Reach Rocky R. Tlwr Rock Island Rock I. Tlwr
11 Page 11 FISH PASSAGE CENTER 7/12/2018 5:15:10 PM Total Dissolved Gas Saturation(%) - Average of 12 Highest Hours, 24 Hours Average and 24 Hours High (Washington Calculation) Page 2 of 4 [INTERNAL PURPOSES ONLY] Total Dissolved Gas Data at Upper and Mid-Columbia Sites Wanapum Wanapum Tlwr Priest Rapids Priest R. Dnstr Pasco Total Dissolved Gas Data at Snake and Clearwater Sites Dworshak Clrwtr Peck Anatone Clrwtr-Lewiston Lower Granite Lower G. Tlwr
12 Page 12 FISH PASSAGE CENTER 7/12/2018 5:15:10 PM Total Dissolved Gas Saturation(%) - Average of 12 Highest Hours, 24 Hours Average and 24 Hours High (Washington Calculation) Page 3 of 4 [INTERNAL PURPOSES ONLY] Total Dissolved Gas Data at Lower Snake Sites Little Goose L. Goose Tlwr Lower Mon. Lwr. Mon. Tlwr Ice Harbor Tlwtr Ice Harbor Total Dissolved Gas Data at Mid-Columbia Sites McNary-Wash. Tlwtr McNary John Day Tlwtr John Day The Dalles Dnstr T. Dalles
13 Page 13 FISH PASSAGE CENTER 7/12/2018 5:15:10 PM Total Dissolved Gas Saturation(%) - Average of 12 Highest Hours, 24 Hours Average and 24 Hours High (Washington Calculation) Page 4 of 4 [INTERNAL PURPOSES ONLY] Total Dissolved Gas Data at Mid-Columbia Sites Bonneville Warrendale Camas\Washug. Cascade Isld Hours used in calculating values:
14 FISH PASSAGE CENTER Page 14 7/12/2018 5:17:09 PM Smolt Monitoring Program Two Week Passage Index Report Page 1 of 7 COMBINED YEARLING CHINOOK WTB (Coll) IMN (Coll) GRN (Coll) LEW (Coll) LGR (Index) LGS (Index) LMN (Index) RIS (Index) MCN (Index) JDA (Index) BO2 (Index) / / / / / / / / / / / / / / /12/ Total: # Days: Average: YTD: 23,452 41,210 21,824 12,792 4,639,013 2,838,048 2,045,219 49,702 1,494,206 1,257,304 1,890,717 Number of hours sampled: - No data available or no sample conducted
15 FISH PASSAGE CENTER Page 15 7/12/2018 5:17:09 PM Smolt Monitoring Program Two Week Passage Index Report Page 2 of 7 COMBINED SUBYEARLING CHINOOK WTB (Coll) IMN (Coll) GRN (Coll) LEW (Coll) LGR (Index) LGS (Index) LMN (Index) RIS (Index) MCN (Index) JDA (Index) BO2 (Index) / ,025 5,195 2, ,507 42,348 / ,964 8,453 1, ,826 26,889 /2018 3,734 2,771 1, ,308 26,496 /2018 4,152 3,879 2, ,692 18,114 / ,674 3,851 1, ,006 27,036 / ,579 3,558 2, ,968 14,443 /2018 4,011 3,457 4, ,774 18,981 /2018 3,263 4,484 6, ,013 25,561 / ,227 4,447 2, ,921 16,741 /2018 1,304 2,851 2, ,345 10,865 /2018 3,088 4,059 1, ,309 9,764 / ,541 4,233 1, ,314 10,836 /2018 4,168 4,632 2, ,621 10,019 /2018 1,898 4,745 2, ,565 7,818 07/12/2018 2,983 3,054 1, ,656 14,114 Total: ,611 63,669 39,165 5, , , ,025 # Days: Average: ,174 4,245 2, ,388 33,960 18,668 YTD: , , ,175 28,979 1,977, ,023 2,175,993 Number of hours sampled: - No data available or no sample conducted
16 FISH PASSAGE CENTER Page 16 7/12/2018 5:17:09 PM Smolt Monitoring Program Two Week Passage Index Report Page 3 of 7 COMBINED COHO WTB (Coll) IMN (Coll) GRN (Coll) LEW (Coll) LGR (Index) LGS (Index) LMN (Index) RIS (Index) MCN (Index) JDA (Index) BO2 (Index) / / / / / / / / / / / / / / /12/ Total: ,717 # Days: Average: YTD: 0 0 1,224 1, , ,219 42,470 44, , , ,310 Number of hours sampled: - No data available or no sample conducted
17 FISH PASSAGE CENTER Page 17 7/12/2018 5:17:09 PM Smolt Monitoring Program Two Week Passage Index Report Page 4 of 7 COMBINED STEELHEAD WTB (Coll) IMN (Coll) GRN (Coll) LEW (Coll) LGR (Index) LGS (Index) LMN (Index) RIS (Index) MCN (Index) JDA (Index) BO2 (Index) / / / / / / / / / / / / / / /12/ Total: # Days: Average: YTD: ,447 3,888 5,328 3,924,703 3,004,167 1,942,657 24, , , ,557 Number of hours sampled: - No data available or no sample conducted
18 FISH PASSAGE CENTER Page 18 7/12/2018 5:17:09 PM Smolt Monitoring Program Two Week Passage Index Report Page 5 of 7 COMBINED SOCKEYE WTB (Coll) IMN (Coll) GRN (Coll) LEW (Coll) LGR (Index) LGS (Index) LMN (Index) RIS (Index) MCN (Index) JDA (Index) BO2 (Index) / / / / / / / / / / / / / / /12/ Total: # Days: Average: YTD: , ,845 58,616 76,223 1,527, , ,292 Number of hours sampled: - No data available or no sample conducted
19 Page 19 FISH PASSAGE CENTER 7/12/2018 5:17:09 PM Smolt Monitoring Program Two Week Passage Index Report Page 6 of 7 COMBINED LAMPREY JUVENILES WTB (Coll) IMN (Coll) GRN (Coll) LEW (Coll) LGR* (Sample) LGS (Coll) LMN (Coll) RIS (Coll) MCN (Coll) JDA (Coll) BO2 (Coll) / / / / / / / / / / / / / / /12/ Total: ,000 1, # Days: Average: YTD: ,679 56, , ,128 26,890 * - No data available or no sample conducted - Juvenile lamprey can escape the sample tank at LGR which would lead to unreliable estimates of collection.therefore, only sample counts are provided in this report. Number of hours sampled:
20 FISH PASSAGE CENTER Page 20 7/12/2018 5:17:09 PM Smolt Monitoring Program Two Week Passage Index Report Page 7 of 7 Smolt Minitoring Program Sites and Agency Collaborations: WTB (Collection) - Salmon River Trap at Whitebird : Collection Counts IMN (Collection) - Imnaha River Trap : Collection Counts GRN (Collection) - Grande Ronde River Trap : Collection Counts LEW (Collection) = Snake River Trap at Lewiston : Collection Counts LGR (Index) - Lower Granite Dam Bypass Collection System : Passage Index Counts LGS (Index) - Little Goose Bypass Collection System : Passage Index Counts LMN (Index) - Lower Monumental Dam Bypass Collection System : Passage Index Counts RIS (Index) - Rock Island Dam Second Powerhouse Bypass Trap : Passage Index Counts MCN (Index) - McNary Dam Bypass Collection System : Passage Index Counts JDA (Index) - John Day Dam Bypass Collection System : Passage Index Counts BO2 (Index) - Bonneville Dam Second Powerhouse Bypass Collection System : Passage Index Counts - No data available or no sample conducted Number of hours sampled: Important Information About this Report: - For clip information see: - Three classes of fish counts are shown in these tables: Sample counts (Samp) are provided for juvenile lamprey at LGR. See note below for details. Collection counts (Coll), which account for sample rates but are not adjusted for flow; Passage indices (INDEX), which are collection counts divided by the proportion of water passing through the sampled powerhouse. Passage indices are not population estimates, but are used to adjust collection counts for daily fluctuations in the site's or project's operations. Equations for passage index are provided below for each site. LGR, LGS, LMN, MCN, JDA (Index) = Lower Granite Dam Bypass Collection System : Passage Index Counts Passage Index = Collection Counts / (Powerhouse Flow / (Powerhouse Flow + Spill)) RIS, BO2 (Index) = Rock Island Dam Second Powerhouse Bypass Trap : Passage Index Counts Passage Index = Collection Counts / (Powerhouse 2 Flow / (Powerhouse 1 & 2 Flow + Spill)) - Combined lamprey juvenile collection counts are provided for all sites. Combined lamprey juveniles is a combination of pacific lamprey ammocoetes, brook lamprey ammocoetes, unknown lamprey ammocoetes, pacific lamprey macropthalmia, and unidentified lamprey species. - Most samples occur over a 24-hr period that spans two calendar days. In this report, the date shown corresponds with the sample end date.
21 FISH PASSAGE CENTER Page 21 7/12/2018 5:17:44 PM Two Week Transportation Summary Report 6/28/ :00:00 AM TO 7/12/ :00:00 AM Page 1 of 2 Lower Granite Dam Data Chinook Subyearlings Chinook Yearlings Coho Sockeye Steelhead Grand Total Sum of Number Collected 28, ,746 Sum of Number Barged 25, ,874 Sum of Number Bypassed Sum of Number Trucked Sum of Sample Morts Sum of Facility Morts Sum of Reseach Morts Sum of Total Project Mort Little Goose Dam Data Chinook Subyearlings Chinook Yearlings Coho Sockeye Steelhead Grand Total Sum of Number Collected 42, ,067 Sum of Number Barged 40, ,765 Sum of Number Bypassed Sum of Number Trucked Sum of Sample Morts Sum of Facility Morts Sum of Reseach Morts Sum of Total Project Mort
22 Page 22 FISH PASSAGE CENTER 7/12/2018 5:17:44 PM Two Week Transportation Summary Report 6/28/ :00:00 AM TO 7/12/ :00:00 AM Page 2 of 2 Lower Monumental Dam Data Chinook Subyearlings Chinook Yearlings Coho Sockeye Steelhead Grand Total Sum of Number Collected 23, ,070 Sum of Number Barged 22, ,026 Sum of Number Bypassed Sum of Number Trucked Sum of Sample Morts Sum of Facility Morts Sum of Reseach Morts Sum of Total Project Mort Total Data Chinook Subyearlings Chinook Yearlings Coho Sockeye Steelhead Grand Total Sum of Number Collected 94, ,883 Sum of Number Barged 88, ,665 Sum of Number Bypassed Sum of Number Trucked Sum of Sample Morts Sum of Facility Morts Sum of Reseach Morts Sum of Total Project Mort
23 Page 23 FISH PASSAGE CENTER 7/12/2018 5:17:21 PM YTD Transportation Summary Report Page 1 of 2 Lower Granite Dam Data Chinook Subyearlings Chinook Yearlings Coho Sockeye Steelhead Grand Total Sum of Number Collected Sum of Number Barged Sum of Number Bypassed Sum of Number Trucked Sum of Sample Morts Sum of Facility Morts Sum of Reseach Morts Sum of Total Project Mort Little Goose Dam Data Chinook Subyearlings Chinook Yearlings Coho Sockeye Steelhead Grand Total Sum of Number Collected Sum of Number Barged Sum of Number Bypassed Sum of Number Trucked Sum of Sample Morts Sum of Facility Morts Sum of Reseach Morts Sum of Total Project Mort
24 FISH PASSAGE CENTER Page 24 7/12/2018 5:17:22 PM YTD Transportation Summary Report Page 2 of 2 Lower Monumental Dam Data Chinook Subyearlings Chinook Yearlings Coho Sockeye Steelhead Grand Total Sum of Number Collected Sum of Number Barged Sum of Number Bypassed Sum of Number Trucked Sum of Sample Morts Sum of Facility Morts Sum of Reseach Morts Sum of Total Project Mort Total Data Chinook Subyearlings Chinook Yearlings Coho Sockeye Steelhead Grand Total Sum of Number Collected Sum of Number Barged Sum of Number Bypassed Sum of Number Trucked Sum of Sample Morts Sum of Facility Morts Sum of Reseach Morts Sum of Total Project Mort
25 Cumulative Adult Passage at Mainstem Dams Through: 07/12 Page 25 Spring Chinook Summer Chinook Fall Chinook Yr Avg Yr Avg Yr Avg. dam enddate Adult Jack Adult Jack Adult Jack Adult Jack Adult Jack Adult Jack Adult Jack Adult Jack Adult Jack BON 07/ TDA 07/ JDA 07/ MCN 07/ IHR 07/ LMN LGS 07/ LGR 07/ PRD WAN RIS RRH WEL WFA Coho Sockeye Steelhead Lamprey Yr Avg. 10-Yr 10-Yr Unclipped Unclipped 10-Yr 10-Yr DAM ENDDATE Adult Jack Adult Jack Adult Jack Avg Avg Avg Avg. BON 07/ TDA 07/ JDA 07/ MCN 07/ IHR 07/ LMN LGS 07/ LGR 07/ PRD WAN RIS RRH WEL WFA PRD does not post wild steelhead numbers. These numbers were collected from USACE, Grant PUD, Douglas PUD, Chelan PUD, ODFW and DART. Wild steelhead numbers are included in the total. Wild Steelhead are defined as unclipped fish. Historic counts (pre-1996) were obtained from CRITFC and compiled by the FPC. Historic counts 1997 to present were obtained from the Corps of Engineers. Page last updated on:

26 Page 26
Weekly Report #18 16
 Visit our Website at www.fpc.org Fish Passage Center Weekly Report #18 16 847 NE 19th Ave., Suite 250 Portland, OR 97232 (503) 833-3900 June 22, 2018 This Week s Highlights Water Supply Precipitation throughout
Fish Passage Center Weekly Report #01-5
 SUMMARY OF EVENTS: Fish Passage Center Weekly Report #01-5 April 13, 2001 BPA declared a power emergency from April 3 through April 13, under the terms of the NMFS Biological Opinion. The power emergency
On October 2, 2018, FPAC met via conference call for its weekly meeting. The following people participated in the meeting:
 FISH PASSAGE CENTER 847 NE 19 th Avenue, #250, Portland, OR 97232 Phone: (503) 833-3900 Fax: (503) 232-1259 www.fpc.org/ e-mail us at fpcstaff@fpc.org MEMORANDUM To: From: Fish Passage Advisory Committee
Appendix N. The 2006 Fish Passage Implementation Plan
 Appendix N The 2006 Fish Passage Implementation Plan 2006 Fish Passage Implementation Plan March 31, 2006 Background: The 2006 Fish Passage Implementation Plan describes the Corps plan for fish passage
Annual Fish Passage Report 2012 Columbia and Snake River Projects
 US Army Corps of Engineers Portland District Walla Walla District Annual Fish Passage Report 2012 Columbia and Snake River Projects 2012 ANNUAL FISH PASSAGE REPORT COLUMBIA AND SNAKE RIVERS for SALMON,
1999 Annual Report To the Oregon Department of Environmental Quality
 1999 Annual Report To the Oregon Department of Environmental Quality February 25, 2000 ODEQ Annual Report Table of Contents Introduction................................................................
LAKE CHELAN ANNUAL FLOW AND WATER TEMPERATURE REPORT Final
 LAKE CHELAN ANNUAL FLOW AND WATER TEMPERATURE REPORT 2013 LICENSE ARTICLES 405 & 408 Final LAKE CHELAN HYDROELECTRIC PROJECT FERC Project No. 637 April 30, 2014 Public Utility District No. 1 of Chelan
ALBENI FALLS DAM AND LAKE PEND OREILLE
 ALBENI FALLS DAM AND LAKE PEND OREILLE Fall Public Meeting 237 237 237 217 217 217 200 200 200 0 0 0 163 163 163 131 132 122 Aug. 7, 2017 255 255 255 239 65 53 80 119 27 252 174.59 83 36 118 110 135 120
SNOHOMISH COUNTY PUBLIC UTILITY DISTRICT NO.1. Your Northwest renewables utility
 SNOHOMISH COUNTY PUBLIC UTILITY DISTRICT NO.1 Your Northwest renewables utility May 17, 2013 VIA ELECTRONIC FILING Kimberly D. Bose, Secretary Federal Energy Regulatory Commission (FERC) 888 First Street
Season Totals by Port for All Weeks
 Salmon Fishery Estimates for the Area from Cape Falcon to the Oregon/California Border No. Fish Harvested No. Fish Released Retained Catch Port Per Garibaldi 6,372 2,206 697 1,213 125 0.46 Pacific City
*iiiii. May 31, 2017 VIA ELECTRONIC FILING
 *iiiii. PUBLIC UTILITY DISTRICT NO. I of CHELAN COUNTY P.O. Box 1231, Wenatchee, WA 98807-1231 327 N. Wenatchee Ave., Wenatchee, WA 98801 (509) 663-8121 Toll free 1-888-663-8121 www.chelanpud.org May 31,
2015 Fish Passage Plan
 March 1, 2015 2015 Fish Passage Plan Chapter 4 John Day Dam Table of Contents 1. FISH PASSAGE INFORMATION... 5 1.1. JUVENILE FISH.... 5 1.2. ADULT FISH.... 7 2. PROJECT OPERATIONS... 9 2.1. GENERAL....
CUSHMAN HYDROELECTRIC PROJECT. Pat McCarty, Generation Manager
 CUSHMAN HYDROELECTRIC PROJECT Pat McCarty, Generation Manager AGENDA A picture tour of Cushman Relicense history Relicense requirements Fisheries Flows & reservoir elevations Cultural/historical resources
Henry M. Jackson Hydroelectric Project (FERC No. 2157)
") Henry M. Jackson Hydroelectric Project (FERC No. 2157) License Article 401: Water Quality Monitoring Plan 2013 Annual Report Everett, WA Final This document has been prepared for the District. It has been
Henry M. Jackson Hydroelectric Project (FERC No. 2157) License Article 401: Water Quality Monitoring Plan 2013 Annual Report Everett, WA Final This document has been prepared for the District. It has been
FISHWAY STATUS REPORT
 FISHWAY STATUS REPORT Date: 05/12/13 Inspection Period: 05/05-11/12 THE DALLES DAM The Dalles Project-Fisheries P.O. Box 564 The Dalles, OR 97058-9998 Phone: 541-506-3800 Fishways are inspected twice daily.
Year to Date Summary. Average and Median Sale Prices
 A Publication of RMLS, The Source for Real Estate Statistics in Your Community Residential Review: Southwest Washington September 2018 Reporting Period September Residential Highlights Southwest Washington
Meter Insights for Downtown Store
 Meter Insights for Downtown Store Commodity: Analysis Period: Prepared for: Report Date: Electricity 1 December 2013-31 December 2014 Arlington Mills 12 February 2015 Electricity use over the analysis
6.3 SUBSTRATE COMPOSITION AND QUALITY
 6.3 SUBSTRATE COMPOSITION AND QUALITY 6.3.1 METHODS The Wolman pebble count procedure (Wolman, 1954) is used to measure the diameter of the intermediate axis of 100 randomly selected stones along transects
Kelly Redmond Regional Climatologist, Western Regional Climate Center Atmospheric Sciences Division
 Kelly Redmond Regional Climatologist, Western Regional Climate Center Atmospheric Sciences Division Climate and the Colorado and Columbia River Basins Presented at The Aspen Global Change Institute June
FRI-UW-9507 October 1995 DONALD E. ROGERS A REPORT TO THE PACIFIC SEAFOOD PROCESSORS ASSOCIATION
 FRI-UW-957 October 1995 FORECASTS OF THE 1996 SOCKEYE SALMON RUNS TO BRISTOL BAY DONALD E. ROGERS A REPORT TO THE PACIFIC SEAFOOD PROCESSORS ASSOCIATION ACKNOWLEDGMENTS A special thanks to Mrs. Bev Cross
FORECASTS OF THE 1998 SOCKEYE SALMON RUNS TO BRISTOL BAY
 FRI-UW-9710 October 1997 FISHERIES RESEARCH INSTITUTE School of Fisheries University of Washington Seattle, Washington 98195 FORECASTS OF THE 1998 SOCKEYE SALMON RUNS TO BRISTOL BAY D.E. ROGERS ANNUAL
D O N A LD E. R O GER S RE SEA RC H P ROFESSOR
 F RI -UW -9417 O c t ober 1 994 FORECASTS OF THE 1995 SOCKEYE SALMON RUNS TO BRISTOL BAY D O N A LD E. R O GER S RE SEA RC H P ROFESSOR A RE P O R T T O T H E P A CIFIC S E A FO O D P ROCESSORS A SSOCIA
Cook Inlet Aquaculture Association 2016 Capture/Transport of Smolt/Broodstock Call for Bids
 Cook Inlet Aquaculture Association 2016 Capture/Transport of Smolt/Broodstock Call for Bids Cook Inlet Aquaculture Association (CIAA), as part of its broodstock collection and remote release programs,
2017 Adjusted Count Report February 12, 2018
 A statewide multi-use trail user study and volunteer data collection program 2017 Adjusted Count Report February 12, 2018 The following report includes the final adjusted infrared (IR) counter data at
Revising the Historic Monthly Mean Niagara River Flow at Buffalo to Reflect Better Estimates of Maid-of-the-Mist Pool Outflows
 Revising the Historic Monthly Mean Niagara River Flow at Buffalo to Reflect Better Estimates of Maid-of-the-Mist Pool Outflows 1961-2007 Background The Niagara River flow at Buffalo is currently computed
DRIVER SPEED COMPLIANCE WITHIN SCHOOL ZONES AND EFFECTS OF 40 PAINTED SPEED LIMIT ON DRIVER SPEED BEHAVIOURS Tony Radalj Main Roads Western Australia
 DRIVER SPEED COMPLIANCE WITHIN SCHOOL ZONES AND EFFECTS OF 4 PAINTED SPEED LIMIT ON DRIVER SPEED BEHAVIOURS Tony Radalj Main Roads Western Australia ABSTRACT Two speed surveys were conducted on nineteen
April 10, Dear Customer:
 Dear Customer: April 10, Attached is the monthly water supply outlook and projected operations for Yellowtail Dam and Powerplant. If you have any questions or concerns, please feel free to call me at 406-247-7334
Appendix E Water Supply Modeling
 Supply Modeling Modesto Irrigation District Treatment Plant Expansion Project Modeling I. Introduction The Modesto Irrigation District (MID) is situated adjacent to and north of the Tuolumne River. Over
ENVIRONMENTAL & ENGINEERING SERVICES DEPARTMENT
 CITY OF LONDON ENVIRONMENTAL & ENGINEERING SERVICES DEPARTMENT WASTEWATER TREATMENT OPERATIONS VAUXHALL WASTEWATER TREATMENT PLANT 2013 ANNUAL REPORT FEBRUARY 2014 Vauxhall Wastewater Treatment Plant 2013
February 10, The Honorable Kimberly D. Bose Secretary Federal Energy Regulatory Commission 888 First Street, NE Washington, DC 20426
 California Independent System Operator Corporation February 10, 2016 The Honorable Kimberly D. Bose Secretary Federal Energy Regulatory Commission 888 First Street, NE Washington, DC 20426 Re: California
Projected 2011 Missouri River Flood Elevations
 Projected 2011 Missouri River Flood Elevations Kansas City District, US Army Corps of Engineers The following table presents two water surface profiles based on the likely range of flows that are expected
Presentation to the Customer Service, Operations and Safety Committee OPERATIONS PERFORMANCE INDICATORS
 Presentation to the Customer Service, Operations and Safety Committee OPERATIONS PERFORMANCE INDICATORS May 19, 2005 Department of Operations 100 95 90 85 80 75 70 65 A B C D RAIL PERFORMANCE INDEX FY
Omineca Region Stocked Lake Assessment Report
 Executive Mackenzie Lake #1 West 2004 Stocking assessments were conducted at Mackenzie Lake #1 West in 2000, 2003 and 2004 to determine the status of the fishery. Mackenzie Lake #1 West is 16.9 ha and
Presentation to: Cedar Hills City Council Division of Water Quality Utah Department of Environmental Quality
 American Fork Canyon Water Quality Presentation to: Cedar Hills City Council Utah Department of Environmental Quality Meeting Purpose 1. Provide an overview of general water quality conditions in American
Action Requested From AMWG
 Action Requested From AMWG NONE, These Two Presentations Are For Information Transfer Only The information is derived from a multi-year synthesis research effort related to existing data on flow, sediment-transport
2017 EXTENDED LOCK MAINTENANCE CLOSURE ON THE COLUMBIA SNAKE RIVER WATERWAY
 EXTENDED LOCK MAINTENANCE CLOSURE ON THE WATERWAY 2 2 2 8 11 12 12 13 12 13 12 Sheryl Carrubba Northwestern Division, Navigation Inland Waterways Users Board Meeting No. 84 19 July The views, opinions
State of California The Resources Agency DEPARTMENT OF FISH AND GAME
 State of California The Resources Agency DEPARTMENT OF FISH AND GAME BUTTE CREEK SPRING-RUN CHINOOK SALMON, ONCORYHNCHUS TSHAWYTSCHA PRE-SPAWN MORTALITY EVALUATION 2013 By Clint E. Garman Inland Fisheries
Meridian Township Range Sections Seward 5N 4W 33,34 Seward 4N 4W 4,9
 ATTACHMENT A. RUSSIAN RIVER RESERVATION OF WATER APPLICATION. Page 1 LOCATION OF PROPOSED RESERVATION OF WATER Meridian Township Range Sections Seward 5N 4W 33,34 Seward 4N 4W 4,9 Russian River is located
All Annual Operating Plan Recipients
 To: All Annual Operating Plan Recipients From: Lower Colorado Region Boulder Canyon Operations Office River Operations Group Daniel Bunk P.O. Box 647 Boulder City, NV 896-47 Phone: 72-293-83 The operation
August ATR Monthly Report
 August ATR Monthly Report Minnesota Department of Transportation Office of Transportation Data and Analysis August 2011 Introduction The purpose of this report is to examine monthly traffic trends on
Outmigrant Trapping of Juvenile Salmon in the Lower Tuolumne River, 2011
 Outmigrant Trapping of Juvenile Salmon in the Lower Tuolumne River, 2011 Submitted To: Turlock Irrigation District Modesto Irrigation District Prepared By: Chrissy L. Sonke Shaara Ainsley Andrea Fuller
Outmigrant Trapping of Juvenile Salmon in the Lower Tuolumne River, 2012
 Outmigrant Trapping of Juvenile Salmon in the Lower Tuolumne River, 2012 Submitted To: Turlock Irrigation District Modesto Irrigation District Prepared By: Chrissy L. Sonke Andrea Fuller FISHBIO 1617 S.
Willamette River Transit Bridge. Portland - Milwaukie Light Rail Willamette River Bridge Willamette River Bridge Advisory Committee
 Portland - Milwaukie Light Rail Willamette River Bridge Willamette River Bridge Advisory Committee 05.28.09 09 Bridge Type - Cost Vertical Clearance Bicycle Pedestrian Path Width Bridge Type - Cost WRBAC
Customer Service, Operations and Security Committee. Information Item III-A. January 12, 2017
 Customer Service, Operations and Security Committee Information Item III-A January 12, 2017 Train Reliability Program Page 4 of 19 Washington Metropolitan Area Transit Authority Board Action/Information
FOR IMMEDIATE RELEASE
 Article No. 7433 Available on www.roymorgan.com Roy Morgan Unemployment Profile Friday, 12 January 2018 2.6m Australians unemployed or under-employed in December The latest data for the Roy Morgan employment
Southern Nevada Water Authority Lake Mead Intake No. 3. The Last Straw?
 Southern Nevada Water Authority Lake Mead Intake No. 3 The Last Straw? WESTCAS October 29, 2015 Underlying Intake No. 3 Factors Lake Mead is the primary water source for So. Nevada 90% of supply No guarantees
Rates of Motor Vehicle Crashes, Injuries, and Deaths in Relation to Driver Age, United States,
 RESEARCH BRIEF This Research Brief provides updated statistics on rates of crashes, injuries and death per mile driven in relation to driver age based on the most recent data available, from 2014-2015.
Capacity Analysis Report. For. William E. Dunn Water Reclamation Facility 4111 Dunn Drive Palm Harbor, Florida 34683
 Capacity Analysis Report For William E. Dunn Water Reclamation Facility 4111 Dunn Drive Palm Harbor, Florida 34683 Florida Department of Environmental Protection Facility Identification No. FLA0128775
September 2016 Water Production & Consumption Data
 September 2016 Water Production & Consumption Data September 2016 monthly water production (288.48 AF) was lowest in at least 17 years. Monthly water production has increased slightly each month since
Federal Railroad Administration. 49 CFR Part 228. Passenger Hours of Service. Do not distribute outside the FRA
 Federal Railroad Administration 49 CFR Part 228 Passenger Hours of Service Do not distribute outside the FRA Title 49 CFR 228 SUBPART F COVERED EMPLOYEES PROVISIONS CARRIED OVER FROM THE OLD LAW TO THE
TARGET ZERO TEAM PROJECT DUI ZONE IDENTIFICATION AND BASELINE DATA SNOHOMISH COUNTY
 TARGET ZERO TEAM PROJECT DUI ZONE IDENTIFICATION AND BASELINE DATA 2005 2009 SNOHOMISH COUNTY TABLE OF CONTENTS COUNTY CHARACTERISTICS AND SUMMARY... TOTAL FATAL COLLISIONS 4 DUI ZONE IDENTIFICATION...
Sound Transit Operations July 2016 Service Performance Report. Ridership
 Ridership Total Boardings by Mode Mode Jul-15 Jul-16 % YTD-15 YTD-16 % ST Express 1,618,779 1,545,852-4.5% 10,803,486 10,774,063-0.3% Sounder 333,000 323,233-2.9% 2,176,914 2,423,058 11.3% Tacoma Link
Selecting climate change scenarios using impact-relevant sensitivities
 Geophysical Research Letters Supporting Information for Selecting climate change scenarios using impact-relevant sensitivities Julie A. Vano A* John B. Kim B David E. Rupp A Philip W. Mote A A Oregon Climate
Transmission Planning Report
 Transmission Planning Report Board of Directors Meeting December 15, 2010 1 Overview Study Team Reports Puget Sound Area Study Team Northern Mid-Columbia Study Team Cross Cascades Study Team Centralia
LONG RANGE PERFORMANCE REPORT. Study Objectives: 1. To determine annually an index of statewide turkey populations and production success in Georgia.
 State: Georgia Grant Number: 08-953 Study Number: 6 LONG RANGE PERFORMANCE REPORT Grant Title: State Funded Wildlife Survey Period Covered: July 1, 2010 - June 30, 2011 Study Title: Wild Turkey Production
Monthly Market Detail - June 2018 Single Family Homes Miami-Dade County
 ly Market Detail - June 218 Summary Statistics June 218 June 217 Paid in Cash 1,335 1,346 -.8% 286 33-5.6% $355, $335, 6.% Average Sale Price Dollar Volume $598,494 $57,82 18.% $799. Million $682.5 Million
Monthly Market Detail - June 2018 Townhouses and Condos Miami-Dade County
 ly Market Detail - June 218 Summary Statistics June 218 June 217 Paid in Cash 1,257 1,323-5.% 657 682-3.7% $24, $235, 2.1% Average Sale Price Dollar Volume $439,546 $384,319 14.4% $552.5 Million $58.5
Summary Statistics. Closed Sales. Paid in Cash. Median Sale Price. Average Sale Price. Dollar Volume. Median Percent of Original List Price Received
 ly Market Detail - May 218 Summary Statistics May 218 May 217 Paid in Cash 1,667 1,647 1.2% 888 943-5.8% $168, $159, 5.7% Average Sale Price Dollar Volume $231,288 $21,944 9.6% $385.6 Million $347.4 Million
A Guide to the medium General Service. BC Hydro Last Updated: February 24, 2012
 A Guide to the medium General Service Conservation Rate BC Hydro Last Updated: February 24, 2012 Executive summary The way Medium General Service (MGS) accounts pay for electricity is changing. MGS is
Local Climatological (Data Summary Molim, Illinois
 SWS Miscellaneous Publication 98-13 STATE OF ILLINOIS DEPARTMENT OF ENERGY AND NATURAL RESOURCES Local Climatological (Data Summary Molim, Illinois 1872-1992 by Audrey A. Bryan and Wayne Wendland Climatological
11. Electrical energy tariff rating
 799 11. Electrical energy tariff rating 800 11. ELECTRICAL ENERGY TARIFF RATING There is no universal system for billing electrical energy. Each country generally adopts its own method, taking into account
2011 Air Emissions Inventory
 SECTION 3 HARBOR CRAFT This section presents emissions estimates for the commercial harbor craft source category, including source description (3.1), geographical delineation (3.2), data and information
GETTING THE WIND TO MARKET: KEY TO SUCCESS. IDAHO WIND WORKING GROUP Boise, Idaho September 22, 2010
 GETTING THE WIND TO MARKET: KEY TO SUCCESS IDAHO WIND WORKING GROUP Boise, Idaho September 22, 2010 Ridgeline started in 2000 Developed 65 MW Wolverine Creek Wind Farm E of Idaho Falls. Power Purchase
WIM #41 CSAH 14, MP 14.9 CROOKSTON, MINNESOTA APRIL 2014 MONTHLY REPORT
 WIM #41 CSAH 14, MP 14.9 CROOKSTON, MINNESOTA APRIL 2014 MONTHLY REPORT In order to understand the vehicle classes and groupings, the MnDOT Vehicle Classification Scheme and the Vehicle Classification
May ATR Monthly Report
 May ATR Monthly Report Minnesota Department of Transportation Office of Transportation Data and Analysis May 2011 Introduction The purpose of this report is to examine monthly traffic trends on Minnesota
January 18, Docket: ER Energy Imbalance Market Special Report Transition Period August 2018 for Idaho Power Company
 California Independent System Operator Corporation January 18, 2019 The Honorable Kimberly D. Bose Secretary Federal Energy Regulatory Commission 888 First Street, NE Washington, DC 20426 Re: California
TARGET ZERO TEAM PROJECT DUI ZONE IDENTIFICATION AND BASELINE DATA KING COUNTY
 TARGET ZERO TEAM PROJECT DUI ZONE IDENTIFICATION AND BASELINE DATA 2005 2009 KING COUNTY TABLE OF CONTENTS COUNTY CHARACTERISTICS AND SUMMARY TOTAL FATAL COLLISIONS 4 DUI ZONE IDENTIFICATION... Overview
Motorcoach Census. A Study of the Size and Activity of the Motorcoach Industry in the United States and Canada in 2015
 Motorcoach Census A Study of the Size and Activity of the Motorcoach Industry in the United States and Canada in 2015 Prepared for the American Bus Association Foundation by John Dunham & Associates October
January 18, Docket: ER Energy Imbalance Market Special Report Transition Period September 2018 for Idaho Power Company
 California Independent System Operator Corporation January 18, 2019 The Honorable Kimberly D. Bose Secretary Federal Energy Regulatory Commission 888 First Street, NE Washington, DC 20426 Re: California
Summary. IEEJ: November 2011 All Rights Reserved. Yu Nagatomi *
 Estimate of the Electricity-Saving Effects Taking Account of Change Effects in the Service Areas of Tokyo Electric Power Company and Tohoku Electric Power Company Yu Nagatomi * Summary Power generation
February 2012 Caltrain Annual Passenger Counts Key Findings
 February 2012 Caltrain Annual Passenger Counts Key Findings Key Findings February 2012 Caltrain Annual Passenger Counts The 2012 annual Caltrain passenger counts, which were conducted in February 2012,
February 2011 Caltrain Annual Passenger Counts Key Findings
 February 2011 Caltrain Annual Passenger Counts Key Findings Key Findings February 2011 Caltrain Annual Passenger Counts The 2011 annual Caltrain passenger counts, which were conducted in February 2011,
GoToBermuda.com. Q3 Arrivals and Statistics at September 30 th 2015
 Q3 Arrivals and Statistics at September 30 th 2015 1 Q3 Total Vacation Visitor Arrivals Q3 Arrivals 2014 2015 YTD 2014 YTD 2015 Air - Vacation 54,305 54,473 0.31% 168 117,639 116,700-0.80% (939) Cruise
2012 Air Emissions Inventory
 SECTION 3 HARBOR CRAFT This section presents emissions estimates for the commercial harbor craft source category, including source description (3.1), geographical domain (3.2), data and information acquisition
VEHICLE / PEDESTRIAN COLLISIONS
 Info item No. 1 Crosswalk Safety Advisory Committee March 31, 2016 VEHICLE / PEDESTRIAN COLLISIONS HRM: January December 20 DISCLAIMER: All figures presented in this report reflect the information held
Massachusetts Electric Company and Nantucket Electric Company, Docket No. D.T.E
 Amy G. Rabinowitz Counsel April 3, 2003 By Hand Mary L. Cottrell, Secretary Department of Telecommunications and Energy One South Station, 2 nd Floor Boston, MA 02110 Re: Massachusetts Electric Company
Group 3: Pricing from 1 April 2018 and load management
 Group 3: Pricing from 1 April 2018 and load management This document is intended to provide background to Network Tasman s Group 3 pricing, in particular the Regional Coincident Peak Demand (RCPD) price,
TACOMA HYDROELECTRIC PROJECT PROJECT EFFECTS ON THE WATER QUANTITY AND QUALITY OF THE ANIMAS RIVER
 TACOMA HYDROELECTRIC PROJECT PROJECT EFFECTS ON THE WATER QUANTITY AND QUALITY OF THE ANIMAS RIVER Prepared for: PUBLIC SERVICE CO. OF COLORADO Durango, Colorado Prepared by: DEVINE TARBELL & ASSOCIATES,
THE PARTNERSHIP OF RAIL & COAL MOVING AHEAD 2014 RMCMI ANNUAL MEETING SEPTEMBER 19, 2014
 THE PARTNERSHIP OF RAIL & COAL MOVING AHEAD 2014 RMCMI ANNUAL MEETING SEPTEMBER 19, 2014 1 BNSF is a Leading U.S. Railroad A Berkshire Hathaway company 32,500 route miles in 28 states and two Canadian
The Fuel and Vehicle Trends Report August 31, 2016
 ISSN 1948-2388 The Fuel and Vehicle Trends Report August 31, 2016 This report is a summary of the latest fuel prices and other oil industry key statistics. In addition, this report provides the latest
Local Climatological Data Summary Aurora, Illinois
 SWS Miscellaneous Publication 98-15 STATE OF ILLINOIS DEPARTMENT OF NATURAL RESOURCES Local Climatological Data Summary Aurora, Illinois 1901-1996 Herbert Hoffman 1, Audrey A. Bryan 2 and Wayne Wendland
Monthly Hog Market Update United States Hog Production
 This information is provided as a resource by Saskatchewan Agriculture staff All prices are in Canadian dollars unless otherwise noted. Please use this information at your own risk. Monthly Hog Market
Appendix E Hydrology, Erosion and Sediment Transport Studies
 Appendix E Hydrology, Erosion and Sediment Transport Studies Hatch 2012/10 Appendix E1 EA Hydrology Memorandum February 2011 (Hatch. 2011a) Hatch 2012/10 Project Memo February 23, 2011 TO: Larry King FROM:
Residential Load Profiles
 Residential Load Profiles TABLE OF CONTENTS PAGE 1 BACKGROUND... 1 2 DATA COLLECTION AND ASSUMPTIONS... 1 3 ANALYSIS AND RESULTS... 2 3.1 Load Profiles... 2 3.2 Calculation of Monthly Electricity Bills...
Session D2 - Use of 3D Acoustic Telemetry to Monitor Upstream Passage of American Shad on the Merrimack River in Massachusetts
 University of Massachusetts - Amherst ScholarWorks@UMass Amherst International Conference on Engineering and Ecohydrology for Fish Passage International Conference on Engineering and Ecohydrology for Fish
ENOW SOLAR TEST RESULTS:
 ENOW SOLAR TEST RESULTS: WINTER, SPRING AND SUMMER APU OPERATION Summary Results enow Inc. has been collecting data from three Class 8 Sleeper Trucks equipped with Battery APU systems. Two of the trucks
Design Criteria Data
 PHOENIX/SKY HARBOR AZ Latitude = 33.43 N WMO No. 72278 Longitude =112. W Elevation = 116 feet Period of Record = 1973 to 1996 Average Pressure = 28.72 inches Hg Design Criteria Data Mean Coincident (Average)
AOP. Final Missouri River Mainstem System Annual Operating Plan
 US Army Corps of Engineers Northwestern Division Missouri River Basin Water Management Division Final AOP 2009-2010 Missouri River Mainstem System 2009-2010 Annual Operating Plan Fort Peck Garrison Oahe
2014 Meteorological and Oceanographic Summary for the Bocas del Toro Research Station. Prepared by: Steven Paton
 0 2014 Meteorological and Oceanographic Summary for the Bocas del Toro Research Station Prepared by: Steven Paton 1 Introduction This is the second of a series of yearly reports summarising the past year
JBS Energy, Inc. 311 D Street West Sacramento California, USA tel Prepared by William B. Marcus Greg Ruszovan
 Know Your Customers : A Review of Load Research Data and Economic, Demographic, and Appliance Saturation Characteristics of California Utility Residential Customers Prepared by William B. Marcus Greg Ruszovan
Driver Speed Compliance in Western Australia. Tony Radalj and Brian Kidd Main Roads Western Australia
 Driver Speed Compliance in Western Australia Abstract Tony Radalj and Brian Kidd Main Roads Western Australia A state-wide speed survey was conducted over the period March to June 2 to measure driver speed
Rate Schedules. Effective 1/1/2019
 Rate Schedules 2019 Effective 1/1/2019 SUMMARY OF RATE SCHEDULES REVISIONS FOR RATES EFFECTIVE JANUARY 1, 2019 (1) Rate component changes for Residential and Heating Service rate schedules. (2) General
TRAFFIC VOLUME TRENDS July 2002
 TRAFFIC VOLUME TRENDS July 2002 Travel on all roads and streets changed by +2.3 percent for July 2002 as compared to July 2001. Estimated Vehicle-Miles of Travel by Region - July 2002 - (in Billions) West
Missouri River Mainstem System Annual Operating Plan. Garrison. Oahe
 Missouri River Basin Water Management Division Final AOP 2012-2013 Missouri River Mainstem System 2012-2013 Annual Operating Plan Fort Peck Garrison Oahe Big Bend Fort Randall Gavins Point Annual Operating
Motorcyclist Deaths Jan Jul. 2018
 Motorcyclist Deaths Jan. 2008 Jul. 2018 This report summarizes all accidental deaths of motorcyclists in traffic-related motor vehicle incidents (MVIs) between January 1, 2008 and July 30, 2018. Inclusion
Oregon DOT Slow-Speed Weigh-in-Motion (SWIM) Project: Analysis of Initial Weight Data
 Project: Analysis of Initial Weight Data") Portland State University PDXScholar Center for Urban Studies Publications and Reports Center for Urban Studies 7-1997 Oregon DOT Slow-Speed Weigh-in-Motion (SWIM) Project: Analysis of Initial Weight Data
Portland State University PDXScholar Center for Urban Studies Publications and Reports Center for Urban Studies 7-1997 Oregon DOT Slow-Speed Weigh-in-Motion (SWIM) Project: Analysis of Initial Weight Data
FOR IMMEDIATE RELEASE
 Article No. 5842 Available on www.roymorgan.com Roy Morgan Unemployment Profile Thursday, 2 October 2014 Unemployment climbs to 9.9% in September as full-time work lowest since October 2011; 2.2 million
FLORENCE ELECTRICITY DEPARTMENT. GENERAL POWER RATE--SCHEDULE GSC (October 2015) Availability
 Availability") FLORENCE ELECTRICITY DEPARTMENT GENERAL POWER RATE--SCHEDULE GSC () Availability This rate shall apply to the firm electric power requirements where a customer s currently effective onpeak or offpeak contract
FLORENCE ELECTRICITY DEPARTMENT GENERAL POWER RATE--SCHEDULE GSC () Availability This rate shall apply to the firm electric power requirements where a customer s currently effective onpeak or offpeak contract
Beneficial Use Designations for Stream Reaches: Mississippi River - Grand Rapids Watershed ( )
") Beneficial Use Designations for Stream Reaches: Mississippi River - Grand Rapids Watershed (07010103) Beneficial Use Legend 1A Domestic Consumption (does not require treatment) 1B Domestic Consumption
Beneficial Use Designations for Stream Reaches: Mississippi River - Grand Rapids Watershed (07010103) Beneficial Use Legend 1A Domestic Consumption (does not require treatment) 1B Domestic Consumption
Marine Fuel Prices on the Economics Data Program Website
 Marine Fuel s on the Economics Data Program Website Data Series Economics Data Program Pacific States Marine Fisheries Commission 7600 Sand Point Way NE, Building 4 Seattle, WA 98115 efin@psmfc.org? http://www.psmfc.org/efin