AOP. Final Missouri River Mainstem System Annual Operating Plan
|
|
|
- Imogene Agnes Mason
- 6 years ago
- Views:
Transcription

1 US Army Corps of Engineers Northwestern Division Missouri River Basin Water Management Division Final AOP Missouri River Mainstem System Annual Operating Plan Fort Peck Garrison Oahe Big Bend Ft. Randall Gavins Point Annual Operating Plan Process 57 Years Serving the Missouri River Basin December 2009
2
3
4
5 MISSOURI RIVER MAINSTEM RESERVOIR SYSTEM Annual Operating Plan List of Tables... ii List of Plates... ii List of Abbreviations... iii Definition of Terms... v I. FOREWORD...1 II. PURPOSE AND SCOPE...2 III. MAINSTEM MASTER MANUAL AND ESA CONSULTATIONS...3 IV. FUTURE RUNOFF: AUGUST 2009 DECEMBER V. ANNUAL OPERATING PLAN FOR A. General...6 B AOP Simulations...6 C. Regulation for the Balance of 2009 Nav. Season and Fall of D. Regulation Plan for Winter E. Regulation During the 2010 Navigation Season...13 F. Regulation Activities for T&E Species and Fish Propagation...15 G. Regulation Activities for Historical and Cultural Properties...18 VI. SUMMARY OF RESULTS EXPECTED IN A. Flood Control...21 B. Water Supply and Water Quality Control...22 C. Irrigation...23 D. Navigation...23 E. Power...24 F. Recreation, Fish and Wildlife...24 G. Historic and Cultural Properties...24 H. System Storage...27 I. Summary of Water Use by Functions...27 VII. TENTATIVE PROJECTION OF REGULATION THROUGH FEBRUARY A. Median Runoff...29 B. Lower Quartile Runoff...34 C. Lower Decile Runoff...34 i
6 TABLES I Natural and Net Runoff at Sioux City...5 II Navigation Service Support for the 2010 Season...14 III Summary of Draft AOP Studies...21 IV Peaking Capability and Sales...25 V Energy Generation and Sales...25 VI Anticipated December 31, 2010 System Storage...27 VII Missouri River Mainstem System Water Use for Calendar Years 2008, 2009, and 2010 Above Sioux City, Iowa...28 VIII Navigation Service Support, Spring Pulses, Unbalancing AOP Extension Studies...30 IX Median Extension Studies Criteria Considered in the Modeling Process...31 X Lower Quartile Extension Studies Criteria Considered in the Modeling Process...32 XI Lower Decile Extension Studies Criteria Considered in the Modeling Process...33 PLATES 1 Missouri River Basin Map 2 Summary of Engineering Data 3 Summary of Master Manual Criteria 4 System Storage and Fort Peck Elevations 5 Garrison and Oahe Elevations 6 System Storage 7 Gavins Point Releases 8 Fort Peck Elevations and Releases 9 Garrison Elevations and Releases 10 Oahe Elevations and Releases 11 Fort Randall Elevations and Releases 12 Reservoir Release and Unregulated Flow 13 System Gross Capability and Average Monthly Generation 14 Tentative Five Year Extensions of AOP System Storage, Gavins Point Regulated Flows, and System Peaking Capability 15 Tentative Five Year Extensions of AOP Fort Peck, Garrison, Oahe and Fort Randall 16 American Indian Reservations ii
7 ABBREVIATIONS AOP - annual operating plan ac.ft. - acre-feet ACHP - Advisory Council on Historic Preservation AF - acre-feet B - Billion BiOp - Biological Opinion BOR - Bureau of Reclamation cfs - cubic feet per second COE - Corps of Engineers CY - calendar year (January 1 to December 31) elev - elevation ESA - Endangered Species Act ft - feet FTT - Flow-to-Target FY - fiscal year (October 1 to September 30) GIS - Geographic Information System GWh - gigawatt hour ISP - initial starting point KAF - 1,000 acre-feet Kcfs - 1,000 cubic feet per second kw - kilowatt kwh - kilowatt hour M - million MAF - million acre-feet MRBA - Missouri River Basin Association MRNRC - Missouri River Natural Resources Committee msl - mean sea level MW - megawatt MWh - megawatt hour NEPA - National Environmental Policy Act plover - piping plover pp - powerplant PA - Programmatic Agreement P-S MBP - Pick-Sloan Missouri Basin Program RCC - Reservoir Control Center RM - river mile RPA - Reasonable and Prudent Alternative SHPO - State Historic Preservation Officers SR - Steady Release tern - interior least tern T&E - Threatened and Endangered THPO - Tribal Historic Preservation Officers iii
8 tw - tailwater USFWS - United States Fish and Wildlife Service USGS - United States Geological Survey WY - water year yr - year iv
9 DEFINITION OF TERMS Acre-foot (AF, ac-ft) is the quantity of water required to cover 1 acre to a depth of 1 foot and is equivalent to 43,560 cubic feet or 325,850 gallons. Cubic foot per second (cfs) is the rate of discharge representing a volume of 1 cubic foot passing a given point during 1 second and is equivalent to approximately 7.48 gallons per second or gallons per minute. The volume of water represented by a flow of 1 cubic foot per second for 24 hours is equivalent to 86,400 cubic feet, approximately acre-feet, or 646,272 gallons. Discharge is the volume of water (or more broadly, volume of fluid plus suspended sediment) that passes a given point within a given period of time. Drainage area of a stream at a specific location is that area, measured in a horizontal plane, enclosed by a topographic divide from which direct surface runoff from precipitation normally drains by gravity into the river above the specified point. Figures of drainage area given herein include all closed basins, or noncontributing areas, within the area unless otherwise noted. Drainage basin is a part of the surface of the earth that is occupied by drainage system, which consists of a surface stream or body of impounded surface water together with all tributary surface streams and bodies of impounded water. Gaging station is a particular site on a stream, canal, lake, or reservoir where systematic observations of hydrologic data are obtained. Runoff in inches shows the depth to which the drainage area would be covered if all the runoff for a given time period were uniformly distributed on it. Streamflow is the discharge that occurs in a natural channel. Although the term "discharge" can be applied to the flow of a canal, the word "streamflow" uniquely describes the discharge in a surface stream course. The term "streamflow" is more general than "runoff" as streamflow may be applied to discharge whether or not it is affected by diversion or regulation. v
10 This page is intentionally left blank. vi
11 MISSOURI RIVER MAINSTEM RESERVOIR SYSTEM Annual Operating Plan I. FOREWORD This Annual Operating Plan (AOP) presents pertinent information and plans for regulating the Missouri River Mainstem Reservoir System (System) through December 2010 under widely varying water supply conditions. It provides a framework for the development of detailed monthly, weekly, and daily regulation schedules for the System's six individual dams during the coming year to serve the Congressionally authorized project purposes; to fulfill the Corps responsibilities to Native American Tribes; and to comply with environmental laws, including the Endangered Species Act (ESA). Regulation is directed by the Missouri River Basin Water Management Division, Northwestern Division, U. S. Army Corps of Engineers (Corps) located in Omaha, Nebraska. A map of the Missouri River basin is shown on Plate 1 and the summary of engineering data for the six individual Mainstem projects and System is shown on Plate 2. This plan may require adjustments such as when substantial departures from expected runoff occur; to meet emergencies including short-term intrasystem adjustments to protect human health and safety during periods of extended drought to maintain minimum river or reservoir levels to keep intakes operational, and adjustments in reservoir releases or reservoir levels to prevent loss of historic and cultural properties; or to meet the provisions of applicable laws, including the ESA. These adjustments would be made to the extent possible after evaluating impacts to all System uses, would generally be short term in nature and would continue only until the issue is resolved. This document provides the plan for future regulation of the System. Other documents that may be of interest include the System Description and Regulation report dated November 2007 or the Summary of Actual Calendar Year 2008 Regulation, dated April Both reports are currently available at the Reports and Publications link on our web site at: or you may contact the Missouri River Basin Water Management Division at 1616 Capitol Avenue, Suite 365, Omaha, Nebraska , phone (402) for copies. The Summary of Actual Calendar Year 2009 Regulation will be available at the same site in April of
12 II. PURPOSE AND SCOPE Beginning in 1953, projected System reservoir regulation for the year ahead was developed annually as a basis for advance coordination with the various interested Federal, State, and local agencies and private citizens. Also beginning in 1953, a coordinating committee was organized to make recommendations on each upcoming year's System regulation. The Coordinating Committee on Missouri River Mainstem Reservoir Operations held meetings semiannually until 1981 and provided recommendations to the Corps. In 1982, the Committee was dissolved because it did not conform to the provisions of the Federal Advisory Committee Act. Since 1982, to continue providing a forum for public participation, one or more open public meetings are held semiannually in the spring and fall. The fall public meeting is conducted to take public input on the Draft AOP, which typically is published in mid-september each year. The spring meetings are conducted to update the public on the current hydrologic conditions and projected System regulation for the remainder of the year as it relates to implementing the Final AOP. Under the terms of Stipulation 18 of the March 2004 Programmatic Agreement for the Operation and Management of the Missouri River Main Stem System for Compliance with the National Historic Preservation Act, as amended (PA) the Corps has agreed to consult/meet with the affected Tribes and Tribal Historic Preservation Officers (THPO s), State Historic Preservation Officers (SHPO s), the Advisory Council on Historic Preservation (ACHP) and other parties on the Draft AOP. The purpose of this consultation/meeting is to determine whether operational changes are likely to cause changes to the nature, location or severity of adverse effects to historic properties or to the types of historic properties affected and whether amendments to the Corps Cultural Resources Management Plans and Five-Year Plan are warranted in order to better address such effects to historic properties. During 2006 the Corps worked with the affected Tribes to establish processes for consultation on AOP s under 36 CFR Part 800, the PA, and Executive Order The process consists of a series of informational meetings with the Tribes and/or government-to-government consultation with Tribes, as requested. A letter, dated August 4, 2009, was sent to the Tribes offering consultation on the AOP. Meeting times and locations of the six fall public meetings were also provided. Separate meetings will be scheduled for all Tribes requesting government-to-government consultation. All tribes, whether signatory to the PA or not, may request government-to-government consultation on this and all future AOP s. In addition, the Tribes have reserved water rights to the Missouri River and its major tributaries. In no way does this AOP attempt to define, regulate or quantify water rights or any other rights that the Tribes are entitled to by law/treaty. The 2009 spring public meetings were held at the following locations and dates: April 6 at Fort Peck, Montana; April 7 at Bismarck, North Dakota and Fort Pierre, South Dakota; April 8 at Jefferson City, Missouri and Kansas City, Missouri; April 9 at 2
13 Nebraska City, Nebraska. The attendees were given an update regarding the outlook for 2009 runoff and projected System regulation for the remainder of Six fall public meetings on the Draft AOP were held: October 5 in Nebraska City, Nebraska; October 6 in Kansas City and Jefferson City, Missouri; October 7 in Fort Peck, Montana and Bismarck, North Dakota; and October 8 in Pierre, South Dakota. In the spring of 2010, public meetings will be held to discuss the basin s hydrologic conditions and the effects those conditions are expected to have on the implementation of the Final AOP. III. MAINSTEM MASTER MANUAL AND ESA CONSULTATIONS The Missouri River Mainstem Reservoir System Master Water Control Manual (Master Manual) presents the water control plan and operational objectives for the integrated regulation of the System. First published in 1960 and subsequently revised during the 1970 s, the Master Manual was revised in March 2004 to include more stringent drought conservation measures. The 2003 Amendment to the 2000 Biological Opinion (2003 Amended BiOp) presented the USFWS opinion that the regulation of the System would jeopardize the continued existence of the endangered pallid sturgeon. The USFWS provided a Reasonable and Prudent Alternative (RPA) to avoid jeopardy to the pallid sturgeon that included a provision for the Corps to develop a plan to implement a bimodal spring pulse from Gavins Point Dam. Working with the USFWS, Tribes, states and basin stakeholders, the Corps developed technical criteria for the bimodal spring pulse releases. In March 2006 the Master Manual was revised to include technical criteria for a spring pulse. Current regulation of the System in accordance with the Master Manual to serve authorized project purposes is dependent on successful implementation of the 2003 Amended BiOp. Implementation of the RPA elements is accomplished through the Missouri River Recovery Program (MRRP) which includes the following elements: habitat construction including emergent sandbar habitat and shallow water habitat, flow modifications, propagation/hatchery support, research, monitoring and evaluation, and adaptive management. This AOP identifies flow modifications at Garrison, Fort Randall and Gavins Point for the benefit of the interior least tern and the piping plover, and the Gavins Point spring pulse for the benefit of the endangered pallid sturgeon. In addition, the ongoing construction and rehabilitation of emergent sandbar habitat construction is key to the continued operational flexibility of the System, especially in light of the return to more normal reservoirs levels and releases which has greatly reduced the amount of available emergent sandbar habitat for the terns and plovers. In the fall of 2009 and spring of acres of emergent sandbar habitat will be constructed in the headwaters of the Gavins Point reservoir and in the river reach below the dam. Prior to the 2011 nesting season an additional 3
14 approximately 150 acres of habitat will be made available. This habitat construction in combination with other ongoing efforts to minimize incidental take including but not limited to improving public awareness, better predation control plans, and not meeting flow targets in reaches without commercial navigation is expected to result in a greater likelihood of bird productivity. Additional information on other efforts undertaken through the Missouri River Recovery Program to meet the requirements of the 2003 Amended BiOp can be found in the Annual Report on the Biological Opinion which can be found on the MRRP Documents page of the Recovery Program website at: IV. FUTURE RUNOFF: AUGUST DECEMBER 2010 Runoff into the six System reservoirs is typically low and relatively stable during the August-to-February period. The August 1 calendar year runoff forecast is used as input to the Basic reservoir regulation simulation in the AOP studies for the period August 2009 to February The August 1 runoff forecast for 2009 was 32.7 million acre-feet (MAF). Two other runoff scenarios based on the August 1 runoff forecast were developed for the same period. These are the Upper Basic and Lower basic simulations, which are based on 120 percent and 80 percent of the August 1 runoff forecast, respectively. Simulations for the March 1, 2010 to February 28, 2011 time period use five statistically derived inflow scenarios based on an analysis of historic water supply. The report that presents the details of the calculations used to develop these inflow scenarios was updated in July 2008 to include 9 additional years of inflow data that now extends from 1898 to Using statistically derived inflow scenarios provides a good range of simulation for dry, average, and wet conditions, and eliminates the need to forecast future precipitation, which is very difficult. The five statistically derived inflows are identified as the Upper Decile, Upper Quartile, Median, Lower Quartile and Lower Decile runoff conditions. Upper Decile runoff (34.3 MAF) has a 1 in 10 chance of being exceeded, Upper Quartile (30.3 MAF) has a 1 in 4 chance of being exceeded, and Median (24.4 MAF) has a 1 in 2 chance of being exceeded. Lower Quartile runoff (19.3 MAF) has a 1 in 4 chance of the occurrence of less runoff, and Lower Decile (16.2 MAF) has a 1 in 10 chance of the occurrence of less runoff. There is still a 20 percent chance that a runoff condition may occur that has not been simulated; i.e., a 10 percent chance runoff could be lower than Lower Decile, and a 10 percent chance runoff could be greater than Upper Decile. The Upper Decile and Upper Quartile simulations extend from the end of the Upper Basic simulation through February Likewise, the Median simulation extends from the end of the Basic simulation, and the Lower Quartile and Lower Decile simulations extend from the end of the Lower Basic simulation through February
15 The estimated natural flow at Sioux City, the corresponding post-1949 water use effects, and the net flow available above Sioux City are shown in Table I, where water supply conditions are quantified for the period August 2009 through February The natural water supply for calendar year (CY) 2008 totaled 26.6 MAF. TABLE I NATURAL AND NET RUNOFF AT SIOUX CITY (Volumes in 1,000 Acre-Feet) Natural 1/ Post-1949 Depletions Net 2/ August 2009 through February 2010 (Basic Runoff Scenario) Basic 7, , % Basic 8, ,000 80% Basic 5, ,500 Runoff Year March 2010 through February 2011 (Statistical Analysis of Past Records) Upper Decile 34,300-2,200 32,100 Upper Quartile 30,300-2,200 28,100 Median 24,400-2,500 21,900 Lower Quartile 19,300-2,500 16,800 Lower Decile 16,200-2,500 13,700 1/ The word Natural is used to designate runoff adjusted to the 1949 level of basin development, except that regulation and evaporation effects of the Fort Peck reservoir have also been eliminated during its period of regulation prior to / The word Net represents the total runoff after deduction of the post-1949 irrigation, upstream storage, and other use effects. 5
16 V. ANNUAL OPERATING PLAN FOR A. General. The anticipated regulation described in this AOP is designed to meet the regulation objectives presented in the current Master Manual. While some aspects of System and individual project regulation are clearly defined by technical criteria in the Master Manual, for example navigation service level and season length, others such as minimum releases for irrigation and water supply in the reaches between the reservoirs are based on regulation experience and will be adjusted as needed to respond to changing conditions. Consideration has been given to all of the authorized project purposes, to historic and cultural resources and to the needs of threatened and endangered (T&E) species. The System Description and Regulation report provides a concise summary of the primary aspects of System regulation and should be referred to for further information. For ease of use, a summary of the frequently used technical criteria included in the Master Manual is presented on Plate 3. The plan relies on a wealth of regulation experience. Reservoir regulation experience available for preparation of the AOP includes 13 years of regulation at Fort Peck (1940) by itself, plus 56 years of System experience as Fort Randall (1953), Garrison (1955), Gavins Point (1955), Oahe (1962), and Big Bend (1964) have been brought progressively into System regulation. This regulation experience includes lessons learned during two major droughts of six and eight years ( and ) that have occurred since the System filled in 1967 and the high runoff period from during which five of the seven years experienced runoff greater than Upper Quartile including the record runoff of 49.0 MAF in In addition to the long period of actual System reservoir regulation experience, many background regulation studies for the completed System are available for reference. B AOP Simulations. AOP simulations for the five runoff scenarios are shown in the final section of this AOP as studies 4 through 8. The return of System storage to near normal levels will provide a great opportunity for the System to provide improved service to all authorized purposes. In summary, the studies provide the following: full service flow support during the first part of the navigation season under the Upper Quartile and Upper Decile runoff scenarios, near full service flow support for Median runoff, and intermediate service for Lower Quartile and Lower Decile; full service flow support after the July 1 System storage check for Median runoff and above and intermediate service for Lower Quartile and Lower Decile; a full length navigation season for all runoff scenarios; low winter releases for Lower Quartile and Lower Decile runoff; higher than normal winter releases for Upper Decile and Upper Quartile runoff, and near normal winter releases for Median runoff; March and May spring pulses from Gavins Point dam; a steady release-flow to target regulation during the tern and plover nesting season for Median and below runoff and nearly steady releases for Upper Quartile and Upper Decile runoff though flood water evacuation is required; emphasis on Oahe and Fort Peck for a steady to rising reservoir level during the forage fish 6
17 spawn; and reservoir releases and pool levels sufficient to keep all intakes operational under all runoff scenarios. Water conservation measures will be implemented if runoff conditions indicate that it would be appropriate including cycling releases from Gavins Point during the early part of the nesting season, only supporting flow targets in reaches being used by commercial navigation, reducing flows to minimum levels to support various authorized purposes, and utilization of the Kansas River projects authorized for Missouri River navigation flow support. Additional details about the studies are provided in the following paragraphs. Results of the simulations are shown in Plates 4 and 5 for the System storage and the Fort Peck, Garrison and Oahe pool elevations. Under all runoff scenarios modeled for the AOP, the March 1 and May 1 System storage is above the Gavins Point spring pulse precludes of 40.0 MAF. The peak magnitude of the March pulse is 5,000 cfs over navigation flows. Based on the technical criteria, the peak magnitude of the May pulse would be 20,000 cfs under the Upper Decile and Upper Quartile runoff scenarios, 16,000 for Median runoff, 11,600 cfs for Lower Quartile runoff and 11,500 cfs for Lower Decile runoff. The actual peak magnitude of the May pulse will be determined based on the actual System storage and the May 1 runoff forecast. The Master Manual technical criteria includes safeguards to minimize the risk of flooding associated with the spring pulses. Both spring pulses may be reduced or eliminated due to the downstream flow limits, shown on Plate 3, which are well below the channel capacity of the Missouri River. These flow limits are identical to the most restrictive flood control constraints presented in the previous Master Manual and provide a very similar level of flood protection. An additional safeguard is the incorporation of observed and anticipated precipitation into the daily river forecast to provide greater assurance that flows will remain below the downstream flow limits during the duration of the spring pulses. For simulation purposes, the magnitude of the May pulse for Median and above runoff was limited to 10,000 cfs due to the downstream flow limits. Water for the spring pulses will be withdrawn from one or more of the upper three reservoirs and/or Fort Randall depending on releases required to maintain steady to rising pools during the forage fish spawn and other considerations including impacts to historical and cultural sites and the need to evacuate stored flood waters. Prior to implementing the May pulse, the Corps will coordinate with the affected Tribes and States. The Corps will also work closely with the USFWS to insure the planned implementation of the spring pulses meet the intent of the 2003 Amended BiOp. The reach of the Missouri River downstream of the Platte River experiences a more normalized hydrograph than the reach between Gavins Point and the Platte. As a result, the USFWS has indicated that reducing the spring pulses when possible downstream of the Platte River through reductions in Corps tributary reservoir projects still meets the intent of the 2003 Amended BiOp. If the releases at these downstream Corps tributary reservoirs can be reduced without undue increased risk to other areas, 7
18 it may be possible to reduce the impacts on the lower Missouri River due to the spring pulses. This type of regulation was implemented in conjunction with the March 2008 and May 2009 spring pulses. However, this type of regulation is only feasible when releases are scheduled from certain downstream Corps' tributary reservoirs, most likely due to recently captured runoff. Because of its higher magnitude, it is unlikely that the May pulse can be completely eliminated. The March 15 and July 1 System storage checks were used to determine the level of flow support for navigation and other downstream purposes as well as the navigation season length. Full service navigation flows or more are provided for Upper Quartile and Upper Decile runoff conditions throughout the navigation season. Median runoff starts the season near full service and increases to full service based on the July 1 System storage check. Service levels for Lower Quartile and Lower Decile begin the season at an intermediate service level, and drop slightly based on the July 1 System storage check. Application of the July 1 System storage check (see Plate 3) indicated a full length navigation season would be provided for all five runoff conditions. Upper Quartile and Upper Decile simulations reach the desired 56.8 MAF System storage level on March 1, For modeling purposes in this AOP, the Steady Release Flow to Target (SR-FTT) regulation scenario for Gavins Point dam is shown during the 2010 tern and plover nesting season for Median and lower runoff conditions. For these simulations, the monthly average May release used in the simulations was determined by adding the May spring pulse hydrograph to the long-term average release (see Plate 3) based on the service level, followed by cycling between the May and July table values for the remainder of the month to reflect an every third day peaking cycle from Gavins Point. The June release was modeled as a steady release due to the presence of chicks along the river at that time, and was set equal to long-term average release for July (see Plate 3) based on the service level for the first half of the navigation season. The long-term average releases (see Plate 3) were used for July and August to indicate flowing to target. The Lower Quartile and Lower Decile runoff conditions reflect a decrease in service level after July 1. The Upper Quartile and Upper Decile runoff simulations follow the Master Manual, with much above normal runoff requiring release increases early in the year to evacuate floodwater from the reservoirs. Although these modeled Gavins Point releases represent our best estimate of required releases during 2010, actual releases will be based on hydrologic conditions and the availability of habitat at that time. To the extent reasonably possible, measures to minimize incidental take of the protected species will be utilized. These may include not meeting flow targets in reaches without commercial navigation and utilizing the Kansas River tributary reservoirs for navigation flow support when appropriate. It may also be necessary to cycle releases for flood control regulation during the T&E species nesting season. 8
19 The long-term average Gavins Point releases to meet target flows were used in the AOP studies for navigation support during the spring and fall months with the exception of Upper Quartile and Upper Decile. Under those two runoff scenarios, releases were based on flood water evacuation. Based on the September 1 storage checks, Gavins Point winter modeled releases ranged from 14,000 to 15,000 cfs during the winter season for all runoff scenarios, and from 12,500 cfs to 20,000 cfs during the winter season depending on the runoff scenario. Gavins Point releases will be increased to meet downstream water supply requirements in critical reaches, to the extent reasonably possible, if downstream incremental runoff is low. The Gavins Point releases shown in this and previous AOPs are estimates based on historic averages and experience. Adjustments are made as necessary in real-time based on hydrologic conditions. Intrasystem releases are adjusted to best serve the multiple purposes of the projects with special emphasis placed on regulation for non-listed fisheries starting in early April and for T&E bird species beginning in early May and continuing through August. As part of the overall plan to rotate emphasis among the upper three reservoirs during low runoff years, Fort Peck and Oahe are scheduled to be favored during the 2010 forage fish spawn while also attempting to maintain rising water levels in Garrison. The Median, Upper Quartile, and Upper Decile simulations show that it is possible to provide steady-to-rising pool levels in each of the three large upper reservoirs during the spring forage fish spawn period. Releases in the Lower Quartile and Lower Decile simulations are adjusted to maintain steady-to-rising pool levels at Fort Peck. The Lower Quartile and Lower Decile simulations show the Oahe pool rising during April, but dropping slightly during May and June. Two additional modified reservoir regulation plans, the Fort Peck mini-test and unbalancing the upper three reservoirs, have been shown in previous AOPs, but have not been implemented due to low reservoir levels. The unbalancing of the three reservoirs to benefit reservoir fisheries and the endangered interior least tern and threatened piping plover will be transitioned to in 2010, and then implemented beginning in In 2011, Fort Peck will be high (see Plate 3), Garrison low, and Oahe allowed to float (normal operation) should Median or greater runoff occur. In terms of elevations for Upper Decile and Upper Quartile, Fort Peck would be 4.2 feet high, Garrison would be 3.0 feet low, and Oahe would be balanced on March 1, In terms of elevations for Median, Fort Peck would be 1.0 foot high and Garrison would be 1.0 foot low on March 1, This unbalancing is computed based on the percent of the carryover multiple-use pool. With regard to the Fort Peck mini-test, a priority for pallid sturgeon recovery has been placed on the Lower Yellowstone Project at Intake. The Fort Peck mini-test and full test flows will be deferred until the efficacy of the Lower Yellowstone Project has been assessed. 9
20 Actual System regulation from January 1 through July 31, 2009 and the simulated regulating plans for each project through CY 2010 using the five runoff scenarios described on Page 4 are presented on Plates 6 through 11, inclusive. Big Bend regulation is omitted since storage at that project is relatively constant and average monthly releases are essentially the same as those at Oahe. These plates also show, on a condensed scale, actual regulation since Plate 12 illustrates for Fort Peck, Garrison, Oahe, and Gavins Point the actual releases (Regulated Flow) as well as the Missouri River flows that would have resulted if the reservoirs were not in place (Unregulated Flow) during the period January 2008 through July Plate 13 presents past and simulated gross average monthly power generation and gross peaking capability for the System. C. Regulation Plan for the Balance of the 2009 Navigation Season and Fall of The regulation of the System for the period of August though November 2009 is presented in the following paragraphs. Fort Peck Dam. Releases averaged 6,500 cfs during August and the first half of September. When irrigation ceased in mid-september they were reduced to 4,000 cfs. The releases will be held near that level through December. The Fort Peck pool remained essentially steady through the period and ended November near 2221 ft msl. It will slowly climb through the winter as releases are kept low due to the upper three reservoirs not being in balance. The record low pool elevation of feet msl was set in March The previous record low pool elevation was feet msl set in April Garrison Dam. Releases averaged 16,000 cfs during August. They continued at 16,000 until mid September and were then reduced to 12,500 cfs when irrigation ceased. Releases ranged from 12,500 cfs to 13,000 cfs during October and November as a water conservation measure and were then raised to 15,000 cfs in December. The Garrison pool level slowly fell to 1841 feet msl by the end of November and will continue to slowly decline through the winter as higher releases for hydropower are initiated. The record low pool elevation of feet msl was set in May The previous record low pool elevation was feet msl set in May Oahe Dam. Releases averaged 25,600 cfs in August and 29,500 cfs in September in support of full service navigation. Releases were reduced in October to initiate the fall drawdown of the Fort Randall pool. Lower releases continued in November to complete the annual fall draw of Fort Randall. Releases will be increased in December for winter power production. The Oahe pool ended November at elevation feet msl. The record low Oahe pool elevation of feet msl was set in August The previous record low pool elevation was feet msl set in November
21 Big Bend Dam. Releases will parallel those from Oahe. Big Bend will generally fluctuate between feet msl and feet msl for weekly cycling during high power load periods. Fort Randall Dam. Releases averaged 25,600 cfs in August, 28,700 in September, and 26,000 cfs in October to back up the releases from Gavins Point Dam. The majority of the fall pool draw down of Fort Randall occurred in October and November. Releases were reduced after the navigation season ended in late-november to the level required to back up Gavins Point winter releases. Gavins Point Dam. Releases were scheduled to support downstream full service flows in reaches with scheduled commercial navigation throughout the 2009 navigation season. A full length navigation season was provided in accordance with the technical criteria for the July 1 System storage check presented in the Master Manual. The last day of flow support for the commercial navigation season ranged from November 21 at Sioux City to November 30 at the mouth near St. Louis. Releases were reduced by 3,000 cfs per day in mid-november until they reached 15,000 cfs. The Gavins Point pool level was raised 1.5 feet to elevation feet msl in September. The pool level will remain near that elevation during the fall and winter months. D. Regulation Plan for Winter The September 1 System storage check is used to determine the winter release rate from Gavins Point dam. A winter release of 12,000 cfs is scheduled if System storage is less than 55 MAF on September 1; 17,000 cfs is scheduled when System storage is above 58 MAF; and the release is prorated for System storages between 55 and 58 MAF. Under the basic runoff scenario, Gavins Point releases were shown as 14,500 cfs during the winter of , well above the levels seen in the previous drought years. The actual September 1 storage set winter releases at 15,500 cfs. If mild weather conditions prevail, System releases may be set lower than 15,500 cfs, but only if downstream water supply intakes can remain operable at those levels. The planned winter release rate may be less than is required for downstream water supply intakes without sufficient incremental tributary flows below the System, and therefore, releases may need to be set at levels higher than the winter release rate at times to ensure downstream water supply intakes are operable. However, we believe the minimum winter release of 12,000 cfs presented in the Master Manual represents a reasonable long-term goal for water intake operability and for owners to strive for as they make improvements to their facilities. It may be necessary at times to increase Gavins Point releases to provide adequate downstream flows due to the forecast of excessive river ice formation or if ice jams or blockages form which temporarily restrict flows. Based on past experiences, these events are expected to occur infrequently and be of short duration. Given these infrequent temporary release increases above the winter release rate, the winter System release will likely average around 15,500 cfs. It is anticipated that this year s winter release will be adequate to 11
22 serve all downstream water intakes except for very short periods during significant river ice formation or ice jamming. Fort Peck Dam. Releases are expected to average 4,000 cfs to help balance System storage from December through February. Average winter release rates are about 11,000 cfs. The Basic simulation shows that the Fort Peck pool level will rise slightly to near feet msl during the winter period, ending February about 10.8 feet below the base of the annual flood control storage zone. Carryover multiple purpose storage in the three large upper reservoirs will be out of balance on March 1, 2010 due to minimum release requirements below the dam throughout the year. Fort Peck will end February 2010 about 6.1 feet low, Garrison about 2.0 feet high, and Oahe about 2.0 feet high. The pool level is expected to rise during March to near elevation feet msl. Garrison Dam. Releases will be scheduled at 16,000 cfs in December increasing to 21,000 cfs for January and February to serve winter power loads and to help balance System storage. The December release rate should be sufficient to prevent ice induced flooding at the time of freeze-in, but temporary reductions in the releases may be scheduled to prevent exceedence of a 13-foot stage at the Bismarck gage. Flood stage is 16 feet. Average winter release rates for Garrison are 20,300 cfs in December, 22,800 cfs in January and 24,000 cfs in February. The Garrison pool level is expected to decline about 5.5 feet from near elevation feet msl at the end of November to near elevation feet msl by March 1, 2.0 feet below the base of the annual flood control storage zone. The Median simulation indicates the pool level will rise to elevation feet msl by March 31. Oahe Dam. Releases for the winter season will provide backup for the Fort Randall and Gavins Point releases plus fill the recapture space available in the Fort Randall reservoir consistent with anticipated winter power loads. Monthly average releases may vary substantially with fluctuations in power loads occasioned by weather conditions but, in general, are expected to average about 16,800 cfs. Daily releases will vary widely to best meet power loads. Peak hourly releases, as well as daily energy generation, will be constrained to prevent urban flooding in the Pierre and Fort Pierre areas if severe ice problems develop downstream of Oahe Dam. This potential reduction has been coordinated with the Western Area Power Administration. Under the Median simulation, the Oahe pool level is expected to remain steady at from the end of November through the end of December before starting to rise to elevation feet msl by the beginning of March, 2.1 feet below the base of the annual flood control storage zone. The pool is expected to rise to elevation feet msl by the end of March. Big Bend Dam. The Big Bend pool level will be maintained in the normal to feet msl range during the winter. 12
23 Fort Randall Dam. Under the Median simulation releases averaged about 12,500 cfs during the winter season. Based on the actual September system storage check, releases will average about 13,500 cfs. The Fort Randall pool level is expected to rise from its fall drawdown elevation of feet msl to near elevation feet msl, the seasonal base of flood control, by March 1. However, if the plains snowpack flood potential downstream of Oahe Dam remains quite low, the Fort Randall pool level will be raised to near feet msl by March 1. It is likely that a pool level as high as feet msl could be reached by the end of the winter period on March 31 if runoff conditions permit. The Fort Randall pool level above the White River delta near Chamberlain, South Dakota will likely remain at a higher elevation than the pool level below the delta from early October through December, due to the damming effect of this delta area. Gavins Point Dam. Gavins Point winter releases are discussed in the first paragraph of this section. The Gavins Point pool level will be near elevation feet msl until late February when it will be lowered to elevation feet msl to create additional capacity to store spring runoff. System storage for all runoff conditions will range between 52.0 and 55.0 million acre-feet by March 1, 2010, the beginning of next year s runoff season. System storage at the base of the annual flood control zone is 56.8 million acre-feet. E. Regulation During the 2010 Navigation Season. All five runoff scenarios modeled for this year s AOP follow the technical criteria presented in the current Master Manual for downstream flow support. Beginning in mid-march, Gavins Point releases will be gradually increased to provide navigation flow support at the mouth of the Missouri near St. Louis by April 1, 2010, the normal navigation season opening date. The corresponding dates at upstream locations are Sioux City, March 23; Omaha, March 25; Nebraska City, March 26; and Kansas City, March 28. However, if during the 2010 navigation season there is no commercial navigation scheduled to use the upper reaches of the navigation channel, we will consider eliminating navigation flow support for targets in those reaches to conserve water in the System, provide additional flood control, and/or minimize incidental take of the protected species during the nesting season. Navigation flow support for the 2010 season will be determined by actual System storage on March 15 and July 1. Runoff scenarios modeled indicate full service flow support at the start of the 2010 navigation season for Upper Decile and Upper Quartile runoffs and near full support for Median runoff (200 cfs below full service). Lower Quartile and Lower Decile runoffs would result in reductions below full service of 2,000 cfs and 2,100 cfs, respectively. Following the July 1 System storage check, full service would be provided for the Median runoff scenario and above. Service levels would be further reduced for Lower Quartile and Lower Decile runoffs to 2,600 cfs and 3,600 cfs 13
24 below full service, respectively. If the July 1 System storage check indicates an increase in service level, any increase may be delayed until the end of the nesting season, depending on the potential for incidental take of the protected species. The normal 8- month navigation season is provided for all runoff scenarios as shown in Table II. TABLE II NAVIGATION SERVICE SUPPORT FOR THE 2010 SEASON Runoff System Storage Flow Level Above or Season Scenario March 15 July 1 Below Full Service Shortening (MAF) (MAF) (MAF) (cfs) (Days) Spring Summer/Fall U.D.* U.Q.* Med * L.Q.* ,000-2,600 0 L.D.* ,100-3,600 0 *Includes both March and May Spring Pulses As previously stated, the planned regulation for the 2010 nesting season below Gavins Point dam will be Steady Release Flow to Target (SR-FTT) for median runoff or below. The initial steady release, which is estimated to be 25,000 to 32,000 cfs, will be based on hydrologic conditions and the availability of habitat at that time. Model runs included in this AOP have a Gavins Point release peaking cycle of 2 days down and 1 day up following the May pulse to keep birds from nesting at low elevations. Gavins Point releases will be adjusted to meet downstream targets as tributary flows recede, but ideally the initial steady release will be sufficient to meet downstream targets until the majority of the birds have nested. The purpose of this regulation is to continue to meet the project purposes while minimizing the loss of nesting T&E species and conserving water in the upper three reservoirs. Gavins Point releases for the Upper Quartile and Upper Decile runoff simulations are much above normal to evacuate floodwater from the reservoirs. Releases from Garrison and Fort Randall will follow repetitive daily patterns from early May, at the beginning of the T&E species nesting season, to the end of the nesting in late August. In addition to the intra-day pattern, Fort Randall releases may also be cycled with 2 days of low releases and 1 day of higher releases during the early part of the nesting season to maintain release flexibility in that reach while minimizing the potential for take. As discussed previously, System storage will be above the storage precludes for both spring pulses under all runoff scenarios modeled. 14
25 Gavins Point releases may be quite variable during the 2010 navigation season but are expected to range from 12,000 to 35,000 cfs. Release reductions necessary to minimize downstream flooding are not reflected in the monthly averages shown in the simulations but will be implemented as conditions warrant. Reductions in System releases to integrate the use of downstream Missouri River flow support from the Kansas Reservoir System have not been included since they are based on downstream hydrologic conditions. However, this storage will be utilized to the extent possible as a water conservation measure or to minimize incidental take of protected species during the nesting season if conditions indicate it is prudent to do so. Simulated storages and releases for the System and individual reservoirs within the System are shown on Plates 6 through 11. Ample storage space exists in the System to control flood inflows under all scenarios simulated for this AOP. F. Regulation Activities for T&E Species and Fish Propagation Enhancement. The ability to provide steady to rising pool levels in the upper three reservoirs in low runoff years is very dependent on the volume, timing, and distribution of runoff. The reservoir regulation simulations presented in this AOP for the Upper Decile, Upper Quartile, and Median runoff scenarios show that steady to rising pool levels would occur during the spring fish spawn period for the upper three System reservoirs. As part of the overall plan to rotate emphasis among the upper three reservoirs during low runoff years, Fort Peck and Oahe are scheduled to be favored during the 2010 forage fish spawn if runoff is below median. The studies show that inflows are sufficient to maintain steady to rising pools at Fort Peck from April through June for Lower Quartile and Lower Decile runoff scenarios, however, the Oahe pool level may fall during this period. Oahe will be supported by releases from Garrison during the forage fish spawn if local runoff is not sufficient to keep Oahe rising. These adjustments may be restricted when the terns and plovers begin nesting in May. If the drought re-emerges, emphasis during the fish spawn will be rotated among the upper three reservoirs and may also be adjusted to be opportunistic in regard to runoff potential. The upper three reservoirs will be managed to benefit forage fish to the extent reasonably possible, while continuing to serve the other Congressionally authorized project purposes. As discussed in the previous section, the AOP includes provisions for unbalancing the Fort Peck, Garrison, and Oahe reservoirs for the first time under the revised Master Manual to benefit the endangered species and reservoir fishery. On March 1, 2011 for the Upper Quartile and Upper Decile runoff scenarios the reservoirs will be unbalanced 4.2 feet in favor of Fort Peck and Garrison will be 3 feet lower than balanced. Under Median runoff the reservoirs will be unbalanced 1 foot in favor of Fort Peck and Garrison will be 1 foot lower than balanced. The criteria for unbalancing are based on recommendations provided by the MORAST, MRNRC and the USFWS. System storage will be below the minimum levels under which unbalancing is recommended by either the MRNRC or the USFWS under the lowest two runoff scenarios. 15
26 Fort Peck Dam. The repetitive daily pattern of releases from Fort Peck Dam has not been implemented since the 2004 tern and plover nesting season. This adaptive management decision was made based on data collected during previous nesting seasons. In recent years, birds in this reach have nested on available high habitat, and thus were not expected to be impacted by the potential range of releases from Fort Peck during the summer. Releases during the 2010 nesting season will not be restricted by the repetitive daily pattern unless habitat conditions or nesting patterns warrant a change. Overall habitat should be slightly less than in 2009 as flows during the nesting season will be slightly higher. If flood flows enter the Missouri River below the project during the nesting season, hourly releases will generally be lowered to no less than 3,000 cfs in order to keep traditional riverine fish rearing areas continuously inundated, while helping to lower river stages at downstream nesting sites. In rare instances releases below 3,000 cfs may be scheduled for flood damage reduction. April releases should be adequate for trout spawning below the project. Maintaining a rising Fort Peck pool level will be dependent upon the daily inflow pattern to the reservoir, but appears possible under all the runoff scenarios. The Fort Peck mini-test will not be run pending an evaluation of the results of the Yellowstone River Intake Diversion fish passage structure. Garrison Dam. Daily average releases from Garrison will be much less than full powerplant capacity during the tern and plover nesting season under all runoff scenarios. As in previous years, releases from Garrison will follow a repetitive daily pattern during the T&E nesting season to limit peak stages below the project for nesting birds. Releases during the 2010 nesting season will be higher than was experienced during the drought resulting in less available habitat. The Garrison pool was much higher in the summer of 2009 than in the past several years. Early indications are that the cold-water habitat volume in the reservoir has improved significantly this year. In 2005 plywood was attached to the lower 50 feet of the trash racks on two of the penstocks to allow water to be drawn from a higher, and therefore warmer, region of the reservoir to conserve the volume of cold-water habitat in the reservoir. In 2007 plywood was installed on one additional trash rack. In , releases from Garrison during the summer months were made through the hydropower units with modified intakes, to the extent reasonably possible. In addition, the manner in which the other hydropower units were operated was adjusted to run them at or near full capacity when in use, which also had the effect of drawing water off the upper, warmer, portion of the reservoir. With the higher pool elevation improving cold-water habitat volume this summer, the modified unit operation was discontinued. Additional sampling of data was conducted in September and a comparison of previous 16
27 cold-water habitat was completed. The plywood was removed from the trash racks in October If runoff is not sufficient to keep all the pool levels rising during the fish spawn in 2010, the Corps will, to the extent reasonably possible while serving other Congressionally authorized project purposes, set releases to result in a steady to rising pool at Fort Peck and Oahe from April 20 to May 20. Adjustments to Garrison s releases, however, may be restricted when the terns and plovers begin nesting in May. A rising pool at Garrison during the fish spawn in April and May will be dependent upon the daily inflow pattern to the reservoir but appears possible for Median runoff and above runoff simulations. Oahe Dam. Releases in the spring and summer will back up those from Gavins Point Dam. The pool level should be steady to rising in the spring during the fish spawn under median and above runoff scenarios. Under lower runoff conditions, Garrison s releases will be adjusted to the extent reasonably possible to maintain a steady to rising pool at Oahe, but depending on the timing and distribution of runoff that goal may not be possible under all conditions. Fort Randall Dam. To the extent reasonably possible, Fort Randall will be regulated to provide for a pool elevation near 1355 feet msl during the fish spawn period, provided water can be supplied from other reservoirs for downstream uses. The pool will not be drawn down below elevation feet msl in the fall to ensure adequate supply for water intakes. As a measure to minimize take while maintaining the flexibility to increase releases during the nesting season, hourly releases from Fort Randall during the 2009 nesting season will follow a repetitive daily pattern to limit peak stages below the project for nesting birds. Daily average flows may be increased every third day to preserve the capability of increasing releases later in the summer with little or no incidental take if drier downstream conditions occur. If higher daily releases are required later in the nesting season, the daily peaking pattern may be adjusted, reduced or eliminated resulting in a steady release to avoid increased stages at downstream nesting sites. Fort Randall zero releases will be minimized to the extent reasonably possible during the nesting season given daily average releases, real-time hydrologic conditions, and System generating constraints as defined in coordination with Western Area Power Administration. Gavins Point Dam. March and May spring pulses from Gavins Point Dam for the benefit of the endangered pallid sturgeon will be implemented under all runoff scenarios in The Master Manual technical criteria for the pulses are presented in Plate 3. Details of the spring pulses included in the AOP simulations are provided in Chapter V, Section B, entitled AOP Simulations. Based on 2003 through 2008 nesting season results with the SR-FTT regulation and planned habitat development activities, it is anticipated that sufficient habitat will be 17
28 available above the planned release rates for Median or below runoff to provide for successful nesting. All reasonable measures to minimize the loss of nesting T&E bird species will be used. These measures include, but are not limited to, such things as a relatively high initial steady release during the peak of nest initiation, the use of the Kansas River basin reservoirs, moving nests to higher ground when possible, and monitoring nest fledge dates to determine if delaying an increase a few days might allow threatened chicks to fledge. The location of navigation tows and river conditions at intakes would also be monitored to determine if an increase could be temporarily delayed without impact. Cycling releases every third day may be used to conserve water early in the nesting season if extremely dry conditions develop. In addition, cycling may be used during downstream flood control regulation. It is anticipated that for Upper Decile and Upper Quartile runoff scenarios a SR scenario will be implemented due to the need to evacuate flood water. A SR-FTT release scenario will be implemented for Median and below runoff scenarios. A full description of these two release scenarios can be found in the Missouri River Mainstem Master Water Control Manual. The Gavins Point pool will be regulated near feet msl in the spring and early summer, with minor day-to-day variations due to inflows resulting from rainfall runoff. Several factors can limit the ability to protect nests from inundation in the upper end of the Gavins Point pool. First, because there are greater numbers of T&E bird species nesting below the Gavins Point project, regulation to minimize incidental take usually involves restricting Gavins Point releases, which means that the Gavins Point pool can fluctuate significantly due to increased runoff from rainfall events. Second, rainfall runoff between Fort Randall Dam and Gavins Point Dam can result in relatively rapid pool rises because the Gavins Point project has a smaller storage capacity than the other System reservoirs. And third, the regulation of Gavins Point for downstream flood control may necessitate immediate release reductions to reduce downstream damage. When combined, all these factors make it difficult and sometimes impossible to prevent inundation of nests in the upper end of the Gavins Point reservoir. Planned habitat creation projects in Lewis and Clark Lake will reduce the inundation risk to T&E bird species by providing higher habitat for nesting. The pool will be increased to elevation feet msl when it is determined that there are no terns or plovers nesting along the reservoir. G. Regulation Activities for Historic and Cultural Properties. As acknowledged in the 2004 Programmatic Agreement for the Operation and Management of the Missouri River Main Stem System (PA), wave action and fluctuation in the level of the reservoirs results in erosion along the banks of the reservoirs. The Corps will work with the Tribes utilizing 36 CFR Part 800 and the PA to address the exposure of historic and cultural sites. The objective of a programmatic agreement is to deal with the potential adverse effects of complex projects or multiple undertakings The PA objective was to collaboratively develop a 18
29 preservation program that would avoid, minimize and/or mitigate adverse effects along the System reservoirs. All tribes, whether signatory to the PA or not, may request government-to-government consultation on the regulation of the System and the resulting effect on historic and cultural properties and other resources. Pool levels at the upper three reservoirs improved significantly in 2009 and are currently 11 to 18 feet higher than one year ago, but continuing exposure of cultural sites along the shorelines is still possible. Actions to avoid, minimize or mitigate adverse impacts and expected results of the actions are covered under Chapter VI of this AOP. Plate 14 shows the locations of the Tribal Reservations. Fort Peck Dam. Depending on runoff in the Missouri River basin, System regulation during 2010 could result in a Fort Peck pool elevation variation from a high of 2241 feet msl to a low of 2217 feet msl. This is based on the Upper and Lower Decile runoff scenarios (see Plate 8 and the studies included at the end of this report). Based on a review of existing information, approximately 13 known sites could be affected during this period. Garrison Dam. Based on the Upper and Lower Decile runoff scenarios (see Plate 9 and the studies included at the end of this report), Garrison pool elevations could range between 1847 and 1823 feet msl during Based on a review of existing information, approximately 93 known sites could be affected during this period. Oahe Dam. At the Oahe reservoir, the System regulation under the Upper and Lower Decile runoff scenarios could result in pool elevations between 1615 and 1590 feet msl (see Plate 10 and the studies included at the end of this report). Based on a review of existing information, approximately 203 known sites could be affected during this period. Big Bend Dam. System regulation will be adjusted to maintain the Big Bend pool level in the normal 1420 to 1421 feet msl range during Short-term increases above 1421 due to local rainfall may also occur. Based on a review of existing information, approximately 4 known sites could be affected during this period. Fort Randall Dam. As part of the normal System regulation, the Fort Randall pool elevations will vary between 1350 and 1355 feet msl during the spring and summer of Short-term increases above 1355 feet msl due to local rainfall may occur. The annual fall drawdown of the reservoir to elevation feet msl will begin prior to the close of the navigation season and will be accomplished by early December. The reservoir will then refill during the winter to elevation 1350 feet msl. Based on a review of existing information, approximately 32 known sites could be affected during this period. 19
30 Gavins Point Dam. System regulation will be adjusted to maintain the Gavins Point pool level in the normal 1206 to feet msl range during Short-term increases above feet msl may occur due to local rainfall. Based on a review of existing information, no known sites could be affected during this period. 20
31 VI. SUMMARY OF RESULTS EXPECTED IN 2010 With regulation of the System in accordance with the AOP outlined in the preceding pages, the following results can be expected. Table III summarizes the critical decision points throughout the year for all runoff conditions. Table III Summary of AOP Studies Runoff Condition Decision Points Upper Decile Upper Quartile Median Lower Quartile Lower Decile March 1 System Storage March Spring Pulse? Pulse Magnitude March GP Release 55.0 MAF Yes 5 kcfs 28.9 kcfs 55.0 MAF Yes 5 kcfs 28.9 kcfs 53.4 MAF Yes 5 kcfs 28.7 kcfs 52.0 MAF Yes 5 kcfs 30.0 kcfs 52.0 MAF Yes 5 kcfs 29.9 kcfs March 15 System Storage Spring Service Level May 1 System Storage May Spring Pulse? Pulse Magnitude* May Cycling May GP Release 56.1 MAF full service 58.5 MAF Yes 20.0 (10) kcfs 37.5/37.5 kcfs 37.5 kcfs 56.0 MAF full service 58.0 MAF Yes 20.0 (10) kcfs 28.0/31.0 kcfs 33.0 kcfs 54.3 MAF 0.2 Kcfs blw full service 55.2 MAF Yes 16.0 (10.0) kcfs 27.8/31.4 kcfs 30.5kcfs 52.7 MAF 2.0 Kcfs blw full service 52.7 MAF Yes 11.6 kcfs 29.3/32.3 kcfs 32.0 kcfs 52.6 MAF 2.1 Kcfs blw full service 52.4 MAF Yes 11.6 kcfs 29.2/32.2 kcfs 31.9 kcfs Fish Spawn Rise (Apr-Jun) FTPK Pool Elev Change GARR Pool Elev Change OAHE Pool Elev Change feet +5.8 feet +5.7 feet feet +5.0 feet +6.0 feet +6.5 feet +5.1 feet +2.5 feet +5.7 feet +1.6 feet -0.9 feet +3.0 feet +0.6 feet -1.5 feet July 1 System Storage Sum-Fall Service Level (kcfs) Nav Season Shortening 63.3 MAF Full Service 0 Days 62.6 MAF Full Service 0 Days 58.4 MAF Full Service 0 Days 54.2 MAF 2.6 blw full service 0 Days 53.1 MAF 3.6 blw full Service 0 Days September 1 System Storage Winter GP Release 62.1 MAF 20.0 kcfs 62.2 MAF 20.0 kcfs 56.8 MAF 15.2 kcfs 52.0 MAF 12.5 kcfs 50.3 MAF 12.5 kcfs February 28 System Storage End-Year Pool Balance Percent Pool 56.8 MAF Unbalanced 100% FP+4.2/GA MAF Unbalanced 100% FP+4.2/GA MAF Unbalanced 91% FP+1.0/GA MAF Balanced 76% * Pulse magnitudes are the calculated magnitude per technical criteria and simulated magnitude due to the downstream flow limits MAF Balanced 70% A. Flood Control. All runoff scenarios studied will begin the March 1, 2009 runoff season below the desired 56.8 MAF base of the annual flood control and multiple 21
32 use zone. Therefore, the entire System flood control zone, plus an additional 1.8 to 4.8 MAF of the carryover multiple use zone, will be available to store surplus runoff. The System will be available to significantly reduce peak discharges and store a significant volume of water for all floods that may originate above the System. Remaining storage in the carryover multiple use zone will be adequate to provide support for all of the other multiple purposes of the System, though at reduced service levels after July 1 if lower quartile or lower decile runoff occurs in B. Water Supply and Water Quality Control. Problems at intakes located in the river reaches and Mainstem reservoirs are related primarily to intake elevations or river access rather than inadequate water supply. In emergency situations, short-term adjustments to protect human health and safety would be considered to keep intakes operational. Low reservoir levels during the drought contributed to both intake access and water quality problems for intakes on Garrison and Oahe reservoirs, including several Tribal intakes; however better runoff in 2008 and 2009 has eliminated concern over many of these intakes. Gains in the Oahe pool level required modification of the Standing Rock Sioux Tribe s temporary intake at Fort Yates to protect it from the risng water levels. The Bureau of Reclamation (BOR) installed the temporary intake after the primary intake failed in November 2003 leaving the community without water for several days. If the drought re-emerges, reservoir pool levels and releases may decline renewing the potential for intake access and water quality problems at both river and reservoir intakes. Under the Lower Decile runoff scenario, minimum reservoir levels in 2010 would be approximately 20 feet higher than the record lows set in the current drought. Although not below the critical shut-down elevations for any intake, return to lower levels would require extra monitoring to ensure the continued operation of the intakes. Although below normal Gavins Point releases are being scheduled in the winter of for all runoff scenarios and in the winter of for all but the Upper Decile and Quartile runoff scenarios, all water supply and water quality requirements on the Missouri River both below Gavins Point Dam and between System reservoirs should be met for all flow conditions studied. Lower releases may result in additional water treatment costs such as intake operators experienced during the past eight year drought. It is also possible with the lower releases during winter that river ice formation or ice jams may temporarily reduce river stages to levels below which some intakes can draw water. Therefore, during severe cold spells, experience has shown that for brief periods it may be necessary to increase Gavins Point releases to help alleviate downstream water supply problems. 22
33 During non-navigation periods in the spring and fall from 2004 through 2007, System releases were scheduled as low as 9,000 cfs provided that enough downstream tributary flow existed to allow for continued operation of downstream water intakes. If a non-navigation year would occur in the future, summer releases (May thru August) could average around 18,000 cfs from the System. However, it should be noted that System releases will be set at levels that meet the operational requirements of all water intakes to the extent reasonably possible. Problems have occurred at several downstream intakes in the past, however in all cases the problems have been associated with access to the river or reservoir rather than insufficient water supply. In addition, the low summer release rate would likely result in higher water temperatures in the river, which could impact a power plant s ability to meet their thermal discharge permits. Again, it should be noted that System releases will be set at levels that allow the downstream power plant to meet their thermal discharge permit requirements to the extent reasonably possible. This may mean that actual System releases in the hottest part of the summer period may be set well above the 18,000 cfs level. The Corps continues to encourage intake operators throughout the System and along the lower river reach to make necessary modifications to their intakes to allow efficient operation over the widest possible range of hydrologic conditions. While the current level of System storage should allow adequate access for all intakes for those intake operators whom had issues or difficulty with access during the past drought years, adjustments should continue to be made during this more normal release period to improve access and flexibility when drought returns to the basin. C. Irrigation. Scheduled releases from the System reservoirs will be sufficient to meet the volumes of flow required for irrigation diversions from the Missouri River. Some access problems may be experienced, however, if Lower Quartile or Decile runoff conditions return. Below Fort Peck, localized dredging may once again be required in the vicinity of irrigation intakes in order to maintain access to the water if releases are low next summer as a significant storage imbalance exists that will require releases to be at minimums for irrigation. Tributary irrigation water usage is fully accounted for in the estimates of water supply. D. Navigation. Service to navigation in 2010 will be at or near full service flow support from the beginning of the navigation season through the July 1 storage check for Median and above runoff scenarios. For lower runoff scenarios, navigation flow support will be at intermediate levels of 2,000 cfs below full service for Lower Quartile, and 2,100 cfs below full service for Lower Decile. Full service flow support will continue throughout the entire navigation season for Median and higher runoff. Lower Quartile or Lower Decile runoffs will result in reductions from full service of 2,600 and 3,600 cfs respectively after the July 1 storage check. Although the AOP simulations provide a comparison of typical flow support under varying runoff conditions, the actual rate of flow support for the 2010 navigation season will be based on actual System storage on March 15 and July 1,
34 All runoff simulations show no reduction in the normal 8-month navigation season length during The anticipated service level and season length for all runoff conditions simulated are shown in Table II. E. Power. Tables IV and V give the estimated monthly System load requirements and hydropower supply of the Eastern Division, Pick-Sloan Missouri Basin Program (P- S MBP), from August 2009 through December Estimates of monthly peak demands and energy include customer requirements for firm, short-term firm, summer firm, peaking, and various other types of power sales, System losses, and the effects of diversity. Also included in the estimated requirements are deliveries of power to the Western Division, P-S MBP, to help meet its firm power commitments. Under median runoff, annual generation in CY2010 is estimated to be 9.0 million mwh, 95 percent of normal. F. Recreation, Fish and Wildlife. The regulation of the System will continue to provide recreation and fish and wildlife opportunities in the project areas and along the Missouri River as well as other benefits of a managed system. Improved runoff resulted in higher pool levels and better recreation access at the upper three reservoirs during Recreation access is expected to be at normal levels in 2010 with the exception of Fort Peck which still has two boat ramps that remain inaccessible due to the low reservoir level. If Lower Quartile or Lower Decile runoff were to occur in 2010,, boat ramps that were lowered and low water ramps that were constructed during the two recent drought periods will provide adequate reservoir access. Special regulation adjustments incorporating specific objectives for these purposes will be made to the extent reasonably possible. Overall conditions should be favorable for the many visitors who enjoy the camping, boating, fishing, hunting, swimming, picnicking, and other recreational activities associated with the System reservoirs. The effects of the simulated System regulation during 2010 on fish and wildlife are included in Chapter V, Section F, entitled, Regulation Activities for T&E Species and Fish Propagation Enhancement. G. Historic and Cultural Properties. As mentioned in Chapter V of this AOP, the regulation of the System during 2009 and 2010 will expose cultural sites due to erosion from the normal fluctuation of pool elevations. The Corps will work with the Tribes utilizing 36 CFR Part 800 and the PA to address the exposure of these sites. The objective of a PA is to deal with the potential adverse effects of complex projects or multiple undertakings The PA objective was to collaboratively develop a preservation program that would avoid, minimize and/or mitigate the adverse affects of the System operation. All tribes, whether signatory to the PA or not, may request government-to-government consultation on the regulation of the System and the resulting effect on historic and cultural properties and other resources. 24
35 TABLE IV PEAKING CAPABILITY AND SALES (1,000 kw at plant) Estimated Committed Expected Tota Sales* Expected C of E Capability Expected Bureau Capability* System Capability % Basic 80% 120% Basic 80% 120% Basic 80% Aug Sep Oct Nov Dec Jan Feb U.D. U.Q. Med L.Q. L.D. U.D. U.Q. Med L.Q. L.D. U.D. U.Q. Med L.Q. L.D. Mar Apr May Jun Jul Aug Sep Oct Nov Dec * Estimated sales, including system reserves. Power in addition to hydro production needed for these load requirements will be obtained other power systems by interchange or purchase ** Total output of Canyon Ferry and 1/2 of the output of Yellowtail powerpla TABLE V ENERGY GENERATION AND SALES (Million kwh at plant) Estimated Committed Expected Tota Sales* Expected C of E Generation Expected Bureau Generation * System Generation % Basic 80% 120% Basic 80% 120% Basic 80% Aug Sep Oct Nov Dec Jan Feb U.D. U.Q. Med L.Q. L.D. U.D. U.Q. Med L.Q. L.D. U.D. U.Q. Med L.Q. L.D. Mar Apr May Jun Jul Aug Sep Oct Nov Dec CY TOT * Estimated sales including system reserves and losses. Power in addition to hydro production needed for these load requirements w obtained from other systems by interchange or purchas ** Total output Canyon Ferry and 1/2 output of Yellowtail powerplan 25
36 The planned preservation program for this AOP is outlined by multiple stipulations in the PA. One of the stipulations, or program components, is the Five-Year Plan. This plan outlines how the Corps will accomplish its responsibilities under the PA and the National Historic Preservation Act. The Draft Five Year Plan, dated February 2005 (see is currently being implemented. The plan includes inventory, testing and evaluation, mitigation and other specific activities that will allow the Corps to avoid, minimize and/or mitigate the adverse effects to cultural sites on Corps lands within the System. Many of the actions listed in the plan are within the elevation ranges that will occur with the implementation of the Master Manual criteria in 2009 and Two critical components of the Five-Year plan that are applicable to this AOP are monitoring and mitigation, which will be briefly discussed in the following paragraphs. First, a collaboratively developed plan, entitled Draft Monitoring and Enforcement Plan, dated April 2005 (see is in place. This monitoring plan outlines the sites that require monitoring and specifies a frequency for monitoring. The Corps is strategically monitoring sites, including those sites within the potential operating pool elevations, to document the effects of the implementation of the AOP. Specific sites are identified in the draft Monitoring and Enforcement Plan for the monitoring team, comprised of Corps rangers and tribal monitors, to visit and document impacts. This focused monitoring is resulting in more accurate data on the current impacts to sites along the river plus it is assisting with the identification of sites for mitigation. Training for the monitoring teams was held in June 2006, July 2007, March 2008, April 2008, July 2008, and again in May Second, mitigation or protection of sites that are being adversely impacted continues. During the reporting period for the 2008 Annual Report by the Corps on the implementation of the Programmatic Agreement eight sites were either completed, started, or in the design phase. The annual report is available at In addition the Corps has awarded a contract to develop an erosion model that will compare modeling data against actual erosion data, collected by the monitoring team, to assist in the prioritization of sites for protection. Work on the erosion model is continuing. Results expected from the proposed monitoring and mitigation actions include more accurate horizontal and vertical data on existing cultural sites, detailed impact data, proactive protection and preservation of sites. The effects of the simulated System regulation during on cultural sites are included in the Chapter V, section G., entitled, Regulation Activities for Historic and Cultural Properties. 26
37 H. System Storage. If August 1, 2009 Basic runoff forecast verifies, System storage will decline to 53.1 MAF by the close of CY This would be 19.2 MAF higher than the all-time record low storage of 33.9 MAF set on February 9, 2007 and nearly 9.1 MAF higher than last year s storage of 44.0 MAF. This end-of-year storage is 0.6 MAF more than the 1967 to 2008 average. The record low storage during the drought was 40.8 MAF in January The end-of-year System storages have ranged from a maximum of 60.9 MAF, in 1975, to the 2006 minimum of 34.4 MAF. Forecasted System storage on December 31, 2010 is presented in Table VI for the runoff scenarios simulated. I. Summary of Water Use by Functions. Anticipated water use in CY 2009, under the regulation plan with the Basic forecast of water supply is shown in Table VII. Actual water use data for CY 2008 are included for information and comparison. Under the reservoir regulation simulations in this AOP, estimated water use in CY 2010 also is shown in Table VII. TABLE VI ANTICIPATED DECEMBER 31, 2010 SYSTEM STORAGE Carryover Unfilled Total Water Supply Total Storage Carryover Change Condition (12/31/10) Remaining 1/ Storage 2/ CY 2010 (Volumes in 1,000 Acre-Feet) Upper Decile 56,900 38, ,400 Upper Quartile 57,100 38, ,200 Median 53,400 35,500 3, Lower Quartile 48,000 30,100 8,800-4,100 Lower Decile 45,900 28,000 10,900-6,200 1/ Net usable storage above 17.9 MAF System minimum pool level established for power, recreation, irrigation diversions, and other purposes. 2/ System base of annual flood control zone containing 56.8 MAF. 27
38 TABLE VII MISSOURI RIVER MAINSTEM SYSTEM WATER USE FOR CALENDAR YEARS 2008, 2009, AND 2010 ABOVE SIOUX CITY, IOWA in Million Acre-Feet (MAF) Simulations for CY 2008 CY 2009 Calendar Year 2010 Actual Basic Upper Upper Lower Lower Simulation Decile Quartile Median Quartile Decile Upstream Depletions (1) Irrigation, Tributary Reservoir Evaporation & Other Uses Tributary Reservoir Storage Change Total Upstream Depletions System Reservoir Evaporation (2) Sioux City Flows Navigation Season Unregulated Flood Inflows Between Gavins Point & Sioux City (3) Navigation Service Requirement (4) Supplementary Releases T&E Species (5) Flood Evacuation (6) Non-navigation Season Flows Flood Evacuation Releases (7) System Storage Change Total Project Releases Fort Peck Garrison Oahe Big Bend Fort Randall Gavins Point (1) Tributary uses above the 1949 level of development including agricultural depletions and tributary storage effects. (2) Net evaporation is shown for (3) Incremental inflows to reach which exceed those usable in support of navigation at the target level, even if Gavins Point releases were held to as low as 6,000 cfs. (4) Estimated requirement for downstream water supply and water quality is approximately 6.0 MAF. (5) Increased releases required for endangered species regulation. (6) Includes flood control releases for flood control storage evacuation and releases used to extend the navigation season beyond the normal December 1 closing date at the mouth of the Missouri River. (7) Releases for flood control storage evacuation in excess of a 17,000 cfs Gavins Point release. 28
39 VII. TENTATIVE PROJECTION OF REGULATION THROUGH MARCH 2016 The 5-year extensions to the AOP (March 2011 to March 2016) have been prepared to serve as a guide for the Western Area Power Administration s marketing activities and to provide data to allow basin interests to conduct long-term planning. Three runoff conditions are modeled in the extension studies: Median, Lower Quartile, and Lower Decile. The navigation service level and season length criteria described in Plate 3 were applied to the extensions. The March 15 and July 1 System storage checks shown in Plate 3 were used to determine the flow support for navigation and other downstream uses and the navigation season length. A steady release flow to target (SR-FTT) regulation with cycling in May was modeled during the T&E bird species nesting season. The Gavins Point releases to meet navigation target flows, as shown in Plate 3 and as computed by the March 15 and July 1 System storage checks, were used prior to and following the nesting season. The September 1 System storage check was used to determine the winter System release. Navigation service support and season length, magnitudes of March and May spring pulses, March 1 reservoir unbalancing, end of year System storage, and the winter release rate for the extensions are shown on Table VII. The criteria considered as each year of the extensions was modeled are listed, along with the results, in Tables VIII through X for the Median, Lower Quartile, and Lower Decile extension studies, respectively. A. Median Runoff. Studies 9 through 13 present the results of simulating Median runoff (24.4 MAF) from March 2011 through February The March 1, 2011 System storage would be 53.5 MAF and would drop to 53.0 MAF by March 1, 2016, 3.8 MAF below the desired March 1 storage of 56.8 MAF, the base of the annual flood control and multiple use pool. The navigation service level would range from full service to 400 cfs below service for the study period of 2011 to There would be full navigation seasons for the study period of 2011 through Winter releases would range from 14,800 cfs in the winter of to 14,000 cfs in winter March and May spring pulses would occur each year, with the magnitude of the May pulse ranging from 13,200 cfs in 2011 to 13,400 cfs in The May pulses in the study period of 2011 to 2015 would be limited in order to meet downstream flow limits during the pulse. Fort Peck, Garrison, and Oahe pools are in the range of the elevations described in Plate 3 that permit unbalancing. 29
40 TABLE VIII NAVIGATION SERVICE SUPPORT, SPRING PULSES, UNBALANCING AOP EXTENSION STUDIES MEDIAN Spring Pulse March (kcfs) May (kcfs) 13.2* 13.3* 13.3* 13.4* 13.4* Flow Level Below Full Service Spring (kcfs) Full-0.2 Full-0.3 Full-0.3 Full-0.4 Full-0.4 Summer/Fall (kcfs) Full Full Full Full Full Season Length 8 months 8 months 8 months 8 months 8 months Reservoir Unbalancing (ft) Fort Peck Garrison Oahe Dec 31 Storage (MAF) Winter Release (kcfs) Special Information LOWER QUARTILE Spring Pulse March (kcfs) May (kcfs) Flow Level Below Full Service Spring (kcfs) Full-6.0 Full-6.0 Full -6.0 Full -6.0 Full -6.0 Summer/Fall (kcfs) Full -5.7 Full -6.0 Full -6.0 Full -6.0 Full -4.4 Season Length 8 mnths-5 days 8 mnths-13 days 8 mnths-13days 8 mnths-8 days 8 mnths Reservoir Unbalancing (ft) Fort Peck Garrison Oahe Dec 31 Storage (MAF) Winter Release (kcfs) LOWER DECILE Spring Pulse March (kcfs) May (kcfs) Flow Level Below Full Service Spring (kcfs) Full-6.0 Full -6.0 Full -6.0 Full -6.0 Full -6.0 Summer/Fall (kcfs) Full -6.0 Full -6.0 Full -6.0 Full -6.0 Full -6.0 Season Length 8 mnths-25 days 8 mnths-30 days 8 mnths-30 days 8 mnths-31 days 8 mnths-37 days Reservoir Unbalancing (ft) Fort Peck Garrison Oahe Dec 31 Storage (MAF) Winter Release (kcfs) *Limited by Downstream Flood-Control Limits 30
41 Table IX Median Extension Studies - Criteria Considered in the Modeling Process Study Number Units Criteria March 1 Storage MAF March Spring Pulse? N/A Yes Yes Yes Yes Yes March 15 Storage MAF 31/49/ Service Level N/A or kcfs No Sea/Min/Full Thresholds Full -0.2 Full -0.3 Full -0.3 Full -0.4 Full rd Period March GP Q kcfs April Gavins Point Q kcfs May 1 Storage MAF May Spring Pulse? N/A Yes Yes Yes Yes Yes - Pulse Magnitude kcfs Gavins Point Cycling Qs kcfs 27.8/ / / / / May Gavins Point Q kcfs June Gavins Point Q kcfs July 1 Storage MAF 50.5/ Service Level N/A Min/Full Thresholds Full Full Full Full Full - July Gavins Point Q kcfs Aug Gavins Point Q kcfs Sept Gavins Point Q kcfs July 1 Storage MAF 36.5/41&46.8/ Season Length Shortening days 61/31&31/0 Thresholds Oct Gavins Point Q kcfs Nov Gavins Point Q kcfs September 1 Storage MAF 55/ Winter Gavins Point Q kcfs 12/17 Thresholds End-of-Year Reservoir Storage MAF Percent Full N/A 91% 91% 91% 91% 90% Balance/Unbalance N/A Bal <2227/1827/1600 ft msl +3.0 G -3.0 O -4.2 P +3.0 O +4.2 P -3.0 G +3.0 G -3.0 O -4.2 P +3.0 O Peck Rise 3/31-5/31 N/A Yes Yes Yes Yes Yes Garr Rise 3/31-5/31 N/A Yes Yes Yes Yes Yes Oahe Rise 3/31-5/31 N/A Yes Yes Yes Yes Yes Favored Reservoir - Fish Spawn N/A GA FP/OA GA FP/OA GA 31
42 Table X Lower Quartile Extension Studies - Criteria Considered in the Modeling Process Study Number Units Criteria March 1 Storage MAF March Spring Pulse? N/A Yes Yes Yes Yes Yes March 15 Storage MAF 31/49/ Service Level N/A or kcfs No Sea/Min/Full Thresholds Min Service Min Service Min Service Min Service Min Service - 3rd Period March GP Q kcfs April Gavins Point Q kcfs May 1 Storage MAF May Spring Pulse? N/A Yes Yes Yes Yes Yes - Pulse Magnitude kcfs Gavins Point Cycling Qs kcfs 25.3/ / / / / May Gavins Point Q kcfs June Gavins Point Q kcfs July 1 Storage MAF 50.5/ Service Level N/A Min/Full Thresholds Full Min Service Min Service Min Service Full July Gavins Point Q kcfs Aug Gavins Point Q kcfs Sept Gavins Point Q kcfs July 1 Storage MAF 36.5/41&46.8/ Season Length Shortening days 61/31&31/0 Thresholds Oct Gavins Point Q kcfs Nov Gavins Point Q kcfs September 1 Storage MAF 55/ Winter Gavins Point Q kcfs 12/17 Thresholds End-of-Year Reservoir Storage MAF Percent Full N/A 71% 70% 70% 73% 77% Balance/Unbalance N/A Bal <2227/1827/1600 ft msl Balance Balance Balance Balance Balance Peck Rise 3/31-5/31 N/A No Yes Yes Yes Yes Garr Rise 3/31-5/31 N/A Yes Yes Yes Yes Yes Oahe Rise 3/31-5/31 N/A No Yes Yes Yes Yes Favored Reservoir - Fish Spawn N/A GA FP/OA GA FP/OA GA 32
43 Table XI Lower Decile Extension Studies - Criteria Considered in the Modeling Process Study Number Units Criteria March 1 Storage MAF March Spring Pulse? N/A Yes Yes No No No March 15 Storage MAF 31/49/ Service Level N/A or kcfs No Sea/Min/Full Thresholds Min Service Min Service Min Service Min Service Min Service - 3rd Period March GP Q kcfs April Gavins Point Q kcfs May 1 Storage MAF May Spring Pulse? N/A Yes Yes Yes No No - Pulse Magnitude kcfs Gavins Point Cycling Qs kcfs 25.3/ / / / / May Gavins Point Q kcfs June Gavins Point Q kcfs July 1 Storage MAF 50.5/ Service Level N/A Min/Full Thresholds Min Service Min Service Min Service Min Service Min Service - July Gavins Point Q kcfs Aug Gavins Point Q kcfs Sept Gavins Point Q kcfs July 1 Storage MAF 36.5/41&46.8/ Season Length Shortening days 61/31&31/0 Thresholds Oct Gavins Point Q kcfs Nov Gavins Point Q kcfs September 1 Storage MAF 55/ Winter Gavins Point Q kcfs 12/17 Thresholds End-of-Year Reservoir Storage MAF Percent Full N/A 60% 52% 48% 46% 45% Balance/Unbalance N/A Bal <2227/1827/1600 ft msl Balance Balance Balance Balance Balance Peck Rise 3/31-5/31 N/A Yes Yes No Yes No Garr Rise 3/31-5/31 N/A Yes No Yes No Yes Oahe Rise 3/31-5/31 N/A No Yes Yes Yes No Favored Reservoir - Fish Spawn N/A GA FP/OA GA FP/OA GA 33
44 B. Lower Quartile Runoff. Studies 14 through 18 show the results of Lower Quartile runoff extensions. System storage on March 1, 2011 is 48.0 MAF and rises to 48.3 MAF by March 1, 2016, with navigation service levels remaining at minimum service during the simulation period. The navigation season is shortened 5 days in 2011, 13 days in 2012 and days in 2014, and no shortening in A 12,500-cfs average winter release is shown for the entire study period. Spring pulses would occur every March and May from 2011 through Since the upper three reservoirs do not refill enough to meet the unbalancing criteria in Plate 3 under Lower Quartile runoff, the carryover multiple use storage is balanced each March 1. C. Lower Decile Runoff. Studies 19 through 23 show the results of Lower Decile runoff extensions. System storage is 45.6 MAF on March 1, 2011 and gradually decreasing to 36.2 MAF on March 1, All extension years have minimum navigation service levels throughout the season. The navigation season is shortened 25 days in 2011, 30 days in 2012 and 2013, 31 days in 2014, and 37 days in There are March spring pulses in 2011 and 2012, May spring pulses in 2011, 2012, and 2013, and no intrasystem unbalancing for the entire study period due to low System storage. Plate 14 presents System storage, Gavins Point releases, and System peaking capability for Median, Lower Quartile, and Lower Decile runoff for the period 2011 through February Peak power, or peaking capability, is the amount of power available when all powerplants are operating at maximum. Plate 15 presents reservoir pool elevations for Fort Peck, Garrison, Oahe, and Fort Randall for Median, Lower Quartile, and Lower Decile runoff for the period 2011 through February
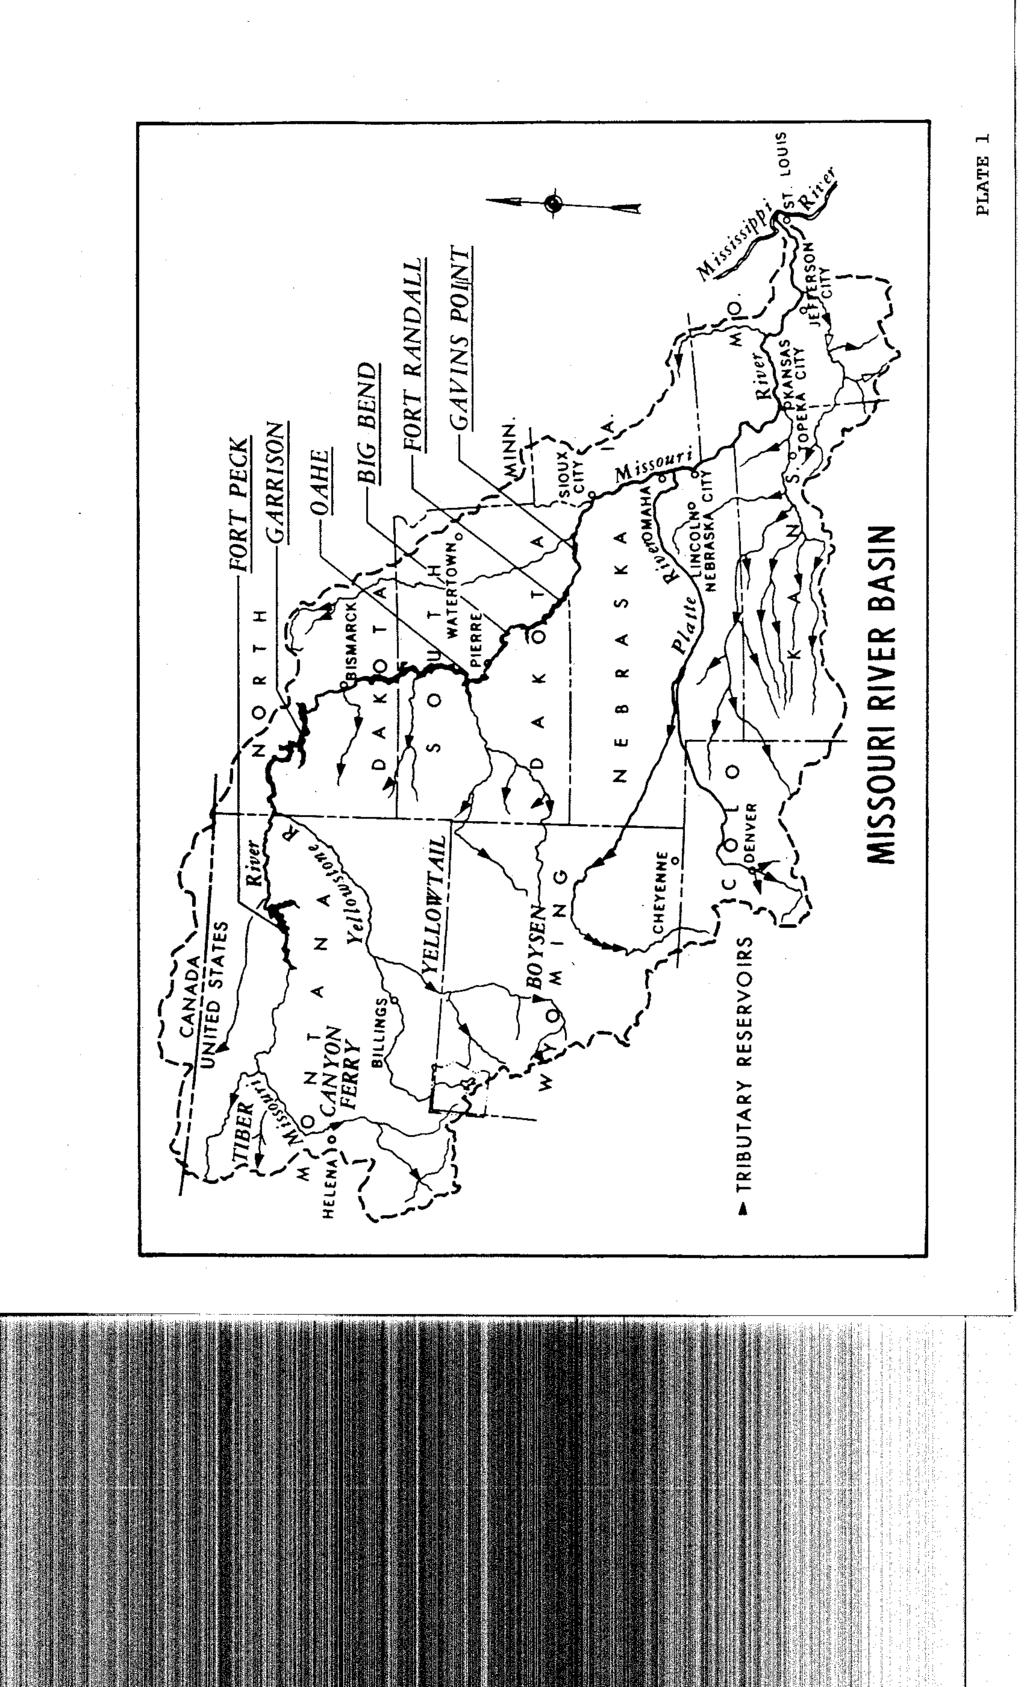
45
Missouri River Mainstem System Annual Operating Plan. Garrison. Oahe
 Missouri River Basin Water Management Division Final AOP 2012-2013 Missouri River Mainstem System 2012-2013 Annual Operating Plan Fort Peck Garrison Oahe Big Bend Fort Randall Gavins Point Annual Operating
Missouri River Mainstem Reservoir System Hydrologic Statistics on Inflows Technical Report
 Missouri River Mainstem Reservoir System Hydrologic Statistics on Inflows Technical Report Fort Peck Garrison Oahe Big Bend Fort Randall Gavins Point Missouri River Basin Water Management Division Omaha,
Missouri River Mainstem Reservoirs Runoff Volumes for Annual Operating Plan Studies RCC Technical Report Jy-08
 Missouri River Region Since 1953 US Army Corps of Engineers Reservoir Control Center Missouri River Region Northwestern Division Reservoir Control Center July 2008 Missouri River Basin Fort Peck Montana
Missouri River Incremental Flows Below Gavins Point Technical Report
 Missouri River Incremental Flows Below Gavins Point Technical Report Fort Peck Garrison Oahe Big Bend Fort Randall Gavins Point Missouri River Basin Water Management Division Omaha, Nebraska July 214 Missouri
LAKE CHELAN ANNUAL FLOW AND WATER TEMPERATURE REPORT Final
 LAKE CHELAN ANNUAL FLOW AND WATER TEMPERATURE REPORT 2013 LICENSE ARTICLES 405 & 408 Final LAKE CHELAN HYDROELECTRIC PROJECT FERC Project No. 637 April 30, 2014 Public Utility District No. 1 of Chelan
Appendix E Water Supply Modeling
 Supply Modeling Modesto Irrigation District Treatment Plant Expansion Project Modeling I. Introduction The Modesto Irrigation District (MID) is situated adjacent to and north of the Tuolumne River. Over
ALBENI FALLS DAM AND LAKE PEND OREILLE
 ALBENI FALLS DAM AND LAKE PEND OREILLE Fall Public Meeting 237 237 237 217 217 217 200 200 200 0 0 0 163 163 163 131 132 122 Aug. 7, 2017 255 255 255 239 65 53 80 119 27 252 174.59 83 36 118 110 135 120
REASONABLE FURTHER PROGRESS REPORT FOR THE MONO BASIN PM-10 STATE IMPLEMENTATION PLAN
 REASONABLE FURTHER PROGRESS REPORT FOR THE MONO BASIN PM-10 STATE IMPLEMENTATION PLAN September 2001 This document provides a progress report on air quality trends in the Mono Basin federal PM-10 1 nonattainment
BEFORE THE CANTERBURY REGIONAL COUNCIL. Act 1991 AND. of Plan Change 3 to the Waitaki Catchment Water Allocation Regional Plan
 BEFORE THE CANTERBURY REGIONAL COUNCIL IN THE MATTER of the Resource Management Act 1991 AND IN THE MATTER of Change 3 to the Waitaki Catchment Water Allocation Regional STATEMENT OF EVIDENCE OF DAVID
Flows Atlas. Compilation of instream flow & estuary inflow statistics for the Sabine and Neches River Basins and Sabine Lake
 Compilation of instream flow & estuary inflow statistics for the Sabine and Neches River Basins and Sabine Lake April 2010 FLOWS ATLAS Compilation of instream flow & estuary inflow statistics for the Sabine
SNOHOMISH COUNTY PUBLIC UTILITY DISTRICT NO.1. Your Northwest renewables utility
 SNOHOMISH COUNTY PUBLIC UTILITY DISTRICT NO.1 Your Northwest renewables utility May 17, 2013 VIA ELECTRONIC FILING Kimberly D. Bose, Secretary Federal Energy Regulatory Commission (FERC) 888 First Street
P. SUMMARY: The Southeastern Power Administration (SEPA) establishes Rate Schedules JW-
 establishes Rate Schedules JW-") This document is scheduled to be published in the Federal Register on 08/29/2016 and available online at http://federalregister.gov/a/2016-20620, and on FDsys.gov 6450-01-P DEPARTMENT OF ENERGY Southeastern
This document is scheduled to be published in the Federal Register on 08/29/2016 and available online at http://federalregister.gov/a/2016-20620, and on FDsys.gov 6450-01-P DEPARTMENT OF ENERGY Southeastern
Exhibit 1. Background. Authorizing Legislation
 Background Authorizing Legislation The Boulder Canyon Project Act (43 U.S.C. 617, et seq.), enacted by the U.S. Congress in 1928 (The 1928 Act), authorized the Secretary of the Interior to spend up to
A significant milestone..
 Cape Hatteras Access Preservation Alliance Post Office Box 1355 Buxton, North Carolina 27920 March 14, 2017 A significant milestone.. On January 20, 2017 the National Park Service (NPS) implemented a new
Action Requested From AMWG
 Action Requested From AMWG NONE, These Two Presentations Are For Information Transfer Only The information is derived from a multi-year synthesis research effort related to existing data on flow, sediment-transport
All Annual Operating Plan Recipients
 To: All Annual Operating Plan Recipients From: Lower Colorado Region Boulder Canyon Operations Office River Operations Group Daniel Bunk P.O. Box 647 Boulder City, NV 896-47 Phone: 72-293-83 The operation
Memorandum October 5, 2017
 614 Magnolia Avenue Ocean Springs, Mississippi 39564 228.818.9626 Memorandum October 5, 2017 To: Gary Miller, U.S. Environmental Protection Agency From: David Keith, John Laplante, Matt Henderson, and
STRUCTURE 5A PURPOSE
 STRUCTURE 5A This structure is a six unit pumping plant located on the south side of U.S. Highway 441 and Canal 51 (West Palm Beach Canal) between the canal and the borrow canals of Levees 7 and 40 about
Merger of the generator interconnection processes of Valley Electric and the ISO;
 California Independent System Operator Corporation Memorandum To: ISO Board of Governors From: Karen Edson Vice President, Policy & Client Services Date: August 18, 2011 Re: Decision on Valley Electric
Projected 2011 Missouri River Flood Elevations
 Projected 2011 Missouri River Flood Elevations Kansas City District, US Army Corps of Engineers The following table presents two water surface profiles based on the likely range of flows that are expected
April 10, Dear Customer:
 Dear Customer: April 10, Attached is the monthly water supply outlook and projected operations for Yellowtail Dam and Powerplant. If you have any questions or concerns, please feel free to call me at 406-247-7334
City of Palo Alto (ID # 6416) City Council Staff Report
 City Council Staff Report") City of Palo Alto (ID # 6416) City Council Staff Report Report Type: Informational Report Meeting Date: 1/25/2016 Summary Title: Update on Second Transmission Line Title: Update on Progress Towards Building
City of Palo Alto (ID # 6416) City Council Staff Report Report Type: Informational Report Meeting Date: 1/25/2016 Summary Title: Update on Second Transmission Line Title: Update on Progress Towards Building
ELECTRICAL GENERATING STEAM BOILERS, REPLACEMENT UNITS AND NEW UNITS (Adopted 1/18/94; Rev. Adopted & Effective 12/12/95)
") RULE 69. ELECTRICAL GENERATING STEAM BOILERS, REPLACEMENT UNITS AND NEW UNITS (Adopted 1/18/94; Rev. Adopted & Effective 12/12/95) (a) APPLICABILITY (1) Except as provided in Section (b) or otherwise specified
RULE 69. ELECTRICAL GENERATING STEAM BOILERS, REPLACEMENT UNITS AND NEW UNITS (Adopted 1/18/94; Rev. Adopted & Effective 12/12/95) (a) APPLICABILITY (1) Except as provided in Section (b) or otherwise specified
A Guide to the medium General Service. BC Hydro Last Updated: February 24, 2012
 A Guide to the medium General Service Conservation Rate BC Hydro Last Updated: February 24, 2012 Executive summary The way Medium General Service (MGS) accounts pay for electricity is changing. MGS is
Evaluating Stakeholder Engagement
 Evaluating Stakeholder Engagement Peace River October 17, 2014 Stakeholder Engagement: The Panel recognizes that although significant stakeholder engagement initiatives have occurred, these efforts were
Revising the Historic Monthly Mean Niagara River Flow at Buffalo to Reflect Better Estimates of Maid-of-the-Mist Pool Outflows
 Revising the Historic Monthly Mean Niagara River Flow at Buffalo to Reflect Better Estimates of Maid-of-the-Mist Pool Outflows 1961-2007 Background The Niagara River flow at Buffalo is currently computed
RECOMMENDATION: It is recommended that the City Council, following a public hearing, adopt the attached resolution which:
 DATE: July 16,2007 TO: FROM: SUBJECT: CITY COUNCIL CITY MANAGER CONSIDERATION OF ADOPTION OF NEW FEDERAL STANDARDS RELATING TO ELECTRIC UTILITIES UNDER THE PUBLIC UTILITIES REGULATORY POLICIES ACT AND
Henry M. Jackson Hydroelectric Project (FERC No. 2157)
") Henry M. Jackson Hydroelectric Project (FERC No. 2157) License Article 401: Water Quality Monitoring Plan 2013 Annual Report Everett, WA Final This document has been prepared for the District. It has been
Henry M. Jackson Hydroelectric Project (FERC No. 2157) License Article 401: Water Quality Monitoring Plan 2013 Annual Report Everett, WA Final This document has been prepared for the District. It has been
Lake Mead Intake No. 3
 Lake Mead Intake No. 3 1 Lake Mead Intake No. 3 Total Project Scope INTAKE STRUCTURE PUMPING STATION ACCESS SHAFTS WATER TREATMENT FACILITY CONNECTOR TUNNEL INTAKE 1 INTAKE 2 C-2 Lake Mead Intake No. 3
Caution and Disclaimer The contents of these materials are for information purposes and are provided as is without representation or warranty of any
 Draft Version 1 Caution and Disclaimer The contents of these materials are for information purposes and are provided as is without representation or warranty of any kind, including without limitation,
Office of Transportation Bureau of Traffic Management Downtown Parking Meter District Rate Report
 Office of Transportation Bureau of Traffic Management 1997 Downtown Parking Meter District Rate Report Introduction The City operates approximately 5,600 parking meters in the core area of downtown. 1
February 10, The Honorable Kimberly D. Bose Secretary Federal Energy Regulatory Commission 888 First Street, NE Washington, DC 20426
 California Independent System Operator Corporation February 10, 2016 The Honorable Kimberly D. Bose Secretary Federal Energy Regulatory Commission 888 First Street, NE Washington, DC 20426 Re: California
Cost Reflective Tariffs
 Cost Reflective Tariffs for Large Government,Commercial and Industrial Customers Customer Guide Introduction On September 2016, the Council of Ministers had approved the introduction Cost of Reflective
Decision on Merced Irrigation District Transition Agreement
 California Independent System Operator Corporation Memorandum To: ISO Board of Governors From: Karen Edson, Vice President Policy & Client Services Date: March 13, 2013 Re: Decision on Merced Irrigation
Fueling Savings: Higher Fuel Economy Standards Result In Big Savings for Consumers
 Fueling Savings: Higher Fuel Economy Standards Result In Big Savings for Consumers Prepared for Consumers Union September 7, 2016 AUTHORS Tyler Comings Avi Allison Frank Ackerman, PhD 485 Massachusetts
LONG RANGE PERFORMANCE REPORT. Study Objectives: 1. To determine annually an index of statewide turkey populations and production success in Georgia.
 State: Georgia Grant Number: 08-953 Study Number: 6 LONG RANGE PERFORMANCE REPORT Grant Title: State Funded Wildlife Survey Period Covered: July 1, 2010 - June 30, 2011 Study Title: Wild Turkey Production
*iiiii. May 31, 2017 VIA ELECTRONIC FILING
 *iiiii. PUBLIC UTILITY DISTRICT NO. I of CHELAN COUNTY P.O. Box 1231, Wenatchee, WA 98807-1231 327 N. Wenatchee Ave., Wenatchee, WA 98801 (509) 663-8121 Toll free 1-888-663-8121 www.chelanpud.org May 31,
Sales of Fossil Fuels Produced from Federal and Indian Lands, FY 2003 through FY 2013
 Sales of Fossil Fuels Produced from Federal and Indian Lands, FY 2003 through FY 2013 June 2014 Independent Statistics & Analysis www.eia.gov U.S. Department of Energy Washington, DC 20585 This report
Internal Audit Report. Fuel Consumption Oversight and Coordination TxDOT Internal Audit Division
 Internal Audit Report Fuel Consumption Oversight and Coordination TxDOT Internal Audit Division Objective To determine if a process exists to ensure retail fuel consumption is appropriately managed and
Appendix E Hydrology, Erosion and Sediment Transport Studies
 Appendix E Hydrology, Erosion and Sediment Transport Studies Hatch 2012/10 Appendix E1 EA Hydrology Memorandum February 2011 (Hatch. 2011a) Hatch 2012/10 Project Memo February 23, 2011 TO: Larry King FROM:
DISCUSSION DOCUMENT. New standards for off-road small spark-ignition engines under consideration
 DISCUSSION DOCUMENT New standards for off-road small spark-ignition engines under consideration Background The Off-Road Small Spark-Ignition Engine Emission Regulations (hereinafter referred to as the
Ambient PM 10 Monitoring Sechelt, B.C Update
 Ministry of Environment LOWER MAINLAND REGION Ambient PM 10 Monitoring Sechelt, B.C. 2004-2005 Update E N V I R O N M E N T A L Q U A L I T Y Library and Archives Canada Cataloguing in Publication Data
ENERGY STRATEGY FOR YUKON. Independent Power Production Policy
 ENERGY STRATEGY FOR YUKON Independent Power Production Policy May 20, 2014 Page 2 of 11 BACKGROUND The Government of Yukon released the Energy Strategy for Yukon in January 2009. The strategy sets out
Consolidated Edison Company of New York, Inc.
 PSC NO: 11 Electricity Leaf: 1 Initial Superseding Economic Development Delivery Service No. 2 Consolidated Edison Company of New York, Inc. Schedule For Economic Development Delivery Service Subsequent
August 15, Please contact the undersigned directly with any questions or concerns regarding the foregoing.
 California Independent System Operator Corporation The Honorable Kimberly D. Bose Secretary Federal Energy Regulatory Commission 888 First Street, NE Washington, DC 20426 August 15, 2017 Re: California
2018 Load & Capacity Data Report
 Caution and Disclaimer The contents of these materials are for information purposes and are provided as is without representation or warranty of any kind, including without limitation, accuracy, completeness
BEFORE THE FLORIDA PUBLIC SERVICE COMMISSION. The following Commissioners participated in the disposition of this matter:
 BEFORE THE FLORIDA PUBLIC SERVICE COMMISSION In re: Fuel and purchased power cost recovery clause with generating performance incentive factor. ORDER NO. PSC-17-0219-PCO-EI ISSUED: June 13, 2017 The following
Draft Agenda. Item Subject Responsible Time. 4. GAS INFORMATION SERVICES PROJECT IMO 10 min. 5. OPTIONS FOR GAS BULLETIN BOARD SYSTEM IMO 15 min
 Gas Advisory Board Draft Agenda Meeting No. 1 Location: Parmelia Hilton, Swan B Room 14 Mill Street, Perth WA 6000 Date: 20 December 2011 Time: 11:15am 12:15pm Item Subject Responsible Time 1. WELCOME
NORTHEAST NEBRASKA PUBLIC POWER DISTRICT RATE SCHEDULE LP-2 Large Power Service. Effective: For bills rendered on and after February 1, 2019.
 NORTHEAST NEBRASKA PUBLIC POWER DISTRICT RATE SCHEDULE LP-2 Large Power Service Effective: For bills rendered on and after February 1, 2019. SEDC:60/7/8/9 SECTION 1. AVAILABILITY AND APPLICABILITY 1.1
WIRES University Overview of ISO/RTOs. Mike Ross Senior Vice President Government Affairs and Public Relations Southwest Power Pool
 WIRES University Overview of ISO/RTOs Mike Ross Senior Vice President Government Affairs and Public Relations Southwest Power Pool 1 OUR MISSION Helping our members work together to keep the lights on
Downtown Lee s Summit Parking Study
 Downtown Lee s Summit Parking Study As part of the Downtown Lee s Summit Master Plan, a downtown parking and traffic study was completed by TranSystems Corporation in November 2003. The parking analysis
NORTHEAST NEBRASKA PUBLIC POWER DISTRICT RATE SCHEDULE LP-2 Large Power Service. Effective: For bills rendered on and after January 1, 2014.
 NORTHEAST NEBRASKA PUBLIC POWER DISTRICT RATE SCHEDULE LP-2 Large Power Service Effective: For bills rendered on and after January 1, 2014. SECTION 1. AVAILABILITY AND APPLICABILITY 1.1 This Rate Schedule
Civil Works Construction Cost Index System (CWCCIS)
") EM 1110-2-1304 31 March 2017 Amendment #1 Tables Revised as of 30 September 2017 Civil Works Construction Cost Index System (CWCCIS) EM 1110-2-1304 31 Mar 17 This Page Intentionally Left Blank DEPARTMENT
EM 1110-2-1304 31 March 2017 Amendment #1 Tables Revised as of 30 September 2017 Civil Works Construction Cost Index System (CWCCIS) EM 1110-2-1304 31 Mar 17 This Page Intentionally Left Blank DEPARTMENT
TORONTO TRANSIT COMMISSION REPORT NO.
 Form Revised: February 2005 TORONTO TRANSIT COMMISSION REPORT NO. MEETING DATE: September 27, 2012 SUBJECT: NOTICE OF AWARD PROCUREMENT AUTHORIZATION - ARTICULATED BUSES INFORMATION ITEM RECOMMENDATION
Unitil Energy Demand Response Demonstration Project Proposal October 12, 2016
 Unitil Energy Demand Response Demonstration Project Proposal October 12, 2016 Fitchburg Gas and Electric Light Company d/b/a Unitil ( Unitil or the Company ) indicated in the 2016-2018 Energy Efficiency
GC108: EU Code: Emergency & Restoration: Black start testing requirement
 Stage 01: Modification Proposal Grid Code GC108: EU Code: Emergency & Restoration: Black start testing requirement Purpose of Modification: This modification seeks to align the GB Grid Code with the European
Taxis and Accessible Services Division Medallion Reform Background May 1, 2018
 Introduction: Taxis and Accessible Services Division Medallion Reform Background May 1, 2018 SFMTA s Taxis and Accessible Services Division is responsible for the regulation of the private businesses that
Rate Schedules. Effective 1/1/2019
 Rate Schedules 2019 Effective 1/1/2019 SUMMARY OF RATE SCHEDULES REVISIONS FOR RATES EFFECTIVE JANUARY 1, 2019 (1) Rate component changes for Residential and Heating Service rate schedules. (2) General
2016 Load & Capacity Data Report
 Caution and Disclaimer The contents of these materials are for information purposes and are provided as is without representation or warranty of any kind, including without limitation, accuracy, completeness
SAN JOAQUIN VALLEY UNIFIED AIR POLLUTION CONTROL DISTRICT DRAFT STAFF REPORT
 DRAFT STAFF REPORT Draft Amendments to Rule 4621 (Gasoline Transfer into Stationary Storage Containers, Delivery Vessels, and Bulk Plants) and Rule 4622 (Gasoline Transfer into Motor Vehicle Fuel Tanks)
Abstract. Background and Study Description
 OG&E Smart Study TOGETHER: Technology-Enabled Dynamic Pricing Impact Evaluation Craig Williamson, Global Energy Partners, an EnerNOC Company, Denver, CO Katie Chiccarelli, OG&E, Oklahoma City, OK Abstract
Appendix N. The 2006 Fish Passage Implementation Plan
 Appendix N The 2006 Fish Passage Implementation Plan 2006 Fish Passage Implementation Plan March 31, 2006 Background: The 2006 Fish Passage Implementation Plan describes the Corps plan for fish passage
Appendix G Aquilla Lake Pool Rise Recreational Resources
 Appendix G Aquilla Lake Pool Rise Recreational Resources 1. INTRODUCTION The purpose of this appendix is to document the impacts of a 2.5 ft (Alternative A), 4.5 ft (Alternative B), and 6.5 ft. (Alternative
CCoWS. Central Coast Watershed Studies. Summary of Precipitation and Streamflow for Potrero and San Clemente Creeks in Water-Year 2008
 Central Coast Watershed Studies CCoWS Summary of Precipitation and Streamflow for Potrero and San Clemente Creeks in Water-Year 2008 Santa Lucia Preserve Monterey County, California Publication No. WI-2009-01
Minimization 36 CFR (b)
") Rico West Dolores Roads and Trails (Travel Management) Project Draft Record of Decision, Attachment 6 Travel Rule for Motor Vehicle designations of trails and areas (Minimization ) As described in the
Rico West Dolores Roads and Trails (Travel Management) Project Draft Record of Decision, Attachment 6 Travel Rule for Motor Vehicle designations of trails and areas (Minimization ) As described in the
City of, Kansas Electric Department. Net Metering Policy & Procedures for Customer-Owned Renewable Energy Resources
 Ordinance No. Exhibit A ----------------------------------------- City of, Kansas Electric Department Net Metering Policy & Procedures for Customer-Owned Renewable Energy Resources -------------------------------------
October 17, Please contact the undersigned directly with any questions or concerns regarding the foregoing.
 California Independent System Operator Corporation The Honorable Kimberly D. Bose Secretary Federal Energy Regulatory Commission 888 First Street, NE Washington, DC 20426 October 17, 2017 Re: California
Joint Operating Procedures for First Nations Consultation on Energy Resource Activities
 Joint Operating Procedures for First Nations Consultation on Energy Resource Activities October 31, 2018 Contents Revision History... iv Definitions of Key Terms... v 1 Background... 1 2 Roles and Responsibilities...
Monitoring Bank Erosion On the Missouri River, Lower Brule Reservation
 Monitoring Bank Erosion On the Missouri River, Lower Brule Reservation A cooperative study between the Lower Brule Sioux Tribe s Environmental Protection Office and the U.S. Geological Survey, with assistance
Department of Market Quality and Renewable Integration November 2016
 Energy Imbalance Market March 23 June 3, 216 Available Balancing Capacity Report November 1, 216 California ISO Department of Market Quality and Renewable Integration California ISO i TABLE OF CONTENTS
Yukon s Independent Power Production Policy
 Yukon s Independent Power Production Policy Updated October 2018 BACKGROUND The Government of Yukon (YG) released the Energy Strategy for Yukon in January 2009. The strategy sets out YG s energy priorities,
FITCHBURG GAS AND ELECTRIC LIGHT COMPANY NET METERING SCHEDULE NM
 Sheet 1 FITCHBURG GAS AND ELECTRIC LIGHT COMPANY SCHEDULE NM Applicability The following tariff provisions shall be applicable to a Host Customer, as defined herein, that requests net metering services
Biennial Assessment of the Fifth Power Plan
 Biennial Assessment of the Fifth Power Plan Gas Turbine Power Plant Planning Assumptions October 17, 2006 Simple- and combined-cycle gas turbine power plants fuelled by natural gas are among the bulk power
Coal Mine Safety Shortchanged by Years of Budget Cuts
 Coal Mine Safety Shortchanged by Years of Budget Cuts Congress created the Mine Safety and Health Administration (MSHA) in 1977, placing a new federal focus on miner safety and health. However, the agency's
Appendix 6.7 January 23, 2015 SURPLUS ENERGY PROGRAM PROPOSED TERMS AND CONDITIONS
 Appendix 6.7 SUR ENERGY PROGRAM PROPOSED TERMS AND CONDITIONS SUR ENERGY PROGRAM INDUSTRIAL LOAD - OPTION 1 TABLE OF CONTENTS Page No. Eligibility...1 Reference Demand...1 Billing...2 Interruptions...3
Delaware Electric Cooperative
 Delaware Electric Cooperative Approved Rates Rate Leaf No. Residential 48 Residential Load Management 51 Residential Space Heating 54 General Service 56 Irrigation 58 Irrigation Demand Off-Peak 61 Irrigation-Demand
Audit Follow-up. Fleet Fuel Operations (Report #0801, Issued October 18, 2007) As of March 31, Summary. Report #0811 June 20, 2008
 As of March 31, Summary. Report #0811 June 20, 2008") Audit Follow-up As of March 31, 2008 Sam M. McCall, CPA, CGFM, CIA, CGAP City Auditor Fleet Fuel Operations (Report #0801, Issued October 18, 2007) Report #0811 June 20, 2008 Summary This is the first
Audit Follow-up As of March 31, 2008 Sam M. McCall, CPA, CGFM, CIA, CGAP City Auditor Fleet Fuel Operations (Report #0801, Issued October 18, 2007) Report #0811 June 20, 2008 Summary This is the first
STATE IMPLEMENTATION PLAN CREDIT FOR EMISSION REDUCTIONS GENERATED THROUGH INCENTIVE PROGRAMS (Adopted June 20, 2013)
") RULE 9610 STATE IMPLEMENTATION PLAN CREDIT FOR EMISSION REDUCTIONS GENERATED THROUGH INCENTIVE PROGRAMS (Adopted June 20, 2013) 1.0 Purpose The purpose of this rule is to provide an administrative mechanism
RULE 9610 STATE IMPLEMENTATION PLAN CREDIT FOR EMISSION REDUCTIONS GENERATED THROUGH INCENTIVE PROGRAMS (Adopted June 20, 2013) 1.0 Purpose The purpose of this rule is to provide an administrative mechanism
DRIVER SPEED COMPLIANCE WITHIN SCHOOL ZONES AND EFFECTS OF 40 PAINTED SPEED LIMIT ON DRIVER SPEED BEHAVIOURS Tony Radalj Main Roads Western Australia
 DRIVER SPEED COMPLIANCE WITHIN SCHOOL ZONES AND EFFECTS OF 4 PAINTED SPEED LIMIT ON DRIVER SPEED BEHAVIOURS Tony Radalj Main Roads Western Australia ABSTRACT Two speed surveys were conducted on nineteen
Regulatory update on implementation of the 0.50% sulphur limit for international shipping
 Regulatory update on implementation of the 0.50% sulphur limit for international shipping Marshall Islands Quality Council (MIQC), 19 April 2018 Trinity House, London Dr Edmund Hughes Marine Environment
POLICY MANUAL OPERATING POLICIES AND PROCEDURES
 POLICY MANUAL OPERATING POLICIES AND PROCEDURES Number 514 Subject: Vehicle Use Policy Effective Date: February 1, 2006 Date of Last Revision: January 14, 2013 514.1 USE OF UNIVERSITY VEHICLES 1.1 All
Alberta Electric System Operator Saleski Transmission Project Needs Identification Document
 Decision 2013-127 Alberta Electric System Operator Saleski Transmission Project Needs Identification Document ATCO Electric Ltd. Saleski 901S Substation and 144-kV Transmission Line 7L142 Facility Application
March 14, Please contact the undersigned directly with any questions or concerns regarding the foregoing.
 California Independent System Operator Corporation The Honorable Kimberly D. Bose Secretary Federal Energy Regulatory Commission 888 First Street, NE Washington, DC 20426 March 14, 2017 Re: California
June Safety Measurement System Changes
 June 2012 Safety Measurement System Changes The Federal Motor Carrier Safety Administration s (FMCSA) Safety Measurement System (SMS) quantifies the on-road safety performance and compliance history of
Frequently Asked Questions
 Frequently Asked Questions Directive 040 General December 2016 Q1. How do I apply for exemptions to Directive 040 test requirements? A1. Contact the AER Well Test Group by email at welltest-helpline@aer.ca
Brake Pad Copper Reduction - Metrics for Tracking Progress
 Brake Pad Copper Reduction - Metrics for Tracking Progress Technical Memo California Stormwater Quality Association tdc environmental MEMO TO: CASQA DATE: FROM: Kelly D. Moran, Ph.D. PROJECT: 79 SUBJECT:
City of Washington, Kansas Electric Department. Net Metering Policy & Procedure For Customer-Owned Renewable Energy Resources
 Ordinance No. 743 Exhibit A City of Washington, Kansas Electric Department Net Metering Policy & Procedure For Customer-Owned Renewable Energy Resources Page 1 of 7 1. INTRODUCTION The provisions of this
Electrovaya Provides Business Update
 News for Immediate Release Electrovaya Provides Business Update Toronto, Ontario November 8, 2016 Electrovaya Inc. (TSX: EFL) (OTCQX:EFLVF) is providing the following update on business developments previously
SPP OVERVIEW. Mike Ross Senior Vice President, Government Affairs and Public Relations
 SPP OVERVIEW Mike Ross Senior Vice President, Government Affairs and Public Relations 1 Our Mission Helping our members work together to keep the lights on today and in the future. 2 NORTH AMERICAN INDEPENDENT
Modernising the Great Western railway
 Report by the Comptroller and Auditor General Department for Transport and Network Rail Modernising the Great Western railway HC 781 SESSION 2016-17 9 NOVEMBER 2016 4 Key facts Modernising the Great Western
Public Information Workshop
 Public Information Workshop Charlotte County-Punta Gorda MPO - Meeting Rooms A and B March 29, 2018 Welcome to the Public Information Workshop for Harborview Road Project Development and Environment (PD&E)
Southern California Edison Rule 21 Storage Charging Interconnection Load Process Guide. Version 1.1
 Southern California Edison Rule 21 Storage Charging Interconnection Load Process Guide Version 1.1 October 21, 2016 1 Table of Contents: A. Application Processing Pages 3-4 B. Operational Modes Associated
Residential Load Profiles
 Residential Load Profiles TABLE OF CONTENTS PAGE 1 BACKGROUND... 1 2 DATA COLLECTION AND ASSUMPTIONS... 1 3 ANALYSIS AND RESULTS... 2 3.1 Load Profiles... 2 3.2 Calculation of Monthly Electricity Bills...
REPORT TO THE CHIEF ADMINISTRATIVE OFFICER FROM THE DEVELOPMENT AND ENGINEERING SERVICES DEPARTMENT COMPRESSED NATURAL GAS TRANSIT FLEET UPDATE
 September 7, 2016 REPORT TO THE CHIEF ADMINISTRATIVE OFFICER FROM THE DEVELOPMENT AND ENGINEERING SERVICES DEPARTMENT ON COMPRESSED NATURAL GAS TRANSIT FLEET UPDATE PURPOSE To update Council on Kamloops
Kelly Redmond Regional Climatologist, Western Regional Climate Center Atmospheric Sciences Division
 Kelly Redmond Regional Climatologist, Western Regional Climate Center Atmospheric Sciences Division Climate and the Colorado and Columbia River Basins Presented at The Aspen Global Change Institute June
The Premcor Refining Group, Inc. Delaware City Refinery 4550 Wrangle Hill Rd. EXHIBIT A Delaware City, DE 19706
 DRAFT Permit: APC-2004/0721-CONSTRUCTION (NSPS) Two Package Boilers The Premcor Refining Group, Inc. Delaware City Refinery 4550 Wrangle Hill Rd. EXHIBIT A Delaware City, DE 19706 ATTENTION: Andrew Kenner
MONTHLY NEW RESIDENTIAL SALES, SEPTEMBER 2018
 FOR RELEASE AT 10:00 AM EDT, WEDNESDAY, OCTOBER 24, MONTHLY NEW RESIDENTIAL SALES, SEPTEMBER Release Number: CB18 160 October 24, The U.S. Census Bureau and the U.S. Department of Housing and Urban Development
STANDBY SERVICE. Transmission Service Primary Service Secondary Service
 a division of Otter Tail Corporation Rate Designation C-10M, Page 1 of 6 STANDBY SERVICE OPTION A: FIRM OPTION B: NON-FIRM On-Peak Off-Peak On-Peak Off-Peak Transmission Service 927 928 937 938 Primary
Monthly Economic Letter
 Monthly Economic Letter Cotton Market Fundamentals & Price Outlook RECENT PRICE MOVEMENT Most cotton prices were stable over the past month. Chinese prices moved slightly higher. Indian prices moved slightly
7000 Series Railcar Program Overview
 Finance, Administration and Oversight Committee Information Item IV-B November 6, 2008 7000 Series Railcar Program Overview Washington Metropolitan Area Transit Authority Board Action/Information Summary