Kelly Redmond Regional Climatologist, Western Regional Climate Center Atmospheric Sciences Division
|
|
|
- Mervyn Ball
- 5 years ago
- Views:
Transcription

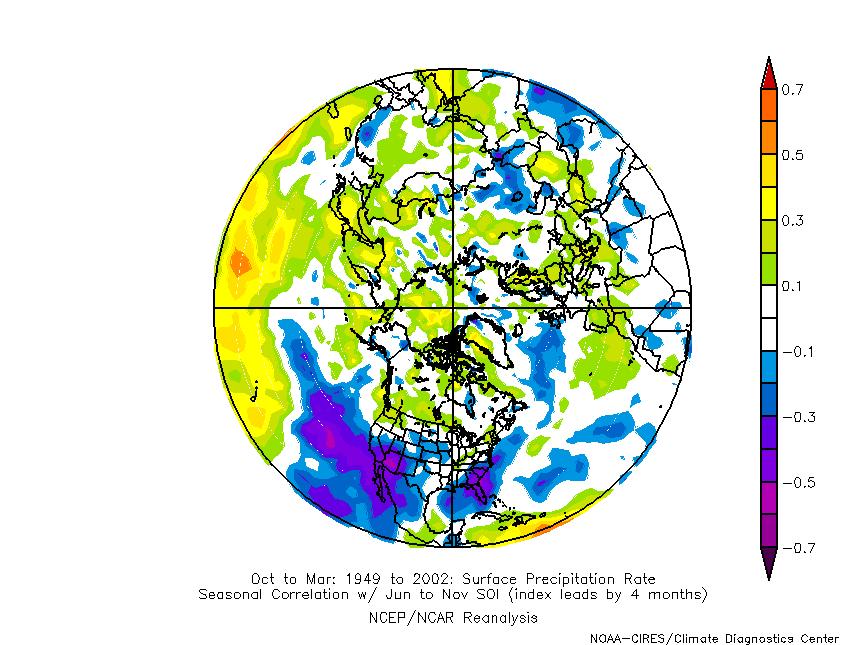
1 Kelly Redmond Regional Climatologist, Western Regional Climate Center Atmospheric Sciences Division Climate and the Colorado and Columbia River Basins Presented at The Aspen Global Change Institute June 5-10, 2003 Summer Science Session I Learning from Regions: A Comparative Appraisal of Climate, Water, and Human Interactions in the Colorado and Columbia River Systems
2 Climate and the Colorado and Columbia River Basins Kelly T. Redmond Western Regional Climate Center Desert Research Institute Reno Nevada

3
4

5

6
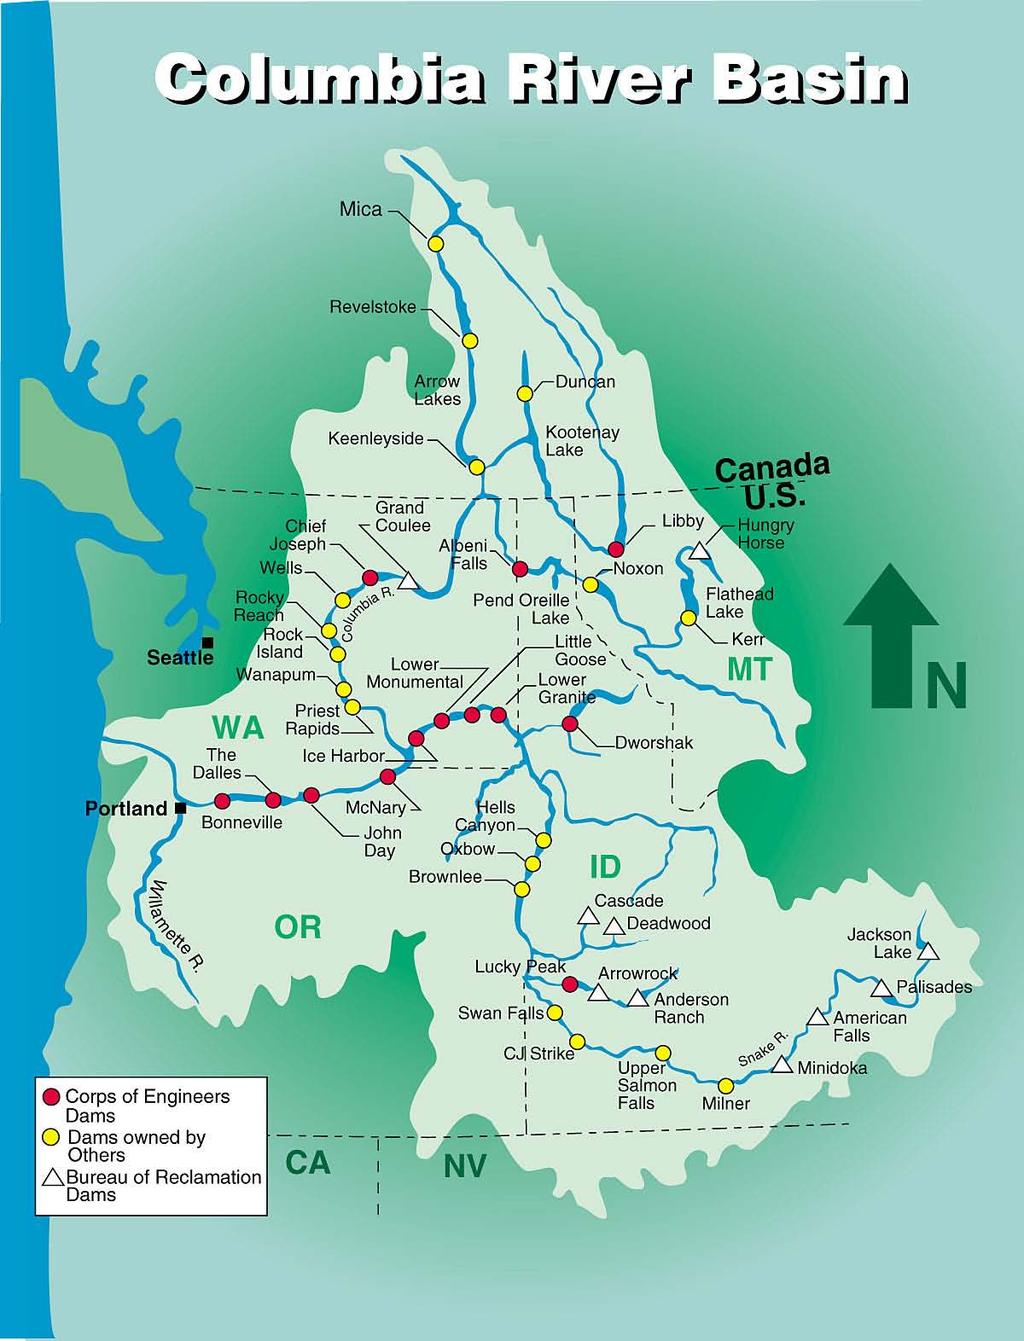
7
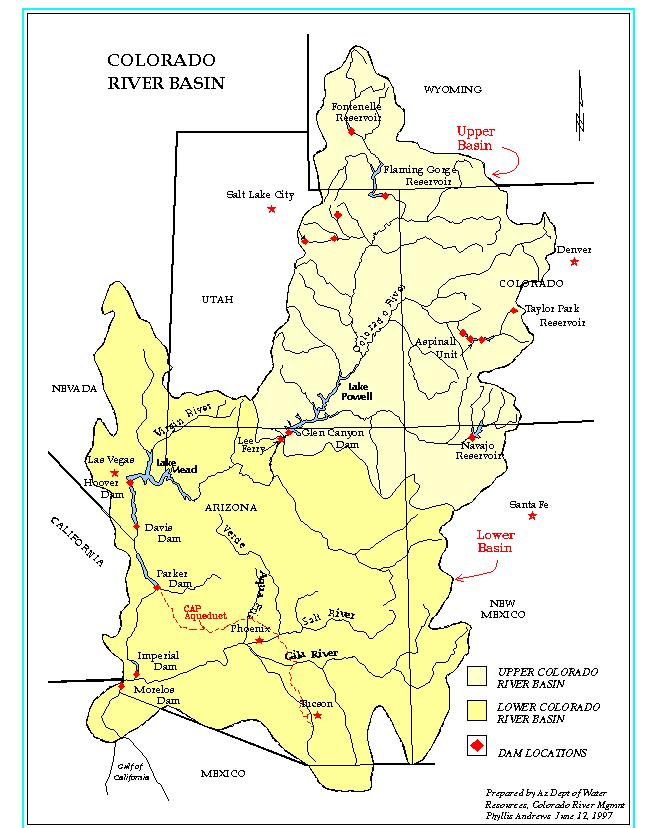
8
9
10
11
12

13 Oct-Mar Apr-May-June Fraction of Annual Total Precipitation, by Season July-Aug
14 Columbia River Basin High symbolic significance in the West Crosses an international boundary Heavily regulated and dammed Has endangered fish species Substantial hydropower development Strong predictive ENSO signal in winter within the basin Significant tribal issues Rapid population growth in basin Enters the United States from a foreign country Storage to flow ratio approximately 0.4 El Nino dry, La Nina wet El Nino usually warm, La Nina usually cool Largest flow volume is at mouth Water Services needed from the river Major transportation corridor No out-of-basin water transfers Relatively few protected corridors within basin Anadromous fish populations Few mainstem sediment and salinity problems ESA fish is very well known, charismatic cultural icon History of relative cooperation among managers Water not divided by interstate compact
15 Colorado River Basin High symbolic significance in the West Crosses an international boundary Heavily regulated and dammed Has endangered fish species Substantial hydropower development Strong predictive ENSO signal in winter within the basin Significant tribal issues Rapid population growth in basin Leaves the United States to enter a foreign country Storage to flow ratio approximately 4.0 El Nino wet, La Nina dry El Nino usually cool, La Nina usually warm No flow at its mouth Water itself needed from the river Essentially no commercial transportation Significant out-of-basin water transfers Extensive protected corridors within basin No anadromous fish population Mainstem sediment and salinity problems ESA fish is relatively unknown, not a big fan base History of relatively contentious water disputes Water divided by interstate compact of 1922
16
17
18 Water Vapor June GMT

19 Courtesy Klaus Wolter & Mike Timlin, Climate Diagnostics Center


20 Positive Negative Mantua et al.

21 Washington Redmond & Koch, 1991, updated. ENSO Arizona Central Sierra
22
23
24 Colorado Statewide Average Precipitation, by Month. Jan 2000 Apr Long term Average ( ) Jan 2000 Jan 2001 Jan 2001 Jan 2003
25 Colorado Statewide Average Precipitation Dec Aug (9-month period) & 10-Year Running Mean
26
27
28
29 Water Vapor June GMT
30 Arizona Statewide Precipitation (12-Months: May April) & 10-Yr Running Mean
31
32
33 Water Vapor June GMT
34 Arizona Statewide Precipitation (12-Months: May April) & 10-Yr Running Mean
35
36
37 Water Vapor June GMT
38 Arizona Statewide Precipitation (12-Months: May April) & 10-Yr Running Mean
39
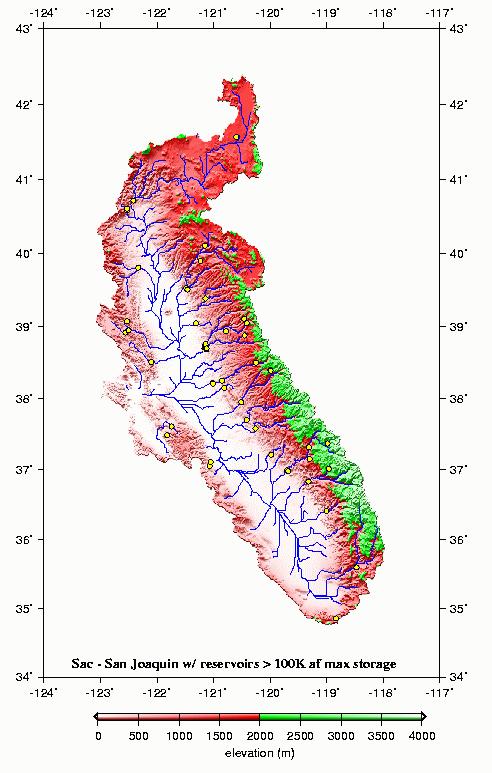
40

41 Water Vapor June GMT
42 Arizona Statewide Precipitation (12-Months: May April) & 10-Yr Running Mean
43
44
45
46
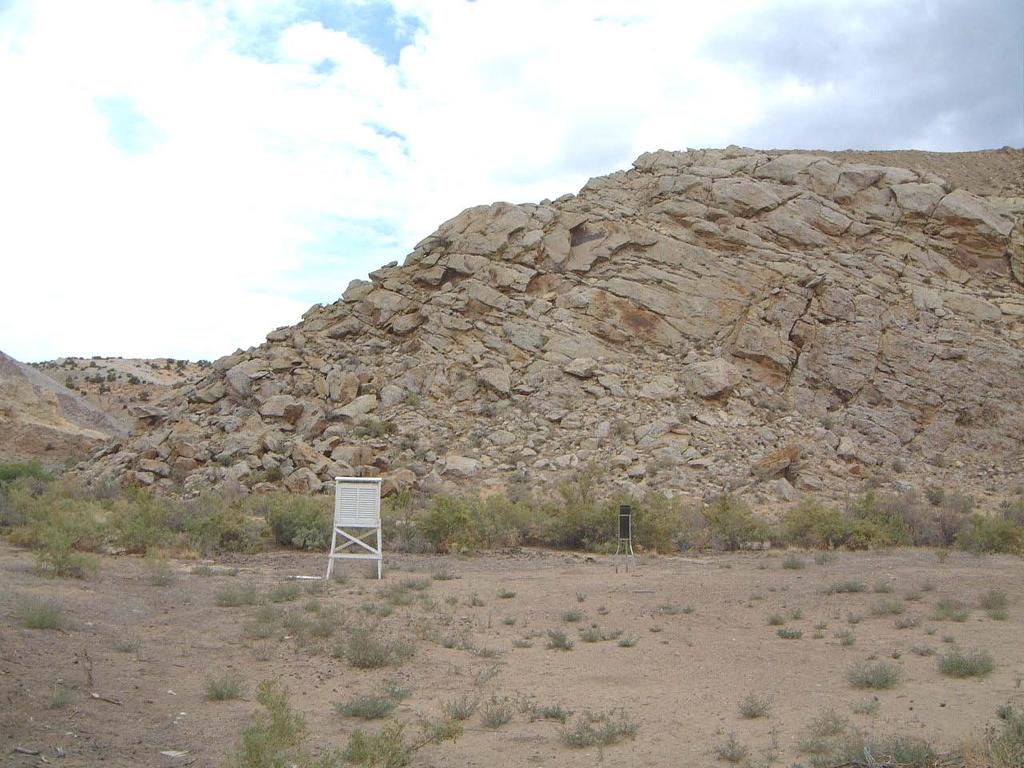
47 We need more high elevation climate stations! Most of California s Precip gauges are sited in low elevation population centers. Yet, a lot of our concern is for climate changes in mid-high elevations.
 ********************** Temperature differences can be 6-8 degrees F from one end of runway to the other, at")
48 Reno Airport (KRNO) Approximate Urban / Downtown Heat Bubble KRNO ASOS (between runways) Temporary ASOS ( not windy enough ) ********************** Temperature differences can be 6-8 degrees F from one end of runway to the other, at night.
49
50
51
52

53

54
55
56
57
58 STATION NUMBER ELEMENT : DAILY MAX TEMPERATURE QUANTITY : MONTHLY MAXIMUM STATION : DINOSAUR NM QUARRY AREA FROM DATA WITH UNITS: DEGREES F *** Note *** Provisional Data *** After Year/Month a = 1 day missing, b = 2 days missing, c = 3 days,..etc.., z = 26 or more days missing, A = Accumulations present Long-term means based on columns; thus, the monthly row may not sum (or average) to the long-term annual value. MAXIMUM ALLOWABLE NUMBER OF MISSING DAYS : 9 For 80-column screen, values more than four digits produce 4 asterisks (****). For 80-column screen, values have been multiplied by 1, skewness by 10 YEAR(S) JAN FEB MAR APR MAY JUN JUL AUG SEP OCT NOV DEC ANN z9999z9999z 77b 94a a d 82d 70a 59h b 52 64d 83a 90a 102a 102a b 65b 50b a 71 82e 90a b 102b 94b 83d 67h 46d a 57d 70 78d 87b 105e 100i 97e 81l9999z 57a a f a b 61a f 74a 91a c a 59b 77a 78b z 80d 48a 45a c b 90e 94b a 80z9999z9999z9999z a j c z
59 j s 42z z o m 42p l 54l 72k k m 58m 40n 110 MEAN S.D SKW MAX MIN YRS Dinosaur Nat Mon, Utah Quarry Site STATION NUMBER ELEMENT : DAILY MAX TEMPERATURE QUANTITY : MONTHLY MAXIMUM STATION : DINOSAUR NATL MONUMENT FROM DATA WITH UNITS: DEGREES F *** Note *** Provisional Data *** After Year/Month YEAR(S) JAN FEB MAR APR MAY JUN JUL AUG SEP OCT NOV DEC ANN z9999z9999z9999z9999z 59 74b a MEAN S.D SKW MAX MIN YRS Dinosaur Nat Mon, Colorado HQ.


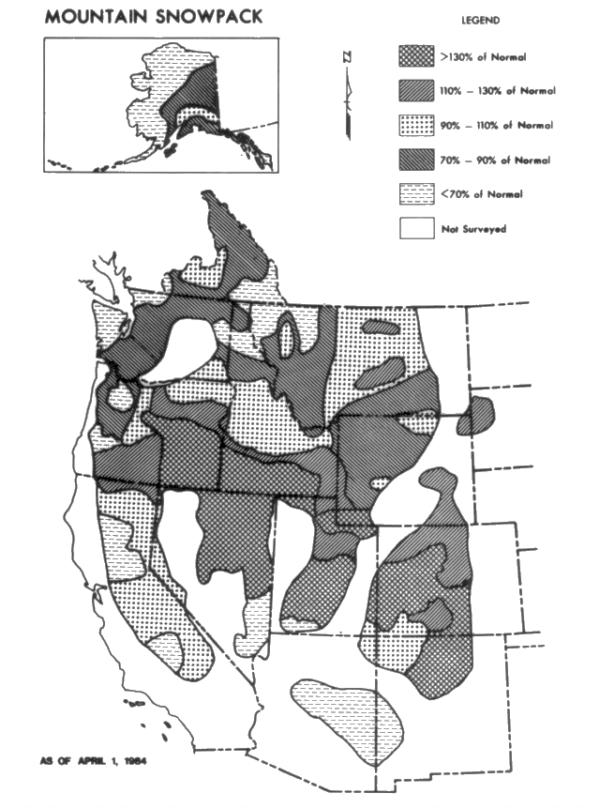

60 April 1 Mountain Snowpack Pct of average


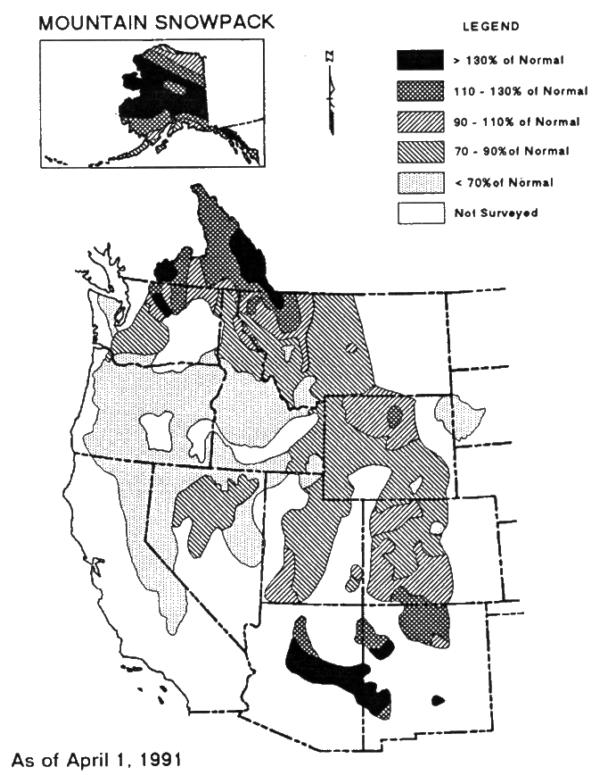
61 April 1 Mountain Snowpack Pct of average


62 April 1 Mountain Snowpack Pct of average


63 April 1 Mountain Snowpack Pct of average
64
Commercial-in-Confidence Ashton Old Baths Financial Model - Detailed Cashflow
 Year 0 1 2 3 4 5 6 7 8 9 10 11 12 13 Oct-16 Nov-16 Dec-16 Jan-17 Feb-17 Mar-17 Apr-17 May-17 Jun-17 Jul-17 Aug-17 Sep-17 Oct-17 2,038 2,922 4,089 4,349 6,256 7,124 8,885 8,885 8,885 8,885 8,885 8,885 9,107
COMPARISON OF FIXED & VARIABLE RATES (25 YEARS) CHARTERED BANK ADMINISTERED INTEREST RATES - PRIME BUSINESS*
 CHARTERED BANK ADMINISTERED INTEREST RATES - PRIME BUSINESS*") COMPARISON OF FIXED & VARIABLE RATES (25 YEARS) 2 Fixed Rates Variable Rates For Internal Use Only. FIXED RATES OF THE PAST 25 YEARS AVERAGE RESIDENTIAL MORTGAGE LENDING RATE - 5 YEAR* (Per cent) Year
COMPARISON OF FIXED & VARIABLE RATES (25 YEARS) 2 Fixed Rates Variable Rates For Internal Use Only. FIXED RATES OF THE PAST 25 YEARS AVERAGE RESIDENTIAL MORTGAGE LENDING RATE - 5 YEAR* (Per cent) Year
COMPARISON OF FIXED & VARIABLE RATES (25 YEARS) CHARTERED BANK ADMINISTERED INTEREST RATES - PRIME BUSINESS*
 CHARTERED BANK ADMINISTERED INTEREST RATES - PRIME BUSINESS*") COMPARISON OF FIXED & VARIABLE RATES (25 YEARS) 2 Fixed Rates Variable Rates FIXED RATES OF THE PAST 25 YEARS AVERAGE RESIDENTIAL MORTGAGE LENDING RATE - 5 YEAR* (Per cent) Year Jan Feb Mar Apr May Jun
COMPARISON OF FIXED & VARIABLE RATES (25 YEARS) 2 Fixed Rates Variable Rates FIXED RATES OF THE PAST 25 YEARS AVERAGE RESIDENTIAL MORTGAGE LENDING RATE - 5 YEAR* (Per cent) Year Jan Feb Mar Apr May Jun
TRAFFIC VOLUME TRENDS July 2002
 TRAFFIC VOLUME TRENDS July 2002 Travel on all roads and streets changed by +2.3 percent for July 2002 as compared to July 2001. Estimated Vehicle-Miles of Travel by Region - July 2002 - (in Billions) West
2017 Adjusted Count Report February 12, 2018
 A statewide multi-use trail user study and volunteer data collection program 2017 Adjusted Count Report February 12, 2018 The following report includes the final adjusted infrared (IR) counter data at
Climatography of the United States No
 Climate Division: CA 5 NWS Call Sign: Month (1) Min (2) Month(1) Extremes Lowest (2) Temperature ( F) Lowest Month(1) Degree s (1) Base Temp 65 Heating Cooling 100 Number of s (3) Jan 45.9 26.0 36.0 67
Climatography of the United States No
 Climate Division: WY 9 NWS Call Sign: LND Temperature ( F) Month (1) Min (2) Month(1) Extremes Lowest (2) Lowest Month(1) Degree s (1) Base Temp 65 Heating Cooling 100 Number of s (3) Jan 31.9 8.7 20.3
TRAFFIC VOLUME TRENDS
 Page 1 U. S. Department Transportation Federal Highway Administration Office Highway Policy Information TRAFFIC VOLUME TRENDS September Travel on all roads and streets changed by +2.5 (5.8 billion vehicle
University of Michigan Eco-Driving Index (EDI) Latest data: October 2017
 Latest data: October 2017") University of Michigan Eco-Driving Index () http://www.ecodrivingindex.org Latest data: October 2017 Developed and issued monthly by Michael Sivak and Brandon Schoettle Sustainable Worldwide Transportation
University of Michigan Eco-Driving Index () http://www.ecodrivingindex.org Latest data: October 2017 Developed and issued monthly by Michael Sivak and Brandon Schoettle Sustainable Worldwide Transportation
Climatography of the United States No
 Climate Division: MA 3 NWS Call Sign: BOS Month (1) Min (2) Month(1) Extremes Lowest (2) Temperature ( F) Lowest Month(1) Degree s (1) Base Temp 65 Heating Cooling 100 Number of s (3) 36.5 22.1 29.3 72
Missouri River Mainstem Reservoirs Runoff Volumes for Annual Operating Plan Studies RCC Technical Report Jy-08
 Missouri River Region Since 1953 US Army Corps of Engineers Reservoir Control Center Missouri River Region Northwestern Division Reservoir Control Center July 2008 Missouri River Basin Fort Peck Montana
Up and Down Months of the Stock Market
 Up and Down Months of the Stock Market 1926-2017 Positive years (66) in the stock market were not good all year long and losing years (24) were not losers throughout the year. Winning years produce losing
CLIMATOLOGICAL SUMMARY
 DEPARTMENT OF REGISTRATION AND EDUCATION CTATP OF ILLINOIS ILLINOIS STATE WATER SURVEY DIVISION URBANA, ILLINOIS ISWS MP-19 Archive ISWS Illinois State Water Survey )CAL CLIMATOLOGICAL DATA MP-19 LOCAL
CCoWS. Central Coast Watershed Studies. Summary of Precipitation and Streamflow for Potrero and San Clemente Creeks in Water-Year 2008
 Central Coast Watershed Studies CCoWS Summary of Precipitation and Streamflow for Potrero and San Clemente Creeks in Water-Year 2008 Santa Lucia Preserve Monterey County, California Publication No. WI-2009-01
Aglantha digitale in the Eastern North Pacific. Moira Galbraith - Institute of Ocean Sciences Mary Arai Pacific Biological Station Emeritus
 Aglantha digitale in the Eastern North Pacific Moira Galbraith - Institute of Ocean Sciences Mary Arai Pacific Biological Station Emeritus Aglantha digitale: one of the most common hydromedusae in north
CCoWS. Central Coast Watershed Studies. Summary of Precipitation and Streamflow for Potrero and San Clemente Creeks in Water-Year 2007
 Central Coast Watershed Studies CCoWS Summary of Precipitation and Streamflow for Potrero and San Clemente Creeks in Water-Year 2007 Santa Lucia Preserve Monterey County, California Publication No. WI-2008-01
Action Requested From AMWG
 Action Requested From AMWG NONE, These Two Presentations Are For Information Transfer Only The information is derived from a multi-year synthesis research effort related to existing data on flow, sediment-transport
Local Climatological Data Summary Aurora, Illinois
 SWS Miscellaneous Publication 98-15 STATE OF ILLINOIS DEPARTMENT OF NATURAL RESOURCES Local Climatological Data Summary Aurora, Illinois 1901-1996 Herbert Hoffman 1, Audrey A. Bryan 2 and Wayne Wendland
Design Criteria Data
 LAS VEGAS/MCCARRAN NV Latitude = 36.8 N WMO No. 72386 Longitude =115.1 W Elevation = 2179 feet Period of Record = 1973 to 1996 Average Pressure = 27.67 inches Hg Design Criteria Data Mean Coincident (Average)
April 10, Dear Customer:
 Dear Customer: April 10, Attached is the monthly water supply outlook and projected operations for Yellowtail Dam and Powerplant. If you have any questions or concerns, please feel free to call me at 406-247-7334
Flows Atlas. Compilation of instream flow & estuary inflow statistics for the Sabine and Neches River Basins and Sabine Lake
 Compilation of instream flow & estuary inflow statistics for the Sabine and Neches River Basins and Sabine Lake April 2010 FLOWS ATLAS Compilation of instream flow & estuary inflow statistics for the Sabine
2014 Meteorological and Oceanographic Summary for the Bocas del Toro Research Station. Prepared by: Steven Paton
 0 2014 Meteorological and Oceanographic Summary for the Bocas del Toro Research Station Prepared by: Steven Paton 1 Introduction This is the second of a series of yearly reports summarising the past year
3. Atmospheric Supply of Nitrogen to the Baltic Sea in 2009
 3. Atmospheric Supply of Nitrogen to the Baltic Sea in 2009 Nitrogen emission data, as well as the model results presented here have been approved by the 35 th Session of the Steering Body of EMEP in Geneva
NEU Electric and Natural Gas Price Update
 $ / MWH Jan-11 May-11 Sep-11 Sep-12 Jan-13 Electric: Short-Term Outlook The NYMEX Northern Illinois Hub 12-month forward price at the end of August 2016 for the September 2016 to August 2017 period was
Design Criteria Data
 RAPID CITY SD Latitude = 44.5 N WMO No. 72662 Longitude =3. W Elevation = 3169 feet Period of Record = 1973 to 1996 Average Pressure = 26.67 inches Hg Design Criteria Data Mean Coincident (Average) Values
All Annual Operating Plan Recipients
 To: All Annual Operating Plan Recipients From: Lower Colorado Region Boulder Canyon Operations Office River Operations Group Daniel Bunk P.O. Box 647 Boulder City, NV 896-47 Phone: 72-293-83 The operation
PyeongChang Weather Report. (April 2017) The PyeongChang Organizing Committee for the 2018 Olympic & Paralympic Winter Games
 The PyeongChang Organizing Committee for the 2018 Olympic & Paralympic Winter Games") PyeongChang 218 Weather Report (April 217) The PyeongChang Organizing Committee for the 218 Olympic & Paralympic Winter Games Sport Planning Department Meteorology & Climate Team Contents 1. Characteristics
PyeongChang 218 Weather Report (April 217) The PyeongChang Organizing Committee for the 218 Olympic & Paralympic Winter Games Sport Planning Department Meteorology & Climate Team Contents 1. Characteristics
Design Criteria Data
 OKLAHOMA CITY OK Latitude = 35.4 N WMO No. 72353 Longitude = 97.6 W Elevation = 133 feet Period of Record = 1973 to 1996 Average Pressure = 28.62 inches Hg Design Criteria Data Mean Coincident (Average)
LOCAL CLIMATOLOGICAL DATA
 ILLINOIS STATE WATER SURVEY DIVISION URBANA, ILLINOIS ISWS MP-21 Archive SWS0964 Illinois State Water Survey LOCAL CLIMATOLOGICAL DATA FDR HILLSBORO, IL. 1901-1962 LOCAL CLIMATOLOGICAL DATA 1901-1962 HILLSBORO
May ATR Monthly Report
 May ATR Monthly Report Minnesota Department of Transportation Office of Transportation Data and Analysis May 2011 Introduction The purpose of this report is to examine monthly traffic trends on Minnesota
Arctic Freshwater Flux and Change
 Arctic Freshwater Flux and Change Daqing Yang, Doug Kane, Sveta Berezovskaya Water and Environment Research Center, Univ. of Alaska Fairbanks Main Topics Large Arctic River Streamflow Regime and Change
Meteorology of Monteverde, Costa Rica 2005
 Meteorology of Monteverde, Costa Rica 2005 Technical Report submitted to the Monteverde Institute Andrew J. Guswa, Asst Professor, Picker Engineering Program Amy L. Rhodes, Asst Professor, Department of
Design Criteria Data
 MEDFORD/JACKSON CO. OR Latitude = 42.37 N WMO No. 72597 Longitude =122.8 W Elevation = 1329 feet Period of Record = 1973 to 1996 Average Pressure = 28.61 inches Hg Design Criteria Data Mean Coincident
Thirty Years of Climatological Data: 1969 to 1998
 Thirty Years of Climatological Data: 1969 to 1998 NMSU's Agricultural Science Center at Farmington, New Mexico Agricultural Experiment Station Research Report 744 College of Agriculture and Home Economics
NJ Solar Market Update As of 6/30/15
 NJ Solar Market Update As of 6/30/ Prepared by Charlie Garrison July 17, 20 SOLAR INSTALLED CAPACITY DATA The preliminary installed solar capacity as of 6/30/ is approximately 1,500.7 MW. Approximately
Design Criteria Data
 DES MOINES IA Latitude = 41.53 N WMO No. 72546 Longitude = 93.65 W Elevation = 965 feet Period of Record = 1973 to 1996 Average Pressure = 28.96 inches Hg Design Criteria Data Mean Coincident (Average)
Energy Markets in Turmoil The Consumer Perspective
 Energy Markets in Turmoil The Consumer Perspective Sonny Popowsky Consumer Advocate of Pennsylvania Illinois State University Institute for Regulatory Policy Studies 63682 Springfield, IL May 17, 2001
NJ Solar Market Update
 NJ Solar Market Update April 16, 20 Renewable Energy Committee Meeting Trenton, NJ Prepared by Charlie Garrison Solar Installed Capacity Data The preliminary installed solar capacity as of 3/31/ is approximately
Meter Insights for Downtown Store
 Meter Insights for Downtown Store Commodity: Analysis Period: Prepared for: Report Date: Electricity 1 December 2013-31 December 2014 Arlington Mills 12 February 2015 Electricity use over the analysis
Design Criteria Data
 PHOENIX/SKY HARBOR AZ Latitude = 33.43 N WMO No. 72278 Longitude =112. W Elevation = 116 feet Period of Record = 1973 to 1996 Average Pressure = 28.72 inches Hg Design Criteria Data Mean Coincident (Average)
Design Criteria Data
 COLUMBIA SC Latitude = 33.95 N WMO No. 7231 Longitude = 81.12 W Elevation = 226 feet Period of Record = 1973 to 1996 Average Pressure = 29.8 inches Hg Design Criteria Data Mean Coincident (Average) Values
2019 Western North Carolina Weather Calendar. Department of Atmospheric Sciences The University of North Carolina at Asheville
 209 Western North Carolina Weather Calendar Department of Atmospheric Sciences The University of North Carolina at Asheville www.atms.unca.edu 209 Western North Carolina Weather Calendar Climatological
Design Criteria Data
 PIERRE SD Latitude = 44.38 N WMO No. 726686 Longitude =1.2 W Elevation = 1742 feet Period of Record = 1973 to 1996 Average Pressure = 28.1 inches Hg Design Criteria Data Mean Coincident (Average) Values
NJ Solar Market Update As of 10/31/15
 NJ Solar Market Update As of 10/31/15 Prepared by Charlie Garrison Renewable Energy Committee Meeting November 10, 2015 SOLAR INSTALLED CAPACITY DATA The preliminary installed solar capacity as of 10/31/15
TABLE C-43. Manufacturers' new and unfilled orders, {Amounts in millions of dollars] Nondurable. Capital goods. Total. goods.
![TABLE C-43. Manufacturers' new and unfilled orders, {Amounts in millions of dollars] Nondurable. Capital goods. Total. goods.](/thumbs/93/112603708.jpg "TABLE C-43. Manufacturers' new and unfilled orders, {Amounts in millions of dollars] Nondurable. Capital goods. Total. goods.") TABLE C-43. Manufacturers' new and unfilled orders, -74 {Amounts in millions of dollars] New orders t, I960. 27, 559 26, 903 30,672 30,115 31,086 33,005 35,322 37,952 41, 803 45, 944 46,763 50, 243 53,
TABLE C-43. Manufacturers' new and unfilled orders, -74 {Amounts in millions of dollars] New orders t, I960. 27, 559 26, 903 30,672 30,115 31,086 33,005 35,322 37,952 41, 803 45, 944 46,763 50, 243 53,
Design Criteria Data
 BIRMINGHAM AL Latitude = 33.57 N WMO No. 72228 Longitude = 86.75 W Elevation = 63 feet Period of Record = 1973 to 1996 Average Pressure = 29.36 inches Hg Design Criteria Data Mean Coincident (Average)
Appendix F. Ship Drift Analysis West Coast of North America: Alaska to Southern California HAZMAT Report ; April 2000
 Appendix F Ship Drift Analysis West Coast of North America: Alaska to Southern California HAZMAT Report 2000-2; April 2000 2.2 Drift Factors When its propulsion or steering device fails, a ship will drift
Appendix E Water Supply Modeling
 Supply Modeling Modesto Irrigation District Treatment Plant Expansion Project Modeling I. Introduction The Modesto Irrigation District (MID) is situated adjacent to and north of the Tuolumne River. Over
D G A G R I D A S H B O A R D : A P P L E S
 75 79 60 56 49 74 65 59 54 42 76 63 58 53 78 55 42 43 79 44 81 63 47 83 64 59 53 48 Sources: Eurostat, MSs notifications, DG Agri, Comext, Comtrade, GTA, ITC, AMI, Expert groups, Freshfel, Wapa. 89 68
Design Criteria Data
 ALBUQUERQUE NM Latitude = 35.5 N WMO No. 72365 Longitude =16.6 W Elevation = 5315 feet Period of Record = 1967 to 1996 Average Pressure = 24.72 inches Hg Design Criteria Data Mean Coincident (Average)
Design Criteria Data
 RENO/CANNON INTL NV Latitude = 39.5 N WMO No. 72488 Longitude =119.7 W Elevation = 44 feet Period of Record = 1973 to 1996 Average Pressure = 25.57 inches Hg Design Criteria Data Mean Coincident (Average)
NE (SE) Beam
 Beam") Predicted clear day beam and diffuse irradiances (/ W m 2 ) on vertical and horizontal surfaces on specified days in northern (N) and southern (S) hemispheres (see notes at foot of table): LATITUDE 60
Predicted clear day beam and diffuse irradiances (/ W m 2 ) on vertical and horizontal surfaces on specified days in northern (N) and southern (S) hemispheres (see notes at foot of table): LATITUDE 60
Sunrise: 05:48 N (S) Beam
 Beam") Predicted clear day beam and diffuse irradiances (/ W m 2 ) on vertical and horizontal surfaces on specified days in northern (N) and southern (S) hemispheres (see notes at foot of table): LATITUDE 40
Predicted clear day beam and diffuse irradiances (/ W m 2 ) on vertical and horizontal surfaces on specified days in northern (N) and southern (S) hemispheres (see notes at foot of table): LATITUDE 40
Design Criteria Data
 BURLINGTON VT Latitude = 44.47 N WMO No. 72617 Longitude = 73.15 W Elevation = 341 feet Period of Record = 1973 to 1996 Average Pressure = 29.61 inches Hg Design Criteria Data Mean Coincident (Average)
Regulation Update. Operating Committee September 12, PJM 2017
 Regulation Update Operating Committee September 12, 2017 Regulation Market Clearing Price *Data up to Aug 22 2 Mileage Ratio Mileage Ratio has increased since the new signal implementation Larger Utilization
Design Criteria Data
 PHILADELPHIA PA Latitude = 39.88 N WMO No. 7248 Longitude = 75.25 W Elevation = 3 feet Period of Record = 1973 to 1996 Average Pressure = 29.98 inches Hg Design Criteria Data Mean Coincident (Average)
Design Criteria Data
 HONOLULU/OAHU HI Latitude = 21.35 N WMO No. 91182 Longitude =157.9 W Elevation = 16 feet Period of Record = 1967 to 1996 Average Pressure = 29.96 inches Hg Design Criteria Data Mean Coincident (Average)
Design Criteria Data
 MACON/LEWIS WILSON GA Latitude = 32.7 N WMO No. 72217 Longitude = 83.65 W Elevation = 361 feet Period of Record = 1973 to 1996 Average Pressure = 29.66 inches Hg Design Criteria Data Mean Coincident (Average)
Design Criteria Data
 INDIANAPOLIS IN Latitude = 39.73 N WMO No. 72438 Longitude = 86.27 W Elevation = 87 feet Period of Record = 1973 to 1996 Average Pressure = 29.15 inches Hg Design Criteria Data Mean Coincident (Average)
Design Criteria Data
 ANCHORAGE AK Latitude = 61.17 N WMO No. 7273 Longitude =15. W Elevation = 131 feet Period of Record = 1973 to 1996 Average Pressure = 29.6 inches Hg Design Criteria Data Mean Coincident (Average) Values
Design Criteria Data
 DENVER/STAPLETON CO Latitude = 39.75 N WMO No. 72469 Longitude =14.8 W Elevation = 5332 feet Period of Record = 1973 to 1995 Average Pressure = 24.66 inches Hg Design Criteria Data Mean Coincident (Average)
Design Criteria Data
 JACKSONVILLE FL Latitude = 3.5 N WMO No. 7226 Longitude = 81.7 W Elevation = 3 feet Period of Record = 1973 to 1996 Average Pressure = 3.1 inches Hg Design Criteria Data Mean Coincident (Average) Values
Total Production by Month (Acre Feet)
") Production by Month (acre-feet) 2008 2009 2010 2011 2012 2013 2014 2015 2016 January 25 339.10 228.90 249.50 297.99 243.06 327.14 247.66 212.37 February 234.00 218.80 212.10 241.52 245.82 279.08 234.16
Production by Month (acre-feet) 2008 2009 2010 2011 2012 2013 2014 2015 2016 January 25 339.10 228.90 249.50 297.99 243.06 327.14 247.66 212.37 February 234.00 218.80 212.10 241.52 245.82 279.08 234.16
Design Criteria Data
 SPOKANE WA Latitude = 47.63 N WMO No. 72785 Longitude =117.5 W Elevation = 2366 feet Period of Record = 1973 to 1996 Average Pressure = 27.5 inches Hg Design Criteria Data Mean Coincident (Average) Values
Design Criteria Data
 LOUISVILLE/STANDIFORD KY Latitude = 38.18 N WMO No. 72423 Longitude = 85.73 W Elevation = 489 feet Period of Record = 1973 to 1996 Average Pressure = 29.49 inches Hg Design Criteria Data Mean Coincident
Design Criteria Data
 DAYTON/JAMES M COX OH Latitude = 39.9 N WMO No. 72429 Longitude = 84.2 W Elevation = 14 feet Period of Record = 1973 to 1996 Average Pressure = 28.95 inches Hg Design Criteria Data Mean Coincident (Average)
Design Criteria Data
 SPRINGFLD MO Latitude = 37.23 N WMO No. 7244 Longitude = 93.38 W Elevation = 127 feet Period of Record = 1973 to 1996 Average Pressure = 28.66 inches Hg Design Criteria Data Mean Coincident (Average) Values
2016 Meteorological and Oceanographic Summary for the Bocas del Toro Research Station. Prepared by: Steven Paton
 0 2016 Meteorological and Oceanographic Summary for the Bocas del Toro Research Station Prepared by: Steven Paton 1 Introduction This is the forth of a series of yearly reports summarising the past year
Design Criteria Data
 BOSTON/LOGAN MA Latitude = 42.37 N WMO No. 7259 Longitude = 71.3 W Elevation = 3 feet Period of Record = 1967 to 1996 Average Pressure = 29.95 inches Hg Design Criteria Data Mean Coincident (Average) Values
Design Criteria Data
 MINNEAPOLIS-ST PAUL MN Latitude = 44.88 N WMO No. 72658 Longitude = 93.22 W Elevation = 837 feet Period of Record = 1973 to 1996 Average Pressure = 29.7 inches Hg Design Criteria Data Mean Coincident (Average)
Design Criteria Data
 MIDLAND TX Latitude = 31.95 N WMO No. 72265 Longitude =2. W Elevation = 2861 feet Period of Record = 1973 to 1996 Average Pressure = 27.3 inches Hg Design Criteria Data Mean Coincident (Average) Values
Design Criteria Data
 NEW YORK/JOHN F KENNEDY NY Latitude = 4.65 N WMO No. 74486 Longitude = 73.78 W Elevation = 23 feet Period of Record = 1973 to 1996 Average Pressure = 29.98 inches Hg Design Criteria Data Mean Coincident
Design Criteria Data
 WASHINGTON/DULLES VA Latitude = 38.95 N WMO No. 7243 Longitude = 77.45 W Elevation = 322 feet Period of Record = 1973 to 1996 Average Pressure = 29.68 inches Hg Design Criteria Data Mean Coincident (Average)
Design Criteria Data
 LANDER/HUNT WY Latitude = 42.82 N WMO No. 72576 Longitude =18.7 W Elevation = 5558 feet Period of Record = 1973 to 1996 Average Pressure = 24.44 inches Hg Design Criteria Data Mean Coincident (Average)
/ PRELIMINARY STEEL IMPORTS INCREASE 2% IN MAY Import Market Share 23% in May
 News Release FOR IMMEDIATE RELEASE June 25, 2013 CONTACT Lisa Harrison 202.452.7115/ lharrison@steel.org PRELIMINARY STEEL IMPORTS INCREASE 2% IN MAY Import Market Share 23% in May Washington, D.C. Based
Design Criteria Data
 DULUTH MN Latitude = 46.83 N WMO No. 72745 Longitude = 92.18 W Elevation = 1417 feet Period of Record = 1973 to 1996 Average Pressure = 28.43 inches Hg Design Criteria Data Mean Coincident (Average) Values
Annual Fish Passage Report 2012 Columbia and Snake River Projects
 US Army Corps of Engineers Portland District Walla Walla District Annual Fish Passage Report 2012 Columbia and Snake River Projects 2012 ANNUAL FISH PASSAGE REPORT COLUMBIA AND SNAKE RIVERS for SALMON,
Design Criteria Data
 MINOT AFB ND Latitude = 48.42 N WMO No. 727675 Longitude =11.3 W Elevation = 1667 feet Period of Record = 1967 to 1996 Average Pressure = 28.16 inches Hg Design Criteria Data Mean Coincident (Average)
Design Criteria Data
 CHARLESTON/KANAWHA WV Latitude = 38.37 N WMO No. 72414 Longitude = 81.6 W Elevation = 981 feet Period of Record = 1973 to 1996 Average Pressure = 29. inches Hg Design Criteria Data Mean Coincident (Average)
Design Criteria Data
 CHICAGO/O HARE IL Latitude = 41.98 N WMO No. 7253 Longitude = 87.9 W Elevation = 673 feet Period of Record = 1967 to 1996 Average Pressure = 29.27 inches Hg Design Criteria Data Mean Coincident (Average)
ANCR CRU Statistics February 2007 to December 2007
 ANCR CRU Statistics February 2007 to December 2007 o Jan/07 Feb/07* Mar/07 Apr/07 May/07 Jun/07 Jul/07 Aug/07 Sep/07 Oct/07 Nov/07 Dec/07 Total notes data from Perimeter phone system unavailable prior
Design Criteria Data
 MADISON/DANE CO. RGNL WI Latitude = 43.13 N WMO No. 72641 Longitude = 89.33 W Elevation = 866 feet Period of Record = 1973 to 1996 Average Pressure = 29.5 inches Hg Design Criteria Data Mean Coincident
Local Climatological (Data Summary Molim, Illinois
 SWS Miscellaneous Publication 98-13 STATE OF ILLINOIS DEPARTMENT OF ENERGY AND NATURAL RESOURCES Local Climatological (Data Summary Molim, Illinois 1872-1992 by Audrey A. Bryan and Wayne Wendland Climatological
Year to Date Summary. Average and Median Sale Prices
 A Publication of RMLS, The Source for Real Estate Statistics in Your Community Residential Review: Southwest Washington September 2018 Reporting Period September Residential Highlights Southwest Washington
August ATR Monthly Report
 August ATR Monthly Report Minnesota Department of Transportation Office of Transportation Data and Analysis August 2011 Introduction The purpose of this report is to examine monthly traffic trends on
Sound Transit Operations July 2016 Service Performance Report. Ridership
 Ridership Total Boardings by Mode Mode Jul-15 Jul-16 % YTD-15 YTD-16 % ST Express 1,618,779 1,545,852-4.5% 10,803,486 10,774,063-0.3% Sounder 333,000 323,233-2.9% 2,176,914 2,423,058 11.3% Tacoma Link
September 2016 Water Production & Consumption Data
 September 2016 Water Production & Consumption Data September 2016 monthly water production (288.48 AF) was lowest in at least 17 years. Monthly water production has increased slightly each month since
AUTOMOTIVE REPORT. ChattanoogaHasCars. 7/5/2016 Hamilton County Vehicle Registrations. A Monthly Snapshot Of Local Vehicle Sales and Trends
 AUTOMOTIVE REPORT 7/5/20 Hamilton County Vehicle Registrations A Monthly Snapshot Of Local Vehicle Sales and Trends H A M I L T O N C O U N T Y V E H I C L E R E G I S T R A T I O N S ABOUT THIS REPORT
2017 Meteorological and Oceanographic Summary for the Bocas del Toro Research Station. Prepared by: Steven Paton
 0 2017 Meteorological and Oceanographic Summary for the Bocas del Toro Research Station Prepared by: Steven Paton 1 Introduction This is the 5 th of a series of yearly reports summarising the past year
/ Preliminary Steel Imports Increase 6% in May Import Market Share at 21%
 News Release FOR IMMEDIATE RELEASE June 21, 2011 CONTACT: NANCY GRAVATT 202.452.7115/ ngravatt@steel.org Preliminary Steel Imports Increase 6% in May Import Market Share at 21% Washington, D.C. Based on
GoToBermuda.com. Q3 Arrivals and Statistics at September 30 th 2015
 Q3 Arrivals and Statistics at September 30 th 2015 1 Q3 Total Vacation Visitor Arrivals Q3 Arrivals 2014 2015 YTD 2014 YTD 2015 Air - Vacation 54,305 54,473 0.31% 168 117,639 116,700-0.80% (939) Cruise
STEEL IMPORTS DOWN 23% FROM PRIOR MONTH IN MAY Finished Import Market Share YTD at 26%
 News Release FOR IMMEDIATE RELEASE June 25, 2018 CONTACT Lisa Harrison 202.452.7115/lharrison@steel.org STEEL IMPORTS DOWN 23% FROM PRIOR MONTH IN MAY Finished Import Market Share YTD at 26% Washington,
GAZIFÈRE INC. Prime Rate Forecasting Process 2017 Rate Case
 Overview A consensus forecast is used to estimate the prime rate charged by commercial banks. As the prime rate is subject to competitive pressures faced by individual lenders and is set on an individual
M onthly arket. Jan Table of Contents. Monthly Highlights
 Table of Contents Market Inventory...2 www.gaar.com Monthly Highlights January 2014 had a 12.29% increase in the number of homes sales when compared to same time last year. The average sale price of single-family
NJ Solar Market Update As of 2/29/16
 NJ Solar Market Update As of 2/29/16 Prepared by Charlie Garrison March 24, 2016 SOLAR INSTALLED CAPACITY DATA The installed solar capacity as of 2/29/16 is approximately 1,644.3 MW. Approximately 20.3
D G A G R I D A S H B O A R D : A P P L E S
 Sources: Eurostat, MSs notifications, DG Agri, Comext, Comtrade, GTA, ITC, AMI, Expert groups, Freshfel, Wapa. 000 tonnes 39 41 31 22 29 22 32 27 17 18 9 27 15 12 6 6 6 4 5 6 5 4 11 25 15 9 9 93 62 51
MARKET RATES UPDATE Paula Gold-Williams Cory Kuchinsky
 MARKET RATES UPDATE I N T R O D U C T I O N BY: Paula Gold-Williams President & Chief Executive Officer (CEO) P R E S E N T E D BY: Cory Kuchinsky Interim Vice President, Financial Services September 24,
Presentation to the Customer Service, Operations and Safety Committee OPERATIONS PERFORMANCE INDICATORS
 Presentation to the Customer Service, Operations and Safety Committee OPERATIONS PERFORMANCE INDICATORS May 19, 2005 Department of Operations 100 95 90 85 80 75 70 65 A B C D RAIL PERFORMANCE INDEX FY
History gives hope for wheat rally Be sure to reward $2 rally. By Bryce Knorr, Senior Grain Market Analyst
 History gives hope for wheat rally Be sure to reward $2 rally By Bryce Knorr, Senior Grain Market Analyst For years the wheat market stagnated waiting for a single trigger: A sharp reduction in global
STEEL IMPORTS DOWN 10% YEAR-TO-DATE Finished Import Market Share YTD at 25%
 News Release FOR IMMEDIATE RELEASE August 24, 2018 CONTACT Lisa Harrison 202.452.7115/lharrison@steel.org STEEL IMPORTS DOWN 10% YEAR-TO-DATE Finished Import Market Share YTD at 25% Washington, D.C. Based