Arctic Freshwater Flux and Change
|
|
|
- Leo Hall
- 5 years ago
- Views:
Transcription
1 Arctic Freshwater Flux and Change Daqing Yang, Doug Kane, Sveta Berezovskaya Water and Environment Research Center, Univ. of Alaska Fairbanks Main Topics Large Arctic River Streamflow Regime and Change - Review of recent analyses/results Remote Sensing Snowcover Hydrology - Evaluation of RS snow data Snow Cover Change over Northern Eurasia - Review of recent analyses of in-situ snow data Summary of Major Challenges - Gaps in arctic hydrology research

2 Large Arctic rivers & their annual discharge to the Arctic Ocean/marginal seas 5% 9% 15% 17% 11% Table 1: Physical characteristics for the five major rivers of the Arctic. River Name Drainage Area River Length Annual Discharge Mean Annual Temperature Mean Yearly Precipitation Snowfall Percent Total Res. Capacity (1, Km 2 ) (Km) (Km 3 ) ( C) (mm) (%) Km3 / # dam Ob 2,99 4, / 5 Yenisei 2,58 3, / 12 Lena 2,49 3, / 2 Yukon 1,79 3, / Mackenzie 85 5, / 2


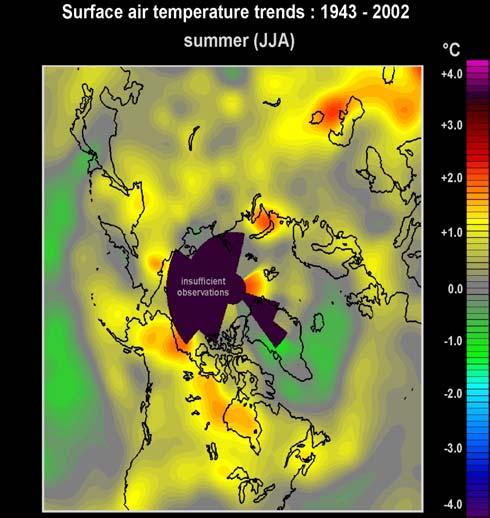
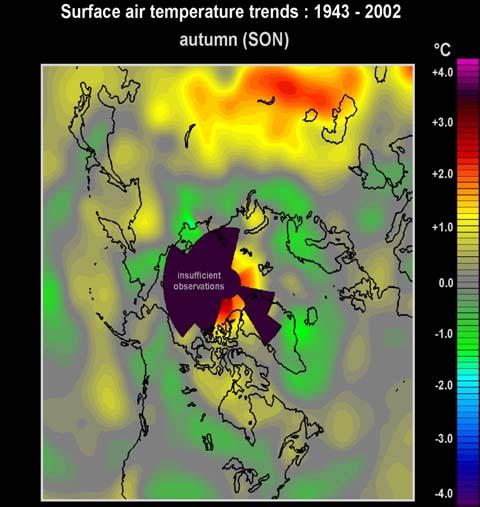
3 High Latitude Temperature Changes,


4 Water Budget and Change (P mean + ΔP) = (R mean + ΔR) + (E mean + ΔE) ± (S mean + ΔS) P precipitation, R- runoff, E evaporation, S storage Positive ΔP, ΔR, ΔE --> intensification of water cycle? FWI Science Questions Is the Arctic Freshwater Cycle Intensifying? If So, Why? What are the Implications?
5 Yearly, Monthly and Daily Streamflow Regime and Change Document discharge change
6 The Big Story Total annual discharge from the 6 largest Eurasian arctic rivers increased by about 2. km 3 /yr during (Peterson et al., Science, 22). Cold season (Oct-Apr) discharge increased by about 25-9% over past decades (Yang et al., JGR, 22; Serreze et al., JGR, 22; Ye at al., WRR, 23). What caused discharge changes???

7 Large Siberian rivers and dam locations A Reservoir J I A N M L K H G F E D C B Ob River: R / P = 134/47 =.29 Permafrost % = 7% Lena River: R / P = 216/39 =.55 Permafrost % = 9%
8 Precipitation vs. Runoff Trends over Largest Siberian Rivers (Berezovskaya, Yang & Kane, GRL, 24) precipitation and runoff anom alies Ob basin.2 Yenisei basin.2 Lena basin NCEP NCEP NCEP UDel -.2 UDel -.2 UDel.2.2 CRU -.2 CRU -.2 CRU Runoff -.2 Runoff -.2 Runoff yr yr
9 Mean Gauge-Measured (Pm) and Bias-Corrected (Pc) Precipitation, and Correction Factor (CF) for January Yang et al., 25, GRL Pm (mm) Pc (mm) CF a) Pm (mm) b) Pc (mm) c) CF Total 4827 stations located north of 45N, with data records longer-than 15 years during Similar Pm and Pc patterns corrections did not significantly change the spatial distribution. CF pattern is different from the Pm and Pc patterns, very high CF along the coasts of the Arctic Ocean.
10 Monthly basin temp climatology (top) and Temperature (c) Ob Yenisei Lena Jan Feb Mar Apr May Jun Jul Aug Sep Oct Nov Dec trend (bottom), Ob Yenisei Lena T trends (c) 2 1 Jan Feb Mar Apr May Jun Jul Aug Sep Oct Nov Dec -1-2
11 Monthly basin precip climatology (top) and trend (bottom), Precip (mm Ob Yenisei Lena Month P trend (mm 1 5 Ob Yenisei Lena Jan Feb Mar Apr May Jun Jul Aug Sep Oct Nov Dec


12 12, Monthly flow regime and change: 1, 8, 6, 4, 2, Ice cover Ice Lena river, Russian Arctic rivers (Yang et al. 22, 23) Monthly discharge (m3/s) 12, 1, 8, 6, 4, 2, Jan Feb Mar Apr May Jun Jul Aug Sep Oct Nov Dec Ice cover Ice Jan Feb Mar Apr May Jun Jul A ug S ep Oct Nov Dec Yenisei river, , A Reservoir K N M L H G J I FE D CB A 1, 8, 6, 4, 2, Ice cover Ice Ob river, Jan Feb Mar Apr May Jun Jul Aug Sep Oct Nov Dec
13 N. America Arctic rivers Mackenzie R., Yukon R., Monthly discharge (m3/s) 3, 25, 2, 15, 1, 5, 3, 25, 2, 15, 1, Ice cover Ice Ice cover Ice 5, Month
14 12, Daily discharge (m3/s 1, 8, 6, 4, 2, Lena Comparisons Daily discharge (m3/s 14, 12, 1, 8, 6, 4, 2, Yenisei of long-term mean daily discharge Daily discharge (m3/s 4, 35, 3, 25, 2, 15, 1, 5, Ob (m3/s) Julian day
15 Daily Flow Variation, Lena Basin Outlet, max
16 Daily Flow Variation, Yenisei Basin Outlet, , 199 max 16, 14, 12, 1, 1967 min 8, 6, 4, 2, Julian day Daily flow (m3/s)

17 Daily Flow Variation, Ob Basin Outlet,
18 Standard Deviation of Daily Flow, Q standard deviation (m3/s)
19

20 Discharge Records and Trends,
21 Daily Flow Regime and Change
. Discharge from rivers in HJU regions decreased. Why the trends are so different among the regions?")
22 White et al., 27 Discharge from the large Eurasian rivers increased (Peterson et al., 22). Discharge in NA arctic rivers did not change much (Woo et al., 2x; Dery et al., 25). Discharge from rivers in HJU regions decreased. Why the trends are so different among the regions? What caused discharge changes in the Arctic???
23 Remote Sensing (RS) Snow Cover Hydrology Evaluation of RS snow data, SCE and SWE Basin/region winter snow mass balance SWE = Snowfall Sublimation Basin spring water budget Runoff = SWE + Precip. Evaporation Storage


24 NOAA monthly snowcover extent / Rutgers Univ. Sept Oct Nov Dec Jan Feb Mar Apr May Jun Jul Aug
 49 52 b) Mean weekly basin snowcover percent, 1966-99 1% 9% 8% 7% 6% 5% 4% 3% 2% 1% % Ob R Yenisei R Lena R 1 4 7 1 13 16 19 22 25 28 31 34 37 4 43 46 49 52 NOAA Snowcover Grid")
25 Basin weekly snowcover extent (km 2 ) & percent (%), ,5, 3,, 2,5, 2,, 1,5, 1,, 5, a) Mean weekly basin snowcover extent, Ob Yenisei Lena Snowcover extent (Km2) b) Mean weekly basin snowcover percent, % 9% 8% 7% 6% 5% 4% 3% 2% 1% % Ob R Yenisei R Lena R NOAA Snowcover Grid Interpretation Snowcover percent (%)
26 Lena basin weekly snowcover variations 2,5, Lena basin snowcover extent, ,, 1,5, 1,, 5, min mean max ,5, 2,, 1,5, 1,, Snowcover extent (Km2) 5, 17th 19th 21th 23th 25th 27th 29th 31th 33th 35th 37th 39th 41th Weeks
27 Weekly mean basin snowcover & discharge over Siberian large watersheds, Weekly snowcover extent (Km2) 3,5, 3,, 2,5, 2,, 1,5, 1,, 5, 3,, 2,5, 2,, 1,5, 1,, 5, 2,5, a) Ob basin snowcover discharge b) Yenisei Basin Week 4, 35, 3, 25, 2, 15, 1, 5, 1, 9, 8, 7, 6, 5, 4, 3, 2, 1, 1, 2,, 1,5, c) Lena Bain 9, 8, 7, 6, 5, 1,, 4, 3, 5, 2, 1, Weekly discharge (m3/s)
28 Weekly relation of discharge vs. snowcover extent Weekly discharge (m3/s) 25, 2, 15, 1, 5, 18, 16, 14, 12, 1, 8, 6, 4, 2, y = Ln(x) R 2 =.4645 y = Ln(x) R 2 =.3245 week 17 week18 week 19 Log. (week18) Log. (week 19) Log. (week 17) y = Ln(x) R 2 = , 1,, 1,5, 2,, 2,5, 3,, y = Ln(x) R 2 =.21 week 2 week 22 Log. (week 2) Log. (week 22) y = -3744Ln(x) R 2 =.245 5, 1,, 1,5, 2,, 2,5, 3,, Ob River, Weeks Yenisei River, Weeks , 18, 16, 14, 12, 1, 8, 6, 4, 2, y = Ln(x) R 2 =.3717 week 21 week 22 Log. (week 22) Log. (week 21) y = -2421Ln(x) R 2 =.451 Lena River, Weeks , 1,, 1,5, 2,, 2,5, Weekly snowcover extent (km2)
29 Ob Basin Yenise Basin Lena Basin Snow Water 1979,Q Equivalent =44,643m 3 /s peak (SWE) 199,Q Information =157,286m 3 /s peak 1989,Q =177,429m 3 /s peak ,Q =26,286m 3 /s peak ,Q =64,771m 3 /s 2 peak ,Q =84,457m 3 /s peak Discharge (1 m 3 /s) Discharge (1 m 3 /s) Discharge (1 m 3 /s) Modified Weeks Modified Weeks Modified Weeks Discharge (1 m 3 /s) Yukon Basin 1985,Q peak =3,299m 3 /s 1978,Q peak =12,969m 3 /s Modified Weeks Discharge (1 m 3 /s) Mackenzie Basin 1992,Q peak =33,343m 3 /s 1995,Q peak =15,86m 3 /s Modified Weeks SWE ~ Discharge Basin extreme (weekly-mean) discharge (m3/s). Data source: UNH/SHI
30 14 2,SWE = 136.4mm Snow Water Equivalent (SWE) Information max ,SWE = 114.2mm max Lena basin has the ,SWE = 75.2mm max ,SWE = 97.8mm max 1998,SWE = 76.2mm max ,SWE = 19.2mm highest max winter snow pack, and Yenisei basin has the lowest. Weekly mean SWE (mm) Weekly mean SWE (mm) 2 Ob.5mm Modified Weeks Yukon 1998,SWE max = 124.7mm 1991,SWE max = 8.9mm.5mm Modified Weeks Weekly mean SWE (mm) Weekly mean SWE (mm) 14 2 Yenise.5mm Modified Weeks Mackenzie 21,SWE max = 12.6mm 1993,SWE max = 82.1mm.5mm Modified Weeks Weekly mean SWE (mm) 14 2 Lena.5mm 2. The snow pack Modified Weeks accumulate to the highest in winter, week Basin SWE interannual variation 2. For study Extreme convenience, (SSM/I) snowcover when water when equivalent SWE (SWE, <.5mm, mm), the basin is considered Data source: empty. NSIDC/UNH

31 Average of snow water equivalent (SWE), Prepared by A.N.Krenke, L.M. Kitaev
32 Basin SWE (mm) vs. weekly discharge (m3/s), Lena R., The SWE and Dicharge in Lena Basin, 1988~ SWE (mm) Discharge (1 m 3 /s) Weeks Streamflow = SWE ET?
33 Basin SWE vs. winter precip (mm), Lena R., SWE and AP (mm) SWE AP Weeks SWE = Snowfall Sublimation?
34 Basin SWE vs. winter precip (mm), Ob R., SWE and AP (mm) SWE AP Weeks
35 Snow Cover Change over Northern Eurasia Groisman, P. Ya., R. W. Knight, V. N. Razuvaev, O. N. Bulygina, and T. R. Karl, 26: State of the ground rarely used characteristic of snow cover and frozen land: Climatology and changes during the past 65 years over Northern Eurasia., J. Climate, Vol.19, 19, pp
36 Long-term mean annual number of days with snow on the ground < > 27


37 Mean snow depth for permanent snowcover period,
38 Linear trend in number of days with more than 5% snow cover for


39 Linear trend in number of days with snow cover exceeding 1cm for

40 Linear trend in number of days with snow cover exceeding 2cm during
41 Major Challenges in Arctic Hydrology Research Basin/regional water balance Quality and consistency of precipitation, snowcover (SWE), river discharge data Lack of regional/basin ET data for water budget analyses Uncertainties in storage (ground ice, glaciers, lake/reservoir storage) amount and change Hydrologic change detection and attribution Quantify and separate hydrologic response to climate change and human influence Time Scale: yearly, monthly, daily, and extreme events Spatial scale: continent, river basin, and sub-basin Gaps in arctic hydrology research Pan arctic in-situ snow data sets (snow depth, SWE and density) Validation of RS precipitation and snow data/products
COMPARISON OF FIXED & VARIABLE RATES (25 YEARS) CHARTERED BANK ADMINISTERED INTEREST RATES - PRIME BUSINESS*
 CHARTERED BANK ADMINISTERED INTEREST RATES - PRIME BUSINESS*") COMPARISON OF FIXED & VARIABLE RATES (25 YEARS) 2 Fixed Rates Variable Rates For Internal Use Only. FIXED RATES OF THE PAST 25 YEARS AVERAGE RESIDENTIAL MORTGAGE LENDING RATE - 5 YEAR* (Per cent) Year
COMPARISON OF FIXED & VARIABLE RATES (25 YEARS) 2 Fixed Rates Variable Rates For Internal Use Only. FIXED RATES OF THE PAST 25 YEARS AVERAGE RESIDENTIAL MORTGAGE LENDING RATE - 5 YEAR* (Per cent) Year
COMPARISON OF FIXED & VARIABLE RATES (25 YEARS) CHARTERED BANK ADMINISTERED INTEREST RATES - PRIME BUSINESS*
 CHARTERED BANK ADMINISTERED INTEREST RATES - PRIME BUSINESS*") COMPARISON OF FIXED & VARIABLE RATES (25 YEARS) 2 Fixed Rates Variable Rates FIXED RATES OF THE PAST 25 YEARS AVERAGE RESIDENTIAL MORTGAGE LENDING RATE - 5 YEAR* (Per cent) Year Jan Feb Mar Apr May Jun
COMPARISON OF FIXED & VARIABLE RATES (25 YEARS) 2 Fixed Rates Variable Rates FIXED RATES OF THE PAST 25 YEARS AVERAGE RESIDENTIAL MORTGAGE LENDING RATE - 5 YEAR* (Per cent) Year Jan Feb Mar Apr May Jun
Commercial-in-Confidence Ashton Old Baths Financial Model - Detailed Cashflow
 Year 0 1 2 3 4 5 6 7 8 9 10 11 12 13 Oct-16 Nov-16 Dec-16 Jan-17 Feb-17 Mar-17 Apr-17 May-17 Jun-17 Jul-17 Aug-17 Sep-17 Oct-17 2,038 2,922 4,089 4,349 6,256 7,124 8,885 8,885 8,885 8,885 8,885 8,885 9,107
Local Climatological Data Summary Aurora, Illinois
 SWS Miscellaneous Publication 98-15 STATE OF ILLINOIS DEPARTMENT OF NATURAL RESOURCES Local Climatological Data Summary Aurora, Illinois 1901-1996 Herbert Hoffman 1, Audrey A. Bryan 2 and Wayne Wendland
Climatography of the United States No
 Climate Division: CA 5 NWS Call Sign: Month (1) Min (2) Month(1) Extremes Lowest (2) Temperature ( F) Lowest Month(1) Degree s (1) Base Temp 65 Heating Cooling 100 Number of s (3) Jan 45.9 26.0 36.0 67
CCoWS. Central Coast Watershed Studies. Summary of Precipitation and Streamflow for Potrero and San Clemente Creeks in Water-Year 2007
 Central Coast Watershed Studies CCoWS Summary of Precipitation and Streamflow for Potrero and San Clemente Creeks in Water-Year 2007 Santa Lucia Preserve Monterey County, California Publication No. WI-2008-01
Climatography of the United States No
 Climate Division: WY 9 NWS Call Sign: LND Temperature ( F) Month (1) Min (2) Month(1) Extremes Lowest (2) Lowest Month(1) Degree s (1) Base Temp 65 Heating Cooling 100 Number of s (3) Jan 31.9 8.7 20.3
Climatography of the United States No
 Climate Division: MA 3 NWS Call Sign: BOS Month (1) Min (2) Month(1) Extremes Lowest (2) Temperature ( F) Lowest Month(1) Degree s (1) Base Temp 65 Heating Cooling 100 Number of s (3) 36.5 22.1 29.3 72
CCoWS. Central Coast Watershed Studies. Summary of Precipitation and Streamflow for Potrero and San Clemente Creeks in Water-Year 2008
 Central Coast Watershed Studies CCoWS Summary of Precipitation and Streamflow for Potrero and San Clemente Creeks in Water-Year 2008 Santa Lucia Preserve Monterey County, California Publication No. WI-2009-01
Appendix E Hydrology, Erosion and Sediment Transport Studies
 Appendix E Hydrology, Erosion and Sediment Transport Studies Hatch 2012/10 Appendix E1 EA Hydrology Memorandum February 2011 (Hatch. 2011a) Hatch 2012/10 Project Memo February 23, 2011 TO: Larry King FROM:
Local Climatological (Data Summary Molim, Illinois
 SWS Miscellaneous Publication 98-13 STATE OF ILLINOIS DEPARTMENT OF ENERGY AND NATURAL RESOURCES Local Climatological (Data Summary Molim, Illinois 1872-1992 by Audrey A. Bryan and Wayne Wendland Climatological
CLIMATOLOGICAL SUMMARY
 DEPARTMENT OF REGISTRATION AND EDUCATION CTATP OF ILLINOIS ILLINOIS STATE WATER SURVEY DIVISION URBANA, ILLINOIS ISWS MP-19 Archive ISWS Illinois State Water Survey )CAL CLIMATOLOGICAL DATA MP-19 LOCAL
2017 Adjusted Count Report February 12, 2018
 A statewide multi-use trail user study and volunteer data collection program 2017 Adjusted Count Report February 12, 2018 The following report includes the final adjusted infrared (IR) counter data at
PyeongChang Weather Report. (April 2017) The PyeongChang Organizing Committee for the 2018 Olympic & Paralympic Winter Games
 The PyeongChang Organizing Committee for the 2018 Olympic & Paralympic Winter Games") PyeongChang 218 Weather Report (April 217) The PyeongChang Organizing Committee for the 218 Olympic & Paralympic Winter Games Sport Planning Department Meteorology & Climate Team Contents 1. Characteristics
PyeongChang 218 Weather Report (April 217) The PyeongChang Organizing Committee for the 218 Olympic & Paralympic Winter Games Sport Planning Department Meteorology & Climate Team Contents 1. Characteristics
ANCR CRU Statistics February 2007 to December 2007
 ANCR CRU Statistics February 2007 to December 2007 o Jan/07 Feb/07* Mar/07 Apr/07 May/07 Jun/07 Jul/07 Aug/07 Sep/07 Oct/07 Nov/07 Dec/07 Total notes data from Perimeter phone system unavailable prior
Action Requested From AMWG
 Action Requested From AMWG NONE, These Two Presentations Are For Information Transfer Only The information is derived from a multi-year synthesis research effort related to existing data on flow, sediment-transport
3. Atmospheric Supply of Nitrogen to the Baltic Sea in 2009
 3. Atmospheric Supply of Nitrogen to the Baltic Sea in 2009 Nitrogen emission data, as well as the model results presented here have been approved by the 35 th Session of the Steering Body of EMEP in Geneva
Appendix E Water Supply Modeling
 Supply Modeling Modesto Irrigation District Treatment Plant Expansion Project Modeling I. Introduction The Modesto Irrigation District (MID) is situated adjacent to and north of the Tuolumne River. Over
LOCAL CLIMATOLOGICAL DATA
 ILLINOIS STATE WATER SURVEY DIVISION URBANA, ILLINOIS ISWS MP-21 Archive SWS0964 Illinois State Water Survey LOCAL CLIMATOLOGICAL DATA FDR HILLSBORO, IL. 1901-1962 LOCAL CLIMATOLOGICAL DATA 1901-1962 HILLSBORO
Design Criteria Data
 MEDFORD/JACKSON CO. OR Latitude = 42.37 N WMO No. 72597 Longitude =122.8 W Elevation = 1329 feet Period of Record = 1973 to 1996 Average Pressure = 28.61 inches Hg Design Criteria Data Mean Coincident
Design Criteria Data
 INDIANAPOLIS IN Latitude = 39.73 N WMO No. 72438 Longitude = 86.27 W Elevation = 87 feet Period of Record = 1973 to 1996 Average Pressure = 29.15 inches Hg Design Criteria Data Mean Coincident (Average)
Design Criteria Data
 DENVER/STAPLETON CO Latitude = 39.75 N WMO No. 72469 Longitude =14.8 W Elevation = 5332 feet Period of Record = 1973 to 1995 Average Pressure = 24.66 inches Hg Design Criteria Data Mean Coincident (Average)
Design Criteria Data
 BIRMINGHAM AL Latitude = 33.57 N WMO No. 72228 Longitude = 86.75 W Elevation = 63 feet Period of Record = 1973 to 1996 Average Pressure = 29.36 inches Hg Design Criteria Data Mean Coincident (Average)
Design Criteria Data
 SPRINGFLD MO Latitude = 37.23 N WMO No. 7244 Longitude = 93.38 W Elevation = 127 feet Period of Record = 1973 to 1996 Average Pressure = 28.66 inches Hg Design Criteria Data Mean Coincident (Average) Values
Kelly Redmond Regional Climatologist, Western Regional Climate Center Atmospheric Sciences Division
 Kelly Redmond Regional Climatologist, Western Regional Climate Center Atmospheric Sciences Division Climate and the Colorado and Columbia River Basins Presented at The Aspen Global Change Institute June
Solargis Report. Solar Resource Overview. Plataforma Solar de Almeria, Spain. 03 August Solargis s.r.o.
 Solargis Report Solar Resource Overview Site name: Plataforma Solar de Almeria, Spain Date of Issue: 03 August 2017 Type of Data: Daily time series (01/01/1994-31/12/2016) Customer: Solargis s.r.o. Issued
Design Criteria Data
 MIDLAND TX Latitude = 31.95 N WMO No. 72265 Longitude =2. W Elevation = 2861 feet Period of Record = 1973 to 1996 Average Pressure = 27.3 inches Hg Design Criteria Data Mean Coincident (Average) Values
Design Criteria Data
 WASHINGTON/DULLES VA Latitude = 38.95 N WMO No. 7243 Longitude = 77.45 W Elevation = 322 feet Period of Record = 1973 to 1996 Average Pressure = 29.68 inches Hg Design Criteria Data Mean Coincident (Average)
Design Criteria Data
 LANDER/HUNT WY Latitude = 42.82 N WMO No. 72576 Longitude =18.7 W Elevation = 5558 feet Period of Record = 1973 to 1996 Average Pressure = 24.44 inches Hg Design Criteria Data Mean Coincident (Average)
Design Criteria Data
 ALBUQUERQUE NM Latitude = 35.5 N WMO No. 72365 Longitude =16.6 W Elevation = 5315 feet Period of Record = 1967 to 1996 Average Pressure = 24.72 inches Hg Design Criteria Data Mean Coincident (Average)
Design Criteria Data
 OKLAHOMA CITY OK Latitude = 35.4 N WMO No. 72353 Longitude = 97.6 W Elevation = 133 feet Period of Record = 1973 to 1996 Average Pressure = 28.62 inches Hg Design Criteria Data Mean Coincident (Average)
2019 Western North Carolina Weather Calendar. Department of Atmospheric Sciences The University of North Carolina at Asheville
 209 Western North Carolina Weather Calendar Department of Atmospheric Sciences The University of North Carolina at Asheville www.atms.unca.edu 209 Western North Carolina Weather Calendar Climatological
Design Criteria Data
 BURLINGTON VT Latitude = 44.47 N WMO No. 72617 Longitude = 73.15 W Elevation = 341 feet Period of Record = 1973 to 1996 Average Pressure = 29.61 inches Hg Design Criteria Data Mean Coincident (Average)
WIM #37 was operational for the entire month of September Volume was computed using all monthly data.
 SEPTEMBER 2016 WIM Site Location WIM #37 is located on I-94 near Otsego in Wright county. The WIM is located only on the westbound (WB) side of I-94, meaning that all data mentioned in this report pertains
Design Criteria Data
 RAPID CITY SD Latitude = 44.5 N WMO No. 72662 Longitude =3. W Elevation = 3169 feet Period of Record = 1973 to 1996 Average Pressure = 26.67 inches Hg Design Criteria Data Mean Coincident (Average) Values
Design Criteria Data
 COLUMBIA SC Latitude = 33.95 N WMO No. 7231 Longitude = 81.12 W Elevation = 226 feet Period of Record = 1973 to 1996 Average Pressure = 29.8 inches Hg Design Criteria Data Mean Coincident (Average) Values
Design Criteria Data
 PHILADELPHIA PA Latitude = 39.88 N WMO No. 7248 Longitude = 75.25 W Elevation = 3 feet Period of Record = 1973 to 1996 Average Pressure = 29.98 inches Hg Design Criteria Data Mean Coincident (Average)
Design Criteria Data
 HONOLULU/OAHU HI Latitude = 21.35 N WMO No. 91182 Longitude =157.9 W Elevation = 16 feet Period of Record = 1967 to 1996 Average Pressure = 29.96 inches Hg Design Criteria Data Mean Coincident (Average)
Design Criteria Data
 MACON/LEWIS WILSON GA Latitude = 32.7 N WMO No. 72217 Longitude = 83.65 W Elevation = 361 feet Period of Record = 1973 to 1996 Average Pressure = 29.66 inches Hg Design Criteria Data Mean Coincident (Average)
Design Criteria Data
 PIERRE SD Latitude = 44.38 N WMO No. 726686 Longitude =1.2 W Elevation = 1742 feet Period of Record = 1973 to 1996 Average Pressure = 28.1 inches Hg Design Criteria Data Mean Coincident (Average) Values
Design Criteria Data
 ANCHORAGE AK Latitude = 61.17 N WMO No. 7273 Longitude =15. W Elevation = 131 feet Period of Record = 1973 to 1996 Average Pressure = 29.6 inches Hg Design Criteria Data Mean Coincident (Average) Values
Design Criteria Data
 DES MOINES IA Latitude = 41.53 N WMO No. 72546 Longitude = 93.65 W Elevation = 965 feet Period of Record = 1973 to 1996 Average Pressure = 28.96 inches Hg Design Criteria Data Mean Coincident (Average)
Design Criteria Data
 JACKSONVILLE FL Latitude = 3.5 N WMO No. 7226 Longitude = 81.7 W Elevation = 3 feet Period of Record = 1973 to 1996 Average Pressure = 3.1 inches Hg Design Criteria Data Mean Coincident (Average) Values
Design Criteria Data
 SPOKANE WA Latitude = 47.63 N WMO No. 72785 Longitude =117.5 W Elevation = 2366 feet Period of Record = 1973 to 1996 Average Pressure = 27.5 inches Hg Design Criteria Data Mean Coincident (Average) Values
Design Criteria Data
 RENO/CANNON INTL NV Latitude = 39.5 N WMO No. 72488 Longitude =119.7 W Elevation = 44 feet Period of Record = 1973 to 1996 Average Pressure = 25.57 inches Hg Design Criteria Data Mean Coincident (Average)
Design Criteria Data
 LOUISVILLE/STANDIFORD KY Latitude = 38.18 N WMO No. 72423 Longitude = 85.73 W Elevation = 489 feet Period of Record = 1973 to 1996 Average Pressure = 29.49 inches Hg Design Criteria Data Mean Coincident
Design Criteria Data
 DAYTON/JAMES M COX OH Latitude = 39.9 N WMO No. 72429 Longitude = 84.2 W Elevation = 14 feet Period of Record = 1973 to 1996 Average Pressure = 28.95 inches Hg Design Criteria Data Mean Coincident (Average)
Design Criteria Data
 LAS VEGAS/MCCARRAN NV Latitude = 36.8 N WMO No. 72386 Longitude =115.1 W Elevation = 2179 feet Period of Record = 1973 to 1996 Average Pressure = 27.67 inches Hg Design Criteria Data Mean Coincident (Average)
Design Criteria Data
 PHOENIX/SKY HARBOR AZ Latitude = 33.43 N WMO No. 72278 Longitude =112. W Elevation = 116 feet Period of Record = 1973 to 1996 Average Pressure = 28.72 inches Hg Design Criteria Data Mean Coincident (Average)
Design Criteria Data
 BOSTON/LOGAN MA Latitude = 42.37 N WMO No. 7259 Longitude = 71.3 W Elevation = 3 feet Period of Record = 1967 to 1996 Average Pressure = 29.95 inches Hg Design Criteria Data Mean Coincident (Average) Values
Design Criteria Data
 MINNEAPOLIS-ST PAUL MN Latitude = 44.88 N WMO No. 72658 Longitude = 93.22 W Elevation = 837 feet Period of Record = 1973 to 1996 Average Pressure = 29.7 inches Hg Design Criteria Data Mean Coincident (Average)
Design Criteria Data
 NEW YORK/JOHN F KENNEDY NY Latitude = 4.65 N WMO No. 74486 Longitude = 73.78 W Elevation = 23 feet Period of Record = 1973 to 1996 Average Pressure = 29.98 inches Hg Design Criteria Data Mean Coincident
Design Criteria Data
 DULUTH MN Latitude = 46.83 N WMO No. 72745 Longitude = 92.18 W Elevation = 1417 feet Period of Record = 1973 to 1996 Average Pressure = 28.43 inches Hg Design Criteria Data Mean Coincident (Average) Values
Design Criteria Data
 MINOT AFB ND Latitude = 48.42 N WMO No. 727675 Longitude =11.3 W Elevation = 1667 feet Period of Record = 1967 to 1996 Average Pressure = 28.16 inches Hg Design Criteria Data Mean Coincident (Average)
Design Criteria Data
 CHARLESTON/KANAWHA WV Latitude = 38.37 N WMO No. 72414 Longitude = 81.6 W Elevation = 981 feet Period of Record = 1973 to 1996 Average Pressure = 29. inches Hg Design Criteria Data Mean Coincident (Average)
D G A G R I D A S H B O A R D : A P P L E S
 75 79 60 56 49 74 65 59 54 42 76 63 58 53 78 55 42 43 79 44 81 63 47 83 64 59 53 48 Sources: Eurostat, MSs notifications, DG Agri, Comext, Comtrade, GTA, ITC, AMI, Expert groups, Freshfel, Wapa. 89 68
NJ Solar Market Update
 NJ Solar Market Update April 16, 20 Renewable Energy Committee Meeting Trenton, NJ Prepared by Charlie Garrison Solar Installed Capacity Data The preliminary installed solar capacity as of 3/31/ is approximately
Design Criteria Data
 CHICAGO/O HARE IL Latitude = 41.98 N WMO No. 7253 Longitude = 87.9 W Elevation = 673 feet Period of Record = 1967 to 1996 Average Pressure = 29.27 inches Hg Design Criteria Data Mean Coincident (Average)
WIM #29 was operational for the entire month of October Volume was computed using all monthly data.
 OCTOBER 2015 WIM Site Location WIM #29 is located on US 53 near Cotton in St Louis county. System Operation WIM #29 was operational for the entire month of October 2015. Volume was computed using all monthly
Design Criteria Data
 MADISON/DANE CO. RGNL WI Latitude = 43.13 N WMO No. 72641 Longitude = 89.33 W Elevation = 866 feet Period of Record = 1973 to 1996 Average Pressure = 29.5 inches Hg Design Criteria Data Mean Coincident
September 2016 Water Production & Consumption Data
 September 2016 Water Production & Consumption Data September 2016 monthly water production (288.48 AF) was lowest in at least 17 years. Monthly water production has increased slightly each month since
University of Michigan Eco-Driving Index (EDI) Latest data: October 2017
 Latest data: October 2017") University of Michigan Eco-Driving Index () http://www.ecodrivingindex.org Latest data: October 2017 Developed and issued monthly by Michael Sivak and Brandon Schoettle Sustainable Worldwide Transportation
University of Michigan Eco-Driving Index () http://www.ecodrivingindex.org Latest data: October 2017 Developed and issued monthly by Michael Sivak and Brandon Schoettle Sustainable Worldwide Transportation
2014 Meteorological and Oceanographic Summary for the Bocas del Toro Research Station. Prepared by: Steven Paton
 0 2014 Meteorological and Oceanographic Summary for the Bocas del Toro Research Station Prepared by: Steven Paton 1 Introduction This is the second of a series of yearly reports summarising the past year
April 10, Dear Customer:
 Dear Customer: April 10, Attached is the monthly water supply outlook and projected operations for Yellowtail Dam and Powerplant. If you have any questions or concerns, please feel free to call me at 406-247-7334
NEU Electric and Natural Gas Price Update
 $ / MWH Jan-11 May-11 Sep-11 Sep-12 Jan-13 Electric: Short-Term Outlook The NYMEX Northern Illinois Hub 12-month forward price at the end of August 2016 for the September 2016 to August 2017 period was
Missouri River Mainstem Reservoirs Runoff Volumes for Annual Operating Plan Studies RCC Technical Report Jy-08
 Missouri River Region Since 1953 US Army Corps of Engineers Reservoir Control Center Missouri River Region Northwestern Division Reservoir Control Center July 2008 Missouri River Basin Fort Peck Montana
ANCR CRU Statistics Februa.. to December 2007
 ANCR CRU Statistics Februa.. to December 2007 Jan/07 Feb/07* Mar/07 Apr/07 May/07 Jun/07 Jul/07 Aug/07 Sep/07 Oct/07 Nov/07 Dec/07 Total notes Answered dato from Perimeter phone system unavailable prior
Meteorology of Monteverde, Costa Rica 2005
 Meteorology of Monteverde, Costa Rica 2005 Technical Report submitted to the Monteverde Institute Andrew J. Guswa, Asst Professor, Picker Engineering Program Amy L. Rhodes, Asst Professor, Department of
D G A G R I D A S H B O A R D : A P P L E S
 Sources: Eurostat, MSs notifications, DG Agri, Comext, Comtrade, GTA, ITC, AMI, Expert groups, Freshfel, Wapa. 000 tonnes 39 41 31 22 29 22 32 27 17 18 9 27 15 12 6 6 6 4 5 6 5 4 11 25 15 9 9 93 62 51
Local Climatologicat Data Summary Chicago, Illinois
 SWS Miscellaneous Publication 98-16 STATE OF ILLINOIS DEPARTMENT OF ENERGY AND NATURAL RESOURCES and NATIONAL WEATHER SERVICE, NOAA Local Climatologicat Data Summary Chicago, Illinois 1830-1993 by Audrey
Thirty Years of Climatological Data: 1969 to 1998
 Thirty Years of Climatological Data: 1969 to 1998 NMSU's Agricultural Science Center at Farmington, New Mexico Agricultural Experiment Station Research Report 744 College of Agriculture and Home Economics
Meridian Township Range Sections Seward 5N 4W 33,34 Seward 4N 4W 4,9
 ATTACHMENT A. RUSSIAN RIVER RESERVATION OF WATER APPLICATION. Page 1 LOCATION OF PROPOSED RESERVATION OF WATER Meridian Township Range Sections Seward 5N 4W 33,34 Seward 4N 4W 4,9 Russian River is located
STATISTICS BOTSWANA ELECTRICITY GENERATION & DISTRIBUTION 2016/2 STATS BRIEF, FIRST QUARTER Copyrights Statistics Botswana 2016
 2016/2 ELECTRICITY GENERATION & DISTRIBUTION STATS BRIEF, FIRST QUARTER 2016 Copyrights Statistics Botswana 2016 Statistics Botswana. Private Bag 0024 Botswana Tel: (267) 367 1300. Fax: (267) 395 2201.
Solargis Report. Solar Resource Overview. Plataforma Solar de Almeria, Spain. 03 August Solargis s.r.o.
 Solargis Report Solar Resource Overview Site name: Plataforma Solar de Almeria, Spain Date of Issue: 03 August 2017 Type of Data: Hourly time series (01/01/1994-31/12/2016) TMY P50 (01/01/1994-31/12/2016)
All Annual Operating Plan Recipients
 To: All Annual Operating Plan Recipients From: Lower Colorado Region Boulder Canyon Operations Office River Operations Group Daniel Bunk P.O. Box 647 Boulder City, NV 896-47 Phone: 72-293-83 The operation
WIM #41 CSAH 14, MP 14.9 CROOKSTON, MINNESOTA APRIL 2014 MONTHLY REPORT
 WIM #41 CSAH 14, MP 14.9 CROOKSTON, MINNESOTA APRIL 2014 MONTHLY REPORT In order to understand the vehicle classes and groupings, the MnDOT Vehicle Classification Scheme and the Vehicle Classification
WIM #31 US 2, MP 8.0 EAST GRAND FORKS, MN JANUARY 2015 MONTHLY REPORT
 WIM #31 US 2, MP 8.0 EAST GRAND FORKS, MN JANUARY 2015 MONTHLY REPORT WIM #31 EAST GRAND FORKS MONTHLY REPORT - JANUARY 2015 WIM Site Location WIM #31 is located on US 2 at mile post 8.0, southeast of
Modeling and Comparison of Dynamics of AC and DC Coupled Remote Hybrid Power Systems
 Modeling and Comparison of Dynamics of AC and DC Coupled Remote Hybrid Power Systems Presenter: Tanjila Haque Supervisor : Dr. Tariq Iqbal Faculty of Engineering and Applied Science Memorial University
WIM #41 CSAH 14, MP 14.9 CROOKSTON, MINNESOTA MAY 2013 MONTHLY REPORT
 WIM #41 CSAH 14, MP 14.9 CROOKSTON, MINNESOTA MAY 2013 MONTHLY REPORT In order to understand the vehicle classes and groupings the Mn/DOT Vehicle Classification Scheme and the Vehicle Classification Groupings
Vunivau, Bua Province Vanua Levu, Fiji Solar Home System Design. Luis A. Vega, Ph.D.
 Vunivau, Bua Province Vanua Levu, Fiji Solar Home System Design Luis A. Vega, Ph.D. Design Approach Choose design Insolation Determine battery capacity and relationship between controller LVD and DOD Determine
NJ Solar Market Update As of 10/31/15
 NJ Solar Market Update As of 10/31/15 Prepared by Charlie Garrison Renewable Energy Committee Meeting November 10, 2015 SOLAR INSTALLED CAPACITY DATA The preliminary installed solar capacity as of 10/31/15
Revising the Historic Monthly Mean Niagara River Flow at Buffalo to Reflect Better Estimates of Maid-of-the-Mist Pool Outflows
 Revising the Historic Monthly Mean Niagara River Flow at Buffalo to Reflect Better Estimates of Maid-of-the-Mist Pool Outflows 1961-2007 Background The Niagara River flow at Buffalo is currently computed
Capacity Analysis Report. For. William E. Dunn Water Reclamation Facility 4111 Dunn Drive Palm Harbor, Florida 34683
 Capacity Analysis Report For William E. Dunn Water Reclamation Facility 4111 Dunn Drive Palm Harbor, Florida 34683 Florida Department of Environmental Protection Facility Identification No. FLA0128775
FOR IMMEDIATE RELEASE
 Article No. 7761 Available on www.roymorgan.com Roy Morgan Unemployment Profile Monday, 8 October 2018 Unemployment down to 9.4% in September off two-year high Australian employment has grown solidly over
Up and Down Months of the Stock Market
 Up and Down Months of the Stock Market 1926-2017 Positive years (66) in the stock market were not good all year long and losing years (24) were not losers throughout the year. Winning years produce losing
Flows Atlas. Compilation of instream flow & estuary inflow statistics for the Sabine and Neches River Basins and Sabine Lake
 Compilation of instream flow & estuary inflow statistics for the Sabine and Neches River Basins and Sabine Lake April 2010 FLOWS ATLAS Compilation of instream flow & estuary inflow statistics for the Sabine
SASKATOON STATION
 SRC CLIMATE REFERENCE STATION DAILY DATA REPORT SASKATOON STATION 45718 Saskatchewan 52 9' N 6 36' W 497 m asl Estab. 1963 JULY Preliminary 16 Day Temperature Degree-days Precipitation Relative Humidity
Irrigation energy efficiency How to analyse your energy costs. Nick Bullock The Energy Guys
 Irrigation energy efficiency How to analyse your energy costs Nick Bullock The Energy Guys March 2017 1 PILOT Energy Audits: Pivots AIM: data on energy use simple field data How energy efficient is system?
Total Production by Month (Acre Feet)
") Production by Month (acre-feet) 2008 2009 2010 2011 2012 2013 2014 2015 2016 January 25 339.10 228.90 249.50 297.99 243.06 327.14 247.66 212.37 February 234.00 218.80 212.10 241.52 245.82 279.08 234.16
Production by Month (acre-feet) 2008 2009 2010 2011 2012 2013 2014 2015 2016 January 25 339.10 228.90 249.50 297.99 243.06 327.14 247.66 212.37 February 234.00 218.80 212.10 241.52 245.82 279.08 234.16
Oriented Strand Board Sheathing (delivered, Los Angeles) 7/16-inch 2005 to 2009
 7/16-inch 2005 to 2009") Oriented Strand Board Sheathing (delivered, Los Angeles) 7/16-inch 2005 to 2009 OSB Sheathing (del. LA) 7/16" 2005 2006 2007 2008 2009 Average Month Price Change Price Change Price Change Price Change
Oriented Strand Board Sheathing (delivered, Los Angeles) 7/16-inch 2005 to 2009 OSB Sheathing (del. LA) 7/16" 2005 2006 2007 2008 2009 Average Month Price Change Price Change Price Change Price Change
ENVIRONMENTAL & ENGINEERING SERVICES DEPARTMENT
 CITY OF LONDON ENVIRONMENTAL & ENGINEERING SERVICES DEPARTMENT WASTEWATER TREATMENT OPERATIONS VAUXHALL WASTEWATER TREATMENT PLANT 2013 ANNUAL REPORT FEBRUARY 2014 Vauxhall Wastewater Treatment Plant 2013
Meter Insights for Downtown Store
 Meter Insights for Downtown Store Commodity: Analysis Period: Prepared for: Report Date: Electricity 1 December 2013-31 December 2014 Arlington Mills 12 February 2015 Electricity use over the analysis
Presentation to the Customer Service, Operations and Safety Committee OPERATIONS PERFORMANCE INDICATORS
 Presentation to the Customer Service, Operations and Safety Committee OPERATIONS PERFORMANCE INDICATORS May 19, 2005 Department of Operations 100 95 90 85 80 75 70 65 A B C D RAIL PERFORMANCE INDEX FY
Results of annual simulation
 2 x Vitosol 100-FM SVKF Total gross surface area:4,46 m² Azimuth: 0 Incl.: 30 160 Liters/Day 50 C Gas-fired boiler 26 kw Vitocell 100-B Vol : 250 l Results of annual simulation Installed collector power:
NJ Solar Market Update As of 6/30/15
 NJ Solar Market Update As of 6/30/ Prepared by Charlie Garrison July 17, 20 SOLAR INSTALLED CAPACITY DATA The preliminary installed solar capacity as of 6/30/ is approximately 1,500.7 MW. Approximately
ELECTRICITY GENERATION AND DISTRIBUTION. Electricity Generation & Distribution Q2,
 Contact Statistician: Otsile Chelenyane Industry Statistics Unit Email: ochelenyane@statsbots.org.bw Tel: (+267) 367 1300; Ext. 333 ELECTRICITY GENERATION AND DISTRIBUTION Stats Brief, Quarter 2, 2018
August ATR Monthly Report
 August ATR Monthly Report Minnesota Department of Transportation Office of Transportation Data and Analysis August 2011 Introduction The purpose of this report is to examine monthly traffic trends on
D G A G R I D A S H B O A R D : T O M A T O E S Last update: EU AVG PRICES
 tonnes Weightedaverages by volume of production per MS Ongoing adjustments on weights by variety group 000 tonnes D G A G R I D A S H B O A R D : T O M A T O E S Last update: 20.04.2018 EU AVG PRICES MS
Impact of the Barrier Layer on the variability of the Southeastern Arabian sea
 Impact of the Barrier Layer on the variability of the Southeastern Arabian sea Masson S., J.-J. Luo, T. Yamagata, Frontier Research Center for global Change, JAMSTEC EU collaborators (France-Germany-Italy)
FOR IMMEDIATE RELEASE
 Article No. 7845 Available on www.roymorgan.com Roy Morgan Unemployment Profile Friday, 18 January 2019 Unemployment in December is 9.7% and under-employment is 8.8% FOR IMMEDIATE RELEASE Australian unemployment