2017 Meteorological Summary for the Galeta Marine Island Laboratory. Prepared by: Steven Paton
|
|
|
- Marion McDaniel
- 5 years ago
- Views:
Transcription

1 Meteorological Summary for the Galeta Marine Island Laboratory Prepared by: Steven Paton

2 1 Introduction This is the 5 th in a series of yearly reports summarising the past year s Smithsonian Tropical Research Institute s Physical Monitoring Program at the Galeta Island Marine Laboratory. This report is not meant to be exhaustive in its coverage in that it summarizes only some of the most important or interesting parameters available. Any comments on how future yearly summaries could be improved would be appreciated. Additional copies of this report, reports from previous years, and downloadable data from the Galeta and other research locations, can be obtained from: Setting Installed in 1974, the Galeta Island Marine Laboratory physical monitoring station ( , ) is located approximately 6 km North East of the city of Colon. Established in the 1960 s, The Galeta Island Marine Laboratory was the first marine laboratory established by STRI on the Caribbean coast of Panama. It was the site of an extensive study of the biological effects of a major oil spill. The station receives an average of mm of rain per year. The meteorological year is divided into two parts: a pronounced dry season (approximately from mid-december to the end of April), and a wet season (May to mid-december). On average, only 217mm of rain falls during the dry season. Relative humidity, air temperature, solar radiation, wind speed and direction, sea surface temperature (SST) all show marked seasonal differences. All data are collected using electronic sensors. Sensors exist (or have existed) at five locations: Upstream, DownStream, and MidReef sensor platforms, on top of the laboratory building and a small tower on the Pier. This report summarises the following data:

")

 SST Pier Tower")
3 2 Pier Relative humidity Air temperature Rainfall Wind speed and direction Solar radiation SST Laboratory Solar radiation ( ) Rainfall ( ) MidReef Upstream Wind speed and direction Air temperature SST Downstream Solar Radiation ( ) SST Pier Tower Mid-Reef site UpStream Site DownStream Site

 and manual Rain gauge (right) The daily rainfall data for 2017 are")
 for the period 1974 to 2016.")
.")
4 3 Rainfall Rainfall was originally collected by a Stevens Type A water level recorder with intake located on top of the laboratory building. Rainfall were recorded to paper charts and digitized at 1-hour intervals. In 1991 a digital encoder was added which recorded 1mm rainfall increments. In 2002, an electronic tipping bucket was installed on the pier. This device records rainfall in 0.254mm increments. Data were also manually recorded weekly using a plastic rain gauge. Stevens Type A water level recorder with intake located on top of the laboratory building Tipping Bucket (left) and manual Rain gauge (right) The daily rainfall data for 2017 are shown on page 6. Page 7-8 show the monthly totals for The graph on the same page compares this year s monthly totals with the average monthly totals (±SD) for the period 1974 to Page 8 shows yearly rainfall totals for all years since Time series graph and frequency histograms are presented for these data. Pages 9 and 10 show an analysis of rainfall events (storms). For convenience, and again somewhat arbitrarily, I have defined a storm as any continuous period of rain separated by at least an hour from any other rainfall. Since this analysis required the timing of rainfall events, tipping bucket data were used. As a result, the absolute size of rainfall events should be considered only as an estimate since tipping buckets will tend to underestimate the size of storms - larger storms


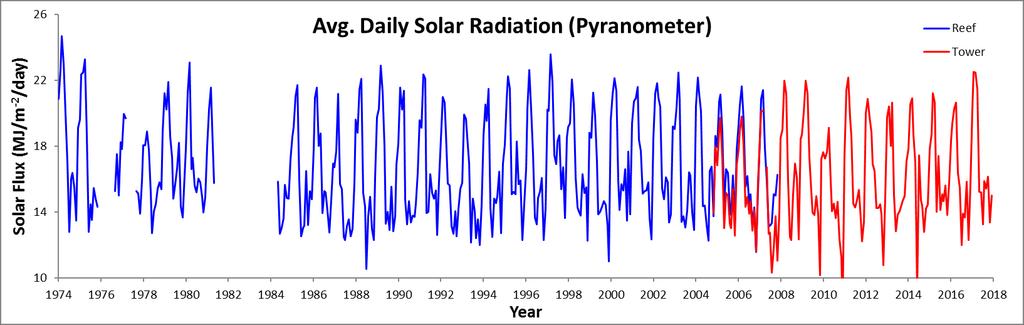
5 4 will be more underestimated than smaller ones. Keeping this in mind, the tables and graphs compare maximum and average storm size, and average storm duration per month for the period 2004 to 2016 versus Relative Humidity Relative humidity data have been collected with a number of electronic Temperature/Humidity sensors: Viasala HMP 35, Viasala HMP45, and most recently Campbell Sci. CS215. Sensors have been located on the small tower on the Pier. Data are recorded at 15- minute intervals by dataloggers controlling the sensors. The average monthly relative humidity data are shown in tabular and graphical forms on page 11. Air Temperature Shaded air temperature data is currently recorded using a Campbell Sci. CS215 electronic temperature/humidity sensor located on the small tower on the Pier. Data are recorded at 15- minute intervals by dataloggers controlling the sensors. Data have also been collected at the Up Stream station using a Hydrolab RT-125 Marine Thermometer connected to a datalogger and recorded at 1-hour intervals. Daily Max/min temperatures were also collected using Taylor Instruments Max/Min thermometers. The monthly average temperatures from the electronic sensors are shown in tabular and graphical form on pages Solar Radiation From 1974 until 1981, Global solar radiation was measured on the roof of the laboratory building using a Moll-Gorczynski-type pyranometer. The sensor was destroyed by lightning in 1981 and in 1984 a Li-Cor LI200SZ pyranometer sensor was deployed at the reef flat Down Stream location. Sensors were connected to dataloggers and the data were recorded hourly. Since 2004, Global solar radiation has been measured on the Pier tower using Li-Cor LI200SB pyranometers attached to a datalogger recording total (MJm - ²), maximum and minimum (J m - ² s -1 ) radiation at 15-minute intervals. Page 15 shows the Daily Global Radiation values. Pages 16 and 17 show total monthly Global Radiation.

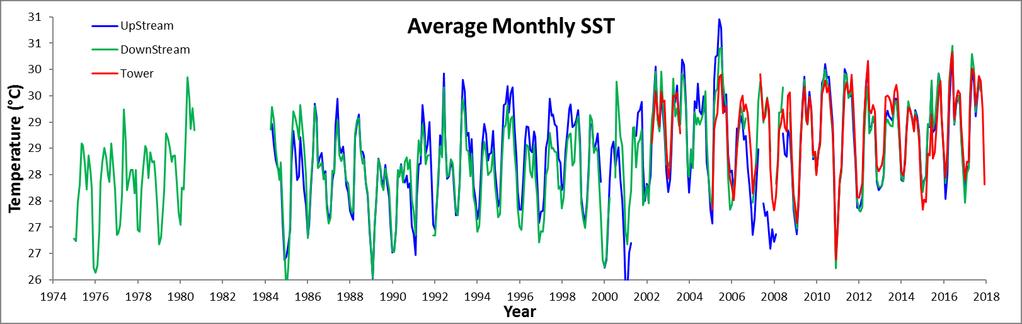
6 5 Wind Speed and Direction Wind speed and direction were originally recorded at the MidReef site using an MRI Mechanical Weather Station model 1072 connected to a datalogger and recording at 1-hour intervals. Anemometers were located on two cement pylons, located 10m from each other, and 3m above the surface of the reef flat. From 1983 to 1992 and Omnidata sensors were used. These were replaced in 1992 with RM Young anemometers. Beginning in April of 2002, 15-minute interval average, maximum and minimum wind speed plus average wind direction have also been recorded by a Model Young Anemometer located on top of the Pier tower. Page 18 shows average and maximum daily wind speeds from the Young Anemometer located at the top of the Pier tower. Page 19 shows daily average wind direction. The angles indicated in the table and graph on this page represent the direction from which the wind was predominately blowing on a given day. Page 20 shows the monthly average wind speed and monthly average directions for the year. Upstream Anemometer Pier Tower Anemometer Water Temperature Water temperature was collected at the UpStream, DownStream and Tower Base sites. Reef site temperatures were inicially measured using Hydrolab RT-125 thermometers connected to dataloggers. In 2007 these sensors were replaced with self-contained Hobo U22 Water Temperature Pro v2 probes. Temperatures were recorded hourly; changed to every 15 minutes in SST at the base of the Tower has always been measured using Campbell Sci. Model 107 temperature sensors at 15-minute intervals. Monthly average SST data are shown on pages Times Series Graphs showing the 2017 daily (Pages 25-6) and monthly averages for the entire period of record (Pages 27-9) for Relative Humidity, Air Temperature, Rainfall, Wind Speed, Solar Radiation and Water Temperature. More details about how data were collected between 1974 and 1988 can be found in: Cubit et al, Meteorology and hydrography of a shoaling reef flat on the Caribbean coast of Panama. Coral Reefs 8:59-66.
7 6 Daily Patterns Pages 30 and 31 show the daily patterns for Relative Humidity, Air Temperature, Rainfall, Wind Speed and Solar Radiation.
8 Daily Rainfall (mm) Jan. Feb. Mar. Apr. May June July Aug. Sep. Oct. Nov. Dec Data in Green are from the ACP Limon Bay station
9 8 Monthly Rainfall (mm) Year Jan Feb Mar Apr May June July Aug Sep Oct Nov Dec Total mean sd min max Note: Data in Purple estimated from ACP station Limon
10 9 Yearly Rainfall (mm) Year Rain Year Rain Year Rain
11 10 Storm Analysis Max. Rainfall per Storm (mm) Storm Duration (min.) Mean S.D. Mean S.D. January February March April May June July August September October November December Av. Rainfall per Storm (mm) Mean S.D. January February March April May June July August September October November December
12 11
13 12 Relative Humidity (%) Year Jan Feb Mar Apr May June July Aug Sep Oct Nov Dec mean sd min max * A sensor change at the end of 2008 resulted in significantly higher readings. Summary statistics only include data from 2009 onwards.
14 13 Monthly Average of Daily Maximum & Minimum Temperatures ( C) Monthly Average Temperature Year Jan Feb Mar Apr May June July Aug Sep Oct Nov Dec mean sd min max
15 14 Monthly Average of Daily Maximum Temperature Year Jan Feb Mar Apr May June July Aug Sep Oct Nov Dec mean sd min max
16 15 Monthly Average of Daily Minimum Temperature Year Jan Feb Mar Apr May June July Aug Sep Oct Nov Dec mean sd min max

17 Daily Total Radiation (MJ m -2 day -1 ) Jan. Feb. Mar. Apr. May June July Aug. Sep. Oct. Nov. Dec
18 17 Monthly Average Total Daily Solar Radiation (MJ m -2 day -1 ) Year Jan Feb Mar Apr May June July Aug Sep Oct Nov Dec mean sd min max Data in Purple are from sensors on Laboratory Roof, Data in Green are from sensors on Reef Station. Other data are from the Pier Tower
19 18

20 Daily Average Wind Speed (km/h) Pier Tower Jan. Feb. Mar. Apr. May June July Aug. Sep. Oct. Nov. Dec. Avg Max Avg Max Avg Max Avg Max Avg Max Avg Max Avg Max Avg Max Avg Max Avg Max Avg Max Avg Max
21 Average Daily Wind Direction ( ) Pier Tower Jan. Feb. Mar. Apr. May June July Aug. Sep. Oct. Nov. Dec
22 -21- Average Monthly Wind Speed (km/h) and Direction ( ) Long-term Av Reef Tower Reef Tower Avg. Max. Avg. Max. Dir. Avg. Avg. Máx. Dir. January February March April May June July August September October November December
23 -22- Average Monthly SST (C) Reef, Upstream Year Jan Feb Mar Apr May June July Aug Sep Oct Nov Dec mean sd min max
24 -23- Average Monthly SST (C) Reef, Downstream Year Jan Feb Mar Apr May June July Aug Sep Oct Nov Dec mean sd min max
25 -24- Average Monthly SST (C) Tower Year Jan Feb Mar Apr May June July Aug Sep Oct Nov Dec mean sd min max Note: Data in green are suspect. Unexpectedly low compared to long-term relationships with other stations
26 -25-

27 -26- Time Series Daily 2017

28 -27- Time Series Daily 2017

29 -28- Time Series - Monthly

30 -29- Time Series - Monthly
31 Minute Average Air Temperature - Temperature (C) Time (hours) 15-Minute Average Relative Humidity - 90 Humidity (%) Time (hours) Rainfall (% of total/15-min interval) 1.8 Percent Time (hours)
32 Minute Average Solar Radiation - 2 Solar Radiation (J/m /s) Time (hours) 15-Minute Average Wind Speed - Wind Speed (km/h) Time (hours)
2016 Meteorological Summary for the Galeta Marine Island Laboratory. Prepared by: Steven Paton
 0 2016 Meteorological Summary for the Galeta Marine Island Laboratory Prepared by: Steven Paton 1 Introduction This is the fourth in a series of yearly reports summarising the past year s Smithsonian Tropical
2017 Meteorological and Oceanographic Summary for the Bocas del Toro Research Station. Prepared by: Steven Paton
 0 2017 Meteorological and Oceanographic Summary for the Bocas del Toro Research Station Prepared by: Steven Paton 1 Introduction This is the 5 th of a series of yearly reports summarising the past year
2016 Meteorological and Oceanographic Summary for the Bocas del Toro Research Station. Prepared by: Steven Paton
 0 2016 Meteorological and Oceanographic Summary for the Bocas del Toro Research Station Prepared by: Steven Paton 1 Introduction This is the forth of a series of yearly reports summarising the past year
2014 Meteorological and Oceanographic Summary for the Bocas del Toro Research Station. Prepared by: Steven Paton
 0 2014 Meteorological and Oceanographic Summary for the Bocas del Toro Research Station Prepared by: Steven Paton 1 Introduction This is the second of a series of yearly reports summarising the past year
2016 Meteorological and Hydrological Summary for Barro Colorado Island. Prepared by: Steven Paton
 0 2016 Meteorological and Hydrological Summary for Barro Colorado Island Prepared by: Steven Paton 1 Introduction This is the seventh of a series of yearly reports summarising the past year s Smithsonian
2017 Meteorological and Hydrological Summary for Barro Colorado Island. Prepared by: Steven Paton
 0 2017 Meteorological and Hydrological Summary for Barro Colorado Island Prepared by: Steven Paton 1 Introduction This is the seventh of a series of yearly reports summarising the past year s Smithsonian
Meteorology of Monteverde, Costa Rica 2005
 Meteorology of Monteverde, Costa Rica 2005 Technical Report submitted to the Monteverde Institute Andrew J. Guswa, Asst Professor, Picker Engineering Program Amy L. Rhodes, Asst Professor, Department of
Total Production by Month (Acre Feet)
") Production by Month (acre-feet) 2008 2009 2010 2011 2012 2013 2014 2015 2016 January 25 339.10 228.90 249.50 297.99 243.06 327.14 247.66 212.37 February 234.00 218.80 212.10 241.52 245.82 279.08 234.16
Production by Month (acre-feet) 2008 2009 2010 2011 2012 2013 2014 2015 2016 January 25 339.10 228.90 249.50 297.99 243.06 327.14 247.66 212.37 February 234.00 218.80 212.10 241.52 245.82 279.08 234.16
September 2016 Water Production & Consumption Data
 September 2016 Water Production & Consumption Data September 2016 monthly water production (288.48 AF) was lowest in at least 17 years. Monthly water production has increased slightly each month since
Year to Date Summary. Average and Median Sale Prices
 A Publication of RMLS, The Source for Real Estate Statistics in Your Community Residential Review: Southwest Washington September 2018 Reporting Period September Residential Highlights Southwest Washington
COMPARISON OF FIXED & VARIABLE RATES (25 YEARS) CHARTERED BANK ADMINISTERED INTEREST RATES - PRIME BUSINESS*
 CHARTERED BANK ADMINISTERED INTEREST RATES - PRIME BUSINESS*") COMPARISON OF FIXED & VARIABLE RATES (25 YEARS) 2 Fixed Rates Variable Rates For Internal Use Only. FIXED RATES OF THE PAST 25 YEARS AVERAGE RESIDENTIAL MORTGAGE LENDING RATE - 5 YEAR* (Per cent) Year
COMPARISON OF FIXED & VARIABLE RATES (25 YEARS) 2 Fixed Rates Variable Rates For Internal Use Only. FIXED RATES OF THE PAST 25 YEARS AVERAGE RESIDENTIAL MORTGAGE LENDING RATE - 5 YEAR* (Per cent) Year
COMPARISON OF FIXED & VARIABLE RATES (25 YEARS) CHARTERED BANK ADMINISTERED INTEREST RATES - PRIME BUSINESS*
 CHARTERED BANK ADMINISTERED INTEREST RATES - PRIME BUSINESS*") COMPARISON OF FIXED & VARIABLE RATES (25 YEARS) 2 Fixed Rates Variable Rates FIXED RATES OF THE PAST 25 YEARS AVERAGE RESIDENTIAL MORTGAGE LENDING RATE - 5 YEAR* (Per cent) Year Jan Feb Mar Apr May Jun
COMPARISON OF FIXED & VARIABLE RATES (25 YEARS) 2 Fixed Rates Variable Rates FIXED RATES OF THE PAST 25 YEARS AVERAGE RESIDENTIAL MORTGAGE LENDING RATE - 5 YEAR* (Per cent) Year Jan Feb Mar Apr May Jun
GAZIFÈRE INC. Prime Rate Forecasting Process 2017 Rate Case
 Overview A consensus forecast is used to estimate the prime rate charged by commercial banks. As the prime rate is subject to competitive pressures faced by individual lenders and is set on an individual
Thirty Years of Climatological Data: 1969 to 1998
 Thirty Years of Climatological Data: 1969 to 1998 NMSU's Agricultural Science Center at Farmington, New Mexico Agricultural Experiment Station Research Report 744 College of Agriculture and Home Economics
LOCAL CLIMATOLOGICAL DATA
 ILLINOIS STATE WATER SURVEY DIVISION URBANA, ILLINOIS ISWS MP-21 Archive SWS0964 Illinois State Water Survey LOCAL CLIMATOLOGICAL DATA FDR HILLSBORO, IL. 1901-1962 LOCAL CLIMATOLOGICAL DATA 1901-1962 HILLSBORO
CCoWS. Central Coast Watershed Studies. Summary of Precipitation and Streamflow for Potrero and San Clemente Creeks in Water-Year 2008
 Central Coast Watershed Studies CCoWS Summary of Precipitation and Streamflow for Potrero and San Clemente Creeks in Water-Year 2008 Santa Lucia Preserve Monterey County, California Publication No. WI-2009-01
CLIMATOLOGICAL SUMMARY
 DEPARTMENT OF REGISTRATION AND EDUCATION CTATP OF ILLINOIS ILLINOIS STATE WATER SURVEY DIVISION URBANA, ILLINOIS ISWS MP-19 Archive ISWS Illinois State Water Survey )CAL CLIMATOLOGICAL DATA MP-19 LOCAL
Design Criteria Data
 OKLAHOMA CITY OK Latitude = 35.4 N WMO No. 72353 Longitude = 97.6 W Elevation = 133 feet Period of Record = 1973 to 1996 Average Pressure = 28.62 inches Hg Design Criteria Data Mean Coincident (Average)
Design Criteria Data
 MEDFORD/JACKSON CO. OR Latitude = 42.37 N WMO No. 72597 Longitude =122.8 W Elevation = 1329 feet Period of Record = 1973 to 1996 Average Pressure = 28.61 inches Hg Design Criteria Data Mean Coincident
Design Criteria Data
 DES MOINES IA Latitude = 41.53 N WMO No. 72546 Longitude = 93.65 W Elevation = 965 feet Period of Record = 1973 to 1996 Average Pressure = 28.96 inches Hg Design Criteria Data Mean Coincident (Average)
Design Criteria Data
 RAPID CITY SD Latitude = 44.5 N WMO No. 72662 Longitude =3. W Elevation = 3169 feet Period of Record = 1973 to 1996 Average Pressure = 26.67 inches Hg Design Criteria Data Mean Coincident (Average) Values
Design Criteria Data
 PIERRE SD Latitude = 44.38 N WMO No. 726686 Longitude =1.2 W Elevation = 1742 feet Period of Record = 1973 to 1996 Average Pressure = 28.1 inches Hg Design Criteria Data Mean Coincident (Average) Values
Design Criteria Data
 LAS VEGAS/MCCARRAN NV Latitude = 36.8 N WMO No. 72386 Longitude =115.1 W Elevation = 2179 feet Period of Record = 1973 to 1996 Average Pressure = 27.67 inches Hg Design Criteria Data Mean Coincident (Average)
Design Criteria Data
 PHOENIX/SKY HARBOR AZ Latitude = 33.43 N WMO No. 72278 Longitude =112. W Elevation = 116 feet Period of Record = 1973 to 1996 Average Pressure = 28.72 inches Hg Design Criteria Data Mean Coincident (Average)
Design Criteria Data
 BIRMINGHAM AL Latitude = 33.57 N WMO No. 72228 Longitude = 86.75 W Elevation = 63 feet Period of Record = 1973 to 1996 Average Pressure = 29.36 inches Hg Design Criteria Data Mean Coincident (Average)
Field Test Results of Green Roofs, Cool Roofs, and Conventional Roofs CNY Engineering Expo Oncenter, Syracuse, NY November 9, 2015
 Field Test Results of Green Roofs, Cool Roofs, and Conventional Roofs CNY Engineering Expo Oncenter, Syracuse, NY November 9, 2015 Hugh I. Henderson, Jr. P.E CDH Energy Corp. Cazenovia, NY Project Goals
Commercial-in-Confidence Ashton Old Baths Financial Model - Detailed Cashflow
 Year 0 1 2 3 4 5 6 7 8 9 10 11 12 13 Oct-16 Nov-16 Dec-16 Jan-17 Feb-17 Mar-17 Apr-17 May-17 Jun-17 Jul-17 Aug-17 Sep-17 Oct-17 2,038 2,922 4,089 4,349 6,256 7,124 8,885 8,885 8,885 8,885 8,885 8,885 9,107
M onthly arket. Jan Table of Contents. Monthly Highlights
 Table of Contents Market Inventory...2 www.gaar.com Monthly Highlights January 2014 had a 12.29% increase in the number of homes sales when compared to same time last year. The average sale price of single-family
Date Event or Holiday :Sun, 2:Mon North Orchard Delong Preschool North Orchard Delong Preschool
 2018 6 1 1:Sun, 2:Mon 2018-2019 Date Event or Holiday Aug 16 Board Meeting 6pm Aug 23 Open House June 2018 July 2018 August 2018 Sep 06 Board Meeting 6pm Su M Tu W Th F Sa Su M Tu W Th F Sa Su M Tu W Th
Design Criteria Data
 BURLINGTON VT Latitude = 44.47 N WMO No. 72617 Longitude = 73.15 W Elevation = 341 feet Period of Record = 1973 to 1996 Average Pressure = 29.61 inches Hg Design Criteria Data Mean Coincident (Average)
Design Criteria Data
 COLUMBIA SC Latitude = 33.95 N WMO No. 7231 Longitude = 81.12 W Elevation = 226 feet Period of Record = 1973 to 1996 Average Pressure = 29.8 inches Hg Design Criteria Data Mean Coincident (Average) Values
Design Criteria Data
 PHILADELPHIA PA Latitude = 39.88 N WMO No. 7248 Longitude = 75.25 W Elevation = 3 feet Period of Record = 1973 to 1996 Average Pressure = 29.98 inches Hg Design Criteria Data Mean Coincident (Average)
Design Criteria Data
 HONOLULU/OAHU HI Latitude = 21.35 N WMO No. 91182 Longitude =157.9 W Elevation = 16 feet Period of Record = 1967 to 1996 Average Pressure = 29.96 inches Hg Design Criteria Data Mean Coincident (Average)
Design Criteria Data
 MACON/LEWIS WILSON GA Latitude = 32.7 N WMO No. 72217 Longitude = 83.65 W Elevation = 361 feet Period of Record = 1973 to 1996 Average Pressure = 29.66 inches Hg Design Criteria Data Mean Coincident (Average)
Design Criteria Data
 INDIANAPOLIS IN Latitude = 39.73 N WMO No. 72438 Longitude = 86.27 W Elevation = 87 feet Period of Record = 1973 to 1996 Average Pressure = 29.15 inches Hg Design Criteria Data Mean Coincident (Average)
Design Criteria Data
 ANCHORAGE AK Latitude = 61.17 N WMO No. 7273 Longitude =15. W Elevation = 131 feet Period of Record = 1973 to 1996 Average Pressure = 29.6 inches Hg Design Criteria Data Mean Coincident (Average) Values
Design Criteria Data
 DENVER/STAPLETON CO Latitude = 39.75 N WMO No. 72469 Longitude =14.8 W Elevation = 5332 feet Period of Record = 1973 to 1995 Average Pressure = 24.66 inches Hg Design Criteria Data Mean Coincident (Average)
Meter Insights for Downtown Store
 Meter Insights for Downtown Store Commodity: Analysis Period: Prepared for: Report Date: Electricity 1 December 2013-31 December 2014 Arlington Mills 12 February 2015 Electricity use over the analysis
Design Criteria Data
 JACKSONVILLE FL Latitude = 3.5 N WMO No. 7226 Longitude = 81.7 W Elevation = 3 feet Period of Record = 1973 to 1996 Average Pressure = 3.1 inches Hg Design Criteria Data Mean Coincident (Average) Values
Design Criteria Data
 SPOKANE WA Latitude = 47.63 N WMO No. 72785 Longitude =117.5 W Elevation = 2366 feet Period of Record = 1973 to 1996 Average Pressure = 27.5 inches Hg Design Criteria Data Mean Coincident (Average) Values
Design Criteria Data
 LOUISVILLE/STANDIFORD KY Latitude = 38.18 N WMO No. 72423 Longitude = 85.73 W Elevation = 489 feet Period of Record = 1973 to 1996 Average Pressure = 29.49 inches Hg Design Criteria Data Mean Coincident
Design Criteria Data
 DAYTON/JAMES M COX OH Latitude = 39.9 N WMO No. 72429 Longitude = 84.2 W Elevation = 14 feet Period of Record = 1973 to 1996 Average Pressure = 28.95 inches Hg Design Criteria Data Mean Coincident (Average)
Design Criteria Data
 SPRINGFLD MO Latitude = 37.23 N WMO No. 7244 Longitude = 93.38 W Elevation = 127 feet Period of Record = 1973 to 1996 Average Pressure = 28.66 inches Hg Design Criteria Data Mean Coincident (Average) Values
Wheat Marketing Situation
 Wheat Marketing Situation Prepared by: Darrell L. Hanavan Executive Director Colorado Wheat Administrative Committee If you would like to receive an email when this report is updated, email gmostek@coloradowheat.org
Design Criteria Data
 BOSTON/LOGAN MA Latitude = 42.37 N WMO No. 7259 Longitude = 71.3 W Elevation = 3 feet Period of Record = 1967 to 1996 Average Pressure = 29.95 inches Hg Design Criteria Data Mean Coincident (Average) Values
2017 Adjusted Count Report February 12, 2018
 A statewide multi-use trail user study and volunteer data collection program 2017 Adjusted Count Report February 12, 2018 The following report includes the final adjusted infrared (IR) counter data at
Design Criteria Data
 MINNEAPOLIS-ST PAUL MN Latitude = 44.88 N WMO No. 72658 Longitude = 93.22 W Elevation = 837 feet Period of Record = 1973 to 1996 Average Pressure = 29.7 inches Hg Design Criteria Data Mean Coincident (Average)
Design Criteria Data
 MIDLAND TX Latitude = 31.95 N WMO No. 72265 Longitude =2. W Elevation = 2861 feet Period of Record = 1973 to 1996 Average Pressure = 27.3 inches Hg Design Criteria Data Mean Coincident (Average) Values
Design Criteria Data
 NEW YORK/JOHN F KENNEDY NY Latitude = 4.65 N WMO No. 74486 Longitude = 73.78 W Elevation = 23 feet Period of Record = 1973 to 1996 Average Pressure = 29.98 inches Hg Design Criteria Data Mean Coincident
Design Criteria Data
 WASHINGTON/DULLES VA Latitude = 38.95 N WMO No. 7243 Longitude = 77.45 W Elevation = 322 feet Period of Record = 1973 to 1996 Average Pressure = 29.68 inches Hg Design Criteria Data Mean Coincident (Average)
Design Criteria Data
 LANDER/HUNT WY Latitude = 42.82 N WMO No. 72576 Longitude =18.7 W Elevation = 5558 feet Period of Record = 1973 to 1996 Average Pressure = 24.44 inches Hg Design Criteria Data Mean Coincident (Average)
Design Criteria Data
 ALBUQUERQUE NM Latitude = 35.5 N WMO No. 72365 Longitude =16.6 W Elevation = 5315 feet Period of Record = 1967 to 1996 Average Pressure = 24.72 inches Hg Design Criteria Data Mean Coincident (Average)
Design Criteria Data
 DULUTH MN Latitude = 46.83 N WMO No. 72745 Longitude = 92.18 W Elevation = 1417 feet Period of Record = 1973 to 1996 Average Pressure = 28.43 inches Hg Design Criteria Data Mean Coincident (Average) Values
Design Criteria Data
 MINOT AFB ND Latitude = 48.42 N WMO No. 727675 Longitude =11.3 W Elevation = 1667 feet Period of Record = 1967 to 1996 Average Pressure = 28.16 inches Hg Design Criteria Data Mean Coincident (Average)
WIM #37 was operational for the entire month of September Volume was computed using all monthly data.
 SEPTEMBER 2016 WIM Site Location WIM #37 is located on I-94 near Otsego in Wright county. The WIM is located only on the westbound (WB) side of I-94, meaning that all data mentioned in this report pertains
Design Criteria Data
 CHARLESTON/KANAWHA WV Latitude = 38.37 N WMO No. 72414 Longitude = 81.6 W Elevation = 981 feet Period of Record = 1973 to 1996 Average Pressure = 29. inches Hg Design Criteria Data Mean Coincident (Average)
CCoWS. Central Coast Watershed Studies. Summary of Precipitation and Streamflow for Potrero and San Clemente Creeks in Water-Year 2007
 Central Coast Watershed Studies CCoWS Summary of Precipitation and Streamflow for Potrero and San Clemente Creeks in Water-Year 2007 Santa Lucia Preserve Monterey County, California Publication No. WI-2008-01
FOR IMMEDIATE RELEASE
 Article No. 7845 Available on www.roymorgan.com Roy Morgan Unemployment Profile Friday, 18 January 2019 Unemployment in December is 9.7% and under-employment is 8.8% FOR IMMEDIATE RELEASE Australian unemployment
Design Criteria Data
 CHICAGO/O HARE IL Latitude = 41.98 N WMO No. 7253 Longitude = 87.9 W Elevation = 673 feet Period of Record = 1967 to 1996 Average Pressure = 29.27 inches Hg Design Criteria Data Mean Coincident (Average)
Determination of Monthly Means of Daily Solar Radiation and its Variability: A Summary (continued)
") Introduction Section 5.3 MONTHLY MEANS OF DAILY SOLAR RADIATION AND ITS VARIABILITY R.E. Schulze, M. Maharaj and R.D. Chapman The maps and statistics of solar radiation in this Section supersede the ones
Introduction Section 5.3 MONTHLY MEANS OF DAILY SOLAR RADIATION AND ITS VARIABILITY R.E. Schulze, M. Maharaj and R.D. Chapman The maps and statistics of solar radiation in this Section supersede the ones
The Peoples Gas Light and Coke Company
 History of Gas Charges Due to the Operation of Rider 2 (Cents per Therm) Factors for Transportation Customers (Riders FST, SST, P, CFY and AGG) Non- Total Standby Standby Aggregation Commodity Commodity
Design Criteria Data
 MADISON/DANE CO. RGNL WI Latitude = 43.13 N WMO No. 72641 Longitude = 89.33 W Elevation = 866 feet Period of Record = 1973 to 1996 Average Pressure = 29.5 inches Hg Design Criteria Data Mean Coincident
Design Criteria Data
 RENO/CANNON INTL NV Latitude = 39.5 N WMO No. 72488 Longitude =119.7 W Elevation = 44 feet Period of Record = 1973 to 1996 Average Pressure = 25.57 inches Hg Design Criteria Data Mean Coincident (Average)
FOR IMMEDIATE RELEASE
 Article No. 7761 Available on www.roymorgan.com Roy Morgan Unemployment Profile Monday, 8 October 2018 Unemployment down to 9.4% in September off two-year high Australian employment has grown solidly over
Inventory Levels - All Prices. Inventory Levels - By Price Range
 Inventory Levels - All Prices Idaho Falls Bonneville Total 7-Apr-17 154 111 265 6-Apr-18 113 91 204-23% Inventory Levels - By Price Range 7-Apr-17 6-Apr-18 0-100,000 36 10 100,001-125,000 13 9 125,001-150,000
NJ Solar Market Update
 NJ Solar Market Update April 16, 20 Renewable Energy Committee Meeting Trenton, NJ Prepared by Charlie Garrison Solar Installed Capacity Data The preliminary installed solar capacity as of 3/31/ is approximately
Inventory Levels - All Prices. Inventory Levels - By Price Range
 Inventory Levels - All Prices Idaho Falls Bonneville Total 3-Mar-17 152 108 260 2-Mar-18 109 78 187-28% Inventory Levels - By Price Range 3-Mar-17 2-Mar-18 0-100,000 41 6 100,001-125,000 19 8 125,001-150,000
NJ Solar Market Update As of 6/30/15
 NJ Solar Market Update As of 6/30/ Prepared by Charlie Garrison July 17, 20 SOLAR INSTALLED CAPACITY DATA The preliminary installed solar capacity as of 6/30/ is approximately 1,500.7 MW. Approximately
D G A G R I D A S H B O A R D : A P P L E S
 75 79 60 56 49 74 65 59 54 42 76 63 58 53 78 55 42 43 79 44 81 63 47 83 64 59 53 48 Sources: Eurostat, MSs notifications, DG Agri, Comext, Comtrade, GTA, ITC, AMI, Expert groups, Freshfel, Wapa. 89 68
August 2018 MLS Statistical Report
 January February March April May June July August Septem October Novem Decem August 218 MLS Statistical Report Total Sales Overall, sales are down 3%; however, total volume sold is up 7% and Median Sale
FOR IMMEDIATE RELEASE
 Article No. 5842 Available on www.roymorgan.com Roy Morgan Unemployment Profile Thursday, 2 October 2014 Unemployment climbs to 9.9% in September as full-time work lowest since October 2011; 2.2 million
ANCR CRU Statistics February 2007 to December 2007
 ANCR CRU Statistics February 2007 to December 2007 o Jan/07 Feb/07* Mar/07 Apr/07 May/07 Jun/07 Jul/07 Aug/07 Sep/07 Oct/07 Nov/07 Dec/07 Total notes data from Perimeter phone system unavailable prior
Inventory Levels - All Prices. Inventory Levels - By Price Range
 Inventory Levels - All Prices Idaho Falls Bonneville Total 3-Nov-17 198 128 326 2-Nov-18 155 134 289-11% Inventory Levels - By Price Range 3-Nov-17 2-Nov-18 0-100,000 17 11 100,001-125,000 15 9 125,001-150,000
2019 Western North Carolina Weather Calendar. Department of Atmospheric Sciences The University of North Carolina at Asheville
 209 Western North Carolina Weather Calendar Department of Atmospheric Sciences The University of North Carolina at Asheville www.atms.unca.edu 209 Western North Carolina Weather Calendar Climatological
Algebra II Pacing Guide
 Unit 13: Exploring a Business Venture (10 days) 8 May 13 - May 24 n/a MISD Pacing Guide Date Range Unit 01: Introduction to Functions in 15 Aug. 21 - Sept. 11 Sept. 12 Unit 02: Absolute Value Functions,,
Local Climatological (Data Summary Molim, Illinois
 SWS Miscellaneous Publication 98-13 STATE OF ILLINOIS DEPARTMENT OF ENERGY AND NATURAL RESOURCES Local Climatological (Data Summary Molim, Illinois 1872-1992 by Audrey A. Bryan and Wayne Wendland Climatological
Operational Overview. Operational Forum, 24 th March 2010
 Operational Overview Operational Forum, 24 th March 21 Weather Weather February 21 The cold weather continued throughout February with all but one day being colder than the 17-year seasonal normal CWV.
Action Requested From AMWG
 Action Requested From AMWG NONE, These Two Presentations Are For Information Transfer Only The information is derived from a multi-year synthesis research effort related to existing data on flow, sediment-transport
FOR IMMEDIATE RELEASE
 Article No. 7353 Available on www.roymorgan.com Roy Morgan Unemployment Profile Wednesday, 11 October 2017 2.498 million Australians (18.9%) now unemployed or under-employed In September 1.202 million
Presented by Eric Englert Puget Sound Energy September 11, 2002
 Results from PSE s First Year of Time of Use Program Presented by Eric Englert Puget Sound Energy September 11, 2002 Puget Sound Energy Overview 973,489 Total Electric Customers 908,949 are AMR Capable
Regulation Update. Operating Committee September 12, PJM 2017
 Regulation Update Operating Committee September 12, 2017 Regulation Market Clearing Price *Data up to Aug 22 2 Mileage Ratio Mileage Ratio has increased since the new signal implementation Larger Utilization
TABLE C-43. Manufacturers' new and unfilled orders, {Amounts in millions of dollars] Nondurable. Capital goods. Total. goods.
![TABLE C-43. Manufacturers' new and unfilled orders, {Amounts in millions of dollars] Nondurable. Capital goods. Total. goods.](/thumbs/93/112603708.jpg "TABLE C-43. Manufacturers' new and unfilled orders, {Amounts in millions of dollars] Nondurable. Capital goods. Total. goods.") TABLE C-43. Manufacturers' new and unfilled orders, -74 {Amounts in millions of dollars] New orders t, I960. 27, 559 26, 903 30,672 30,115 31,086 33,005 35,322 37,952 41, 803 45, 944 46,763 50, 243 53,
TABLE C-43. Manufacturers' new and unfilled orders, -74 {Amounts in millions of dollars] New orders t, I960. 27, 559 26, 903 30,672 30,115 31,086 33,005 35,322 37,952 41, 803 45, 944 46,763 50, 243 53,
SODANKYLÄ GEOPHYSICAL OBSERVATORY PUBLICATIONS. N o. 97 MAGNETIC RESULTS SO D A N K Y L Ä JOHANN ES KULTIMA TERO RAITA
 SODANKYLÄ GEOPHYSICAL OBSERVATORY PUBLICATIONS N o. 9 MAGNETIC RESULTS SO D A N K Y L Ä 0 JOHANN ES KULTIMA TERO RAITA OULU 05 Editor: Johannes Kultima Sodankylä Geophysical Observatory FIN-9900 SODANKYLÄ,
Price Category Breakdown - February 2010
 SINGLE FAMILY RESIDENTIAL BREAKDOWN ruary 21 ruary Sales and Average Price Increase Annually TORONTO - Wednesday, March 3, 21 7.3 % 24.6 % 1.8 % 7.3%.2%.1 % Greater Toronto REALTORS reported 7,291 sales
Digitized for FRASER Federal Reserve Bank of St. Louis. Per cent. P Total reported (000) ^D-)>oCL
 ^D-)>oCL") statistical FEDERAL release RESERVE ^D-)>oCL For immedia < t4 6 relea I s February 13, 1968 AUTOM3BILE LOANS BY MAJOR SALES FINANCE COMPANIES IN THE FOURTH QlJARTP^HE PROPORTION OF 3 YEAR NEW CAR CONTRACTS
statistical FEDERAL release RESERVE ^D-)>oCL For immedia < t4 6 relea I s February 13, 1968 AUTOM3BILE LOANS BY MAJOR SALES FINANCE COMPANIES IN THE FOURTH QlJARTP^HE PROPORTION OF 3 YEAR NEW CAR CONTRACTS
Appendix E Water Supply Modeling
 Supply Modeling Modesto Irrigation District Treatment Plant Expansion Project Modeling I. Introduction The Modesto Irrigation District (MID) is situated adjacent to and north of the Tuolumne River. Over
Crane Inspection Log. Mailing Address: P.O. Box Tulsa, OK Phone: (918) Fax: (918)
 Fax: (918)") 999978000 Crane Inspection Log Mailing Address: P.O. Box 581510 Tulsa, OK 74158-1510 Physical Address: 4707 North Mingo Road Tulsa, OK 74117-5904 Phone: (918) 836-0463 Fax: (918) 834-5979 www.autocrane.com
999978000 Crane Inspection Log Mailing Address: P.O. Box 581510 Tulsa, OK 74158-1510 Physical Address: 4707 North Mingo Road Tulsa, OK 74117-5904 Phone: (918) 836-0463 Fax: (918) 834-5979 www.autocrane.com
increase of over four per cent compared to the average of $409,058 reported in January 2010.
 SINGLE FAMILY RESIDENTIAL BREAKDOWN uary 211 26.8 % 1.7 % 7.%.4%.1 % Good Start to 211 TORONTO - February 4, 211 Greater Toronto REALTORS reported 4,337 transactions through the TorontoMLS system in uary
FOR IMMEDIATE RELEASE
 Article No. 6928 Available on www.roymorgan.com Roy Morgan Unemployment Profile Wednesday, 17 August 2016 Australian real unemployment jumps to 10.5% (up 0.9%) in July during post-election uncertainty
IOWA MOLD TOOLING CO., INC. BOX 189, GARNER, IA TEL: IMT PART NUMBER
 CRANE LOG CALENDAR YEAR CRANE MODEL Daily Inspections Weekly Inspections Monthly Inspections Lubrication Record Maintenance Record Damage & Repair Record Modification Record Reference Specifications CRANE
FOR IMMEDIATE RELEASE
 Article No. 7433 Available on www.roymorgan.com Roy Morgan Unemployment Profile Friday, 12 January 2018 2.6m Australians unemployed or under-employed in December The latest data for the Roy Morgan employment
Units of Instruction MISD Pacing Guide Days Date Range Test Date
 MISD Pacing Guide Date Range Test Date Introduction: Processes of Investigations (1 day) Aug. 21 Unit 01: Matter (12 days) Aug. 22-Sept. 7 Sep. 10 Unit 02: Atomic Structure and the Periodic Table (15 days)
NEU Electric and Natural Gas Price Update
 $ / MWH Jan-11 May-11 Sep-11 Sep-12 Jan-13 Electric: Short-Term Outlook The NYMEX Northern Illinois Hub 12-month forward price at the end of August 2016 for the September 2016 to August 2017 period was
TECHNICAL SERVICE BULLETIN
 TECHNICAL SERVICE BULLETIN To: Minuteman Dealers and Customers From: Minuteman Technical Support Date: 1/12/2011 Subject: TSB for the KIT # K-FRSPEEDSWT. For the FR17115, FR17220, FR20115 and FR20220 models.
SASKATOON STATION
 SRC CLIMATE REFERENCE STATION DAILY DATA REPORT SASKATOON STATION 45718 Saskatchewan 52 9' N 6 36' W 497 m asl Estab. 1963 JULY Preliminary 16 Day Temperature Degree-days Precipitation Relative Humidity
Monthly Market Detail - June 2018 Single Family Homes Miami-Dade County
 ly Market Detail - June 218 Summary Statistics June 218 June 217 Paid in Cash 1,335 1,346 -.8% 286 33-5.6% $355, $335, 6.% Average Sale Price Dollar Volume $598,494 $57,82 18.% $799. Million $682.5 Million
Monthly Market Detail - June 2018 Townhouses and Condos Miami-Dade County
 ly Market Detail - June 218 Summary Statistics June 218 June 217 Paid in Cash 1,257 1,323-5.% 657 682-3.7% $24, $235, 2.1% Average Sale Price Dollar Volume $439,546 $384,319 14.4% $552.5 Million $58.5
Summary Statistics. Closed Sales. Paid in Cash. Median Sale Price. Average Sale Price. Dollar Volume. Median Percent of Original List Price Received
 ly Market Detail - May 218 Summary Statistics May 218 May 217 Paid in Cash 1,667 1,647 1.2% 888 943-5.8% $168, $159, 5.7% Average Sale Price Dollar Volume $231,288 $21,944 9.6% $385.6 Million $347.4 Million
Up and Down Months of the Stock Market
 Up and Down Months of the Stock Market 1926-2017 Positive years (66) in the stock market were not good all year long and losing years (24) were not losers throughout the year. Winning years produce losing
TRANSPACIFIC CUSTOMER ADVISORY Implementation of New BAF Formula Effective January 01, 2019
 December 7, 2018 TRANSPACIFIC CUSTOMER ADVISORY Implementation of New BAF Formula Effective January 01, 2019 Dear Valued Customer, Bunker is one of the important cost components for a container shipping