Elizabeth River Crossings Study June 2008
|
|
|
- Alannah Murphy
- 5 years ago
- Views:
Transcription


1 Elizabeth River Crossings Study June 2008 T08-07
2 HAMPTON ROADS METROPOLITAN PLANNING ORGANIZATION Chesapeake Poquoson * Clifton E. Hayes, Jr. * Charles W. Burgess, Jr. Gloucester County Portsmouth * Lane B. Ramsey * Douglas L. Smith Hampton Suffolk * Randall A. Gilliland * Selena Cuffee-Glenn Isle Of Wight County Virginia Beach * Stan D. Clark * Louis R. Jones James City County Williamsburg * Bruce C. Goodson * Jackson C. Tuttle, Ii Newport News York County * Joe S. Frank * James O. McReynolds Norfolk * Paul D. Fraim Hampton Roads Planning District Commission * Dwight L. Farmer, Executive Director/Secretary Transportation District Commission Of Hampton Roads * Michael S. Townes, President/Chief Executive Officer Virginia Department Of Transportation * Dennis W. Heuer, District Administrator - Hampton Roads District Williamsburg Area Transport * Mark D. Rickards, Executive Director Federal Highway Administration Robert Fonseca-Martinez, Division Administrator - Virginia Division Federal Transit Administration Letitia A. Thompson, Regional Administrator, Region 3 Federal Aviation Administration Terry Page, Manager, Washington Airports District Office Virginia Department Of Aviation Randall P. Burdette, Director Virginia Port Authority Jerry A. Bridges, Executive Director *Voting Member PROJECT STAFF Dwight L. Farmer Camelia Ravanbakht Robert B. Case Andy C. Pickard Marla K. Frye Robert C. Jacobs Michael R. Long Christopher W. Vaigneur Executive Director/Secretary HRMPO Deputy Executive Director Principal Transportation Engineer Senior Transportation Engineer Administrative Assistant General Services Manager Assistant General Services Manager Reprographics Coordinator

3 ELIZABETH RIVER CROSSINGS STUDY This report was included in the Work Program for Fiscal Year , which was approved by the Commission and the Metropolitan Planning Organization at their meetings of March 21, PREPARED BY HAMPTON ROADS METROPOLITAN PLANNING ORGANIZATION JUNE 2008 T08-07
4 REPORT DOCUMENTATION TITLE REPORT DATE Elizabeth River Crossings Study June 2008 AUTHOR Andy Pickard, PE, AICP GRANT/SPONSORING AGENCY VDOT / FHWA ORGANIZATION NAME, ADDRESS AND TELEPHONE Hampton Roads Metropolitan Planning Organization 723 Woodlake Drive Chesapeake, Virginia (757) ABSTRACT The City of Portsmouth requested a comprehensive study to identify the present and long-term (2030) demand for crossing the Elizabeth River between the Midtown Tunnel and the High Rise Bridge. An estimate of the latent crossing demand in the study area and the ability of present and proposed facilities to accommodate this demand are reviewed. Two alternative crossings not included in the region s 2030 Long-Range Transportation Plan were analyzed. Public transportation, bicycle, and pedestrian modes for crossing this portion of the Elizabeth River were also reviewed. ACKNOWLEDGEMENTS Prepared in cooperation with the U.S. Department of Transportation (USDOT), the Federal Highway Administration (FHWA), and the Virginia Department of Transportation (VDOT). The contents of this report reflect the views of the Hampton Roads MPO. The Commission is responsible for the facts and the accuracy of the data presented herein. The contents do not necessarily reflect the official views or policies of the FHWA, VDOT, or the Commission. This report does not constitute a standard, specification, or regulation. FHWA or VDOT acceptance of this report as evidence of fulfillment of the objectives of this planning study does not constitute endorsement/approval of the need for any recommended improvements nor does it constitute approval of their location and design or a commitment to fund any such improvements. Additional project level environmental impact assessments and/or studies of alternatives may be necessary. ii
5 TABLE OF CONTENTS EXECUTIVE SUMMARY.....v STUDY AREA 1 HISTORY...2 BRIDGE AND TUNNEL SPECIFICATIONS.2 The Jordan Bridge 2 SOCIOECONOMIC DATA..5 DEMAND FOR THE CROSSINGS....6 EVALUATION OF ALTERNATIVE CROSSINGS...7 Alternative A: Creation of A New Loop Road 10 Alternative B: Widening of Military Highway..15 Comparison of Alternatives...19 MODEL SENSITIVITY TO TOLLS..21 PUBLIC TRANSPORTATION.. 24 Existing Bus and Ferry..24 Light Rail Corridors...26 BICYCLE AND PEDESTRIAN FACILITIES...27 ADDITIONAL RESOURCES 28 APPENDICES Appendix A. Development of Demand Quantities.30 Appendix B. Converting Among 2000, 2004, and 2007 Dollars iii
6 MAPS, FIGURES AND TABLES MAPS Map 1. Elizabeth River Crossings Study Area...1 Map 2. Recent Traffic Volumes and Congestion...4 Map 3. Areas of Region..5 Map Long-Range Transportation Plan Projects in Study Area.. 8 Map LRP Traffic Volumes and Congestion Map 6. Alternative A: Creation of New Loop Road...11 Map Alternative A Traffic Volumes and Congestion..14 Map 8. Alternative B: Widen Military Highway. 16 Map Alternative B Traffic Volumes and Congestion Map 10. Existing Public Transportation. 25 FIGURES Figure 1. Timeline of Crossings of the Elizabeth River Study Area 2 Figure 2. Summary of Bridge and Tunnel Specifications..3 Figure 3. Comparison of 2030 Average Weekday Volumes..19 Figure 4. Comparison of 2030 Volume to Capacity Ratio.. 20 Figure 5. Difference in 2030 Volume Relative to $0.60 Toll on Jordan Bridge for Alternative A Figure 6. Difference in 2030 Volume Relative to $0.60 Toll on Gilmerton Bridge for Alternative B Figure 7. Boardings for HRT Routes..26 Figure 8. Sidewalks on the Jordan and Gilmerton Bridges...27 TABLES Table 1. Population and Employment for Areas of Region... 6 Table 2. Estimated Demand for the Elizabeth River Crossings...6 Table 3. Toll Details of MPO Package of Toll Projects...10 Table 4. Change in 2030 Average Weekday Volume With Alternative A. 13 Table 5. Change in 2030 Average Weekday Volume With Alternative B.17 Table 6. Change in 2030 Volume Per Ten Cent Increase in Toll.. 23 Table 7. Elasticity of 2030 Volumes.. 23 Table 8. Summary of Bicycle and Pedestrian Facilities.. 28 iv
7 EXECUTIVE SUMMARY The Elizabeth River corridor between the Midtown Tunnel on the north and the High Rise Bridge (I-64) on the south currently serves over a quarter-million vehicle trip crossings each weekday. It boasts the tunnel with the highest weekday usage of the six tunnels in the region (the Downtown Tunnel), three of the region s five interstates (I-64, I-264, and I-464), one of the region s four toll facilities (Jordan Bridge), and one of the region s two commuter ferries (Elizabeth River Ferry). 1 Unfortunately, four of the five crossings are also currently severely congested and the Jordan Bridge has a weight restriction of only three tons. Figure I. Elizabeth River Crossings Study Area 1: Midtown Tunnel (U.S. Route 58) 2: Downtown Tunnel (Interstate 264) 3: Jordan Bridge (State Route 337) 4: Gilmerton Bridge (U.S. Route 13) 5: High Rise Bridge (Interstate 64) Service across this portion of the Elizabeth River began with rowboat crossings in Ferry service then continued until 1955 and started up again in Highway crossings began with the construction of the Jordan Bridge in 1928, with new crossings being added every ten to fifteen years through Since 1987, no additional crossings have been constructed. The region s 2030 Long-Range Transportation Plan 1 Interstates: I-64, I-264, I-464, I-564, and I-664. Toll facilities: Jordan Bridge, Coleman Bridge, Chesapeake Bay Bridge Tunnel, Chesapeake Expressway. Commuter ferries: Elizabeth River Ferry and Jamestown-Scotland Ferry. 2 Source: HRT staff and article Ferries Have Long Run the Elizabeth River, The Virginian Pilot, Oc. 6, v
8 includes an expansion of the Midtown Tunnel. Though the date of construction of the expansion is uncertain, one can be sure that the expansion will follow a gap greatly exceeding the historical trend of adding crossing capacity every ten to fifteen years. Socioeconomic projections indicate that the area to the east of the Elizabeth River crossings has an expected growth between 2000 and 2030 of 177,000 in population and 102,000 in employment. The area to the west has an expected growth between 2000 and 2030 of 106,000 in population and 53,000 in employment. This is an indication that the crossings of the Elizabeth River corridor will continue to see increased pressure as population and employment grow on either side of the crossings. The demand for the crossings measures how many vehicles per day would like to use the given facility. This information can be useful for better placing future capacity improvements at locations where people want to travel. This differs from the forecast volume in that the forecast is an estimate of the number of vehicles that will use the given facility under actual capacity and toll conditions. There is a total growth in demand (desired, as opposed to actual trips) across this corridor of 79,000 vehicles each day between 2007 and The demand for individual facilities tracks the traffic volume, with the highest demand being for the Downtown Tunnel and the lowest being for the Jordan Bridge. The largest growth in demand between 2007 and 2030 is expected for the High Rise Bridge with an increase of 29,000 more vehicles, followed by the Downtown Tunnel with an increase of 24,000. Two alternative locations for capacity expansions were evaluated for the year 2030 as a part of this study. Both alternatives assume the projects in the region s 2030 Long- Range Transportation Plan are in place. See Maps I, II, and III. The alternatives evaluated were: Alternative A: Creation of a partial downtown loop from the Midtown Tunnel to I- 464 via the MLK Freeway and a new Jordan Bridge with tolls. 3 Alternative B: A widening of Military Highway to six through lanes from Battlefield Blvd to Bowers Hill, with tolls on the Gilmerton Bridge. 4 This alternative assumes that the Jordan Bridge is no longer in service. 3 Assumes a fixed toll of $0.60 in year 2007 dollars across the improved Jordan Bridge in the interest of including an extended analysis of one toll rate scenario. Further analysis would be required to determine an acceptable rate given the cost of each project and striking a balance between toll rate and use of the facility. 4 Assumes a fixed toll of $0.60 in year 2007 dollars across the improved Gilmerton Bridge in the interest of including an extended analysis of one toll rate scenario. Further analysis would be required to determine an acceptable rate given the cost of each project and striking a balance between toll rate and use of the facility. vi
9 Map I Long-Range Transportation Plan Projects in Study Area vii
10 Map II. Elizabeth River Crossings Study Alternative A: Creation of a New Loop Road from I-264 to I-464 viii
11 Map III. Elizabeth River Crossings Study Alternative B: Widen Military Highway and Assume Jordan Bridge Is No Longer in Service ix
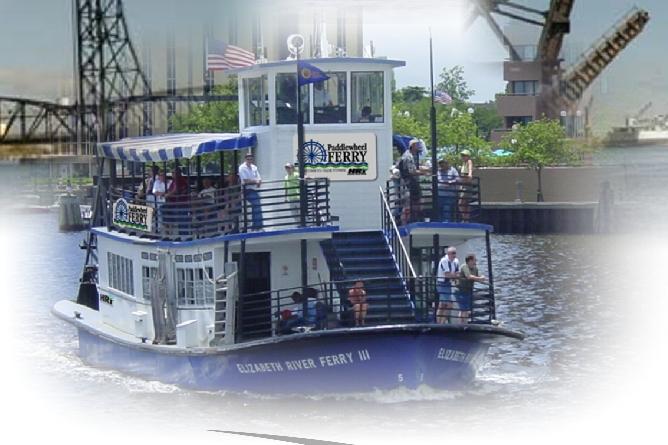
12 Figures II and III on the following pages show a summary of the impact on traffic volumes and volume to capacity ratios of Alternatives A and B. More total vehicle trips are served with Alternative A in comparison to Alternative B (277,000 versus 224,000) and in comparison to the 2030 Long-Range Transportation Plan (277,000 versus 274,000). Alternative A also has a significant impact on the Downtown Tunnel, reducing its volume by 17,000 vehicles per day and reducing its v/c ratio to below This is due to the significant quantity of traffic (56,000) attracted to the new four-lane replacement for the Jordan Bridge as part of the new limited-access loop road from I- 264 to I-464. The most significant impact of Alternative B is the better quality of traffic flow on the Gilmerton Bridge, as the quantity of traffic actually declines across the bridge with the assumption of a fixed $0.60 toll (year 2007 dollars). Alternative B has a minor impact on the Downtown Tunnel, reducing its volume by 4,000 vehicles per day but leaving the tunnel over capacity. Future studies that may further evaluate the previously described two alternatives should include an evaluation of transit service as a complement to the added vehicle capacity. As already noted, public transportation has had a role in the crossing of the Elizabeth River since Until the summer of 2008 there were four Hampton Roads Transit services for crossing the Elizabeth River in the study area (three bus routes and a ferry). Boardings for these routes were analyzed from FY2003 to FY The combined total boardings for the subject routes grew from 793,000 in FY03 to 1,025,000 in FY07, representing an annual growth rate of 6.6%. In the summer of 2008, an additional two commuter bus routes were added in the study area (routes 962 and 967). There are currently limited options for crossing the Elizabeth River via bicycle or on foot. Only two of the five crossings in the study area have any accommodations for pedestrians. The Jordan Bridge and Gilmerton Bridge have sidewalks on one side of each bridge (the north side). No toll is collected at the Jordan Bridge from bicyclists or pedestrians. These bridges, however, do not have bicycle facilities leading to the bridges. Transit can also serve to assist bicyclists and pedestrians in their travels. All of HRT s buses, except for the replica trolleys, have bicycle racks. In addition, the ferry between downtown Portsmouth and downtown Norfolk serves the needs of both pedestrians and bicyclists. 5 Boarding totals are for the entire route, not just persons using HRT service to cross the Elizabeth River. x
13 Figure II. Comparison of 2030 Average Weekday Volumes Totals: 2030 LRP: 274, ERCS Alt A: 277, ERCS Alt B: 224,000 xi
14 Figure III. Comparison of 2030 Volume to Capacity Ratio xii
15 STUDY AREA This study is focused on the crossings of the Elizabeth River from the Midtown Tunnel on the north to the High Rise Bridge (I-64) on the south. The existing facilities included in this area include, from north to south (numbers refer to Map 1 below): 1: Midtown Tunnel (U.S. Route 58) 2: Downtown Tunnel (Interstate 264) 3: Jordan Bridge (State Route 337) 4: Gilmerton Bridge (U.S. Route 13) 5: High Rise Bridge (Interstate 64) The corridor boasts the tunnel (the Downtown Tunnel) with the highest weekday usage of the six tunnels in the region, three of the region s five interstates (I-64, I-264, and I- 464), one of the region s four toll facilities (Jordan Bridge), and one of the region s two commuter ferries (Elizabeth River Ferry). 6 Map 1. Elizabeth River Crossings Study Area base_scale_arrow3.jpg 6 Interstates: I-64, I-264, I-464, I-564, and I-664. Toll facilities: Jordan Bridge, Coleman Bridge, Chesapeake Bay Bridge Tunnel, Chesapeake Expressway. Commuter ferries: Elizabeth River Ferry and Jamestown-Scotland Ferry. 1
16 HISTORY A timeline of the construction of crossings in the study area is presented in Figure 1. It began with rowboat crossings in Ferry service then continued until 1955 and started up again in Highway crossings began with the construction of the Jordan Bridge in 1928, with new crossings being added every ten to fifteen years through Since 1987, no additional crossings have been constructed. The region s 2030 Long- Range Transportation Plan includes an expansion of the Midtown Tunnel. Though the date of construction of the expansion is uncertain, one can be sure that the expansion will follow a gap greatly exceeding the historical trend of adding crossing capacity every ten to fifteen years. Figure 1. Timeline of Elizabeth River Study Area Crossings High rise Bridge (1972) Midtown Tunnel (1962) Downtown Tunnel (1952) second tunnel (1987) Gilmerton Bridge (1938) Jordan Bridge (1928) Ferry (began in 1636 as a rowboat) ferry (con't.) BRIDGE AND TUNNEL SPECIFICATIONS A summary of the characteristics of each bridge and tunnel in the study area is included in Figure 2 on the following page. Over 260,000 vehicles crossed the river on an average weekday in Most of these vehicles experienced significant congestion at the peak hour, with four of the five crossings having severe congestion. 8 Map 2 shows the level-of-service based on the most recent counts available. The Jordan Bridge The Jordan Bridge is a unique facility among the highway crossings in the study area. It is the oldest movable span bridge in Virginia, having been built in With this age comes a significant weight limit of three tons and a sufficiency rating of 4 (on a scale of 1 to 100). Three tons is not a very high threshold; many large SUV s approach or can exceed this weight. 9 In addition to its weight restrictions, the Jordan Bridge is unique as it is the only one of the four toll facilities in the region that does not accept EZ-Pass. Instead, tolls are collected manually at a toll booth, increasing the time it takes to cross the bridge Source: Source: HRT staff and article Ferries Have Long Run the Elizabeth River, The Virginian Pilot, Oc. 6, Severe congestion is considered level-of-service E and F in this study. 9 As an example, a 2008 Chevrolet Tahoe 4x4 has a curb weight of 5,527 pounds. Curb weight is the weight of the vehicle without occupants or payload. 10 Observations indicate vehicles are processed at a rate of every 5 to 6 seconds during the peak period. 2

 # EXISTING LANES 2 BRIDGE TYPE Movable bascule WT LIMIT 3 tons SUFFICIENCY RATING 4 PED FACILITIES Y")
 ; 20 tons (ST trucks) SUFFICIENCY RATING 3 PED FACILITIES Y")
17 Figure 2. Summary of Bridge and Tunnel Specifications MIDTOWN TUNNEL YEAR BUILT 1962 # EXISTING LANES 2 BRIDGE TYPE na WT LIMIT no limit SUFFICIENCY RATING na PED FACILITIES N TOLL N EXISTING WEEKDAY VOL. 41,000 EXISTING LOS F DOWNTOWN TUNNEL YEAR BUILT 1952 # EXISTING LANES 4 BRIDGE TYPE na WT LIMIT no limit SUFFICIENCY RATING na PED FACILITIES N TOLL N EXISTING WEEKDAY VOL. 101,000 EXISTING LOS F JORDAN BRIDGE YEAR BUILT 1928 (oldest movable span bridge in state) # EXISTING LANES 2 BRIDGE TYPE Movable bascule WT LIMIT 3 tons SUFFICIENCY RATING 4 PED FACILITIES Y TOLL $0.75 for two-axle veh EXISTING WEEKDAY VOL. 7,200 EXISTING LOS C GILMERTON BRIDGE YEAR BUILT 1938 # EXISTING LANES 4 BRIDGE TYPE Movable bascule WT LIMIT 14 tons (SU trucks) ; 20 tons (ST trucks) SUFFICIENCY RATING 3 PED FACILITIES Y TOLL N EXISTING WEEKDAY VOL. 36,000 EXISTING LOS E HIGH-RISE BRIDGE YEAR BUILT 1972 # EXISTING LANES 4 BRIDGE TYPE Movable bascule WT LIMIT no limit SUFFICIENCY RATING 61 PED FACILITIES N TOLL N EXISTING WEEKDAY VOL. 76,000 EXISTING LOS F Sources: "Hampton Roads Regional Bridge Study", HRPDC, August 2008; plus additional staff calculations. 3
18 Map 2. Recent Traffic Volumes and Congestion 2 lanes 41k vpd LOS F 101k vpd LOS F 8 lanes 125k vpd LOS D Legend # through lanes Avg. weekday traffic Level of service Congestion: 61k vpd LOS B 47k vpd Severe Moderate Low 2 lanes 7k vpd (tolled) 52k vpd LOS B 23k vpd 36k vpd LOS E 49k vpd LOS B 59k vpd LOS B 77k vpd LOS F 76k vpd LOS F 117k vpd LOS F vpd is vehicles per day base_scale_arrow4.jpg 4

19 SOCIOECONOMIC DATA To gain a broad understanding of the users of the crossings, the population and employment for the areas to the east and west of the Elizabeth River crossings were reviewed. Map 3 indicates the division of the region for this analysis of socioeconomic growth. Map 3. Areas of Region West of Eliz. River East of Eliz. River Peninsula Areas.jpg 5
20 Table 1 below shows the growth in the population and employment for the region between 2000 and The area to the east of the Elizabeth River crossings has the largest quantity of growth with an increase of 177,000 in population and 102,000 in employment expected between 2000 and However, the area to the west has the largest percentage growth about double that of the area to the east of the Elizabeth River. This is an indication that the crossings of the Elizabeth River corridor will continue to see increased pressure as population and employment continue to grow on both sides of the crossings. Table 1. Population and Employment By Area of Region Population Employment Area 2000 % 2030 % Chg. % % Chg % 2030 % Chg. % % Chg. EAST 805,545 53% 982,476 50% 176,931 40% 22% 551,155 58% 653,202 54% 102,047 42% 19% WEST 247,269 16% 353,024 18% 105,755 24% 43% 117,761 12% 171,098 14% 53,337 22% 45% PENINSULA 478,059 31% 637,750 32% 159,691 36% 33% 287,093 30% 374,475 31% 87,382 36% 30% TOTAL 1,530, % 1,973, % 442, % 29% 956, % 1,198, % 242, % 25% DEMAND FOR THE CROSSINGS The demand for the crossings measures how many vehicles per day would like to use the given facility. This information can be useful for better placing future capacity improvements at locations where people want to travel. This differs from the forecast volume in that the forecast is an estimate of the number of vehicles that will use the given facility under actual capacity and toll conditions. Demand was estimated by running the regional travel model with unlimited capacity and no tolls across the Elizabeth River crossings. The development of the demand analysis is further discussed in Appendix A. Table 2. Estimated Demand for the Elizabeth River Crossings Demand Count Demand Diff % Diff LRP Vol Demand Diff % Diff growth Midtown Tunnel 41,000 45,000 4,000 10% 49,000 * 54,000 5,000 10% 9,000 Downtown Tunnel 101, ,000-1,000-1% 90,000 * 124,000 34,000 38% 24,000 Jordan Bridge 7,200 * 18,000 10, % 19,000 * 31,000 12,000 63% 13,000 Gilmerton Bridge 36,000 37,000 1,000 3% 47,000 41,000-6,000-13% 4,000 High-rise bridge 76,000 68,000-8,000-11% 69,000 * 97,000 28,000 41% 29, , ,000 6,800 3% 274, ,000 73,000 27% 79,000 * indicates presence of a toll. As shown in Table 2, there is a total growth in demand across this corridor of 79,000 vehicles each day between 2007 and The demand for individual facilities does track the traffic volume, with the highest demand being for the Downtown Tunnel and the lowest being for the Jordan Bridge. The largest growth in demand between
21 and 2030 would be expected for the High Rise Bridge with an increase of 29,000 more vehicles, followed by the Downtown Tunnel with an increase of 24,000. Although the Jordan Bridge has the lowest demand of the five crossings, the percentage difference between the volume being served and the quantity that would like to use this route (in the absence of toll and capacity restrictions) is significant at 150% in 2007 and 63% in EVALUATION OF ALTERNATIVE CROSSINGS Two alternative locations for capacity expansions were evaluated as a part of this study. They were: Creation of a partial downtown loop from the Midtown Tunnel to I-464 via the MLK Freeway and a new Jordan Bridge with tolls. (see Map 6) A widening of Military Highway (including the Gilmerton Bridge) to six through lanes from Battlefield Blvd to Bowers Hill with tolls on the Gilmerton Bridge. This alternative assumes that the Jordan Bridge is no longer in service. (see Map 8) The evaluation of these alternatives was made under the assumption that the 2030 landuse and the projects contained in the region s 2030 Long-Range Transportation Plan (LRP) were in place. 11 Map 4 shows those projects contained in the 2030 LRP that are located in the study area. It should also be noted that tolls are assumed to be used extensively for the funding of projects in the 2030 LRP. The toll rates are shown in Table 3. While these alternatives are highway expansions, it should be noted that in this document can be found an analysis of existing transit routes (page 25), light-rail transit (page 27), and bicycle and pedestrian accommodations (page 28). Future studies that may further evaluate these two alternatives should include an evaluation of transit service as a complement to the added vehicle capacity. Map 5 shows the traffic volumes and congestion expected in 2030, with the projects in the 2030 LRP in place. The Midtown Tunnel and High Rise Bridge are the only two facilities of the crossings without a level-of-service of F. This is due to a combination of the additional lanes added to these two locations and the presence of tolls, which will deter some drivers from using these routes. 11 Hampton Roads 2030 Long-Range Transportation Plan, HRPDC, December
22 Map Long-Range Transportation Plan Projects in Study Area 2030lrptext2.jpg 8
23 Map LRP Traffic Volumes and Congestion 49k vpd (tolled) 29k vpd LOS B (tolled) 90k vpd LOS F (tolled) 8 lanes 131k vpd LOS E Legend # through lanes Avg. weekday traffic Level of service 77k vpd 66k vpd LOS D Congestion: Severe Moderate Low 2 lanes 19k vpd LOS F (tolled) 78k vpd 29k vpd LOS D 47k vpd LOS F 84k vpd 101k vpd LOS D 79k vpd (tolled) 69k vpd (tolled) 6+2HOV lanes 126k vpd LOS D vpd is vehicles per day 2030lrp2.jpg 9
24 Table 3: Toll Details of MPO Package of Toll Projects 12 Note: Only Phase I of the Third Crossing is in the 2030 LRP. toll insert-2.jpg Alternative A: Creation of a New Loop Road This alternative would create a partial loop road from the Midtown Tunnel to I-464 via the Martin Luther King Freeway and the Jordan Bridge. A portion of this alternative is already planned to be constructed, with the expansion of the Midtown Tunnel and the extension of the Martin Luther King Freeway to I-264 included in the region s 2030 LRP. The additional component is: A new four-lane, limited access highway from I-264 at the extended Martin Luther King Freeway to the I-464/Poindexter St. interchange. Map 6 shows the approximate location of the alternative. 12 To convert year 2004 dollars to year 2007 dollars, multiply by Calculated using Consumer Price Index values of for 2004 and for
25 Map 6. Elizabeth River Crossings Study Alternative A: Creation of a New Loop Road from I-264 to I-464 AltAtext.jpg 11
26 Table 4 and Map 7 below shows the results of the analysis. An analysis of model sensitivity to toll rates across the widened Jordan Bridge was conducted and is discussed later in this report. However, in the interest of including an extended analysis of one toll rate scenario, a moderate toll rate of $0.60 (in year 2007 dollars) across the Jordan Bridge will be analyzed in greater detail. The results of Alternative A show that travel conditions across all of the study area crossings improves. The greatest improvement is in the center of the corridor, at the Downtown Tunnel and Jordan Bridge. The quantity of traffic across the Downtown Tunnel decreases by 17,000 vehicles per day, resulting in an improved level-of-service from F to D. The improved Jordan Bridge serves both a greater quantity of vehicles (an increase of 37,000) and at a better level-of-service. However, an increase in volume of up to 10,000 and a slight decrease in level-of-service does occur for those sections of I- 464 to the south of the improved Jordan Bridge. 12
27 Table 4. Change in 2030 Average Weekday Volume, Alternative A Compared to 2030 LRP Orange indicates significant changes to this segment. Road From To 2030 LRP Forecast V/C LOS 2030 ERCS Alt A Forecast V/C hg. V/C Chg. Vol. Midtown Tunnel na na 49, C 44, C ,000 Downtown Tunnel na na 90, F 73, D ,000 Jordan Bridge na na 19, F 56, C ,000 Gilmerton Bridge na na 47, F 44, F ,000 High Rise Bridge na na 69, C 60, C ,000 MLK Fwy Midtown Tunnel London Blvd 44, B 51, B ,000 MLK Fwy London Blvd High St 33, B 44, C ,000 MLK Fwy High St I , B 44, C ,000 Military Hwy Battlefield Blvd Campostella Rd 32, F 33, F ,000 Military Hwy Campostella Rd I , F 36, F ,000 Military Hwy I-464 Bainbridge Blvd 35, F 33, E ,000 Military Hwy Canal Dr GW Hwy 29, D 29, D Military Hwy GW Hwy Cavalier Blvd 26, D 26, D Military Hwy Cavalier Blvd I-64 25, C 24, D ,000 Military Hwy I-64 Airline Blvd 27, C 27, C I-64 Bowers Hill Military Hwy 63, C 56, B ,000 I-64 Military Hwy GW Hwy 79, C 70, C ,000 I-64 I-464 Battlefield Blvd 126, D 126, D I-64 Battlefield Blvd Greenbrier Pkwy 147, E 147, E I-264 I-664 Greenwood Dr 58, D 58, D I-264 Greenwood Dr Victory Blvd 64, D 64, D I-264 Victory Blvd Portsmouth Blvd 76, C 76, C I-264 Portsmouth Blvd Frederick Blvd 77, C 77, C I-264 Frederick Blvd MLK Fwy 88, D 80, C ,000 I-264 MLK Fwy Des Moines Ave 95, D 89, D ,000 I-264 Des Moines Ave Effingham St 87, C 83, C ,000 I-264 I-464 Tidewater Dr 131, E 135, E ,000 I-264 Tidewater Dr Campostella Rd 127, D 127, D I-464 I-64 Military Hwy 101, D 107, E ,000 I-464 Military Hwy Freeman Ave 84, C 93, D ,000 I-464 Freeman Ave Poindexter St 78, C 88, D ,000 I-464 Poindexter St South Main St 66, D 56, C ,000 I-464 South Main St I , D 51, C ,000 Western Fwy Midtown Tunnel West Norfolk Rd 58, D 62, D ,000 New Alt A road I-264 Frederick Blvd na na na 35, B na na New Alt A road Frederick Blvd GW Hwy na na na 42, B na na New Alt A road GW Hwy Elm Ave na na na 42, B na na Note: A toll rate of $0.60 (year 2007 dollars) is assumed for travel across the improved Jordan Bridge in the "Alt. A" scenario. 13
28 Map ERCS Alternative A Traffic Volumes and Congestion 44k vpd (tolled) 44k vpd (tolled) 73k vpd LOS D (tolled) 8 lanes 135k vpd LOS E Legend # through lanes Avg. weekday traffic Level of service Congestion: 77k vpd 35k vpd LOS B 56k vpd (tolled) 56k vpd Severe Moderate Low 42k vpd LOS B 42k vpd LOS B 88k vpd LOS D 70k vpd (tolled) 29k vpd LOS D 44k vpd LOS F 60k vpd (tolled) 93k vpd LOS D 107k vpd LOS E 6+2HOV lanes 126k vpd LOS D vpd is vehicles per day 14
29 Alternative B: Widening of Military Highway This alternative would increase the capacity at the southern end of the study area by increasing the number of through lanes on Military Highway by two, for a total of six lanes between Battlefield Blvd. and Bowers Hill, including expansion of the Gilmerton Bridge. Because of the age and replacement cost of the Jordan Bridge, the bridge is assumed to be closed in this 2030 scenario. Map 8 shows the location of this alternative. Table 5 and Map 9 below shows the results of the analysis. An analysis of model sensitivity for toll rates across the widened Gilmerton Bridge was conducted and is discussed later in this report. However, in the interest of including an extended analysis of one toll rate scenario, a moderate toll rate of $0.60 (in year 2007 dollars) across the Gilmerton Bridge will be analyzed in greater detail. Volumes at both the Midtown and Downtown Tunnels decrease by only 4,000, yet the volume at the High Rise bridge decreases by 9,000. The toll on the Gilmerton Bridge results in a decrease of traffic as compared to the 2030 LRP scenario. The decreased volume, combined with a widening, results in a LOS of C across the improved Gilmerton Bridge. 15
30 Map 8. Elizabeth River Crossings Study Alternative B: Widen Military Highway and Assume Jordan Bridge Is No Longer in Service AltBtext2.jpg 16
31 Table 5. Change in 2030 Average Weekday Volume, Alternative B Compared to 2030 LRP Orange indicates significant changes to this segment. Road From To 2030 LRP Forecast V/C LOS 2030 ERCS Alt B Forecast V/C hg. V/C Chg. Vol. Midtown Tunnel na na 49, C 45, C ,000 Downtown Tunnel na na 90, F 86, F ,000 Jordan Bridge na na 19, F na na na na na Gilmerton Bridge na na 47, F 33, C ,000 High-rise Bridge na na 69, C 60, C ,000 MLK Fwy Midtown Tunnel London Blvd 44, B 45, B ,000 MLK Fwy London Blvd High St 33, B 33, B MLK Fwy High St I , B 29, B Military Hwy Battlefield Blvd Campostella Rd 32, F 33, C ,000 Military Hwy Campostella Rd I , F 35, C Military Hwy I-464 Bainbridge Blvd 35, F 28, C ,000 Military Hwy Canal Dr GW Hwy 29, D 26, C ,000 Military Hwy GW Hwy Cavalier Blvd 26, D 27, C ,000 Military Hwy Cavalier Blvd I-64 25, C 20, C ,000 Military Hwy I-64 Airline Blvd 27, C 29, C ,000 I-64 Bowers Hill Military Hwy 63, C 56, B ,000 I-64 Military Hwy GW Hwy 79, C 72, C ,000 I-64 I-464 Battlefield Blvd 126, D 115, D ,000 I-64 Battlefield Blvd Greenbrier Pkwy 147, E 142, D ,000 I-264 I-664 Greenwood Dr 58, D 54, D ,000 I-264 Greenwood Dr Victory Blvd 64, D 61, D ,000 I-264 Victory Blvd Portsmouth Blvd 76, C 72, C ,000 I-264 Portsmouth Blvd Frederick Blvd 77, C 72, C ,000 I-264 Frederick Blvd MLK Fwy 88, D 83, C ,000 I-264 MLK Fwy Des Moines Ave 95, D 90, D ,000 I-264 Des Moines Ave Effingham St 87, C 83, C ,000 I-264 I-464 Tidewater Dr 131, E 125, D ,000 I-264 Tidewater Dr Campostella Rd 127, D 121, C ,000 I-464 I-64 Military Hwy 101, D 89, D ,000 I-464 Military Hwy Freeman Ave 84, C 83, C ,000 I-464 Freeman Ave Poindexter St 78, C 75, C ,000 I-464 Poindexter St South Main St 66, D 69, D ,000 I-464 South Main St I , D 63, D ,000 Western Fwy Midtown Tunnel West Norfolk Rd 58, D 56, D ,000 Note: A toll rate of $0.60 (year 2007 dollars) is assumed for travel across the improved Gilmerton Bridge in the "Alt. B" scenario. Note also that this alternative assumes that the Jordan Bridge is no longer in service. 17
32 Map Alternative B Traffic Volumes and Congestion 45k vpd (tolled) 29k vpd LOS B (tolled) 86k vpd LOS F (tolled) 8 lanes 125k vpd LOS D Legend # through lanes Avg. weekday traffic Level of service Congestion: 72k vpd 69k vpd LOS D Severe Moderate Low Assumed to not be in service 75k vpd 26k vpd 33k vpd (tolled) 83k vpd 89k vpd LOS D 72k vpd (tolled) 60k vpd (tolled) 6+2HOV lanes 115k vpd LOS D vpd is vehicles per day AltB2.jpg 18
33 Comparison of Alternatives Figures 3 and 4 show a summary of the impact on traffic volumes and volume to capacity ratios of Alternatives A and B. More total vehicle trips are served with Alternative A in comparison to Alternative B (53,000 more) and in comparison the 2030 Long-Range Transportation Plan (3,000 more). Alternative A also has a significant impact on the Downtown Tunnel, reducing its volume by 17,000 vehicles per day and reducing its v/c ratio to below The most significant impact of Alternative B is the better quality of traffic flow on the Gilmerton Bridge, as the quantity of traffic actually declines across the bridge with the assumption of a $0.60 toll (year 2007 dollars). Alternative B has a minor impact on the Downtown Tunnel, reducing its volume by only 4,000 vehicles per day which leaves the tunnel over capacity. Figure 3. Comparison of 2030 Average Weekday Volumes Totals: 2030 LRP: 274, ERCS Alt A: 277, ERCS Alt B: 224,000 19

34 Figure 4. Comparison of 2030 Volume to Capacity Ratio 20
35 MODEL SENSITIVITY TO TOLLS The previous analysis of alternatives used a single toll rate. However, further analysis would be required to determine what would be an acceptable toll rate given the cost of each project and striking a balance between toll rate and use of the facility. Given the uncertainty of the toll rates and to assist with any future analysis of these alternatives, a toll sensitivity analysis was conducted for the two alternatives. The travel demand forecast model was run for the year 2030 with toll levels of $0.24, $0.48, $0.60, $0.72, and $0.96 (in year 2007 dollars) for both the Jordan Bridge (for the loop alternative; Alternative A) and for the Gilmerton Bridge (for the widening of Military Highway alternative and no Jordan Bridge; Alternative B). 13 All other variables (toll rates, projects, and land use) were held constant at their 2030 LRP values. The improved Jordan Bridge shed an average of twice the traffic per ten-cent toll increase as the improved Gilmerton Bridge (8,200 decrease versus 4,100) as shown in Table 6. However, both the Jordan Bridge and Gilmerton Bridge responded in a similar manner in terms of elasticity, as shown in Table Both are relatively inelastic in the $0.24 to $0.48 toll range and are elastic (elasticity value > 1.0) when a toll of $0.60 is exceeded. However, the sensitivity to tolls may still be greater than expected across the whole range of tolls analyzed. 13 Appendix B includes factors used in converting among 2000, 2004, and 2007 toll values. 14 Elasticity calculated as (% Change in Volume / % Change in Toll). The curves used are generalized and elasticity would actually differ at each point along the toll-volume curve. 21
36 Figure 5. Difference in 2030 Volume Relative to $0.60 Toll on Jordan Bridge for ERCS Alternative A Figure 6. Difference in 2030 Volume Relative to $0.60 Toll on Gilmerton Bridge for ERCS Alternative B 22
37 Table 6. Change in 2030 Volume Per Ten Cent Increase in Toll (Toll on the Jordan Bridge for ERCS Alt. A and Toll on the Gilmerton Bridge for ERCS Alt. B) ERCS Alternative A ERCS Alternative B Road $0.24-$0.48 $0.48-$0.60 $0.60-$0.72 $0.72-$0.96 Avg. * $0.24-$0.48 $0.48-$0.60 $0.60-$0.72 $0.72-$0.96 Avg. * Midtown Tunnel 900 1,100 1, , Downtown Tunnel 2,700 3,200 4,700 3,200 3, , Jordan Bridge -7,800-8,100-10,500-7,600-8,200 na na na na na Gilmerton Bridge 1, ,000-4,500-7,200-3,600-4,100 High-rise Bridge 1,300 1,100 2,600 1,700 1, ,300 4,100 2,100 *Note: Toll is year 2007 dollars. Average is the change in volume per 10-cent toll increase for a toll range of $0.24 to $ ,500 Table 7. Elasticity of 2030 Volumes (Toll on the Jordan Bridge for ERCS Alt. A and Toll on the Gilmerton Bridge for ERCS Alt. B) ERCS Alternative A ERCS Alternative B Road $0.24-$0.48 $0.48-$0.60 $0.60-$0.72 $0.72-$0.96 $0.24-$0.48 $0.48-$0.60 $0.60-$0.72 $0.72-$0.96 Midtown Tunnel Downtown Tunnel Jordan Bridge na na na na Gilmerton Bridge High-rise Bridge Note: Toll is year 2007 dollars. Elasticity calculated as (% Change in Volume / % Change in Toll). Elasticity will differ at various points along the toll-volume curve. 23
38 PUBLIC TRANSPORTATION Existing Bus and Ferry Public transportation has had a role in the crossing of the Elizabeth River since 1636, as noted earlier in the history of the Elizabeth River crossings. There are currently six Hampton Roads Transit services for crossing the Elizabeth River in the study area. They are: Elizabeth River Ferry Route 44 (crosses Midtown Tunnel) Route 45 (crosses Downtown Tunnel) Route 57 (crosses Gilmerton Bridge) Route 962 (crosses Downtown Tunnel) Route 967 (crosses High Rise Bridge) See Map 10 for a map of the routes. Commuter routes 962 and 967 started service in summer of Prior to the summer of 2008 there were four Hampton Roads Transit services for crossing the Elizabeth River in the study area (three bus routes and a ferry). Boardings for these routes were analyzed from FY2003 to FY2007, as shown in Figure The combined total boardings for the subject routes grew from 793,000 in FY03 to 1,025,000 in FY07, representing an annual growth rate of 6.6%. Among the individual routes, Route 45 grew the most in quantity of boardings from FY03 to FY07, growing by 95,000 boardings. In percentage terms, Route 57 grew the most, from 22,000 boardings in FY03 to 92,000 boardings in FY07, or a change of over 300%. The ferry showed notable growth from just over 315,000 boardings in FY03 to 390,000 boardings in FY07, or a change of 23%. Route 44 stayed consistently in the range of approximately 150,000 to 160,000 boardings per year during this time. 15 Boarding totals are for the entire route, not just persons using HRT service to cross the Elizabeth River. 24
39 Map 10. Existing Hampton Roads Transit Routes hrt3.jpg 25

40 Figure 7. Boardings for HRT Routes Note: Complete FY05 data not available due to a change in the HRT fiscal year calendar at that time. Commuter routes 962 and 967 did not begin service until summer of Light Rail Corridors VDOT has recently been exploring Public-Private Partnerships (PPP s) as a means of constructing a widening of the Midtown Tunnel and an extension of the Martin Luther King Freeway to I-264. The current call for proposals includes the statement that The design and construction of the proposed new Midtown Tunnel shall not preclude the development of future facilities dedicated to providing multi-modal transportation alternatives. 16 Prior to these recent efforts, expansion of the Norfolk light-rail system across the southern branch of the Elizabeth River was last studied in 1999 in the Portsmouth and Chesapeake Corridor Planning Study. 17 There were four corridors for crossing the 16 Source: Downtown Tunnel / Midtown Tunnel / MLK Freeway Extension Solicitation for Proposals, VDOT, May 30, 2008, p. 13. Accessed via VDOT website on 6/30/ Portsmouth and Chesapeake Corridor Planning Study for the Hampton Roads Regional Light Rail Transit System, July 1999, Parsons Brinckerhoff and BRW. 26
 Cross at the Downtown Tunnel: CSX corridor (9.0 miles) I-264 corridor (8.4 miles) Cross via the ferry: High Street Corridor to Churchland (7.7 miles) High Street / Airline Blvd. corridor (7.")
 BICYCLE AND PEDESTRIAN FACILITIES There are currently limited options for crossing the Elizabeth River via bicycle or on foot.")
41 southern branch under consideration at that time (and their approximate lengths) are listed below. Cross at the Midtown Tunnel: MLK / CSX corridor (12.8 miles) Cross at the Downtown Tunnel: CSX corridor (9.0 miles) I-264 corridor (8.4 miles) Cross via the ferry: High Street Corridor to Churchland (7.7 miles) High Street / Airline Blvd. corridor (7.4 miles) CSX railroad corridor (7.0 miles) Cross via a new LRT tunnel near the Naval Hospital: CSX railroad corridor (11.5 miles) BICYCLE AND PEDESTRIAN FACILITIES There are currently limited options for crossing the Elizabeth River via bicycle or on foot. Only two of the five crossings in the study area have any accommodations for pedestrians. The Jordan Bridge and Gilmerton Bridge have sidewalks on one side of the bridge (the north side). No toll is collected at the Jordan Bridge from bicyclists or pedestrians. These bridges, however, do not have bicycle facilities leading to the bridges. Figure 8. Sidewalks on the Jordan and Gilmerton Bridges Sidewalks are only on the north side of the Jordan Bridge (left) and Gilmerton Bridge (right). Transit can also serve to assist bicyclists and pedestrians in their travels. All of HRT s buses, except for the replica trolleys, have bicycle racks. In addition, the ferry between downtown Portsmouth and downtown Norfolk serves the needs of both pedestrians and 27
42 bicyclists. As noted in the preceding Public Transportation section, HRT serves this corridor with three bus routes and a ferry. Table 7 summarizes the options for bicyclists and pedestrians for crossing the Elizabeth River in the study area. Table 8. Summary of Bicycle and Pedestrian Facilities Road Bike or Ped Facility Bus Route Midtown Tunnel no yes Downtown Tunnel no yes Jordan Bridge sidewalk on one side no Gilmerton Bridge sidewalk on one side yes High-rise Bridge no yes All bus routes have bike racks on the fronts of buses. The Downtown Tunnel vicinity is additionally served by the HRT ferry, which provides travel for pedestrians and bicyclists. ADDITIONAL RESOURCES The issues involved with the expansion of the capacity across the Elizabeth River are many and complex. This study was designed as a starting point for further analysis of the options available. There have also been related studies performed in the past that may be of interest. These additional studies are listed below. Downtown Tunnel Traffic Management Plan, HRPDC, November Midtown Tunnel Closure Traffic and Transit Analysis, HRPDC, June Toll Feasibility Study, Michael Baker Corp. for HRPDC, VDOT, and FHWA. October 28, Regional Bridge Study, HRPDC, August
43 APPENDICES 29
44 APPENDIX A Development of Demand Quantities Despite its designated name of travel demand forecasting model, the model is typically used to forecast traffic volumes, given the restraints of capacities and the impact of tolls. Demand, however, is quite different. It is a measure of what route people would like to take. Demand is a difficult concept to forecast, as there are no real-world checks available, unlike forecast volumes where ground counts are a useful comparison. Three methods were used for estimating the demand for the Elizabeth River crossings. The approaches used were: Network-wide unrestricted capacity and no tolls (one model run) Unrestricted capacity and no tolls just for the Elizabeth River corridor (one model run) Unrestricted capacity and no tolls for each of the five crossings of the corridor individually (one model run for each crossing; five runs total) The results are shown in Table A1 below. Table A1. Estimates of 2030 Demand Eliz. River Crossings: Road Network-wide Eliz River corridor Individual facility (1 run) (1 run) (5 runs; 1 each xing) Midtown Tunnel 66,000 54,000 64,000 Downtown Tunnel 119, , ,000 Jordan Bridge 44,000 31,000 37,000 Gilmerton Bridge 60,000 41,000 64,000 High-rise bridge 22,000 97, , , ,000 n.a. Other Facilities: Cedar Rd 8,000 9,000 did not run Moses Grandy Trl 50,000 23,000 did not run 58,000 32,000 - The network-wide run produced results that approximate a free-flowing interstate throughout the region. The most notable result of this run was the very low volume on the High Rise Bridge (22,000) and the very high volume on Moses Grandy Trail (50,000). It is clear that this is just a reflection of where people live (no one lives right next to the High Rise Bridge). This definition of demand did not seem to have any measure of reality, and so it was not used. At the other end of the spectrum, scenarios were run where each crossing was the only unrestricted facility in the network. The results of this scenario did not seem unreasonable on an individual basis; those with the highest actual traffic volume had the 30
45 highest demand. The issue with this method was that the total quantity of crossings (414,000) was then higher than the actual number of trips that the trip table indicated crossed through the corridor. For this reason, this method was not chosen. The method settled on struck a balance between all facilities being unrestrained and one facility being unrestrained at a time. The method used applied an unrestricted capacity and no tolls to the components of the Elizabeth River corridor (the five facilities from the Midtown Tunnel to the High Rise Bridge) at the same time, while the rest of the network remained with their real capacities and tolls. The results struck a balance between the previous two methods and produced reasonable results. 31
46 APPENDIX B Converting Among 2000, 2004, and 2007 Dollars Toll rates for three different years were used by sources for this document: 2000 (as used within the regional travel demand model), 2004 (as cited in the Toll Feasibility Study rates in Table 3), and 2007, which is the most recent full calendar year and the most recent full year for which Consumer Price Index (CPI) data is available. Toll rates were converted to year 2007 dollars when appropriate, using the data below CPI $ 0.20 $ 0.22 $ 0.24 $ 0.40 $ 0.44 $ 0.48 $ 0.50 $ 0.55 $ 0.60 $ 0.60 $ 0.66 $ 0.72 $ 0.80 $ 0.88 $ 0.96 "CPI" is Consumer Price Index Toll Rate Convert from 2000 to 2004: / = = 2.3% annual growth rate Convert from 2000 to 2007: / = = 2.7% annual growth rate Convert from 2004 to 2007: / = = 3.1% annual growth rate 32
Park & Ride Lot Investment Strategies
 Park & Ride Lot Investment Strategies Hampton Roads Transportation Technical Advisory Committee May 7, 2014 Carl E. Jackson, AICP Transportation Planning Specialist Hampton Roads District VDOT Park & Ride
I-820 (East) Project Description. Fort Worth District. Reconstruct Southern I-820/SH 121 Interchange
 Project Description. Fort Worth District. Reconstruct Southern I-820/SH 121 Interchange") I-820 (East) Project Description Fort Worth District Reconstruct Southern I-820/SH 121 Interchange I-820 from approximately 2,000 feet north of Pipeline Road/Glenview Drive to approximately 3,200 feet
I-820 (East) Project Description Fort Worth District Reconstruct Southern I-820/SH 121 Interchange I-820 from approximately 2,000 feet north of Pipeline Road/Glenview Drive to approximately 3,200 feet
Richmond Area MPO Regional Priority Transportation Projects
 Regional Priority Transportation Projects September 27, 2007 HANOVER GOOCHLAND ASHLAND POWHATAN RICHMOND HENRICO NEW KENT CHESTERFIELD CHARLES CITY 9211 Forest Hill Avenue, Suite 200 Richmond, Virginia
Energy Technical Memorandum
 Southeast Extension Project Lincoln Station to RidgeGate Parkway Prepared for: Federal Transit Administration Prepared by: Denver Regional Transportation District May 2014 Table of Contents Page No. Chapter
4 COSTS AND OPERATIONS
 4 COSTS AND OPERATIONS 4.1 INTRODUCTION This chapter summarizes the estimated capital and operations and maintenance (O&M) costs for the Modal and High-Speed Train (HST) Alternatives evaluated in this
Alpine Highway to North County Boulevard Connector Study
 Alpine Highway to North County Boulevard Connector Study prepared by Avenue Consultants March 16, 2017 North County Boulevard Connector Study March 16, 2017 Table of Contents 1 Summary of Findings... 1
CEDAR AVENUE TRANSITWAY Implementation Plan Update
 CEDAR AVENUE TRANSITWAY Implementation Plan Update EECUTIVE SUMMARY DECEMBER 2015 Executive Summary In 2013, the Twin Cities metropolitan area s first bus rapid transit (BRT) line, the METRO Red Line,
Naval Station Norfolk Transit Extension Study. October 2014
 Naval Station Norfolk Transit Extension Study October 2014 1 Employment by Transportation Analysis Zone (TAZ) Naval Station Legend Norfolk is Hampton Roads Region s largest employer C or with better PM
STH 60 Northern Reliever Route Feasibility Study Report
 #233087 v3 STH 60 Northern Reliever Route Feasibility Study Report Washington County Public Works Committee Meeting September 28, 2016 1 STH 60 Northern Reliever Route Feasibility Study Hartford Area Development
Bi-County Transitway/ Bethesda Station Access Demand Analysis
 Bi-County Transitway/ Bethesda Station Access Demand Analysis Prepared for: Washington Metropolitan Area Transit Authority Office of Planning and Project Development May 2005 Prepared by: in conjunction
Table of Contents INTRODUCTION... 3 PROJECT STUDY AREA Figure 1 Vicinity Map Study Area... 4 EXISTING CONDITIONS... 5 TRAFFIC OPERATIONS...
 Crosshaven Drive Corridor Study City of Vestavia Hills, Alabama Table of Contents INTRODUCTION... 3 PROJECT STUDY AREA... 3 Figure 1 Vicinity Map Study Area... 4 EXISTING CONDITIONS... 5 TRAFFIC OPERATIONS...
HAMPTON ROADS TRANSPORTATION PROJECT PRIORITIES FOR THE 2034 LONG-RANGE TRANSPORTATION PLAN
 HAMPTON ROADS TRANSPORTATION PROJECT PRIORITIES FOR THE 2034 LONG-RANGE TRANSPORTATION PLAN Prepared By: HRTPO Staff June 16, 2011 2 COMMITTED PROGRAMMED PROJECTS List of and Studies Committed are fully
Hampton Roads Congestion Management Process:
 Hampton Roads Congestion Management Process: The State of Transportation in Hampton Roads T09-01 METROPOLITAN PLANNING ORGANIZATION March 2009 HAMPTON ROADS METROPOLITAN PLANNING ORGANIZATION Chesapeake
BROWARD BOULEVARD CORRIDOR TRANSIT STUDY
 BROWARD BOULEVARD CORRIDOR TRANSIT STUDY FM # 42802411201 EXECUTIVE SUMMARY July 2012 GOBROWARD Broward Boulevard Corridor Transit Study FM # 42802411201 Executive Summary Prepared For: Ms. Khalilah Ffrench,
TRAFFIC SIMULATION IN REGIONAL MODELING: APPLICATION TO THE INTERSTATEE INFRASTRUCTURE NEAR THE TOLEDO SEA PORT
 MICHIGAN OHIO UNIVERSITY TRANSPORTATION CENTER Alternate energy and system mobility to stimulate economic development. Report No: MIOH UTC TS41p1-2 2012-Final TRAFFIC SIMULATION IN REGIONAL MODELING: APPLICATION
RTID Travel Demand Modeling: Assumptions and Method of Analysis
 RTID Travel Demand Modeling: Assumptions and Method of Analysis Overall Model and Scenario Assumptions The Puget Sound Regional Council s (PSRC) regional travel demand model was used to forecast travel
US 81 Bypass of Chickasha Environmental Assessment Public Meeting
 US 81 Bypass of Chickasha Environmental Assessment Public Meeting March 14, 2013 Introductions ODOT FHWA SAIC Meeting Purpose Present need for bypass Provide responses to 10/04/11 public meeting comments
Highway 18 BNSF Railroad Overpass Feasibility Study Craighead County. Executive Summary
 Highway 18 BNSF Railroad Overpass Feasibility Study Craighead County Executive Summary October 2014 Highway 18 BNSF Railroad Overpass Feasibility Study Craighead County Executive Summary October 2014 Prepared
Funding Scenario Descriptions & Performance
 Funding Scenario Descriptions & Performance These scenarios were developed based on direction set by the Task Force at previous meetings. They represent approaches for funding to further Task Force discussion
Action 6A: HRTAC FY2018 FY2023 Funding Plan
 Action 6A: HRTAC 2018 2023 Funding Plan Presentation to: HRTAC Finance Committee Kevin Page, HRTAC Liang Shan, PFM June 5, 2017 PFM Financial Advisors LLC 300 S. Orange Avenue Ste 1170 Orlando, Florida
Hampton Roads Regional Safety Study 2013 Update Part I: Crash Trends and Locations T13-11
 Hampton Roads Regional Safety Study 2013 Update Part I: Crash Trends and Locations T13-11 October 2013 VOTING MEMBERS: HAMPTON ROADS TRANSPORTATION PLANNING ORGANIZATION Dwight L. Farmer Executive Director/Secretary
V. DEVELOPMENT OF CONCEPTS
 Martin Luther King, Jr. Drive Extension FINAL Feasibility Study Page 9 V. DEVELOPMENT OF CONCEPTS Throughout the study process several alternative alignments were developed and eliminated. Initial discussion
Subarea Study. Manning Avenue (CSAH 15) Corridor Management and Safety Improvement Project. Final Version 1. Washington County.
 Corridor Management and Safety Improvement Project. Final Version 1. Washington County.") Subarea Study Manning Avenue (CSAH 15) Corridor Management and Safety Improvement Project Final Version 1 Washington County June 12, 214 SRF No. 138141 Table of Contents Introduction... 1 Forecast Methodology
Subarea Study Manning Avenue (CSAH 15) Corridor Management and Safety Improvement Project Final Version 1 Washington County June 12, 214 SRF No. 138141 Table of Contents Introduction... 1 Forecast Methodology
Transit Access to the National Harbor
 Transit Access to the National Harbor December 2014 Table of Contents Executive Summary... 3 Introduction and Project Purpose... 6 Methodology.. 9 Definition of Alternatives..... 9 Similar Project Implementation
Rocky Mount. Transportation Plan. Transportation Planning Division. Virginia Department of Transportation
 2020 Transportation Plan Developed by the Transportation Planning Division of the Virginia Department of Transportation in cooperation with the U.S. Department of Transportation, Federal Highway Administration
Regional Transit Extension Studies. Hampton Roads Transportation Planning Organization Passenger Rail Task Force Meeting December 17, 2013
 Regional Transit Extension Studies Hampton Roads Transportation Planning Organization Passenger Rail Task Force Meeting December 17, 2013 Topics Virginia Beach Transit Extension Study (VBTES) Naval Station
Major Widening/New Roadway
 Revised Evaluation s Major Widening/New Roadway This page provides a summary of any revisions made to the draft scores presented at the October th Attributable Funds Committee meeting. The information
CLRP. Performance Analysis of The Draft 2014 CLRP. Long-Range Transportation Plan For the National Capital Region
 NATIONAL CAPITAL REGION TRANSPORTATION PLANNING BOARD Item 12 CLRP Financially Constrained Long-Range Transportation Plan For the National Capital Region 2014 Performance Analysis of The Draft 2014 CLRP
TEXAS CITY PARK & RIDE RIDERSHIP ANALYSIS
 TEXAS CITY PARK & RIDE RIDERSHIP ANALYSIS This document reviews the methodologies and tools used to calculate the projected ridership and parking space needs from the proposed Texas City Park & Ride to
Alternatives Analysis Findings Report
 6.0 This chapter presents estimates of the potential capital, operations and maintenance costs associated with the alternatives carried forward for detailed evaluation. The methodology used to develop
TORONTO TRANSIT COMMISSION REPORT NO.
 Form Revised: February 2005 TORONTO TRANSIT COMMISSION REPORT NO. MEETING DATE: October 24, 2012 SUBJECT: DOWNTOWN RAPID TRANSIT EXPANSION STUDY (DRTES) PHASE 1 STRATEGIC PLAN ACTION ITEM RECOMMENDATIONS
Proposed HRTAC FY2018 FY2023 Plan of Finance Update
 Chair, MICHAEL J. HIPPLE Vice Chair, LINDA T. JOHNSON Executive Director, KEVIN B. PAGE Proposed HRTAC 2018 2023 Plan of Finance Update HRTAC 2018 2023 Six Year Operating and Capital Program of Projects
Sepulveda Pass Corridor Systems Planning Study Final Compendium Report. Connecting the San Fernando Valley and the Westside
 Los Angeles County Metropolitan Transportation Authority November 2012 Connecting the San Fernando Valley and the Westside Interstate 405 Sepulveda Pass THIS PAGE INTENTIONALLY LEFT BLANK Sepulveda Pass
SOUTHERN GATEWAY. Transportation and Trinity River Project Committee 11 May 2015
 SOUTHERN GATEWAY Transportation and Trinity River Project Committee 11 May 2015 Southern Gateway Project History Began in 2001 as a Major Investment Study [ MIS ], Schematic, and Environmental Assessment
Expansion Projects Description
 Expansion Projects Description The Turnpike expansion program was authorized by the Florida Legislature in 1990 to meet the State s backlog of needed highway facilities. The Legislature set environmental
CITY OF LONDON STRATEGIC MULTI-YEAR BUDGET ADDITIONAL INVESTMENTS BUSINESS CASE # 6
 2016 2019 CITY OF LONDON STRATEGIC MULTI-YEAR BUDGET ADDITIONAL INVESTMENTS BUSINESS CASE # 6 STRATEGIC AREA OF FOCUS: SUB-PRIORITY: STRATEGY: INITIATIVE: INITIATIVE LEAD(S): BUILDING A SUSTAINABLE CITY
Waco Rapid Transit Corridor (RTC) Feasibility Study
 Feasibility Study") Waco Rapid Transit Corridor (RTC) Feasibility Study Chris Evilia, Director of Waco Metropolitan Planning Organization Allen Hunter, General Manager Waco Transit System Jimi Mitchell, Project Manager AECOM
Waco Rapid Transit Corridor (RTC) Feasibility Study Chris Evilia, Director of Waco Metropolitan Planning Organization Allen Hunter, General Manager Waco Transit System Jimi Mitchell, Project Manager AECOM
APPENDIX B Traffic Analysis
 APPENDIX B Traffic Analysis Rim of the World Unified School District Reconfiguration Prepared for: Rim of the World School District 27315 North Bay Road, Blue Jay, CA 92317 Prepared by: 400 Oceangate,
4.0 TIER 2 ALTERNATIVES
 4.0 TIER 2 ALTERNATIVES The Tier 2 Alternatives represent the highest performing Tier 1 Alternatives. The purpose of the Tier 2 Screening was to identify the LPA utilizing a more robust list of evaluation
Introduction and Background Study Purpose
 Introduction and Background The Brent Spence Bridge on I-71/75 across the Ohio River is arguably the single most important piece of transportation infrastructure the Ohio-Kentucky-Indiana (OKI) region.
Parks and Transportation System Development Charge Methodology
 City of Sandy Parks and Transportation System Development Charge Methodology March, 2016 Background In order to implement a City Council goal the City of Sandy engaged FCS Group in January of 2015 to update
Maryland Gets to Work
 I-695/Leeds Avenue Interchange Reconstruction Baltimore County Reconstruction of the I-695/Leeds Avenue interchange including replacing the I-695 Inner Loop bridges over Benson Avenue, Amtrak s Northeast
Synthesis of Cal Poly Senior Projects Relating to Public Transportation in San Luis Obispo County
 Synthesis of Cal Poly Senior Projects Relating to Public Transportation in San Luis Obispo County In partial fulfillment of CE 424 Professor Eugene Jud By David Thornhill November 14, 2007 Purpose The
Chapter 7: Travel Demand Analysis. Chapter 8. Plan Scenarios. LaSalle Community Center. Image Credit: Town of LaSalle
 Chapter 7: Travel Demand Analysis Chapter 8 Plan Scenarios LaSalle Community Center. Image Credit: Town of LaSalle 164 Chapter 8: Plan Scenarios Moving Ahead for Progress in the 21 st Century Act (MAP
3.17 Energy Resources
 3.17 Energy Resources 3.17.1 Introduction This section characterizes energy resources, usage associated with the proposed Expo Phase 2 project, and the net energy demand associated with changes to the
Hampton Roads Regional Travel Time Reliability Study T13-07
 Hampton Roads Regional Travel Time Reliability Study T13-07 July 2013 VOTING MEMBERS: HAMPTON ROADS TRANSPORTATION ORGANIZATION Dwight L. Farmer Executive Director/Secretary CHESAPEAKE JAMES CITY COUNTY
CITY OF VANCOUVER ADMINISTRATIVE REPORT
 Supports Item No. 1 T&T Committee Agenda May 13, 2008 CITY OF VANCOUVER ADMINISTRATIVE REPORT Report Date: April 29, 2008 Author: Don Klimchuk Phone No.: 604.873.7345 RTS No.: 07283 VanRIMS No.: 13-1400-10
Project Scoping Report Appendix B Project Web Site. APPENDIX B Project Web Site
 Project Scoping Report Appendix B Project Web Site APPENDIX B Project Web Site WESTSIDE EXTENSION TRANSIT CORRIDOR STUDY February 4, 2008 News and Info of 1 http://metro.net/projects_programs/westside/news_info.htm#topofpage
Operating & Maintenance Cost Results Report
 Operating & Maintenance Cost Results Report Prepared for: Hennepin County Regional Railroad Authority Prepared by: Connetics Transportation Group Under Contract To: Kimley-Horn and Associates FINAL June
5. OPPORTUNITIES AND NEXT STEPS
 5. OPPORTUNITIES AND NEXT STEPS When the METRO Green Line LRT begins operating in mid-2014, a strong emphasis will be placed on providing frequent connecting bus service with Green Line trains. Bus hours
Metropolitan Freeway System 2007 Congestion Report
 Metropolitan Freeway System 2007 Congestion Report Minnesota Department of Transportation Office of Traffic, Safety and Operations Freeway Operations Section Regional Transportation Management Center March
REPORT CARD FOR CALIFORNIA S INFRASTRUCTURE WHAT YOU SHOULD KNOW ABOUT CALIFORNIA S TRANSIT FACILITIES
 TRANSIT GRADE: C- WHAT YOU SHOULD KNOW ABOUT TRANSIT FACILITIES California needs robust, flexible and reliable transit systems to reduce peak congestion on our highways, provide options for citizens who
Metropolitan Freeway System 2013 Congestion Report
 Metropolitan Freeway System 2013 Congestion Report Metro District Office of Operations and Maintenance Regional Transportation Management Center May 2014 Table of Contents PURPOSE AND NEED... 1 INTRODUCTION...
The Eastern Connector Study November, 2007 planning for the future
 The Eastern Connector Study November, 2007 planning for the future In late 2006, Albemarle County and the City of Charlottesville jointly initiated the Eastern Connector Corridor Study. The Project Team
Table Existing Traffic Conditions for Arterial Segments along Construction Access Route. Daily
 5.8 TRAFFIC, ACCESS, AND CIRCULATION This section describes existing traffic conditions in the project area; summarizes applicable regulations; and analyzes the potential traffic, access, and circulation
Develop ground transportation improvements to make the Airport a multi-modal regional
 Project Overview TRANSPORTATION IMPROVEMENTS WHAT ARE THE PROJECT GOALS? Transportation transportation hub. Develop ground transportation improvements to make the Airport a multi-modal regional Land Use
Open House. Highway212. Meetings. Corridor Access Management, Safety & Phasing Plan. 5:30 to 6:30 p.m. - Southwest Corridor Transportation Coalition
 Welcome Meetings 5:30 to 6:30 p.m. - Southwest Corridor Transportation Coalition 6:30 to 8:00 p.m. - Open House Why is Highway 212 Project Important? Important Arterial Route Local Support Highway 212
Pacific Electric Right-of-Way / West Santa Ana Branch Corridor Alternatives Analysis
 Pacific Electric Right-of-Way / West Santa Ana Branch Corridor Alternatives Analysis Transit Coalition September 26, 2012 2 Study Area Pacific Electric Rightof-Way/West Santa Ana Branch (PEROW/ WSAB) extends
Downtown Lee s Summit Parking Study
 Downtown Lee s Summit Parking Study As part of the Downtown Lee s Summit Master Plan, a downtown parking and traffic study was completed by TranSystems Corporation in November 2003. The parking analysis
Policy Note. Vanpools in the Puget Sound Region The case for expanding vanpool programs to move the most people for the least cost.
 Policy Note Vanpools in the Puget Sound Region The case for expanding vanpool programs to move the most people for the least cost Recommendations 1. Saturate vanpool market before expanding other intercity
Suffolk Rail Impact Study
 Suffolk Rail Impact Study TECHNICAL APPENDIX T07-03 MAY 2007 HAMPTON ROADS PLANNING DISTRICT COMMISSION CHESAPEAKE POQUOSON REECCA C.W. ADAMS * CHARLES W. URGESS, JR. AMAR DWARKANATH GORDON C. HELSEL,
TRAVEL DEMAND FORECASTS
 Jiangxi Ji an Sustainable Urban Transport Project (RRP PRC 45022) TRAVEL DEMAND FORECASTS A. Introduction 1. The purpose of the travel demand forecasts is to assess the impact of the project components
Proposed Program of Interrelated Projects
 DALLAS AREA RAPID TRANSIT Proposed Program of Interrelated Projects Federal Transit Administration Capital Investment Program Summer 204 INTRODUCTION The current federal transportation bill, Moving Ahead
Dulles Corridor Air Rights Study Investigation
 Dulles Corridor Air Rights Study Investigation Fairfax County Board of Supervisors Transportation Committee September 17, 2013 1 On March 19, 2013 the Fairfax County Board of Supervisors asked FCDOT staff
Help shape your community investment in Wake Transit. Fiscal Year 2019 Draft Work Plan Summary
 Help shape your community investment in Wake Transit Fiscal Year 2019 Draft Work Plan Summary Wake County, growth and transit The Triangle is one of the fastest-growing regions in the nation. Wake County
Leadership NC. November 8, 2018
 v Leadership NC November 8, 2018 Planning for our region s growth The Triangle is one of the fastestgrowing regions in the nation. More than 2 million people are already part of the equation, and the
Appendix C-5: Proposed Refinements Rail Operations and Maintenance Facility (ROMF) Traffic Impact Analysis. Durham-Orange Light Rail Transit Project
 Traffic Impact Analysis. Durham-Orange Light Rail Transit Project") Appendix C-5: Proposed Refinements Rail Operations and Maintenance Facility (ROMF) Traffic Impact Analysis Durham-Orange Light Rail Transit Project July 25, 218 ROMF Transportation Impact Analysis Version
Appendix C-5: Proposed Refinements Rail Operations and Maintenance Facility (ROMF) Traffic Impact Analysis Durham-Orange Light Rail Transit Project July 25, 218 ROMF Transportation Impact Analysis Version
FREQUENTLY ASKED QUESTIONS
 FREQUENTLY ASKED QUESTIONS 2018 What is the More MARTA Atlanta program? The More MARTA Atlanta program is a collaborative partnership between MARTA and the City of Atlanta to develop and implement a program
Task Force Meeting January 15, 2009
 Task Force Meeting January 15, 2009 Study Update August 14 th Task Force Meeting Update on Traffic Projections and Financial Feasibility Study presented by Kane County and WSA staff The presentation summarized
DRAFT DRAFT. Agenda Item #8. Presented to the Hampton Roads Transportation Planning Organization Board March 19, 2015
 Agenda Item #8 Presented to the Hampton Roads Transportation Planning Organization Board March 19, 2015 Dale M. Stith, AICP, GISP Principal Transportation Planner Hampton Roads Transportation Planning
Public Information Workshop
 Public Information Workshop Charlotte County-Punta Gorda MPO - Meeting Rooms A and B March 29, 2018 Welcome to the Public Information Workshop for Harborview Road Project Development and Environment (PD&E)
I-35W Past, Present, and Future: METRO Orange Line
 I-35W Past, Present, and Future: METRO Orange Line 2018 State Public Transportation Partnerships Conference Charles Carlson Director, BRT Projects Metro Transit Charles.Carlson@metrotransit.org Metro Transit:
Proposed Project I 35 Improvements from SH 195 to I 10
 I 35 ROADWAY Proposed Project I 35 Improvements from SH 195 to I 10 The existing I 35 facility from State Highway 195 (SH 195) north of Georgetown to Interstate 10 (I 10) in San Antonio varies from four
ANDERSON PROPERTY SITE ANALYSIS
 ANDERSON PROPERTY SITE ANALYSIS Introduction The Montgomery County Department of Transportation (MCDOT) initiated a feasibility study in the fall of 2012 to evaluate the need for transit service expansion
BERKELEY DOWNTOWN AREA PLAN PROGRAM ENVIRONMENTAL IMPACT REPORT TRAFFIC IMPACT ANALYSIS
 BERKELEY DOWNTOWN AREA PLAN PROGRAM ENVIRONMENTAL IMPACT REPORT TRAFFIC IMPACT ANALYSIS Prepared for: City of Berkeley Prepared by: REVISED JANUARY 9, 2009 Berkeley Downtown Area Plan Program EIR Traffic
Note: The October 2007 version of this report has been updated in this December 2008 report to present costs in year 2007 dollars.
 Sound Transit Phase 2 South Corridor LRT Design Report: SR 99 and I-5 Alignment Scenarios (S 200 th Street to Tacoma Dome Station) Tacoma Link Extension to West Tacoma Prepared for: Sound Transit Prepared
CITY OF LOS ANGELES DEPARTMENT OF AIRPORTS
 CITY OF LOS ANGELES DEPARTMENT OF AIRPORTS COMPRESSED NATURAL GAS 35-FOOT TRANSIT BUSES CONTRACT NUMBER ML09032 FINAL REPORT APRIL 2015 SUBMITTED BY: LOS ANGELES WORLD AIRPORTS MAINTENANCE DIVISION Prepared
Citizens Committee for Facilities
 Citizens Committee for Facilities AGENDA Thursday, December 11, 2014 City Council Chambers 305 3 rd Avenue East -Twin Falls, Idaho 11:30 A.M. AGENDA ITEMS Purpose By 1. Discussion and possible action on
EUGENE-SPRINGFIELD, OREGON EAST WEST PILOT BRT LANE TRANSIT DISTRICT
 EUGENE-SPRINGFIELD, OREGON EAST WEST PILOT BRT LANE TRANSIT DISTRICT (BRIEF) Table of Contents EUGENE-SPRINGFIELD, OREGON (USA)... 1 COUNTY CONTEXT AND SYSTEM DESCRIPTION... 1 SYSTEM OVERVIEW... 1 PLANNING
The Jack A. Markell Trail Delaware s Bicycle Highway New England Bike- Walk Summit
 The Jack A. Markell Trail Delaware s Bicycle Highway 2018 New England Bike- Walk Summit The Jack A. Markell Trail Sometimes a very difficult project, including significant investment and perseverance,
Executive Summary. Treasure Valley High Capacity Transit Study Priority Corridor Phase 1 Alternatives Analysis October 13, 2009.
 Treasure Valley High Capacity Transit Study Priority Corridor Phase 1 Alternatives Analysis October 13, 2009 Background As the Treasure Valley continues to grow, high-quality transportation connections
Purpose and Need Report
 Purpose and Need Report State Highway (SH) 29 From Southwestern Boulevard to SH 95 Williamson County, Texas (CSJ: 0337-02-045) Prepared by Blanton & Associates, Inc. Date: November, 2015 The environmental
Background Information about the Metrobus 29 Lines Study
 Background Information about the Metrobus 29 Lines Study Questions Overview of Existing Service Q. Why is the study being conducted? A. The 29 Lines provide an important connection between Annandale and
Traffic and Toll Revenue Estimates
 The results of WSA s assessment of traffic and toll revenue characteristics of the proposed LBJ (MLs) are presented in this chapter. As discussed in Chapter 1, Alternatives 2 and 6 were selected as the
The major roadways in the study area are State Route 166 and State Route 33, which are shown on Figure 1-1 and described below:
 3.5 TRAFFIC AND CIRCULATION 3.5.1 Existing Conditions 3.5.1.1 Street Network DRAFT ENVIRONMENTAL IMPACT REPORT The major roadways in the study area are State Route 166 and State Route 33, which are shown
TRAFFIC AND TRANSPORTATION TECHNICAL REPORT
 TRAFFIC AND TRANSPORTATION TECHNICAL REPORT for ENVIRONMENTAL ASSESSMENT Route 29 Bypass State Project No.: 0029-002-844, P101; UPC 102419 Federal Project Number: TBD From: Route 250 Bypass To: U.S. Route
WASHINGTON STATE ROAD USAGE CHARGE ASSESSMENT
 1 WASHINGTON STATE ROAD USAGE CHARGE ASSESSMENT Anthony L. Buckley Director, Office of Innovative Partnerships Washington State Department of Transportation Overview: Washington State Infrastructure 2
Transportation & Traffic Engineering
 Transportation & Traffic Engineering 1) Project Description This report presents a summary of findings for a Traffic Impact Analysis (TIA) performed by A+ Engineering, Inc. for the Hill Country Family
Building our future, together. Steering Committee Presentation for the Comprehensive Plan Update April 23, 2013
 Building our future, together Steering Committee Presentation for the Comprehensive Plan Update April 23, 2013 Vision In 2030, the City of Tyler will be nationally known for its commitment to community,
Traffic Impact Analysis West Street Garden Plots Improvements and DuPage River Park Garden Plots Development Naperville, Illinois
 Traffic Impact Analysis West Street Garden Plots Improvements and DuPage River Park Garden Plots Development Naperville, Illinois Submitted by April 9, 2009 Introduction Kenig, Lindgren, O Hara, Aboona,
6/6/2018. June 7, Item #1 CITIZENS PARTICIPATION
 June 7, 2018 Item #1 CITIZENS PARTICIPATION 1 Item #2 APPROVAL OF MINUTES Item #3 TRAC GOALS, FRAMEWORK & AGENDA REVIEW 2 COMMITTEE GOALS Learn about Southern Nevada s mobility challenges, new developments
March 2, 2017 Integrating Transportation Planning, Project Development, and Project Programming
 COORDINATION WITH VDOT DISTRICTS TO DELIVER IMPLEMENTABLE IMPROVEMENT PROJECTS March 2, 2017 Integrating Transportation Planning, Project Development, and Project Programming PRESENTATION OUTLINE What
Richmond Area MPO Regional Priority Transportation Projects
 Regional Priority Transportation Projects October 12, 2006 Town of Ashland Counties of Charles City Chesterfield Goochland Hanover Henrico New Kent Powhatan City of Richmond Richmond Regional Planning
Appendix 3 Traffic Technical Memorandum
 Appendix 3 Traffic Technical Memorandum DRAFT TECHNICAL MEMORANDUM Southport Connector Project Traffic Development Comparison of Future Year Model Results Date: September 10, 2015 Project #:11730.030 To:
Transit City Etobicoke - Finch West LRT
 Delcan Corporation Transit City Etobicoke - Finch West LRT APPENDIX D Microsimulation Traffic Modeling Report March 2010 March 2010 Appendix D CONTENTS 1.0 STUDY CONTEXT... 2 Figure 1 Study Limits... 2
Kendall Drive Premium Transit PD&E Study Project Kick-Off Meeting SR 94/Kendall Drive/SW 88 Street Project Development and Environment (PD&E) Study
 Study") Florida Department of Transportation District Six Kendall Drive Premium Transit PD&E Study Project Kick-Off Meeting SR 94/Kendall Drive/SW 88 Street Project Development and Environment (PD&E) Study What
Florida Department of Transportation District Six Kendall Drive Premium Transit PD&E Study Project Kick-Off Meeting SR 94/Kendall Drive/SW 88 Street Project Development and Environment (PD&E) Study What
Executive Summary. Draft Environmental Impact Statement/Environmental Impact Report ES-1
 Executive Summary Introduction The Eastside Transit Corridor Phase 2 Project is a vital public transit infrastructure investment that would provide a transit connection to the existing Metro Gold Line
The Case for. Business. investment. in Public Transportation
 The Case for Business investment in Public Transportation Introduction Public transportation is an enterprise with expenditure of $55 billion in the United States. There has been a steady growth trend
Bow-Concord Interstate 93 Transportation Planning Study
 Bow-Concord Interstate 93 Transportation Planning Study Presentation to: Greater Concord Chamber of Commerce and Concord 2020 June 21, 2006 Transportation in New Hampshire NH Transportation Business Plan
Unified Corridor Investment Study DRAFT Step 2 Scenario Analysis Report
 Unified Corridor Investment Study DRAFT Step 2 Scenario Analysis Report REVISIONS 1. Table 39: New Public Investments for Operation and Maintenance Costs 2. Appendix A-10: Passenger Rail Service - Operations