Transit Access to the National Harbor
|
|
|
- Bryan Hoover
- 5 years ago
- Views:
Transcription


1
2


3 Transit Access to the National Harbor December 2014
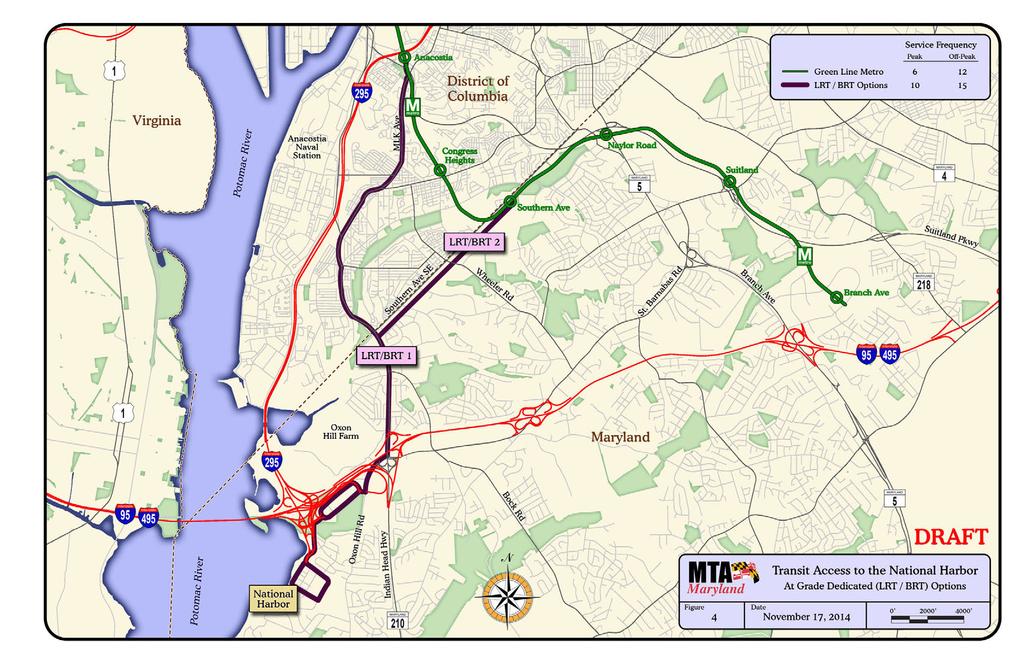
4 Table of Contents Executive Summary... 3 Introduction and Project Purpose... 6 Methodology.. 9 Definition of Alternatives Similar Project Implementation History Ridership Analysis.. 16 Cost Estimates.. 17 Conclusions and Next Steps Appendix A: Ridership Calculations Appendix B: Cost Estimates Appendix C: MGM National Harbor Responses to Comprehensive Transportation Plan Questions List of Tables Table 1: Summary of Transit Alternative Implementation Timelines and Capital Costs. 5 Table 2: Characteristics of Similar Transit Projects 15 Table 3: Estimated Daily Ridership for Transit Alternatives 16 Table 4: Estimated Capital and Operating Costs. 17 Table 5: Summary of Study Findings 19 List of Figures Figure 1: Existing Oxon Hill Area Lines Route Map... 8 Figure 2: Existing Transit Service Figure 3: Mixed Traffic (Bus) Options Figure 4: At Grade Dedicated (LRT/BRT) Options.. 13 Figure 5: Grade Separated (Metro) Options Transit Access to the National Harbor 2 December 2014
5 Executive Summary The 2014 Maryland General Assembly Joint Chairmen s Report requested that the Maryland Department of Transportation (MDOT) submit a report examining how the transportation conditions at National Harbor have changed with the addition of the casino license award for the MGM National Harbor Casino/Hotel and a refined purpose and need statement for a transit solution looking at prudent and feasible alternatives. Following this request, the Transit Access to the National Harbor report will document the feasibility of providing transit service to the National Harbor from the Maryland side of the Potomac River. The study focuses on connections to Washington Metropolitan Area Transit Authority s (WMATA) Green Line Metrorail stations as this would provide linkages to the existing regional transit network. This study builds on the South Side Transit Study prepared by the Maryland Transit Administration (MTA) in April 2013, but with a Maryland-only focus, and incorporates information regarding the MGM National Harbor Casino/Hotel at National Harbor as documented in the Draft Traffic Impact Study dated April 30, 2014 and ridership information for Metrobus Route NH1 provided by WMATA. Both WMATA and Prince George s County currently provide fixed route bus service to National Harbor. Prince George s County TheBus Route 35 provides service Monday through Friday, every 30 minutes, from approximately 6:00 a.m. until 8:00 p.m. WMATA s Metrobus Route NH1 provides service seven days per week, every 30 minutes from approximately 6:00 a.m. until 12:00 a.m., with Metrobus Route NH3 providing some supplemental late night service. The existing transit service carries an average of 24 riders per hour on WMATA s NH1 Metrobus route and 14 riders per hour on TheBus Route 35. The capacity of a standard bus is approximately 65 passengers. With the NH1 running two buses per hour having the combined capacity to carry 130 passengers per hour, the current average of 24 riders per hour represents only an 18 percent utilization of the available capacity on that route. TheBus Route 35 also has a capacity of 130 passengers per hour, with the current ridership representing 11 percent utilization of the available capacity. WMATA, MTA and Prince George s County have conducted a number of recent studies of transit in the area with consideration of the National Harbor as a primary destination. In addition to evaluating existing transit service, these agencies have identified and evaluated alternative transit options to serve the future transit needs of customers traveling to and from the National Harbor area. As part of this study, the team researched the characteristics of similar transit projects to understand the typical project length, number of stations, capital cost and implementation schedule (based on the initial feasibility study, NEPA requirements, and start of revenue service) for the various modes under consideration. Information collected from these similar projects was used to help illustrate the basic differences between the various transit modes. Key Findings An extension of the Metrorail system to serve the National Harbor is not feasible in the short term and would require significant Metrorail system improvements to be implemented in the long term. WMATA currently runs a maximum of 12 trains per hour on the Green Line. Constructing a new branch of the Green Line to serve the National Harbor would reduce the maximum service to only six trains per hour on each branch which would be a major reduction Transit Access to the National Harbor 3 December 2014
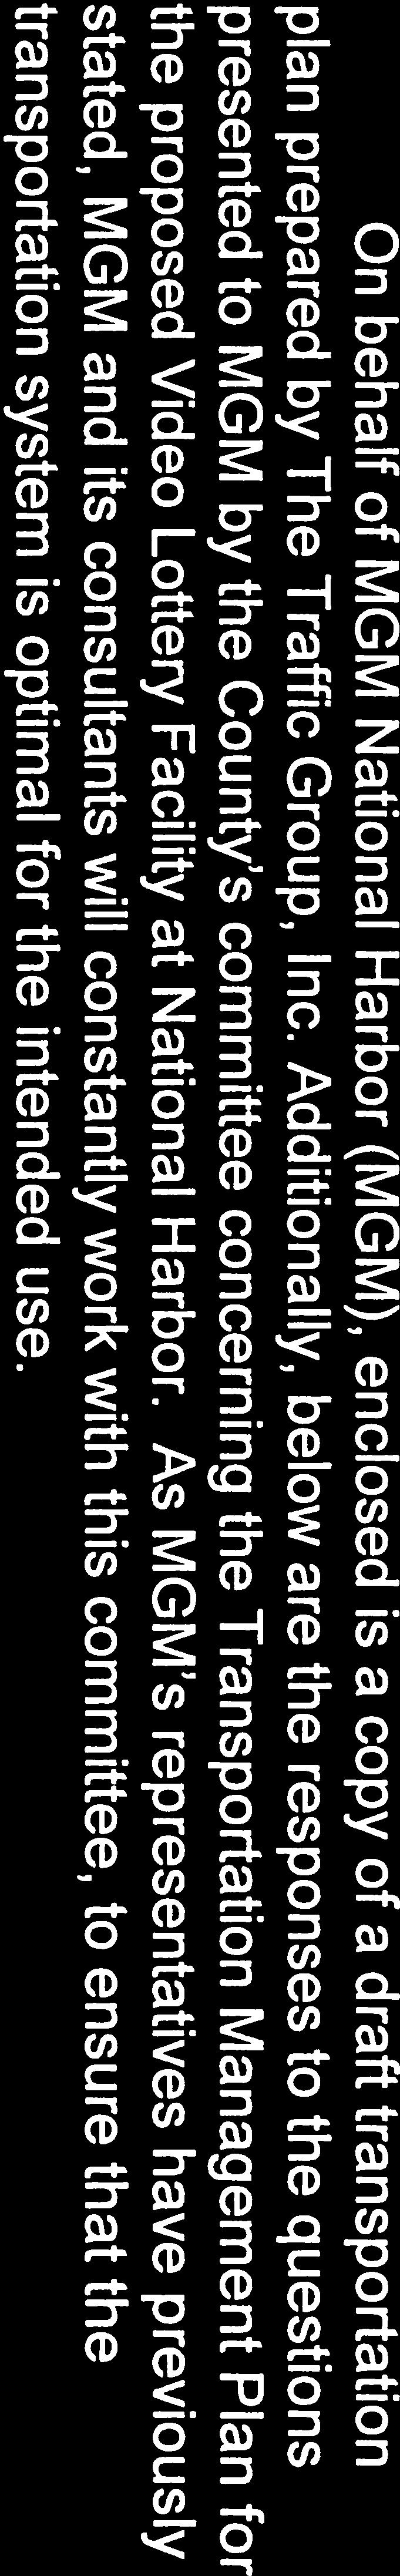
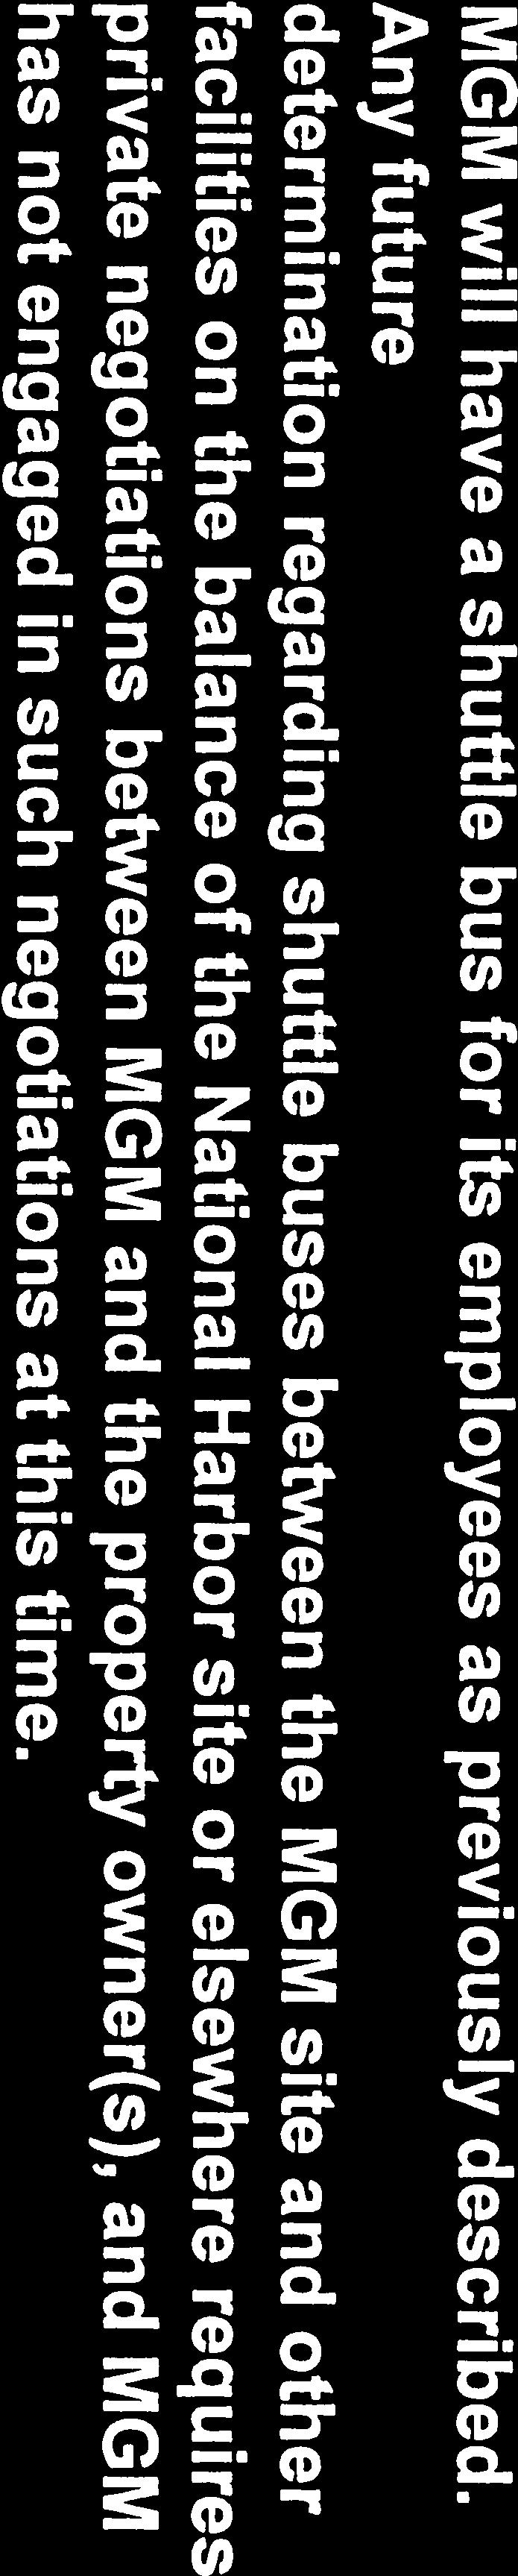
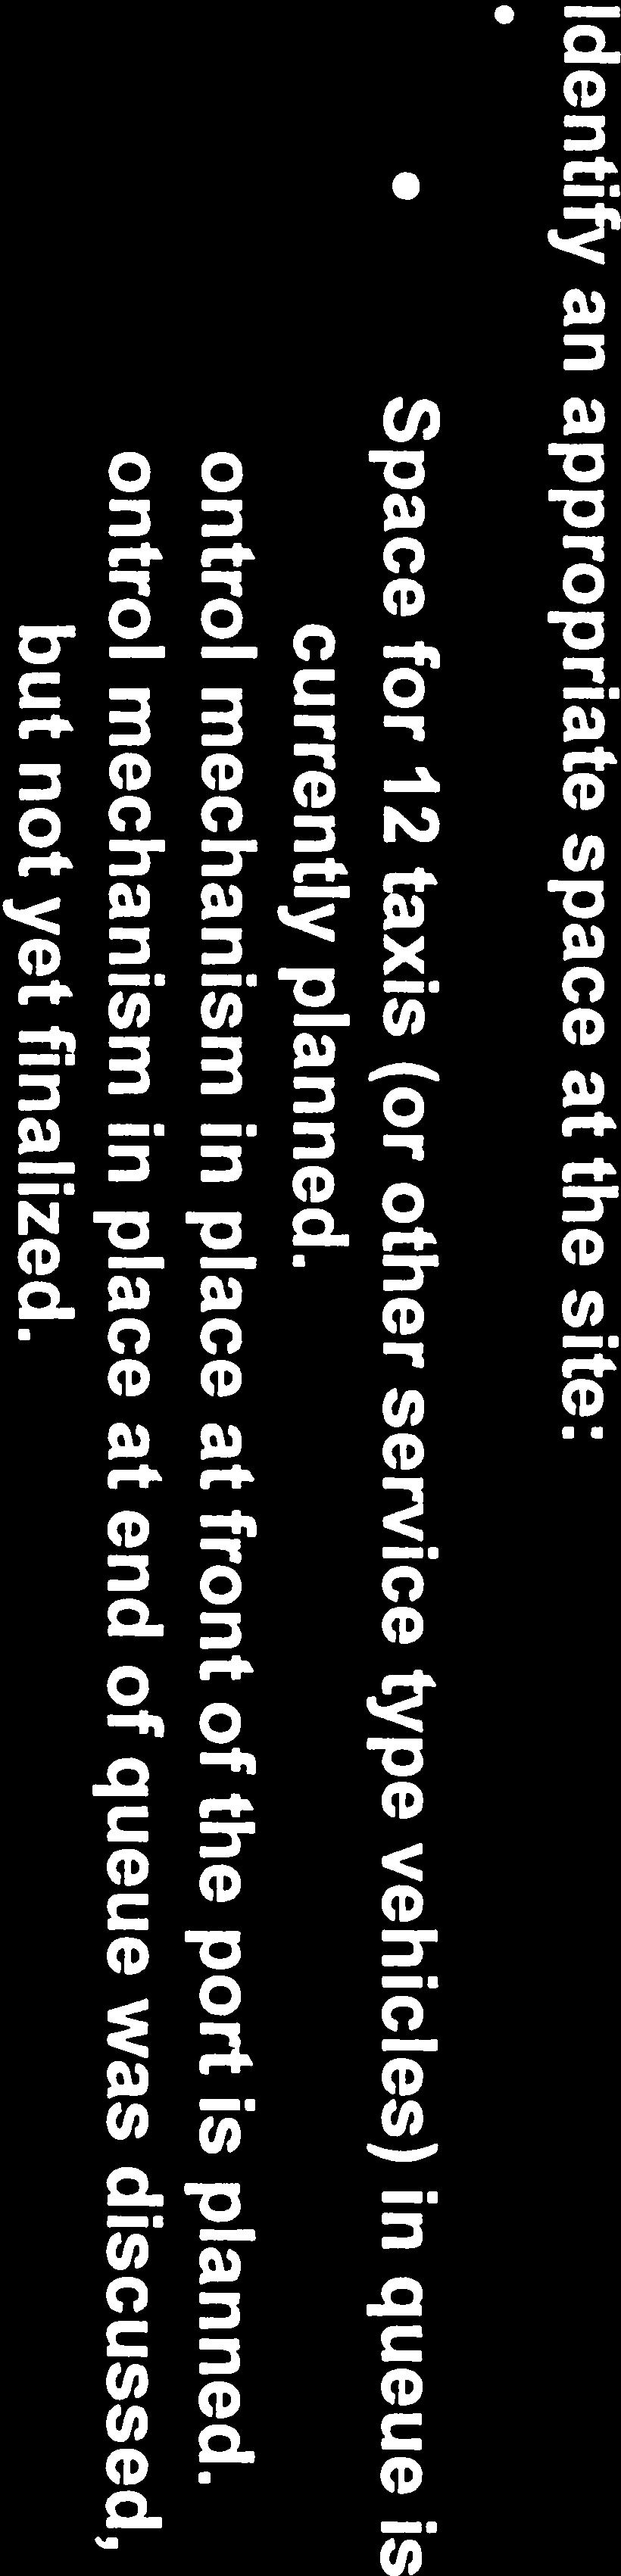
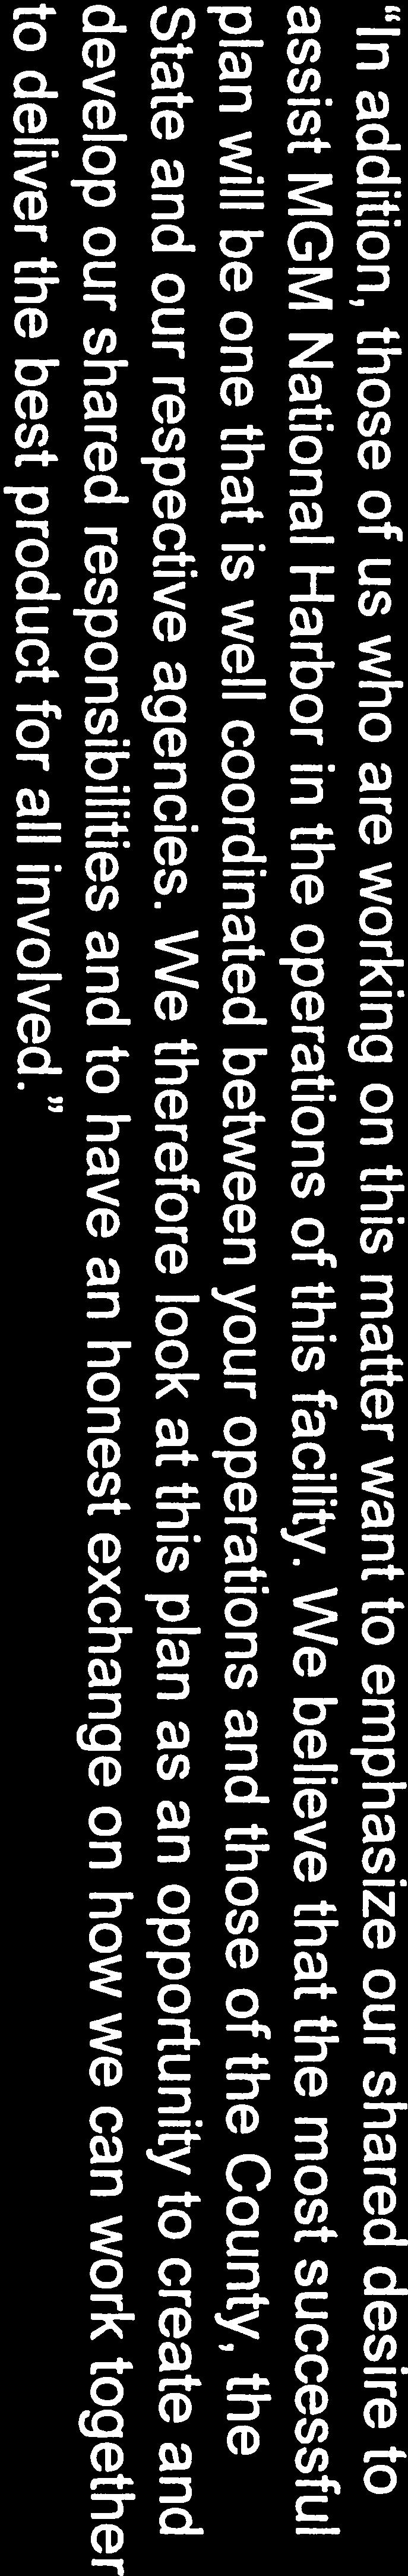
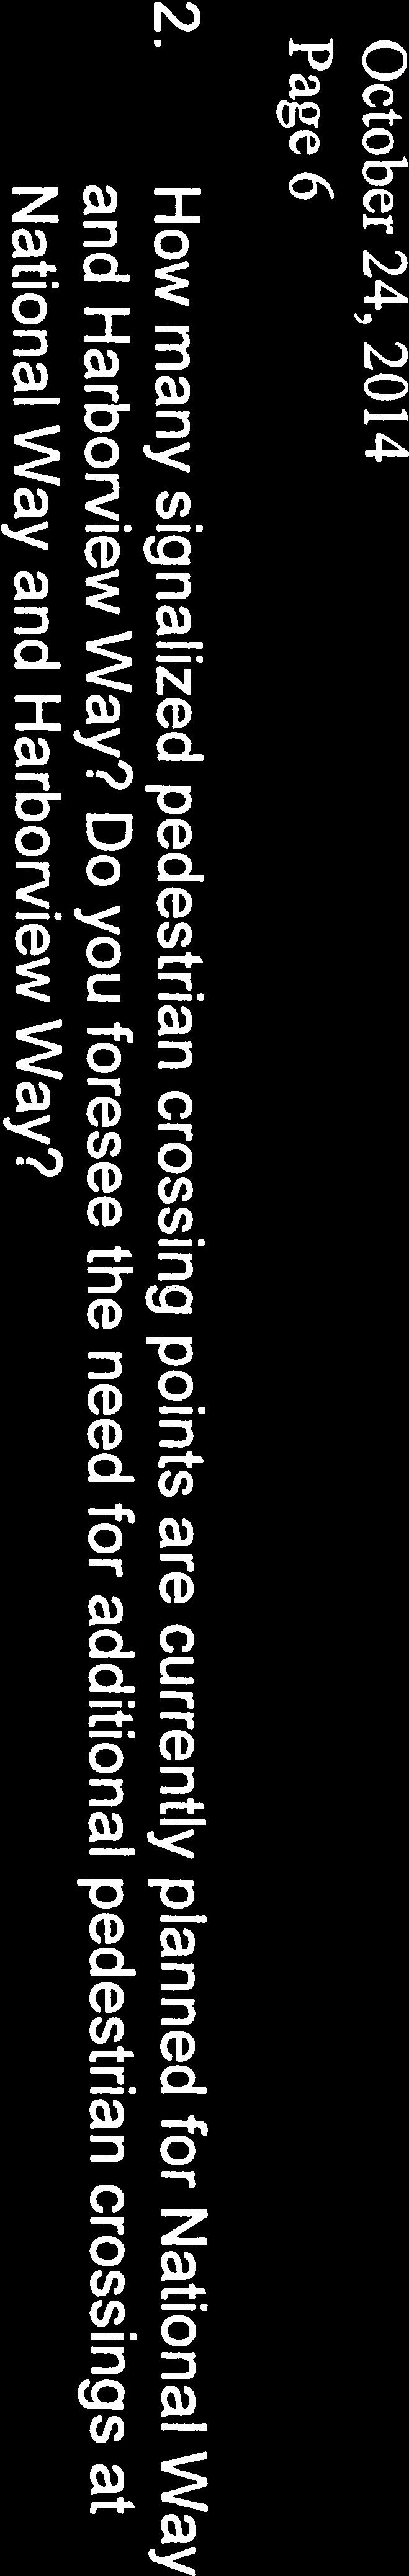
6 in the level of service on the existing Green Line. An extension of the Metrorail system could cost $1.2 $4 billion in 2015 dollars and, based on the implementation time required for other Metrorail extension projects, could have a lengthy project planning and development timeline that could span as much as years. A Light Rail Transit (LRT) or Bus Rapid Transit (BRT) connection to the National Harbor could tie into the existing Metrorail system at the Southern Avenue station. This would provide connections to both the regional Metrorail system as well as a number of existing local bus routes. A new transit service in a dedicated fixed guideway would likely take years to implement depending on the technology selected and the length of the system. Either a LRT or BRT system would likely require a new vehicle storage and maintenance facility and would cost approximately $500 million in 2015 dollars. Expanded bus service to the National Harbor could be implemented in one to three years depending on the extent of the bus service. Implementing a completely new route with new vehicles and new stops could cost approximately $40 million in 2015 dollars, the bulk of which is due to the cost of the vehicles, systems, and bus stops. WMATA plans to restructure its existing NH1 Metrobus service to eliminate NH1 service to Branch Avenue Metrorail Station and instead connect National Harbor to the Southern Avenue Metrorail station via MD 414 (Oxon Hill Road/St. Barnabas Road), Owens Road, and Southern Avenue in June In addition to this restructured line, the most promising options for additional bus service would consist of a limited stop route from the Southern Avenue Metrorail station to National Harbor and/or a restructuring of the existing P17, P18, P19 Metrobus service from the Anacostia Station through the Martin Luther King Boulevard corridor to expand hours of service and provide a shuttle bus connection from the Oxon Hill Park and Ride to the MGM National Harbor Casino/Hotel and National Harbor. It is important to note that providing effective transit service to the National Harbor and the MGM National Harbor Casino/Hotel is highly dependent on providing transit stations that conveniently serve the destinations. The owners and developers of these properties would need to incorporate transit service into the overall site plan that supports transit as a convenient travel option. In an October 24, 2013 letter to Prince George s County (included as Appendix C), MGM estimates that the number of employee staff that will utilize transit is likely to be in the 1% to 2% range (almost non-existent.) It is also expected that there will likely be no guests using transit to arrive at the Casino. The letter goes on to say that Transit buses will not be arriving at the Casino site. With this expectation about utilization of transit service and no provision of transit facilities, growing transit ridership in this corridor will be difficult. Table 1 below summarizes the estimated implementation timelines and costs associated with each of the transit alternatives evaluated as part of this report. To estimate the Year of Expenditure costs in future dollars, an escalation rate of 3% was used to estimate the low end of the cost ranges, and an escalation rate of 5% was used to estimate the high end of the cost ranges. Transit Access to the National Harbor 4 December 2014
7 Table 1: Summary of Transit Alternative Implementation Timelines and Capital Costs Transit Alternative Estimated 2015 Capital Cost Projected Implementation Timeline Estimated Year of Completion Estimated Year of Expenditure Capital Cost Bus 1 $38-$40 Million 3 years 2018 $42-$47 Million LRT 1 $458-$485 Million 25 years 2040 $1.0-$1.7 Billion BRT 1 $458-$485 Million 10 years 2025 $615-$790 Million LRT 2 $327-$346 Million 25 years 2040 $684 Million-$1.2 Billion BRT 2 $327-$346 Million 10 years 2025 $439-$563 Million Metro 1 $3.9-$4.1 Billion 40 years 2055 $13.0-$29.0 Billion Metro 2 $1.2-$1.3 Billion 40 years 2055 $4.0-$9.0 Billion NOTE: Estimated costs do not include right-of-way costs. Transit Access to the National Harbor 5 December 2014
8 Introduction and Project Purpose On page 62 of the Joint Chairmen s Report on the Fiscal 2015 State Operating Budget, the Maryland Department of Transportation (MDOT) is directed to submit a report examining how the transportation conditions at National Harbor have changed with the addition of the casino license award for the MGM National Harbor Casino/Hotel and refining a purpose and need statement for a transit solution looking at prudent and feasible alternatives. Specifically, the report states: National Harbor is a significant economic generator for Prince George s County and Maryland as a whole and will continue to grow with construction of Maryland s sixth casino. However, there is no planned transit line that will help alleviate traffic congestion in the region and support continued economic growth. There have been studies conducted on constructing and extending rail transit service over the Woodrow Wilson Bridge including a stop at National Harbor, but there has been no clear evaluation of cost effectiveness or feasibility. The Maryland Department of Transportation (MDOT) should submit a report examining how the transportation conditions at National Harbor have changed with the addition of the casino license award and refine a purpose and need statement for a transit solution looking at all prudent and feasible alternatives. This report should specifically examine what economic benefits could be realized with extending rail to the National Harbor area. In response to this request, the purpose of the Transit Access to National Harbor report is to document the feasibility of providing transit service to the National Harbor from the Maryland side of the Potomac River. The study focuses on connections to Washington Metropolitan Area Transit Authority s (WMATA) Green Line Metrorail stations as this would provide linkages to the existing regional transit network. This study builds on the South Side Transit Study prepared by the Maryland Transit Administration (MTA) in April 2013, but with a Maryland-only focus, and incorporates information regarding the MGM National Harbor Casino/Hotel at National Harbor as documented in the Draft Traffic Impact Study dated April 30, 2014 and ridership information for Metrobus Route NH1 provided by WMATA. The report was coordinated with MDOT, MTA, WMATA, and Prince George s County. Each of these agencies is responsible for managing and overseeing elements of the public transit service in the vicinity of the National Harbor. It is important to note that a number of recent studies have been conducted to evaluate the effectiveness of existing transit service in the area and to identify and prioritize options to provide transit to accommodate existing needs and future growth. Several of these studies specifically identified the National Harbor as a primary travel destination. The previous studies reviewed as part of this analysis included: South Side Transit Study, MTA, April 2013 The intent of the study was to identify the most viable alternatives for implementing transit service across the Woodrow Wilson Bridge (WWB) as described in the South Side Transit Study: Initial Alternatives Report (November 2011). The report presents an analysis of the estimated costs, cost-effectiveness, and potential land use issues associated with several transit alternatives. Each alternative presented connects the Transit Access to the National Harbor 6 December 2014
9 Metrorail Green Line in Maryland with the Metrorail Blue/Yellow Line in Virginia utilizing the center lanes of the WWB to cross the Potomac River. The recommended alternative contains two station stops within National Harbor, serving both the northern and southern limits of the area. Metrobus Service Evaluation Study Oxon Hill Area, WMATA, July 2014 The purpose of the study was to review capacity, productivity, and quality of service indicators for several of the existing WMATA Metrobus lines in the Oxon Hill Area (D12/13/14, NH1/3, P17/18/19, W13/14/15 and W19). The report also identified the need for customer facilities and presented several recommendations to improve service delivery for the aforementioned lines. Recommendations were categorized into short-, mid- and long-term implementation time frames and include annual cost figures. Several of the recommendations made in the report suggested bus routes to National Harbor be added, including weekend service to National Harbor from the King Street Metrorail station and weekday service between the Southern Avenue Metrorail station and National Harbor. Figure 1 shows the existing Metrobus routes in the area as documented in this study. Metrobus Service Changes Public Hearing Document, WMATA, September 2014 WMATA held public hearings in September and October 2014 to present proposed bus service changes. In order to serve the greatest number of customers as efficiently and effectively as possible, Metro periodically adjusts bus service to match commuting patterns as well as changes in discretionary travel destinations and ridership demands. WMATA presented its plans to the public to restructure NH1 bus service between Branch Avenue Station and National Harbor by rerouting the NH1 and NH3 bus services from National Harbor through the Southview Apartments to the Southern Avenue Metrorail station. The proposed changes will be presented to the Metro Customer Service and Operations Committee and the full Metro Board in December If the service changes are approved, they would become effective in June Transitway Systems Planning Study, Prince George s County, December 2012 This report provides an initial framework for the continued development of a transitway system within Prince George s County, Maryland. The study team reviewed and summarized existing transit service in the County, engaged key stakeholders to share current planning efforts and provide feedback on the study, and developed a corridor evaluation tool and prioritized transitway corridors within the County. The study team categorized National Harbor as a priority corridor and recommended a concept-level study be carried out in the near future. Transit Access to the National Harbor 7 December 2014

10 Figure 1: Existing Oxon Hill Area Lines Route Map Source: Metrobus Service Evaluation Study Oxon Hill Area, July 2014 Transit Access to the National Harbor 8 December 2014
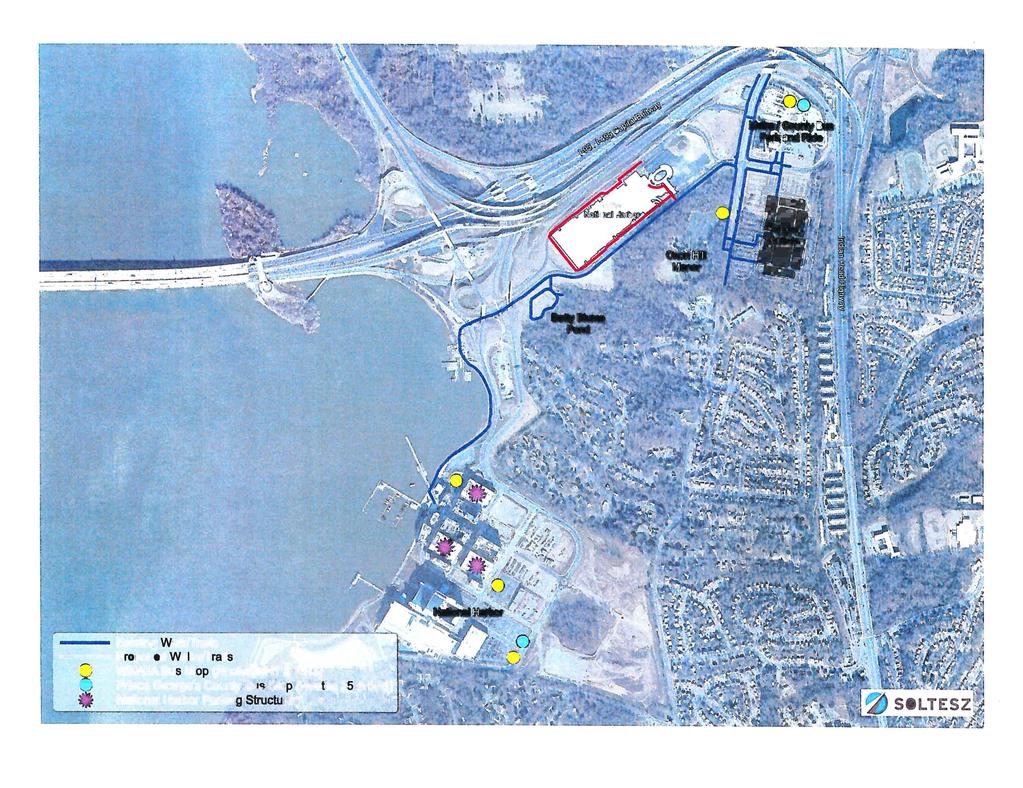
11 Methodology The South Side Transit Study (SSTS) documented the results of the efforts to identify and evaluate transit alternatives to connect the Metro Yellow line service on the west side of the Potomac in Virginia to the Metro Green line service on the east side of the Potomac in Maryland using the Woodrow Wilson Bridge (WWB) and terminating at the National Harbor. The SSTS included mixed traffic options (limited stop bus service using existing streets), at-grade, dedicated right-of-way options (Light Rail Transit/Bus Rapid Transit), and grade-separated options (Metrorail extension). The SSTS alternatives originated from a number of stations along the Metro Green line with intermediate connections to the National Harbor en route to the WWB and were defined to represent the most feasible options for serving the National Harbor on the Maryland side of the River. For this report, the SSTS alternatives were truncated to only include the portion on the east side of the Potomac. The transit alternatives were evaluated to provide estimates of the capital and operating costs and potential ridership. The cost estimates from the SSTS were reviewed and adjusted for the truncated Maryland-only alternatives. Similarly, the ridership estimates from the SSTS were reviewed and adjusted to reflect the truncated Maryland-only alternatives as well as potential ridership due to the planned MGM National Harbor Casino/Hotel. Existing ridership on the NH1 bus line was provided by WMATA. Definition of Alternatives The study team began by reviewing the existing transit service to National Harbor, as shown on Figure 2. Next, the team examined the alternatives defined in the SSTS and retained SSTS alternatives for further evaluation that did not duplicate existing or planned transit service, were expected to generate a reasonable level of ridership, and could serve National Harbor on the Maryland side of the Potomac River. These alternatives included mixed traffic options (limited stop bus service using existing streets), at-grade, dedicated right-of-way options (Light Rail Transit [LRT] or Bus Rapid Transit [BRT]), and gradeseparated options (Metrorail extension). An initial set of five alternatives (described below and shown on Figures 3-5) were defined based on the SSTS: Bus 1 regular bus service in mixed traffic between National Harbor and the Southern Avenue Metrorail Station LRT/BRT 2 Light Rail Transit or Bus Rapid Transit service in a dedicated transit lane between National Harbor and the Anacostia Metrorail Station LRT/BRT 2 Light Rail Transit or Bus Rapid Transit service in a dedicated transit lane between National Harbor and the Southern Avenue Metrorail Station Metro 1 Heavy rail service in an underground tunnel (as assumed by the SSTS) between National Harbor and the Anacostia Metrorail Station Metro 2 Heavy rail service on an aerial structure (as assumed by the SSTS) between National Harbor and the Suitland and Branch Avenue Metrorail Stations Transit Access to the National Harbor 9 December 2014
12 These initial alternatives were reviewed with staff from MDOT, WMATA, and Prince George s County. Conclusions from this review were as follows: The existing NH1 service between National Harbor and the Branch Avenue Station on the Green line has subpar ridership. WMATA staff intend to reorient the NH1 service to serve the Southern Avenue station on the Green line and expect improved ridership due to a shorter travel time to the National Harbor, increased connections to existing local bus routes, and service to additional local trip generators. Based on the experience with the existing NH1 route, it was recommended that fixed guideway options should originate at either the Southern Avenue station or the Anacostia station on the Green Line. Transit Access to the National Harbor 10 December 2014
13
14
15
16
17 Similar Project Implementation History As part of this study, the team researched the characteristics of similar transit projects to understand the typical project length, number of stations, capital cost and implementation schedule (initial feasibility study, NEPA requirements, start of revenue service) for the various modes under consideration. Information collected from these similar projects was used to help illustrate the basic differences between the various transit modes. Table 2 lists the characteristics of transit projects around the country for heavy rail, LRT and BRT projects around the country. Table 2 illustrates that the implementation schedule can vary greatly depending on the transit mode. While a specific standard bus project was not identified as part of this exercise, WMATA and Prince George s County transit planning staff noted that the implementation schedule for a new bus route is typically one to three years and is largely dependent on the procurement time required to obtain the vehicles. Transit Access to the National Harbor 15 December 2014

18 Table 2: Characteristics of Similar Transit Projects Transit Access to the National Harbor 15 December 2014
19 Ridership Analysis Using ridership forecasts developed for the SSTS and ridership information provided by WMATA and Prince George s County, the study team developed estimates of ridership on the truncated alternatives defined above. The ridership adjustments account for two factors: Elimination of the transit connection across the Potomac River Additional trips generated by the MGM National Harbor Casino/Hotel development that were not included in the SSTS forecasts. The ridership adjustments were made based on station-to-station boarding data provided in the SSTS. The scope of the current study does not include detailed ridership modeling using the Maryland Alternative Analysis II (MDAA II) regional travel demand model. Therefore, a range of ridership estimates was developed using the following two procedures to generate high and low ridership estimates: Procedure 1 (high estimate) the passenger boardings at each station were distributed to other stations along the line proportionate to the forecast boardings at the other stations. Passenger trips to stations across the Potomac River in Virginia were then deducted. Procedure 2 (low estimate) the passenger boardings at each station were distributed to other stations along the line proportionate to the forecast boardings at the other stations. However, boardings at stations across the Potomac River in Virginia were weighted by a factor of 2 to account for the strong demand for additional transit river crossing capacity. This factor of 2 was estimated based on the reported transit trips crossing the river compared to the number of boardings on the Virginia side of the river. In addition, potential transit trips to the MGM National Harbor Casino/Hotel were added to the forecast ridership. The Traffic Impact Analysis for the MGM National Harbor Casino/Hotel (April 30, 2014) estimated Friday PM Peak Hour trip generation to be 1,400 trips. It was estimated that the MGM National Harbor Casino/Hotel would generate approximately 21,000 average weekday daily trips. Depending on the convenience of the transit service to the MGM National Harbor Casino/Hotel, it is expected that approximately five to 10 percent of visitors and employees would travel by transit. Table 3 presents the estimated daily range of ridership calculated from the two procedures for each of the transit alternatives under consideration. Please note that these estimates represent a refinement of the 2040 ridership forecasts presented in the SSTS with the estimated additional trips generated by the MGM National Harbor Casino/Hotel incorporated. More detailed ridership calculations are included in Appendix A of this report. Table 3: Estimated Daily Ridership for Transit Alternatives Daily Ridership Bus 1 LRT/BRT 1 LRT/BRT 2 Metro 1 Metro 2 1,300-1,800 26,000-33,000 18,000-23,000 23,000-28,000 11,000-14,000 Transit Access to the National Harbor 16 December 2014
20 Cost Estimates The study team estimated planning-level costs for each alternative. These costs were based on the estimates provided in the SSTS and adjusted to account for the truncation of the alternatives in the SSTS. The study team reviewed the unit costs used in the SSTS based on other current transit projects and escalated the costs from 2012 dollars to 2015 dollars using a five percent annual inflation rate to be conservative. Annual operating costs were estimated by adjusting the annual revenue service hours to account for the truncation of the alternatives resulting in reduced travel times. Table 4 presents the estimated capital and operating costs for each of the transit alternatives under consideration in 2015 dollars. Detailed cost estimates are included in Appendix B of this report. Capital Cost (2015 $) Capital Cost Per Mile (2015 $) Annual Operating Cost (2015 $) Table 4: Estimated Capital and Operating Costs Bus 1 LRT/BRT 1 LRT/BRT 2 $38 - $40 Million $6 - $7 Million $458 - $485 Million $70 - $75 Million $327 - $346 Million $64 - $68 Million Metro 1 (Tunnel) $3.9 - $4.1 Billion $619 - $651 Million Metro 2 (Aerial Structure) $1.2 - $1.3 Billion $188 - $204 Million $4 Million $3 Million $2.5 Million $3.5 Million $4 Million *NOTE: Estimated costs do not include right-of-way costs. It is important to note that while LRT and BRT were combined for the purposes of analysis in the SSTS and also in this report, there are often significant cost differences between them (as shown in Table 2). It is also important to note that that these costs could increase dramatically depending on when the transit alternative is constructed. For example, the capital cost of constructing the LRT/BRT 1 alternative in the year 2015 is estimated to be approximately $460-$485 million. Taking into account an implementation schedule of approximately 15 years (based on the similar projects listed in Table 3) and adjusting the cost for inflation, the capital cost of constructing the LRT/BRT 1 alternative in the year 2030 could cost over $1 billion. Transit Access to the National Harbor 17 December 2014
21 Conclusions and Next Steps Table 5 summarizes the characteristics associated with each of the transit alternatives evaluated as part of this study, including an estimate of the capital costs associated with each alternative in the Year of Expenditure. To estimate the Year of Expenditure costs in future dollars, an escalation rate of 3% was used to estimate the low end of the cost ranges, and an escalation rate of 5% was used to estimate the high end of the cost ranges. Though this table does not include the cost of right-of-way acquisition that could be necessary for the fixed guideway transit alternatives (LRT/BRT and Metro), right-of-way costs could be substantial and the property acquisition process could be lengthy. In order to improve transit access to the National Harbor, the next step would be to present the information in this report to the Maryland General Assembly and get input from project stakeholders on the desire to further study a new transit line. If there is interest in pursuing such a project, Prince George s County could work with local and state elected officials to identify the transit project as a County priority and include it in the Prince George s County Priority Projects letter to MDOT. At that point, if the project is high enough on the list for transit priorities, MDOT and MTA will work with the County to get further information and include the project, or portions of the project (Planning, Design, Right of Way acquisition, or Construction) in a future Consolidated Transportation Plan (CTP). Prior to inclusion in the CTP, the agencies could partner to secure local or private funding and undertake a more detailed feasibility study to understand the project purpose and need, conduct more detailed ridership forecasting, and develop more detailed concepts, cost estimates, and impacts. Transit Access to the National Harbor 18 December 2014
22 Alternative Characteristics (All Information is Projected) Table 5: Summary of Study Findings Transit Alternatives Bus 1 LRT/BRT 1 LRT/BRT 2 Metro 1 Metro 2 Operating Configuration at-grade, mixed traffic at-grade, dedicated right-of-way at-grade, dedicated right-of-way grade separated, in tunnel grade separated, aerial structure Vehicle Technology Standard Bus Light Rail/Bus Rapid Transit Light Rail/Bus Rapid Transit Metro (heavy rail) Metro (heavy rail) Route Origin Southern Ave. Metrorail Station Anacostia Metrorail Station Southern Ave. Metrorail Station Anacostia Metrorail Station Branch Ave./Suitland Metrorail Station Route Length 5.9 miles 6.5 miles 5.1 miles 6.3 miles 6.4 miles Service Frequency 10 min peak, 15 min off peak 10 min peak, 15 min off peak 10 min peak, 15 min off peak 10 min peak, 15 min off peak 10 min peak, 15 min off peak Number of Vehicles Required Daily Ridership 1,300-1,800 26,000-33,000 18,000-23,000 23,000-28,000 11,000-14,000 Operating Cost (2015$) $4 Million $3 Million $2.5 Million $3.5 Million $4 Million *Capital Cost (2015$) $38 - $40 Million $458 - $485 Million $327 - $346 Million $3.9 - $4.1 Billion $1.2 - $1.3 Billion *Capital Cost Per Mile (2015$) $6 - $7 Million $70 - $75 Million $64 - $68 Million $619 - $651 Million $188 - $204 Million Implementation Timeline 3 years LRT: 25 years LRT: 25 years 40 years 40 years BRT: 10 years BRT: 10 years *Year of Expenditure Capital Cost $42 - $47 Million (2018$) LRT: $1.0 - $1.7 Billion (2040$) LRT: $684 Million - $1.2 Billion (2040$) $ $29.0 Billion (2055$) $4.0 - $9.0 Billion (2055$) BRT: $615 - $790 Million (2025$) BRT: $439 - $563 Million (2025$) *NOTE: Estimated costs do not include right-of-way costs. Transit Access to the National Harbor 19 December 2014
23 Appendix A: Ridership Calculations
24 Bus 1 - SSTS Alternative 1C Boardings W/O WWB ADD 5-10% to these Route boardings exclusive to new alignment Boardings W/O WWB Weighted River crossing ranges to account for Southern Avenue P&R potential casino Wash. Highlands North visitor/employee use Wash. Highlands South Eastover P&R Forest Heights North Forest Heights South Oxon Hill P&R National Harbor North National Harbor South Cross river 1320 Low High TOTAL BOARDINGS ,616 1,166 Say 1200 to Weighted River crossing LRT 1 - SSTS Alternative 2Cr Route boardings exclusive to new alignment Anacostia ,590 8,487 St. Elizabeth's ,813 1,537 Congress Heights ,398 1,187 Bellevue ,512 2,953 Eastover P&R ,764 2,333 Forest Heights ,504 1,277 Oxon Hill P&R ,642 1,393 National Harbor North ,675 1,421 National Harbor South ,857 4,056 Cross river 7760 TOTAL BOARDINGS ,754 24,644 Say 25,000 to 30, Weighted River crossing
25 LRT 2 - SSTS Alternative 2C Route boardings exclusive to new alignment Southern Avenue P&R ,079 4,151 Washington Highlands ,492 4,470 Eastover P&R ,348 2,779 Forest Heights ,405 1,182 Oxon Hill P&R ,747 2,290 National Harbor North National Harbor South ,716 2,265 Cross river 5720 ADD 5-10% to these ranges to account for potential casino visitor/employee use TOTAL BOARDINGS ,786 17,138 Say 17,000 to 21, Weighted River crossing Metro 1 - SSTS Alternative 3C Route boardings exclusive to new alignment Anacostia P&R 1370 SB 6600 northbound St. Elizabeth's ,340 3,811 Bellevue ,765 5,025 Eastover P&R ,001 5,224 National Harbor North ,699 4,969 National Harbor South ,666 3,229 Yellow Boardings 4210 TOTAL BOARDINGS ,471 22,258 Say 22,000 to 25, Weighted River crossing Metro 2 - SSTS Alternative 3B Route boardings exclusive to new alignment Boardings without trips across WWB Branch Avenue Suitland ,081 3,025 St. Barnabas ,854 1,432 Oxon Hill ,291 1,758 National Harbor North ,178 3,089 Eisenhower Avenue 6930 TOTAL BOARDINGS ,805 9,619 Say 10,000 to 13, Weighted River crossing
26 Appendix B: Cost Estimates
27 Cost Estimates With 3% Inflation Rate Bus 1 SCC Unit Cost (2012$) Unit Cost (2015$) Quantity Cost 10 Guideway and Track Elements Unit Mixed Traffic mile $40,000 $43, $256, Surface (allows cross traffic) mile $0 $0 0 $0.00 Surface (dedicated) mile $0 $0 0 $0.00 Retained cut or fill mile $12,128,000 $13,252,593 0 $0.00 Tunnel mile $0 0 $0.00 Aerial mile $42,226,000 $46,141,490 0 $ Stations, Stops, Terminals, Intermodals each $662,000 $723,385 8 $5,787, Support Facilities each $0 $0 0 $ Sitework mile $0 $0 0 $ Systems mile $1,654,000 $1,807, $10,609, ROW, Land, Existing Improvements % of % 10% $1,665, Vehicles each $1,323,000 $1,445,678 8 $10,987, Professional Services % of % 30% $4,995, Unallocated Contingency % of % 10% $3,430, Total (2015$): $37,731, Cost Per Mile (2015$): $6,427, LRT 1 LRT 2 SCC Unit Cost (2012$) Unit Cost (2015$) Quantity Cost Quantity Cost 10 Guideway and Track Elements Unit Mixed Traffic mile $0 $0 0 $ $0.00 Surface (allows cross traffic) mile $2,977,000 $3,253, $20,991, $16,645, Surface (dedicated) mile $37,154,000 $40,599,179 0 $ $0.00 Retained cut or fill mile $12,128,000 $13,252,593 0 $ $0.00 Tunnel mile $0 0 $0.00 $0.00 Aerial mile $42,226,000 $46,141,490 0 $ $ Stations, Stops, Terminals, Intermodals each $5,182,000 $5,662,511 8 $45,300, $33,975, Support Facilities each $27,563,000 $30,118,834 1 $30,118, $30,118, Sitework mile $16,538,000 $18,071, $116,615, $92,471, Systems mile $7,718,000 $8,433, $54,422, $43,155, ROW, Land, Existing Improvements % of % 20% $53,489, $4,327, Vehicles each $3,859,000 $4,216,833 4 $14,758, $10,963, Professional Services % of % 30% $80,234, $64,910, Unallocated Contingency % of % 10% $41,593, $29,656, Total (2015$): $457,525, $326,224, Cost Per Mile (2015$): $70,901, $63,753,120.84
28 Cost Estimates With 3% Inflation Rate Metro 1 Metro 2 SCC Unit Cost (2012$) Unit Cost (2015$) Quantity Cost Quantity Cost 10 Guideway and Track Elements Unit Mixed Traffic mile $0 $0 0 $0 0 $0 Surface (allows cross traffic) mile $0 $0 0 $0 0 $0 Surface (dedicated) mile $37,154,000 $40,599,179 0 $0 0 $0 Retained cut or fill mile $12,128,000 $13,252,593 0 $0 0 $0 Tunnel mile $213,334,000 $233,115, $1,459,305,045 0 $0 Aerial mile $56,228,000 $61,441,854 0 $ $392,490, Stations, Stops, Terminals, Intermodals each $69,899,000 $76,380,525 5 $381,902,623 3 $229,141, Support Facilities each $57,330,000 $62,646,039 1 $62,646,039 1 $62,646, Sitework mile $22,050,000 $24,094, $150,832, $153,916, Systems mile $27,563,000 $30,118, $188,543, $192,399, ROW, Land, Existing Improvements % of % 20% $448,645,999 $20,611, Vehicles each $3,859,000 $4,216, $118,071, $110,481, Professional Services % of % 30% $672,968,999 $30,917, Unallocated Contingency % of % 10% $348,291,633 $11,926,045 Total (2015$): $3,831,207, $1,204,530, Cost Per Mile (2015$): $612,014, $188,561,452.50
29 Cost Estimates With 5% Inflation Rate Bus 1 SCC Unit Cost (2012$) Unit Cost (2015$) Quantity Cost 10 Guideway and Track Elements Unit Mixed Traffic mile $40,000 $46, $271, Surface (allows cross traffic) mile $0 $0 0 $0.00 Surface (dedicated) mile $0 $0 0 $0.00 Retained cut or fill mile $12,128,000 $14,039,676 0 $0.00 Tunnel mile $0 0 $0.00 Aerial mile $42,226,000 $48,881,873 0 $ Stations, Stops, Terminals, Intermodals each $662,000 $766,348 8 $6,130, Support Facilities each $0 $0 0 $ Sitework mile $0 $0 0 $ Systems mile $1,654,000 $1,914, $11,239, ROW, Land, Existing Improvements % of % 10% $1,764, Vehicles each $1,323,000 $1,531,538 8 $11,639, Professional Services % of % 30% $5,292, Unallocated Contingency % of % 10% $3,633, Total (2015$): $39,972, Cost Per Mile (2015$): $6,809, Cost Estimates With 5% Inflation Rate LRT 1 LRT 2 SCC Unit Cost (2012$) Unit Cost (2015$) Quantity Cost Quantity Cost 10 Guideway and Track Elements Unit Mixed Traffic mile $0 $0 0 $ $0.00 Surface (allows cross traffic) mile $2,977,000 $3,446, $22,238, $17,634, Surface (dedicated) mile $37,154,000 $43,010,399 0 $ $0.00 Retained cut or fill mile $12,128,000 $14,039,676 0 $ $0.00 Tunnel mile $0 0 $0.00 $0.00 Aerial mile $42,226,000 $48,881,873 0 $ $ Stations, Stops, Terminals, Intermodals each $5,182,000 $5,998,813 8 $47,990, $35,992, Support Facilities each $27,563,000 $31,907,618 1 $31,907, $31,907, Sitework mile $16,538,000 $19,144, $123,541, $97,963, Systems mile $7,718,000 $8,934, $57,654, $45,718, ROW, Land, Existing Improvements % of % 20% $56,666, $4,584, Vehicles each $3,859,000 $4,467,275 4 $15,635, $11,614, Professional Services % of % 30% $84,999, $68,765, Unallocated Contingency % of % 10% $44,063, $31,418, Total (2015$): $484,698, $345,599, Cost Per Mile (2015$): $75,112, $67,539,473.73
30 Cost Estimates With 5% Inflation Rate Metro 1 Metro 2 SCC Unit Cost (2012$) Unit Cost (2015$) Quantity Cost Quantity Cost 10 Guideway and Track Elements Unit Mixed Traffic mile $0 $0 0 $0 0 $0 Surface (allows cross traffic) mile $0 $0 0 $0 0 $0 Surface (dedicated) mile $37,154,000 $43,010,399 0 $0 0 $0 Retained cut or fill mile $12,128,000 $14,039,676 0 $0 0 $0 Tunnel mile $213,334,000 $246,960, $1,545,974,431 0 $0 Aerial mile $56,228,000 $65,090,939 0 $ $415,800, Stations, Stops, Terminals, Intermodals each $69,899,000 $80,916,830 5 $404,584,149 3 $242,750, Support Facilities each $57,330,000 $66,366,641 1 $66,366,641 1 $66,366, Sitework mile $22,050,000 $25,525, $159,790, $163,057, Systems mile $27,563,000 $31,907, $199,741, $203,825, ROW, Land, Existing Improvements % of % 20% $475,291,472 $21,836, Vehicles each $3,859,000 $4,467, $125,083, $117,042, Professional Services % of % 30% $712,937,208 $32,754, Unallocated Contingency % of % 10% $368,976,974 $12,634,343 Total (2015$): $4,058,746, $1,276,068, Cost Per Mile (2015$): $648,362, $199,760,279.97
31 Estimated Annual Operating Costs Bus 1 LRT 1 LRT 2 Metro 1 Metro 2 Annual Revenue Hours NTD Cost/Revenue Hour $ $ $ $ $ Cost/Revenue Hour (2015$) $ $ $ $ $ Annual Operating Cost of Alternative $ 4,051,606 $ 2,991,878 $ 2,565,732 $ 3,429,178 $ 3,907,628
32 Appendix C: MGM National Harbor Responses to Comprehensive Transportation Plan Questions


33

34
35
36

37


38

39

40


41
42


43


44


45
5. OPPORTUNITIES AND NEXT STEPS
 5. OPPORTUNITIES AND NEXT STEPS When the METRO Green Line LRT begins operating in mid-2014, a strong emphasis will be placed on providing frequent connecting bus service with Green Line trains. Bus hours
Bi-County Transitway/ Bethesda Station Access Demand Analysis
 Bi-County Transitway/ Bethesda Station Access Demand Analysis Prepared for: Washington Metropolitan Area Transit Authority Office of Planning and Project Development May 2005 Prepared by: in conjunction
Background Information about the Metrobus 29 Lines Study
 Background Information about the Metrobus 29 Lines Study Questions Overview of Existing Service Q. Why is the study being conducted? A. The 29 Lines provide an important connection between Annandale and
Executive Summary. Treasure Valley High Capacity Transit Study Priority Corridor Phase 1 Alternatives Analysis October 13, 2009.
 Treasure Valley High Capacity Transit Study Priority Corridor Phase 1 Alternatives Analysis October 13, 2009 Background As the Treasure Valley continues to grow, high-quality transportation connections
Executive Summary. Draft Environmental Impact Statement/Environmental Impact Report ES-1
 Executive Summary Introduction The Eastside Transit Corridor Phase 2 Project is a vital public transit infrastructure investment that would provide a transit connection to the existing Metro Gold Line
STRATEGIC PRIORITIES AND POLICY COMMITTEE MAY 5, 2016
 STRATEGIC PRIORITIES AND POLICY COMMITTEE MAY 5, 2016 Shift Rapid Transit Initiative Largest infrastructure project in the city s history. Rapid Transit initiative will transform London s public transit
CEDAR AVENUE TRANSITWAY Implementation Plan Update
 CEDAR AVENUE TRANSITWAY Implementation Plan Update EECUTIVE SUMMARY DECEMBER 2015 Executive Summary In 2013, the Twin Cities metropolitan area s first bus rapid transit (BRT) line, the METRO Red Line,
A Transit Plan for the Future. Draft Network Plan
 A Transit Plan for the Future Draft Network Plan Project Overview and Status Completed Market Analysis and Service Evaluation. Developed Plan Framework and Guiding Principles. Developed a draft Five Year
North Shore Alternatives Analysis. May 2012
 North Shore Alternatives Analysis May 2012 Agenda Study Process and Progress to Date Short List Alternatives Screening Traffic Analysis Conceptual Engineering Ridership Forecasts Refinement of Service
Waco Rapid Transit Corridor (RTC) Feasibility Study
 Feasibility Study") Waco Rapid Transit Corridor (RTC) Feasibility Study Chris Evilia, Director of Waco Metropolitan Planning Organization Allen Hunter, General Manager Waco Transit System Jimi Mitchell, Project Manager AECOM
Waco Rapid Transit Corridor (RTC) Feasibility Study Chris Evilia, Director of Waco Metropolitan Planning Organization Allen Hunter, General Manager Waco Transit System Jimi Mitchell, Project Manager AECOM
METRO Orange Line BRT American Boulevard Station Options
 METRO Orange Line BRT American Boulevard Station Options Bloomington City Council Work Session November 18, 2013 Christina Morrison BRT/Small Starts Project Office Coordinating Planning and Design AMERICAN
Northeast Corridor Alternatives Analysis. Public Involvement Round 2 Input on Alternatives for Further Study
 Northeast Corridor Alternatives Analysis Public Involvement Round 2 Input on Alternatives for Further Study Feb. 7-9, 2012 Agenda Review project background Progress summary Recommended alternatives for
The Engineering Department recommends Council receive this report for information.
 CORPORATE REPORT NO: R161 COUNCIL DATE: July 23, 2018 REGULAR COUNCIL TO: Mayor & Council DATE: July 19, 2018 FROM: General Manager, Engineering FILE: 8740-01 SUBJECT: Surrey Long-Range Rapid Transit Vision
Leadership NC. November 8, 2018
 v Leadership NC November 8, 2018 Planning for our region s growth The Triangle is one of the fastestgrowing regions in the nation. More than 2 million people are already part of the equation, and the
Madison BRT Transit Corridor Study Proposed BRT Operations Plans
 Madison BRT Transit Corridor Study Proposed BRT Operations Plans This paper presents a description of the proposed BRT operations plan for use in the Madison BRT Transit Corridor Study. The objective is
FREQUENTLY ASKED QUESTIONS
 FREQUENTLY ASKED QUESTIONS 2018 What is the More MARTA Atlanta program? The More MARTA Atlanta program is a collaborative partnership between MARTA and the City of Atlanta to develop and implement a program
Public Meeting. City of Chicago Department of Transportation & Department of Housing and Economic Development
 Public Meeting City of Chicago Department of Transportation & Department of Housing and Economic Development Funded by Regional Transportation Authority September 12, 2011 In partnership with Presentation
Central Maryland Transit Development Plan
 Central Maryland Transit Development Plan Planning the Future of Transit in Our Region Anne Arundel County Transportation Commission December 13, 2017 Anne Arundel County Howard County Prince George s
Alternatives Analysis Findings Report
 6.0 This chapter presents estimates of the potential capital, operations and maintenance costs associated with the alternatives carried forward for detailed evaluation. The methodology used to develop
TBARTA USF to Wesley Chapel Express Bus Service Operating Plan. Draft 3/25/2014
 TBARTA USF to Wesley Chapel Express Bus Service Operating Plan Draft 3/25/2014 March 2014 Table of Contents 1.0 Introduction... 1 2.0 Study Area... 1 3.0 Existing Available Service... 3 4.0 Proposed Service...
Energy Technical Memorandum
 Southeast Extension Project Lincoln Station to RidgeGate Parkway Prepared for: Federal Transit Administration Prepared by: Denver Regional Transportation District May 2014 Table of Contents Page No. Chapter
Help shape your community investment in Wake Transit. Fiscal Year 2019 Draft Work Plan Summary
 Help shape your community investment in Wake Transit Fiscal Year 2019 Draft Work Plan Summary Wake County, growth and transit The Triangle is one of the fastest-growing regions in the nation. Wake County
4.0 TIER 2 ALTERNATIVES
 4.0 TIER 2 ALTERNATIVES The Tier 2 Alternatives represent the highest performing Tier 1 Alternatives. The purpose of the Tier 2 Screening was to identify the LPA utilizing a more robust list of evaluation
Mobility Corridor Updates. Transit & Active Transportation Projects
 Mobility Corridor Updates Transit & Active Transportation Projects Manjeet Ranu, SEO East San Fernando Valley Transit Corridor Metro Board LPA selection: June 2018 Recently awarded $200 million in Senate
Needs and Community Characteristics
 Needs and Community Characteristics Anticipate Population and Job Growth in the City Strongest density of population and jobs in Ann Arbor are within the Study Area Population expected to grow 8.4% by
Maryland Gets to Work
 I-695/Leeds Avenue Interchange Reconstruction Baltimore County Reconstruction of the I-695/Leeds Avenue interchange including replacing the I-695 Inner Loop bridges over Benson Avenue, Amtrak s Northeast
TORONTO TRANSIT COMMISSION REPORT NO.
 Form Revised: February 2005 TORONTO TRANSIT COMMISSION REPORT NO. MEETING DATE: October 24, 2012 SUBJECT: DOWNTOWN RAPID TRANSIT EXPANSION STUDY (DRTES) PHASE 1 STRATEGIC PLAN ACTION ITEM RECOMMENDATIONS
Improving Accessibility of Regional Bus Stops and Pathways
 Customer Service and Operations Committee Board Information Item III-A March 13, 2014 Improving Accessibility of Regional Bus Stops and Pathways Page 3 of 17 Washington Metropolitan Area Transit Authority
Pacific Electric Right-of-Way / West Santa Ana Branch Corridor Alternatives Analysis
 Pacific Electric Right-of-Way / West Santa Ana Branch Corridor Alternatives Analysis Transit Coalition September 26, 2012 2 Study Area Pacific Electric Rightof-Way/West Santa Ana Branch (PEROW/ WSAB) extends
CLRP. Performance Analysis of The Draft 2014 CLRP. Long-Range Transportation Plan For the National Capital Region
 NATIONAL CAPITAL REGION TRANSPORTATION PLANNING BOARD Item 12 CLRP Financially Constrained Long-Range Transportation Plan For the National Capital Region 2014 Performance Analysis of The Draft 2014 CLRP
6/6/2018. June 7, Item #1 CITIZENS PARTICIPATION
 June 7, 2018 Item #1 CITIZENS PARTICIPATION 1 Item #2 APPROVAL OF MINUTES Item #3 TRAC GOALS, FRAMEWORK & AGENDA REVIEW 2 COMMITTEE GOALS Learn about Southern Nevada s mobility challenges, new developments
RTSP Phase II Update
 Washington Metropolitan Area Transit Authority RTSP Phase II Update Presentation to the Technical Advisory Group July 18, 2013 Meeting 1 Presentation Outline RTSP Integration with Momentum RTSP Process
Washington Metropolitan Area Transit Authority
 Executive Summary: Metrobus Network Evaluation and Future Fleet Needs Presented to: Washington Metropolitan Area Transit Authority Submitted by: In Association with P 2 D Joint Venture Introduction Metrobus
Operating & Maintenance Cost Results Report
 Operating & Maintenance Cost Results Report Prepared for: Hennepin County Regional Railroad Authority Prepared by: Connetics Transportation Group Under Contract To: Kimley-Horn and Associates FINAL June
WARES. October, 2018
 WARES October, 2018 1 Project Overview A new 16 mile east-west light rail line between Bethesda in Montgomery County and New Carrollton in Prince George s County Operates mostly on the surface with 21
CTfastrak Expansion. Stakeholder Meeting #4 Manchester Town Hall June 3, 2016
 CTfastrak Expansion Stakeholder Meeting #4 Manchester Town Hall June 3, 2016 Today s Agenda Phase I Update 2016 Service Plan Implementation Schedule & Cost Update Phase II Services Timeline Market Analysis
The capital cost estimates do not include allowances for: ROW acquisition. Third-party mitigation works. Hazardous materials handling.
 Mode Selection Report 7 Cost Evaluation The cost evaluation criteria used in the evaluation of the transit modes are: Capital cost. operating costs. Fare revenue. Net cost per passenger/passenger-mile.
Travel Time Savings Memorandum
 04-05-2018 TABLE OF CONTENTS 1 Background 3 Methodology 3 Inputs and Calculation 3 Assumptions 4 Light Rail Transit (LRT) Travel Times 5 Auto Travel Times 5 Bus Travel Times 6 Findings 7 Generalized Cost
Unified Corridor Investment Study DRAFT Step 2 Scenario Analysis Report
 Unified Corridor Investment Study DRAFT Step 2 Scenario Analysis Report REVISIONS 1. Table 39: New Public Investments for Operation and Maintenance Costs 2. Appendix A-10: Passenger Rail Service - Operations
Link LRT: Maintenance Bases, Vehicles and Operations for ST2 Expansion
 Project Number SYS-LRT Subareas All Primary Mode Impacted Link Facility Type Link Service Version Number 4.0 Date Last Modified 7/24/2008 Project Locator Map Short Project Description Construct new light
Stakeholders Advisory Working Groups (SAWGs) Traffic and Transit SAWG Meeting #7
 Traffic and Transit SAWG Meeting #7") Presentation Tappan Zee Bridge/I-287 Corridor Environmental Review December 4, 2008 Slide 1 Title Slide Slide 2 This presentation discusses the contents of the Transit Mode Selection Report. Slide 3 The
Presentation Tappan Zee Bridge/I-287 Corridor Environmental Review December 4, 2008 Slide 1 Title Slide Slide 2 This presentation discusses the contents of the Transit Mode Selection Report. Slide 3 The
A Presentation to: Project Advisory Group Meeting #10
 A Presentation to: Project Advisory Group Meeting #10 October 21, 2015 Agenda Introductions Action Items From Last PAG Meeting (August 26, 2015) Recent Agency Involvement Update on Refined Alternative
Draft Results and Recommendations
 Waco Rapid Transit Corridor (RTC) Feasibility Study Draft Results and Recommendations Chris Evilia, Director of Waco Metropolitan Planning Organization Allen Hunter, General Manager Waco Transit System
EUGENE-SPRINGFIELD, OREGON EAST WEST PILOT BRT LANE TRANSIT DISTRICT
 EUGENE-SPRINGFIELD, OREGON EAST WEST PILOT BRT LANE TRANSIT DISTRICT (BRIEF) Table of Contents EUGENE-SPRINGFIELD, OREGON (USA)... 1 COUNTY CONTEXT AND SYSTEM DESCRIPTION... 1 SYSTEM OVERVIEW... 1 PLANNING
Broward County Intermodal Center And People Mover. AASHTO Value Engineering Conference Presentation. September 1, 2009 San Diego, CA
 Project Development & Environment Study Broward County Intermodal Center And People Mover AASHTO Value Engineering Conference Presentation September 1, 2009 San Diego, CA Background P D & E Study Regional
Report by Planning, Development & Real Estate Committee (B) Washington Metropolitan Area Transit Authority Board Action/Information Summary
 Washington Metropolitan Area Transit Authority Board Action/Information Summary") Report by Planning, Development & Real Estate Committee (B) 06-26-08 Washington Metropolitan Area Transit Authority Board Action/Information Summary Action Information MEAD Number: 100027 Resolution: Yes
Report by Planning, Development & Real Estate Committee (B) 06-26-08 Washington Metropolitan Area Transit Authority Board Action/Information Summary Action Information MEAD Number: 100027 Resolution: Yes
Point A Point B Point C Point D. Fulton County Board of Commissioners and Mayors Meeting December 14, 2017
 Fulton County Board of Commissioners and Mayors Meeting December 14, 2017 Master Plan Overview Phase 1 Community Vision and Existing Transit Conditions Phase 2 Scenario Development Phase 3 Transit Master
Transportation Committee Revised Project Scope and Cost Estimate. November 23, 2015
 Transportation Committee Revised Project Scope and Cost Estimate November 23, 2015 1 Today s Topics Revised Project Scope Revised Cost Estimate Municipal Approval Action 2 3 Revised Project Scope Project
CITY OF LONDON STRATEGIC MULTI-YEAR BUDGET ADDITIONAL INVESTMENTS BUSINESS CASE # 6
 2016 2019 CITY OF LONDON STRATEGIC MULTI-YEAR BUDGET ADDITIONAL INVESTMENTS BUSINESS CASE # 6 STRATEGIC AREA OF FOCUS: SUB-PRIORITY: STRATEGY: INITIATIVE: INITIATIVE LEAD(S): BUILDING A SUSTAINABLE CITY
Midtown Corridor Alternatives Analysis. Policy Advisory Committee Meeting February 12, 2014
 Midtown Corridor Alternatives Analysis Policy Advisory Committee Meeting February 12, 2014 Today s Agenda Introductions Outreach efforts and survey results Other updates since last meeting Evaluation results
Mobility Corridor Updates. Transit & Active Transportation Projects
 Mobility Corridor Updates Transit & Active Transportation Projects Laura Cornejo, DEO Regional Planner Regional Operator Metro is LA County s Regional Builder/Funder Rail Bus Service (Metro/Muni/Local)
Dulles Corridor Air Rights Study Investigation
 Dulles Corridor Air Rights Study Investigation Fairfax County Board of Supervisors Transportation Committee September 17, 2013 1 On March 19, 2013 the Fairfax County Board of Supervisors asked FCDOT staff
Increase Rail Service to the Mid City Green Line Stations
 Washington Metropolitan Area Transit Authority Increase Rail Service to the Mid City Green Line Stations P D E C Presented to the Board of Directors: Planning and Development Committee by Planning, Development,
Preliminary Definition of Alternatives. 3.0 Preliminary Definition of Alternatives
 3.0 What preliminary alternatives are being evaluated? The alternatives for the East San Fernando Valley Transit Corridor project that were considered for screening include the No Build Alternative, Transportation
STH 60 Northern Reliever Route Feasibility Study Report
 #233087 v3 STH 60 Northern Reliever Route Feasibility Study Report Washington County Public Works Committee Meeting September 28, 2016 1 STH 60 Northern Reliever Route Feasibility Study Hartford Area Development
METRONext. Vision & Moving Forward Plans. Board Workshop. December 11, DRAFT For Preliminary Discussion Only
 METRONext Vision & Moving Forward Plans Board Workshop December 11, 2018 Disclaimer This presentation is being provided solely for discussion purposes by the Board of Directors of the Metropolitan Transit
Snelling Bus Rapid Transit. May 13, 2013 Technical Advisory Committee Meeting #1
 Snelling Bus Rapid Transit May 13, 2013 Technical Advisory Committee Meeting #1 1 Today s meeting TAC Introductions Project Overview Arterial BRT Concept Background Snelling Corridor Plan, Funding & Schedule
APPENDIX I: [FIXED-GUIDEWAY TRANSIT FEASIBILITY]
![APPENDIX I: [FIXED-GUIDEWAY TRANSIT FEASIBILITY]](/thumbs/83/87090921.jpg "APPENDIX I: [FIXED-GUIDEWAY TRANSIT FEASIBILITY]") APPENDIX I: [FIXED-GUIDEWAY TRANSIT FEASIBILITY] Jackson/Teton Integrated Transportation Plan 2015 Appendix I. Fixed-Guideway Transit Feasibility Jackson/Teton County Integrated Transportation Plan v2
APPENDIX I: [FIXED-GUIDEWAY TRANSIT FEASIBILITY] Jackson/Teton Integrated Transportation Plan 2015 Appendix I. Fixed-Guideway Transit Feasibility Jackson/Teton County Integrated Transportation Plan v2
Proposed FY2015 Budget and Fare Increase
 Washington Metropolitan Area Transit Authority Proposed FY2015 Budget and Fare Increase Riders Advisory Council January 8, 2014 1 Washington Metropolitan Area Transit Authority What will riders see from
West Broadway Transit Study. Community Advisory Committee September 17, 2015
 West Broadway Transit Study Community Advisory Committee September 17, 2015 Introductions Community Engagement Summer Outreach Fall Outreach Technical Analysis Process Update Alternatives Review Economic
Background Information for MPRB Community Advisory Committee for 2010 Southwest Light Rail Transit Project DEIS Comment Letter Section 2
 Background Information for MPRB Community Advisory Committee for 2010 Southwest Light Rail Transit Project DEIS Comment Letter Section 2 1 2. SW LRT Corridor Overview Source: http://www.southwesttransitway.org/home.html
US 29 Bus Rapid Transit Planning Board Briefing. February 16, 2017
 US 29 Bus Rapid Transit Planning Board Briefing February 16, 2017 Project Goals Improve the quality of transit service Improve mobility opportunities and choices Enhance quality of life Support master
Update on Bus Stop Enhancements
 Customer Service and Operations Committee Board Information Item III-A February 2, 2012 Update on Bus Stop Enhancements Page 3 of 15 Washington Metropolitan Area Transit Authority Board Action/Information
Michigan/Grand River Avenue Transportation Study TECHNICAL MEMORANDUM #18 PROJECTED CARBON DIOXIDE (CO 2 ) EMISSIONS
 EMISSIONS") TECHNICAL MEMORANDUM #18 PROJECTED CARBON DIOXIDE (CO 2 ) EMISSIONS Michigan / Grand River Avenue TECHNICAL MEMORANDUM #18 From: URS Consultant Team To: CATA Project Staff and Technical Committee Topic:
TECHNICAL MEMORANDUM #18 PROJECTED CARBON DIOXIDE (CO 2 ) EMISSIONS Michigan / Grand River Avenue TECHNICAL MEMORANDUM #18 From: URS Consultant Team To: CATA Project Staff and Technical Committee Topic:
Crenshaw-Prairie Transit Corridor Study Public Meetings
 Crenshaw-Prairie Transit Corridor Study Public Meetings Darby Park: Wednesday, February 20, 2008 6:30 8:00 PM US Bank Community Room: Thursday, February 21, 2008 6:30 8:00 PM Nate Holden Performing Arts
Janice Fortunato Senior Director Business Partnerships
 Janice Fortunato Senior Director Business Partnerships What are Megaprojects? They are large-scale projects distinguished by cost, complexity and the potential impact on the community. Collectively, these
Purple Line Light Rail P3 Project
 Purple Line Light Rail P3 Project TPB Meeting May 18, 2016 1 Topics General Project Overview The P3 Contract Details on The Successful Proposal 2 Recap of Purple Line P3 Events In November 2013 MTA initiated
Troost Corridor Transit Study
 Troost Corridor Transit Study May 23, 2007 Kansas City Area Transportation Authority Agenda Welcome Troost Corridor Planning Study Public participation What is MAX? Survey of Troost Riders Proposed Transit
Regional Transit Extension Studies. Hampton Roads Transportation Planning Organization Passenger Rail Task Force Meeting December 17, 2013
 Regional Transit Extension Studies Hampton Roads Transportation Planning Organization Passenger Rail Task Force Meeting December 17, 2013 Topics Virginia Beach Transit Extension Study (VBTES) Naval Station
Kendall Drive Premium Transit PD&E Study Project Kick-Off Meeting SR 94/Kendall Drive/SW 88 Street Project Development and Environment (PD&E) Study
 Study") Florida Department of Transportation District Six Kendall Drive Premium Transit PD&E Study Project Kick-Off Meeting SR 94/Kendall Drive/SW 88 Street Project Development and Environment (PD&E) Study What
Florida Department of Transportation District Six Kendall Drive Premium Transit PD&E Study Project Kick-Off Meeting SR 94/Kendall Drive/SW 88 Street Project Development and Environment (PD&E) Study What
Metro Transit Update. Christina Morrison, Senior Planner Metro Transit BRT/Small Starts Project Office. John Dillery, Senior Transit Planner
 Metro Transit Update Christina Morrison, Senior Planner Metro Transit BRT/Small Starts Project Office John Dillery, Senior Transit Planner Metro Transit Service Development May 16, 2013 1 Transit Planning
Executive Summary October 2013
 Executive Summary October 2013 Table of Contents Introduction... 1 Rider Transit and Regional Connectivity... 1 Plan Overview... 2 Network Overview... 2 Outreach... 3 Rider Performance... 4 Findings...
Pomona Rotary December 19, 2017
 Pomona Rotary December 19, 2017 Los Angeles County s population will grow by 5.9% to 10.7 million by 2024 During that same period, the San Gabriel Valley will grow by 7.6% to more than 1.5 million; taking
TRANSIT FEASIBILITY STUDY Town of Bradford West Gwillimbury
 TRANSIT FEASIBILITY STUDY Town of Bradford West Gwillimbury Open House Presentation January 19, 2012 Study Objectives Quantify the need for transit service in BWG Determine transit service priorities based
Converting BRT to LRT in the Nation s Capital Ottawa, Canada. John Manconi City of Ottawa Ottawa, Canada
 Converting BRT to LRT in the Nation s Capital Ottawa, Canada John Manconi City of Ottawa Ottawa, Canada 1 The Challenge *Mackenzie King Bridge Ottawa, AM peak period 2 The Challenge Ottawa s population
Central City Line Locally Preferred Alternative (LPA) Amendment Public Hearing. July 24, 2014
 Amendment Public Hearing. July 24, 2014") Central City Line Locally Preferred Alternative (LPA) Amendment Public Hearing July 24, 2014 Project Description The Central City Line is a High Performance Transit project that will extend from Browne
Central City Line Locally Preferred Alternative (LPA) Amendment Public Hearing July 24, 2014 Project Description The Central City Line is a High Performance Transit project that will extend from Browne
7000 Series Railcar Program Overview
 Finance, Administration and Oversight Committee Information Item IV-B November 6, 2008 7000 Series Railcar Program Overview Washington Metropolitan Area Transit Authority Board Action/Information Summary
East San Fernando Valley Transit Corridor. TAC Briefing December 4, 2013
 East San Fernando Valley Transit Corridor TAC Briefing December 4, 2013 Overview Measure R Project Long Range Transportation Plan Reserves $170.1 Million 2018 Revenue Operations Date Coordination with
I-26 Fixed Guideway Alternatives Analysis
 I-26 Fixed Guideway Alternatives Analysis Steering & Technical Advisory Committees Joint Meeting January 15, 2016 @ 10:00 AM SC/TAC Meeting Winter 2016 Agenda I. Welcome & Introductions II. III. Project
Transit on the New NY Bridge
 Transit on the New NY Bridge TZB Cross Section North bridge incorporating 12ft shared use path and space for future bus lane South bridge with space for a future bus lane Gap between the two decks for
V03. APTA Multimodal Operations Planning Workshop August Green Line LRT
 V03 APTA Multimodal Operations Planning Workshop August 2016 Green Line LRT 2 Presentation Outline Past Present Future 3 16/03/2016 RouteAhead Update 4 4 16/03/2016 RouteAhead Update 5 5 16/03/2016 6 6
Valley Metro Overview. ITE/IMSA Spring Conference March 6, 2014
 Valley Metro Overview ITE/IMSA Spring Conference March 6, 2014 Valley Metro Who Are We? Operate Regional Transit Services Valley Metro and Phoenix are region s primary service providers Light Rail and
Click to edit Master title style
 Nelson/Nygaard Consulting Associates SERVICE IMPROVEMENT STRATEGIES September 22, 2015 1 PROJECT OVERVIEW & WORK TO DATE 1. Extensive stakeholder involvement Throughout 2. System and market assessment
Executive Summary. Phase 2 Evaluation Report. Introduction
 , Executive Summary Executive Summary Introduction TransLink and the Province of British Columbia sponsored a multi-phase study to evaluate alternatives for rapid transit service in the Broadway corridor
FINAL. Sound Transit Long-Range Plan Update. Issue Paper S.1: Tacoma Link Integration with Central Link. Prepared for: Sound Transit
 Sound Transit Long-Range Plan Update Issue Paper S.1: Tacoma Link Integration with Central Link Prepared for: Sound Transit Prepared by: Quade & Douglas, Inc. FINAL March 2005 Foreword This issue paper
4 COSTS AND OPERATIONS
 4 COSTS AND OPERATIONS 4.1 INTRODUCTION This chapter summarizes the estimated capital and operations and maintenance (O&M) costs for the Modal and High-Speed Train (HST) Alternatives evaluated in this
SEPULVEDA PASS CORRIDOR
 SEPULVEDA PASS CORRIDOR PUBLIC PRIVATE PARTNERSHIP DELIVERY PRE-DEVELOPMENT AGREEMENT PDA Sepulveda Pass Mobility Issues Most congested highway segment in the U.S. 295,000 vehicles per day (2010) 430,000
What is the Connector?
 What is the Connector? The Connector is a plan for a high-capacity transit system from northeast to south Ann Arbor, connecting major destinations including downtown, commercial, and residential areas,
Form Revised: February 2005 TORONTO TRANSIT COMMISSION REPORT NO. MEETING DATE: August 30, SUBJECT: Scarborough Rt Strategic Plan
 Form Revised: February 2005 TORONTO TRANSIT COMMISSION REPORT NO. MEETING DATE: August 30, 2006 SUBJECT: Scarborough Rt Strategic Plan RECOMMENDATIONS It is recommended that the Commission: 1. Endorse
Draft Results and Open House
 Waco Rapid Transit Corridor (RTC) Feasibility Study Draft Results and Open House Chris Evilia, Director of Waco Metropolitan Planning Organization Allen Hunter, General Manager Waco Transit System Jimi
BROWARD BOULEVARD CORRIDOR TRANSIT STUDY
 BROWARD BOULEVARD CORRIDOR TRANSIT STUDY FM # 42802411201 EXECUTIVE SUMMARY July 2012 GOBROWARD Broward Boulevard Corridor Transit Study FM # 42802411201 Executive Summary Prepared For: Ms. Khalilah Ffrench,
Expansion Projects Description
 Expansion Projects Description The Turnpike expansion program was authorized by the Florida Legislature in 1990 to meet the State s backlog of needed highway facilities. The Legislature set environmental
Sepulveda Pass Corridor Systems Planning Study Final Compendium Report. Connecting the San Fernando Valley and the Westside
 Los Angeles County Metropolitan Transportation Authority November 2012 Connecting the San Fernando Valley and the Westside Interstate 405 Sepulveda Pass THIS PAGE INTENTIONALLY LEFT BLANK Sepulveda Pass
Downtown Transit Connector. Making Transit Work for Rhode Island
 Downtown Transit Connector Making Transit Work for Rhode Island 3.17.17 Project Evolution Transit 2020 (Stakeholders identify need for better transit) Providence Core Connector Study (Streetcar project
I-20 EAST TRANSIT INITIATIVE Tier 1 and Tier 2 Alternatives Screening Report EXECUTIVE SUMMARY
 EXECUTIVE SUMMARY The purpose of this report is to document the results of the Tier 1 and Tier 2 Screening of alternatives for the I-20 East Transit Initiative. The two-tier screening process presented
PAG Environmental Planning Advisory Committee Sun Link Streetcar Update May 1, 2015
 PAG Environmental Planning Advisory Committee Sun Link Streetcar Update May 1, 2015 Project Facts 4-mile route, 23 stops 8 made in USA modern streetcars All electric and green Voter-approved project Connects
Business Advisory Committee. November 3, 2015
 Business Advisory Committee November 3, 2015 1 Today s Topics DEIS Cost Estimate 2 Assumptions Revised Cost Estimate Revised Project Scope Cost Estimate Overview Position Statement Discussion Municipal
TORONTO TRANSIT COMMISSION REPORT NO.
 Form Revised: February 2005 TORONTO TRANSIT COMMISSION REPORT NO. MEETING DATE: September 27, 2012 SUBJECT: NOTICE OF AWARD PROCUREMENT AUTHORIZATION - ARTICULATED BUSES INFORMATION ITEM RECOMMENDATION
VAN NESS AVENUE BUS RAPID TRANSIT
 VAN NESS AVENUE BUS RAPID TRANSIT Commission of the Environment Policy Committee May 22, 2014 Peter Gabancho Project Manager III Capital Programs & Construction SFMTA 1 Conceptual Visual Simulation Center-Running
MEMORANDUM. WMATA Service Evaluation Study BService Routes City Staff Recommendation
 A r 4 i9ul Hvcalibiir tload 916 I3o rie 1larvl Z11716 j KA MEMORANDUM TO FROM SUBJECT City Council David J Deutsch City Manager WMATA Service Evaluation Study BService Routes City Staff Recommendation