Western Area Power Administration Sierra Nevada Region
|
|
|
- Norman Edgar Logan
- 5 years ago
- Views:
Transcription
1 Western Area Power Administration Sierra Nevada Region 2014 Annual Ten-Year Transmission Plan Assessment Report November 20, 2014 For information or questions regarding this Transmission Assessment Report, please contact Chris Effiong via (916) or at
2
3 CONTENTS INTRODUCTION... 3 OBJECTIVES AND RESPONSIBILITIES... 4 RELIABILITY STANDARDS... 5 STUDY ASSUMPTIONS... 8 A. BASE CASES DEVELOPED FOR TRANSMISSION SYSTEM ASSESSMENT... 8 B. ELECTRIC DEMAND AND POWER FACTOR ASSUMPTIONS... 9 C. IMPORT-EXPORT AND MAJOR PATH ASSUMPTIONS D. GENERATION ASSUMPTIONS STUDY SCOPE A. THERMAL LOADING AND VOLTAGE LIMITS B. VOLTAGE STABILITY POST TRANSIENT VOLTAGE C. TRANSIENT STABILITY TRANSMISSION SYSTEM ASSESSMENT STUDY RESULTS SUMMARY A. CATEGORY A (NERC PLANNING STANDARD TPL - 001): ALL FACILITIES IN SERVICE, (N-0) A.1 Steady State Evaluation A.2 Post-Transient Evaluation A.3 Dynamic Stability Evaluation B. CATEGORY B (NERC PLANNING STANDARD TPL - 002): SINGLE ELEMENT OUTAGE, (N-1) B.1 Steady State Evaluation B.2 Post-Transient Evaluation B.3 Dynamic Stability Evaluation C. CATEGORY C (NERC PLANNING STANDARD TPL - 003): DOUBLE ELEMENT OUTAGES, (N-2) C.1 STEADY STATE EVALUATION C.1.1 Outage of Shasta-Cottonwood #1 & #2 230 kv Lines C.1.2 Keswick-O Banion 230 kv and Keswick- Olinda 230 kv Lines Outage C.1.3 Cottonwood Olinda 230 kv Line Outage C.1.4 Shasta - Cottonwood #1 & #2 230 kv Lines Outage C.1.5 Keswick O Banion 230 kv Overlapping Line Outage C.1.6 Tracy 500/230 kv Transformer Overlapping Outage C.2 POST - TRANSIENT AND MVAR MARGIN EVALUATION C.2.1 Shasta-Cottonwood Double Line Outage C.2.2 Keswick-O Banion and Keswick - Olinda Double Line Outage C.3 DYNAMIC STABILITY EVALUATION D. CATEGORY D (NERC PLANNING STANDARD TPL - 004): EXTREME EVENTS (N-2 PLUS) D1. Rancho Seco 230 kv Double Line Outage (dlo) D2. O Banion Elverta #1, #2, and #3 230 kv Lines Outage D3. Keswick-Airport 230 kv Line with Overlapping Contingencies D4. Airport - Cottonwood Overlapping with Shasta - Cottonwood D5. Cottonwood Roseville with Olinda Stuck PCB D6. Keswick-O Banion 230 kv Line Overlapping with Shasta - Cottonwood D7. Keswick-Olinda 230 kv Line Overlapping with Shasta - Cottonwood D8. Loss of Sutter Energy Center with Tracy Hurley #1 and #2 Outage D9. Keswick-Flanagan Overlapping with Stuck Breaker Conditions PROPOSED AND PLANNED TRANSMISSION PROJECTS COMMUNICATION AIDED HIGH SPEED PROTECTION
4 2. KESWICK OLINDA DISCONNECT SWITCH KESWICK AIRPORT COTTONWOOD RE-CONDUCTOR COTTONWOOD-OLINDA #1 AND #2 RE-CONDUCTOR TRACY 230 KV HIGH VOLTAGE MITIGATION TRACY 500 KV HIGH VOLTAGE MITIGATION DIAGRAM OF THE WESTERN AREA POWER ADMINISTRATION SIERRA NEVADA REGION TRANSMISSION SYSTEM CONTINGENCIES STUDIED EVENT RESULTING IN THE LOSS OF A SINGLE ELEMENT NERC LEVEL B EVENT(S) RESULTING IN THE LOSS OF TWO OR MORE (MULTIPLE) ELEMENTS NERC LEVEL C EXTREME EVENT RESULTING IN TWO OR MORE (MULTIPLE) ELEMENTS REMOVED OF CASCADING OUT OF SERVICE NERC LEVEL D NERC STANDARDS AND RESULTS PRESENTED POWER FLOW RESULTS POST TRANSIENT AND DYNAMIC STABILITY PLOTS Q-V ANALYSIS PLOTS ATTACHMENT 1: CATEGORY D RESULTS ATTACHMENT 2: 2014 TEN-YEAR ANNUAL ASSESSMENT STUDY PLAN
5 INTRODUCTION The Western Area Power Administration - Sierra Nevada Region (WASN) is one of five regions in the Western Area Power Administration (WAPA). WASN markets power in northern and central California, and portions of Nevada, to wholesale customers and Federal end-use customers such as towns, rural electric cooperatives, public utility and irrigation districts, Federal, state, and military agencies, Native American tribes, investor-owned utilities, power marketers, and U.S. Bureau of Reclamation customers. These customers are served by operating and maintaining over 884 miles of 69- to 500- kv transmission lines. NERC Reliability Standards TPL-001 thru TPL-004 govern the requirements for planning the interconnected Bulk Electric System (BES) such that the transmission system is planned and designed to be reliable. Within these standards, system performance requirements are specified for a range of contingencies according to the number of elements forced out of service as a result of the contingency. The WASN transmission system annual assessment was conducted in accordance with North American Electric Reliability Corporation (NERC) Transmission Planning Standards. The assessment covers critical system conditions over a ten year period from 2015 through 2024 and is consistent with meeting the requirements of NERC Transmission Planning Standards TPL-001 thru TPL-004. This is an analysis of WASN s transmission system. It does not include a detailed assessment of loadserving entities transmission systems connected to WASN. Critical system conditions were modeled and analyzed. Where potential reliability problems were identified, existing or potential mitigation measures were identified to achieve required system performance. Mitigation measures include proposed new transmission projects or other solutions such as operating procedures which can include operating nomograms and Special Protection Systems (SPS s). Technical analysis was conducted to assess the continuing need for planned transmission reinforcement projects. This annual transmission assessment is the basis for WASN maintaining reliable transmission service at various demand levels over a range of forecasted system demands and within the levels of reliability described within NERC Planning Standards. While this assessment is the basis of a ten-year transmission planning horizon for maintaining system reliability, emphasis was placed on the 5 and 10 years (2019 and 2024) of the assessment when assessing voltage and dynamic stability. Interconnected transmission system reliability is addressed and potential performance deficiencies are identified and corresponding mitigation measures or projects that resolve these problems are proposed. Analysis out to the year 2024 was conducted to identify potential reliability concerns that require longer lead-times associated with significant 230 kv and 500 kv systems reinforcements. Specifically, an assessment of WASN s transmission facilities was performed to identify reliability problems (within the years 2015 to 2024) associated with delivering 3
6 transmission service obligations. Full compliance with NERC Planning Standards TPL- 001, TPL-002, TPL-003 and TPL-004 was achieved. For each identified potential reliability problem directly associated with WASN s transmission system and obligations to transport power through its transmission system, a mitigation plan has been proposed as documented in the Transmission System Assessment Study Results section of this report. As appropriate, alternative mitigation plans will be developed to determine the preferred engineering and economical mitigation plan to implement. Details of the assessment are contained in this System Assessment and within the attachments to this report. OBJECTIVES AND RESPONSIBILITIES Per NERC Planning Standards and with the coordination and input from surrounding and interconnected utilities, WASN is responsible for performing a transmission system assessment and developing a plan to maintain reliability of its transmission facilities covering the next 10 years. WASN performed the following: As required, revised power flow base cases obtained from the Western Electricity Coordinating Council (WECC) that model a 10 year span of the studies under various seasonal conditions; Conduct transmission system studies and benchmark the performance of WASN s transmission facilities; Identify potential reliability problems for the 5 and 10-year planning horizons based on NERC Transmission Planning Standards and their requirements; and Propose mitigation plans to address potential reliability problems for years 2015 through 2024 The projects proposed in the transmission plan will accomplish the following objectives: Comply with NERC Transmission Planning Standards; Provide reliable transmission service to entities whose power is transmitted over WASN transmission lines; Maintain acceptable system voltages and thermal loadings; Assess the performance and impact of planned transmission system additions and upgrades; Support coordinated operation with interconnected and parallel utilities transmission systems; and 4
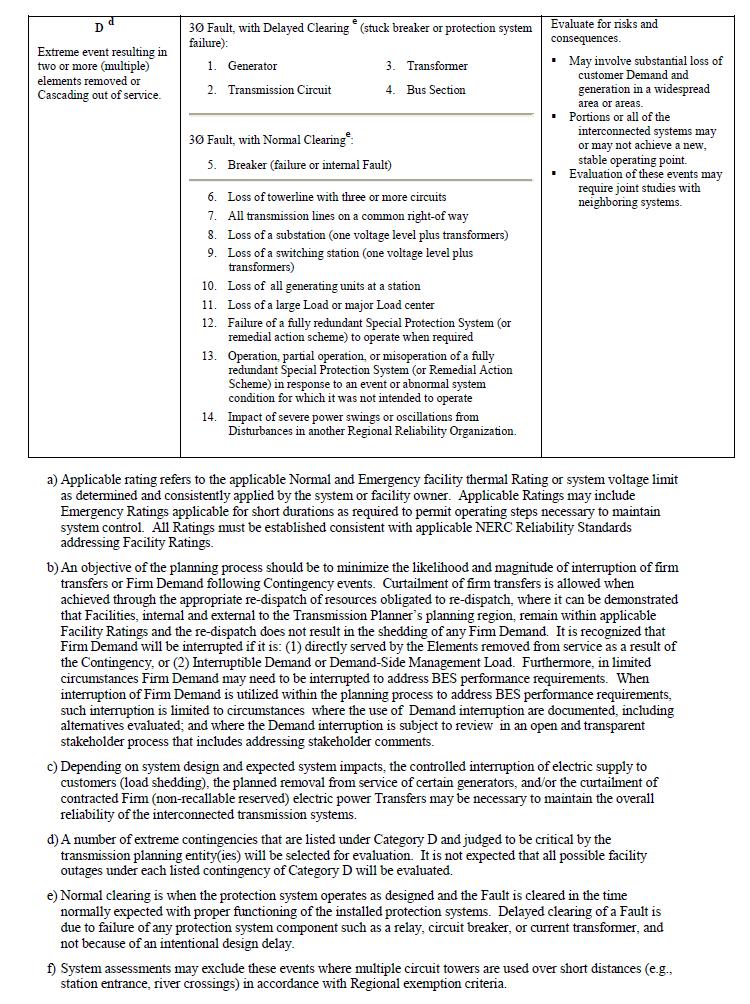
7 Follow-up on the results of various previous and on-going transmission planning studies with verification of the continued need or not and operation dates of transmission projects. RELIABILITY STANDARDS NERC Transmission Planning Standards TPL-001, TPL-002, TPL-003, and TPL-004 and their requirements will be the basis for establishing completion of this annual assessment. The specific performances for these standards are contained in Table 1. Standard TPL System Performance Under Normal (No Contingency) Conditions (Category A). TPL applies to both near-term and longer-term planning horizons. Standard TPL-002-0b System Performance Following Loss of a Single Bulk Electric System Element (Category B).The Reliability Standard applies both to near-term and longer-term planning horizons. Standard TPL-003-0b System Performance Following Loss of Two or More Bulk Electric System Elements (Category C) Standard TPL-004-0a System Performance Following Extreme Events Resulting in the Loss of Two or More Bulk Electric System Elements (Category D) 5
8 NERC Transmission Planning Standards 6
9 7
10 STUDY ASSUMPTIONS This annual transmission planning process starts with the development of power flow base cases that model WASN s transmission system within Northern California as well within the WECC reliability area. A. Base Cases Developed for Transmission System Assessment Power flow base cases for this annual assessment are base cases developed in conjunction with PG&E and the California Independent System Operator (CAISO) in addition to other neighboring utilities in the WECC Base Case development process. The base cases included modeling transmission system and generation power plants within the Western Electricity Coordinating Council (WECC) area. The base cases were developed through review and any required revision by WASN and those entities that supply and receive power over WASN s transmission system as well as other utilities within Northern California. This was accomplished through the WECC base case compilation process. Cases obtained from the WECC website include associated dynamic modeling data for conducting dynamic stability analysis. The dynamic modeling data includes modeling of generator units within the WECC area as well as for various types of electric load. For the purposes of this assessment study, the transmission system configuration has been updated to reflect, according to the projected year of operation, new planned transmission system reinforcements expected to be approved and be operational. Historically, maximum power flow through WASN s transmission system has occurred during summer peak load and high hydroelectric power generating conditions when predominant power flow through the 500 kv transmission system in California is in a North to South direction. This represents the system state when the WASN transmission system is most stressed. However, there are system conditions that occur during other seasons or load conditions that warrant investigation. These include summer off-peak conditions when loads are lower, hydroelectric power is reduced and the direction of predominant power flow through the 500 kv transmission system in California can be in a South to North direction and winter peak load conditions when loads and hydroelectric power are reduced, some thermal units are off-line for annual maintenance and the load pattern reflects winter heating demands. The base cases that were utilized for this annual transmission assessment study and evaluation are listed in Table 2. WASN associated transmission projects that are planned and scheduled to become operational during the 10 year assessment time span are modeled within the base cases, contingency and switching files. Reconductoring of the Shasta-Flanagan-Keswick 230 kv line is being planned for operation by This reconductoring project will allow for the unimpeded full operation of Reclamation s Shasta Hydro Power Plant. The Cottonwood Jumper 8
11 replacement project is scheduled to be complete by the end of This project will increase the ratings of all WASN lines associated with the Cottonwood 230 kv Bus G- Section. Also captured in the base cases from 2015 to 2024 is the potential disconnection of the Sutter Energy Center Power Plant could be off-line at times when it is not economic for the owner to operate. Table 2: List of Study Base Cases Derived from WECC Base Cases WINTER SPRING SUMMER AUTUMN Light Heavy Light Heavy Light Heavy Light Heavy 2015 X X 2016 X 2017 X 2018 X 2019 X X 2020 X 2021 X 2022 X X 2023 X 2024 X X B. Electric Demand and Power Factor Assumptions Base case assumptions for electric demand and power factor represented projected summer peak load conditions, where appropriate, as reported by WASN s planning area Load Serving Entities (LSE) consistent with the California Energy Commission s (CEC) Integrated Energy Policy Report (IEPR). These assumptions include load projections for all of Northern California including for public and privately owned electric utilities. Existing and planned reactive power resources are modeled and put on-line as required to ensure that adequate reactive resources are available to meet system performance on the WASN system. Overall electric demand and power factor assumptions for the WECC system-wide base cases incorporates a 1-in-5 year adverse weather assumption based on ambient temperature. The load in Northern California and specifically the North Valley area (includes the Sacramento Valley Area) incorporates a 1-in-10 year adverse weather assumption and corresponding electric load. Additional information on 9
12 the electric demand forecast is listed in Table 3 Table 3: Forecasted Load in MW represented in summer peak load power flow cases (4) Year SMUD City of Redding(3) City of Roseville MID WASN Direct Service(1) Total Northern California Area Load (2) 28,386 28,329 29,870 (1) Includes the Tracy Pumping Plant, City of Shasta Lake, Lawrence Livermore Lab (2) Includes - PG&E, SVP, SMUD, MID, TID, WAPA Direct Svc, LMUD, NCPA, Roseville, Redding, CDWR and Other Muni's (3) Redding includes load at Knauf (4) Forecasted 1-in-10 year load for the Sacramento Valley was used when appropriate. In several years forecasted load was greater than Load Serving Capability load, in which case load was adjusted while monitoring WAPA s Elverta bus voltage. WASN is not an LSE and has no obligation to support the load of adjacent Sacramento Valley LSE s. C. Import-Export and Major Path Assumptions The summer peak base cases modeled approximately 4,800 MW flowing north-to-south on the California-Oregon Intertie, COI (Path 66). The flow on the Midway-Vincent 500 kv lines (Path 26) at Midway Substation varied as necessary to balance loads and resources in Northern California. Additionally, Northern California Hydro conditions were modeled at 100% output. D. Generation Assumptions Assumptions on existing generation facilities such as capability and output levels were developed based on generation dispatch data for Northern California for most base cases that would provide the most stressed conditions during heavy summer conditions. In recent years Northern California total generation for both hydro and thermal have changed greatly and as a result impacts on the COI versus Northern California Hydro nomogram have equally changed. In order to capture impacts and the changing nature 10
13 of Northern California generation as a whole, 100% Northern California hydroelectric generation was assumed in the heavy summer cases. Although this generation dispatch exceeds generation levels of current nomogram generation levels, it captures possible concerns in the planning horizon. These extreme planning conditions will highlight possible weak areas in the WASN transmission grid, while capturing the changing nature of Northern California generation patterns. US Bureau of Reclamation Central Valley Project hydro generation was modeled at maximum output to provide maximum stress to the northern portions of the Western system as well as PG&E hydro generation. The overall generation pattern and level of generation modeled in power flow base cases was representative of recent utility information provided for both PG&E and WECC seasonal base cases representing peak and off-peak load conditions. By studying different years and seasons from 2015 to 20124, various generation patterns that could influence system reliability were simulated and analyzed. 11
14 STUDY SCOPE The assessment process tested the WASN transmission system against NERC Planning Standards TPL-001 thru TPL-004 and their requirements. The study included analyses of contingencies related to the WASN transmission system. The list of contingencies studied to evaluate the system performance is given in the section labelled Contingencies Studied. This assessment included evaluating the transmission grid for the following: Thermal Loading and Voltage Limits Voltage Stability Post Transient Voltage Dynamic and Transient Stability A. Thermal Loading and Voltage Limits A thermal loading assessment was performed on all WASN transmission facilities. This analysis examined thermal loadings under normal and contingency conditions. When a WASN transmission facility was determined to exceed its thermal capability normally or during contingency conditions, WASN addressed the thermal loading with a mitigation plan. WASN examined system voltages to determine if they stayed within acceptable post transient and steady state limits. As with the thermal loading assessment, the analysis included examining base case (normal) conditions and contingency conditions. B. Voltage Stability Post Transient Voltage Voltage stability studies were performed under normal and contingency conditions in accordance with the WECC Guide to WECC/NERC Planning Standards I.D: Voltage Support and Reactive Power. The voltage stability assessment consisted of an assessment of reactive margin under normal and contingency conditions. When analyzing voltage stability, the WECC requires a 5% increase in load for single contingencies (Category B) and 2.5% for double contingencies (Category C). Post-transient voltage analysis was conducted at points where the WASN transmission system connects to customer load-serving entities (LSE s) such as for the Cities of Redding (Keswick substation) and Roseville (Elverta substation) as well as interconnections to the Sacramento Municipal Utility District (SMUD) (Elverta substation), the US Bureau Of Reclamation (USBR) Pumps at Tracy and at 500 kv and 230 kv connections to Pacific Gas & Electric Company (PG&E) / California Independent System Operator (CAISO) transmission system at the Tracy Substations. 12
15 Historical post-transient studies have shown that the most limiting conditions occur under peak load conditions, such as during summer peak load conditions. The years 2015, 2019 and 2024 were analyzed. The Elverta 230 kv bus continues to be an indicator of available reactive support and is similar to the Roseville 230 kv bus in that they both interface with a significant amount of adjacent LSE load. Specifically, the following points in WASN s transmission system were analyzed for Category B and C contingencies: Keswick 230 kv Substation (Connection to the City of Redding) Elverta (Connection to SMUD) Tracy (Connection to PG&E/CAISO) C. Transient Stability The transient stability assessment was conducted in accordance with WECC Stability Standards for selected contingency conditions. The contingencies run included those for the various sub-categories within the main reliability categories B, C and D. The scope of these studies was sufficient to establish the existence of any stability problems. The analysis followed the latest transient stability modeling methodology recommended by WECC. The analysis included evaluation of damping and swing voltage (amount and duration). While Table 1, within the NERC Planning Standards TPL-001 thru TPL-004, a 3-phase fault was simulated for Category B and C3 contingencies. A single phase to ground fault was simulated for Categories C1, C2 and C6 thru 9. Transient stability studies focused on both the 500 kv transmission system (California/Oregon Transmission Project (COTP)) and the 230 kv transmission lines between Olinda, Cottonwood, O Banion, Roseville and Elverta Substations as determined by their location between generation resources and load centers as well as being between sub-regional generation resources such as Northern California hydro power plants and San Francisco Bay Area thermal power plants. 13
16 TRANSMISSION SYSTEM ASSESSMENT STUDY RESULTS Summary The annual transmission assessment (near-term and long-term) begins with establishing study assumptions. The primary study assumptions are included in power flow base cases that are routinely developed through the WECC. Power flow base cases included in this annual assessment, spanning the next ten years, cover various seasonal load levels and include projected firm transfers and existing and planned facilities. Based on previous analyses, it is clear that any potential system problems would occur and be seen under summer peak load conditions. To ensure capturing any potential reliability problems under other system conditions, summer off-peak and winter peak load conditions were also analyzed. These additional seasonal periods capture both high and low load conditions, high and low local area and regional generation levels, bi-directional power flow over the 500 kv system running through Northern California as well as a different load pattern associated with winter and the use of electric area heating. Based on previous annual transmission assessments and various studies conducted during the year that are associated with system operations and transmission and generation interconnection requests, not all contingencies for each of the power flow base cases are reported on and included in the attachments to the report. The report and attachments to the report do include the analysis illustrating the identification of potential reliability problems and how these potential problems may be mitigated in conformance with NERC Planning Standards. Additional power flow, post-transient and dynamic stability plots are included in the attachments to demonstrate conformance with analyzing various system conditions including seasons of the year, various load levels, major transmission path flow levels and direction as well as generation dispatch patterns. The base cases are well coordinated in advance with input, comment and review for accuracy from adjacent utilities, balancing authorities, power producers and market participants. This annual assessment includes evaluating steady-state thermal facility loadings, voltages, post-transient reactive margin and dynamic stability. Assessment results are compared with previous years study results. This assessment includes planned transmission reinforcement projects. If necessary, additional analysis is performed to confirm any unexpected study results. As required to mitigate any reliability problems discovered, proposed measures were identified with their proposed operation date. The lead time required to implement the proposed mitigation measures is considered and sufficient lead time was established to meet the required operational date. The assumptions for this annual assessment were documented in a study plan (Attachment 2). With the power flow cases listed in Table 2 and transmission system contingencies considered in this annual transmission assessment, more than 100,000 files were generated from the power flow thermal and voltage analysis, post-transient reactive support analysis, and dynamic stability analysis. This report includes samples 14
17 of the results that typify the overall results of the assessment. The samples of study results plotted and included in this report are based on current results and the results of previous annual transmission assessments and the potential impacts of new transmission projects and changes in generation resources. The results reported and included in the attachments to this report are deemed sufficient to illustrate the overall state of reliability within the WASN transmission system. Additional plotted assessment results are available upon request. While it is shown in the analysis that there are some potential TPL-002, TPL-003 and TPL-004 reliability problems during summer peak load conditions, none were found under summer off-peak, autumn off-peak, or winter peak load conditions. Summary of potential reliability problems identified in are given as follows: (a) Under normal system conditions, with maximum Shasta generation and the Shasta 230 kv bus configured as a double-bus double-breaker arrangement, the Shasta-Flanagan 230 kv line loads beyond its normal thermal rating in 2014 and beyond due to some Category A, B, and C contingencies. A project is in progress to reconductor the 230 kv line from Shasta to Flanagan to Keswick to mitigate potentially overloading these lines. This project is due to be in operation by the end of With the Shasta 230 kv bus connected in a single bus arrangement, an outage of the Keswick-O Banion and Keswick-Olinda 230 kv lines can cause the Keswick - Airport and Airport - Cottonwood 230 kv lines to load above their emergency ratings. With the Shasta bus configured in a split-bus arrangement, only the Keswick - Airport line will load above its emergency rating. Reliability is presently maintained through operating nomograms developed within Daily Operating Studies that are utilized in real-time operations. These studies are conducted to conform, in part, with WASN OP- 53 (Planned Outage Coordination).The study findings define real-time operating limits with and without planned or forced outages of WASN transmission system facilities. As system limitations are recognized and change, WASN Operating Procedure OP-17 is updated. WASN OP-17 also covers the outage of one transmissionline over-lapping with the outage of the other line. Reconductoring thess lines from Keswick to Airport and to Cottonwood Sub has been recommended and approved. This project is due to be in operation by This mitigation proposal is identified with meeting Category C NERC Planning Standard TPL-003. System studies show that during an outage of one of the Cottonwood Olinda 230-kV transmission lines, the level of Northern California hydro generation in addition to generation from a new combined-cycle power plant (Colusa) could load the remaining Cottonwood-Olinda 230 kv line above its emergency rating upon an outage of the Captain Jack Olinda 500-kV line or the loss of the Keswick O Banion and Keswick Olinda credible double line outage or upon a stuck breaker condition that would result in the same double line outage condition as well as the loss of the Keswick south bus. WASN along with collaboration from the CAISO, SMUD and PG&E have implemented Operating Procedure OP-17D for presently mitigating to these loading issues. Reconductoring both Cottonwood-Olinda #1 and #2 230 kv lines has been 15
18 recommended and approved. This project is due to be in operation by potential over-lapping outage is associated with TPL-003. This (b) With the Sutter Energy Center off-line, one of the Tracy-Hurley 230 kv lines could overload due certain category B, C, and D contingencies. The Sacramento Area is operated within a nomogram that has at times been defined by this outage and is documented in annual Sacramento Valley Study Group reports. Reconductoring TRY- HUR #1 and #2 lines are not currently scheduled, however it is under review. (c) An overlapping outage of the O Banion-Elverta #1, #2 and #3 230 kv lines can cause the SMUD Natomas-Hurley 230 kv line to load above its summer emergency rating by 153% during 2014 summer peak load conditions with the Sutter Energy Center on-line. The O Banion Elverta #1 and #2 lines run on double circuit towers and are considered a credible double line outage and are studied as such in this assessment as well as in operational studies. An operating procedure (WASN OP- 57B) is in place to limit the Sutter Power Plant (directly connected to the O Banion 230 kv Sub) generation upon the first part of this over-lapping outage occurring and therefore prevent loading the Hurley-Natomas 230 kv line above its emergency rating upon the next outage occurring. A Special Protection System to detect the overload along with the outages is being defined and will be put in place if it is determined it is needed in addition to or in place of the operating procedure. This over-lapping Category D outage is associated with TPL-004. (d) One combination of outages (over-lapping outages of the Keswick-Olinda, Keswick-O Banion, Keswick-Airport and Keswick Flanagan 230 kv lines) at the Keswick substation can cause a number of 115 kv transmission lines connected to Keswick Substation to overload as well as causing the Keswick 230/115 kv transformer banks to overload. This outage can occur during maintenance conditions when part of the over-lapping outage is already out. WASN Operating Procedure OP- 57 outlines the procedure for reducing hydro generation at Keswick, J.F.Carr and Spring Creek Power Plants to prevent and or relieve overloads upon an outage of one of these lines. WASN is pursuing a switching procedure to mitigate any overloads. WASN Operating Procedure OP-57 also outlines mitigation for other category D outages. (e) With the Shasta bus in the double bus double breaker arrangement, a Shasta Cottonwood #1 and #2 double line outage can cause the normal overload of the Keswick Olinda line to approach its emergency rating (99%). This condition is mitigated in real-time and day ahead studies, additionally the limiting element on this line is shown to be a disconnect switch. Mitigation in the form of replacing the disconnect switch has been approved and is planned to be done during a normal maintenance outage in This over-lapping Category C outage is associated with TPL-003. (f) Associated with the Keswick 230 kv substation are potential reliability problems due to some Category D contingencies (line out for maintenance or forced out) 16
19 overlapping with a combination of line outages associated with stuck breaker conditions at Keswick 230 kv Sub. This can result in line loading exceeding emergency ratings. These potential reliability problems are mitigated in real-time and day ahead studies which institute a reduction in Northern Central Valley Project generation output when required. When these conditions arise WASN coordinates with the City of Redding to notify them of issues related to their transmission system. (g) With all lines in service and the loss of the Sutter Energy Center, a Tracy-Hurley #1 and #2 double line outage or a stuck breaker condition that would also result in the Tracy-Hurley #1 and #2 double line outage, can cause the emergency rating of the PG&E Tesla-Weber 230-kV line to be exceeded. This potential overload condition is mitigated in real-time or day ahead studies in coordination with SMUD which institute generation re-dispatch in the SMUD area. This over-lapping Category D outage is associated with TPL-004. (h) An outage of one of two Tracy 500/230 kv transformer banks over-lapping with an outage of the Tracy-Tesla 500 kv line can cause the remaining Tracy 500/230 kv transformer bank to load above its summer normal rating and in most cases below its emergency rating. Mitigation for this over-lapping forced outage is addressed in realtime operations in conjunction with California Independent System Operator (CAISO) where generation is re-dispatched and 500 kv flow schedules are modified as required. This over-lapping Category C outage is associated with TPL-003. Post-transient and steady-state outage studies in this current WASN annual transmission assessment continue to show that maintaining reliable and sufficient import capability into the Sacramento Area is dependent on Sacramento Area load serving entities continuing efforts to install sufficient reactive voltage support as their load grows. Studies show that there may be insufficient voltage support in the five and ten-year (2019 and 2024) power flow cases for two Category D outages (either the Sutter Power Plant off line over-lapping with an outage either of the Tracy-Hurley 230 kv lines #1 & #2 or the Bellota-Rancho Seco #1 & #2 230 kv lines). These lines are used to import power into the Sacramento Area. These study results are consistent with the seasonal Sacramento Valley Study Group (SVSG) analysis which determines import capability limits into the Sacramento Area and where operating nomograms are developed to maintain reliability. This is associated with meeting NERC Planning Standard TPL-004. This report is distributed to neighboring utilities and those SVSG member utilities so that they can continue to monitor these potential reliability problems and continue to mitigate for them.mitigation is a coordinated effort with WASN. The estimated lead time to install reactive voltage support is 3-5 years, so future WASN annual transmission assessments will continue to monitor this potential condition. All dynamic stability simulations were stable and damped. All post-transient simulations showed margin beyond the operation point and included increasing load by 5% and 2.5% for single and multiple contingencies. In addition to the various plots included in the body of the report and the attachments to this report, additional plots are in WASN computers and available upon request. 17
20 A. Category A (NERC Planning Standard TPL - 001): All Facilities in Service, (N-0) WASN s transmission system has been planned such that, with All Transmission Facilities in Service and with normal (pre-contingency) operating procedures in effect (WASN OP-17, OP-50, OP-57 and OP-59), the Network can be operated to supply projected customer demands and projected Firm (non - recallable reserved) Transmission Services at all demand levels over the range of forecasted system demands, under the conditions defined in Category A of Table 1 within the TPL NERC Planning Standard. The system assessment done to evaluate the steady state, post-transient, and dynamic stability requirements are as follows: A.1 Steady State Evaluation While an operational nomogram is created by Northern California utilities in coordination with Northwest utilities and operated to by the California Independent System Operator to account for simultaneous COI and Northern California hydro generation levels, this nomogram does not account for levels of Shasta generation up to its maximum of 142 MW per unit and 710 MW for the entire plant consisting of 5 generator units. Under normal system conditions, with maximum Shasta generation and the Shasta 230 kv bus configured as a double-bus double-breaker arrangement, the Shasta-Flanagan 230 kv line loads beyond its normal thermal rating in 2015 and beyond under certain Trinity River Division generation patterns and COI flow. The output of Shasta generation is dispatched such that no overloads occur with all lines in service or during contingency conditions. A project has been proposed to reconductor the 230 kv line from Shasta to Flanagan to Keswick to mitigate potentially overloading these lines. This project is due to be in operation by 2015 summer. This project is identified with meeting Category A NERC Planning Standards TPL-001. Figures 3-1a and 3-1b show the Shasta-Flanagan power flow pre and post line reconductoring. 18
21 Figure 3-1a: Shasta Flanaga - Keswick 230 kv Line Overload Pre-Reconductoring Figure 3-1b: Shasta Flanagan-Keswick 230 kv Line No Overload Post Reconductoring 19
22 A.2 Post-Transient Evaluation As verification for meeting the requirements of NERC Planning Standard TPL-001, the projected state of WASN s transmission system is shown by power flow, post-transient and dynamic stability plots. The post-transient plots are shown in Figures 3-2 as follows: Figures 3-2a to 3-2d represent the results for the 2015 Heavy Summer system loading condition and Figures 3-2e to 3-2h represent the results for the 2015 Heavy Winter system loading condition. Figure 3-2a: Elverta 230 kv Bus Reactive Power Requirement Figure 3-2b:Tracy 230 kv Bus Reactive Power Requirement 20
23 Figure 3-2c: Olinda 230 kv Bus Reactive Power Requirement Figure 3-2d: Tracy 500 kv Bus Reactive Power Requirement 21
24 Figure 3-2e: Elverta 230 kv Bus Reactive Power Requirement Figure 3-2f: Tracy 230 kv Bus Reactive Power Requirement 22
25 Figure 3-2g: Olinda 230 kv Bus Reactive Power Requirement Figure 3-2h: Tracy 500 kv Bus Reactive Power Requirement A.3 Dynamic Stability Evaluation The dynamic stability plots are shown in Figures 3-3 as follows: Figures 3-3a to 3-3e 23
26 represent the results for the 2015 Heavy Summer system loading condition and Figures 3-3f to 3-3j represent the results for the 2015 Heavy Winter system loading condition. Figure 3-3a: Heavy Summer Generator Rotor Angle with No Fault 24
27 Figure 3-3b: Heavy Summer Generator Bus Voltage with No Fault 25
28 Figure 3-3c: Heavy Summer Generator Bus Frequency with No Fault 26
29 Figure 3-3d: Heavy Summer, Load Bus Voltage with No Fault 27
30 Figure 3-3e: Heavy Summer, Load Bus Frequency No Fault 28
31 Figure 3-3f: Heavy Winter, Generator Rotor Angle No Fault 29
32 Figure 3-3g: Heavy Winter, Generator Bus Voltage No Fault 30
33 Figure 3-3h: Heavy Winter, Generator Bus Frequency No Fault 31
34 Figure 3-3i: Heavy Winter, Load Bus Voltage No Fault 32
35 Figure 3-3j: Heavy Winter, Load Bus Frequency No Fault 33
36 As verification for meeting the requirements of NERC Planning Standard TPL-001, the projected state of WASN s transmission system is shown by power flow, post-transient and dynamic stability plots. Post-transient and dynamic stability plots are shown in Figures 3-2 and 3-3 of this report. For the power flow base cases listed in Table 1, no thermal or voltage problems associated with WASN transmission facilities were found except for the loading on the Shasta-Flanagan 230 kv line as related to the level of Shasta generation. The power flow plots illustrate the MW and percent loading on WASN transmission facilities as well as bus voltages as shown in Figures 3-1a and 3-1b. The available MVAr margin and the dynamic stability plots show stable system performance. Therefore, with no unmitigated reliability problems found, no mitigation measures beyond reconductoring of the Shasta-Flanagan 230 kv line are required. This steady-state thermal and voltage analysis were conducted on the 10 years of power flow cases listed in Table 1. Post-transient analysis was conducted on the 1 year (2015), 5 year (2019) and 10 year (2024) base cases. They demonstrate compliance with NERC Planning Standard TPL-001 over a 10 year future period. While posttransient simulations were run on other seasonal load conditions as well as on the WECC cases, the peak summer load cases have been found in historical studies to be the most limiting. Dynamic stability results are shown not just for summer peak load conditions, but also for other seasonal load conditions as stability can be impacted when load is less during off-peak conditions. The dynamic modeling data was not modified and was as downloaded from the Western Electricity Coordinating Council web site. Other post-transient and dynamic stability results not shown are stored in WASN computer and are available upon request. B. Category B (NERC Planning Standard TPL - 002): Single Element Outage, (N-1) This section provides the results of steady-state, post-transient and Transient Stability analysis for NERC Category B contingencies per NERC Planning Standard TPL The system assessment done to evaluate the steady state, post-transient, and dynamic stability requirements are as follows: B.1 Steady State Evaluation An outage of one of the Shasta-Cottonwood #1 or #2 230 kv lines can cause the Shasta-Flanagan 230 kv line to load above its summer emergency rating. To date, reduction of the loading on these lines has been accomplished by operating the Shasta 230 kv bus in a split-bus configuration and therefore one Shasta unit is radial to Flanagan and two units were radial to Cottonwood on each of the 230 kv lines from Shasta. Reliability continues to be maintained through WASN Operating Procedures OP-17 (Contingency Procedure) and OP-59 (Shasta Split Bus Interim Operating 34
37 Procedure). Although the Shasta 230 kv bus was recently built to a double-bus, double-circuit breaker configuration, it continues to be operated in a split-bus configuration. A Special Protection System (SPS) is installed that will drop or reduce Shasta generation upon an outage. However, it is not active because the Shasta 230 kv bus is still operated in the split bus configuration. For the outage of one Shasta- Cottonwood 230 kv lines, reducing Shasta generation will mitigate an emergency overload of the Shasta-Flanagan 230 kv line. A project has been proposed to reconductor the 230 kv line from Shasta to Flanagan to Keswick to mitigate potentially overloading these lines. This project is due to be in operation by 2015 summer. This project is identified with meeting Category B NERC Planning Standards TPL-002. Figures 4-1a and 4-1b show line loading pre and post line reconductoring. Figure 4-1a: Heavy Summer, Overload of SH-FLN-KE 230 kv Line; Due to Outage of SH-CW #1 or # 2 35
38 Figure 4-1b: Heavy Summer, SH-FLN-KE 230 kv Line; No Overload After Reconductoring With the Shasta 230 kv bus configured as a double-bus double-breaker arrangement, an outage of the Shasta-Flanagan 230 kv line can cause the Shasta-Cottonwood #1 and #2 230 kv lines to load above their summer normal, but not the summer emergency ratings. The lines are presently limited by the line jumpers connecting into Cottonwood 230 kv Sub. Coordination with PG&E has been initiated to have the jumpers replaced such that the rating on these lines will be raised to the higher conductor ratings. This is expected to happen by the end of With the jumpers replaced, the lines would load to near, but below their normal ratings upon the outage. In the interim, reliability is maintained through WASN OP-64 (Operations Facility Ratings) and WASN OP-17 (Contingency Procedure). This project is identified with meeting NERC Planning Standards TPL-002. Figures 4-1c 36
39 Figure 4-1c: Heavy Summer, Overload of SH-CW 230 kv Line Due to Outage of SH-FLN 230 kv Line B.2 Post-Transient Evaluation The study results demonstrate that no post-transient problems were discovered other than noted above and that reactive margin exists when the Northern California load was increased by 5% for a single contingency per WECC reactive margin requirements (see Figures 4-2 and 4-3), which show MVAR margin for the Shasta-Cottonwood single line outage and the Shasta-Flanagan single line outage. Although post-transient analysis was conducted for peak as well as off-peak and for winter seasonal load conditions, previous analysis of the WASN transmission system has shown that the most limiting reactive support conditions occur during summer peak load conditions. 37
40 Figure 4.2a: Elverta 230 kv Bus Reactive Power Requirement Figure 4-2b: Tracy 230 kv Bus Reactive Power Requirement 38
41 Figure 4-2c: Olinda 230 kv Bus Reactive Power Requirement Figure 4-2d: Tracy 500 kv Bus Reactive Power Requirement 39
42 Figure 4-3a: Elverta 230 kv Bus Reactive Power Requirement Figure 4-3b: Tracy 230 kv Bus Reactive Power Requirement 40
43 Figure 4-3c: Olinda 230 kv Bus Reactive Power Requirement Figure 4-3d: Tracy 500 kv Bus Reactive Power Requirement 41
44 B.3 Dynamic Stability Evaluation The study results demonstrate that no dynamic stability problems were discovered and that simulations were damped for these two Category B conditions (see Figures 4-4 and 4-5) which show stability plots for the Shasta-Cottonwood single line fault and the Shasta-Flanagan single line fault. In some stability plots, it can be seen where some generator units appear to be out of sync, this is due to the generator units being dropped as part of the switching scheme. Figure 4-4a: 2015 Heavy Summer, Gen Rotor Angle (Fault on SH-CW 230 kv Line) 42
45 Figure 4-4b: 2015 Heavy Summer, Gen Bus Voltage (Fault on SH-CW 230 kv Line) 43
46 Figure 4-4c: 2015 Heavy Summer, Gen Bus Frequency (Fault on SH-CW 230 kv Line) 44
47 Figure 4-4d: 2015 Heavy Summer Load Bus Voltage (Fault on SH-CW 230 kv Line) 45
48 Figure 4-4e: 2015 Heavy Summer Load Bus Frequency (Fault on SH-CW 230 kv Line) 46
49 Figure 4-5a: 2015 Heavy Summer Generator Rotor Angle (Fault on SH-FLN 230 kv Line) 47
50 Figure 4-5b: 2015 Heavy Summer Generator Bus Voltage (Fault SH-FLN 230 kv Line) 48
51 Figure 4-5c: 2015 Heavy Summer, Gen Bus Frequency (Fault on SH-FLN 230 kv Line) 49
52 Figure 4-5d: 2015 Heavy Summer, Load Bus Voltage (Fault on SH-FLN 230 kv Line) 50
53 Figure 4-5e: 2015 Heavy Summer Load Bus Frequency (Fault on SH-FLN 230 kv Line) 51
54 As verification for meeting the requirements of NERC Planning Standard TPL-002, the projected state of WASN s transmission system is shown by power flow, post-transient and dynamic stability plots. The study results demonstrate that no post-transient problems were discovered other than noted above and that reactive margin exists when the Northern California load was increased by 5% for a single contingency per WECC reactive margin requirements (Figures 4-2 and 4-3), which show MVAR margin for the Shasta-Cottonwood single line outage and the Shasta-Flanagan single line outage. Although post-transient analysis was conducted for peak as well as off-peak and for winter seasonal load conditions, previous analysis of the WASN transmission system has shown that the most limiting reactive support conditions occur during summer peak load conditions The study results demonstrate that no dynamic stability problems were discovered and that simulations were damped for these two Category B conditions (see, Figures 4-4 and 4-5), which show stability plots for the Shasta-Cottonwood single line outage and the Shasta-Flanagan single line outage. In some stability plots, it can be seen where some generator units appear to become un-synchronized, this is due to the generator units being dropped as part of the switching scheme. The contingency analysis plots contained in the Figures in 4-4 and 4-5 are samples of the contingency studies conducted, but cover critical points within the WASN transmission system. As can be seen in the list of contingencies, many more contingencies were analyzed and there results were consistent with what is reported here. Plots for those contingencies are stored in WASN computers and are available upon request. This steady-state thermal and voltage analysis was conducted on the power flow cases listed in Table 1 on page 10 in this report. Post-transient and stability analysis were conducted on the 1 year (2014), 5 year (2019) and 10 year (2024) base cases listed in Table 1 on page 10. They demonstrate compliance with NERC Planning Standard TPL over a 10 year future period. 52
55 C. Category C (NERC Planning Standard TPL - 003): Double Element Outages, (N-2) This section provides the results of steady-state, post-transient and Transient Stability analysis for NERC Category B contingencies per NERC Planning Standard TPL C.1 Steady State Evaluation C.1.1 Outage of Shasta-Cottonwood #1 & #2 230 kv Lines An outage of both the Shasta-Cottonwood #1 and #2 230 kv lines can cause the Shasta-Flanagan and Flanagan-Keswick 230 kv lines to load above their summer emergency ratings. To date, reduction of the loading on these lines has been accomplished by operating the Shasta 230 kv bus in a split-bus configuration and therefore one Shasta unit is radial to Flanagan and two units are radial to Cottonwood on each of the 230 kv lines from Shasta. Reliability continues to be maintained through WASN Operating Procedures OP-17 (Contingency Procedure) and OP-59 (Shasta Split Bus Interim Operating Procedure). Although the Shasta 230 kv bus was recently built to a double-bus, double-circuit breaker configuration, it continues to be operated in a split-bus configuration. A Special Protection System (SPS) is installed that will drop or reduce Shasta generation upon an outage, but is currently not armed. For the outage of both Shasta-Cottonwood 230 kv lines, reducing Shasta generation will mitigate an emergency overload of the Shasta- Flanagan and Flanagan-Keswick 230 kv lines. Although the SPS is in place, it is scheduled to be implemented concurrently with the completion of the re-conductor of the Shasta-Flanagan and Flanagan-Keswick 230-kV transmission lines. To mitigate this problem in the near term and long term planning intervals, a project has been proposed to re-conductor the 230 kv line from Shasta to Flanagan to Keswick to mitigate potentially overloading these lines. This project is due to be in operation by 2015 summer. This project is identified with meeting Category C NERC Planning Standards TPL-003. Figure 5-1 shows the power flows for the line outage and the overload. 53
56 Figure 5-1: 2015 Heavy Summer, Overload of SHA-FLN-KE 230 kv Line Due to Outage of SHA-CW #1 & #2 230 kv Lines C.1.2 Keswick-O Banion 230 kv and Keswick- Olinda 230 kv Lines Outage With the Shasta 230 kv bus connected in a single bus arrangement, an outage of the Keswick-O Banion and Keswick-Olinda 230 kv lines can cause the Keswick - Airport and Airport - Cottonwood 230 kv lines to load above its emergency rating. During high generation dispatch of the Northern CVP units and mid to low import levels of the Redding system a double line outage of the Keswick-O Banion and Keswick-Olinda 230 kv lines will cause the Keswick - Airport and Airport - Cottonwood 230 kv lines to load above its emergency rating. In nearly all generation and import scenarios the loss of both of the Keswick-O Banion and Keswick-Olinda 230 kv lines will cause the Keswick - Airport and Airport - Cottonwood 230 kv lines to load above their normal ratings (see Figure 5-2). This condition will limit TRD and Shasta generation pre-contingency and cause extreme reductions to TRD and Shasta generation in post contingency conditions to reduce line loading below normal ratings in a 30 minute period. Additionally, TRD and Shasta generation will need to be reduced pre-contingency during certain maintenance and overlapping outage conditions associated with the Keswick O Banion and Keswick-Olinda 230-kV lines to mitigate loading on the Keswick - Airport and Airport - Cottonwood 230 kv lines. Reliability is maintained through nomograms 54
57 operation and within Daily Operating Studies that are conducted the day ahead and utilized in real-time operations. These studies are conducted in part for conformity with WASN OP-53 (Planned Outage Coordination). Figure 5-2: 2015 Heavy Summer, Overload of KE - AIR 230 kv Line Due to Outage of KE - OBN and KE-ODA230 kv Lines The study findings define real-time operating limits with and without planned or forced outages of WASN transmission system facilities. As system limitations are recognized, WASN Operator Procedure OP-17 is updated. WASN OP-17 also covers the outage of one of these lines over-lapping with the outage of the other line. Reconductoring this line is currently scheduled for completion in This mitigation proposal is identified with meeting Category C NERC Planning Standard TPL-003. C.1.3 Cottonwood Olinda 230 kv Line Outage System studies show than during a planned outage of one of the Cottonwood Olinda 230-kV transmission lines, the level of Northern California hydro generation in addition to generation from Colusa Power Plant (Colusa) could potentially load the remaining Cottonwood-Olinda 230 kv lines above its emergency rating upon an outage of the Captain Jack Olinda 500-kV line or the loss of the Keswick O Banion and Keswick 55
58 Olinda credible double line outage or stuck breaker conditions that would result in the same double line outage condition as well as the loss of the Keswick south bus. Table 4 provides information on the line loading for the separate overlapping contingencies with some power flow plots shown in Figures 5-3a and 5-3b. Table 4: Cottonwood-Olinda #1 230-kV line Out of Service* Equipment of Concern Normal Rating (%) Emergency Rating (%) Contingency Description Cottonwood-Olinda # Captain Jack - Olinda 500-kV Cottonwood-Olinda # KES-OBN/KES-ODA DLO Cottonwood-Olinda # KES-OBN/KES-ODA DLO Cottonwood-Olinda # Keswick 230 kv South Bus_FLN_sps Cottonwood-Olinda # CAR1_KESX_FAILKES_WHY_fln_sps Cottonwood-Olinda # FLN_KESX_FAILKES_fln_sps_WHY Cottonwood-Olinda # OBN_KESX_FAILKES_fln_sps_WHY Cottonwood-Olinda # ODAX_KES_FAILKES_fln_sps_WHY * Results with the Cottonwood-Olinda #2 line Out of Service will be identical to those shown above only the Cottonwood-Olinda #1 line will be the equipment of concern Figure 5-3a: 2024 Heavy Summer, Overload of CW-ODA #2 230 kv Line Due to Outage of CW-ODA #1and CPJ-ODA 500 kv Lines 56
59 Figure 5-3b:2024 Heavy Summer, Overload of CW-ODA #2 230 kv Line Due to Outage of CW-ODA and KE-ODA 230 kv Lines The Colusa Combined-Cycle Power Plant is interconnected to PG&E s 230 kv transmission lines running south from Cottonwood Sub. Operating procedures as well as operation coordination between WASN and the CAISO (using day-ahead WASN outage coordination studies related to WASN Operating Procedure OP-53) take this into account such that either or both the combined-cycle generation level is reduced or the level of Northern California hydro generation depending on the level of N-S power flow from Oregon into California over the Malin-Round Mt. 500 kv lines. The Round Mt Substation is connected to the Cottonwood Substation via three 230 kv lines. The overload conditions are reflective of the limitations on the Cottonwood-Olinda 230 kv lines. With these limitations resolved the potential overload from the over-lapping outage will be mitigated. With Colusa Off-line the Cottonwood Olinda lines do not exceed their emergency rating, they do exceed their normal ratings, however. Reliability criteria states flow on a line must not exceed its emergency rating and must be reduced to below its normal rating within 30 minutes. This reduction in flow below the normal line rating would require substantial reduction in Northern CVP generation. WASN along with collaboration with the CAISO, SMUD and PG&E have implemented Operating Procedure OP-17D for mitigation to these loading issues. Reconductoring this line is not currently scheduled, however it is under review. This potential overlapping outage is associated with TPL
60 C.1.4 Shasta - Cottonwood #1 & #2 230 kv Lines Outage With the Shasta bus in the double bus double breaker arrangement a Shasta Cottonwood #1 and #2 double line outage can cause the normal overload of the Keswick Olinda line, approaching emergency rating violations (97%). This condition is mitigated in real-time and day ahead studies, additionally the limiting element on this line is shown to be a disconnect switch. A project has been proposed to reconductor the 230 kv line from Shasta to Flanagan to Keswick to mitigate potentially overloading these lines. This project is due to be in operation by 2015 summer In the interim, dayahead and real-time studies will ensure that reliability criteria are met and that no violations occur due to this outage. This over-lapping Category C outage is associated with TPL-003. Figure 5-4 Figure 5-4: 2024 Heavy Summer, Overload of the KE-FLN, and FLN-SHA 230 kv Line, Due to SHA-CW #1 and # kv Lines Outage C.1.5 Keswick O Banion 230 kv Overlapping Line Outage With the Keswick O Banion line out of service an overlapping outage of either the Airport Cottonwood or the Keswick Airport can load the Keswick Olinda line above 58
61 its emergency rating by 9% and 6%, respectively. Further research will be performed to determine if the replacement of the disconnect switch or other limiting equipment (if any) will mitigate this loading issue. In the interim, day-ahead and real-time studies will ensure that reliability criteria are met and that no violations occur due to this outage. This over-lapping Category C outage is associated with TPL-003. See Figure 5-5. Figure 5-5: 2024 Heavy Summer, Overload of ODA-KE 230 kv Line, Due to KE-OBN and CW-AIR 230 kv Lines Outage C.1.6 Tracy 500/230 kv Transformer Overlapping Outage An outage of one of two Tracy 500/230 kv transformer banks over-lapping with an outage of the Tracy-Tesla 500 kv line can cause the remaining Tracy 500/230 kv transformer bank to load above its summer normal rating and in most cases below its emergency rating. Figure 5-6a shows that with one of the Tracy 500/230-kV transformers out of service and the Tracy Tesla 500-kV line out of service, the remaining Tracy 500/230-kV transformer will load to 110% of its normal rating and 90% of its emergency rating (Figure 5-6b shows emergency rating loading). Mitigation for this is addressed in real-time operations in conjunction with CAISO. This over-lapping Category C outage is associated with TPL
62 Figure 5-6a: 2024 Heavy Summer, Overload of Outage of TCY 500/230kV #2 Due to TCY500/230kV #1 Overlapping with TCY-TES 500 kv Line Outage C.2 Post - Transient and MVAr Margin Evaluation The MVAr margin evaluations for the different cases were evaluated based on the same contingencies used in the fault analysis. More plots of the available MVAr margin evaluation are stored on WASN computers and are available upon request. The posttransient plots in Figures 5-7 and 5-8 show available MVAr margin with load increased by 2.5% per WECC reactive margin requirements. Figure 5-7(a-c) shows the reactive power requirement at different buses for Shasta-Cottonwood double line outage. Figure 5-8(a-c) shows the reactive power requirement at different buses for Keswick-O Banion and Keswick - Olinda double line outage 60
63 C.2.1 Shasta-Cottonwood Double Line Outage Figure 5-7a: Elverta 230 kv Bus Reactive Power Requirement Figure 5-7b: Tracy 230 kv Bus Reactive Power Requirement 61
64 Reactive Margin (MVAR) 2014 WAPA Sierra Nevada Region Transmission Grid Assessment Report Figure 5-7c: Olinda 230 kv Bus Reactive Power Requirement C.2.2 Keswick-O Banion and Keswick - Olinda Double Line Outage 100 Elverta 230-kV Bus Bus Voltage (PU) Figure 5-8a: Elverta 230 kv Bus Reactive Power Requirement 62
65 Figure 5-8b: Tracy 230 kv Bus Reactive Power Requirement Figure 5-8c: Tracy 230 kv Bus Reactive Power Requirement 63
66 C.3 Dynamic Stability Evaluation For category 3 requirements, the same contingencies used in the post-transient reactive power requirement evaluation were also used in the transient simulations for dynamic stability evaluation. The dynamic stability plots in Figure 5-9(a-e) and 5-10 (a-e) show samples of the system response to disturbances at Shasta Cottonwood for double line outage (dlo) and Keswick-O Banion/Keswick-Olinda for double line outage. The Stability plots show stable system performance. In some stability plots, it can be seen where some generator units appear to be out of sync, this is due to the generator units being dropped as part of the switching scheme. More dynamic stability plots are stored on WASN computers and are available upon request. 64
67 Figure 5-9a: 2024 Heavy Summer, Generator Rotor Angle (Fault on CW-SHA 230 kv Line) 65
68 Figure 5-9b: 2024 Heavy Summer, Generator Bus Voltage (Fault CW-SHA 230 kv Line) 66
69 Figure 5-9c: 2024 Heavy Summer, Generator Bus Frequency (Fault on CW-SHA 230 kv Line) 67
70 Figure 5-9d: 2024 Heavy Summer, Load Bus Voltage (Fault on CW-SHA 230 kv Line) 68
71 Figure 5-9e: 2024 Heavy Summer, Load Bus Frequency (Fault on CW-SHA 230 kv Line) 69
72 Figure 5-10a: 2024 Heavy Winter, Generator Rotor Angle (Fault on CW-SHA 230 kv Line) 70
73 Figure 5-10b: 2024 Heavy Winter, Generator Bus Voltage (Fault on CW-SHA 230 kv Line) 71
74 Figure 5-10c: 2024 Heavy Winter, Generator Bus Frequency (Fault on CW-SHA 230 kv Line) 72
75 Figure 5-10d: 2024 Heavy Winter Load Bus Voltage (Fault on CW-SHA 230 kv Line) 73
76 Figure 5-10e: 2024 Heavy Winter, Load Bus Frequency (Fault on CW-SHA 230 kv Line) 74
77 As verification, the projected state of WASN s transmission system related to TPL -003 is shown by power flow, post-transient and dynamic stability plots included in the preceding sections of this report. The contingency analysis plots are samples of the contingency studies conducted, but cover critical points within the WASN transmission system such that it can be expected that other contingencies at other points would produce similar results. It was also shown that the most limiting system condition is the during summer peak load season, although thermal, post-transient and dynamic stability simulations were run for summer off-peak and winter load and flow conditions. Study results for these conditions are available upon request. Post-transient and stability plots are provide for the Cottonwood-Olinda #1 and #2 double line outage, the Keswick- O Banion and Keswick-Olinda double line outage. The Stability plots show stable system performance. The steady-state thermal and voltage analysis was conducted on the power flow cases listed in Table 1. Post-transient and dynamic stability analysis were conducted on the 5 th year (2019) and 10 th year (2024) base cases as well as the three WECC base cases also listed in Table 1. They results demonstrate compliance with NERC Planning Standard TPL over a 10 year future period. Post-transient and dynamic stability plots are available on request. Dynamic stability analysis was primarily conducted modeling a 3-phase fault which is more severe than a single-phase to ground fault with normal clearing times, but analysis was conducted to assess the impact of a single-phase to ground fault with delayed clearing times. Based on comparing the results of 3-phase faults and single-phase to ground faults where all the simulations were stable, it can be concluded that no instability and less post-contingency impact to the system would be found if all contingencies were run modeling single-phase to ground faults. The study results demonstrate that no dynamic stability problems were discovered and that simulations were sufficiently damped. In some stability plots, it can be seen where some generator units appear to be out of sync, this is due to the generator units being dropped as part of the switching scheme. D. Category D (NERC Planning Standard TPL - 004): Extreme Events (N-2 plus) Attachment 1 contains power flow, post-transient and dynamic stability plots illustrating the impact of NERC Category D contingencies per NERC Planning Standard TPL D1. Rancho Seco 230 kv Double Line Outage (dlo) The Tracy-Hurley 230 kv lines could potentially overload due to the Rancho Seco 230-kV double line outage. Analysis was done under two separate conditions to determine the impact of this contingency on the system: (a) With Sutter Energy Center off-line and no reactive support assumed in place for 2016HS case, a double outage of Rancho Seco 230 kv line will cause voltage 75
78 depression at Everta 230 kv bus and the surrounding areas with overloading of Tracy Hurley #1 and #2 lines simultaneously. Figure 6-1a&b (2016hs2a) show the loading on the Tracy-Hurley #1& #2 lines at 126% and 117% respectively exceeding normal rating and the Tracy Hurley #1 & #2 lines at 104% and 107% respectively exceeding emergency rating, both conditions with Elverta bus voltage at 225-kV. (b) With Sutter Energy Center on-line and reactive support assumed in place for 2016HS case, studies indicate that neither the Tracy Hurley #1 or #2 line will exceed any of the ratings due to the Rancho Seco Double line outage. Figure 6-1c (2016hs2a) shows the loading on the Tracy-Hurley #1 line at 85.8% normal rating and the Tracy Hurley #2 line at 79.8% normal rating, both conditions with Elverta bus voltage at 229-kV. These results substantiate previous annual assessment findings. In addition, the low voltage issue will continue to be a potential problem looked at in future transmission assessments by both WASN, but more importantly, the Load Serving Entities within the Sacrament Area. Annual transmission planning is being actively coordinated between WASN and the Sacramento Municipal Utility District, as well as other Sacramento Valley utilities. The time-line to resolve any shortage of reactive voltage support can be 2-3 years since the support is typically installed within existing substation and therefore permitting is limited and the time to construct is shorter. The Sacramento Area is operated within a nomogram that has at times been defined by this outage and is documented in annual Sacramento Valley Study Group reports. The need for reactive voltage support to support projected load in the Sacramento Area is also a part of this study as well as the annual transmission assessments of the load-serving entities (LSE) within the Sacramento Area of which WASN is not a LSE. Reconductoring TRY- HUR #1 and #2 lines are not currently scheduled, however it is under review. This outage is classified as a Category D outage and associated with TPL-004. D2. O Banion Elverta #1, #2, and #3 230 kv Lines Outage An overlapping outage of the O Banion-Elverta #1, #2 and #3 230 kv lines can cause the SMUD Natomas-Hurley 230 kv line to load above its summer emergency rating by 174% and the Natomas O Banion 230 kv line load to 99.8% of its summer emergency rating during 2019 summer peak load conditions with the Sutter Energy Center on-line. The O Banion Elverta #1 and #2 lines run on double circuit towers and are considered a credible double line outage and are studied as such in this assessment. An operating procedure (WASN OP-57B) is in place to limit the Sutter Power Plant (directly connected to the O Banion 230 kv Sub) generation, pre-contingency, upon the first part of this over-lapping outage occurring and therefore prevent loading the Hurley-Natomas 230 kv line above its emergency rating upon the next outage occurring. A Special Protection System to detect the overload along with the outages has been implemented to protect Westerns O Banion-Natomas 230-kV line in addition to or in place of the operating procedure. This over-lapping Category D outage is associated with TPL-004. Shown in Attachment 1 are Figures 6-2a & b. 76
79 D3. Keswick-Airport 230 kv Line with Overlapping Contingencies An outage of the Keswick-Airport line (line out for maintenance or forced out) overlapping with a combination of line outages associated with stuck breaker conditions at Keswick result in the emergency overloads, in some cases severe, of lines within the Redding operating area (see Attachment 1 Figure 6-3a). This condition is mitigated in real-time and day ahead studies which institute a reduction in Northern Central Valley Project generation output. When these conditions arise WASN coordinates with Redding to notify them of issues. This over-lapping Category D outage is associated with TPL-004. The power flow results are shown in Attachment 1, Figure 6-3a and b. The list of affected equipment is extensive. Table 5 contains the worst case equipment of concern and the contingency description. Table 5: Keswick - Airport 230-kV line Out of Service Equipment of Concern Normal Rating (%) Emergency Rating (%) Contingency Description Keswick - Olinda C8_Cottonwood-Shasta dlo Keswick - Olinda OBN_KESX_FAILOBN_1082 Keswick - Olinda OBN_ELV1X_FAILOBN_1086 Keswick - Olinda OBN_KESX_FAILOBN_1086 Shasta-Cottonwood# KE-OBN/KE-ODA DLO Shasta-Cottonwood# KE-OBN/KE-ODA DLO Mitigation for this outage is preformed during the daily or day ahead study process. Additionally, base case overloads do not represent generation redispatch allowed by WECC planning criteria that cause the overloads. Further analysis of the Shasta- Cottonwood double line outage utilizing Shasta generation only to mitigate the emergency loading of the Keswick-Olinda line. Shasta generation would need to be limited to 284 MW assuming full TRD output. Upon the loss of the Keswick-Airport line, this generation reduction would need to be put in place pre-contingency to mitigate for the next worst contingency. Attachment 1 Figure 6-3b shows loading on the Keswick Olinda line due to the Shasta Cottonwood #1 and #2 double line outage. Attachment 1Figure 6-3c shows loading on the Shasta Cottonwood #1 and #2 lines due to the Keswick-O Banion and Keswick-Olinda double line outages. D4. Airport - Cottonwood Overlapping with Shasta - Cottonwood An outage of the Airport-Cottonwood line (line out for maintenance or forced out) overlapping with a Shasta-Cottonwood #1 and #2 double line outage results exceeding the Keswick-Olinda emergency ratings by 161% and normal rating by 168% as shown in Attachment 1Figure 6-4a. An outage of the Airport-Cottonwood line overlapping with a Keswick-O Banion and Keswick-Olinda double line outage result in exceeding the emergency rating of the Shasta Cottonwood #1 and #2 lines by 137% as shown in Figure 6-4b. This condition is mitigated in real-time and day ahead studies which institute a reduction in Northern Central Valley Project generation output. This overlapping Category D outage is associated with TPL-004. The power flow results are shown in Attachment1, Figure 6-4a and 6-4b. The worst case equipment of concern and contingency description are listed in Table 6. Mitigation for this outage is preformed 77
80 during the daily or day ahead study process. Additionally, base case overloads do not represent generation re-dispatch allowed by WECC planning criteria that cause the overloads. Shasta generation maximum output would need to be limited to approximately 385 MW, assuming full TRD output to mitigate all line loading issues. Table 6: Airport-Cottonwood 230-kV line Out of Service Equipment of Concern Normal Rating (%) Emergency Rating (%) Contingency Description Keswick - Olinda C8_Cottonwood-Shasta dlo Shasta-Cottonwood# C8_KES-OBN/KES-ODA Shasta-Cottonwood# C8_KES-OBN/KES-ODA Keswick - Olinda B2_KESWICK - OBANION 230 kv #1 Keswick - Olinda OBN_KESX_FAILOBN_1082 D5. Cottonwood Roseville with Olinda Stuck PCB An outage of the Cottonwood-Roseville line (line out for maintenance or forced out) overlapping with an Olinda stuck Power Circuit Breaker (PCB) 282 associated with a line fault on either the Cottonwood-Olinda #1 or Keswick Olinda lines results in the emergency overload of the Cottonwood-Olinda #2 line, this condition results in exceeding the emergency rating of the Cottonwood-Olinda #2 line by 162% as shown in Figure 6-5a. This condition is mitigated in real-time and day ahead studies which institute a reduction in Northern Central Valley Project generation output. The table below shows several overlapping outage conditions associated with the Cottonwood- Roseville line being out of service. The resulting overloads are shown in Attachment 1 Figures 6-5a and 6-5b. This over-lapping Category D outage is associated with TPL Table 7 contains the worst case equipment of concern and the contingency description. Mitigation for this outage is preformed during the daily or day ahead study process. Additionally, base case overloads do not represent generation redispatch allowed by WECC planning criteria that cause the overloads. Shasta generation maximum output would need to be limited to approximately 648 MW, assuming full TRD output to mitigate line loading issues associated with WASN northern lines. Mitigation from Sacramento Valley LSE s would be required to mitigate line loading issues associated with the TRY-HUR #1 and #2 lines. Nomograms are developed and utilized during day ahead and real-time studies to ensure reliable operation of the TRY-HUR #1 and #2 lines. Table 7: Cottonwood-Roseville 230-kV line Out of Service Equipment of Concern Normal Rating (%) Emergency Rating (%) Contingency Description Cottonwood-Olinda# ODA1X_CW_FAILODA_282 Cottonwood-Olinda# ODAX_KES_FAILODA_282 Keswick - Olinda C8_Olinda-Cottonwood dlo D6. Keswick-O Banion 230 kv Line Overlapping with Shasta - Cottonwood An outage of the Keswick-O Banion line (line out for maintenance or forced out) 78
81 overlapping with a Shasta-Cottonwood #1 and #2 double line outage or multiple but individual stuck breaker conditions associated with various line faults in the Western System results in exceeding the emergency rating of the Keswick-Olinda and Cottonwood-Olinda #2 line. This condition is mitigated in real-time and day ahead studies which institute a reduction in Northern Central Valley Project generation output. This over-lapping Category D outage is associated with TPL-004. The power flow results are shown in Attachment 1, Figure 6-6a and b. Table 8 contains the worst case equipment of concern and the contingency description. Additionally, base case overloads do not represent generation redispatch allowed by WECC planning criteria that cause the overloads. Shasta generation maximum output would need to be limited to approximately 344 MW, assuming full TRD output to mitigate line loading issues associated with loading on the Keswick Olinda line. Table 8: Keswick-O Banion 230-kV line Out of Service Equipment of Concern Normal Rating (%) Emergency Rating (%) Contingency Description Keswick - Olinda C8_Cottonwood-Shasta dlo Airport - Cottonwood C8_Cottonwood-Shasta dlo Airport Keswick* C8_Cottonwood-Shasta dlo Keswick Olinda* C8_Cottonwood-Shasta dlo Airport Cottonwood* C8_Cottonwood-Shasta dlo Cottonwood-Olinda# ODA1X_CW_FAILODA_282 Cottonwood-Olinda# ODAX_KES_FAILODA_282 *In 2024 Heavy Summer D7. Keswick-Olinda 230 kv Line Overlapping with Shasta - Cottonwood An outage of the Keswick-Olinda line (line out for maintenance or forced out) overlapping with a Shasta-Cottonwood #1 and #2 double line outage or Olinda stuck Power Circuit Breaker (PCB) 282 condition results in the emergency overload of the Cottonwood-Airport, Shasta-Cottonwood #1 and #2 or Cottonwood-Olinda #1 and #2 lines. The overloaded line will depend on what the overlapping outage is. Table 9 provides contingency description and resulting overloads. For example, the Shasta- Cottonwood #1 and #2 will not overload if they are the overlapping outage, in this case the overlapping outage is the stuck breaker condition. This condition is mitigated in realtime and day ahead studies which institute a reduction in Northern Central Valley Project generation output. This over-lapping Category D outage is associated with TPL The power flow results are shown in Attachment 1, Figure 6-7a and 7b). Table 9 contains the worst case equipment of concern and the contingency description. Additionally, base case overloads do not represent generation redispatch allowed by WECC planning criteria that cause the overloads. Shasta generation maximum output would need to be limited to approximately 384 MW, assuming full TRD output to mitigate line loading issues associated with the Keswick-Airport and Airport-Cottonwood lines. 79
82 Table 9: Keswick-Olinda 230-kV line Out of Service Equipment of Concern Normal Emergency Contingency Description Rating (%) Rating (%) Airport-Cottonwood C8_Cottonwood-Shasta dlo Keswick-Airport C8_Cottonwood-Shasta dlo Shasta-Cottonwood # ODA1X_CW_FAILCW_332 Cottonwood-Olinda# ODA2X_CW_FAILCW_332 D8. Loss of Sutter Energy Center with Tracy Hurley #1 and #2 Outage With all lines in service and the loss of the Sutter Energy Center, a Tracy-Hurley #1 and #2 double line outage or a stuck breaker condition that would result in the Tracy-Hurley #1 and #2 double line outage, results in the exceeding the normal loading of the PG&E Tesla-Weber 230-kV line. The Emergency rating is exceeded in some study years, but not others. This condition is mitigated in real-time and day ahead studies in coordination with SMUD which institute generation re-dispatch in the SMUD area. This over-lapping Category D outage is associated with TPL-004. Attachment1, Figure 6-8a shows loading with normal ratings and Figure 6-8b loading with Emergency ratings. As can be seen, the normal rating is exceeded by 114% and emergency rating is not exceeded (97%) by year 2019hs. The Sutter Energy Center is scheduled to move from its present location in the future. If this move is to occur this outage would then be classified as a Category C, TPL-003 contingency. D9. Keswick-Flanagan Overlapping with Stuck Breaker Conditions An outage of the Keswick-Flanagan line overlapping with several different, but individual stuck break conditions, results in the emergency overload of several lines within the Redding 115-kV system, the Flanagan 230/115-kV transformers, Keswick-Knauf, Flanagan-Knauf and Flanagan-City of Shasta Lake 115-kV lines. The list of effected equipment is extensive and not shown here, however, an SPS is installed such that should the Keswick-Flanagan line trip, the Shasta-Flanagan line will be removed from service thereby protecting potentially affected equipment. Additionally, this condition is mitigated in real-time and day ahead studies which institute a reduction in Northern Central Valley Project generation output. This over-lapping Category D outage is associated with TPL-004. Post-transient and steady-state outage studies in this current WASN annual transmission assessment continue to show that maintaining reliable and sufficient import capability into the Sacramento Area is dependent on Sacramento Area load serving entities continuing effort to install reactive voltage support as their load grows. Studies show that there may be insufficient voltage support in the five and ten-year (2019 and 2024) power flow case for two Category D outages (either the Sutter Power Plant off line over-lapping with an outage either of the Tracy-Hurley 230 kv lines #1 & #2 or the Sutter Power Plant off line over-lapping with the Bellota-Rancho Seco #1 & #2 230 kv lines). These lines are used to import power into the Sacramento Area. These study results are consistent with the annual Sacramento Valley Study Group analysis which determines import capability limits into the Sacramento Area 80
83 This report will be sent to the California Independent System Operator, Pacific Gas & Electric Company, the City of Roseville, the Sacramento Municipal Utility District and Northern California Power Agency so that they can look into these potential reliability problems, help determine more specifically if it is a future reliability problem, when it would first occur and recommend how to mitigate it. Mitigation would be a coordinated effort with WASN. The estimated lead time to install reactive voltage support is 3-5 years, so future WASN annual transmission assessments will continue to track this. It should be noted that the Sutter Energy Center is scheduled to be moved in the future, in which case these outages could be classified as a within the NERC requirements of category C in lieu of Category D. No cascading operating conditions associated with Category D contingencies were found and any loss of load is limited to the local area. WASN will study and analyze the merit of any required new operating procedures or other feasible mitigation plans during the coming year. The potential reliability problems associated with Category D (TPL - 004) extreme contingency events have not been seen historically, but WASN will continue to assess the need and viability for implementing operating procedures or other mitigation measures. As verification, the projected state of WASN s transmission system related to TPL-004 is shown by power flow, post-transient and dynamic stability plots included in Attachment 1 of this report. The contingency analysis plots contained in these attachments is a sampling of the contingency studies conducted, but cover critical points within the WASN transmission system such that it can be expected that other contingencies at other points would produce similar results. The post-transient plot in Attachment 1 shows available MVAr margin with load increased by 2.5% per WECC reactive margin requirements. The VAR Margin plots in Attachment 1, Figures 6-10a, 6-10b and 6-10c) shows VAR margin during the Keswick-Olinda, Keswick-O Banion and Keswick-Airport 230 kv lines at the Keswick substation outage. The study results demonstrate that no dynamic stability problems were discovered and that simulations were damped. In some stability plots, it can be seen where some generator units appear to become un-synchronized, this is due to the generator units being dropped as part of the switching scheme. Attachment 1, Figures 6-11a, 6-11b, 6-11c is a demonstration of stability analysis associated with the Keswick-Olinda, Keswick-O Banion and Keswick-Airport 230 kv lines at the Keswick substation, indicating stable system performance. This steady-state thermal and voltage analysis was conducted on the 10 years of power flow cases listed in Table 2. Post-transient and stability analysis was conducted on the 5 year (2019) and 10 year (2024) base cases. They demonstrate compliance with NERC Planning Standard TPL over a 10 year future period. Plots for other Category D outages investigated are available upon request. 81
84 PROPOSED AND PLANNED TRANSMISSION PROJECTS 1. Communication Aided High Speed Protection Operating studies show that when a transmission line is placed on the bypass breaker, to perform circuit breaker maintenance, the clearing time associated with the bypass breaker is longer than when the line is used with its dedicated circuit breaker. The longer clearing times are due to the fact that there is no communications associated with the relays associated with the transfer breaker. Additionally, because lines of different length and protection coordination can be used on the transfer breaker, zone clearing times are used for primary protection when a line is placed on the transfer bus. Western currently employs a main and transfer breaker scheme at the Keswick, Elverta, Folsom and Judge Francis Carr substations. Mitigation for this issue is provided for by operations and real-time studies when lines are placed on the transfer bus. Operations time-frame studies are performed to determine needed clearing times or generation level for safe operation in accordance with NERC and WECC operating criteria. A project to install protection equipment that will accommodate high speed clearing is currently being pursued, however implementation dates have not been determined. 2. Keswick Olinda Disconnect Switch Further research will be conducted to determine if the outages associated with exceeding the emergency ratings of the Keswick-Olinda line can be mitigated by replacing a disconnect switch on the Keswick-Olinda line located in the Keswick substation. The limiting element on this line is shown to be a disconnect switch. Further research will be performed to determine if the replacement of the disconnect switch or other limiting equipment (if any) will mitigate the loading issue on the Keswick- Olinda line. 3. Keswick Airport Cottonwood Re-conductor Re-conductor the Keswick-Airport and Airport-Cottonwood to mitigate for the credible Keswick-O Banion and Keswick-Olinda double line outage as well as various stuck breaker scenarios associated with the loading of the Keswick-Airport and Airport- Cottonwood 230-kV lines. 4. Cottonwood-Olinda #1 and #2 Re-conductor Re-conductor the Cottonwood-Olinda #1 and #2 lines to mitigate for the Overlapping Cottonwood-Olinda 230-kV and Captain Jack Olinda 500-kV line outages as well as various stuck breaker scenarios associated with the loading of the Cottonwood-Olinda 230-kV lines 82
85 5. Tracy 230 kv High Voltage Mitigation Installation of shunt reactors to mitigate high voltage in the northern part of the Western system is being proposed. Although not studied in this assessment, operations during off-peak times has experienced voltages above 235-kV in the Western has operating procedures in place for the mitigation of high voltage, however, the installation of shunt reactors is being proposed as a more effective long-term remedy. 6. Tracy 500 kv High Voltage Mitigation Under light loading conditions in the area within CAISO operation encompassing PG&E, SUD, BPA, and, WAPA, the 550 kv bus at Tracy is subjected to high voltage levels in excess of 550 kv. This condition has been observed for a period of time and studied extensively in our daily operational studies as well as in this assessment. Western in has operating procedures in place for the mitigation of this high voltage condition, however, the installation of shunt reactors is being proposed as a more effective longterm remedy. 83

86 DIAGRAM OF THE WESTERN AREA POWER ADMINISTRATION SIERRA NEVADA REGION TRANSMISSION SYSTEM 84
Western Area Power Administration Sierra Nevada Region
 Western Area Power Administration Sierra Nevada Region 2013 Annual Ten-Year Transmission Plan Assessment Report December 1, 2013 For information or questions regarding this Transmission Assessment Report,
SMUD 2014 Ten-Year Transmission Assessment Plan. Final. December 18, 2014
 SMUD 2014 Ten-Year Transmission Assessment Plan Final December 18, 2014 I CONTENTS Executive Summary... III 1 Introduction... 2 1.1 Reliability Criteria and Guidelines... 2 1.2 Load Forecast... 2 1.3 Demand
Transmission Competitive Solicitation Questions Log Question / Answer Matrix Harry Allen to Eldorado 2015
 No. Comment Submitted ISO Response Date Q&A Posted 1 Will the ISO consider proposals that are not within the impedance range specified? Yes. However, the benefits estimated and studies performed by the
Interconnection System Impact Study Report Request # GI
 Executive Summary Interconnection System Impact Study Report Request # GI-2008-23 34 MW Solar Generation Ranch at Hartsel, Colorado Public Service Company of Colorado Transmission Planning August 19, 2010
PID 274 Feasibility Study Report 13.7 MW Distribution Inter-Connection Buras Substation
 PID 274 Feasibility Study Report 13.7 MW Distribution Inter-Connection Buras Substation Prepared by: Entergy Services, Inc. T & D Planning L-ENT-17A 639 Loyola Avenue New Orleans, LA 70113 Rev Issue Date
AMERICAN ELECTRIC POWER 2017 FILING FERC FORM 715 ANNUAL TRANSMISSION PLANNING AND EVALUATION REPORT PART 4 TRANSMISSION PLANNING RELIABILITY CRITERIA
 AMERICAN ELECTRIC POWER 2017 FILING FERC FORM 715 ANNUAL TRANSMISSION PLANNING AND EVALUATION REPORT PART 4 TRANSMISSION PLANNING RELIABILITY CRITERIA AEP Texas (comprised of its Central and North Divisions
TRANSMISSION PLANNING CRITERIA
 CONSOLIDATED EDISON COMPANY OF NEW YORK, INC. 4 IRVING PLACE NEW YORK, NY 10003-3502 Effective Date: TRANSMISSION PLANNING CRITERIA PURPOSE This specification describes Con Edison s Criteria for assessing
DUKE ENERGY PROGRESS TRANSMISSION SYSTEM PLANNING SUMMARY
 DUKE ENERGY PROGRESS TRANSMISSION SYSTEM PLANNING SUMMARY Transmission Department Transmission Planning Duke Energy Progress TABLE OF CONTENTS I. SCOPE 3 II. TRANSMISSION PLANNING OBJECTIVES 3 III. TRANSMISSION
System Impact Study Report
 Report For: NTE Carolinas II, LLC ( Customer ) Queue #: 42432-01 Service Location: Rockingham County, NC Total Output: 477 MW (summer) / 540 MW (winter) Commercial Operation Date: 12/1/2020 42432-01 SIS
100 MW Wind Generation Project
 A subsidiary of Pinnacle West Capital Corporation 100 MW Wind Generation Project CUSTOMER FINAL Feasibility Study Results By Transmission Planning, APS December 21, 2007 Executive Summary This Feasibility
SPS Planning Criteria and Study Methodology
 SPS Planning Criteria and Study Methodology SPS subscribes to the Southwest Power Pool ("SPP") Reliability Criteria, which incorporates compliance with the appropriate North American Electric Reliability
THE NECESSITY OF THE 500 KV SYSTEM IN NWE S TRANSMISSION SYSTEM TO MAINTAIN RELIABLE SERVICE TO MONTANA CUSTOMERS
 THE NECESSITY OF THE 500 KV SYSTEM IN NWE S TRANSMISSION SYSTEM TO MAINTAIN RELIABLE SERVICE TO MONTANA CUSTOMERS 2/27/2018 ELECTRIC TRANSMISSION PLANNING Table of Contents Table of Contents... 2 Executive
Gateway South Transmission Project
 Phase 1 Comprehensive Progress Report Volume 1 - Technical Report Report Prepared by PacifiCorp Transmission Planning Department November 21, 2008 WECC1-V4 Phase 1 Comprehensive Progress Report Executive
City of Palo Alto (ID # 6416) City Council Staff Report
 City Council Staff Report") City of Palo Alto (ID # 6416) City Council Staff Report Report Type: Informational Report Meeting Date: 1/25/2016 Summary Title: Update on Second Transmission Line Title: Update on Progress Towards Building
City of Palo Alto (ID # 6416) City Council Staff Report Report Type: Informational Report Meeting Date: 1/25/2016 Summary Title: Update on Second Transmission Line Title: Update on Progress Towards Building
Decision on Merced Irrigation District Transition Agreement
 California Independent System Operator Corporation Memorandum To: ISO Board of Governors From: Karen Edson, Vice President Policy & Client Services Date: March 13, 2013 Re: Decision on Merced Irrigation
EL PASO ELECTRIC COMPANY (EPE) FACILITIES STUDY FOR PROPOSED HVDC TERMINAL INTERCONNECTION AT NEW ARTESIA 345 KV BUS
 FACILITIES STUDY FOR PROPOSED HVDC TERMINAL INTERCONNECTION AT NEW ARTESIA 345 KV BUS") EL PASO ELECTRIC COMPANY (EPE) FACILITIES STUDY FOR PROPOSED HVDC TERMINAL INTERCONNECTION AT NEW ARTESIA 345 KV BUS El Paso Electric Company System Operations Department System Planning Section May 2004
EL PASO ELECTRIC COMPANY (EPE) FACILITIES STUDY FOR PROPOSED HVDC TERMINAL INTERCONNECTION AT NEW ARTESIA 345 KV BUS El Paso Electric Company System Operations Department System Planning Section May 2004
15 Nelson-Marlborough Regional Plan
 15 Nelson-Marlborough Regional Plan 15.1 Regional overview 15.2 Nelson-Marlborough transmission system 15.3 Nelson-Marlborough demand 15.4 Nelson-Marlborough generation 15.5 Nelson-Marlborough significant
Midway/Monument Area TTC Study
 Midway/Monument Area TTC Study (includes the following lines: Midway Geesen 115 kv, Geesen Falcon 115 kv, Falcon Fuller 115 kv, Fuller Black Squirrel 115 kv, and Black Squirrel Monument 115 kv) Johnny
TOLTEC POWER PARTNERSHIP TOLTEC POWER PROJECT INTERCONNECTION STUDY SYSTEM IMPACT STUDY
 TOLTEC POWER PARTNERSHIP TOLTEC POWER PROJECT INTERCONNECTION STUDY SYSTEM IMPACT STUDY January 7, 2002 Prepared by Jorge Chacon (Consultant) Tucson Electric Power Company Ed Beck ii EXECUTIVE SUMMARY
APPENDIX F: Project Need and Description
 APPENDIX F: Project Need and Description California ISO/MID F-1 Intentionally left blank California ISO/MID F-2 Name Brief Description Type Lugo Victorville 500 kv Upgrade (SCE portion) The project was
Updated Transmission Expansion Plan for the Puget Sound Area to Support Winter South-to-North Transfers
 Updated Transmission Expansion Plan for the Puget Sound Area to Support Winter South-to-North Transfers Puget Sound Area Study Team Bonneville Power Administration, Puget Sound Energy, Seattle City Light,
Supplemental Report on the NCTPC Collaborative Transmission Plan
 Supplemental Report on the NCTPC 2007-2017 Collaborative Transmission Plan May 16, 2008 1 Table of Contents I. Executive Summary...1 II. Richmond-Fort Bragg Woodruff Street 230 kv Line...2 II.A. Need for
Stability Study for the Mt. Olive Hartburg 500 kv Line
 Stability Study for the Mt. Olive Hartburg 500 kv Line Peng Yu Sharma Kolluri Transmission & Distribution Planning Group Energy Delivery Organization Entergy Sevices Inc April, 2011 New Orleans, LA 1.
Transmission Planning & Engineering P.O. Box MS 3259 Phoenix, Arizona
 Transmission Planning & Engineering P.O. Box 53933 MS 3259 Phoenix, Arizona 85072-3933 March 9, 2016 Mr. Philip Augustin Chair, WECC Technical Studies Subcommittee Mr. Enoch Davies WECC Technical Staff
Interconnection Feasibility Study Report GIP-226-FEAS-R3
 Interconnection Feasibility Study Report GIP-226-FEAS-R3 System Interconnection Request #226 70 MW Wind Generating Facility Kings County (L-6013) 2010 07 21 Control Centre Operations Nova Scotia Power
PUD ELECTRIC SYSTEM INTERCONNECTION
 APPENDIX A PROCEDURES & REQUIREMENTS for OKANOGAN PUD ELECTRIC SYSTEM INTERCONNECTION Version 4.0 December 2011 Version 4.0 12/28/2011 Page 1 of 15 TABLE OF CONTENTS DEFINITIONS 1.0 Introduction 2.0 Procedures
Generator Interconnection Facilities Study For SCE&G Two Combustion Turbine Generators at Hagood
 Generator Interconnection Facilities Study For SCE&G Two Combustion Turbine Generators at Hagood Prepared for: SCE&G Fossil/Hydro June 30, 2008 Prepared by: SCE&G Transmission Planning Table of Contents
Consulting Agreement Study. Completed for Transmission Customer
 Completed for Transmission Customer Proposed Resource & Transmission Carbon County, MT & 230 kv Transmission in North Wyoming August 2016 Table of Contents 1.0 Description... 1 2.0 Overall Assumptions...
Merger of the generator interconnection processes of Valley Electric and the ISO;
 California Independent System Operator Corporation Memorandum To: ISO Board of Governors From: Karen Edson Vice President, Policy & Client Services Date: August 18, 2011 Re: Decision on Valley Electric
Elbert County 500 MW Generation Addition Interconnection Feasibility Study Report OASIS POSTING # GI
 Executive Summary Elbert County 500 MW Generation Addition Interconnection Feasibility Study Report OASIS POSTING # GI-2003-2 Xcel Energy Transmission Planning January 2004 This Interconnection Feasibility
Project #148. Generation Interconnection System Impact Study Report
 Project #148 Generation Interconnection System Impact Study Report June 05, 2012 Electric Transmission Planning Table of Contents Table of Contents... 2 Executive Summary... 3 Energy Resource Interconnection
TransWest Express Project
 TransWest Express Project Phase One--Feasibility Study Final Study Report November 2006 A subsidiary of Pinnacle West Capital Corporation Executive Summary On October 21, 2005 Arizona Public Service Company
Transmission Coordination and Planning Committee 2014 Q4 Stakeholder Meeting. December 18, 2014
 Transmission Coordination and Planning Committee 2014 Q4 Stakeholder Meeting December 18, 2014 Agenda 1. Introductions 2. TCPC Policies 3. BHCE Planning Department Update 4. 2014 LTP Study Results 5. Stakeholder
REDACTED. Eastside Needs Assessment Report Transmission System King County. Redacted Draft. October 2013 Puget Sound Energy
 Eastside Needs Assessment Report Transmission System King County Redacted Draft October 2013 Puget Sound Energy Report prepared by: Thomas J. Gentile, P.E. Quanta Technology Donald J. Morrow, P.E. Quanta
PSE Attachment K Puget Sound Area Transmission Meeting
 PSE Attachment K Puget Sound Area Transmission Meeting Stephanie Lu Senior Engineer December 15, 2011 Agenda Attachment K Review Economic Studies Process PSE Planning Process and Assumptions PSE Projects
Interconnection Feasibility Study Report Request # GI Draft Report 600 MW Wind Generating Facility Missile Site 230 kv Substation, Colorado
 Executive Summary Interconnection Feasibility Study Report Request # GI-2016-6 Draft Report 600 MW Wind Generating Facility Missile Site 230 kv Substation, Colorado Public Service Company of Colorado Transmission
GENERAL DIRECTION SOUGHT AND SPECIFIC QUESTIONS TO BE ANSWERED
 DATE: June 28, 2011 STAFF: Brian Janonis Brian Moeck, PRPA Pre-taped staff presentation: none WORK SESSION ITEM FORT COLLINS CITY COUNCIL SUBJECT FOR DISCUSSION Electric Transmission Update. EXECUTIVE
Guideline for Parallel Grid Exit Point Connection 28/10/2010
 Guideline for Parallel Grid Exit Point Connection 28/10/2010 Guideline for Parallel Grid Exit Point Connection Page 2 of 11 TABLE OF CONTENTS 1 PURPOSE... 3 1.1 Pupose of the document... 3 2 BACKGROUND
Emera Maine Representative: Jeffrey Fenn, P.E., SGC Engineering LLC
 OCTOBER 22, 2015 Emera Maine s Local System Plan Bangor Hydro District Needs Assessment/Potential Solutions Local Planning Advisory Committee Meeting Emera Maine Representative: Jeffrey Fenn, P.E., SGC
El PASO ELECTRIC COMPANY 2014 BULK ELECTRIC SYSTEM TRANSMISSION ASSESSMENT FOR YEARS
 El Paso Electric Company El PASO ELECTRIC COMPANY 2014 BULK ELECTRIC SYSTEM TRANSMISSION ASSESSMENT FOR YEARS 2015 2024 A Review on System Performance Following Extreme Bulk Electric System Events of the
Transmission Coordination and Planning Committee 2016 Q4 Stakeholder Meeting
 Transmission Coordination and Planning Committee 2016 Q4 Stakeholder Meeting BHE Wyoming Q4 Stakeholder Meeting November 17, 2016 @ 1:00PM MT Black Hills Energy Service Center 409 Deadwood Avenue, Rapid
Memorandum. This memorandum requires Board action. EXECUTIVE SUMMARY
 California Independent System Operator Memorandum To: ISO Operations (MRTU) Committee From: Armando J. Perez, Director of Grid Planning cc: ISO Board of Governors ISO Officers Date: April 29, 2005 Re:
Feasibility Study Report
 Generator Interconnection Request Feasibility Study Report For: Customer --- Service Location: Rutherford County Total Output: 79.2 MW Commercial Operation Date: 9/1/2014 In-Service Date (if given): 9/1/2014
DFO STATEMENT OF NEED REPORT
 APPENDIX E DFO STATEMENT OF NEED REPORT Table of Contents 1.0 Executive Summary... 1 2.0 Description of the Area... 2 2.1 Geographic Study Area... 2 2.2 2016 System Configuration... 2 3.0 Area Loading
Emera Maine Representative: Jeffrey Fenn, P.E., SGC Engineering LLC
 OCTOBER 22, 2014 Emera Maine s Local System Plan Bangor Hydro District Needs Assessment/Potential Solutions Local Planning Advisory Committee Meeting E M i R t ti Emera Maine Representative: Jeffrey Fenn,
BEFORE THE PUBLIC UTILITIES COMMISSION OF THE STATE OF CALIFORNIA PACIFICORP. Direct Testimony of Richard A. Vail
 Application No. -0- Exhibit PAC/00 Witness: Richard A. Vail BEFORE THE PUBLIC UTILITIES COMMISSION OF THE STATE OF CALIFORNIA PACIFICORP Investment in Distribution and Transmission Systems April 0 PAC/00
Service Requested 150 MW, Firm. Table ES.1: Summary Details for TSR #
 Executive Summary Firm point to point transmission service has been requested by Transmission Service Request (TSR) #75669514, under the SaskPower Open Access Transmission Tariff (OATT). The TSR consists
Pacific Gas and Electric Company s Revised 2015 Annual Progress
 March 02, 2015 Mr. Tracy Rolstad Chair, WECC Technical Studies Subcommittee Avista PO Box 3727 MSC-16 1411 East Mission Ave Spokane, WA 99220-3727 Mr. Enoch Davies WECC Technical Staff 155 North 400 West
Generator Interconnection System Impact Study For
 Generator Interconnection System Impact Study For Prepared for: January 15, 2015 Prepared by: SCE&G Transmission Planning Table of Contents General Discussion... Page 3 I. Generator Interconnection Specifications...
15 Nelson-Marlborough Regional Plan
 15 Nelson-Marlborough Regional Plan 15.1 Regional overview 15.2 Nelson-Marlborough transmission system 15.3 Nelson-Marlborough demand 15.4 Nelson-Marlborough generation 15.5 Nelson-Marlborough significant
Interconnection Feasibility Study Report GIP-222-FEAS-R3
 Interconnection Feasibility Study Report GIP-222-FEAS-R3 System Interconnection Request #222 48 MW Steam Generating Facility Pictou County (53N) 2010 07 30 Control Centre Operations Nova Scotia Power Inc.
Pacific Gas and Electric Company s 2013 Annual Progress Report
 March 14, 2013 Mr. David Franklin Chair, WECC Technical Studies Subcommittee Southern California Edison 1 Innovation Way Pomona, CA 91768 Mr. Enoch Davies WECC Technical Staff 155 North 400 West Salt Lake
Pacific Gas and Electric Company s Revised 2016 Annual Progress
 March 06, 2016 Mr. Philip Augustin Chair, WECC Technical Studies Subcommittee Mr. Enoch Davies WECC Technical Staff 155 North 400 West Salt Lake City, UT 84103-1114 Subject: Report Pacific Gas and Electric
March 18, Subject: Imperial Irrigation District 2014 Annual Progress Report - Rev 1
 Energy Division P.O. Box 937 333 E. Barioni Blvd. Imperial, CA 92251 www.iid.com March 18, 2014 Mr. Tracy Rolstad Chair, WECC Technical Studies Subcommittee Senior Power System Consultant Avista System
Georgia Transmission Corporation Georgia Systems Operations Corporation
 Georgia Transmission Corporation Georgia Systems Operations Corporation Reactive Power Requirements for Generating Facilities Interconnecting to the Georgia Integrated Transmission System with Georgia
North Oregon Coast Area Study. Adam Lint
 North Oregon Coast Area Study Adam Lint PAGE 2 North Oregon Coast System Overview - Clatsop Study Covers: Transmission Switching Stations (Clatsop District): Astoria Lewis and Clark 115 kv Distribution
WECC Regional Planning Review. Canada/Pacific Northwest Northern California Transmission Line Project. Technical Analysis Committee Report
 WECC Regional Planning Review Canada/Pacific Northwest Northern California Transmission Line Project Technical Analysis Committee Report November 1, 2007 Table of Content Summary...1 SECTION 1 SECTION
PJM Generator Interconnection Request Queue #R60 Robison Park-Convoy 345kV Impact Study September 2008
 PJM enerator Interconnection Request Queue #R60 Robison Park-Convoy 345kV Impact Study 504744 September 2008 PJM Interconnection 2008. All rights reserved R60 Robison Park-Convoy 345kV Impact Study eneral
Falcon-Midway 115 kv Line Uprate Project Report
 Falcon-Midway 115 kv Line Uprate Project Report 12/1/2008 1 Background The function of this project is to uprate the 26.7 miles of Tri-State s 115 kv line between Midway and Falcon substations from 50
Evaluation of the Performance of Back-to-Back HVDC Converter and Variable Frequency Transformer for Power Flow Control in a Weak Interconnection
 Evaluation of the Performance of Back-to-Back HVDC Converter and Variable Frequency Transformer for Power Flow Control in a Weak Interconnection B. Bagen, D. Jacobson, G. Lane and H. M. Turanli Manitoba
SERTP rd Quarter Meeting
 2015 SERTP SERTP 2015 3 rd Quarter Meeting 2nd RPSG Meeting September 24 th, 2015 APC Headquarters Birmingham, AL 2015 SERTP Process Information The SERTP process is a transmission planning process. Please
Final Draft Report. Assessment Summary. Hydro One Networks Inc. Longlac TS: Refurbish 115/44 kv, 25/33/ General Description
 Final Draft Report Assessment Summary Hydro One Networks Inc. : Refurbish 115/44 kv, 25/33/42 MVA DESN Station CAA ID Number: 2007-EX360 1.0 General Description Hydro One is proposing to replace the existing
Southern California Edison Rule 21 Storage Charging Interconnection Load Process Guide. Version 1.1
 Southern California Edison Rule 21 Storage Charging Interconnection Load Process Guide Version 1.1 October 21, 2016 1 Table of Contents: A. Application Processing Pages 3-4 B. Operational Modes Associated
Connection Engineering Study Report for AUC Application: AESO Project # 1674
 APPENDIX A CONNECTION ASSESSMENT Connection Engineering Study Report for AUC Application: AESO Project # 1674 Executive Summary Project Overview FortisAlberta Inc. (FortisAlberta) submitted a System
Project #94. Generation Interconnection System Impact Study Report Revision
 Project #94 Generation Interconnection System Impact Study Report Revision October 2, 2009 Electric Transmission Planning Table of Contents Table of Contents...2 Executive Summary...3 Energy Resource Interconnection
Pacific Northwest/Canada To Northern California Transmission Feasibility Study
 Pacific Nthwest/Canada To Nthern Califnia Transmission Feasibility Study Technical Analysis Committee Presentation By Ben Mris, PG&E 1 December 12, 2006 Topics Study Objectives Alternatives Considered
Wheeler Ridge Junction Substation Project Description and Functional Specifications for Competitive Solicitation
 Wheeler Ridge Junction Substation Project Description and Functional Specifications for Competitive Solicitation 1. Description In the 2013-2014 Transmission Planning Cycle, the ISO approved the construction
OCTOBER 17, Emera Maine Representative: Jeffrey Fenn, P.E., LR/SGC Engineering LLC
 OCTOBER 17, 2018 Emera Maine s Local System Plan Bangor Hydro District Needs Assessment/Potential Solutions Local Planning Advisory Committee Meeting Emera Maine Representative: Jeffrey Fenn, P.E., LR/SGC
TEN YEAR PLANNING GUIDE SHASTA LAKE ELECTRIC UTILITY
 TEN YEAR PLANNING GUIDE SHASTA LAKE ELECTRIC UTILITY 2011-2020 P+ PowerPlus Engineering A Department of STAR Energy Services, LLC TEN YEAR PLANNING GUIDE 2011-2020 SHASTA LAKE ELECTRIC UTILITY CITY OF
APPENDIX I: Description and Functional Specifications for Transmission Facilities Eligible for Competitive Solicitation
 APPENDIX I: Description and Functional Specifications for Transmission Facilities Eligible for Competitive Solicitation Intentionally left blank F1 Description and Functional Specifications of Proposed
SERTP rd Quarter Meeting
 2014 SERTP SERTP 2014 3 rd Quarter Meeting 2 nd RPSG Meeting September 30 th, 2014 APC Headquarters Birmingham, AL 2014 SERTP Process Information The SERTP process is a transmission planning process. Please
Interconnection Feasibility Study Report GIP-084-FEAS-R2
 Interconnection Feasibility Study Report GIP-084-FEAS-R2 System Interconnection Request #84 50 MW Wind Generating Facility Pictou County (L-7004) August 17, 2007 Control Centre Operations Nova Scotia Power
MILLIGAN SOLAR PROJECT
 February 16, 2009 Page 1 of 18 A subsidiary of Pinnacle West Capital Corporation MILLIGAN SOLAR PROJECT FINAL Feasibility Study Report APS Contract 52115 Prepared by: Arizona Public Service Company Transmission
CONNECTION ASSESSMENT & APPROVAL PROCESS. Cardinal Substation Modification of 115kV Substation
 CONNECTION ASSESSMENT & APPROVAL PROCESS ASSESSMENT SUMMARY Applicant: Project: Cardinal Substation Modification of 115kV Substation CAA ID: 2002 EX071 Long Term Forecasts & Assessments Department\ Consistent
Impact of Distributed Energy Resources on Transmission System Reliability
 S E P T E M B E R 1 3, 2 0 1 8 W E B I N A R Impact of Distributed Energy Resources on Transmission System Reliability National Council on Electricity Policy (NCEP) Alan McBride D I R E C T O R, T R A
Managing California s Electrical Supply System after the shut down of San Onofre Nuclear Generating Station
 Managing California s Electrical Supply System after the shut down of San Onofre Nuclear Generating Station East Asian Alternative Energy Futures Workshop By the Nonproliferation Policy Education Center
California s RPS Program: Progress Towards California s 33% RPS Goal and the Role of Concentrating Solar Power CSP Conference
 California s RPS Program: Progress Towards California s 33% RPS Goal and the Role of Concentrating Solar Power CSP Conference Presented by Edward Randolph Energy Division Director, California Public Utilities
The Long-Range Transmission Plan
 The Long-Range Transmission Plan 2015 2025 Matt Koenig Presentation to ESPWG / TPAS October 29 th, 2015 Long-Range Transmission Plan Driver of the Plan is to maintain local reliability 10-year planning
RULE 21 GENERATING FACILITY INTERCONNECTION APPLICATION SMUD s Distribution System - (SMUD FORM 2655)
") - (SMUD FORM 2655) A. Applicability: This Generating Facility Interconnection Application (Application) shall be used to request the interconnection of a Generating Facility to Sacramento Municipal Utility
- (SMUD FORM 2655) A. Applicability: This Generating Facility Interconnection Application (Application) shall be used to request the interconnection of a Generating Facility to Sacramento Municipal Utility
SYSTEM IMPACT STUDY EC300W ERIS FINAL REPORT. El Paso Electric Company
 SYSTEM IMPACT STUDY EC300W ERIS FINAL REPORT Prepared for: El Paso Electric Company Prepared by: Engineers, LLC 1526 Cole Boulevard Building 3, Suite 150 Lakewood, CO 80401 (303) 395-4018 FOREWORD This
ERCOT Overview. Paul Wattles Senior Analyst, Market Design & Development. Solar Energy Industries Association July 11, 2012
 ERCOT Overview Paul Wattles Senior Analyst, Market Design & Development Solar Energy Industries Association History of Electric Reliability Council of Texas, Inc. 1941 Utilities band together to aid war
A member-consumer with a QF facility shall not participate in the Cooperative s electric heat rate program.
 Electric Tariff _2nd Revised Sheet No. 72 Filed with Iowa Utilities Board Cancels _1st Sheet No. _72 Cooperative is a member of Central Iowa Power Cooperative (CIPCO), a generation and transmission cooperative
Local Transmission Plan. October 11, 2013 Revised August 25, 2014
 Local Transmission Plan October 11, 2013 Revised August 25, 2014 2 Central Hudson s System Zone G: Majority of Central Hudson s load Zone E: One small distribution substation Interconnections with Consolidated
CUSTOMER/ TWIN ARROWS PROJECT
 A subsidiary of Pinnacle West Capital Corporation CUSTOMER/ TWIN ARROWS PROJECT V1 Facility Study Report APS Contract 52149 Prepared by: Arizona Public Service Company Transmission & Distribution Asset
ATTACHMENT Y STUDY REPORT
 Attachment Y Study Edwards Unit 1: 90 MW Coal Retirement December 31, 2012 ATTACHMENT Y STUDY REPORT 7/5/2013 PUBLIC / EXECUTIVE SUMMARY MISO received an Attachment Y Notification of Potential Generation
Feasibility Study. Customer Kingman Area Photovoltaic Generation Project Interconnection
 Feasibility Study Customer Kingman Area Photovoltaic Generation Project Interconnection October, 2009 October 2009 i EXECUTIVE SUMMARY CONCLUSION Customer has requested network resource interconnection
Dunvegan Hydroelectric Project. For Glacier Power Limited. Preliminary Interconnection Study
 ` Dunvegan Hydroelectric Project For Glacier Power Limited Preliminary Interconnection Study Prepared by Pung Toy, P. Eng. and Ata Rehman, P. Eng. September 24, 2004 Table of Contents Table of Contents...
INTERCONNECTION STANDARDS FOR CUSTOMER-OWNED GENERATING FACILITIES 25 kw OR LESS PUBLIC UTILITY DISTRICT NO. 1 OF CHELAN COUNTY
 INTERCONNECTION STANDARDS FOR CUSTOMER-OWNED GENERATING FACILITIES 25 kw OR LESS PUBLIC UTILITY DISTRICT NO. 1 OF CHELAN COUNTY Table of Contents Chapter 1. Purpose and scope. Pg 3 Chapter 2. Application
2012 LOCAL TRANSMISSION PLAN:
 Colorado PUC E-Filings System 2012 LOCAL TRANSMISSION PLAN: TRANSMISSION COORDINATION AND PLANNING COMMITTEE ANNUAL TRANSMISSION ASSESSMENT FOR BLACK HILLS/COLORADO ELECTRIC UTILITY COMPANY, L.P., D/B/A
APPENDIX E: Project Need and Description
 APPENDIX E: Project Need and California ISO/MID E-1 Intentionally left blank California ISO/MID E-2 Lakeville 115 kv Bus Upgrade Installation of a sectionalizing breaker to be installed on 115 kv bus section
Electric Generation Workpapers Jeff Huang SDG&E/SoCalGas 2013 TCAP
 Electric Generation Workpapers Jeff Huang SDG&E/SoCalGas 2013 TCAP The electric generation forecast is based on an analysis of the plant s operation in the western electric market using the Market Analytics
ATCO ELECTRIC LTD. (Transmission System) SERVICE QUALITY AND RELIABILITY PERFORMANCE, MEASURES AND INDICES Revision 0
 SERVICE QUALITY AND RELIABILITY PERFORMANCE, MEASURES AND INDICES Revision 0") ATCO ELECTRIC LTD. (Transmission System) SERVICE QUALITY AND RELIABILITY PERFORMANCE, MEASURES AND INDICES 2018-04-24 - Revision 0 EUB Decision 2007-071 Board Direction 52 For questions or comments regarding
ATCO ELECTRIC LTD. (Transmission System) SERVICE QUALITY AND RELIABILITY PERFORMANCE, MEASURES AND INDICES 2018-04-24 - Revision 0 EUB Decision 2007-071 Board Direction 52 For questions or comments regarding
Caution and Disclaimer The contents of these materials are for information purposes and are provided as is without representation or warranty of any
 Draft Version 1 Caution and Disclaimer The contents of these materials are for information purposes and are provided as is without representation or warranty of any kind, including without limitation,
POWER SYSTEM OPERATION AND CONTROL YAHIA BAGHZOUZ UNIVERSITY OF NEVADA, LAS VEGAS
 POWER SYSTEM OPERATION AND CONTROL YAHIA BAGHZOUZ UNIVERSITY OF NEVADA, LAS VEGAS OVERVIEW Interconnected systems Generator scheduling/dispatching Load-generation balancing Area Control Error (ACE) Load
Black Hills Project Summary
 2016 Rule 3627 Report Black Hills Project Summary Page 1 of 38 Black Hills Project Summary Colorado PUC E-Filings System D 1 2016 Rule 3627 Report Black Hills Project Summary Page 2 of 38 Category Transmission
Interconnection Feasibility Study Report GIP-157-FEAS-R2
 Interconnection Feasibility Study Report GIP-157-FEAS-R2 System Interconnection Request #157 100.5 MW Wind Generating Facility Guysborough County (L-6515) 2009 09 14 Control Centre Operations Nova Scotia
Western NY Public Policy Transmission Planning Report
 Western NY Public Policy Transmission Planning Report Dawei Fan Supervisor, Public Policy and Interregional Planning Business Issues Committee September 12, 2017 Operating Committee September 15, 2017
Alberta Electric System Operator Needs Identification Document Application. Mowat 2033S Substation
 Decision 21781-D01-2016 Alberta Electric System Operator Needs Identification Document Application Facility Applications September 7, 2016 Alberta Utilities Commission Decision 21781-D01-2016: Alberta
VACAR STABILITY STUDY OF PROJECTED 2014/2015 WINTER PEAK LOAD CONDITIONS
 VACAR STABILITY STUDY OF PROJECTED 2014/2015 WINTER PEAK LOAD CONDITIONS April 2009 Prepared by VACAR Stability Working Group: Kirit Doshi Anthony Williams John O Connor Joe Hood Art Brown Dominion Virginia
Generation Interconnection Feasibility Study For XXXXXXXXXXXXXXXXXXXXXX MW generator at new Western Refinary Substation
 Generation Interconnection Feasibility Study For XXXXXXXXXXXXXXXXXXXXXX 131-250 MW generator at new Western Refinary Substation System Planning Section April, 2005 TABLE OF CONTENT 1 EXECUTIVE SUMMARY