What can the Waterberg achieve? PDF created with pdffactory Pro trial version
|
|
|
- Ursula Johns
- 6 years ago
- Views:
Transcription
1 What can the Waterberg achieve?
2 Contents Global Coal market SA Coal market trends Energy demand and supply in SA. Alternative energy for SA Waterberg Coal field Exxaro s development plan for Waterberg What s happening? Constraints Future potential 1
3 Strong Industry Outlook Strong fundamentals for the local and global coal markets Significant power generation investments to be made in South Africa to meet demand following long period of underinvestment Electricity demand growing at 1,200MW per annum for the next 20 years, approximately eight new power stations will be required 89% of Eskom s installed capacity is coal-fired Coal s share of global power generation expected to be sustained while total capacity continues to grow China continuing to drive global demand while supply constraints remain RBCT expansion will enable increased exports from South Africa Prices expected to recede but remain at high levels from a historical perspective World Coal Consumption Continuing to Grow 8 (Bn tpa) Reference High Growth Low Growth Source: EIA World Power Generation Mix Coal to Maintain Its Share Other Other Hydro 2% Hydro 6% 16% 13% 39% Coal 39% Coal Nuclear 9% Nuclear 17% 19% 7% 29% 4% Gas Oil Gas Oil 16,074TWh 31,657TWh Source: IEA from ABSA 2
4 MARKET PRICES Prices USD/T Global demand is driven by the Asian factor a structural shift in prices foreseen on the long term USD/T HCC SSCC Steam API4 Market Coke Coal and coke prices coming off a high due strong demand and coke shortages Steam coal prices driven by demand and freight rates Years Commodity price rise due to weakened US dollar 3

5 RBCT EXPORT TERMINAL RBCT expansions announced Nov 2005 Construction April 2006 to June to 91Mtpa 4Mtpa to small BEE miners 6Mtpa to SDCT 9Mtpa subscription to larger BEE companies Exxaro will have 6.3Mt 4

6 AFRICAN ENERGY OUTLOOK POWER GENERATION MIX 1971 Hydro 24% Other 0% 90Twh Nuclear 0% Gas 1% 2002 Nuclear 2% Gas 22% 2030 Oil 12% Hydro 15% Nuclear 1% Hydro 7% Oil 13% Other 1% Other 2% Coal 63% 480Twh Coal 29% Coal 47% 1583Twh The expected increase in the contribution of natural gas for the generation of electricity in Africa is even more marked than for the world in total Contrary to expectations in some quarters, the IEA does not expect that the hydro-power contribution will increase, although the absolute volume is forecast to increase by 50% Persons without electricity: Africa 598,200,000 China 536,000,000 Gas 52% Oil 9% Africa energy needs to treble by 2030!! 5
7 SA energy outlook: electricity generation capacity Due to a long hiatus in electricity generation capacity investment during the last decade or two, a significant backlog has developed Considerable investment will be required in the decades ahead with an expected concomitant impact on prices Source : Eskom 6

8 The cost of future energy production The crux of the debate what will the future production costs of the different types of primary energy be? Fossil fuel derived energy will be with us for years to Source : IEA 2005 come.. 7
9 COSTS OF ELECTRICITY - WORLDWIDE South Africa Australia Norway Korea Chinese Taipei US Czech Turkey Poland Mexico Greece Spain Slovakia Finland Hungary UK Germany Switzerland France Ireland Japan Portugal Austria Italy Denmark Industry US c/kwh Households
10 South African power generation mix Installed capacity in SA ( MW) Munics 5% Eskom s installed power generation portfolio Total installed capacity : 39,154 MW 1% 2% 4% Oil-fired Hydro Pumped Storage 5% Nuclear 89% Coal-fired Eskom 95% Source: South African Coal Statistics, 2001 Source: Eskom website 9


11 Alternative forms of energy? Inga? Hydro Electricity Nuclear Solar Wind Coal bed methane/lng Fuel Cells LPG Gas Bio Mass 10

12 The Inga potential Inga Massive potential for hydro electricity ( MWe) in the Congo river But Political instability Massive infrastructure needed for electricity generation and distribution (it s a long way from Coega!) high capex long lead-time Will come to fruition only in 5-20 years from now 11

13 Nox pollution image of world showing Loyd s blanket in Highveld Source: &Beeld& (13/10/04) The expansion of electricity generation in the Mpumalanga Highveld and Gauteng will be limited due to pollution levels. 12
14 Where will all the Coal come from?? AVAILABILITY OF COAL TO ESKOM'S POWER STATIONS (CURRENT SOURCES) 200 Demand 2.5% per annum Arnot Hendrina Coal (Mt per annum) Arnot Depleted Where will all the coal come from? Source SACR Source: Year reports, SA Coal Report Optimum Stops Kriel Depleted Matla Depleted Very Expensive Coal (if available) Duvha PS stops (50 years old) Matla Kendal Duvha Tutuka Majuba Lethabo Matimba Kriel Demand 13


15 The Waterberg. 14
16 The Waterberg Coal field Zoetfontein Fault Botswana Current Pit Daarby Fault Deep Coal (250m below surface) Eenzaamheid Fault Open Pit Mine-able Coal Fault Bounded by Zoetfontein fault along the Northern side Eenzaamheid fault along the Southern boundary Daarby fault divides the coal field into open-pit mineable and underground mineable reserves Stretches 40kms from N to S and 88kms E to W. Extends Westwards into Botswana More than 40% of the remaining coal resources in RSA 15
17 Grootegeluk mine area 40- year pit layout I NFERRED Inferred Daarby Fault I NDICATED Current Pit Reserves in excess of 400 years Inferred Inferred I NFERRED Measured MEASURESD Measured Indicated Indicated I NDICATED Eenzaamheid Fault 16
18 Exxaro s development plan for the Waterberg Phase 2: Green fields expansion with a new coal mine and a new coal-fired (clean technology) power station (4200MW). Products (coal tons pa): -24 mt to Power Station (FBC) -Time-frame: 2013 to 2017 Phase 1: Brown fields expansion of current Grootegeluk coal mine near Lephalale with Medupi power station (2100 to 4200MW). Products (coal tons pa): -8.0 mt to Power Station,phase mt to Power Station, phase kt to other markets Time-frame: 2009 t Phase 3: Green fields new coal mine for exports nearby Lephalale. Products (coal tons pa): -10 mt for exports Time-frame: in 6 to 10 years Other Downstream Opportunities: Char in construction Market Coke in FS Activated Carbon Coal Liquifaction (Diesel) 17
19 GEOLOGICAL PROFILE ZONES OVERBURDEN AVERAGE THICKNESS (m) 16.5 BENCH 1 Total resources in mineral rights area: 6.016Bn tons ZONE LOM >75 years ZONE BENCH 2 ZONE 9 ZONE 8 ZONE 7 ZONE 6 ZONE 5 INTERBEDDED SC ZONE 4 INTERBED SC INTERBED SC ZONE 3 INTERBED SC ZONE BENCH 3 BENCH 4 Upper Ecca: Bright Coal with interbedded shale Lower Ecca: Dull Coal, Sand stone BENCH 5 and Carbonaceous shale BENCH 6 BENCH 7a BENCH 7b BENCH 8 BENCH 9a,b BENCH 10 BENCH 11 18
20 Grootegeluk Overall process flow BENCH 1 WASTE DUMPS BENCH 2 BENCH 3 BENCH 4 BENCH 5 BENCH 6 BENCH 7 BENCH 8 BENCH 9A BENCH 9B BENCH 10 BENCH 11 GG 1 GG 2 GG 3 GG 4/5 GG6 SEMI-SOFT COKING COAL 10% ASH POWER STATION COAL PCI PRODUCT 10% ASH MET. PRODUCTS Export Mittal Iscor Steel Matimba Saldanha Steel Local Duff Peas Small Nuts Large Nuts 19

21 GG 6 Beneficiation plant 20


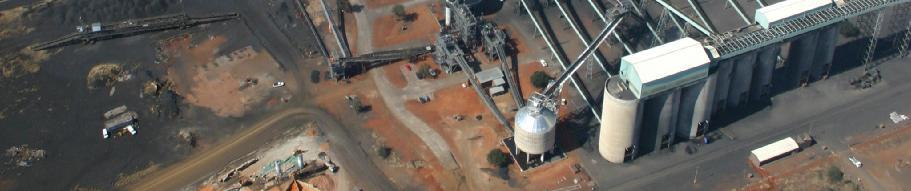

22 GG 6 plant commissioned 21


23 Medupi Grootegeluk 22 Matimba MEDUPI PROJECT Geographical Layout 22

24 MEDUPI PROJECT Pit Layout 23
25 MATERIAL FLOW BENCH PLANT DESTINATION 24 BENCH 1 GG1 GG2 SSCC 10% Ash Power Staton Coal Export BENCH 2 BENCH 3 GG6 GG3 Iscor/ Mittal ICC BENCH 4 BENCH 5 BENCH 6 BENCH 7a BENCH 8 BENCH 9a,b BENCH 10 BENCH 11 BENCH 7b GG8 GG7 GG4/5 Power Staton Coal PCI 10% Ash MET. Coal Matimba A Matimba Medupi B Saldanha Local Small Nuts Duff Peas 24
26 ROM production.. 6 PACK: Mining Tons per Bench / Year mt ROM T o n s Bench 1 Bench 2 Bench 3 Bench 4 Bench 5 Bench 6 Bench 7A Bench 7B Bench 8 Bench 9A Bench 9B Bench 10 Bench 11 25
: -24 mt to Power Station (FBC) -Time-frame: 2013 to 2017 Phase 1: Brown fields expansion of current Grootegeluk coal mine near Lephalale with Medupi power station")

27 Exxaro s development plan for the Waterberg Phase 2: Green fields expansion with a new coal mine and a new coal-fired (clean technology) power station (4200MW). Products (coal tons pa): -24 mt to Power Station (FBC) -Time-frame: 2013 to 2017 Phase 1: Brown fields expansion of current Grootegeluk coal mine near Lephalale with Medupi power station (2100 to 4200MW). Products (coal tons pa): -8.0 mt to Power Station,phase mt to Power Station, phase kt to other markets Time-frame: 2009 t Phase 3: Green fields new coal mine for exports nearby Lephalale. Products (coal tons pa): -10 mt for exports Time-frame: in 6 to 10 years Other Downstream Opportunities: Char in construction Market Coke in FS Activated Carbon Coal Liquifaction (Diesel) 26
28 Downstream value generation Exxaro Exxaro 27


29 Sintel Char project 28
30 Char plant in construction 29


31 And progressing. Commissioning Nov
32 Coal production volumes PROJECTED COAL PRODUCTION P 3 could be moved earlier Phase 3 Tons per annum (millions) Production 18,5mt! GG6 Phase 1 Phase 2 Coking Steam Eskom Current Year 1 Year 2 Year 3 Year 4 Year 5 Year 6 Year 7 Year 8 Year 9 Year 10 Year 11 Year 12 Year 13 31
33 Rail capacity Grootegeluk Expansion Projected Waterberg Rail Requirements (May 2007) Exxaro "Probable" Exxaro "Bankable" Kumba "2005" Exxaro "High" Million tons Exxaro "Probable" Exxaro "Bankable" Kumba "2005" Exxaro "High"
34 Grootegeluk RAIL INFRASTRUCTURE Thabazimbi Northam Rustenburg Rustenburg Pyramid-South Pretoria To Germiston Van der Bijl Greenview Sentrarand Blackhill Witbank Delmas Ogies Welgedag Saaiwater Leeuwpan Hawerklip Broodsnyersplaas Halfgewonnen Technical options identified ie electrification etc Costing in progress S W A Z I L A N D Saldhanha To Springs Kelty/Leandra Trichardt Twistdraai Bethal Volksrust Hamelfontein Overvaal ERMELO Panbult Kemp Piet Retief Newcastle Utrecht Ngagane Ballengeich Dannhauser Hattinghspruit Glencoe Talana Elandslaagte To Durban Paul Pietersburg Mahulumbe Sikame Vryheid Lenjanedrif Vryheid-East AAAAA = COAL Line = General Freight = GG Destinations Enqolothi To Empangeni Nsese RBCT RBCT (March 05)

35 Alternative rail routes 34

36 Conclusion Development plan on track Infrastructural constraints being addressed Downstream projects on track See you in the Waterberg!!!!! 35
Thermal Coal Market Presentation to UNECE Ad Hoc Group of Experts on Coal in Sustainable Development December 7, 2004
 Thermal Coal Market Presentation to UNECE Ad Hoc Group of Experts on Coal in Sustainable Development December 7, 2004 Barlow Jonker Pty Ltd Commercial in Confidence 1 Presentation Outline 1. Barlow Jonker
Rails and Sleepers. BACK TO THE FUTURE Biennial Symposium: October 2012
 BACK TO THE FUTURE Biennial : 10 11 October 2012 Rails and Sleepers Mr Fana Marutla (Pr Eng) Principal Engineer Perway Rail Network fana.marutla@transnet.net Content Market Demand Strategy - Overview MDS
Electricity sector transformation and the expected impact of Climate Change mitigation measures
 Electricity sector transformation and the expected impact of Climate Change mitigation measures 26 September 2018 Mandy Rambharos Climate Change and Sustainable Development Eskom Holdings SOC Ltd Overview
Energy Management :: 2007/2008
 :: 2007/2008 Class # 1P Course organization and Energy statistics Energy Prices Dr. João Parente joao.parente@dem.ist.utl.pt pt Primary Energy Supply Source: http://www.snowman-jim.org/science/images Class
Alstom in South Africa
 Alstom s Presence Medupi Kusile Kriel Johannesburg Transport Gibela Factory Koeberg Key Data: Provided major equipment for 12 out of 13 South Africa s coal-fired power plants and for the only nuclear power
Global Coal and Coke Flows, 2008
 Global Coal and Coke Flows, 2008 Phil Fisher Pet Coke Consulting Argus Petroleum Coke Summit September 17-18, 2009 Houston, TX Global Coal and Coke Flows What we will see: 1 How much steam coal is produced/
TABLE OF CONTENTS 6 MEDIUM-TERM COAL MARKET REPORT 2012
 TABLE OF CONTENTS FOREWORD... 3 ACKNOWLEDGEMENTS... 5 EXECUTIVE SUMMARY... 12 Business as usual... 12 The winds of change... 12 US shale gas switches on coal in Europe... 13 From Beijing to New Delhi?...
BP Statistical Review of World Energy June 2017
 BP Statistical Review of World Energy June 217 Primary energy 8 Consumption 8 Consumption by fuel 9 66 th edition Primary energy Consumption* Growth rate per annum Million tonnes oil equivalent 26 27 28
SACAFMA 24 JULY 2009 ESKOM PRESENTATION
 SACAFMA 24 JULY 2009 ESKOM PRESENTATION BY KOOS JORDAAN 1 CONTENTS RECOVERY PLAN SUPPLY AND DEMAND COAL QUALITIES/ LOAD LOSSES ENVIRONMENTAL COST REDUCTION 2 STATE OF THE POWER SYSTEM: COAL SUPPLY TREND
FIRESTONE ENERGY WATERBERG COAL PROJECT
 FIRESTONE ENERGY WATERBERG COAL PROJECT the place, the project, the coal 20 July 2009 firestoneenergy.com.au DISCLAIMER This presentation may include forward-looking statements. These forward-looking statements
The Great Transition: Shifting from Fossil Fuels to Solar and Wind Energy Supporting Data - Coal
 The Great Transition: Shifting from Fossil Fuels to Solar and Wind Energy Supporting Data - Coal Proved Coal Reserves, 213 GRAPH: Proved Coal Reserves in Top Countries, 213 Coal Production in Top Ten Countries
1. INTERNATIONAL OVERVIEW. 1.0 Area and population. population (1,000) area
 area") 1.0 Area and population area population (1,000) km 2 2000 2010 2018 1 inhabitants per km 2 Belgium 30,530 10,251 10,920 11,443 375 Germany 357,380 82,212 81,777 82,952 232 Estonia 45,230 1,397 1,331 1,315
1.0 Area and population area population (1,000) km 2 2000 2010 2018 1 inhabitants per km 2 Belgium 30,530 10,251 10,920 11,443 375 Germany 357,380 82,212 81,777 82,952 232 Estonia 45,230 1,397 1,331 1,315
I. World trade in Overview
 I. World trade in - Overview Table I.1 Growth in the volume of world merchandise exports and production, 2-5 (Annual percentage change) 2-5 23 24 World merchandise exports 4.5 5. 9.5 6. Agricultural products
TABLE OF CONTENTS OECD/IEA, 2017
 TABLE OF CONTENTS Foreword... 3 Acknowledgements... 4 Executive Summary... 13 Coal s decade of stagnation... 13 While some demand centres are in decline, others are taking off... 13 High prices endure,
Medium-term Coal Market Report 2011 Carlos Fernández Alvarez. Senior Coal Analyst. Gas, Coal and Power Markets Division
 Medium-term Coal Market Report 211 Carlos Fernández Alvarez. Senior Coal Analyst. Gas, Coal and Power Markets Division Madrid, 31 January 212 The context Uncertainties will fundamentally shape the medium-term
Pogled v energetsko prihodnost
 Pogled v energetsko prihodnost Prof.dr.sc. Neven Duić International Centre for Sustainable Development of Energy, Water and Environment Systems Power Engineering and Energy Management Chair Department
Primary energy. 8 Consumption 9 Consumption by fuel. 67 th edition
 Primary energy 8 Consumption 9 Consumption by fuel 67 th edition Primary energy Consumption* Growth rate per annum Million tonnes oil equivalent 27 28 29 2 211 212 213 214 215 216 217 217 26-16 Share 217
Alfen acquires Elkamo in Finland A platform for expansion in the Nordics
 Alfen acquires Elkamo in Finland A platform for expansion in the Nordics 2 July 2018 Disclaimer This communication may include forward-looking statements. All statements other than statements of historical
Table of Contents... i List of Tables... vi List of Figures... x List of Abbreviations... xiv
 Table of Contents Table of Contents Table of Contents... i List of Tables... vi List of Figures... x List of Abbreviations... xiv Introduction... 1 Operating Support Incentives... 1 Feed-in Tariffs...
Regional Cooperation Infrastructure Development and Operation. EU Energy Governance. Olaf Ziemann Member of ENTSO-E s System Operations Committee
 Regional Cooperation Infrastructure Development and Operation EU Energy Governance 30 April 2014, Berlin Olaf Ziemann Member of ENTSO-E s System Operations Committee About ENTSO-E 41 TSOs from 34 countries
NEW PASSENGER CAR REGISTRATIONS BY ALTERNATIVE FUEL TYPE IN THE EUROPEAN UNION 1 Quarter
 PRESS EMBARGO: NEW PASSENGER CAR REGISTRATIONS BY ALTERNATIVE FUEL TYPE IN THE EUROPEAN UNION 1 Quarter 3 2017 Alternative fuel vehicle registrations: +51.4% in third quarter of 2017 In the third quarter
Sectoral Profile - Services
 Sectoral Profile - Services Energy consumption Changes in energy consumption and value added in services Since 2008 strong contraction of total energy consumption (-0.3%/year) although electricity consumption
OECD unemployment rate stable at 5.4% in March 2018
 OECD unemployment rate stable at.4% in March 2018 The OECD unemployment rate remained stable at.4% in March 2018. Across the OECD area, 34 million people were unemployed, 1.4 million more than in April
OECD unemployment rate falls to 6.0% in March 2017
 OECD unemployment rate falls to 6.0% in March 017 The OECD unemployment rate for the population as a whole fell by 0.1 percentage point, to 6.0%, in March 017. Across the OECD area, 37.5 million people
Automotive Aftermarket Giorgio Brusco
 Automotive Aftermarket Giorgio Brusco Vice President Automotive Aftermarket Europe Agenda The global business today Recent progress in automotive Future growth drivers Summary 2 Worldwide Automotive Aftermarket:
AUSTRIA. Table 1. FDI flows in the host economy, by geographical origin. (Millions of US dollars)
") Table 1. FDI flows in the host economy, by geographical origin World 5 690 138 6 195 3 184 10 784 7 933 31 154 6 858 9 303 840 10 618 5 760 Developed economies 5 740 13 5 341 2 689 10 137 6 291 29 721
Table 1. FDI flows in the host economy, by geographical origin World 5 690 138 6 195 3 184 10 784 7 933 31 154 6 858 9 303 840 10 618 5 760 Developed economies 5 740 13 5 341 2 689 10 137 6 291 29 721
Coal. 36 Reserves and prices 38 Production and consumption. 67 th edition
 Coal 36 Reserves and prices 38 Production and consumption 67 th edition Total proved reserves at end 217 Million tonnes Anthracite and bituminous Subbituminous and lignite US 228 3116 25916 24.2% 357 Canada
COAL DIVISION ARM COAL. Goedgevonden Coal Project
 COAL DIVISION ARM COAL Goedgevonden Coal Project ARM Coal Divisional structure ARM Coal was formed in July 2006 in partnership with global diversified mining group Xstrata plc. The ownership structure
Energy perspectives and new energy solutions
 Energy perspectives and new energy solutions Energy seminar Ås, 3rd of March 2017 Classification: Open 3 mars 20 Statoil ASA Outline Personal introduction Statoil s strategy Energy perspectives New energy
International Coal Markets
 International Coal Markets www.coalimp.org.uk Nigel Yaxley Managing Director, CoalImp 26 th November 28 International Coal Markets World supply and demand Seaborne trade Reserves and resources International
Fresh Connections: Netherlands
 Fresh Connections: Netherlands SHIFTING TRADE WINDS: GEOPOLITICS, GLOBAL TRADE & YOU JULIEN MARCILLY CHIEF ECONOMIST APRIL 29, 215 Oil prices: Lower for longer 14 Oil price (Brent, source: OPEC) 12 Oil
OECD unemployment rate down to 6.4% in March 2016
 OECD unemployment rate down to 6.4% in March 2016 The OECD unemployment rate fell by 0.1 percentage point to 6.4% in March 2016, 1.7 percentage point below the January 2013 peak. Across the OECD area,
STATISTICAL ANNEX NOTE ON QUARTERLY PROJECTIONS
 OECD Economic Outlook, Volume 2017 Issue 1 OECD 2017 This annex contains data on key economic series which provide a background to the recent economic developments in the OECD area described in the main
67 th edition. Renewable energy. Appendices. 44 Other renewables consumption 45 Biofuels production
 Renewable energy 44 Other renewables consumption 45 Biofuels production Appendices A1 Solar Generation A2 Wind Generation A3 Geothermal, biomass and other Generation A4 Geothermal Cumulative installed
M O T O R V E H I C L E S T A T I S T l C S
 M O T O R V E H I C L E S T A T I S T l C S of Japan 2017 JAPAN AUTOMOBILE MANUFACTURERS ASSOCIATlON, INC. C O N T E N T S Motor Vehicles in Use Cars, Trucks, Buses and Special Purpose Vehicles, 1945-2016
INITIATING AND FUNDING R&D. IGRC 2014 Copenhagen September Brad Douville, Vice-President, Westport
 INITIATING AND FUNDING R&D IGRC 2014 Copenhagen September 17-19 Brad Douville, Vice-President, Westport 1 Driving a Shift to Natural Gas as a Transportation Fuel» Energy transitions are enormously difficult»
Electricity industry structure and key players
 Electricity industry structure and key players Growth in capacity, production and consumption, 2006 2017 Expected demand and addition to generation capacity, 2018 2027 Growth in transmission network and
TRENDS OF EUROPEAN PV MARKET: INVESTORS PERSPECTIVE
 TRENDS OF EUROPEAN PV MARKET: INVESTORS PERSPECTIVE Pius Hüsser, Director, Nova Energie GmbH IEA PVPS Task 1 Switzerland Vice President Swiss Solar Industry Association Swissolar Board Member Edisun Power
USDA Agricultural Outlook Forum 2007
 USDA Agricultural Outlook Forum 2007 EU BIOFUELS POLICY AND EFFECTS ON PRODUCTION, CONSUMPTION AND LAND USE FOR ENERGY CROPS Hilkka Summa Head of Unit for Bioenergy, Biomass, Forestry and Climate Change
ACEA Report. Vehicles in use Europe 2017
 ACEA Report Vehicles in use Europe 2017 TABLE OF CONTENTS Summary... 2 Vehicles in use in Europe... 3 Passenger cars... 3 Light commercial vehicles... 4 Medium and heavy commercial vehicles... 5 Buses...
Laboratory worker at Goedgevonden Coal Mine
 82 Laboratory worker at Goedgevonden Coal Mine Integrated Annual Report 2013 Operational review ARM Coal 83 ARM Coal F2013 F2012 % change ARM Coal attributable sales volumes (000t) Headline earnings Rm
Technologies for Urban Transport
 Downloaded from orbit.dtu.dk on: Dec 19, 2017 Technologies for Urban Transport Dhar, Subash; Shukla, P.R. Publication date: 2013 Link back to DTU Orbit Citation (APA): Dhar, S., & Shukla, P. R. (2013).
Photo courtesy of NZTA
 international comparisons for road deaths Photo courtesy of NZTA 14 Motor Vehicle Crashes in New Zealand international comparisons for road deaths 141 Contents TABLES Table 1 International comparison of
DEVELOPING THE BOTSWANA COAL INDUSTRY BOTSWANA RESOURCE CONFERENCE
 DEVELOPING THE BOTSWANA COAL INDUSTRY BOTSWANA RESOURCE CONFERENCE June 2018 REUTERS HEADLINE NEW PRESIDENT LOOKS TO WEAN BOTSWANA OFF DEPENDENCE ON DIAMONDS 1 APRIL 2018 Quote: We still seek to build
The Energy Market 2004
 The Energy Market 24 Electrical energy generated by Swedish nuclear power per inhabitant in 21 compared to other countries kwh/inhabitant 9 8 7 6 5 4 3 2 1 Sweden Belgium Finland France Slovakia Spain
Joao Ramon Capital Markets Day Industrial Fluid Power
 Joao Ramon Capital Markets Day 2004 Industrial Fluid Power Agenda Business overview Markets Our position South America Summary 2 Fluid Power Products Fluid Power global market worth $7.3bn Hose & Connectors
Understanding the current electricity supply challenges facing Eskom
 Understanding the current electricity supply challenges facing Eskom 1 Contents System performance Capacity expansion programme Load shedding Where we are now Short term initiatives 2 Overview Eskom s
Why would a $6b revenue company buy a small independent WOFIE in China?
 1 Why would a $6b revenue company buy a small independent WOFIE in China? Chris Goode One year ago at the APBO 2016 in my capacity as Chief Business Development Officer of Propulsys Inc., I gave a presentation
exports of goods annual change (%)
") 12.0 Austria s foreign trade 2015 by world region imports of goods 2015 exports of goods 2015 region 1 1 share (%) share (%) Europe 106,984 80.4 104,032 79.1 EU 93,686 70.4 90,841 69.1 EFTA 8,020 6.0 8,098
12.0 Austria s foreign trade 2015 by world region imports of goods 2015 exports of goods 2015 region 1 1 share (%) share (%) Europe 106,984 80.4 104,032 79.1 EU 93,686 70.4 90,841 69.1 EFTA 8,020 6.0 8,098
exports of goods annual change (%)
") 12.0 Austria s foreign trade 2016 by world region imports of goods 2016 exports of goods 2016 region 1 1 share (%) share (%) Europe 110,067 81.2 104,271 79.5 EU 96,801 71.4 91,112 69.4 EFTA 7,718 5.7 8,132
12.0 Austria s foreign trade 2016 by world region imports of goods 2016 exports of goods 2016 region 1 1 share (%) share (%) Europe 110,067 81.2 104,271 79.5 EU 96,801 71.4 91,112 69.4 EFTA 7,718 5.7 8,132
Evolving Global Oil Trade Flows. IEA-IEF-OPEC Joint Meeting Vienna, March 2018
 Evolving Global Oil Trade Flows IEA-IEF-OPEC Joint Meeting Vienna, March 2018 SHIFTING FLOWS: WHAT HAS THIS MEANT IN PRACTICE? US/Europe crude imports & exports Saudi crude to Poland Chinese teapots importing
ANNUAL STATISTICAL SUPPLEMENT
 ANNUAL STATISTICAL SUPPLEMENT with 2016 data 2017 Edition This Statistical Supplement has been prepared to provide a longer historical perspective for the oil demand, supply, trade, stocks, prices and
Infographics on Electromobility (January 2019)
") Infographics on Electromobility (January 2019) Publisher: BMW Group Corporate Communications Electromobility Last Update: 04.01.2019 Contact: presse@bmw.de ELECTROMOBILITY IN GERMANY. SHARE IN NEW REGISTRATIONS
Infographics on Electromobility (January 2019) Publisher: BMW Group Corporate Communications Electromobility Last Update: 04.01.2019 Contact: presse@bmw.de ELECTROMOBILITY IN GERMANY. SHARE IN NEW REGISTRATIONS
Fossil Fuel Foundation: 3 rd Waterberg Conference An overview of Transnet s plans for Waterberg coal 15/16 October 2014
 1 Fossil Fuel Foundation: 3 rd Waterberg Conference An overview of Transnet s plans for Waterberg coal 15/16 October 2014 Contents Setting the scene Transnet Market Demand Strategy Demand Integrated supply
Building on success - growing the Pilbara. Greg Lilleyman President, Pilbara Operations
 Building on success - growing the Pilbara Greg Lilleyman President, Pilbara Operations 2 Guideline Rio Tinto, in context The Pilbara integrated operations Rio Tinto s major customers: some historical perspective
OECD unemployment rate down to 6.5% in January 2016
 OECD unemployment rate down to 6.% in January 2016 The OECD unemployment rate fell by 0.1 percentage point to 6.% in January 2016, 1.6 percentage points below the January 2013 peak. Across the OECD area,
P r e s s R e l e a s e. June 2007
 PRESS EMBARGO FOR ALL DATA: 26 July 27, 8. A.M. (6. A.M. GMT) P r e s s NEW COMMERCIAL VEHICLE REGISTRATIONS June 27 European Union + EFTA Countries LCVs up to 3.5t Heavy Trucks over 16t 25, 3, 2, 15,
Beef Markets Outlook. January Mark Zieg. Growing the success of Irish food & horticulture. Growing the success of Irish food & horticulture
 Beef Markets Outlook January 213 Mark Zieg AIDAN COTTER CHIEF EXECUTIVE BORD BIA 28 JANUARY 29 Irish Beef Markets Exports 444, Export Volumes by Destination (212) UK 231, Spain 11, France 46, Holland 36,
The Great Transition: Shifting from Fossil Fuels to Solar and Wind Energy Supporting Data - Hydropower
 The Great Transition: Shifting from Fossil Fuels to Solar and Wind Energy Supporting Data - Hydropower World Installed Hydroelectric Generating Capacity, 1980-2013 GRAPH: World Installed Hydroelectric
Total credit to the non-financial sector (core debt), % of GDP Table F1.1
, % of GDP Table F1.1") Total credit to the non-financial sector (core debt), % of GDP Table F1.1 2012 2013 2014 2015 2016 Q2 16 Q3 16 Q4 16 Q1 17 Q2 17 Argentina 62.6 66.4 64.6 75.5 75.3 81.7 80.1 75.3 71.6 72.7 Australia 208.0
Total credit to the non-financial sector (core debt), % of GDP Table F1.1 2012 2013 2014 2015 2016 Q2 16 Q3 16 Q4 16 Q1 17 Q2 17 Argentina 62.6 66.4 64.6 75.5 75.3 81.7 80.1 75.3 71.6 72.7 Australia 208.0
(annual average compound growth rate)
") Table 3-1. 3KDVHVRI*URZWKE\0DMRU5HJLRQ (annual average compound growth rate) 1820-70 1870-1913 1913-50 1950-73 1973-92 1820-1992 GDP Western Europe 1.7 2.1 1.4 4.7 2.2 2.2 Western Offshoots 4.3 3.9 2.8
Table 3-1. 3KDVHVRI*URZWKE\0DMRU5HJLRQ (annual average compound growth rate) 1820-70 1870-1913 1913-50 1950-73 1973-92 1820-1992 GDP Western Europe 1.7 2.1 1.4 4.7 2.2 2.2 Western Offshoots 4.3 3.9 2.8
INFINEUM WORLDWIDE WINTER DIESEL FUEL QUALITY SURVEY
 INFINEUM WORLDWIDE WINTER DIESEL FUEL QUALITY SURVEY 22 http://www.infineum.com/ Contents Forward CONTENTS Introduction... 3 The Trends... 4 Worldwide Diesel Fuel Survey Physical Inspection Data Mean values...
Gas Insecurity: A Figment of the Imagination? Peter Davies. Chief Economist, BP EPRG. Cambridge. 19 May, 2006
 Gas Insecurity: A Figment of the Imagination? Peter Davies. Chief Economist, BP EPRG. Cambridge. 19 May, 2006 BP 2006 2 Gas Security What is it? Does the UK have it? What is going to change? What can we
Corporate Overview. Business Model. Track Record. Target Markets. Contact
 MINING 1. 2. 3. 4. 5. Corporate Overview Business Model Track Record Target Markets Contact 12.11.2013 2 Corporate Overview CRONIMET Mining AG CRONIMET Mining AG CRONIMET Holding was established in 1980
WORLD MOTOR VEHICLE PRODUCTION BY COUNTRY AND TYPE QUARTERS June 14, 2018
 QUARTERS 2017-2018 June 14, 2018 CONTENTS BASEPROTOTAL BASEPROCARS BASEPROLCV BASEPROHCV BASEPROBC Summation of cars, LCVs, HCVs, heavy buses Cars LCVs HCVs Heavy buses Note: The production of cars and
Ronnie van Eeden. Senior Mining Engineer. Overview
 Senior Mining Engineer Overview is a qualified Mining Engineer with other commercial qualifications. He has 46 years of experience in the coal industry working for mining houses, the smaller coal industry,
Taxing Petrol and Diesel
 Taxing Petrol and Diesel Colm Farrell Key Point Under the polluter pays principle, tax rates on diesel and petrol fuels should be at a rate which is commensurate with the total environmental costs they
Energy Efficiency: An engine for growth and development. Philippe Benoit Head, Energy Efficiency and Environment Division, IEA 8 June 2015
 Energy Efficiency: An engine for growth and development Philippe Benoit Head, Energy Efficiency and Environment Division, IEA 8 June 2015 EE: an important role? Energy efficiency can help drive economic
EBRD Sustainable Energy Finance Facilities
 EBRD Sustainable Energy Finance Facilities London, 20 th June 2011 Michael Liebreich Chief Executive Twitter: @MLiebreich MICHAEL LIEBREICH SUMMIT KEYNOTE, 5 APRIL 2011 1 AGENDA 1. Background 2. Investment
Asahi World Environmental Forum 14 September Global trends in clean energy investment. Michael Liebreich Chief Executive
 Asahi World Environmental Forum 14 September 2010 Global trends in clean energy investment Michael Liebreich Chief Executive Bloomberg New Energy Finance, 2004-2010 Global total new investment in clean
OECD unemployment rate stable at 5.8% in August 2017
 OECD unemployment rate stable at 5.8% in August 017 The OECD unemployment rate was stable at 5.8% in August 017, unchanged since May. Across the OECD area, 36.1 million people were unemployed, 3.5 million
Economic and Market Report. EU Automotive Industry Quarter
 Economic and Market Report EU Automotive Industry Quarter 2 2017 September 2017 CONTENTS Passenger cars... 2 Registrations... 2 World... 2 The European Union... 4 Passenger car registrations by fuel type...
Willem van der Westhuizen Pump Consultant Eskom Enterprises Engineering Johannesburg South-Africa. Master Degree in Mechanical Engineering
 SELECTING THE OPTIMISED PUMP CONFIGURATION AND DRIVE OPTION FOR THE CONDENSATE EXTRACTION AND BOILER FEED PUMPS FOR THE NEW ESKOM SUPERCRITICAL POWER STATIONS Abstract: Willem van der Westhuizen Pump Consultant
Delivery Statistics. Second quarter 2015 EUROPEAN PULP AND PAPER INDUSTRY
 Second quarter EUROPEAN PULP AND PAPER INDUSTRY INTRODUCTION 2 nd Quarter, Paper and board deliveries by CEPI countries were 45.9 million tonnes in the first half of, a small tonnage decrease on the same
OECD unemployment rate stable at 5.3% in July 2018
 OECD unemployment rate stable at.3% in July 208 The OECD unemployment rate was stable at.3% in July 208. Across the OECD, 33. million people were unemployed,.7 million less than the peak in January 203
Energy Outlook for Asia and the Pacific
 Energy Outlook for Asia and the Pacific Aiming Zhou Senior Energy Specialist Asian Development Bank 25-29 Nov, 2013 Coverage of the Outlook Time Frame: 2010 2035 Geographic Coverage: Developing Asia o
NEW PASSENGER CAR REGISTRATIONS BY FUEL TYPE IN THE EUROPEAN UNION 1
 PRESS EMBARGO: NEW PASSENGER CAR REGISTRATIONS BY FUEL TYPE IN THE EUROPEAN UNION 1 Quarter 3 2018 Fuel types of new cars: diesel 18.2%, petrol +15.2%, electric +30.0% in third quarter of 2018 In the third
NEW ALTERNATIVE FUEL VEHICLE REGISTRATIONS IN THE EUROPEAN UNION 1 Q1 2015
 NEW ALTERNATIVE FUEL VEHICLE REGISTRATIONS IN THE Q1 2015 ALTERNATIVE FUEL VEHICLE registrations: +28.8% in in first quarter In the first quarter of 2015, total alternative fuel vehicle (AFV) registrations
Euracoal Market Report 3/2006
 Euracoal Market Report 3/2006 November 2006 WORLD MARKET The following comments and figures only apply to the seaborne World Coal Market. They are preliminary. World Market Coal Mio t 1-6 2006 1-6 2005
Citrus: World Markets and Trade
 United States Department of Agriculture Foreign Agricultural Service January 2017 Citrus: World Markets and Trade Oranges Global orange production for 2016/17 is forecast up 2.4 million metric tons from
Global Monthly February 2018
 Global Monthly February 18 3 1-year Treasury yields 1-year breakeven inflation rate 1 1 15 16 17 18 February 18 5 3 Global GDP growth Composite PMI (RHS) Index 56 5 5 1 5 1 13 1 15 16 17 18 3..5. 1.5 1.
Economic and Market Report. EU Automotive Industry Quarter
 Economic and Market Report EU Automotive Industry Quarter 3 2017 December 2017 CONTENTS EU economic outlook... 2 Passenger cars... 4 Registrations... 4 World... 4 The European Union... 6 Passenger car
Efficient Electrification Initiative Update
 Efficient Electrification Initiative Update NSTF Discussion Forum SE4All in South Africa April 17, 2018 Barry MacColl https://www.epri.com/#/pages/sa/us_national_electrification_assessment Three Key Aspects
Greening transport taxation
 Greening transport taxation Jos Dings GBE conference, Budapest, 8 July 2010 www.transportenvironment.org A ranking of transport tax anomalies 1 Tax free aviation 2 Private benefits of company cars 3 Europe
NEW ALTERNATIVE FUEL VEHICLE REGISTRATIONS IN THE EUROPEAN UNION 1 Q2 2015
 NEW ALTERNATIVE FUEL VEHICLE REGISTRATIONS IN THE Q2 2015 New alternative fuel vehicle (AFV) registrations in the EU by engine type Q2 2014 Q2 2015 Thousand units 70 60 50 40 30 20 10 0 EVs HEVs AFVs other
For personal use only Coal & Allied Industries Limited
 Coal & Allied Industries Limited Presentation to the Financial Community Half Year Results 30 June 2011 Bill Champion 29 July 2011 Mount Thorley Warkworth Mount Thorley Warkworth Mount Thorley Warkworth
World Geographic Shares
 World Geographic Shares North America South America Europe Africa Asia Australia/ Oceania 18% 13% 7% 22% 33% 6% World Population Shares North America South America Europe Africa Asia Australia/ Oceania
OECD unemployment rate stable at 5.5% in January 2018
 OECD unemployment rate stable at.% in January 2018 The OECD unemployment rate was stable at.% in January 2018. Across the OECD area, 34. million people were unemployed, 1.9 million more than in April 2008.
FEDERAL RESERVE statistical release
 FEDERAL RESERVE statistical release FOR IMMEDIATE RELEASE MARCH 16, 1992 E.U C1Z1, GEOGRAPHICAL r DISTRIBUTION n OF e ASSETS AND^LIABILITIES (IN MILLIONS OF DOLLARS) ASSETS COUNTRY OF CUSTOMER 12/31/90
Global Valuation Summary - SAMPLE PAGES
 - SAMPLE PAGES Regional Valuation Comparisons... 2... 4... 7... 9... 11 Developed Asia Pacific ex... 13 Developed Europe ex... 16 Advanced Emerging... 19 Appendix... 22 Disclaimer... 23 Global Market Valuations
Spain s exports by oil product group and country of destination
 Corporación de Reservas Estratégicas de Productos Petrolíferos Castellana, 79 28046 Madrid T. +34 91 360 09 10 Updated F. +34 91 420 on39 45 www.cores.es February 13 th 2017 Spain s exports by oil product
FACTS ABOUT DIESEL PRICES & THE AUSTRALIAN FUEL MARKET
 FACTS ABOUT DIESEL PRICES & THE AUSTRALIAN FUEL MARKET INTERNATIONAL PRICES & INFLUENCES Crude oil, diesel and petrol are different products and are bought/sold in their own markets. Each market is typically
Improving the integration of electricity networks: Prospects of the European Network of Transmission System Operators for Electricity (ENTSO-E)
") Improving the integration of electricity networks: Prospects of the European Network of Transmission System Operators for Electricity (ENTSO-E) 1. Context: ENTSO-E, 10/20/40 year views, network codes 2.
Improving the integration of electricity networks: Prospects of the European Network of Transmission System Operators for Electricity (ENTSO-E) 1. Context: ENTSO-E, 10/20/40 year views, network codes 2.
NEW PASSENGER CARS BY FUEL TYPE IN THE EUROPEAN UNION 1 Quarter
 PRESS EMBARGO: NEW PASSENGER CARS BY FUEL TYPE IN THE EUROPEAN UNION 1 Quarter 1 2018 Next press release: Thursday 6 September 2018 1 Data for Croatia, Cyprus, Luxembourg and Malta is not available Page
NEW COMMERCIAL VEHICLE REGISTRATIONS EUROPEAN UNION 1. November 2018
 PRESS EMBARGO: NEW COMMERCIAL VEHICLE REGISTRATIONS EUROPEAN UNION 1 November 2018 Commercial vehicle registrations: +3.8% 11 months into 2018; +2.7% in November Total new commercial vehicles In November
Natural gas. 26 Reserves 28 Production and consumption 33 Prices 34 Trade movements. 67 th edition
 Natural gas 26 Reserves 28 Production and consumption 33 Prices 34 Trade movements 67 th edition Natural gas Total proved reserves At end 1997 At end 2007 At end 2016 At end Trillion Trillion Trillion
GLOBAL SUMMARY REPORT Market for High Voltage Insulators & Bushings
 GLOBAL SUMMARY REPORT Market for High Voltage Insulators & Bushings 2010-2015 - 2025 GOULDEN REPORTS October 2016 No 1 Priorsfield, Marlborough, Wiltshire, SN84AQ. United Kingdom Tel: +44 1672 513316 Fax:
NEW PASSENGER CARS BY FUEL TYPE IN THE EUROPEAN UNION 1 Quarter
 PRESS EMBARGO: NEW PASSENGER CARS BY FUEL TYPE IN THE EUROPEAN UNION 1 Quarter 1 2018 Next press release: Thursday 6 September 2018 1 Data for Croatia, Cyprus, Luxembourg and Malta is not available Page
The Supply of Oil. Projections to Oil and the Macroeconomy in a Changing World Federal Reserve Bank of Boston June 9, 2010 Boston, MA
 The Supply of Oil Projections to 2035 Oil and the Macroeconomy in a Changing World Federal Reserve Bank of Boston June 9, 2010 Boston, MA Howard Gruenspecht, Deputy Administrator Near-term oil price uncertainty
Next Release: 14 November Next Release: 14 November July
 43282 Next Release: 14 November 2018 Next Release: 14 November 2018 July Date of publication: 12 October 2018 TABLE OF CONTENTS Charts 1 Gross consumption of natural gas by OECD region 3 2 Indigenous production