The Impacts of the Recent Hurricanes to Energy Infrastructure and Markets
|
|
|
- Briana Martin
- 6 years ago
- Views:
Transcription


1 The Impacts of the Recent Hurricanes to Energy Infrastructure and Markets Presentation to the Baton Rouge City Club Distinguished Lecture Series October 13, 2005 David E. Dismukes Center for Louisiana State University

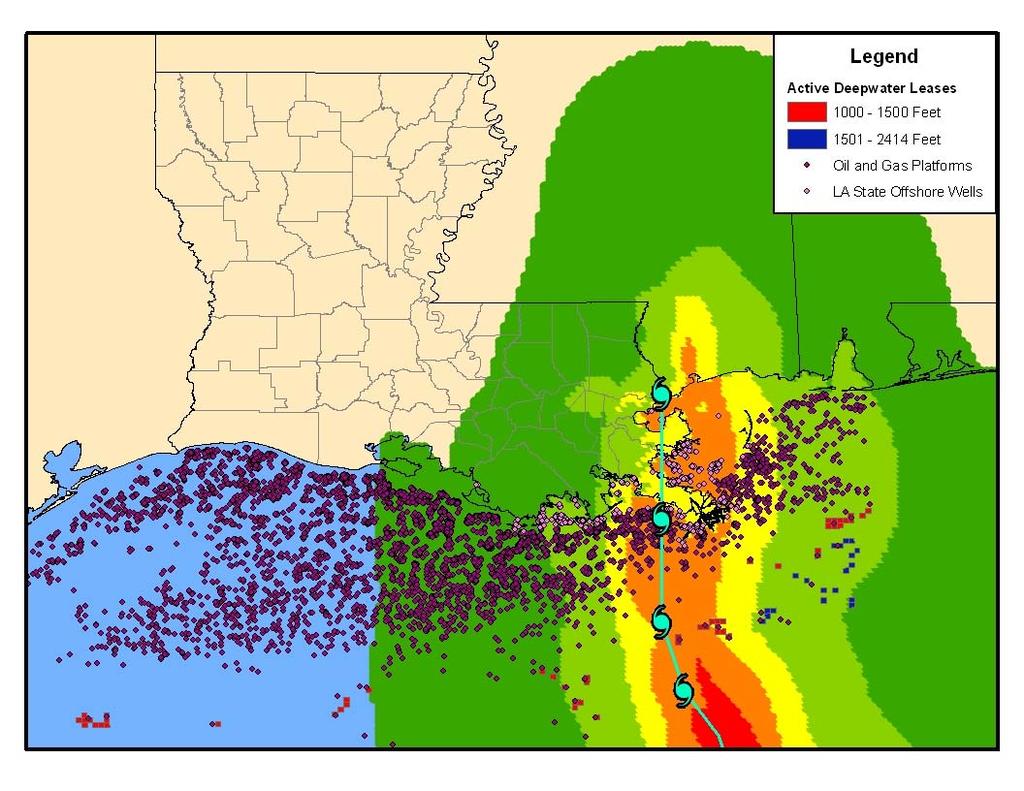
2 Katrina at Louisiana Landfall Katrina s path Platforms Louisiana state offshore wells

3 Hurricane Katrina Wind Fields
4 Platforms/Structures Impacted by Katrina
5 Katrina versus Other Major Hurricanes Shut-in Oil Production 1,600 1,400 Katrina (Landfall: August 29, 2005) Dennis (Landfall: July 10, 2005) Ivan (Landfall: September 16, 2004) 1,200 thousand bbls per day 1, Landfall Source: Minerals Management Service
6 Katrina versus Other Major Hurricanes - Shut-in Oil Production as a Percent of Daily GOM Production 120% 100% Katrina (Landfall: August 29, 2005) Dennis (Landfall: July 10, 2005) Ivan (Landfall: September 16, 2004) 80% percent 60% 40% 20% 0% Landfall Source: Minerals Management Service
7 Refineries Impacted by Katrina Gulf Coast, Port Arthur and Lake Charles Company Location Processing Capacity Status (barrels per day) (as of August 31) ExxonMobil Baton Rouge, LA 493,500 reduced runs ChevronTexaco Pascagoula, MS 325,500 shutdown Citgo Lake Charles, LA 324,300 total supply loss ConocoPhillips Belle Chasse, LA 247,000 shutdown Marathon Garyville, LA 245,000 shutdown ConocoPhillips Lake Charles, LA 239,400 total supply loss Motiva (Shell) Convent, LA 235,000 shutdown Motiva (Shell) Norco, LA 226,500 shutdown Total Port Arthur, TX 211,500 reduced runs ExxonMobil Chalmette, LA 187,200 shutdown Valero St. Charles 185,000 shutdown Murphy Meraux 120,00 shutdown Valero Krotz Springs, LA 80,000 reduced runs Shell Chemical Saraland, AL 80,000? Shell Chemical St Rose, LA 55,000 shutdown Placid Oil Port Allen, LA 48,500 reduced runs Source: Energy Information Administration, Department of Energy

8 Refineries Shutdown Due to Katrina Capacity Refinery Location (bbls/day) 1 Calcasieu Refining Lake Charles, LA 30,000 2 Calumet Lubricants Cotton Valley, LA 13,020 3 Calumet Lubricants Princeton, LA 8,300 4 Calumet Shreveport Shreveport, LA 35,000 5 Chalmette Refining Chalmette, LA 187,200 6 Citgo Petroleum Lake Charles, LA 324,300 7 ConocoPhillips Belle Chasse, LA 247,000 8 ConocoPhillips Westlake, LA 239,400 9 ExxonMobil Baton Rouge, LA 493, Marathon Ashland Petroleum Garyville, LA 245, Motiva Enterprises Convent, LA 235, Motiva Enterprises Norco, LA 226, Murphy Oil Meraux, LA 120, Placid Refining Co Port Allen, LA 48, Shell Chemical Saint Rose, LA 55, Valero Energy Krotz Springs, LA 80, Valero St. Charles Refinery Norco, LA 185, Chevron USA Pascagoula, MS 325,000

9 Crude and Product Pipelines Impacted by Katrina
10 Critical Terminals Impacted by Katrina

11 Critical Electricity Transmission Lines Impacted by Katrina
12 Critical Terminals and the Power-Pipeline Infrastructure
13 Gasoline Price Increases August 30, 2005 to September 6, Regional Changes in Gasoline Prices (cents per gallon) 60.1 Mid-Atlantic 54.9 Northeast 51 South Atlantic 46.9 Midwest 39.5 South 38.5 Mountain 25.3 West 44.7 US Colonial / Plantation Pipeline Systems < > Source: American Petroleum Institute
14 Total Immediate Refinery Impact LA/MS/AL Gulf Coast Refiners (reduced runs and shutdowns) 2,528 thousand bbls/day 15% of US operating capacity Port Arthur/Lake Charles (reduced runs and supply loss) 775 thousand bbls/day 5% of US operating capacity Midwest (reduced runs supplied by Capline Pipeline) 1,628 thousand bbls/day 10% of US operating capacity Remaining US Operating Capacity 12,075 thousand bbls/day 70% of US operating capacity Total Refinery Impact 4,931 thousand bbls/day 30% of US operating capacity Source: Energy Information Administration, Department of Energy
15 Katrina versus Other Major Hurricanes Shut-in Natural Gas Production 10 9 Katrina (Landfall: August 29, 2005) Dennis (Landfall: July 10, 2005) Ivan (Landfall: September 16, 2004) 8 7 bcf per day Landfall Source: Minerals Management Service
16 Katrina versus Other Major Hurricanes - Shut-in Gas Production as a Percent of Daily GOM Production 100% 90% Katrina (Landfall: August 29, 2005) Dennis (Landfall: July 10, 2005) Ivan (Landfall: September 16, 2004) 80% 70% percent 60% 50% 40% 30% 20% 10% 0% Landfall Source: Minerals Management Service
17 Number of Natural Gas Processing Facilities Out Capacity 2004 as of Average Plant Location Jan 1, 2005 Throughput Status (as of September 10) (MMcf/d) Duke Energy Bay, AL available for service, but waiting on pipeline outlet for liquids BP Pascagoula, MS 1, power restored. waiting for pipelines to deliver gas Dynegy Venice, LA 1, seawater damage. Could take 3-6 months to repair Dynegy Yscloskey, LA 1,850 1,343 seawater damage. Could take 3-6 months to repair Enterprise Prod. Toca, LA 1, assessment ongoing ExxonMobil Garden City, LA 630 n.a. waiting on power ExxonMobil Grand Isle, LA waiting on power Marathon Burns Point, LA waiting on power Source: Energy Information Administration, Department of Energy

18 Capline Colonial - Plantation
19 Power Outages Number of Customers State Outage Data August 30, 2005 (as of 3 PM) Number of Percent of Customers Total Customers State without Power Customers without Power Alabama 624,427 2,339,004 27% Florida 194,856 9,075,577 2% Georgia 12,500 4,156,052 0% Louisiana 890,294 2,130,925 42% Mississippi 909,173 1,420,571 64% Total 2,631,250 19,122,129 14% Source: Energy Information Administration, Department of Energy
20 Power Outages Generating Stations Nameplate Company Power Plant Location Capacity (MW) Entergy Louisiana Ninemile Point Westwego, LA 2,142 Entergy Louisiana Baxter Wilson Vicksburg, MS 1,328 Entergy New Orleans Michoud New Orleans, LA 959 Entergy New Orleans AB Patterson 3 & 4 New Orleans, LA 133 Mississippi Power Daniel Escatawpa 1,064 Mississippi Power Watson Gulfport, MS 1,012

21 Power Outages Generating Stations Entergy Patterson Source: Entergy

22 Power Outages Substation Damage Source: Entergy

23 Petrochemical Facilities Impacted by Katrina

24 Shell Mars Tension Leg Platform Source: Shell.com

25 Ocean Warwick Dauphin Island, AL

26 Semi-Sub Stuck Under Bridge North Mobile Bay

27 Venice Port, Supply & Crew Bases

28 Chevron Refinery Pascagoula, MS
29 Then, Along Comes Rita

30 Platforms/Structures Impacted by Rita
31 Rig Damage Assessment Year Status / Operator Rig Name Rig Type Built Notes Major Damage Chevron GSF Adriatic VII Jackup 1983 Ran aground in shallow waters offshore Louisiana; severe damage Res Tech./ADTI GSF High Island III Jackup 1980 Ran aground in shallow waters offshore Louisiana; severe damage Arena/ADTI Noble Joe Alford Submersible 1982 Drifted approx. 8 miles. Damage comprised of bent or broken support members below the hull Drifted 123 miles. Principal damage is large hole in starboard outboard BHP Billiton Noble Max Smith Semisub 1999 column, a crossover deck, and the main deck outboard of an anchor winch. The hull apparently detached from its legs and is aground offshore Newfield Rowan Louisiana Jackup 1975 Louisiana. Minor Damage LLOG Ocean Saratoga Semisub 1976 Rig grounded in 35' of water on Vermilion 111. Kerr McGee Ocean Star Semisub 1974 Rig grounded in 35' of water in Eugene Island 142. ExxonMobil ENSCO 68 Jackup 1976 Drill floor shifted. Energy Resource Technology ENSCO 69 Jackup 1976 Skid-off drilling package shifted on the oil company platform. Apache ENSCO 90 Jackup 1982 Rig is listing on location at South Marsh 130. Chevron Hercules 21 Jackup Rig listing on Main Pass 41. Rig sumberged on location; water damage to the electrical, power, mud Petroquest Barge 300 Inland Barge pump and other systems. Windows in the pilot house and quarters blown out; water damage to Nabors Offshore Dolphin 111 Jackup 1982 control systems and the quarters. Mast was blown over but Nabors has a substitute mast available and Houston Exploration Pool 54 Jackup 1982 should be able to return the rig to service in a few weeks. Broke some mooring lines, remaining lines holding the unit in position Petrobras Noble Lorris Bouzigard Semisub 1975 approximately 0.8 of a mile off its original location. Adrift Kerr McGee Noble Amos Runner Semisub 1999 Rig drifted 75 miles off location. Anadarko Noble Paul Romano Semisub 1998 Rig Drifted 118 miles off location. Chevron Noble Therald Martin Semisub 1977 Rig drifted 89 miles off location Hunt Rowan Fort Worth Jackup 1978 Unable to locate rig. Remington O&G Rowan Halifax Jackup 1982 Rig drifted off pre-storm location. Remington O&G Rowan Odessa Jackup 1976 Rig moved off pre-storm location. Shell Deepwater Nautilus Semisub 2000 Moved 40 miles south of pre-storm location. BP Transocean Marianas Semisub 1998 Moved 130 miles norwest of pre-storm location Source: Rigzone.com
32 Shut-in Statistics Crude Oil Percent Rita Percent Total Percent Shut-in of Daily Cumulative of Annual Cumulative of Annual Oil GOM Oil Shut-in Oil GOM Oil Shut-in Oil GOM Oil Date Production Production Production Production Production 1 Production (bbls/day) (%) (bbls) (%) (bbls) (%) 20-Sep , % 877, % 26,000, % 21-Sep-05 1,097, % 1,974, % 27,104, % 22-Sep-05 1,379, % 3,353, % 28,483, % 23-Sep-05 1,486, % 4,840, % 30,280, % 24-Sep-05 1,500, % 6,341, % 31,781, % 25-Sep-05 1,501, % 7,843, % 33,283, % 26-Sep-05 1,527, % 9,370, % 34,811, % 27-Sep-05 1,512, % 10,883, % 36,361, % 28-Sep-05 1,511, % 12,395, % 37,881, % 29-Sep-05 1,478, % 13,874, % 39,360, % 30-Sep-05 1,467, % 15,341, % 40,828, % 3-Oct-05 1,391, % 1,391, % 45,119, % 4-Oct-05 1,349, % 2,741, % 46,457, % 5-Oct-05 1,299, % 4,041, % 47,756, % 6-Oct-05 1,202, % 5,243, % 48,959, % 7-Oct-05 1,162, % 6,406, % 50,105, % 11-Oct-05 1,062, % 1,062, % 54,557, % Note: 1 cumulative production is as of August 26, 2005 Source: Minerals Management Service
33 Rita versus Other Major Hurricanes Shut-in Oil Production 1,800 1,600 Rita (Landfall: September 24, 2005) Katrina (Landfall: August 29, 2005) Dennis (Landfall: July 10, 2005) Ivan (Landfall: September 16, 2004) 1,400 thousand bbls per day 1,200 1, Landfall Source: Minerals Management Service
34 Rita versus Other Major Hurricanes - Shut-in Oil Production as a Percent of Daily GOM Production 100% 90% Rita (Landfall: September 24, 2005) Katrina (Landfall: August 29, 2005) Dennis (Landfall: July 10, 2005) Ivan (Landfall: September 16, 2004) 80% 70% percent 60% 50% 40% 30% 20% 10% 0% Landfall Source: Minerals Management Service
35 Refineries Shutdown Due to Rita Barrels Plant Location per Day Louisiana Plants 1 Calcasieu Refining Lake Charles 30,000 6 Citgo Petroleum Lake Charles 324,300 8 ConocoPhillips Westlake 239, Valero Energy Krotz Springs 80,000 Texas Plants 1 Fina Oil and Chemical Co Pasadena 80,000 2 Valero Refining Co Texas City 90,000 3 Exxon Coal USA Baytown 75,000 4 BP Amoco Corp Texas City 84,000 5 Lubrizol Corp Deer Park 80,000 6 Motiva Enterprises Port Arthur 59,000 7 Mobil Oil Corp Beaumont 82, Lyondell-Citgo Refining Houston 99, Shell Oil Co Deer Park 88, Lubrizol Corp Pasadena 80, Premcor Refining Group Port Arthur 100, Marathon Ashland Petroleum Texas City 96, Sartomer Co Inc Houston 100, Valero Refining Houston 92, Fina Oil and Chemical Co Port Arthur 85, Phillips Petroleum Old Ocean 100,000

36 Crude and Product Pipelines Impacted by Rita
37 Total Immediate Refinery Impact Port Arthur/Lake Charles (shutdowns and damaged facilities) 1,715 thousand bbls/day 10% of US operating capacity Houston/Texas City (shutdowns and damaged facilities) 2,292 thousand bbls/day 13.5% of US operating capacity Corpus Christi (shutdown and reduced runs) 706 thousand bbls/day 4% of US operating capacity Remaining US Operating Capacity 11,954 thousand bbls/day 70% of US operating capacity Midwest (reduced runs from supply loss) 338 thousand bbls/day 2% of US operating capacity Total Refinery Impact 5,052 thousand bbls/day 30% of US operating capacity Source: Energy Information Administration, Department of Energy
38 Shut-in Statistics Natural Gas Percent Rita Percent Total Percent Shut-in of Daily Cumulative of Annual Cumulative of Annual Natural Gas GOM Gas Shut-in Gas GOM Gas Shut-in Gas GOM Gas Date Production Production Production Production Production 1 Production (MMcf/day) (%) (MMcf) (%) (Bcf) (%) 20-Sep-05 3, % 3, % % 21-Sep-05 4, % 8, % % 22-Sep-05 6, % 14, % % 23-Sep-05 7, % 21, % % 24-Sep-05 7, % 29, % % 25-Sep-05 8, % 37, % % 26-Sep-05 7, % 45, % % 27-Sep-05 7, % 53, % % 28-Sep-05 8, % 61, % % 29-Sep-05 7, % 69, % % 30-Sep-05 7, % 77, % % 3-Oct-05 7, % 7, % % 4-Oct-05 7, % 14, % % 5-Oct-05 6, % 21, % % 6-Oct-05 6, % 28, % % 7-Oct-05 6, % 34, % % 11-Oct-05 6, % 6, % % Note: 1 cumulative production is as of August 26, 2005 Source: Minerals Management Service
39 Rita versus Other Major Hurricanes Shut-in Natural Gas Production 10 9 Rita (Landfall: September 24, 2005) Katrina (Landfall: August 29, 2005) Dennis (Landfall: July 10, 2005) Ivan (Landfall: September 16, 2004) 8 7 bcf per day Landfall Source: Minerals Management Service
40 Rita versus Other Major Hurricanes - Shut-in Gas Production as a Percent of Daily GOM Production 100% 90% 80% Rita (Landfall: September 24, 2005) Katrina (Landfall: August 29, 2005) Dennis (Landfall: July 10, 2005) Ivan (Landfall: September 16, 2004) 70% percent 60% 50% 40% 30% 20% 10% 0% Landfall Source: Minerals Management Service
41 Number of Natural Gas Processing Facilities Out Potential Impacts on GOM Gas Supply from Processing Facility Outages Number of Facilities Capacity (MMcf/d) Throughput (MMcf/d) Katrina Facilities (Central GOM) 4 4,250 2,948 Rita Facilities (Western GOM) Cameron Facilities 6 2,155 1,231 Vermillion Facilities 3 1, Total Rita Impacts 9 3,625 2,005 Total (All Katrina and Rita) 7,875 4,953 Assume GOM Gas Production 10,000 10,000 Percent of Total (Katrina + Cameron Only) 64% 42% Percent of Total (Katrina + Cameron & Vermillion) 79% 50% Source: Energy Information Administration, Department of Energy

42 Gas Processing Facilities Impacted by Rita
43 Power Outages - Number of Customers as of September 26, 2005 Number of Percent of Customers Customers State without Power without Power Arkansas 11,137 n.a. Louisiana 539,647 32% Mississippi 7,383 n.a. Texas 707,757 7% Note: Arkansas and Mississippi outages are for Entergy customers only. Source: Energy Information Administration, Department of Energy
44 Power Outages from Rita Generating Stations Plant Unit Capability (MW) Fuel Type Status as of Storm Peak Toledo Bend 1 40 Hydro Outage Toledo Bend 2 40 Hydro Outage Roy S. Nelson Gas/Oil Outage Roy S. Nelson Gas/Oil Outage Roy S. Nelson Gas/Oil Operating but disconnected Roy S. Nelson Gas/Oil Outage Roy S. Nelson Coal Outage Sabine Gas/Oil Outage Sabine Gas/Oil Outage Sabine Gas/Oil Outage Sabine Gas/Oil Outage Sabine Gas/Oil Outage Source: Entergy.com

45 Petrochemical Facilities Impacted by Rita

46 Henry Hub, September 25, 2005 Source: LIOGA

47 Entergy Transmission Source: Entergy.com


48 Single Well Caisson Western GOM Source: MMS


49 Natural Gas Pipeline Leak Source: MMS


50 Chevron Typhoon TLP
51 Longer Run Impacts of Hurricanes Katrina and Rita
52 Estimated Decrease in Refining Production from both Katrina and Rita 6,000 Refining capacity should return to normal soon, but there will be a stubborn five percent of total capacity that has unknown return date not good for tight markets 100% 5,000 Total Lost Production Lost Production as a Percent of US Total Capacity 90% 80% thousand bbls per day 4,000 3,000 2,000 70% 60% 50% 40% 30% percent of US capacity 1,000 20% 10% 0 0% Landfall Source: Assumes 95 percent capacity factor; assumes 4 week recovery for facilities damaged by Rita.
53 Cumulative Refining Production 4,000 3,500 Impacts of Katrina result in a loss of million barrels, or 4 percent of total production, by the end of the year. Impacts of Katrina and Rita result in a loss of million barrels, or over 5 percent of total, by the end of the year. Cumulative Production - Business as Usual Cumulative Production - After Katrina Cumulative Production - After Katrina and Rita 3,000 2,500 million bbls 2,000 1,500 1, Jun-05 Jul-05 Aug-05 Sep-05 Oct-05 Nov-05 Dec-05 Source: Assumes 95 percent capacity factor
54 Estimated Return of Existing Crude Production 1,800 1,600 If crude production returns follow path similar to Ivan, we could still be experiencing production shut-ins for some time. 100% 90% thousand bbls per day 1,400 1,200 1, % 70% 60% 50% 40% 30% 20% percent of daily GOM production (%) % 0 Landfall Ivan Katrina Rita days after landfall % of Daily GOM Production - Ivan % of Daily GOM Production - Katrina % of Daily GOM Production - Rita 0% Note: Assuming recovery of 2,685 barrels per day for remaining days.
55 Forecast versus New Forecast Crude Oil 6 5 million barrels per day EIA Short-Term Outlook Outlook after Katrina Outlook after Rita Q Q Q Q Q Q Note: Assuming recovery of bcf per day for 150 days.
56 Estimated Return of Existing Natural Gas Production 10 9 If natural gas production returns follow path similar to Ivan, we could still be experiencing production shut-ins for some time. 100% 90% bcf per day % 70% 60% 50% 40% 30% 20% Percent of Daily GOM Production (%) 1 10% 0 Landfall Ivan Katrina Rita % of Daily GOM Production - Ivan % of Daily GOM Production days - Katrina after landfall % of Daily GOM Production - Rita 0% Note: Assuming recovery of bcf per day for remaining days.
57 Forecast versus New Forecast Natural Gas 6 5 EIA Short-Term Outlook Outlook after Katrina Outlook after Rita 4 tcf Q Q Q Q Q Q Note: Assuming recovery of bcf per day for 150 days.
58 Estimated Decrease in Natural Gas Storage Using 5-Year Average Using 2005 Average Weekly Injection Weekly Injection Katrina Katrina Katrina and Rita Katrina and Rita (Bcf) (Bcf) Current Natural Gas Storage Amount: (stocks as of September 30, 2005) 2,929 2,929 2,929 2,929 Total Remaining Injection Amount: (from September 30, 2005) Estimated Storage Level, Nov. 1: 3,169 3,169 3,111 3,111 Estimated Lost Natural Gas Production (Sep 30-Nov 1): Estimated Natural Gas Production (Sep 30-Nov 1): 1,581 1,498 1,581 1,498 Estimated Natural Gas Consumption (Sep 30-Nov 1): 1,406 1,406 1,406 1,406 Balance after Consumption Difference between Injection Amount and Balance (65) (149) (7) (91) Estimated Storage Level, Nov 1 (Corrected): 3,104 3,020 3,104 3,020

59 Price Outlook
60 Forecast for Energy Commodity Prices Natural Gas Futures $16 $ Actual Futures $12 $10 $ per Mcf $8 $6 $4 $2 $0 Nov Dec Jan Feb Mar Apr May Jun Jul Aug Sep Oct Note: Prices recorded on October 11, 2005 Source: Federal Reserve Bank of St. Louis; and Nymex.com
61 Forecast for Energy Commodity Prices Heating Oil Futures $ $ $ per Mcf $ $ $50.00 $0.00 Nov-05 Dec-05 Jan-06 Feb-06 Mar-06 Apr-06 May-06 Jun-06 Jul-06 Aug-06 Sep-06 Oct-06 Note: Prices recorded on October 11, 2005 Source: Energy Information Administration, Department of Energy; and Nymex.com
62 Industrial Natural Gas Usage, Expenditures and Taxes Estimated Estimated Taxable Estimated Sector Usage Natural Gas Usage Natural Gas Expenditures Natural Gas Taxes Shares (%) (MMcf) ($ 000) ($ 000) 20 Food and Kindred Products 0.8% 6,513 6,578 $ 86,132 $ 67,259 $ 3,273 $ 2, Textile Mill Products 0.2% 1,346 1,359 $ 17,798 $ 13,898 $ 676 $ Apparel & Textile Products 0.0% $ 272 $ 212 $ 10 $ 8 24 Lumber and Wood Products 0.5% 3,944 3,984 $ 52,164 $ 40,734 $ 1,982 $ 1, Paper and Allied Products 4.0% 33,347 33,680 $ 441,014 $ 344,382 $ 16,759 $ 13, Printing & Publishing 0.0% $ 709 $ 554 $ 27 $ Chemicals and Allied Products 83.0% 689, ,629 $ 7,705,935 $ 6,017,476 $ 292,826 $ 228, Petroleum and Coal Products 10.2% 84,390 85,234 $ 1,116,061 $ 871,519 $ 42,410 $ 33, Rubber & Misc. Plastic Prods. 0.0% $ 4,396 $ 3,432 $ 167 $ Stone, Clay & Glass Products 0.4% 3,740 3,777 $ 49,460 $ 38,623 $ 1,879 $ 1, Primary Metal Industries 0.5% 4,165 4,207 $ 55,084 $ 43,014 $ 2,093 $ 1, Fabricated Metal Products 0.1% 1,063 1,073 $ 14,055 $ 10,976 $ 534 $ Machinery & Computer Equip. 0.0% $ 3,318 $ 2,591 $ 126 $ Electric & Electronic Equip. 0.1% $ 7,624 $ 5,954 $ 290 $ Transportation Equipment 0.2% 1,845 1,863 $ 24,399 $ 19,053 $ 927 $ Instruments & Related Products 0.0% 6 6 $ 84 $ 65 $ 3 $ 2 39 Misc. Manufacturing Industries 0.0% 3 3 $ 37 $ 29 $ 1 $ 1 Total 100.0% 831, ,641 $ 9,578,541 $ 7,479,772 $ 363,985 $ 284,231
63 Energy Market Outlook Fall Signal Winter Signal Overall 6 Months (Sep-Oct) (Nov-Mar) Bullish, weather and supply concerns Bullish, weather and supply concerns -- daily super spikes probable Bullish, low injections set up chornic tight market conditions -- potential lows going into next injection season. Range: Range: Range: Short term (September-October) weather futures prices are bullish for natural gas in the South and West, but neutral in the East and Midwest Forecast of $58 to $70 crude through the end of Refining capacity challenges will keep pressure on prices. Diminishing natural gas surpluses especially in the aftermath of Katrina and Rita. Storage forecasts call into question the supply adequacy heading into the winter season given our preliminary winter assessments. Katrina and Rita impacts felt until next hurricane season.
64 November March HDD Seasonal Strips % Difference 10 Year from 10-Year City Market Average Average Atlanta % Boston % Cleveland Cincinnati % Denver Dallas % Houston % Kansas City % Tuscon % Source: First Enercast Financial
65 November March HDD Forecast % Difference 10-Year from 10-Year Region Market Average Average Northeast % Midwest % South % West % Average % Source: First Enercast Financial

66 Future CES Events to Note
67 Questions, Comments, & Discussion
Impacts of Recent Hurricanes and the Outlook for Energy Markets
 Impacts of Recent Hurricanes and the Outlook for Energy Markets Presentation to Baton Rouge Rotary Club November 8, 2005 David E. Dismukes Center for Louisiana State University Summary on Impacts of Hurricanes
Hurricane Gustav & Ike Impacts to U.S. Petroleum Supply and Infrastructure Jeremy J. Cusimano Office of Petroleum Reserves Washington, DC
 Click to edit Master title style Hurricane Gustav & Ike Impacts to U.S. Petroleum Supply and Infrastructure Jeremy J. Cusimano Office of Petroleum Reserves Washington, DC Hurricane Gustav and Ike Impacts
CRS Report for Congress
 Order Code RS22233 Updated September 6, 2005 CRS Report for Congress Received through the CRS Web Oil and Gas: Supply Issues After Katrina Robert L. Bamberger and Lawrence Kumins Resources, Science, and
Petroleum and Natural Gas Situation
 Petroleum and Natural Gas Situation John C. Felmy Chief Economist and Director Statistics Department American Petroleum Institute Felmyj@api.org www.api.org www.gasolineandyou.org www.naturalgasfacts.org
U.S. GASOLINE AND DISTILLATE FUELS UPDATE - DECEMBER 20, 2017
 U.S. GASOLINE AND DISTILLATE FUELS UPDATE - DECEMBER 20, 2017 PRICE TRENDS Monday, December 18 According to the Energy Information Administration (EIA), the average U.S. retail price for regular grade
Appendix B. OSHA Carcinogen Air Emissions (1999, 2003, and 2004)
") Appendix B OSHA Carcinogen Air Emissions (1999, 2003, and 2004) OSHA Carcinogen Air Emissions (1999) Row # Facility OSHA Carcinogen Fugitive Air Emissions OSHA Carcinogen Stack Emissions Total OSHA Carcinogen
Appendix B OSHA Carcinogen Air Emissions (1999, 2003, and 2004) OSHA Carcinogen Air Emissions (1999) Row # Facility OSHA Carcinogen Fugitive Air Emissions OSHA Carcinogen Stack Emissions Total OSHA Carcinogen
A summary of national and global energy indicators. FEDERAL RESERVE BANK of KANSAS CITY
 THE U.S. Energy DATABOOK A summary of national and global energy indicators JULY 1, 17 FEDERAL RESERVE BANK of KANSAS CITY SUMMARY OF CURRENT ENERGY CONDITIONS The number of total active drilling rigs
ENERGY SLIDESHOW. Federal Reserve Bank of Dallas
 ENERGY SLIDESHOW Updated: January 16, 2019 ENERGY PRICES www.dallasfed.org/research/energy Brent & WTI & Crude Brent Oil Crude Oil Dollars per barrel 140 120 100 Brent (Jan 11 = $58.64) WTI (Jan 11 = $50.78)
Emerging Trends in Petroleum Markets
 Emerging Trends in Petroleum Markets For Defense Logistics Agency, Worldwide Energy Conference Washington, D.C. By T. Mason Hamilton, Petroleum Markets Analyst U.S. Energy Information Administration Independent
ENERGY SLIDESHOW. Federal Reserve Bank of Dallas
 ENERGY SLIDESHOW Updated: March 13, 2018 ENERGY PRICES www.dallasfed.org/research/energy Brent & WTI & Crude Brent Oil Crude Oil Dollars per barrel 140 Brent (Mar 9 = $65.12) WTI (Mar 9 = $61.65) 120 100
TRAFFIC VOLUME TRENDS July 2002
 TRAFFIC VOLUME TRENDS July 2002 Travel on all roads and streets changed by +2.3 percent for July 2002 as compared to July 2001. Estimated Vehicle-Miles of Travel by Region - July 2002 - (in Billions) West
05/17/2011
 RETAIL DIESEL FUEL OUTLOOK A Fundamental Petroleum Trends Weekly Report Lehi German Tel: 816.505.0980 www.fundamentalpetroleumtrends.com Tuesday, May 17, 2011 Diesel Fuel Price Trends U.S. retail diesel
THE PARTNERSHIP OF RAIL & COAL MOVING AHEAD 2014 RMCMI ANNUAL MEETING SEPTEMBER 19, 2014
 THE PARTNERSHIP OF RAIL & COAL MOVING AHEAD 2014 RMCMI ANNUAL MEETING SEPTEMBER 19, 2014 1 BNSF is a Leading U.S. Railroad A Berkshire Hathaway company 32,500 route miles in 28 states and two Canadian
NPRA United States Refining and Storage Capacity Report
 Refining Capacity Report January 1, 2009 NPRA United States Refining and Storage Capacity Report Published August 2009 Refining Capacity Report January 1, 2009 Locations of U.S. Refineries 2009 PADD V
TRAFFIC VOLUME TRENDS
 Page 1 U. S. Department Transportation Federal Highway Administration Office Highway Policy Information TRAFFIC VOLUME TRENDS September Travel on all roads and streets changed by +2.5 (5.8 billion vehicle
The following events were obtained from the Department of Energy (DOE) website:
 website:") Refinery Events October 2, 2013 October 10, 2013 The following events were obtained from the Department of Energy (DOE) website: Lima Energy to Supply 22,000 b/d of Synthetic Crude Oil to Husky s Lima
Refinery Events October 2, 2013 October 10, 2013 The following events were obtained from the Department of Energy (DOE) website: Lima Energy to Supply 22,000 b/d of Synthetic Crude Oil to Husky s Lima
Weekly Fuel Monitor Update
 May 1, 2006 DISTILLATES AND DIESEL UPDATE NYMEX heating oil futures settled higher Friday amid concerns about world supply disruptions given ongoing militant activity in Nigeria that is cutting into supplies
Diesel prices finally ease Winter weather and international events could determine your fuel bill for 2018 By Bryce Knorr, senior grain market analyst
 Diesel prices finally ease Winter weather and international events could determine your fuel bill for 2018 By Bryce Knorr, senior grain market analyst After rallying to their highest level in nearly three
NEWS Release. U.S. Manufacturing Technology Orders. Year-to-date U.S. manufacturing technology orders up 4.1% over 2011
 U.S. Manufacturing Technology Orders A statistical program of AMT NEWS Release FOR RELEASE: October 8, 2012 Contact: Pat McGibbon, AMT, 703-827-5255 Year-to-date U.S. manufacturing technology orders up
High fuel costs could last Diesel and propane may not get much cheaper in 2019 By Bryce Knorr, senior grain market analyst
 High fuel costs could last Diesel and propane may not get much cheaper in 2019 By Bryce Knorr, senior grain market analyst In July I recommended using a dip in the energy market to lock in propane for
Refining Trends and Outlook
 Refining Trends and Outlook Presented by: Greg Kort, P.E., ASA 2018 TXOGA PROPERTY TAX REPRESENTATIVES ANNUAL CONFERENCE March 7, 2018 www.ryan.com Agenda Hurricane Harvey Tax Cuts and Jobs Act of 2017
Thursday, March 6, 2014 Houston, TX. 8:30 9:40 a.m. AN ECONOMIST S-EYE VIEW OF THE ENERGY INDUSTRY: HYDROCARBON HAT TRICK
 Thursday, March 6, 214 Houston, TX 8:3 9:4 a.m. AN ECONOMIST S-EYE VIEW OF THE ENERGY INDUSTRY: HYDROCARBON HAT TRICK Presented by Jesse Thompson Business Economist Federal Reserve Bank of Dallas, Houston
North American Storage and Transportation Trends
 North American Storage and Transportation Trends Brian Busch Director, Oil Markets and Business Development www.genscape.com 2016 Genscape Incorporated. All rights reserved. What we do 2 Current State
Diesel prices at multi-year highs mean pain at the pump
 Diesel prices at multi-year highs mean pain at the pump Conflicting signals from Wall Street keep commodity prices unsettled By Bryce Knorr, senior grain market analyst Headline news this week provided
Energy Outlook. U.S. Energy Information Administration. For EnerCom Dallas February 22, 2018 Dallas, TX
 Energy Outlook For EnerCom Dallas Dallas, TX Jeff Barron Industry Economist, U.S. Energy Information Administration U.S. Energy Information Administration Independent Statistics & Analysis www.eia.gov
NEU Electric and Natural Gas Price Update
 $ / MWH Jan-11 May-11 Sep-11 Sep-12 Jan-13 Electric: Short-Term Outlook The NYMEX Northern Illinois Hub 12-month forward price at the end of August 2016 for the September 2016 to August 2017 period was
COQG-Crude Oil Quality Group Meeting San Antonio October 23, Thunder Horse and Southern Green Canyon
 COQG-Crude Oil Quality Group Meeting San Antonio October 23, 2008 Thunder Horse and Southern Green Canyon THUNDER HORSE THUNDER HORSE Platform design: semi-submersible Dimension: (ft) 455 x 344 Topsides:
Alabama - Goodway Refining LLC Atmore 4,100 Hunt Refining Co Tuscaloosa 36,000 Shell Chemical LP Saraland 86,500
 This database has two primary purposes: 1) to list the vital information on current permitting actions for the expansions of existing refineries and construction of new oil refineries in the United States
May 2018 Short-Term Energy Outlook
 May 2018 for Williston Basin Petroleum Conference Bismarck, N.D. by Dr. Linda Capuano Administrator U.S. Energy Information Administration Independent Statistics & Analysis www.eia.gov Brent crude oil
NPRA Safety Awards Dinner. National Petrochemical & Refiners Association. Billy Bob s Texas Fort Worth, TX. Wednesday, May 11, 2011.
 National Petrochemical & Refiners Association Billy Bob s Texas Fort Worth, TX Safety Wednesday, May 11, 2011 NPRA Safety Awards Dinner Congratulations! NPRA congratulates all of this year s award recipients.
Monthly Report on the Corporate Goods Price Index ( Preliminary Figures for August 2014 )
") Research and Statistics Department Bank of Japan Report on the Corporate Goods Price The Producer Price fell 0.2 percent from the previous. The Export Price (contract currency ) rose 0.1 percent from the
Research and Statistics Department Bank of Japan Report on the Corporate Goods Price The Producer Price fell 0.2 percent from the previous. The Export Price (contract currency ) rose 0.1 percent from the
Revised July 17, 2017
 Revised July 17, 2017 ISM Manufacturing Purchasing Managers Index (June 2016 June 2017) 66 64 62 60 58 56 54 52 50 48 46 Jun-16 Jul Aug Sept Oct Nov Dec Jan-17 Feb Mar Apr May Jun Purchasing Managers'
Macroeconomic Outlook. Presented by Dr. Bruce A. Scherr Chairman of the Board Chief Executive Officer Emeritus
 Macroeconomic Outlook Presented by Dr. Bruce A. Scherr Chairman of the Board Chief Executive Officer Emeritus Waterways Symposium Cincinnati, OH November 15-17, 2016 Topics Energy Macro Implications Inflation
The Changing Relationship Between the Price of Crude Oil and the Price At the Pump
 In 2007, what goes up, does not necessarily come down... May 3, 2007 The Changing Relationship Between the Price of Crude Oil and the Price At the Pump Prepared by: Tim Hamilton Petroleum Industry Consultant
GoToBermuda.com. Q3 Arrivals and Statistics at September 30 th 2015
 Q3 Arrivals and Statistics at September 30 th 2015 1 Q3 Total Vacation Visitor Arrivals Q3 Arrivals 2014 2015 YTD 2014 YTD 2015 Air - Vacation 54,305 54,473 0.31% 168 117,639 116,700-0.80% (939) Cruise
Rice Global E&C Forum August 9, 2013
 Rice Global E&C Forum August 9, 2013 Midyear Forecast: July 1, 2013 Conglin Xu, Senior Editor-Economics Laura Bell, Statistics Editor Alan Petzet, Chief Editor-Exploration Forecast & Review: Jan. 7, 2013
WEEKLY REFINING INDICATORS REPORT WEEK ENDING 06/17/2016
 WEEKLY REFINING INDICATORS REPORT WEEK ENDING 06/17/2016 Blake Fernandez, Analyst 713.393.4524 blakef@howardweil.com Quick Take: Somewhat bearish stats on the refining side as we had hoped for some gasoline
MARKET RATES UPDATE Paula Gold-Williams Cory Kuchinsky
 MARKET RATES UPDATE I N T R O D U C T I O N BY: Paula Gold-Williams President & Chief Executive Officer (CEO) P R E S E N T E D BY: Cory Kuchinsky Interim Vice President, Financial Services September 24,
Gas & electricity - at a glance
 $/barrel /tco 2 e p/therm /MWh Gas & electricity - at a glance Week-on-Week Annual Gas Price Changes Short-term gas contracts jump Cold snap forecast for the first half of February, lifting demand Longer-dated
Monthly Report on the Corporate Goods Price Index ( Preliminary Figures for November 2018 )
") Research and Statistics Department Bank of Japan Report on the Corporate Goods Price Index The Producer Price Index fell 0.3 percent from the previous. The Export Price Index (contract currency ) fell
Research and Statistics Department Bank of Japan Report on the Corporate Goods Price Index The Producer Price Index fell 0.3 percent from the previous. The Export Price Index (contract currency ) fell
The Shifting Ground in US Crude Markets. Houston, TX April 15, 2013
 The Shifting Ground in US Crude Markets Houston, TX April 15, 2013 Agenda Will production growth in Texas, Bakken, etc. overwhelm domestic demand? New Markets Eagle Ford, Permian to the USGC, Bakken to
Commercial-in-Confidence Ashton Old Baths Financial Model - Detailed Cashflow
 Year 0 1 2 3 4 5 6 7 8 9 10 11 12 13 Oct-16 Nov-16 Dec-16 Jan-17 Feb-17 Mar-17 Apr-17 May-17 Jun-17 Jul-17 Aug-17 Sep-17 Oct-17 2,038 2,922 4,089 4,349 6,256 7,124 8,885 8,885 8,885 8,885 8,885 8,885 9,107
NJ Solar Market Update
 NJ Solar Market Update April 16, 20 Renewable Energy Committee Meeting Trenton, NJ Prepared by Charlie Garrison Solar Installed Capacity Data The preliminary installed solar capacity as of 3/31/ is approximately
Monthly Report on the Corporate Goods Price Index ( Preliminary Figures for June 2014 )
") Research and Statistics Department Bank of Japan Report on the Corporate Goods Price The Producer Price rose 0.2 percent from the previous. The Export Price (contract currency ) fell 0.1 percent from the
Research and Statistics Department Bank of Japan Report on the Corporate Goods Price The Producer Price rose 0.2 percent from the previous. The Export Price (contract currency ) fell 0.1 percent from the
Monthly Report on the Corporate Goods Price Index ( Preliminary Figures for February 2018 )
") Research and Statistics Department Bank of Japan Report on the Corporate Goods Price Index The Producer Price Index was und from the previous. The Export Price Index (contract currency ) rose 0.4 percent
Research and Statistics Department Bank of Japan Report on the Corporate Goods Price Index The Producer Price Index was und from the previous. The Export Price Index (contract currency ) rose 0.4 percent
Section 5. Crude Oil and Natural Gas Resource Development
 Section 5. Crude Oil and Natural Gas Resource Development The September 4 rotary rig count was 1,4, slightly higher than the count in August 4 and 13 percent higher than the count in September 3. Of the
Outlook for Franchised New Car Dealers
 1 Outlook for Franchised New Car Dealers Fourteenth Annual Automotive Outlook Symposium June 1, 2007 Paul Taylor, Ph.D., Chief Economist National Automobile Dealers Association, McLean, VA www.nada.org
Monthly Biodiesel Production Report
 Monthly Biodiesel Production Report With data for June 2017 August 2017 Independent Statistics & Analysis www.eia.gov U.S. Department of Energy Washington, DC 20585 This report was prepared by the U.S.
Monthly Report on the Corporate Goods Price Index ( Preliminary Figures for July 2015 )
") Research and Statistics Department Bank of Japan Report on the Corporate Goods Price The Producer Price fell 0.2 percent from the previous. The index excluding extra charges for summer electricity fell
Research and Statistics Department Bank of Japan Report on the Corporate Goods Price The Producer Price fell 0.2 percent from the previous. The index excluding extra charges for summer electricity fell
Monthly Report on the Corporate Goods Price Index ( Preliminary Figures for November 2017 )
") Research and Statistics Department Bank of Japan Report on the Corporate Goods Price Index The Producer Price Index rose 0.4 percent from the previous. The Export Price Index (contract currency ) rose
Research and Statistics Department Bank of Japan Report on the Corporate Goods Price Index The Producer Price Index rose 0.4 percent from the previous. The Export Price Index (contract currency ) rose
It s time to start buying propane for fall Expect to pay more to dry 2017 corn crop By Bryce Knorr, senior grain market analyst
 It s time to start buying propane for fall Expect to pay more to dry 2017 corn crop By Bryce Knorr, senior grain market analyst It s the end of winter hopefully and that means it s a good time to buy coats,
Monthly Report on the Corporate Goods Price Index ( Preliminary Figures for October 2014 )
") Research and Statistics Department Bank of Japan Report on the Corporate Goods Price The fell 0.8 percent from the previous. The index excluding extra charges for summer electricity fell 0.6 percent from
Research and Statistics Department Bank of Japan Report on the Corporate Goods Price The fell 0.8 percent from the previous. The index excluding extra charges for summer electricity fell 0.6 percent from
Port Botany. Trade Statistics Bulletin 1 July June 2018
 Port Botany Trade Statistics Bulletin 1 July 2017 30 June 2018 FY 2017/18 Port Botany Container Trade Jul 2017 Aug 2017 Sep 2017 Oct 2017 Nov 2017 Dec 2017 Jan 2018 Feb 2018 Mar 2018 Apr 2018 May 2018
Ministério de Minas e Energia. Minister Eduardo Braga. Brazil - Texas Chamber of Commerce - BRATECC May/2015
 1 Minister Eduardo Braga Brazil - Texas Chamber of Commerce - BRATECC May/2015 2 3 World s 7 th largest economy; Investment grade Fiscal adjustment taking place; Inflation being controlled; Large and diversified
Monthly Report on the Corporate Goods Price Index ( Preliminary Figures for October 2017 )
") Research and Statistics Department Bank of Japan Report on the Corporate Goods Price Index FOR RELEASE 8:50 A.M. Monday, November 13, 2017 The Producer Price Index rose 0.3 percent from the previous. The
Research and Statistics Department Bank of Japan Report on the Corporate Goods Price Index FOR RELEASE 8:50 A.M. Monday, November 13, 2017 The Producer Price Index rose 0.3 percent from the previous. The
For Region 5 and Region 7 Regional Response Teams Meeting April 22, 2015 St. Charles, Missouri via video/teleconference
 For Region 5 and Region 7 Regional Response Teams Meeting St. Charles, Missouri via video/teleconference By Grant Nülle, Upstream Oil & Gas Economist, Exploration and Production Analysis Team U.S. Energy
NEU Electric and Natural Gas Price Update
 Exelon s $24 Billion Energy Bill Senate Bill 2814 Short-Term Energy Price Outlook On November 15, 2016, Exelon, through its legislative supporters, introduced Senate Bill 2814, a massive 446 page document
January 24, *updated PADD1 / East Coast. PADD2 / Midwest
 January 24, 2018 *updated PADD1 / East Coast PBF Energy OPIS understands from an industry source that as of at least Jan. 11 the company s 190,200- b/d refinery in Delaware City, Del., could be experiencing
September 2016 Water Production & Consumption Data
 September 2016 Water Production & Consumption Data September 2016 monthly water production (288.48 AF) was lowest in at least 17 years. Monthly water production has increased slightly each month since
The State of Alaska s Refining Industry
 The State of Alaska s Refining Industry Barry Pulliam Managing Director Econ One Research, Inc. Anchorage, Alaska December 2016 Econ One Research, Inc. 1 Econ One Research, Inc. In Alaska Three Decades
Transmission Planning Attachment K Public Input Meeting
 Transmission Planning Attachment K Public Input Meeting FERC 890 6 th Quarter Meeting May 25, 2011 Agenda Mountain Time Topic Presenter 1:00 1:15 Greetings and Introduction Dennis Desmarais 1:15 1:30 Attachment
U.S. Refinery Benzene Emissions Increase in 2008: Data Quality Concerns Undermine Confidence in Reported Data
 U.S. Refinery Benzene Emissions Increase in 2008: Data Quality Concerns Undermine Confidence in Reported Data Photo Credit: U.S. EPA, http://www.epa.gov/oust/graphics/miscpix2.htm. The Environmental Integrity
CORPORATION Analyst Review. Jon Jeppesen Senior Vice President Gulf Coast Region
 2008 Analyst Review Jon Jeppesen Senior Vice President Gulf Coast Region The following discussions contain certain forward looking statements as defined by the Private Securities Litigation Reform Act
Fuel Focus. Understanding Gasoline Markets in Canada and Economic Drivers Influencing Prices. Issue 24, Volume 8
 Fuel Focus Understanding Gasoline Markets in Canada and Economic Drivers Influencing Prices Issue 24, Volume 8 December, Copies of this publication may be obtained free of charge from: Natural Resources
FOR IMMEDIATE RELEASE
 Article No. 7845 Available on www.roymorgan.com Roy Morgan Unemployment Profile Friday, 18 January 2019 Unemployment in December is 9.7% and under-employment is 8.8% FOR IMMEDIATE RELEASE Australian unemployment
Start covering fall fuel needs OPEC unity stabilizes oil market for now By Bryce Knorr, senior grain market analyst
 Start covering fall fuel needs OPEC unity stabilizes oil market for now By Bryce Knorr, senior grain market analyst OPEC and its allies are a strange bunch. Iran hates Saudi Arabia as much as it dislikes
PHOTOS: SHUTTERSTOCK. June Editor s note: The Arkansas Energy Report is Sponsored by MISO & Arkansas State Chamber of Commerce.
 PHOTOS: SHUTTERSTOCK June 2016 Editor s note: The Arkansas Energy Report is Sponsored by MISO & Arkansas State Chamber of Commerce. Arkansas energy picture in recent months is one of low pump prices, a
Monthly Report on the Corporate Goods Price Index ( Preliminary Figures for September 2017 )
") Research and Statistics Department Bank of Japan Report on the Corporate Goods Price Index The Producer Price Index rose 0.2 percent from the previous. The Export Price Index (contract currency ) rose
Research and Statistics Department Bank of Japan Report on the Corporate Goods Price Index The Producer Price Index rose 0.2 percent from the previous. The Export Price Index (contract currency ) rose
Refinery Outages: Fourth-Quarter 2015
 Refinery Outages: Fourth-Quarter October Independent Statistics & Analysis www.eia.gov U.S. Department of Energy Washington, DC 20585 This report was prepared by the U.S. Energy Information Administration
Energy Markets in Turmoil The Consumer Perspective
 Energy Markets in Turmoil The Consumer Perspective Sonny Popowsky Consumer Advocate of Pennsylvania Illinois State University Institute for Regulatory Policy Studies 63682 Springfield, IL May 17, 2001
Terminals Jeff Armstrong
 Terminals Jeff Armstrong KMT - 2002 Legend Dry Bulk Locations Liquid Locations 2 KMT - 2004 (4) (4) (4) Legend Transload Operations Dry Bulk Locations Liquid Locations 3 Liquids Terminals Pasadena Terminal
NJ Solar Market Update As of 6/30/15
 NJ Solar Market Update As of 6/30/ Prepared by Charlie Garrison July 17, 20 SOLAR INSTALLED CAPACITY DATA The preliminary installed solar capacity as of 6/30/ is approximately 1,500.7 MW. Approximately
TANK BARGE OPPORTUNITIES RELATED TO CRUDE OIL PRODUCTION & MOVEMENT
 TANK BARGE OPPORTUNITIES RELATED TO CRUDE OIL PRODUCTION & MOVEMENT Third Edition A SPECIAL INDUSTRY STUDY Prepared by: November 2014 775 Ridge Lake Boulevard, Suite 400 ~ Memphis, Tennessee 38120-9403
Port Botany Trade Statistics Bulletin. 1 July April 2017
 Port Botany Trade Statistics Bulletin 1 July 2016 30 April 2017 YTD April 2017 Port Botany Container Trade Jul 2016 Aug 2016 Sep 2016 Oct 2016 Nov 2016 Dec 2016 Jan 2017 Feb 2017 Mar 2017 Apr 2017 Export
Monthly Report on the Corporate Goods Price Index ( Preliminary Figures for April 2014 )
") Research and Statistics Department Bank of Japan Report on the Corporate Goods Price The Domestic Corporate Goods Price rose 2.8 percent from the previous. The Export Price (contract currency ) fell 0.1
Research and Statistics Department Bank of Japan Report on the Corporate Goods Price The Domestic Corporate Goods Price rose 2.8 percent from the previous. The Export Price (contract currency ) fell 0.1
Port Botany Trade Statistics Bulletin. 1 July May 2017
 Port Botany Trade Statistics Bulletin 1 July 2016 31 May 2017 YTD May 2017 Port Botany Container Trade Jul 2016 Aug 2016 Sep 2016 Oct 2016 Nov 2016 Dec 2016 Jan 2017 Feb 2017 Mar 2017 Apr 2017 May 2017
Prices indeed dropped on Thursday, aided by a surprise increase in crude oil supplies caused by stronger imports.
 Trump s war on OPEC Farm fuel prices resist President s attempt to jawbone cartel By Bryce Knorr, senior grain market analyst For a day or two, at least, it looked like President Trump s attempt to tweet
Monthly Report on the Corporate Goods Price Index ( Preliminary Figures for May 2018 )
") Research and Statistics Department Bank of Japan Report on the Corporate Goods Price Index The Producer Price Index rose 0.6 percent from the previous. The Export Price Index (contract currency ) rose
Research and Statistics Department Bank of Japan Report on the Corporate Goods Price Index The Producer Price Index rose 0.6 percent from the previous. The Export Price Index (contract currency ) rose
Petroleum Wax Supply and Demand - Marketplace Issues. Stephen Burns Managing Editor, Americas ICIS
 Petroleum Wax Supply and Demand - Marketplace Issues Stephen Burns Managing Editor, Americas ICIS www.icis.com Global Publishing Company ICIS is part of Reed Business Information (RBI), the publisher of
Challenges and Opportunities in the Canada Newfoundland and Labrador Offshore Oil Industry
 Challenges and Opportunities in the Canada Newfoundland and Labrador Offshore Oil Industry JffO K Jeff O Keefe Director Resource Management and Chief Conservation Officer Cougar Helicopters Flight 491
MARINE ELFA Equipment Management Conference. Van C. Dewitt Sea Mar
 MARINE 2007 ELFA Equipment Management Conference Van C. Dewitt Sea Mar 1 SEA MAR Fleet Profile 2007 2 Sea Mar Fleet Profile Super 200 Class (Sisterships) Year Built Flag L x W x D BHP Tunnel Bow Thruster(s)
The Debrosse Memorial Report 2017 Oil & Gas Activity in Ohio
 The Debrosse Memorial Report 2017 Oil & Gas Activity in Ohio 71 st Annual Winter Meeting Prepared by: Marty Shumway Locus Bio-Energy Solutions LLC; Shumway Resources LLC Bill Arnholt - Northwood Energy
Association of Energy Engineers January 9, Michael Dirrane Director, Northeast Marketing
 Association of Energy Engineers January 9, 2013 Michael Dirrane Director, Northeast Marketing Spectra Energy U.S. Transmission Map Miles of Pipe 13,297 Number of Compressor Stations 129 Total Horsepower
Across the Nation...it must be Dun! (903)
") Across the Nation...it must be Dun! (9)891-9660 Home History Projects Equipment Safety Gallery Contact Dun Transportation & Stringing, Inc. Projects Within The Last 20 Years CUSTOMER LOCATION DATE SCOPE
Across the Nation...it must be Dun! (9)891-9660 Home History Projects Equipment Safety Gallery Contact Dun Transportation & Stringing, Inc. Projects Within The Last 20 Years CUSTOMER LOCATION DATE SCOPE
NEW HAMPSHIRE GAS CORPORATION WINTER PERIOD ORIGINAL FILING CONTENTS 3. CONVERSION OF GAS COSTS - GALLONS TO THERMS SCHEDULE A
 NEW HAMPSHIRE GAS CORPORATION COST OF GAS RATE FILING - DG 13- WINTER PERIOD 2013-2014 ORIGINAL FILING CONTENTS 1. TARIFF PAGE - COST OF GAS RATE 2. MARKED TARIFF PAGE - COST OF GAS RATE 3. CONVERSION
ERGMed Coastal. Refining
 ERGMed Coastal Refining 11 Refining Industry Trend: Capacity World total oil products demand and crude runs increasing, faster than refining capacity. World Source: International Energy Agency (IEA), Oil
U.S. Rail Crude Oil Traffic
 U.S. Rail Crude Oil Traffic Association of American Railroads November 215 Summary U.S. crude oil production has risen sharply in recent years, with much of the increased output moving by rail. In 28,
The Asphalt Oil Binder Business A Necessary Evil or a Godsend From a Refiner s Perspective
 The Asphalt Oil Binder Business A Necessary Evil or a Godsend From a Refiner s Perspective Austin Miller Sr. Manager Asphalt Supply & Trading Valero Energy Corporation NAPA s 56 th ANNUAL MEETING Orlando,
FED ER AL RESERVE statistical release
 FED ER AL RESERVE statistical release -! ' (3.17 (419) For release at 9:15 a.m. (EDT) April 16, INDUSTRIAL PRODUCTION AND CAPACITY UTILIZATION Industrial production decreased 0.3 percent in March following
GAZIFÈRE INC. Prime Rate Forecasting Process 2017 Rate Case
 Overview A consensus forecast is used to estimate the prime rate charged by commercial banks. As the prime rate is subject to competitive pressures faced by individual lenders and is set on an individual
National Trends and Highlights
 June 5, 2017 Volume 2: Issue 21 National Trends and Highlights U.S. Downstream Refinery Netback The turnabout in crude values came with a $2.20 hike in processing costs this past week. This increase is
Preliminary Steel Imports, Down 14% in June, Increase 35% in First Half of Year; Import Market Share 21% in Second Quarter 2010
 News Release FOR IMMEDIATE RELEASE July 27, 2010 CONTACT: NANCY GRAVATT 202.452.7115/ ngravatt@steel.org Preliminary Steel Imports, Down 14% in June, Increase 35% in First Half of Year; Import Market Share
U.S. Ethanol Production, Imports and Stocks
 U.S. Ethanol Production, Imports and Stocks Daniel O Brien and Mike Woolverton, Extension Agricultural Economists K-State Research and Extension January 12, 29 Trends in production, imports and ending
A perspective on the refining industry. Platts European Refining Summit Brussels, 29 September2016 Kristine Petrosyan, International Energy Agency
 A perspective on the refining industry Platts European Refining Summit Brussels, 29 September2016 Kristine Petrosyan, International Energy Agency OECD/IEA 2016 mb/d European refiners: busy 2015 OECD Europe
Preliminary Steel Imports Decline 9% in September Import Market Share at 20%
 News Release FOR IMMEDIATE RELEASE October 25, 2011 CONTACT: NANCY GRAVATT 202.452.7115/ ngravatt@steel.org Preliminary Steel Imports Decline 9% in September Import Market Share at 20% Washington, D.C.
Ethanol and the Economics of Octane The Superior Solution
 Ethanol and the Economics of Octane The Superior Solution Geoff Cooper Renewable Fuels Association October 20, 2017 Today s Presentation What is octane and why is it important? Options for boosting octane
Defining the Debate: Crude Oil Exports
 Defining the Debate: Crude Oil Exports Trisha Curtis, Director of Research Upstream and Midstream Energy Policy Research Foundation, Inc. (EPRINC) Brookings Task Force February 28th, 214 About EPRINC www.eprinc.org
HEAVY FUEL THE NARROWING LIGHT-HEAVY CRUDE OIL SPREAD
 Jan-95 Jan-96 Jan-97 Jan-98 Jan-99 Jan-00 Jan-01 Jan-02 Jan-03 Jan-04 Jan-05 Jan-06 Jan-07 Jan-08 Jan-09 Jan-10 Jan-11 Jan-12 Jan-13 Jan-14 Jan-15 Jan-16 Jan-17 $/B HEAVY FUEL THE NARROWING LIGHT-HEAVY
02/02/2011
 www.fundamentalpetroleumtrends.com 2/2/211 WEEKLY GASOLINE FUNDAMENTAL-PRICE-BASIS OUTLOOK A Fundamental Petroleum Trends Weekly Report Lehi German Tel: 816..98 www.fundamentalpetroleumtrends.com Wednesday,
WIM #37 was operational for the entire month of September Volume was computed using all monthly data.
 SEPTEMBER 2016 WIM Site Location WIM #37 is located on I-94 near Otsego in Wright county. The WIM is located only on the westbound (WB) side of I-94, meaning that all data mentioned in this report pertains