Terminals Jeff Armstrong
|
|
|
- Bridget Kathryn Johnston
- 6 years ago
- Views:
Transcription
1 Terminals Jeff Armstrong
2 KMT Legend Dry Bulk Locations Liquid Locations 2
3 KMT (4) (4) (4) Legend Transload Operations Dry Bulk Locations Liquid Locations 3


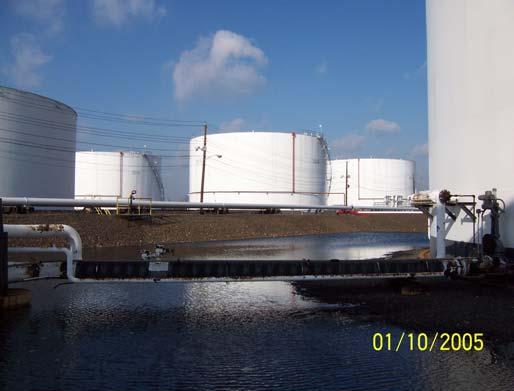
4 Liquids Terminals Pasadena Terminal Pasadena, Texas Carteret Terminal Carteret, New Jersey Argo Terminal Argo, Illinois Harvey Terminal Harvey, Louisiana 4


5 Bulk Terminals Pinney Dock Terminal Ashtabula, Ohio West Memphis Terminal West Memphis, ARkansas Shipyard River Terminal Charleston, South Carolina International Marine Terminal Port Sulphur,, Louisiana 5
6 Throughput - Liquids Variance 2003 vs 2004 Jan - Dec 2002 Jan - Dec 2003 Jan - Dec 2004 Amt % KMLT Throughput (bbls) Chemical 31,636,912 28,999,370 29,136, , % Distillate 135,894, ,931, ,372,223 14,440, % Petroleum 305,335, ,328, ,928,782 21,599, % Fuel Grade Ethanol 3,653,449 4,332,549 7,561,201 3,228, % Other 1,557,826 1,664,313 2,066, , % Vegetable Oils 3,461,477 2,578,745 3,959,405 1,380, % Animal Fats 488, , ,116 (27,256) -7.3% Agriculture 36, Alcohol 261, , , , % Oil Fields 887, , ,037 (133,242) -20.9% Totals 483,212, ,959, ,141,485 41,181, % KMLT Utilization Capacity Utilization Rate 96.0% 95.8% 96.6% 0.8% 0.8% Shell Capacity (MM bbls) % Refinery Utilization 1 Percent Utilization 90.7% 92.6% 92.5% -0.1% -0.1% Operable Capacity (MBD) % Source: EIA website, Weekly Petroleum Status Report 6
7 Throughput - Bulk Variance 2003 vs 2004 Jan - Dec 2002 Jan - Dec 2003 Jan - Dec 2004 Amt % KMBT Throughput (tons) Coal 26,423,424 23,773,778 27,364,801 3,591, % Coke 6,093,582 7,120,928 6,499,439 (621,489) -8.7% Cement (Including Clinker) 1,825, ,866 1,303, , % Fertilizers 1,504,846 4,221,488 3,247,618 (973,871) -23.1% Salt 2,176,435 2,731,711 3,708, , % Ores/Metals 10,263,047 12,286,689 13,635,282 1,348, % Soda Ash 2,388,696 2,224,929 3,257,814 1,032, % Other 5,248,950 5,152,959 10,209,449 5,056, % Totals 55,924,656 58,389,350 69,227,109 10,837, % 7
8 Modal Count Vessels Trucks Railcars Barges Other Loaded 915 1,131,341 79,254 15,907 16,734 Unloaded 2, , ,806 13,184 1,314 Total 3,091 1,248, ,060 29,091 18,048 8
9 Financials Total Total Total Budget Revenue 428, , , ,427 Cost of Sales 4,943 7,507 7,777 6,362 Gross Margin 423, , , ,065 Op Exp 197, , , ,531 DD&A 30,045 37,072 42,890 47,544 TOTI 11,135 11,049 12,066 13,644 NOI 184, , , ,346 Other Inc/(Exp) (470) 130 (396) 88 Income Before Taxes 183, , , ,434 Income Tax 4,750 3,857 5,529 9,810 Net Income 178, , , ,624 SS Capital 17,684 20,522 22,740 23, ,331 Historical Bulk Terminals DCF 191, , , , ,601 Historical Liquids Terminals 9
10 Internal & External Growth Earnings before DD&A 208, , , ,168 Growth from prior year 25.94% 15.22% 9.30% 9.50% Internal 7.51% 7.47% 4.49% 9.50% Acquisition 18.43% 7.75% 4.81% 0.00% 10

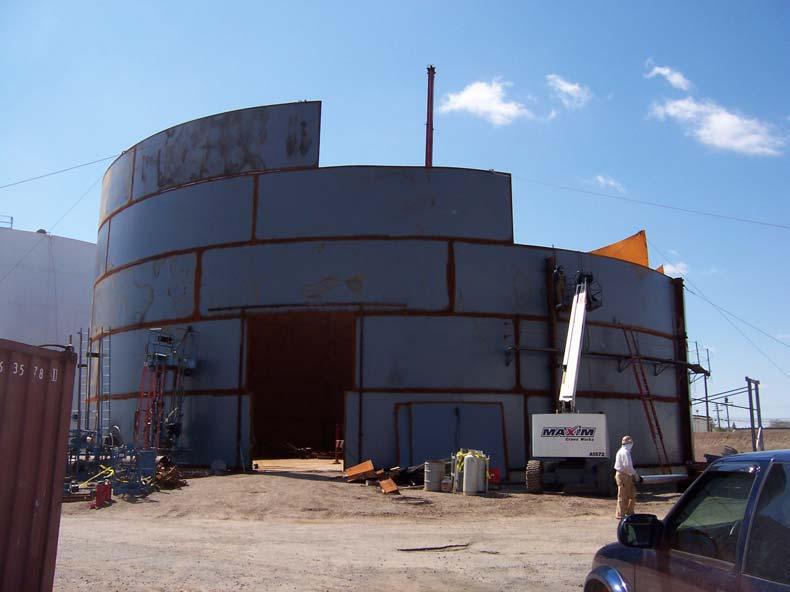
11 Carteret New Build Tanks 11

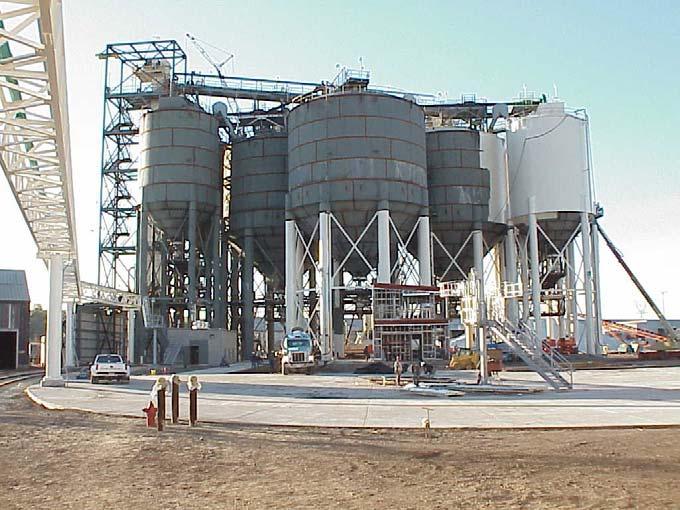
12 Dakota Bulk 12

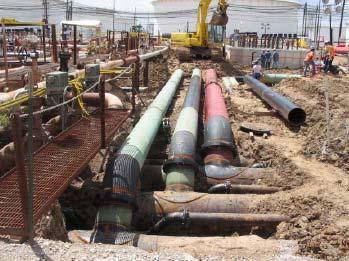

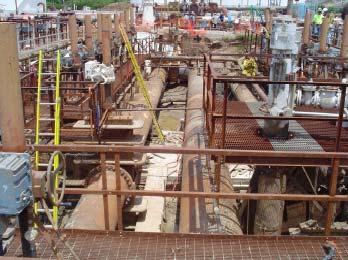
13 Colonial Manifold 13
14 Top Customer Breakout Ansac BASF BP Oil CSX Dow Great Lakes ISG Koch / Flint Hills Mosaic (Cargill and IMC) Northville Industries Sempra Shell Tennessee Valley Authority (TVA) Valero George E Warren Corporation All Others 60% 2004 Revenue = $541MM Top 15 Customers 40% 14
15 Contract Term Breakout Contract Breakdown by Total Revenue Liquid and Bulk, All Regions (using January 1, 2005 start date) 3+ Years 33.7% Under 1 Year 28.8% 2-3 Years 11.6% 1-2 Years 25.9% 15
16 Revenue by Product Breakout 2005 Budget % 27% 40% 26% 6% 8% 18% 5% 8% 21% Petroleum Chemical Coal Coke Other Petroleum Chemical Coal Coke Other 16
17 US Petroleum Products Supply/Demand Balance ( 000 BPD) (EIA est) 2006 (EIA est) Demand Gasoline 8,846 8,932 (+1.0%) 9,057 (+1.4%) (+1.9%) (+2.4%) Distillate 3,775 3,930 (+4.0%) 4,080 (+3.8%) (+2.5%) (+1.3%) Jet 1,613 1,578 (-2.2%) 1,613 (+2.1%) (+2.6%) (+1.9%) Total 14,234 14,440 (+1.4%) 14,750 (+2.1%) (+2.0%) (+1.9%) Production Gasoline 8,473 8,499 (+0.3%) 8,679 (+2.1%) Distillate 3,592 3,706 (+3.2%) 3,818 (+3.0%) Jet 1,514 1,487 (-1.8%) 1,540 (+3.6%) Operating Capacity 90.7% 92.6% (+2.1%) 92.5% (-0.1%) Imports Gasoline (+8.2%) 911 (+3.1%) Distillate (+24.6%) 323 (-3.3%) Jet (+0.9%) 113 (+3.7%) Source: EIA 17
18 US Refining Capacity & Inputs Million Barrels Per Day Refineries 18.6MM BPD capacity Jan-81 Jan-83 Operable Capacity Gross Inputs Jan-85 Jan-87 Jan-89 Jan-91 Jan-93 Jan-95 Jan-97 Jan-99 Jan-01 Source: EIA - World Petroleum Market Changes and Impact on U.S., OPIS Supply Summit, October 2004 Jan Refineries 16.9MM BPD capacity 18


19 A Look at U.S. Refining Capacity 1 Data for each year are those reported for Jan 1 the following year. Capacities not reported for 1997; values for that year are averages of 1996 and 1998 data. Source: Oil & Gas Journal, December 20,
20 US Regional Refinery Creep Capacity MBPD Increase MBPD % PAD I 1,691 1, PAD II 3,619 3,526 (93) -2.6 PAD III 7,411 7, PAD IV PAD V 3,013 3, Total 16,262 16, Texas 4,185 4, Louisiana 2,600 2, California 1,929 2, Source: EIA 20


21 Imports Imports as Percent of Demand Gasoline 9.2% 9.9% 10.1% Distillate 7.1% 8.5% 7.9% Jet 6.7% 6.9% 7.0% Source: Oil & Gas Journal, December 20,


22 PAD I Gasoline U.S. Import Destinations PAD 1 Sources of Supply Other PADs 103MB/D PAD I Share Inter PAD Net Receipts 1,580MB/D Locally Produced 1,065MB/D Imports 782MB/D 782MB/D (2003) 88% of total U.S. Gasoline Product Demand for PAD I 3,216 MB/D (2003); 36% Total U.S. Source: EIA 22

23 European Gasoline/Diesel Demand 23
24 US Petroleum Stocks ( 000 BPD) Gasoline Distillate Jet ppm & under ppm & greater Gasoline Distillate By PAD for 2004 PAD I PAD IA PAD IB PAD IC PAD II PAD III PAD IV PAD V Total Source: EIA 24


25 Stocks of Gasoline and Distillate Source: EIA 25
26 Ethanol/MTBE Production ( 000BPD) (Through October) Ethanol MTBE Source: EIA 26
27 KM Assets 2,090M Fuel Grade Ethanol Combined Capacity 440M Fuel Grade Ethanol 578M Fuel Grade Ethanol 647M Fuel Grade Ethanol (4) (3) Ethanol capacity shown in barrels Legend 425.7M Fuel Grade Ethanol Liquid Locations Product Pipelines Locations 27
28 U. S. Coal Production 1,200 1,000 Compounded Annual Growth Rate Appalachian -0.76% Interior -1.21% Western 3.68% U.S. Total 1.15% 800 Million Tons est. Appalachian Total Interior Total Western Total U. S. Total Source: EIA Monthly Production Reports 28
29 Domestic Coal Supply Considerations 29
30 U. S. Coal Imports 30,000 26,600 25,000 20,000 Thousand Tons 15, , , *2004 * Estimate Source: EIA Monthly Production Reports 30
31 Potential Imports ( ) East Coast 11 million tpy currently received by water served utilities Fairless Hills Fairless Hills, PA Chesapeake Bulk Baltimore, MD Pier IX Newport News, VA Shipyard River Charleston, SC Rapid Rail turnaround required Import potential as high as 43 million tons Some infrastructure upgrade required Over 234 million tons of coal consumed by Electric Utilities in East Coast States in 2003 Over 60 power plant locations to service Tampaplex Tampa, FL KMT Import Coal Strategic Locations 31
32 KMT s Coal Volumes 30,000 25,000 Thousand Tons 20,000 15,000 10,000 16,906 19,496 20,119 17,405 16,670 8,219 5,000 8,830 7,925 6,098 5, , , Imports Exports Transshipped 32
33 Coke Supply World Production (1) US Production US Gulf Coast Production Worldwide Production (1) North America 63% (Gulf Coast 39%)* South America 12% Europe 7% Africa 3% Asia 15% (1) Source: Oxbow Carbon Source: Oil & Gas Journal * TX, MS, LA 33
34 Fuel Grade Petcoke Demand World United States Storage 4% Other (1) 15% Power 23% Other (1) 17% Residential 2% Iron & Steel 8% Cement 26% Power 53% Cement 48% Iron & Steel 4% (1) (Lime, Chemical Processes, Paper & Pulp) Source: Jacobs Consultancy 34


35 Chemical Demand Production Increases Import / Export Source: Chemical Week, December 22/29, 2004, Pg
36 U.S. Chemical Railcar Shipments 4.3% increase in 2004 Chemical Railcars Shipped 1,580,000 1,560,000 1,540,000 1,520,000 1,500,000 1,480,000 1,460,000 1,440,000 1,420,000 1,400,000 1,380,
37 KMT MM barrels of combined capacity Kinder Morgan Terminals 36.8MM barrels of capacity Kinder Morgan Product Pipelines 29.2MM barrels of capacity (4) (4) (3) (4) Legend Transload Operations Dry Bulk Locations Liquid Locations Product Pipelines Locations 37
Emerging Trends in Petroleum Markets
 Emerging Trends in Petroleum Markets For Defense Logistics Agency, Worldwide Energy Conference Washington, D.C. By T. Mason Hamilton, Petroleum Markets Analyst U.S. Energy Information Administration Independent
Rice Global E&C Forum August 9, 2013
 Rice Global E&C Forum August 9, 2013 Midyear Forecast: July 1, 2013 Conglin Xu, Senior Editor-Economics Laura Bell, Statistics Editor Alan Petzet, Chief Editor-Exploration Forecast & Review: Jan. 7, 2013
STATUS OF THE U.S. REFINING INDUSTRY
 STATUS OF THE U.S. REFINING INDUSTRY October 2005 BAKER & O BRIEN Incorporated, All Rights Reserved REFINING VITAL LINK IN THE OIL SUPPLY CHAIN Crude Oil Supply & Logistics Products Distribution & Marketing
Downstream & Chemicals
 Downstream & Chemicals Mark Nelson Executive Vice President Downstream & chemicals portfolio Fuels refining & marketing Focused, regional optimization Petrochemicals Advantaged feed, scale and technology
A summary of national and global energy indicators. FEDERAL RESERVE BANK of KANSAS CITY
 THE U.S. Energy DATABOOK A summary of national and global energy indicators JULY 1, 17 FEDERAL RESERVE BANK of KANSAS CITY SUMMARY OF CURRENT ENERGY CONDITIONS The number of total active drilling rigs
Technical Session: Crude Oil Supply High Quality Competitive Distillate Fuels from Coal-to-Liquids Processing
 Technical Session: Crude Oil Supply High Quality Competitive Distillate Fuels from Coal-to-Liquids Processing NPRA Annual Meeting March 20, 2007 Mark Landrum / Jon Warzel BAKER & O BRIEN Incorporated,
The State of Alaska s Refining Industry
 The State of Alaska s Refining Industry Barry Pulliam Managing Director Econ One Research, Inc. Anchorage, Alaska December 2016 Econ One Research, Inc. 1 Econ One Research, Inc. In Alaska Three Decades
North American Storage and Transportation Trends
 North American Storage and Transportation Trends Brian Busch Director, Oil Markets and Business Development www.genscape.com 2016 Genscape Incorporated. All rights reserved. What we do 2 Current State
ASPHALT SUPPLY IN A VOLATILE OIL WORLD. Bill Haverland ConocoPhillips Company
 ASPHALT SUPPLY IN A VOLATILE OIL WORLD Bill Haverland ConocoPhillips Company Issues to be Discussed Crude Oil Supply Crude Oil Pricing Refining Capacity Products Supply Products Pricing Future of the Industry
Issues to be Discussed ASPHALT SUPPLY IN A VOLATILE OIL WORLD. Crude Oil Supply (2006) CRUDE OIL SUPPLY. Crude Oil Demand CRUDE OIL PRICING
 CRUDE OIL SUPPLY. Crude Oil Demand CRUDE OIL PRICING") 6 SEAUPG CONFERENCE - WILMINGN, NORTH CAROLINA Issues to be Discussed ASPHALT SUPPLY IN A VOLATILE OIL WORLD Bill Haverland ConocoPhillips Company Crude Oil Supply Crude Oil Pricing Refining Capacity Products
6 SEAUPG CONFERENCE - WILMINGN, NORTH CAROLINA Issues to be Discussed ASPHALT SUPPLY IN A VOLATILE OIL WORLD Bill Haverland ConocoPhillips Company Crude Oil Supply Crude Oil Pricing Refining Capacity Products
ASPHALT SUPPLY IN A VOLATILE OIL WORLD. Bill Haverland ConocoPhillips Company
 ASPHALT SUPPLY IN A VOLATILE OIL WORLD Bill Haverland ConocoPhillips Company Issues to be Discussed Crude Oil Supply Crude Oil Pricing Refining Capacity Products Supply Products Pricing Future of the Industry
Weekly Statistical Bulletin
 API 1220 L Street, NW Washington, DC 20005 Weekly Statistical Bulletin STATISTICS DEPARTMENT Volume: 93 Number: 35 Week Ending: August 31, 2012 SUMMARY (In thousands of 42-gallon barrels per day, except
RETURN ON INVESTMENT LIQUIFIED NATURAL GAS PIVOTAL LNG TRUCK MARKET LNG TO DIESEL COMPARISON
 RETURN ON INVESTMENT LIQUIFIED NATURAL GAS PIVOTAL LNG TRUCK MARKET LNG TO DIESEL COMPARISON Year 1 Year 2 Year 3 Year 4 Year 5 Year 6 Year 7 Year 8 Year 9 Year 10 RETAIL BREAK EVEN AND IRR EXAMPLE FOR
The Changing Face of Global Refining
 The Changing Face of Global Refining OPIS National Supply Summit Las Vegas, Nevada October 24-26, 2010 John B. O Brien, Executive Chairman Baker & O Brien, Inc. All rights reserved. The Changing Face of
Monthly Biodiesel Production Report
 Monthly Biodiesel Production Report With data for June 2017 August 2017 Independent Statistics & Analysis www.eia.gov U.S. Department of Energy Washington, DC 20585 This report was prepared by the U.S.
California s Petroleum Infrastructure Overview and Import Projections
 California s Petroleum Infrastructure Overview and Import Projections Port of Los Angeles Harbor Commission Meeting San Pedro, CA February 1, 2007 Gordon Schremp Fuels and Transportation Division California
Operating Refineries in a High Cost Environment. Options for RFS Compliance. March 20, Baker & O Brien, Inc. All rights reserved.
 Operating Refineries in a High Cost Environment Options for RFS Compliance March 2, 217 Baker & O Brien, Inc. All rights reserved. Discussion Points Introduction Renewable Fuels Standard (RFS) Overview
Global Refining : Delivering Long-Term Value
 Taking on the world s toughest energy challenges. Global Refining : Delivering Long-Term Value J. Steve Simon Sr. Vice President, Exxon Mobil Corporation Goldman Sachs Global Energy Conference January
The Asphalt Oil Binder Business A Necessary Evil or a Godsend From a Refiner s Perspective
 The Asphalt Oil Binder Business A Necessary Evil or a Godsend From a Refiner s Perspective Austin Miller Sr. Manager Asphalt Supply & Trading Valero Energy Corporation NAPA s 56 th ANNUAL MEETING Orlando,
UBS Global Oil and Gas Conference May 22, Joe Gorder Executive Vice President Marketing and Supply
 UBS Global Oil and Gas Conference May 22, 2008 Joe Gorder Executive Vice President Marketing and Supply 2008 Year-to-Date Performance Raised annual dividend rate by 25% to $0.60 per share Purchased more
Biofuel Market Factors
 Biofuel Market Factors Michael Cooper Ultra Green Energy Corporation, Executive Vice President Biofuel Brokers, LLC, President/Director 866-E-MY-FUEL (369-3835) info@ultragreenenergy.com emyfuel@biofuelbrokers.com
05/17/2011
 RETAIL DIESEL FUEL OUTLOOK A Fundamental Petroleum Trends Weekly Report Lehi German Tel: 816.505.0980 www.fundamentalpetroleumtrends.com Tuesday, May 17, 2011 Diesel Fuel Price Trends U.S. retail diesel
ASPHALT SUPPLY IN A VOLATILE OIL WORLD
 ASPHALT SUPPLY IN A VOLATILE OIL WORLD Bill Haverland ConocoPhillips Baxter Burns Ergon CRUDE OIL SUPPLY A WORLD LOOK Crude Oil Supply (2006) World Crude Oil Production Millions of Barrels Per Day FSU/E.
U.S. GASOLINE AND DISTILLATE FUELS UPDATE - DECEMBER 20, 2017
 U.S. GASOLINE AND DISTILLATE FUELS UPDATE - DECEMBER 20, 2017 PRICE TRENDS Monday, December 18 According to the Energy Information Administration (EIA), the average U.S. retail price for regular grade
U.S. Ethanol Production, Imports and Stocks
 U.S. Ethanol Production, Imports and Stocks Daniel O Brien and Mike Woolverton, Extension Agricultural Economists K-State Research and Extension January 12, 29 Trends in production, imports and ending
Downstream & Chemicals
 Downstream & Chemicals Pierre Breber Executive Vice President 017 Chevron Corporation Downstream portfolio Fuels refining & marketing Integrated value chains Lubricants & additives Globally positioned
Petroleum and Natural Gas Situation
 Petroleum and Natural Gas Situation John C. Felmy Chief Economist and Director Statistics Department American Petroleum Institute Felmyj@api.org www.api.org www.gasolineandyou.org www.naturalgasfacts.org
Stifel Nicolaus Transportation Conference
 Stifel Nicolaus Transportation Conference February 14, 2012 James A. Squires Executive Vice President Finance and Chief Financial Officer Norfolk Southern System Norfolk Southern Update Recent Results
Changes to America s Gasoline Pool. Charles Kemp. May 17, Baker & O Brien, Inc. All rights reserved.
 Changes to America s Gasoline Pool Charles Kemp May 17, 2016 Baker & O Brien, Inc. All rights reserved. Discussion Points Light Naphtha Definitions Sources and Uses of Light Naphtha Octane Challenges Tier
Defining the Debate: Crude Oil Exports
 Defining the Debate: Crude Oil Exports Trisha Curtis, Director of Research Upstream and Midstream Energy Policy Research Foundation, Inc. (EPRINC) Brookings Task Force February 28th, 214 About EPRINC www.eprinc.org
STATE TAX CHANGES JULY 2018* CALIFORNIA
 STATE TAX CHANGES JULY 2018* CALIFORNIA The prepaid sales tax rates effective July 1, 2018 are $0.06 per gallon for gasoline, $0.31 per gallon for diesel and $0.105 per gallon for jet fuel. CONNECTICUT
Weekly Petroleum Status Report
 DOE/EIA-0208(2015-34) Distribution Category UC-98 Data for Week Ended: August 14, 2015 Weekly Petroleum Status Report EIA DATA ARE AVAILABLE IN ELECTRONIC FORM The tables in the Weekly Petroleum Status
TANK BARGE OPPORTUNITIES RELATED TO CRUDE OIL PRODUCTION & MOVEMENT
 TANK BARGE OPPORTUNITIES RELATED TO CRUDE OIL PRODUCTION & MOVEMENT Third Edition A SPECIAL INDUSTRY STUDY Prepared by: November 2014 775 Ridge Lake Boulevard, Suite 400 ~ Memphis, Tennessee 38120-9403
U.S. Rail Crude Oil Traffic
 U.S. Rail Crude Oil Traffic Association of American Railroads May 217 Summary U.S. crude oil production has risen sharply in recent years, with much of the increased output moving by rail. In 28, U.S.
Commercializing the Rentech Process
 Commercializing the Rentech Process China-US Coal Gasification and Liquefaction Workshop Beijing, China June 15-16, 16, 2006 1 Ultra-High Purity Fuel - from Coal (CTL) The U.S. needs clean economical fuel
Products Pipelines Tom Bannigan President
 Products Pipelines Tom Bannigan President The Demographic Wave Kinder Morgan has built a portfolio of refined products assets in the fastest growing demographic markets in the country Demand for refined
1H 2003 Financial Results (US GAAP)
") 1H 2003 Financial Results (US GAAP) October 2003 Crude Oil Production Growth bpd 1.52 1.50 1.48 1.46 1.44 1.42 1.40 Jan- 03 Daily crude production Feb- 03 Mar- 03 Apr- 03 May- 03 Jun- 03 Crude oil production*
1H 2003 Financial Results (US GAAP) October 2003 Crude Oil Production Growth bpd 1.52 1.50 1.48 1.46 1.44 1.42 1.40 Jan- 03 Daily crude production Feb- 03 Mar- 03 Apr- 03 May- 03 Jun- 03 Crude oil production*
Strategic Factors Impacting The California Crude Oil Market. About Purvin & Gertz, Inc. California Independent Petroleum Association
 Strategic Factors Impacting The California Crude Oil Market Hyatt Regency Huntington Beach Mike Sarna Eric Wei Long Beach Office 1 About Purvin & Gertz, Inc. Privately-Owned, Independent International
Recent Developments in EU Refining and in the Supply and Trade of Petroleum Products
 Recent Developments in EU Refining and in the Supply and Trade of Petroleum Products Third Meeting of the EU Refining Forum Brussels, 22 May 2014 Toril Bosoni, International Energy Agency OECD/IEA 2014
U.S. Rail Crude Oil Traffic
 U.S. Rail Crude Oil Traffic Association of American Railroads November 215 Summary U.S. crude oil production has risen sharply in recent years, with much of the increased output moving by rail. In 28,
Evolving Global Oil Trade Flows. IEA-IEF-OPEC Joint Meeting Vienna, March 2018
 Evolving Global Oil Trade Flows IEA-IEF-OPEC Joint Meeting Vienna, March 2018 SHIFTING FLOWS: WHAT HAS THIS MEANT IN PRACTICE? US/Europe crude imports & exports Saudi crude to Poland Chinese teapots importing
PHOTOS: SHUTTERSTOCK. June Editor s note: The Arkansas Energy Report is Sponsored by MISO & Arkansas State Chamber of Commerce.
 PHOTOS: SHUTTERSTOCK June 2016 Editor s note: The Arkansas Energy Report is Sponsored by MISO & Arkansas State Chamber of Commerce. Arkansas energy picture in recent months is one of low pump prices, a
Implications Across the Supply Chain. Prepared for Sustainableshipping Conference San Francisco 30 September 2009
 Implications Across the Supply Chain Prepared for Sustainableshipping Conference San Francisco 30 September 2009 Agenda Residual Markets & Quality Refinery Bunker Production Supply & Pricing 2 World marine
Financial Statements Matti Lievonen, President & CEO 7 February 2017
 Financial Statements 2016 Matti Lievonen, President & CEO Agenda 1 2 3 4 Year 2016 Financials 2016 Segment reviews Current topics 5 Appendix 2 Disclaimer The following information contains, or may be deemed
Changing Crude Qualities and Their Impacts on U.S. Refinery Operations AM-14-42
 Changing Crude Qualities and Their Impacts on U.S. Refinery Operations Presented to: AFPM 2014 Annual Meeting March 25, 2014 by John M. Mayes International consulting practice since 1971 Downstream focus;
Why is a towboat called a towboat when it pushes the barges?
 Why is a towboat called a towboat when it pushes the barges? The word "tow" comes from the canal age when a draft animal walking along the bank of the canal pulled a barge. As rivermen gained experience
Renewable Fuels March 26, 2007
 Biodiesel Supply Chain Oilseed Crush RBD or Crude Oil Animal Fat Co-location Truck Rail Barge Ship Transportation Transportation Renewable Fuels March 26, 2007 Oilseed Continuous Flow Process Large Customer
Thursday, March 6, 2014 Houston, TX. 8:30 9:40 a.m. AN ECONOMIST S-EYE VIEW OF THE ENERGY INDUSTRY: HYDROCARBON HAT TRICK
 Thursday, March 6, 214 Houston, TX 8:3 9:4 a.m. AN ECONOMIST S-EYE VIEW OF THE ENERGY INDUSTRY: HYDROCARBON HAT TRICK Presented by Jesse Thompson Business Economist Federal Reserve Bank of Dallas, Houston
Petroleum Planning & Analysis Cell
 MONTHLY REPORT ON INDIGENOUS CRUDE OIL PRODUCTION, IMPORT AND PROCESSING & PRODUCTION, IMPORT AND EXPORT OF PETROLEUM PRODUCTS February 2018 Petroleum Planning & Analysis Cell (Ministry of Petroleum &
B A K E R & O B R I E N
 B A K E R & O B R I E N I N C O R P O R A T E D Q3 : U. S. Refining Margins Remain Robust Special Topic: Domestic Light Oil Processing in the U.S. Gulf Coast Have We Hit the Limit? Houston, October 30,
Abstract Process Economics Program Report 222 PETROLEUM INDUSTRY OUTLOOK (July 1999)
") Abstract Process Economics Program Report 222 PETROLEUM INDUSTRY OUTLOOK (July 1999) Global energy demand is rising, with fossil fuels oil, natural gas, and coal continuing to provide more than 90% of
Abstract Process Economics Program Report 222 PETROLEUM INDUSTRY OUTLOOK (July 1999) Global energy demand is rising, with fossil fuels oil, natural gas, and coal continuing to provide more than 90% of
Trends in U.S. crude oil and petroleum product exports
 Trends in U.S. crude oil and petroleum product exports For ENERCOM Oil & Gas Conference August 21, 218 Denver, Colorado By T. Mason Hamilton, Petroleum Markets Analyst, Office of Energy Markets and Financial
Refining Trends and Outlook
 Refining Trends and Outlook Presented by: Greg Kort, P.E., ASA 2018 TXOGA PROPERTY TAX REPRESENTATIVES ANNUAL CONFERENCE March 7, 2018 www.ryan.com Agenda Hurricane Harvey Tax Cuts and Jobs Act of 2017
A perspective on the refining industry. Platts European Refining Summit Brussels, 29 September2016 Kristine Petrosyan, International Energy Agency
 A perspective on the refining industry Platts European Refining Summit Brussels, 29 September2016 Kristine Petrosyan, International Energy Agency OECD/IEA 2016 mb/d European refiners: busy 2015 OECD Europe
Third quarter results Matti Lievonen, President & CEO 26 October 2017
 Third quarter results 2017 Matti Lievonen, President & CEO 26 October 2017 Agenda 1. Q3/17 Group financials 2. January-September 2017 review 3. Q3/17 Segment reviews 4. Current topics 5. Appendix 2 Disclaimer
Examining the cost burden imposed on European refining by EU legislation
 ENVIRONMENTAL SCIENCE FOR THE EUROPEAN REFINING INDUSTRY Examining the cost burden imposed on European refining by EU legislation Platts European Middle Distillates Conference Antwerp, Belgium Alan Reid
Downstream & Chemicals
 Downstream & Chemicals Pierre Breber Executive Vice President Profitable downstream & chemicals portfolio Fuels refining & marketing Focused, regional optimization Petrochemicals Advantaged feed, scale
OCTANE THE NEW ECONOMICS OF. What Drives the Cost of Octane and Why Octane Costs Have Risen Since 2012 T. J. HIGGINS. A Report By:
 THE NEW ECONOMICS OF OCTANE What Drives the Cost of Octane and Why Octane Costs Have Risen Since 2012 A Report By: T. J. HIGGINS Contents Foreword... 1 1. Executive Summary... 2 2. Tracking the Changing
BB&T Capital Markets Transportation Conference. Marta R. Stewart Executive Vice President Chief Financial Officer February 12, 2014
 BB&T Capital Markets Transportation Conference Marta R. Stewart Executive Vice President Chief Financial Officer February 12, 2014 1 Norfolk Southern Update 2013 Overview First Quarter Update Business
The Impact of Shale Oil Production Growth in the US
 The Impact of Shale Oil Production Growth in the US Presentation to IMSF, Copenhagen By Selena Yan, Senior Analyst www.clarksons.com Disclaimer The material and the information (including, without limitation,
VTTI. Storage Markets : Our Perspective. StocExpo Europe March Onur Capan: Market Intelligence
 VTTI Storage Markets : Our Perspective Onur Capan: Market Intelligence StocExpo Europe March 2017 VTTI track record at its 10 th anniversary VTTI has grown in 10 years to be one of the largest global independent
Stifel Transportation and Logistics Conference. Marta R. Stewart Executive Vice President Chief Financial Officer February 11, 2014
 Stifel Transportation and Logistics Conference Marta R. Stewart Executive Vice President Chief Financial Officer February 11, 2014 1 Norfolk Southern Update 2013 Overview First Quarter Update Business
ENERGY PARTNERS, L.P. Products Pipelines. Tom Bannigan. President Products Pipelines Group
 Products Pipelines Tom Bannigan President Products Pipelines Group KMP Products Pipelines Assets ENERGY PARTNERS, L.P. Cochin (2,3,4) PRODUCTS PIPELINES PRODUCTS PIPELINES TERMINALS TRANSMIX FACILITIES
9 th Annual NH3 Fuel Conference
 9 th Annual NH3 Fuel Conference Current Challenges Facing the U.S. Ammonia Market and Implications for NH3 Fuel Glen Buckley NPK Fertilizer Advisory Service www.npkfas.com October 2, 2012 Ammonia market
Petroleum Planning & Analysis Cell
 MONTHLY REPORT ON INDIGENOUS CRUDE OIL PRODUCTION, IMPORT AND PROCESSING & PRODUCTION, IMPORT AND EXPORT OF PETROLEUM PRODUCTS May 2018 Petroleum Planning & Analysis Cell (Ministry of Petroleum & Natural
Products Pipelines. Tom Bannigan. President Products Pipelines Group
 Products Pipelines Tom Bannigan President Products Pipelines Group Products Pipelines Assets PRODUCTS PIPELINES Cochin PRODUCTS PIPELINES TERMINALS TRANSMIX FACILITIES PIPELINES UNDER CONSTRUCTION CONDENSATE
POSITIONED FOR GROWTH BNSF Railway. John Miller Group Vice President Agricultural Products BNSF Railway
 POSITIONED FOR GROWTH BNSF Railway John Miller Group Vice President Agricultural Products BNSF Railway 1 Historic Rail Industry Volumes U.S. Class I Weekly Rail Volumes 800,000 2006 2007 2008 2009 2010
OPEC PRIMARY ENERGY CONSUMPTION IN 2005 (1)
") CHAPTER 4 I n 1384, political tensions in the Middle East and some oil-producing countries, sabotage in Iraq s oil industry and speculation in the market raised oil prices incrementally. As of the beginning
CHAPTER 4 I n 1384, political tensions in the Middle East and some oil-producing countries, sabotage in Iraq s oil industry and speculation in the market raised oil prices incrementally. As of the beginning
VTTI placing Cyprus on the Oil Trading Map 19 June 2018
 VTTI placing Cyprus on the Oil Trading Map 19 June 2018 VTTI offers oil storage solutions in strategic locations, in a way that is fast, flexible, safe and environmentally sound. We are importantly driven
WÄRTSILÄ CORPORATION
 WÄRTSILÄ CORPORATION JP MORGAN EUROPEAN CAPITAL GOODS CEO CONFERENCE 13 JUNE 2014 Björn Rosengren, President & CEO 1 Net sales by business 1-3/2014 Ship Power 38% Services 43% Power Plants 19% 2 Net sales
PET Outlook. Chase Willett Director Polyester & Polyester Raw Materials CMAI USA. Houston London Singapore Dubai 2004 Plastic Processors Conference
 PET Outlook Chase Willett Director Polyester & Polyester Raw Materials CMAI USA Global PET Demand Americas Asia Europe, MDE & Africa 23 28 1998 21% 45% 34% Tot Dem : 5.6 Mil Tons 24% 39% 37% Tot Dem :
Fuel Focus. Understanding Gasoline Markets in Canada and Economic Drivers Influencing Prices. Issue 20, Volume 8
 Fuel Focus Understanding Gasoline Markets in Canada and Economic Drivers Influencing Prices Issue 20, Volume 8 October 18, 2013 Copies of this publication may be obtained free of charge from: Natural Resources
Q Matti Lievonen President and CEO
 Q1 2018 Matti Lievonen President and CEO CONTENTS 1. Q1 2018 review 2. Group financials 3. Segment reviews 4. Current topics 5. Appendix 2 Disclaimer The following information contains, or may be deemed
Months Investor Presentation
 2018 9 Months Investor Presentation 25.10.2018 Disclaimer Ereğli Demir Çelik Fabrikaları T.A.Ş. (Erdemir) may, when necessary, make written or verbal announcements about forward-looking information, expectations,
TABLE OF CONTENTS 6 MEDIUM-TERM COAL MARKET REPORT 2012
 TABLE OF CONTENTS FOREWORD... 3 ACKNOWLEDGEMENTS... 5 EXECUTIVE SUMMARY... 12 Business as usual... 12 The winds of change... 12 US shale gas switches on coal in Europe... 13 From Beijing to New Delhi?...
Energy Outlook. U.S. Energy Information Administration. For EnerCom Dallas February 22, 2018 Dallas, TX
 Energy Outlook For EnerCom Dallas Dallas, TX Jeff Barron Industry Economist, U.S. Energy Information Administration U.S. Energy Information Administration Independent Statistics & Analysis www.eia.gov
For Region 5 and Region 7 Regional Response Teams Meeting April 22, 2015 St. Charles, Missouri via video/teleconference
 For Region 5 and Region 7 Regional Response Teams Meeting St. Charles, Missouri via video/teleconference By Grant Nülle, Upstream Oil & Gas Economist, Exploration and Production Analysis Team U.S. Energy
Operating Expenses and Margin Analysis of the European Union (EU) Refineries vs Regional Peers
 Refineries vs Regional Peers") Operating Expenses and Margin Analysis of the European Union (EU) Refineries vs Regional Peers Tracy Ellerington Third Meeting of the EU Refining Forum 22 May 214 Solomon Benchmarking Global Standard We
Operating Expenses and Margin Analysis of the European Union (EU) Refineries vs Regional Peers Tracy Ellerington Third Meeting of the EU Refining Forum 22 May 214 Solomon Benchmarking Global Standard We
WEEKLY REFINING INDICATORS REPORT WEEK ENDING 06/17/2016
 WEEKLY REFINING INDICATORS REPORT WEEK ENDING 06/17/2016 Blake Fernandez, Analyst 713.393.4524 blakef@howardweil.com Quick Take: Somewhat bearish stats on the refining side as we had hoped for some gasoline
ANNUAL FINANCIAL PROFILE OF AMERICA S FRANCHISED NEW-TRUCK DEALERSHIPS
 217 ANNUAL FINANCIAL PROFILE OF AMERICA S FRANCHISED NEW-TRUCK DEALERSHIPS Overview For 217, ATD Data our annual financial profile of franchised new medium- and heavyduty truck dealerships shows the following:
Petroleum Planning & Analysis Cell
 MONTHLY REPORT ON INDIGENOUS CRUDE OIL PRODUCTION, IMPORT AND PROCESSING & PRODUCTION, IMPORT AND EXPORT OF PETROLEUM PRODUCTS September 2018 Petroleum Planning & Analysis Cell (Ministry of Petroleum &
Hurricane Gustav & Ike Impacts to U.S. Petroleum Supply and Infrastructure Jeremy J. Cusimano Office of Petroleum Reserves Washington, DC
 Click to edit Master title style Hurricane Gustav & Ike Impacts to U.S. Petroleum Supply and Infrastructure Jeremy J. Cusimano Office of Petroleum Reserves Washington, DC Hurricane Gustav and Ike Impacts
Second Quarter 2009 Results
 1 Second Quarter 2009 Results Second Quarter 2009 Results Donald W. Seale Executive Vice President and Chief Marketing Officer Railway Operating Revenue Second Quarter 2009 vs. 2008 Revenue Total $1.86
Turmoil in Refining The Shakeout Continues
 Turmoil in Refining The Shakeout Continues OPIS National Supply Summit Las Vegas, Nevada October 22 24, 2012 John B. O Brien Executive Chairman Baker & O Brien, Inc. All rights reserved. Conclusions from
Petroleum Planning & Analysis Cell
 MONTHLY REPORT ON INDIGENOUS CRUDE OIL PRODUCTION, IMPORT AND PROCESSING & PRODUCTION, IMPORT AND EXPORT OF PETROLEUM PRODUCTS November 2017 Petroleum Planning & Analysis Cell (Ministry of Petroleum &
KIRBY CORPORATION ANNOUNCES 2017 FIRST QUARTER RESULTS first quarter earnings per share of $0.51 compared with $0.71 in the 2016 first quarter
 KIRBY CORPORATION FOR IMMEDIATE RELEASE Contact: Brian Carey 713-435-1413 KIRBY CORPORATION ANNOUNCES 2017 FIRST QUARTER RESULTS 2017 first quarter earnings per share of $0.51 compared with $0.71 in the
Recent Developments in EU Refining and in the Supply and Trade of Petroleum Products
 Recent Developments in EU Refining and in the Supply and Trade of Petroleum Products Second Meeting of the EU Refining Forum Brussels, 27 November 2013 Toril Bosoni, International Energy Agency OECD/IEA
NASHVILLE DISTRICT UPDATE TRVA ANNUAL CONFERENCE
 NASHVILLE DISTRICT UPDATE TRVA ANNUAL CONFERENCE 1 LTC Cullen A. Jones, P.E., PMP Nashville District Commander Great Lakes and Ohio River Division US Army Corps of Engineers (USACE) 10 October 2017 The
Oil Refining in a CO 2 Constrained World Implications for Gasoline & Diesel Fuels
 Oil Refining in a CO 2 Constrained World Implications for Gasoline & Diesel Fuels Amir F.N. Abdul-Manan & Hassan Babiker Strategic Transport Analysis Team (STAT), Saudi Aramco Agenda 1. Global Mobility
TRAFFIC VOLUME TRENDS July 2002
 TRAFFIC VOLUME TRENDS July 2002 Travel on all roads and streets changed by +2.3 percent for July 2002 as compared to July 2001. Estimated Vehicle-Miles of Travel by Region - July 2002 - (in Billions) West
European Energy Union Impact on the Refining & Petrochemical Business. John Cooper, Director General Budapest, 13th October 2015
 European Energy Union Impact on the Refining & Petrochemical Business John Cooper, Director General Budapest, 13th October 2015 FuelsEurope represents 42 Member Companies 100% of EU Refining Page 2 AGENDA
Macro economic and Energy Factors Driving the Agricultural Outlook
 Macro economic and Energy Factors Driving the Agricultural Outlook Michael Swanson Ph.D. Wells Fargo September 2013 Inter connected Markets Economic growth GDP, Population and Income Currency competition
STATE TAX CHANGES JULY 2017* CALIFORNIA
 STATE TAX CHANGES JULY 2017* CALIFORNIA Effective July 1, 2017, California s tax on diesel will be unchanged at $0.16 per gallon. The tax on gasoline is increased to $0.297 per gallon. There are no changes
TRAFFIC VOLUME TRENDS
 Page 1 U. S. Department Transportation Federal Highway Administration Office Highway Policy Information TRAFFIC VOLUME TRENDS September Travel on all roads and streets changed by +2.5 (5.8 billion vehicle
Crude Export and the New Dynamics
 27 April 2016 Crude Export and the New Dynamics Mel Larson, Principal Consultant SUPERIOR RESULTS. SUSTAINED. Topics of Interest Crude Export Impact The Great Divide Export to everywhere The US Advantage
Q Analyst Teleconference. 9 August 2018
 9 August 218 Disclaimer This presentation contains forward-looking statements that reflect the Company management s current views with respect to certain future events. Although it is believed that the
OUTLINING STORAGE REGIONALLY IN AFRICA How much is sufficient and well-linked storage key to security of supply and competitive pricing?
 Platts African Refining Summit 2014 OUTLINING STORAGE REGIONALLY IN AFRICA How much is sufficient and well-linked storage key to security of supply and competitive pricing? - by Gabriel Ogbechie, Managing
Methodology. Supply. Demand
 Methodology Supply Demand Tipping the Scale 1 Overview Latin America and the Caribbean, a major petroleum product importing region, provides an important counterbalance to surpluses in refined product
9M 2003 Financial Results (US GAAP)
") 9M Financial Results (US GAAP) January 2004 LUKOIL Group Crude Oil Production* mln tonnes 82 80 78 76 74 72 70 68 66 64 Crude oil production 3.2 5.5 3.9 76.8 70.3 71.3 2001 Production by subsidiaries Share
9M Financial Results (US GAAP) January 2004 LUKOIL Group Crude Oil Production* mln tonnes 82 80 78 76 74 72 70 68 66 64 Crude oil production 3.2 5.5 3.9 76.8 70.3 71.3 2001 Production by subsidiaries Share
Energy Security of APEC Economies in a Changing Downstream Oil Environment
 IEEJ Feb. 2018 4th APEC OGSN Forum on 7 March 2018 Session2-2 Energy Security of APEC Economies in a Changing Downstream Oil Environment Takashi MATSUMOTO and Ichiro KUTANI Manager, Global Energy Group