Spot Speed Study. Engineering H191. Autumn, Hannah Zierden, Seat 20. Ryan King, Seat 29. Jae Lee, Seat 23. Alex Rector, Seat 26
|
|
|
- Jeffrey Cameron
- 5 years ago
- Views:
Transcription
1 Spot Speed Study Engineering H191 Autumn, 2011 Hannah Zierden, Seat 20 Ryan King, Seat 29 Jae Lee, Seat 23 Alex Rector, Seat 26 Instructor: Dr. Kathy Harper Class Section: 1:30 Lab Section: Thursday, 1:30-3:18 Date of Experiment: 10/6/11 Date of Submission: 10/27/11
2 1. Introduction The purpose of this experiment was to determine if the speed limit enforcement in a given area was effective. By timing how long it took a car to drive a fixed distance, the approximate speed, in miles per hour, of the car could be determined. By timing as many cars as possible, numerous data points were collected. The speeds and frequencies of the observed cars were then used to calculate mode, percentiles, pace, average speed and deviation. A thorough description of how the experiment was carried out can be found in Section 2, Experimental Methodology. Section 3 of this report, Results and Description, contains observed and calculated data. These results are analyzed in Section 4, Discussion. A summary and concluding statements made from this experiment can be found in Section 5, Summary and Conclusions. 2. Experimental Methodology A stopwatch was used for the experiment. The flagger was at the south end of the marked area, while the recorder and timer were at the north. The safety engineer moved between the groups. The marked area was 176 feet long. Each time the front of a car would enter the speed trap, the flagger would signal to the timer, who would begin timing. Flagging was done in a manner that would not distract drivers. When the car exited the speed trap, the timer would announce the time to the recorder, who would mark a tally in the correct time slot. Figure A1, in Appendix A, shows the data collection sheet used for the experiment. Slots were established by an upper limit and a lower limit that were 2 seconds apart. The limits were measurements of time, in seconds, that corresponded to a measurement of speed, in miles per hour. The time, location, weather and road conditions were also recorded. The safety engineer was in charge of 2
3 ensuring that everyone stayed out of the road. Group members were instructed to rotate positions during the observation period. The group was positioned on the east side of Olentangy River Road. The cars observed were northbound cars in the right lane. Figure A2, in Appendix A, shows the layout of the experiment. The group s location is indicated by a star and the letter H. Cars were observed on October 6, 2011 from 2:00 until 3:00 in the afternoon. It was a sunny day and the road conditions were good. After an hour, data collection was discontinued. As many data points as possible were recorded. 3. Results and Description The raw data was organized and observed results for 112 vehicles are displayed in Table C1, of Appendix C. This set of data is used for all the calculated values throughout the experiment. From the collected data, relative frequency and cumulative frequency of the cars in each speed interval were calculated. The relative frequency is calculated as a percent; the number of cars in the interval divided by the total number of cars, multiplied by 100%. The cumulative frequency is the sum of the percentages of vehicles travelling at or below the maximum speed of the group. For the 35mph speed interval, this would mean adding the relative frequencies of the 33mph, 31mph, 29mph, 27mph and 25mph speed intervals to the relative frequency for the 35mph speed interval to get 17.86% cumulative frequency. The values for relative and cumulative frequency are found in Table 1, on page 4 of this report. 3
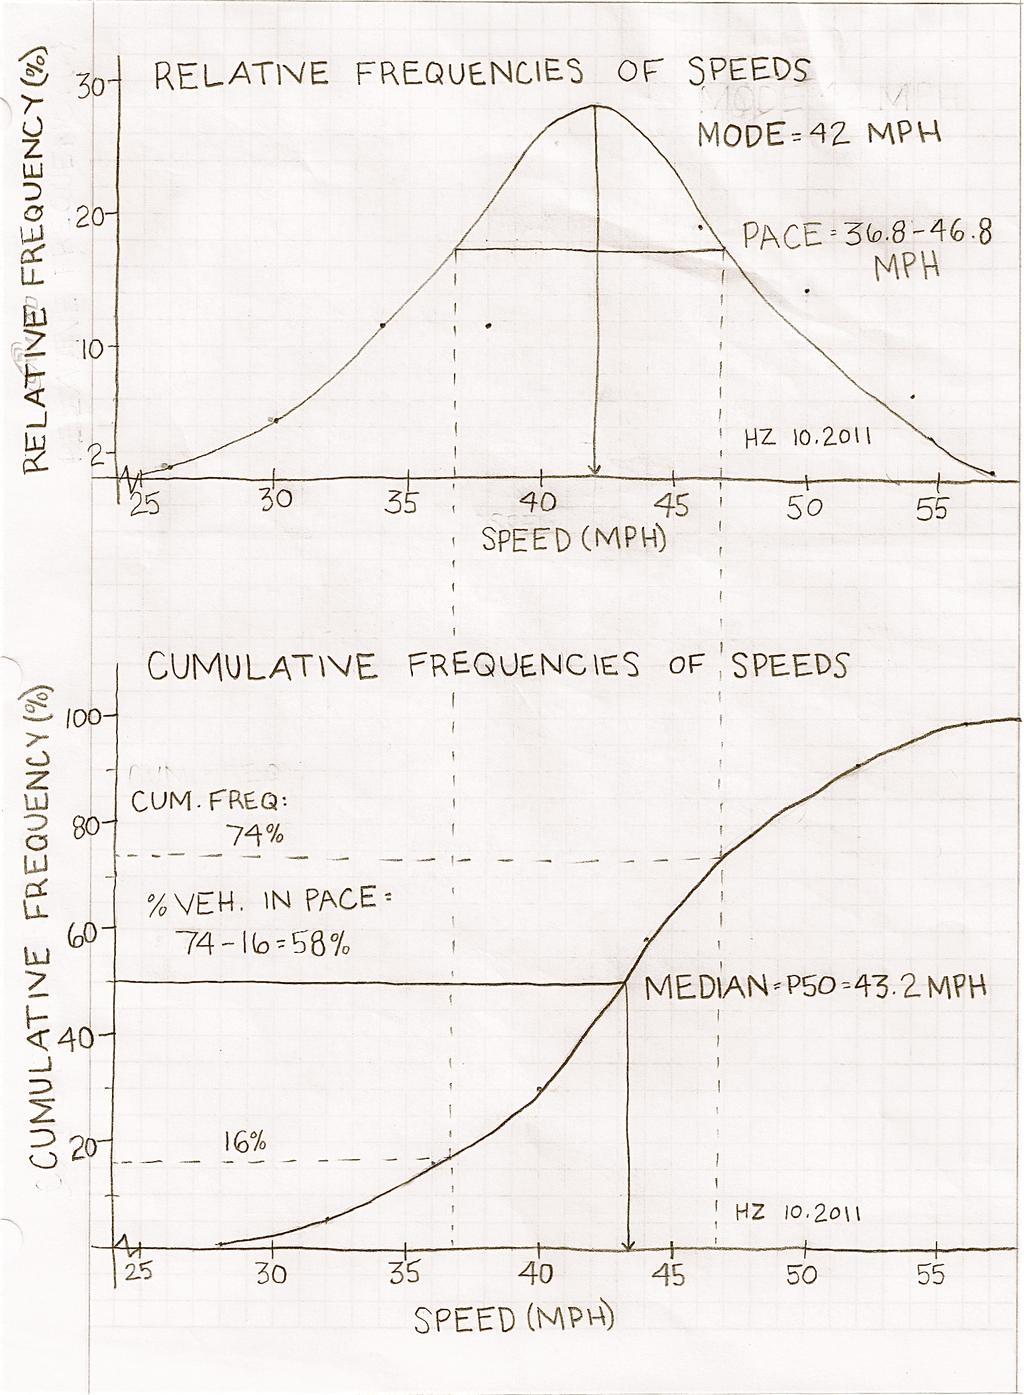
4 Table 1: Calculated relative and cumulative frequencies Middle Speed (mph) Frequency (no. of cars) Relative Frequency (%) Cumulative Frequency (%) The range of time, originally two seconds, was changed to four seconds to produce a graph with one mode peak, rather than two. If two mode peaks appeared in the graph, the pace and the percentage of vehicles in the pace could not be accurately calculated. With two peaks, the graph does not have a smooth, consistent curve nor does it have a central tendency. Neighboring pairs of intervals were combined to create a single mode graph. By adding the maximum speed and minimum speed of each interval, and dividing the sum by two, the average speed for the adjusted interval was calculated. The adjusted frequencies and speeds are shown in Table C2, in Appendix C. The results from Table C2 were plotted on two graphs- one graph showing relative frequency, the other showing cumulative frequency. These graphs are found in Figure C1 in 4
5 Appendix C of this report. Table 2, below, shows the data that was read from Figure C1, as well as calculated values from equations 1, 2, and 3. Table2:ValuesdeterminedfromFigureC1andmathematicallycalculatedvalues Mode(mph) th Percentile Speed(mph) 10mphPace (xtoymph) Percentofvehicles inpace(%) 15 th percentile speed(mph) 85 th percentile speed(mph) AverageSpeed (mph) Estimated StandardDeviation (mph) Calculated StandardDeviation (mph) G % The mode, 42mph, was determined to be the highest point on the Relative Frequency Graph, which is equal to the speed at which the most cars travelled. Values for 50 th Percentile Speed; 43.2mph, 15 th Percentile Speed; 35.7mph, and 85 th Percentile Speed; 50.1mph, were read directly from the Cumulative Frequency Graph in Figure C1. The pace, 36.8mph to 46.8mph, 5
6 was calculated by finding two points on the Relative Frequency Graph that were 10 mph apart. Because the abscissa scales were the same for both graphs, lines were extended from the two endpoints of the pace on the Relative Frequency Graph down to the Cumulative Frequency Graph in order to determine the percent of vehicles in the pace, which was 58%. The calculated values- average speed; 42.43mph, estimated standard deviation; 7.00mph, and calculated standard deviation; 6.33mph- were found using Equations 1, 2 and 3 respectively. The sample calculations are found in Appendix B of this report. Average Speed = n = frequency of observations in group i, cars S = middle speed of interval i, mph N = total number, cars = average speed, mph (1) The values for n i S i, for all speed groups, can be found in Table C3 in Appendix C. Estimated Standard Deviation "# = " " (2) P 85 = 85 th percentile speed, % of cars P 15 = 15 th percentile speed, % of cars "# = estimated deviation, mph 6
7 Calculated Standard Deviation = ( ) (3) x i = middle speed of interval, mph = average speed, mph N= total number, cars s= standard deviation, mph 4. Discussion The raw collected data, as shown in Figure C1, shows that there is a medium amount of dispersion in collected data. Dispersion, in this case, refers to thescatteringofvaluesofa variablearoundthemeanormedianofadistribution. ( 10/25/11) Dispersion shows how widespread the data points were, and deals with the value of standard deviation, or the average of the differences in mean speed and group speed. The cars, on average, were 6.33mph away from the mean of 42.43mph. By analyzing the results in Table 1, one can see that 63.39% of cars were within one standard deviation of the mean. The remaining 36.61% of cars had wide dispersion. The dispersion of data may have come from drivers travelling at speeds faster speed limit % of cars were recorded to be travelling at the posted speed limit, 35mph, while 82.14% of cars were travelling faster than 35mph. The wide range in driving speeds may have accounted for the dispersion of the data. The mode of the graph shows that there is one central tendency. Central tendency refers to the tendency of samples of a given measurement to cluster around some central value. ( 10/10/11) The central value of this experiment is the mode, 42mph. Most of the cars in the experiment were travelling at this speed. There is a central tendency, or 7
8 mode, in the graph because there is a speed limit, and cars have a tendency to drive the speed limit, or in this case, 7mph over the speed limit. Dispersion of data in a speed trap may vary under different conditions. For instance, at the Indy 500 during normal green flag conditions, one might expect to see very little dispersion. If the cars are all travelling at approximately the same speed even if the speed is very fast there will be little difference in the speed of the cars and therefore, narrow dispersion. If a spot speed study was conducted on High Street on a Saturday evening in the spring, with moderate pedestrian traffic, many stop lights and no rain, one might expect to see a wider dispersion of data. With cars accelerating and decelerating due to stoplights and waiting on pedestrians and other vehicles, the collected data may span a wide range of values. Errors may have occurred due to the rotation of team members, distractions to drivers, lane-changing cars and the imperfect method of flagging. With rotation of team members through the different positions, flagging and timing methods may have varied slightly. This could have affected times and values recorded. Inaccuracies may have occurred with the change of each position. Flagging, although intended to be done in subtly, may have distracted drivers. This distraction may have caused them to change their speed, resulting in an inaccurate recorded speed value. Cars that were changing lanes travelled extra distance and were therefore timed for a longer distance than the other cars. This ambiguity was not addressed in the method of recording, so the lane-changing cars were recorded at a slower speed than they were actually travelling. The method of flagging was fairly basic and imprecise. A wave of the hand could have been delayed and the timing, likewise, could have been slightly off. This would have produced an inaccurate speed for the car. 8
9 5. Summary and Conclusions The purpose of this spot speed study was to determine the range of speeds in a speed zone of 35mph and to determine if the legal speed limit enforcement was effective. In this experiment a 176-foot length of road, on Olentangy River Road, was marked off and cars travelling through the zone were timed. The time, in seconds, that the vehicle took to travel the length of the trap was converted to miles per hour on a given record sheet. The data from the observations was manipulated and used to calculate the values of average speed, standard deviation, mode, percentiles, and pace. From this data, conclusions can be made as to the effectiveness of the speed enforcement in the area. The methodology of the experiment could be altered to reduce error. First, it would be advisable to keep all team members in their original positions for the duration of the experiment. This would produce a uniformity that was not present in the original experiment. In order to avoid distracting drivers, a very slight signal could be done. Instead of a hand wave, a small twitch or subtle movement could be used, for example a head turn. Lane changing cars should not be counted because there is no way to accurately measure their distance. The issue of flagging conflicts with the issue of distracting drivers. The subtler the movement, the less likely a driver is to see it. At the same time, the subtler the movement, the less likely the timer is to recognize it quickly. If the team had a budget of $200, the experiment could be changed to reduce error. With $200, two radar guns could be purchased ( 10/12/11). With these tools, the exact speed of the travelling vehicles could be recorded. With two recorded speeds for each observed vehicle, a more precise and accurate value could be calculated. Radar guns would eliminate the error from rotation, lane-changing and imperfect flagging. If observed subtly, driver distraction could be eliminated. 9
10 The average speed of the experiment was calculated to be 42.43mph. This is 7.43mph over the posted speed limit of 35mph. The percentage of cars travelling at 45mph was 18.75%. With this statistic, it can be concluded that speed enforcement is not effective in this area. Further experiments could be carried out to collect more data on this subject. For instance, data collection should be taken at different times, different days and during different weather conditions. This would give more diverse and more accurate data. Future errors could be avoided by using a more precise method of recording and by having a better plan for how to record data. From the results collected in this study, it can be concluded that most data would produce results that show drivers to be travelling at speeds faster than the posted limit. 10
11 APPENDIX(A( ( Experimental(Setup( (

12 Figure(A1:(ExperimentalSet0Up,takenfrom SpotSpeedSlides02011,FEH CourseMaterials:< A1
13 APPENDIX(B( ( Sample(Calculations( (
14 Average(Speed(of(Group( ( ( ( ( "# = "# "# (1) Relative(Frequency(( ( ( ( ( = 100% (2) Cumulative(Frequency( ( ( ( (, = +, (((( (3) Average(Speed((((((((((((((((((((((((((((((((( ( ( ( (= (4) Sum$of$all$speeds$in$interval$ $ $ $ nisi$ $ $ (4a) Standard(Deviation(( ( ( ( ( ( Estimated$ $ $ $ $ $ $ "# = " " $ (5) Calculated$ $ $ $ $ $ $ = ( ) $ (6) Allcalculationsusethe30mphpoint,unlesstheentirescopeofvaluesisneeded. ( Sample(Calculation(for(Average(Speed(of(Group "# = "" =30mph ( Sample(Calculation(for(the(Relative(Frequency = 5 100% = 4.46% 112 ( Sample(Calculation(for(the(Cumulative(Frequency, = 4.46% % = 5.36% ( B1
15 Sample(Calculation(for(the(Average(Speed( Sum$of$all$speeds$in$interval$ nisi$=30mphx5=150mph = ""#"#"#"##"#"""#" " = 42.63"ℎ Sample(Calculation(for(Standard(Deviation Estimated "# = 50"ℎ 36"ℎ = 7.00"ℎ 2 Calculated$ = ("""."") ("""."") " + "("""."") "("""."") "("""."") " ("""."") "("""."") ("""."") ("""."") " =6.48mph + B2
16 APPENDIX(C( ( Figures(and(Tables
17 Figure(C1:Graphofrelativeandcumulativefrequencies(%)asappliedtospeedsof observedcars. C1
18 Table(C1:ValuesdeterminedfromFigureC1andmathematicallycalculatedvalues Mode(mph) th Percentile Speed(mph) 10mphPace (xtoymph) Percentofvehicles inpace(%) 15 th percentile speed(mph) 85 th percentile speed(mph) K % AverageSpeed (mph) Estimated StandardDeviation (mph) Calculated StandardDeviation (mph) Table(C2:Thesumofallspeedswithineachspeedinterval Middle Frequency ns Speed C2
The purpose of this experiment was to determine if current speed limit postings are
 Memorandum To: Jen Keidel From: Christina Ochs (Seat 28) Date: 1/19/12 Re: Spot Speed Memo 1. Introduction The purpose of this experiment was to determine if current speed limit postings are satisfactory
POLICY FOR THE ESTABLISHMENT AND POSTING OF SPEED LIMITS ON COUNTY AND TOWNSHIP HIGHWAYS WITHIN MCHENRY COUNTY, ILLINOIS
 POLICY FOR THE ESTABLISHMENT AND POSTING OF SPEED LIMITS ON COUNTY AND TOWNSHIP HIGHWAYS WITHIN MCHENRY COUNTY, ILLINOIS MCHENRY COUNTY DIVISION OF TRANSPORTATION 16111 NELSON ROAD WOODSTOCK, IL 60098
Engineering Dept. Highways & Transportation Engineering
 The University College of Applied Sciences UCAS Engineering Dept. Highways & Transportation Engineering (BENG 4326) Instructors: Dr. Y. R. Sarraj Chapter 4 Traffic Engineering Studies Reference: Traffic
Chapter 12 VEHICLE SPOT SPEED STUDY
 Chapter 12 VEHICLE SPOT SPEED STUDY 12.1 PURPOSE (1) The Vehicle Spot Speed Study is designed to measure the speed characteristics at a specified location under the traffic and environmental conditions
WIM #40 US 52, MP S. ST. PAUL, MN APRIL 2010 MONTHLY REPORT
 WIM #40 US 52, MP 126.8 S. ST. PAUL, MN APRIL 2010 MONTHLY REPORT In order to understand the vehicle classes and groupings the Mn/DOT Vehicle Classification Scheme and the Vehicle Class Groupings for Forecasting
WIM #39 MN 43, MP 45.2 WINONA, MN APRIL 2010 MONTHLY REPORT
 WIM #39 MN 43, MP 45.2 WINONA, MN APRIL 2010 MONTHLY REPORT In order to understand the vehicle classes and groupings the Mn/DOT Vehicle Classification Scheme and the Vehicle Class Groupings for Forecasting
Evaluation of Renton Ramp Meters on I-405
 Evaluation of Renton Ramp Meters on I-405 From the SE 8 th St. Interchange in Bellevue to the SR 167 Interchange in Renton January 2000 By Hien Trinh Edited by Jason Gibbens Northwest Region Traffic Systems
Oregon DOT Slow-Speed Weigh-in-Motion (SWIM) Project: Analysis of Initial Weight Data
 Project: Analysis of Initial Weight Data") Portland State University PDXScholar Center for Urban Studies Publications and Reports Center for Urban Studies 7-1997 Oregon DOT Slow-Speed Weigh-in-Motion (SWIM) Project: Analysis of Initial Weight Data
Portland State University PDXScholar Center for Urban Studies Publications and Reports Center for Urban Studies 7-1997 Oregon DOT Slow-Speed Weigh-in-Motion (SWIM) Project: Analysis of Initial Weight Data
Appendix B CTA Transit Data Supporting Documentation
 RED ED-PURPLE BYPASS PROJECT ENVIRONMENTAL ASSESSMENT AND SECTION 4(F) EVALUATION Appendix B CTA Transit Data Supporting Documentation 4( Memorandum Date: May 14, 2015 Subject: Chicago Transit Authority
Trip Generation Study: Provo Assisted Living Facility Land Use Code: 254
 Trip Generation Study: Provo Assisted Living Facility Land Use Code: 254 Introduction The Brigham Young University Institute of Transportation Engineers (BYU ITE) student chapter completed a trip generation
Transportation & Traffic Engineering
 Transportation & Traffic Engineering 1) Project Description This report presents a summary of findings for a Traffic Impact Analysis (TIA) performed by A+ Engineering, Inc. for the Hill Country Family
Speed measurements were taken at the following three locations on October 13 and 14, 2016 (See Location Map in Exhibit 1):
:") 2709 McGraw Drive Bloomington, Illinois 61704 p 309.663.8435 f 309.663.1571 www.f-w.com www.greennavigation.com November 4, 2016 Mr. Kevin Kothe, PE City Engineer City of Bloomington Public Works Department
2709 McGraw Drive Bloomington, Illinois 61704 p 309.663.8435 f 309.663.1571 www.f-w.com www.greennavigation.com November 4, 2016 Mr. Kevin Kothe, PE City Engineer City of Bloomington Public Works Department
DRIVER SPEED COMPLIANCE WITHIN SCHOOL ZONES AND EFFECTS OF 40 PAINTED SPEED LIMIT ON DRIVER SPEED BEHAVIOURS Tony Radalj Main Roads Western Australia
 DRIVER SPEED COMPLIANCE WITHIN SCHOOL ZONES AND EFFECTS OF 4 PAINTED SPEED LIMIT ON DRIVER SPEED BEHAVIOURS Tony Radalj Main Roads Western Australia ABSTRACT Two speed surveys were conducted on nineteen
Traffic Engineering Study
 Traffic Engineering Study Bellaire Boulevard Prepared For: International Management District Technical Services, Inc. Texas Registered Engineering Firm F-3580 November 2009 Executive Summary has been requested
CONTENTS I. INTRODUCTION... 2 II. SPEED HUMP INSTALLATION POLICY... 3 III. SPEED HUMP INSTALLATION PROCEDURE... 7 APPENDIX A... 9 APPENDIX B...
 Speed Hump Program CONTENTS I. INTRODUCTION... 2 II. SPEED HUMP INSTALLATION POLICY... 3 1. GENERAL... 3 2. ELIGIBILITY REQUIREMENTS... 3 A. PETITION... 3 B. OPERATIONAL AND GEOMETRIC CHARACTERISTICS OF
King Soopers #116 Thornton, Colorado
 Traffic Impact Study King Soopers #116 Thornton, Colorado Prepared for: Galloway & Company, Inc. T R A F F I C I M P A C T S T U D Y King Soopers #116 Thornton, Colorado Prepared for Galloway & Company
TECHNICAL MEMORANDUM. Part A: Introduction
 TECHNICAL MEMORANDUM To: David J. Decker Decker Properties, Inc. 5950 Seminole Centre Ct. Suite 200 Madison, Wisconsin 53711 608-663-1218 Fax: 608-663-1226 www.klengineering.com From: Mike Scarmon, P.E.,
2016 Congestion Report
 2016 Congestion Report Metropolitan Freeway System May 2017 2016 Congestion Report 1 Table of Contents Purpose and Need...3 Introduction...3 Methodology...4 2016 Results...5 Explanation of Percentage Miles
Speed Evaluation Saw Mill Drive
 Speed Evaluation Saw Mill Drive Prepared for: Mount Laurel Township Burlington County, New Jersey Prepared by: Dana Litwornia Litwornia & Associates, Inc. Transportation, Traffic & Environmental Engineering
LAWRENCE TRANSIT CENTER LOCATION ANALYSIS 9 TH STREET & ROCKLEDGE ROAD / 21 ST STREET & IOWA STREET LAWRENCE, KANSAS
 LAWRENCE TRANSIT CENTER LOCATION ANALYSIS 9 TH STREET & ROCKLEDGE ROAD / 21 ST STREET & IOWA STREET LAWRENCE, KANSAS TRAFFIC IMPACT STUDY FEBRUARY 214 OA Project No. 213-542 TABLE OF CONTENTS 1. INTRODUCTION...
TRAFFIC IMPACT DATA. Dillons #98 On-Site Relocation
 TRAFFIC IMPACT DATA For Dillons #98 On-Site Relocation COMMERCIAL DEVELOPMENT 1740 Massachusetts Street Lawrence, KS Revised April 6, 2011 Prepared by: Pickering Firm, Inc. Introduction The project site
#6 IN A SERIES SHARING THE ROAD. How to stay safe.
 #6 IN A SERIES SHARING THE ROAD How to stay safe. SM Today, there are more vehicles on the road than ever. That s why it s important to be aware of vehicles around you as well as where you re driving.
Introduction. 3. The sample calculations used throughout this paper are based on a roadway posted at 35 mph.
 Calculating a Legally Enforceable Yellow Change Interval For Turning Lanes in California by Jay Beeber, Executive Director, Safer Streets L.A., Member ITE and J. J. Bahen, Jr., P.E., Life Member National
RE: A Traffic Impact Statement for a proposed development on Quinpool Road
 James J. Copeland, P.Eng. GRIFFIN transportation group inc. 30 Bonny View Drive Fall River, NS B2T 1R2 May 31, 2018 Ellen O Hara, P.Eng. Project Engineer DesignPoint Engineering & Surveying Ltd. 200 Waterfront
Traffic Impact Analysis. Alliance Cole Avenue Residential Site Dallas, Texas. Kimley-Horn and Associates, Inc. Dallas, Texas.
 Traffic Impact Analysis Alliance Cole Avenue Residential Site Dallas, Texas February 15, 2018 Kimley-Horn and Associates, Inc. Dallas, Texas Project #064524900 Registered Firm F-928 Traffic Impact Analysis
EXECUTIVE SUMMARY. The following is an outline of the traffic analysis performed by Hales Engineering for the traffic conditions of this project.
 EXECUTIVE SUMMARY This study addresses the traffic impacts associated with the proposed Shopko redevelopment located in Sugarhouse, Utah. The Shopko redevelopment project is located between 1300 East and
Metropolitan Freeway System 2013 Congestion Report
 Metropolitan Freeway System 2013 Congestion Report Metro District Office of Operations and Maintenance Regional Transportation Management Center May 2014 Table of Contents PURPOSE AND NEED... 1 INTRODUCTION...
Burn Characteristics of Visco Fuse
 Originally appeared in Pyrotechnics Guild International Bulletin, No. 75 (1991). Burn Characteristics of Visco Fuse by K.L. and B.J. Kosanke From time to time there is speculation regarding the performance
Descriptive Statistics
 Chapter 2 Descriptive Statistics 2-1 Overview 2-2 Summarizing Data 2-3 Pictures of Data 2-4 Measures of Central Tendency 2-5 Measures of Variation 2-6 Measures of Position 2-7 Exploratory Data Analysis
Parking Studies. Lecture Notes in Transportation Systems Engineering. Prof. Tom V. Mathew. 1 Overview 1
 Parking Studies Lecture Notes in Transportation Systems Engineering Prof. Tom V. Mathew Contents 1 Overview 1 2 Parking system 1 2.1 On street parking.................................. 2 2.2 Off street
Southern Windsor County 2016 Traffic Count Program Summary April 2017
 Southern Windsor County 2016 Traffic Count Program Summary April 2017 The Southern Windsor County Regional Planning Commission (the RPC ) has been monitoring traffic at 19 locations throughout the southern
Traffic Impact Study Speedway Gas Station Redevelopment
 Traffic Impact Study Speedway Gas Station Redevelopment Warrenville, Illinois Prepared For: Prepared By: April 11, 2018 Table of Contents 1. Introduction... 1 2. Existing Conditions... 4 Site Location...
Bennett Pit. Traffic Impact Study. J&T Consulting, Inc. Weld County, Colorado. March 3, 2017
 Bennett Pit Traffic Impact Study J&T Consulting, Inc. Weld County, Colorado March 3, 217 Prepared By: Sustainable Traffic Solutions, Inc. http://www.sustainabletrafficsolutions.com/ Joseph L. Henderson,
Missouri River Mainstem Reservoirs Runoff Volumes for Annual Operating Plan Studies RCC Technical Report Jy-08
 Missouri River Region Since 1953 US Army Corps of Engineers Reservoir Control Center Missouri River Region Northwestern Division Reservoir Control Center July 2008 Missouri River Basin Fort Peck Montana
Comparing Flow and Pressure Drop in Mufflers
 UNIVERSITY OF IDAHO GAUSS ENGINEERING Comparing Flow and Pressure Drop in Mufflers A Statistical Analysis Jeremy Cuddihy, Chris Ohlinger, Steven Slippy, and Brian Lockner 10/24/2012 Table Of Contents Topic
Project Title: Using Truck GPS Data for Freight Performance Analysis in the Twin Cities Metro Area Prepared by: Chen-Fu Liao (PI) Task Due: 9/30/2013
 Task Due: 9/30/2013") MnDOT Contract No. 998 Work Order No.47 213 Project Title: Using Truck GPS Data for Freight Performance Analysis in the Twin Cities Metro Area Prepared by: Chen-Fu Liao (PI) Task Due: 9/3/213 TASK #4:
MnDOT Contract No. 998 Work Order No.47 213 Project Title: Using Truck GPS Data for Freight Performance Analysis in the Twin Cities Metro Area Prepared by: Chen-Fu Liao (PI) Task Due: 9/3/213 TASK #4:
Missouri Seat Belt Usage Survey for 2017
 Missouri Seat Belt Usage Survey for 2017 Conducted for the Highway Safety & Traffic Division of the Missouri Department of Transportation by The Missouri Safety Center University of Central Missouri Final
WHITE PAPER. Preventing Collisions and Reducing Fleet Costs While Using the Zendrive Dashboard
 WHITE PAPER Preventing Collisions and Reducing Fleet Costs While Using the Zendrive Dashboard August 2017 Introduction The term accident, even in a collision sense, often has the connotation of being an
RE: 3605 Paul Anka Drive Addendum #2 to the December 2012 Traffic Impact Study
 19 May 2015 BY EMAIL: asaggarwal@gmail.com Manor Park Management 231 Brittany Drive, Suite D Ottawa, ON K1K 0R8 Attention: Mr. Anand Aggarwal RE: 3605 Paul Anka Drive Addendum #2 to the December 2012 Traffic
2. ELIGIBILITY REQUIREMENTS
 Speed Hump Policy 1. GENERAL The purpose of this policy is to provide guidelines for the application of speed humps. A "speed hump" is a gradual rise and fall of pavement surface across the width of the
FINAL REPORT AP STATISTICS CLASS DIESEL TRUCK COUNT PROJECT
 FINAL REPORT AP STATISTICS CLASS 2017-2018 DIESEL TRUCK COUNT PROJECT Authors: AP Statistics Class 2017-2018 Table of Contents SURVEY QUESTION...p. 2 AIR QUALITY...p. 3-4 TOTAL TRUCK COUNTS.p. 5 TRUCK
Vehicle Speeds in School Zones
 Vehicle Speeds in School Zones THE POSTED SPEED LIMIT IN SCHOOL ZONES IS 20 MPH, AND VARIOUS TYPES OF SIGNS THAT INFORM DRIVERS OF THE SCHOOL-ZONE SPEED LIMIT ARE IN USE. THE STUDY DISCUSSED IN THIS FEATURE
CHARACTERIZATION AND DEVELOPMENT OF TRUCK LOAD SPECTRA FOR CURRENT AND FUTURE PAVEMENT DESIGN PRACTICES IN LOUISIANA
 CHARACTERIZATION AND DEVELOPMENT OF TRUCK LOAD SPECTRA FOR CURRENT AND FUTURE PAVEMENT DESIGN PRACTICES IN LOUISIANA LSU Research Team Sherif Ishak Hak-Chul Shin Bharath K Sridhar OUTLINE BACKGROUND AND
Pembina Emerson Border Crossing Interim Measures Microsimulation
 Pembina Emerson Border Crossing Interim Measures Microsimulation Final Report December 2013 Prepared for: North Dakota Department of Transportation Prepared by: Advanced Traffic Analysis Center Upper Great
Introduction and Background Study Purpose
 Introduction and Background The Brent Spence Bridge on I-71/75 across the Ohio River is arguably the single most important piece of transportation infrastructure the Ohio-Kentucky-Indiana (OKI) region.
IRSCH REEN Hirsch/Green Transportation Consulting, Inc.
 IRSCH REEN Hirsch/Green Transportation Consulting, Inc. February 6, 2013 Mr. David Weil Director of Finance St. Matthew s Parish School 1031 Bienveneda Avenue Pacific Palisades, California 90272 RE: Trip
WIM #41 CSAH 14, MP 14.9 CROOKSTON, MINNESOTA MAY 2013 MONTHLY REPORT
 WIM #41 CSAH 14, MP 14.9 CROOKSTON, MINNESOTA MAY 2013 MONTHLY REPORT In order to understand the vehicle classes and groupings the Mn/DOT Vehicle Classification Scheme and the Vehicle Classification Groupings
Table 1 - Land Use Comparisons - Proposed King s Wharf Development. Retail (SF) Office (SF) 354 6,000 10, Land Uses 1
 Office (SF) 354 6,000 10, Land Uses 1") Ref. No. 171-6694 Phase 2 November 23, 217 Mr. David Quilichini, Vice President Fares & Co. Developments Inc. 31 Place Keelson Sales Centre DARTMOUTH NS B2Y C1 Sent Via Email to David@faresinc.com RE:
Ref. No. 171-6694 Phase 2 November 23, 217 Mr. David Quilichini, Vice President Fares & Co. Developments Inc. 31 Place Keelson Sales Centre DARTMOUTH NS B2Y C1 Sent Via Email to David@faresinc.com RE:
Isaac Newton vs. Red Light Cameras
 2012 Isaac Newton vs. Red Light Cameras Approach Speed vs. Speed Limit Brian Cecvehicleelli redlightrobber.com 3/1/2012 Table of Contents Approach Speed vs. Speed Limit... 3 Definition of Speed Limit...
King County Metro. Columbia Street Transit Priority Improvements Alternative Analysis. Downtown Southend Transit Study. May 2014.
 King County Metro Columbia Street Transit Priority Improvements Alternative Analysis Downtown Southend Transit Study May 2014 Parametrix Table of Contents Introduction... 1 Methodology... 1 Study Area...
TRAFFIC ENGINEERING DIVISION INSTRUCTIONAL & INFORMATIONAL MEMORANDUM
 VIRGINIA DEPARTMENT OF TRANSPORTATION TRAFFIC ENGINEERING DIVISION INSTRUCTIONAL & INFORMATIONAL MEMORANDUM GENERAL SUBJECT: Portable Temporary Rumble Strips (PTRS) SPECIFIC SUBJECT: Guidelines for the
Technical Memorandum Analysis Procedures and Mobility Performance Measures 100 Most Congested Texas Road Sections What s New for 2015
 Technical Memorandum Analysis Procedures and Mobility Performance Measures 100 Most Congested Texas Road Sections Prepared by Texas A&M Transportation Institute August 2015 This memo documents the analysis
COUNTY ROAD SPEED LIMITS. Policy 817 i
 Table of Contents COUNTY ROAD SPEED LIMITS Policy 817.1 PURPOSE... 1.2 APPLICABILITY... 1.3 DEFINITIONS... 1.4 STATE ENABLING LEGISLATION... 2.5 SPEED LIMITS ON COUNTY ROADS (CCC 11.04)... 2.6 ESTABLISHING
I-95 Corridor Coalition Vehicle Probe Project: HERE, INRIX and TOMTOM Data Validation
 I-95 Corridor Coalition Vehicle Probe Project: HERE, INRIX and TOMTOM Data Validation Report for Georgia (#03) I-75 Prepared by: Masoud Hamedi, Sanaz Aliari, Sara Zahedian University of Maryland, College
APPENDIX C1 TRAFFIC ANALYSIS DESIGN YEAR TRAFFIC ANALYSIS
 APPENDIX C1 TRAFFIC ANALYSIS DESIGN YEAR TRAFFIC ANALYSIS DESIGN YEAR TRAFFIC ANALYSIS February 2018 Highway & Bridge Project PIN 6754.12 Route 13 Connector Road Chemung County February 2018 Appendix
TRAFFIC PARKING ANALYSIS
 TRAFFIC PARKING ANALYSIS NAPA FLEA MARKET COUNTY OF NAPA Prepared for: Tom Harding Napa-Vallejo Flea Market 33 Kelly Road American Canyon, CA 9453 Prepared by: 166 Olympic Boulevard, Suite 21 Walnut Creek,
WIM #41 CSAH 14, MP 14.9 CROOKSTON, MINNESOTA APRIL 2014 MONTHLY REPORT
 WIM #41 CSAH 14, MP 14.9 CROOKSTON, MINNESOTA APRIL 2014 MONTHLY REPORT In order to understand the vehicle classes and groupings, the MnDOT Vehicle Classification Scheme and the Vehicle Classification
Performance means how fast will it go? How fast will it climb? How quickly it will take-off and land? How far it will go?
 Performance Concepts Speaker: Randall L. Brookhiser Performance means how fast will it go? How fast will it climb? How quickly it will take-off and land? How far it will go? Let s start with the phase
Construction Realty Co.
 MEMORANDUM TO: FROM : Jeff Pickus Construction Realty Co. Luay R. Aboona, PE Principal 9575 West Higgins Road, Suite 400 Rosemont, Illinois 60018 p: 847-518-9990 f: 847-518-9987 DATE: May 22, 2014 SUBJECT:
MILLERSVILLE PARK TRAFFIC IMPACT ANALYSIS ANNE ARUNDEL COUNTY, MARYLAND
 MILLERSVILLE PARK TRAFFIC IMPACT ANALYSIS ANNE ARUNDEL COUNTY, MARYLAND Prepared for: Department of Public Works Anne Arundel County Prepared by: URS Corporation 4 North Park Drive, Suite 3 Hunt Valley,
COUNTY ROAD SPEED LIMITS. Policy 817 i
 Table of Contents COUNTY ROAD SPEED LIMITS Policy 817.1 PURPOSE... 2.2 APPLICABILITY... 2.3 DEFINITIONS... 2.4 STATE ENABLING LEGISLATION... 3.5 SPEED LIMITS ON COUNTY ROADS (CCC 11.04)... 3.6 ESTABLISHING
SJSU ENGR 10 Wind Turbine Power Measurement Procedure
 SJSU ENGR 10 Wind Turbine Power Measurement Procedure In this lab, we determine the maximum electrical power that your wind turbine can generate. This involves the use of two key components: a power meter
Establishing Realistic Speed Limits
 Establishing Realistic Speed Limits Establishing Realistic Speed Limits This publication updates the Setting Realistic Speed Limits booklet which was originally produced in the 1970s. Technical references
I-95 Corridor Coalition Vehicle Probe Project: HERE, INRIX and TOMTOM Data Validation. Report for North Carolina (#08) I-240, I-40 and I-26
 I-240, I-40 and I-26") I-95 Corridor Coalition Vehicle Probe Project: HERE, INRIX and TOMTOM Data Validation Report for North Carolina (#08) I-240, I-40 and I-26 Prepared by: Masoud Hamedi, Sanaz Aliari University of Maryland,
I-95 Corridor Coalition Vehicle Probe Project: HERE, INRIX and TOMTOM Data Validation Report for North Carolina (#08) I-240, I-40 and I-26 Prepared by: Masoud Hamedi, Sanaz Aliari University of Maryland,
Skills and Sequences for In-Car Instruction
 The stopping procedure (shoulder parking) Check the rear view mirror Check the blind spot Right Bring the vehicle towards to the curb at designated point Stop 30 cm away from the curb Once you stop your
Simulating Trucks in CORSIM
 Simulating Trucks in CORSIM Minnesota Department of Transportation September 13, 2004 Simulating Trucks in CORSIM. Table of Contents 1.0 Overview... 3 2.0 Acquiring Truck Count Information... 5 3.0 Data
AusRAP assessment of Peak Downs Highway 2013
 AusRAP assessment of Peak Downs Highway 2013 SUMMARY The Royal Automobile Club of Queensland (RACQ) commissioned an AusRAP assessment of Peak Downs Highway based on the irap protocol. The purpose is to
Interim Advice Note 137/10. The use of Stepped Speed Limits at Roadworks. Interim Advice Note 137/10 Stepped Speed Limits
 Interim Advice Note 137/10 The use of Stepped Speed Limits at Roadworks IAN 137/10 Page 1 of 5 Nov 10 Interim Advice Note 137/10 The Use of Summary This document provides an introduction to (SSL) on the
PERFORMANCE ACTIVITY 603 SIGNS
 PERFORMANCE ACTIVITY 603 SIGNS WORK DESCRIPTION 3 WORK DESCRIPTION 4 WORK DESCRIPTION 6 New Install Maintenance / Replace Temporary 603 SIGNS ACTIVITY DESCRIPTION Install new signs and maintain and replace
Act 229 Evaluation Report
 R22-1 W21-19 W21-20 Act 229 Evaluation Report Prepared for Prepared by Table of Contents 1. Documentation Page 3 2. Executive Summary 4 2.1. Purpose 4 2.2. Evaluation Results 4 3. Background 4 4. Approach
Transmission Error in Screw Compressor Rotors
 Purdue University Purdue e-pubs International Compressor Engineering Conference School of Mechanical Engineering 2008 Transmission Error in Screw Compressor Rotors Jack Sauls Trane Follow this and additional
Evaluation of Major Street Speeds for Minnesota Intersection Collision Warning Systems
 Evaluation of Major Street Speeds for Minnesota Intersection Collision Warning Systems Shauna Hallmark, Principal Investigator Center for Transportation Research and Education Iowa State University June
Fuel Strategy (Exponential Decay)
") By Ten80 Education Fuel Strategy (Exponential Decay) STEM Lesson for TI-Nspire Technology Objective: Collect data and analyze the data using graphs and regressions to understand conservation of energy
By Ten80 Education Fuel Strategy (Exponential Decay) STEM Lesson for TI-Nspire Technology Objective: Collect data and analyze the data using graphs and regressions to understand conservation of energy
Oklahoma Gas & Electric P.O. Box 321 Oklahoma City, OK, Main Street, Suite 900 Cambridge, MA 02142
 Final Report Oklahoma Gas & Electric System Loss Study Submitted to Oklahoma Gas & Electric P.O. Box 321 Oklahoma City, OK, 73101-0321 Submitted by Stone & Webster Management Consultants, Inc. 1 Main Street,
Appendix J Traffic Impact Study
 MRI May 2012 Appendix J Traffic Impact Study Level 2 Traffic Assessment Limited Impact Review Appendix J [This page was left blank intentionally.] www.sgm-inc.com Figure 1. Site Driveway and Trail Crossing
3.15 SAFETY AND SECURITY
 3.15 SAFETY AND SECURITY Introduction This section describes the environmental setting and potential effects of the alternatives analyzed in this EIR with regard to safety and security in the SantaClara-Alum
Collision Analysis Safety Tables
 Crash Severity Geography of Geography of Time and Date of Crash Conditions Features Features.. Queries Selected: Town(Hartford), Date(Year:All or //05 to 9/7/06), Severity(All), Route Class(Interstate),
Metropolitan Freeway System 2007 Congestion Report
 Metropolitan Freeway System 2007 Congestion Report Minnesota Department of Transportation Office of Traffic, Safety and Operations Freeway Operations Section Regional Transportation Management Center March
VEHICLE FLEET MANAGEMENT AT THE IDAHO NATIONAL ENGINEERING AND ENVl RONMENTAL LABORATORY
 VEHICLE FLEET MANAGEMENT AT THE IDAHO NATIONAL ENGINEERING AND ENVl RONMENTAL LABORATORY March 1999 DISCLAIMER Portions of this document may be illegible in electronic image products. Images are produced
Traffic, Transportation & Civil Engineering Ali R. Khorasani, P.E. P.O. Box 804, Spencer, MA 01562, Tel: (508)
") Associates Traffic, Transportation & Civil Engineering Ali R. Khorasani, P.E. P.O. Box 804, Spencer, MA 01562, Tel: (508) 885-5121 Ms. Teri Ford, Associate 800 Boylston Street, Suite 1570 Boston, MA July
Associates Traffic, Transportation & Civil Engineering Ali R. Khorasani, P.E. P.O. Box 804, Spencer, MA 01562, Tel: (508) 885-5121 Ms. Teri Ford, Associate 800 Boylston Street, Suite 1570 Boston, MA July
SPEED CUSHION POLICY AND INSTALLATION PROCEDURES FOR RESIDENTIAL STREETS
 SPEED CUSHION POLICY AND INSTALLATION PROCEDURES FOR RESIDENTIAL STREETS CITY OF GRAND PRAIRIE TRANSPORTATION SERVICES DEPARTMENT SPEED CUSHION INSTALLATION POLICY A. GENERAL Speed cushions are an effective
SpeedGuard Radar Speed Reporting System
 Report Title Report Date: 2000 SpeedGuard Radar Speed Reporting System Principle Investigator Vendor Name and Address Name Meyer, Eric Speed Measurement Labs Affiliation Meyer ITS Carl Fors Address 2617
Clean Harbors Canada, Inc.
 Clean Harbors Canada, Inc. Proposed Lambton Landfill Expansion Environmental Assessment Terms of Reference Transportation Assessment St. Clair Township, Ontario September 2009 itrans Consulting Inc. 260
A Gap-Based Approach to the Left Turn Signal Warrant. Jeremy R. Chapman, PhD, PE, PTOE Senior Traffic Engineer American Structurepoint, Inc.
 A Gap-Based Approach to the Left Turn Signal Warrant Jeremy R. Chapman, PhD, PE, PTOE Senior Traffic Engineer American Structurepoint, Inc. March 5, 2019 - The problem: Existing signalized intersection
Exploring Electric Vehicle Battery Charging Efficiency
 September 2018 Exploring Electric Vehicle Battery Charging Efficiency The National Center for Sustainable Transportation Undergraduate Fellowship Report Nathaniel Kong, Plug-in Hybrid & Electric Vehicle
SPEED ZONING ON TEXAS HIGHWAYS
 SPEED ZONING ON TEXAS HIGHWAYS Where do speed zones come from? How do they come up with speed limits? Questions like this are common in the minds of most citizens when it comes to highway speed limits,
Battery Capacity Versus Discharge Rate
 Exercise 2 Battery Capacity Versus Discharge Rate EXERCISE OBJECTIVE When you have completed this exercise, you will be familiar with the effects of the discharge rate and battery temperature on the capacity
MEMORANDUM. Figure 1. Roundabout Interchange under Alternative D
 MEMORANDUM Date: To: Liz Diamond, Dokken Engineering From: Subject: Dave Stanek, Fehr & Peers Western Placerville Interchanges 2045 Analysis RS08-2639 Fehr & Peers has completed a transportation analysis
Speed Workshop. In this workshop we will be covering: a. Average speed b. Units c. Relative Speeds d. Distance/time graphs
 Speed Workshop In this workshop we will be covering: a. Average speed b. Units c. Relative Speeds d. Distance/time graphs Average speed Speed is how quickly an object can cover a distance. You may also
Speed Limit and Safety Nexus Studies for Automated Enforcement Locations in the District of Columbia 3rd Street Tunnel at Massachusetts Avenue Exit
 Speed Limit and Safety Nexus Studies for Automated Enforcement Locations in the District of Columbia 3rd Street Tunnel at Massachusetts Avenue Exit Study Area and Location District PSA Ward ANC Phase Description
APPENDIX C ROADWAY BEFORE-AND-AFTER STUDY
 APPENDIX C ROADWAY BEFORE-AND-AFTER STUDY The benefits to pedestrians and bus patrons are numerous when a bus bay is replaced with a bus bulb. Buses should operate more efficiently at the stop when not
Introducing the OMAX Generation 4 cutting model
 Introducing the OMAX Generation 4 cutting model 8/11/2014 It is strongly recommend that OMAX machine owners and operators read this document in its entirety in order to fully understand and best take advantage
Effect of Police Control on U-turn Saturation Flow at Different Median Widths
 Effect of Police Control on U-turn Saturation Flow at Different Widths Thakonlaphat JENJIWATTANAKUL 1 and Kazushi SANO 2 1 Graduate Student, Dept. of Civil and Environmental Eng., Nagaoka University of
Freeway Weaving and Ramp Junction Analysis
 TEXAS TECH UNIVERSITY Freeway Weaving and Ramp Junction Analysis Along IH 27 at Plainview, TX Hao Xu, Jared A. Squyres, Wesley Kumfer, and Hongchao Liu 7/15/2011 Table of Contents Project Description...
Spot Speed. Select Study Methodology. Select Location. Complete Study. Document
 Spot Speed Select Study Methodology 1. etere the issue at hand 2. oes the study require a small or large sample 3. Select the stopwatch, radar meter, or pneumatic road tube method Select Location 1. Select
WIM #29 was operational for the entire month of October Volume was computed using all monthly data.
 OCTOBER 2015 WIM Site Location WIM #29 is located on US 53 near Cotton in St Louis county. System Operation WIM #29 was operational for the entire month of October 2015. Volume was computed using all monthly
Appendix H TRAFFIC IMPACT ANALYSIS
 Appendix H TRAFFIC IMPACT ANALYSIS Teichert Boca Quarry Expansion Traffic Impact Analysis Prepared for Teichert Aggregates Prepared by TRANSPORTATION CONSULTANTS, INC. LSC Transportation Consultants, Inc.
Study Area and Location District PSA Ward ANC Phase Description C Planned Suitland Parkway Westbound at Stanton Road Southeast
 Speed Limit and Safety Nexus Studies for Automated Enforcement Locations in the District of Columbia Suitland Parkway at Stanton Road SE Study Area and Location District PSA Ward ANC Phase Description
Abstract. Executive Summary. Emily Rogers Jean Wang ORF 467 Final Report-Middlesex County
 Emily Rogers Jean Wang ORF 467 Final Report-Middlesex County Abstract The purpose of this investigation is to model the demand for an ataxi system in Middlesex County. Given transportation statistics for
Development of a Moving Automatic Flagger Assistance Device (AFAD) for Moving Work Zone Operations
 for Moving Work Zone Operations") Development of a Moving Automatic Flagger Assistance Device (AFAD) for Moving Work Zone Operations Edward F. Terhaar, Principal Investigator Wenck Associates, Inc. March 2017 Research Project Final Report
Development of a Moving Automatic Flagger Assistance Device (AFAD) for Moving Work Zone Operations Edward F. Terhaar, Principal Investigator Wenck Associates, Inc. March 2017 Research Project Final Report