The purpose of this experiment was to determine if current speed limit postings are
|
|
|
- Eustace Short
- 5 years ago
- Views:
Transcription
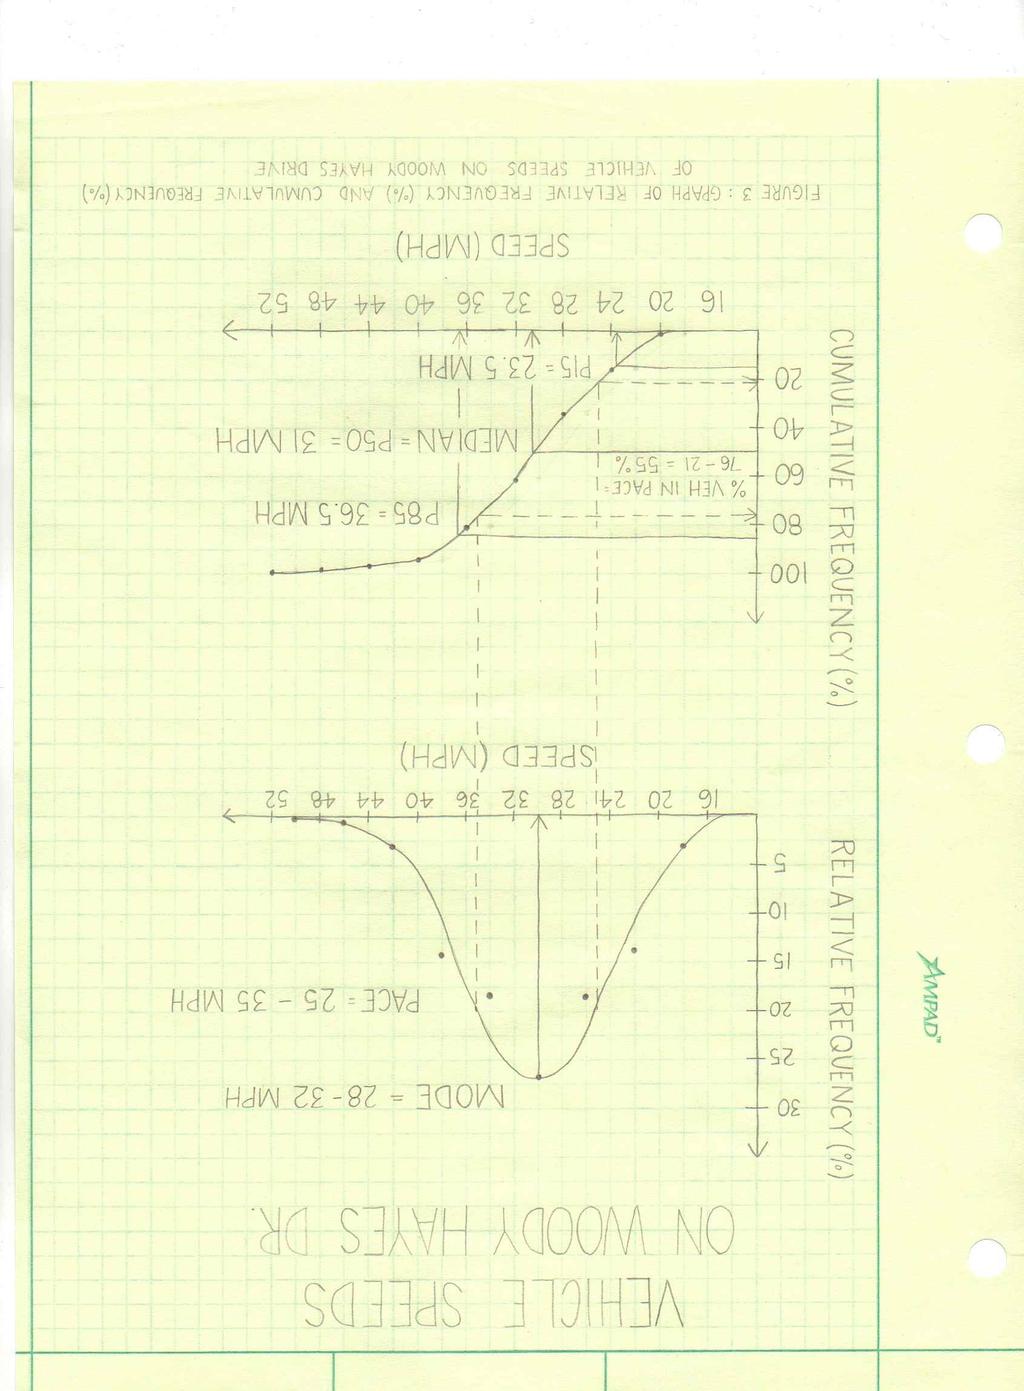
1 Memorandum To: Jen Keidel From: Christina Ochs (Seat 28) Date: 1/19/12 Re: Spot Speed Memo 1. Introduction The purpose of this experiment was to determine if current speed limit postings are satisfactory for keeping drivers at the set rate. This was determined by calculating the average speed of vehicles driving along a road for a certain amount of time. Other values were calculated to help determine the conclusion including, but not limited to, standard deviation, relative frequency, cumulative frequency, mode, pace, and median. The data can be found in the Results and Description in Section 2. The analysis of this data can be found in Section 3, Discussion. A summary of the whole experiment and conclusions made can be found in section Results and Description The results of the experiment were formulated and are presented in the second attachment in Table 1. Table 1 shows the values determined after the experiment was performed. The mode and 10 mph pace were determined using the relative frequency graph located in the second attachment. The relative frequency graph shows the mode is mph because that is the speed interval at which the peak of the frequency curve occurs. The pace could be found by locating the 10 mph interval on the relative frequency curve in which the most cars traveled. 1 of 6
2 The 50th percentile speed, 15th percentile speed, and 85th percentile speeds were found by looking at the cumulative frequency graph, located in the second attachment. These speeds were determined by finding the percentile on the ordinate axis of the cumulative frequency graph and determining what x-value corresponds with the percent (y-value) on the cumulative frequency curve. The percent of vehicles in pace could be found while looking at the graphs of relative frequency and cumulative frequency simultaneously. The average speed was calculated using equation 1. The estimated standard deviation was determined using equation 2 and the calculated standard deviation was found using equation 3. All these equations and the sample calculations for each can be found in the first attachment. The values for the variables included in the equations are located in Table 2 in the first attachment. Table 2 gives the experimental data. The difference between the lower limit and upper limit of a speed group is 4 mph. The data collected was for a 2 mph interval, but for accurate results on the relative frequency graph, the data was combined to 4 mph intervals. The reason for this is because the relative frequency curve needs to look like a bell curve. With data on 2 mph intervals, the graph was altered to have 2 relative maximums. Therefore, the data needed to be combined to give the relative frequency graph a bell-shaped curve. The number of vehicles in the group was found by looking at the field sheet, displayed as Figure 1 in the second attachment. Figure 2, located in the second attachment, shows the relative frequency and cumulative frequency graphs for the data collected in this experiment. The relative frequency graph is used to determine the mode (28-32 mph) and 10 mph pace (25-35 mph). The median, 85th percentile speed, 15th percentile speed, and % of vehicles in pace, were determined and 2 of 6
3 labeled on the cumulative frequency graph. The median speed is 31 mph; the 85th percentile speed is 36.5 mph; the 15th percentile speed is 23.5 mph; the percent of vehicles in pace is 55%. 3. Discussion The experiment revealed that the mode for the speed of drivers on Woody Hayes Drive is between 28 mph and 32 mph. The median speed was approximately 31 mph. The 15th percentile speed was 23.5 mph and the 85th percentile speed was 36.5 mph. All these values can be found in Table 1. These values play a key role in deciding whether the current speed limit postings are satisfactory for keeping drivers at the set rate. The mode shows the speed that most cars in the speed trap were travelling. Since the speed limit on Woody Hayes Drive is 25 mph and the mode was between 28 mph and 32 mph, it can be concluded that the majority of cars travel between 3 mph and 7 mph over the posted speed limit. The pace and percent of vehicles in pace show that 55% of vehicles travelling on Woody Hayes Drive travel between the posted speed limit (25 mph) and 10 mph over the speed limit. With the median speed being 31 mph, it can be proven that the majority of cars on Woody Hayes Drive travel faster than the posted speed limit. Table 1 reveals that the pace for this experiment was 25 mph to 35 mph, with 55% of the vehicles in the speed trap travelling within that pace. With this, it can be said that the data exhibits central tendency because over half of the vehicles observed clustered between 25 mph and 35 mph. Since only 55% of the vehicles observed were in the 10 mph pace, dispersion, the scattering of values of a variable around the mean or median of a distribution ( 10/24/11) was also exhibited. The speeds of the vehicles observed 3 of 6
4 ranged from 16 mph to 52 mph. Although over half the data was between 25 mph and 35 mph, there was a wide range of speeds observed, resulting in dispersion. Standard deviation is the measure of dispersion of a set of data from its mean ( 10/09/11). Since the standard deviation was approximately 6, this shows there is a relatively wide range of dispersion in this set of data. If the data would have been from the Indy 500, there would be less dispersion because the cars racing would have been travelling at a closer speed to one another, rather than a wide range of speeds. However, if the data was collected on High Street on a Saturday evening in the spring, the dispersion would most likely be greater than the dispersion in this experiment. This is because High Street is a main road so many vehicles would be driving through the speed trap and there would be more traffic than observed on Woody Hayes Drive. The dispersion in the data collected for this experiment was caused by the wide variety of vehicles observed and the accuracy problems associated with this experiment. Some of these accuracy problems included human error, location of a bus stop, and a large crowd of students on the sidewalk. Human error was caused by the reaction times of the flagger and timer. The times of vehicles passing through the speed zone was not 100% accurate due to the inability of humans to react immediately. There would be a delay from when the car entered the speed zone and the timer actually started the stopwatch. During that delay, the flagger had to raise his/her arm, the timer had to interpret that signal, and press the 'start' button on the timer/stopwatch. The same goes for the time delay once the vehicle reaches the end of the speed trap. 4 of 6
5 The location of a bus stop nearby also skewed the data collected. Approximately 300 feet past the end of the speed trap, there was a bus stop. This means, some of the buses travelling through the speed trap could have begun slowing down while in the speed trap, skewing the data. The final accuracy problem associated with this experiment was the surroundings. Drivers don't expect to see a large group of people spread along the side of the road and students watching vehicles closely and throwing their arms in the air when a vehicle reaches a certain point. This scenario could have distracted drivers and caused them to drive more cautiously through the speed trap, also resulting in skewed data. 4. Summary and Conclusions The purpose of this experiment was to determine if current speed limit postings are satisfactory for keeping drivers at the set rate. Values such as average speed, mode, standard deviation, and pace were determined to reach a conclusion. The average speed was found to be 30.5 mph. The mode was between 28 mph and 32 mph. This means the majority of the vehicles passing through the speed trap were travelling somewhere between 28 mph and 32 mph. Based on the data collected, the current speed limit postings are not satisfactory for keeping drivers at the set rate because the current speed limit on Woody Hayes Drive is 25 mph. In order to gain more accurate results and prevent error, better equipment could have been purchased and used. If given $200 to improve the experiment, it would have been beneficial to attempt to avoid human error. Using an automated timer that could accurately read the position of the vehicles in the speed trap would drastically improve the experimental data. It would be valuable to invest in such a device so that human error would be eliminated and the 5 of 6
6 speed of the vehicles could be determined without fault. Another device that would have been propitious would have been a radar gun. A radar gun can use the waves bouncing off the vehicle to flawlessly determine the speed of the car and produce accurate data. These devices would also reduce the distractions on the side of the road, resulting in the drivers driving at a regular pace and receiving accurate data. Also, changing the location of the experiment could have resulted in more accurate data. A location without a bus stop nearby would have been ideal. The bus stop at the end of the speed trap skewed the data. If there hadn't been a bus stop, drivers would have been more likely to drive a constant speed, resulting in more accurate data. Attachment: Sample Calculations, 2. Attachment: Figures and Tables, 3. 6 of 6
7 Sample Calculations Average Speed: (1) = number of vehicles in group i = middle speed of group i N= total number of vehicles observed in experiment Estimated Standard Deviation: (2) = 85th percentile speed = 15th percentile speed Calculated Standard Deviation: (3) = number of vehicles in group i = middle speed of group i = average speed N= total number of vehicles observed in experiment 1 of 2
8 Sample Calculation for Average Speed = 30.5 mph Sample Calculations for Estimated Standard Deviation Sample Calculations for Calculated Standard Deviation = 6.18 mph Sample Calculation for Relative Frequency Sample Calculation for Cumulative Frequency 2 of 2
9 Figures and Tables Mode 50th Percentile Speed Table 1: Experimental Data of Vehicles on Woody Hayes Drive 10 mph Pace (x to y mph) Vehicles in Pace (%) 15th Percentile Speed 85th Percentile Speed Average Speed Estimated Standard Deviation Calculated Standard Deviation Speed Group Table 2: Statistics of Vehicle Speeds on Woody Hayes Drive Lower Limit Upper Limit Middle Speed, S # of Vehicles in Group, n Relative Frequency (%) Cumulative Frequency (%) ns of 3
10 Figure 1: Vehicle Speeds collected throughout experiment 2 of 3
11 3 of 3
Spot Speed Study. Engineering H191. Autumn, Hannah Zierden, Seat 20. Ryan King, Seat 29. Jae Lee, Seat 23. Alex Rector, Seat 26
 Spot Speed Study Engineering H191 Autumn, 2011 Hannah Zierden, Seat 20 Ryan King, Seat 29 Jae Lee, Seat 23 Alex Rector, Seat 26 Instructor: Dr. Kathy Harper Class Section: 1:30 Lab Section: Thursday, 1:30-3:18
Chapter 12 VEHICLE SPOT SPEED STUDY
 Chapter 12 VEHICLE SPOT SPEED STUDY 12.1 PURPOSE (1) The Vehicle Spot Speed Study is designed to measure the speed characteristics at a specified location under the traffic and environmental conditions
Engineering Dept. Highways & Transportation Engineering
 The University College of Applied Sciences UCAS Engineering Dept. Highways & Transportation Engineering (BENG 4326) Instructors: Dr. Y. R. Sarraj Chapter 4 Traffic Engineering Studies Reference: Traffic
Effect of Sample Size and Method of Sampling Pig Weights on the Accuracy of Estimating the Mean Weight of the Population 1
 Effect of Sample Size and Method of Sampling Pig Weights on the Accuracy of Estimating the Mean Weight of the Population C. B. Paulk, G. L. Highland 2, M. D. Tokach, J. L. Nelssen, S. S. Dritz 3, R. D.
Descriptive Statistics
 Chapter 2 Descriptive Statistics 2-1 Overview 2-2 Summarizing Data 2-3 Pictures of Data 2-4 Measures of Central Tendency 2-5 Measures of Variation 2-6 Measures of Position 2-7 Exploratory Data Analysis
Appendix B CTA Transit Data Supporting Documentation
 RED ED-PURPLE BYPASS PROJECT ENVIRONMENTAL ASSESSMENT AND SECTION 4(F) EVALUATION Appendix B CTA Transit Data Supporting Documentation 4( Memorandum Date: May 14, 2015 Subject: Chicago Transit Authority
9.3 Tests About a Population Mean (Day 1)
") Bellwork In a recent year, 73% of first year college students responding to a national survey identified being very well off financially as an important personal goal. A state university finds that 132
Bellwork In a recent year, 73% of first year college students responding to a national survey identified being very well off financially as an important personal goal. A state university finds that 132
NEW CAR TIPS. Teaching Guidelines
 NEW CAR TIPS Teaching Guidelines Subject: Algebra Topics: Patterns and Functions Grades: 7-12 Concepts: Independent and dependent variables Slope Direct variation (optional) Knowledge and Skills: Can relate
Technical Papers supporting SAP 2009
 Technical Papers supporting SAP 29 A meta-analysis of boiler test efficiencies to compare independent and manufacturers results Reference no. STP9/B5 Date last amended 25 March 29 Date originated 6 October
Descriptive Statistics Practice Problems (99-04)
") Descriptive Statistics Practice Problems (99-04) 1. One thousand candidates sit an examination. The distribution of marks is shown in the following grouped frequency table. Marks 1 10 11 20 21 30 31 40
Descriptive Statistics Practice Problems (99-04) 1. One thousand candidates sit an examination. The distribution of marks is shown in the following grouped frequency table. Marks 1 10 11 20 21 30 31 40
Real-time Bus Tracking using CrowdSourcing
 Real-time Bus Tracking using CrowdSourcing R & D Project Report Submitted in partial fulfillment of the requirements for the degree of Master of Technology by Deepali Mittal 153050016 under the guidance
A Cost Benefit Analysis of Faster Transmission System Protection Schemes and Ground Grid Design
 A Cost Benefit Analysis of Faster Transmission System Protection Schemes and Ground Grid Design Presented at the 2018 Transmission and Substation Design and Operation Symposium Revision presented at the
The purpose of this lab is to explore the timing and termination of a phase for the cross street approach of an isolated intersection.
 1 The purpose of this lab is to explore the timing and termination of a phase for the cross street approach of an isolated intersection. Two learning objectives for this lab. We will proceed over the remainder
DRIVER SPEED COMPLIANCE WITHIN SCHOOL ZONES AND EFFECTS OF 40 PAINTED SPEED LIMIT ON DRIVER SPEED BEHAVIOURS Tony Radalj Main Roads Western Australia
 DRIVER SPEED COMPLIANCE WITHIN SCHOOL ZONES AND EFFECTS OF 4 PAINTED SPEED LIMIT ON DRIVER SPEED BEHAVIOURS Tony Radalj Main Roads Western Australia ABSTRACT Two speed surveys were conducted on nineteen
Statistics for Social Research
 Facoltà di Scienze della Formazione, Scienze Politiche e Sociali Statistics for Social Research Lesson 2: Descriptive Statistics Prof.ssa Monica Palma a.a. 2016-2017 DESCRIPTIVE STATISTICS How do we describe
POLICY FOR THE ESTABLISHMENT AND POSTING OF SPEED LIMITS ON COUNTY AND TOWNSHIP HIGHWAYS WITHIN MCHENRY COUNTY, ILLINOIS
 POLICY FOR THE ESTABLISHMENT AND POSTING OF SPEED LIMITS ON COUNTY AND TOWNSHIP HIGHWAYS WITHIN MCHENRY COUNTY, ILLINOIS MCHENRY COUNTY DIVISION OF TRANSPORTATION 16111 NELSON ROAD WOODSTOCK, IL 60098
Fuel Strategy (Exponential Decay)
") By Ten80 Education Fuel Strategy (Exponential Decay) STEM Lesson for TI-Nspire Technology Objective: Collect data and analyze the data using graphs and regressions to understand conservation of energy
By Ten80 Education Fuel Strategy (Exponential Decay) STEM Lesson for TI-Nspire Technology Objective: Collect data and analyze the data using graphs and regressions to understand conservation of energy
Burn Characteristics of Visco Fuse
 Originally appeared in Pyrotechnics Guild International Bulletin, No. 75 (1991). Burn Characteristics of Visco Fuse by K.L. and B.J. Kosanke From time to time there is speculation regarding the performance
Singh Groove Concept Combustion Analysis using Ionization Current By: Garrett R. Herning AutoTronixs, LLC. October 2007
 Singh Groove Concept Combustion Analysis using Ionization Current By: Garrett R. Herning AutoTronixs, LLC. October 2007 Ionization Current: Ionization current is a method devised of using the spark plug
2016 Congestion Report
 2016 Congestion Report Metropolitan Freeway System May 2017 2016 Congestion Report 1 Table of Contents Purpose and Need...3 Introduction...3 Methodology...4 2016 Results...5 Explanation of Percentage Miles
Stopping distance = thinking distance + braking distance.
 Q1. (a) A driver may have to make an emergency stop. Stopping distance = thinking distance + braking distance. Give three different factors which affect the thinking distance or the braking distance. In
Planning for Traffic Signals by Jeffrey W. Buckholz, PhD, PE, PTOE A SunCam online continuing education course PLANNING FOR TRAFFIC SIGNALS
 PLANNING FOR TRAFFIC SIGNALS This Traffic Signal Design course addresses basic procedures used in planning traffic signal installations. Included in this course is a discussion of warrants for traffic
Speed Evaluation Saw Mill Drive
 Speed Evaluation Saw Mill Drive Prepared for: Mount Laurel Township Burlington County, New Jersey Prepared by: Dana Litwornia Litwornia & Associates, Inc. Transportation, Traffic & Environmental Engineering
Low Speed Design Criteria for Residential Streets Andrew J. Ballard, P.E. and David M. Haldeman, E.I.T.
 Low Speed Design Criteria for Residential Streets Andrew J. Ballard, P.E. and David M. Haldeman, E.I.T. Background The City of San Antonio receives many complaints regarding speeding in residential areas.
Red Line Customer Capacity Update. Fiscal & Management Control Board September 19, 2016
 Red Line Customer Capacity Update Fiscal & Management Control Board September 19, 2016 Delivering Service System Reliability Delivering Service System Capacity 2 System Capacity System Capacity Vehicle
A STUDY OF HUMAN KINEMATIC RESPONSE TO LOW SPEED REAR END IMPACTS INVOLVING VEHICLES OF LARGELY DIFFERING MASSES
 A STUDY OF HUMAN KINEMATIC RESPONSE TO LOW SPEED REAR END IMPACTS INVOLVING VEHICLES OF LARGELY DIFFERING MASSES Brian Henderson GBB UK Ltd, University of Central Lancashire School of Forensic & Investigative
Evaluation of Major Street Speeds for Minnesota Intersection Collision Warning Systems
 Evaluation of Major Street Speeds for Minnesota Intersection Collision Warning Systems Shauna Hallmark, Principal Investigator Center for Transportation Research and Education Iowa State University June
Cost Benefit Analysis of Faster Transmission System Protection Systems
 Cost Benefit Analysis of Faster Transmission System Protection Systems Presented at the 71st Annual Conference for Protective Engineers Brian Ehsani, Black & Veatch Jason Hulme, Black & Veatch Abstract
Metropolitan Freeway System 2013 Congestion Report
 Metropolitan Freeway System 2013 Congestion Report Metro District Office of Operations and Maintenance Regional Transportation Management Center May 2014 Table of Contents PURPOSE AND NEED... 1 INTRODUCTION...
FINAL REPORT AP STATISTICS CLASS DIESEL TRUCK COUNT PROJECT
 FINAL REPORT AP STATISTICS CLASS 2017-2018 DIESEL TRUCK COUNT PROJECT Authors: AP Statistics Class 2017-2018 Table of Contents SURVEY QUESTION...p. 2 AIR QUALITY...p. 3-4 TOTAL TRUCK COUNTS.p. 5 TRUCK
Oregon DOT Slow-Speed Weigh-in-Motion (SWIM) Project: Analysis of Initial Weight Data
 Project: Analysis of Initial Weight Data") Portland State University PDXScholar Center for Urban Studies Publications and Reports Center for Urban Studies 7-1997 Oregon DOT Slow-Speed Weigh-in-Motion (SWIM) Project: Analysis of Initial Weight Data
Portland State University PDXScholar Center for Urban Studies Publications and Reports Center for Urban Studies 7-1997 Oregon DOT Slow-Speed Weigh-in-Motion (SWIM) Project: Analysis of Initial Weight Data
Lab 9: Faraday s and Ampere s Laws
 Lab 9: Faraday s and Ampere s Laws Introduction In this experiment we will explore the magnetic field produced by a current in a cylindrical coil of wire, that is, a solenoid. In the previous experiment
Speed measurements were taken at the following three locations on October 13 and 14, 2016 (See Location Map in Exhibit 1):
:") 2709 McGraw Drive Bloomington, Illinois 61704 p 309.663.8435 f 309.663.1571 www.f-w.com www.greennavigation.com November 4, 2016 Mr. Kevin Kothe, PE City Engineer City of Bloomington Public Works Department
2709 McGraw Drive Bloomington, Illinois 61704 p 309.663.8435 f 309.663.1571 www.f-w.com www.greennavigation.com November 4, 2016 Mr. Kevin Kothe, PE City Engineer City of Bloomington Public Works Department
Egg Car Collision Project
 Name Date Egg Car Collision Project Objective: To apply your science knowledge of momentum, energy and Newton s Laws of Motion to design and build a crashworthy vehicle. Introduction: The popularity of
Memorandum. To: Sue Polka, City Engineer, City of Arden Hills. From: Sean Delmore, PE, PTOE. Date: June 21, 2017
 Memorandum engineering planning environmental construction 701 Xenia Avenue South Suite 300 Minneapolis, MN 55416 Tel: 763-541-4800 Fax: 763-541-1700 To: Sue Polka, City Engineer, City of Arden Hills From:
This letter summarizes our observations, anticipated traffic changes, and conclusions.
 Mr. David Jorschumb Project Manager Boulder Valley School District Re: Review of proposed school access improvements at the Foothills Elementary School in Boulder Dear Mr. Jorschumb, At your request, the
D etonation in Light Aircraft
 D etonation in Light Aircraft Yes it s true, the topic of pre-ignition and detonation has been previously written about in grueling detail. However, almost every article published on the subject broaches
Isaac Newton vs. Red Light Cameras
 2012 Isaac Newton vs. Red Light Cameras Approach Speed vs. Speed Limit Brian Cecvehicleelli redlightrobber.com 3/1/2012 Table of Contents Approach Speed vs. Speed Limit... 3 Definition of Speed Limit...
Tuning the System. I. Introduction to Tuning II. Understanding System Response III. Control Scheme Theory IV. BCU Settings and Parameter Ranges
 I. Introduction to Tuning II. Understanding System Response III. Control Scheme Theory IV. BCU Settings and Parameter Ranges a. Determining Initial Settings The Basics b. Determining Initial Settings -
The Brake Assist System
 Service. Self-study programme 264 The Brake Assist System Design and function Accident statistics show that in 1999 alone, 493,527 accidents in Germany were caused by driver error. Many accidents caused
WHITE PAPER. Preventing Collisions and Reducing Fleet Costs While Using the Zendrive Dashboard
 WHITE PAPER Preventing Collisions and Reducing Fleet Costs While Using the Zendrive Dashboard August 2017 Introduction The term accident, even in a collision sense, often has the connotation of being an
Q1. The graph shows the speed of a runner during an indoor 60 metres race.
 Q1. The graph shows the speed of a runner during an indoor 60 metres race. (a) Calculate the acceleration of the runner during the first four seconds. (Show your working.) (b) How far does the runner travel
PVP Field Calibration and Accuracy of Torque Wrenches. Proceedings of ASME PVP ASME Pressure Vessel and Piping Conference PVP2011-
 Proceedings of ASME PVP2011 2011 ASME Pressure Vessel and Piping Conference Proceedings of the ASME 2011 Pressure Vessels July 17-21, & Piping 2011, Division Baltimore, Conference Maryland PVP2011 July
Establishing Realistic Speed Limits
 Establishing Realistic Speed Limits Establishing Realistic Speed Limits This publication updates the Setting Realistic Speed Limits booklet which was originally produced in the 1970s. Technical references
Stationary 3D anemometer at 0.5 m from the ground and ca m from the driving track Driving direction. 25 m
 1 Standardisation of test method for salt spreader: Air flow experiments Report 6: Three dimensional velocities generated by a full scale salt truck by Hisamitsu Takai and Jan S. Strøm, Consultants Aarhus
Technical Memorandum Analysis Procedures and Mobility Performance Measures 100 Most Congested Texas Road Sections What s New for 2015
 Technical Memorandum Analysis Procedures and Mobility Performance Measures 100 Most Congested Texas Road Sections Prepared by Texas A&M Transportation Institute August 2015 This memo documents the analysis
Comparing Flow and Pressure Drop in Mufflers
 UNIVERSITY OF IDAHO GAUSS ENGINEERING Comparing Flow and Pressure Drop in Mufflers A Statistical Analysis Jeremy Cuddihy, Chris Ohlinger, Steven Slippy, and Brian Lockner 10/24/2012 Table Of Contents Topic
Brain on Board: From safety features to driverless cars
 Brain on Board: From safety features to driverless cars Robyn Robertson, M.C.A. President & CEO Traffic Injury Research Foundation 18 th Annual Not By Accident Conference. London, ON, October 18 th, 2016
Lecture 3: Measure of Central Tendency
 Lecture 3: Measure of Central Tendency Donglei Du (ddu@unb.edu) Faculty of Business Administration, University of New Brunswick, NB Canada Fredericton E3B 9Y2 Donglei Du (UNB) ADM 2623: Business Statistics
Spot Speed. Select Study Methodology. Select Location. Complete Study. Document
 Spot Speed Select Study Methodology 1. etere the issue at hand 2. oes the study require a small or large sample 3. Select the stopwatch, radar meter, or pneumatic road tube method Select Location 1. Select
Speed Limit and Safety Nexus Studies for Automated Enforcement Locations in the District of Columbia 400 Block 14th Street SW
 Speed Limit and Safety Nexus Studies for Automated Enforcement Locations in the District of Columbia 4 Block 4th Street SW Study Area and Location District PSA Ward ANC Phase Description 27 6 6D Existing
SpeedGuard Radar Speed Reporting System
 Report Title Report Date: 2000 SpeedGuard Radar Speed Reporting System Principle Investigator Vendor Name and Address Name Meyer, Eric Speed Measurement Labs Affiliation Meyer ITS Carl Fors Address 2617
Problem of the Month. Movin n Groovin
 Problem of the Month Movin n Groovin Level A: Maria and Tran each have a pet hamster. They have a maze for the hamsters to run through. Maria says she thinks her hamster can run through the maze faster
STOPPING SIGHT DISTANCE AS A MINIMUM CRITERION FOR APPROACH SPACING
 STOPPING SIGHT DISTANCE AS A MINIMUM CRITERION prepared for Oregon Department of Transportation Salem, Oregon by the Transportation Research Institute Oregon State University Corvallis, Oregon 97331-4304
ANALYSIS OF SPEED CHARACTERISTICS ON VIDYA PATH CHANDIGARH A CASE STUDY 1
 ANALYSIS OF CHARACTERISTICS ON VIYA PATH CHANIGARH A CASE STUY 1 Amanpreet Kaur, 2 Bhavneet Singh, 3 r. Tripta Goyal M.E. Student, M.E. Student, Associate Professor (epartment of Civil Engineering, PEC
Non-Contact Sensor Performance Report
 Non-Contact Sensor Performance Report Abstract The 30mm non-contact sensor (Encoder) was subjected to a variety of tests outside of the recommended usage parameters. The separation distance, planar tilt,
Traffic Operation and Safety Analyses of Minimum Speed Limits on Florida Rural Interstate Highways
 Traffic Operation and Safety Analyses of Minimum Speed Limits on Florida Rural Interstate Highways Victor Muchuruza Department of Civil Engineering College of Engineering Florida A & M University-Florida
meters Time Trials, seconds Time Trials, seconds 1 2 AVG. 1 2 AVG
 Constan t Velocity (Speed) Objective: Measure distance and time during constant velocity (speed) movement. Determine average velocity (speed) as the slope of a Distance vs. Time graph. Equipment: battery
Chapter 9 Motion Exam Question Pack
 Chapter 9 Motion Exam Question Pack Name: Class: Date: Time: 63 minutes Marks: 63 marks Comments: Page of 49 The graphs in List A show how the velocities of three vehicles change with time. The statements
#6 IN A SERIES SHARING THE ROAD. How to stay safe.
 #6 IN A SERIES SHARING THE ROAD How to stay safe. SM Today, there are more vehicles on the road than ever. That s why it s important to be aware of vehicles around you as well as where you re driving.
Southern Windsor County 2016 Traffic Count Program Summary April 2017
 Southern Windsor County 2016 Traffic Count Program Summary April 2017 The Southern Windsor County Regional Planning Commission (the RPC ) has been monitoring traffic at 19 locations throughout the southern
Evaluation of the Rolling Wheel Deflectometer (RWD) in Louisiana. John Ashley Horne Dr. Mostafa A Elseifi
 in Louisiana. John Ashley Horne Dr. Mostafa A Elseifi") Evaluation of the Rolling Wheel Deflectometer (RWD) in Louisiana John Ashley Horne Dr. Mostafa A Elseifi Introduction Louisiana uses the Falling-Weight Deflectometer (FWD) for project level testing Limitations
Evaluation of the Rolling Wheel Deflectometer (RWD) in Louisiana John Ashley Horne Dr. Mostafa A Elseifi Introduction Louisiana uses the Falling-Weight Deflectometer (FWD) for project level testing Limitations
Food Truck Consulting Study of Proposed Food Truck Regulations
 Food Truck Consulting Study of Proposed Food Truck Regulations Introduction The City of San Diego is considering revisions to its mobile vending ordinance. The revised ordinance would, in part, 1) prevent
Travel Time Savings Memorandum
 04-05-2018 TABLE OF CONTENTS 1 Background 3 Methodology 3 Inputs and Calculation 3 Assumptions 4 Light Rail Transit (LRT) Travel Times 5 Auto Travel Times 5 Bus Travel Times 6 Findings 7 Generalized Cost
The graph shows how far the car travelled and how long it took. (i) Between which points was the car travelling fastest? Tick ( ) your answer.
 Between which points was the car travelling fastest? Tick ( ) your answer.") Q1. This question is about a car travelling through a town. (a) The graph shows how far the car travelled and how long it took. (i) Between which points was the car travelling fastest? Tick ( ) your answer.
Q1. This question is about a car travelling through a town. (a) The graph shows how far the car travelled and how long it took. (i) Between which points was the car travelling fastest? Tick ( ) your answer.
The application of the 95% Confidence interval with ISAT and IMAGE
 Confidence intervals are commonly applied in many fields using statistical analyses. The most commonly seen usage of confidence intervals is within political polls. In the case of a political poll, an
Noise Reduction in a Reciprocating Compressor by Optimizing the Suction Muffler
 Noise Reduction in a Reciprocating Compressor by Optimizing the Suction Muffler Katakama Nagarjuna ¹ K.Sreenivas² ¹ M.tech student, ²Professor, dept of mechanical engineering kits, markapur, A.P, INDIA
 اجزا ء سیست م اهی ح م ل و نق ل http://mnooriamiri.professora.ir Road users-drivers, pedestrians, bicyclists, passengers Vehicles- private and commercial Streets and highways Traffic control devices The
Linking the Virginia SOL Assessments to NWEA MAP Growth Tests *
 Linking the Virginia SOL Assessments to NWEA MAP Growth Tests * *As of June 2017 Measures of Academic Progress (MAP ) is known as MAP Growth. March 2016 Introduction Northwest Evaluation Association (NWEA
TABLE 4.1 POPULATION OF 100 VALUES 2
 TABLE 4. POPULATION OF 00 VALUES WITH µ = 6. AND = 7.5 8. 6.4 0. 9.9 9.8 6.6 6. 5.7 5. 6.3 6.7 30.6.6.3 30.0 6.5 8. 5.6 0.3 35.5.9 30.7 3.. 9. 6. 6.8 5.3 4.3 4.4 9.0 5.0 9.9 5. 0.8 9.0.9 5.4 7.3 3.4 38..6
Ohio State University Extension. Boom Sprayer Calibration, AEX Food, Agricultural and Biological Engineering
 Page 1 of 7 Ohio State University Extension Food, Agricultural and Biological Engineering 590 Woody Hayes Dr., Columbus, Ohio 43210 Boom Sprayer Calibration AEX-520-92 H. Erdal Ozkan Professor and Extension
Objectives. Materials TI-73 CBL 2
 . Objectives To understand the relationship between dry cell size and voltage Activity 4 Materials TI-73 Unit-to-unit cable Voltage from Dry Cells CBL 2 Voltage sensor New AAA, AA, C, and D dry cells Battery
Linking the Georgia Milestones Assessments to NWEA MAP Growth Tests *
 Linking the Georgia Milestones Assessments to NWEA MAP Growth Tests * *As of June 2017 Measures of Academic Progress (MAP ) is known as MAP Growth. February 2016 Introduction Northwest Evaluation Association
Trip Generation Study: Provo Assisted Living Facility Land Use Code: 254
 Trip Generation Study: Provo Assisted Living Facility Land Use Code: 254 Introduction The Brigham Young University Institute of Transportation Engineers (BYU ITE) student chapter completed a trip generation
Introduction. Traffic data collection. Introduction. Introduction. Traffic stream parameters
 Introduction Traffic data collection Transportation Systems Engineering Outline Point measurement Measurement over a short stretch Measurement over a long stretch Measurement over an area 20080813 Traffic
Impact of Reflectors on Solar Energy Systems
 Impact of Reflectors on Solar Energy Systems J. Rizk, and M. H. Nagrial Abstract The paper aims to show that implementing different types of reflectors in solar energy systems, will dramatically improve
Introducing the OMAX Generation 4 cutting model
 Introducing the OMAX Generation 4 cutting model 8/11/2014 It is strongly recommend that OMAX machine owners and operators read this document in its entirety in order to fully understand and best take advantage
Study of the Performance of a Driver-vehicle System for Changing the Steering Characteristics of a Vehicle
 20 Special Issue Estimation and Control of Vehicle Dynamics for Active Safety Research Report Study of the Performance of a Driver-vehicle System for Changing the Steering Characteristics of a Vehicle
MEDIA RELEASE. June 16, 2008 For Immediate Release
 MEDIA RELEASE June 16, 2008 For Immediate Release Recommendations to Keep Trolleys Released Alternative Proposal for Trolleys Ensures City s Sustainability The Edmonton Trolley Coalition, a non-profit
White paper: Originally published in ISA InTech Magazine Page 1
 Page 1 Improving Differential Pressure Diaphragm Seal System Performance and Installed Cost Tuned-Systems ; Deliver the Best Practice Diaphragm Seal Installation To Compensate Errors Caused by Temperature
Study Area and Location District PSA Ward ANC Phase Description B Existing 2200 Block South Dakota Avenue Northeast Southeast bound
 Speed Limit and Safety Nexus Studies for Automated Enforcement Locations in the District of Columbia 22 Block South Dakota Avenue NE Study Area and Location District PSA Ward ANC Phase Description 5 53
5. CONSTRUCTION OF THE WEIGHT-FOR-LENGTH AND WEIGHT-FOR- HEIGHT STANDARDS
 5. CONSTRUCTION OF THE WEIGHT-FOR-LENGTH AND WEIGHT-FOR- HEIGHT STANDARDS 5.1 Indicator-specific methodology The construction of the weight-for-length (45 to 110 cm) and weight-for-height (65 to 120 cm)
Linking the Kansas KAP Assessments to NWEA MAP Growth Tests *
 Linking the Kansas KAP Assessments to NWEA MAP Growth Tests * *As of June 2017 Measures of Academic Progress (MAP ) is known as MAP Growth. February 2016 Introduction Northwest Evaluation Association (NWEA
Appendix A: Motion Control Theory
 Appendix A: Motion Control Theory Objectives The objectives for this appendix are as follows: Learn about valve step response. Show examples and terminology related to valve and system damping. Gain an
Linking the North Carolina EOG Assessments to NWEA MAP Growth Tests *
 Linking the North Carolina EOG Assessments to NWEA MAP Growth Tests * *As of June 2017 Measures of Academic Progress (MAP ) is known as MAP Growth. March 2016 Introduction Northwest Evaluation Association
AUTOMATIC PNEUMATIC BUMPER AND BREAK ACTUATION BEFORE COLLISION.
 AUTOMATIC PNEUMATIC BUMPER AND BREAK ACTUATION BEFORE COLLISION. Shinde Ravindra B 1, Valvi Priyanka G 2, Shelake Balasaheb T 3, Shelke Pravin A 4, Gange Manoj D 5. 1 BE student Mechanical, SND COE & RC,
Linking the Alaska AMP Assessments to NWEA MAP Tests
 Linking the Alaska AMP Assessments to NWEA MAP Tests February 2016 Introduction Northwest Evaluation Association (NWEA ) is committed to providing partners with useful tools to help make inferences from
Linking the Florida Standards Assessments (FSA) to NWEA MAP
 to NWEA MAP") Linking the Florida Standards Assessments (FSA) to NWEA MAP October 2016 Introduction Northwest Evaluation Association (NWEA ) is committed to providing partners with useful tools to help make inferences
Linking the Florida Standards Assessments (FSA) to NWEA MAP October 2016 Introduction Northwest Evaluation Association (NWEA ) is committed to providing partners with useful tools to help make inferences
LEGAL STATEMENT 1 / 2018 NAVIGANT CONSULTING, INC. ALL RIGHTS RESERVED
 LEGAL STATEMENT The purpose of the information in this presentation is to guide ICA programs and provide members with information to make independent business decisions. 1 ANTITRUST GUIDELINES Antitrust
Linking the New York State NYSTP Assessments to NWEA MAP Growth Tests *
 Linking the New York State NYSTP Assessments to NWEA MAP Growth Tests * *As of June 2017 Measures of Academic Progress (MAP ) is known as MAP Growth. March 2016 Introduction Northwest Evaluation Association
The Effect of a Vehicle Control Device on Driver Performance in a Simulated Tank Driving Task
 University of Iowa Iowa Research Online Driving Assessment Conference 2001 Driving Assessment Conference Aug 15th, 12:00 AM The Effect of a Vehicle Control Device on Driver Performance in a Simulated Tank
Load profiling for balance settlement, demand response and smart metering in Finland
 Load profiling for balance settlement, demand response and smart metering in Finland Seppo Kärkkäinen Elektraflex, Finland Is DSM the Answer? Workshop in the connection of IEA DSM EXCO, Chester 21st October
Lampiran IV. Hasil Output SPSS Versi 16.0 untuk Analisis Deskriptif
 182 Lampiran IV. Hasil Output SPSS Versi 16.0 untuk Analisis Deskriptif Frequencies Statistics Kinerja Guru Sikap Guru Thdp Kepsek Motivasi Kerja Guru Kompetensi Pedagogik Guru N Valid 64 64 64 64 Missing
COATING YOUR WAY TO LOWER EMISSIONS
 COATING YOUR WAY TO LOWER EMISSIONS With vehicle production growing annually and manufacturers under pressure to reduce exhaust emissions, new and innovative methods will have to be found to increase engine
Scientific Report AN INVESTIGATION OF THE ITE FORMULA AND ITS USE
 Scientific Report AN INVESTIGATION OF THE ITE FORMULA AND ITS USE CP = t + + Abstract This working report is a study of the universally adopted ITE formula which calculates a traffic light s change interval.
Calibrating Chemical Application Equipment
 Calibrating Chemical Application Equipment PURPOSE To determine if the proper amount of chemical is being applied, the operator must measure the output of the application equipment. This technique is known
2018 Linking Study: Predicting Performance on the Performance Evaluation for Alaska s Schools (PEAKS) based on MAP Growth Scores
 based on MAP Growth Scores") 2018 Linking Study: Predicting Performance on the Performance Evaluation for Alaska s Schools (PEAKS) based on MAP Growth Scores June 2018 NWEA Psychometric Solutions 2018 NWEA. MAP Growth is a registered
2018 Linking Study: Predicting Performance on the Performance Evaluation for Alaska s Schools (PEAKS) based on MAP Growth Scores June 2018 NWEA Psychometric Solutions 2018 NWEA. MAP Growth is a registered
Bennett Pit. Traffic Impact Study. J&T Consulting, Inc. Weld County, Colorado. March 3, 2017
 Bennett Pit Traffic Impact Study J&T Consulting, Inc. Weld County, Colorado March 3, 217 Prepared By: Sustainable Traffic Solutions, Inc. http://www.sustainabletrafficsolutions.com/ Joseph L. Henderson,
CEMENT AND CONCRETE REFERENCE LABORATORY PROFICIENCY SAMPLE PROGRAM
 CEMENT AND CONCRETE REFERENCE LABORATORY PROFICIENCY SAMPLE PROGRAM Final Report ASR ASTM C1260 Proficiency Samples Number 5 and Number 6 August 2018 www.ccrl.us www.ccrl.us August 24, 2018 TO: Participants
Traffic Analysis for Bon Air Bridge Mitigation Magnolia Storm Water Quality Project
 Memo To: Paul DiDonato, ATI Architects and Engineers From: David Parisi, PE and Ashley Tam, EIT Date: February 23, 216 Subject: Traffic Analysis for Bon Air Bridge Mitigation Magnolia Storm Water Quality