Simulating Trucks in CORSIM
|
|
|
- Charity York
- 6 years ago
- Views:
Transcription

1 Simulating Trucks in CORSIM Minnesota Department of Transportation September 13, 2004
2 Simulating Trucks in CORSIM. Table of Contents 1.0 Overview Acquiring Truck Count Information Data Assembly Example where passenger vehicle column is all zeros Example where passenger vehicle column is filled in Calculating Truck Percents Example of blank passenger vehicle column continued Continuation the passenger vehicles counted example Coding CORSIM with truck percentages Coding into CORSIM using the *.tno file Coding into CORSIM using the *.trf file Calculating Fleet Composition Inserting Fleet Composition into CORSIM Coding FRESIM network for fleet splits Coding NETSIM network for fleet splits Submittal Requirements Figures Figure 1: Data flow diagram... 4 Figure 2: Site Location Maps... 5 Figure 3: Sample Figure 4: Classification site data... 7 Figure 5: Diagram of detectors on TH-169 at I Figure 6: Data Extract Data... 9 Figure 7: Classification site data with passenger vehicle count Figure 8: Truck percent calculations Figure 9: Truck percent calculations with passenger vehicles known Figure 10: TSIS screen used to enter truck percentages Figure 11: Record type 50 used to enter truck percentages Figure 12: Heavy Vehicle Types Figure 13: Table of vehicle type descriptions

3 1.0 Overview Truck operations have a profound impact on traffic operations according to the Highway Capacity Manual: Heavy vehicles adversely affect traffic in two ways: they are larger than passenger cars and occupy more roadway space; and they have poorer operating capabilities than passenger cars, particularly with respect to acceleration, deceleration, and the ability to maintain speed on upgrades. The second impact is more critical. The inability of heavy vehicles to keep pace with passenger cars in many situations creates large gaps in the traffic stream, which are difficult to fill by passing maneuvers. The resulting inefficiencies in the use of roadway space cannot be completely overcome. (HCM2000, 2-4&2-5) Heavy vehicles affect CORSIM in the same ways; therefore, accurately representing the truck percentages and fleet composition (i.e. mix of single unit trucks, medium semis, heavy semis and double trailer trucks) is essential for credible analysis using CORSIM. The purpose of this manual is to provide the procedure for incorporating truck percentages and fleet composition information into the CORSIM model. Traffic without Trucks consists of a steady traffic stream with close headway Traffic with Trucks consists of large gaps in the traffic stream 3
4 Truck data is used in two CORSIM inputs: truck percentage and fleet composition. Figure 1 illustrates the data sources used to compute the truck percentages and fleet composition. Figure 1: Data flow diagram Data Source Truck Count Data: CORSIM Inputs Truck Percentages at each entry link for: Arterials Freeways See Sections: IV & V See Section II Fleet Composition: Arterials Freeways See Sections: VI & VII 4


5 2.0 Acquiring Truck Count Information Mn/DOT s Office of Transportation Data and Analysis manages vehicle classification sites throughout Minnesota. These counts are collected either manually, or by tubes, which count the numbers and types of vehicles on the roadway. These sites are located on major highways. Maps of these site locations are available for both the Metro region and outstate Minnesota. Below are the maps are for viewing in *.pdf format at: Figure 2: Site Location Maps This document will follow the steps to set up a project concerning the TH169 and I-494 interchange 169 and 494. The sites needed for a project would be: 8853 (494 west of 169) 7717 (494 east of 169) 7999 (169 south of 494) 8872 (169 north of 494) I-494 and TH 169 5
 that most closely represent the project area.")
6 Steps for Requesting truck information: 1) Access the Mn/DOT website: and determine the data collection site(s) that most closely represent the project area. The number of site will increase with the size of the model and the characteristic of the roadway under consideration. 2) Assemble a list of the ID numbers from the maps for each site needed. 3) Submit a data request via ed to the Mn/DOT Office of Transportation Data & Analysis. The current contact is listed at Figure 3: Sample Make sure that you indicate within the that the truck information is going to be used for operational modeling. Have the requester provide a brief description of the construction limits. The requester should also check with the Office of Transportation & Data Analysis unit to verify that the sites collected accurately represent this area. They may be aware of some problems with the site or additional data collection that has occurred that s not currently available on the website. The should include construction limits, proposed list of data collection sites, the application the data will be used for and needs to explain that the information needed is the hourly counts of each separate type of vehicle. Without including this information, the format you receive may only have summarized information used for a different analysis. 6
7 3.0 Data Assembly The vehicle classification site information will be transmitted in the form of a Word, Excel or text document, and includes both directions of traffic (i.e. both northbound and southbound). The data in the Word or text document can be copied and pasted into an Excel spreadsheet. Doing this step will save time and minimize the likelihood of errors created by hand calculations. Figure 4: Classification site data (Full sized on next page) The data request may or may not include the passenger vehicles. Examples will be provided that cover how to determine the truck percentage and fleet composition with and without the passenger vehicles values provided. In Figure 4, the passenger vehicle column lists zeros for each time period. This is common among many of the classification counts, since numerous sites are manually counted and trying to obtain an accurate number for passenger vehicles is not feasible. 3.1 Example where passenger vehicle column is all zeros When the passenger vehicle column is empty, the total number of vehicles on the road at the time when the classification counts were taken can be obtained from the instrumented system by using the DataExtract program. Mainline detector stations should be used that are in close vicinity of the classification site. (Reference the Data Extraction Cookbook on the Mn/DOT s Office of Traffic, Security and Operations modeling website: for help with Data Extract route). Data Extract can be setup to collect the one-hour volumes for exactly the dates and times needed. 7
8 8

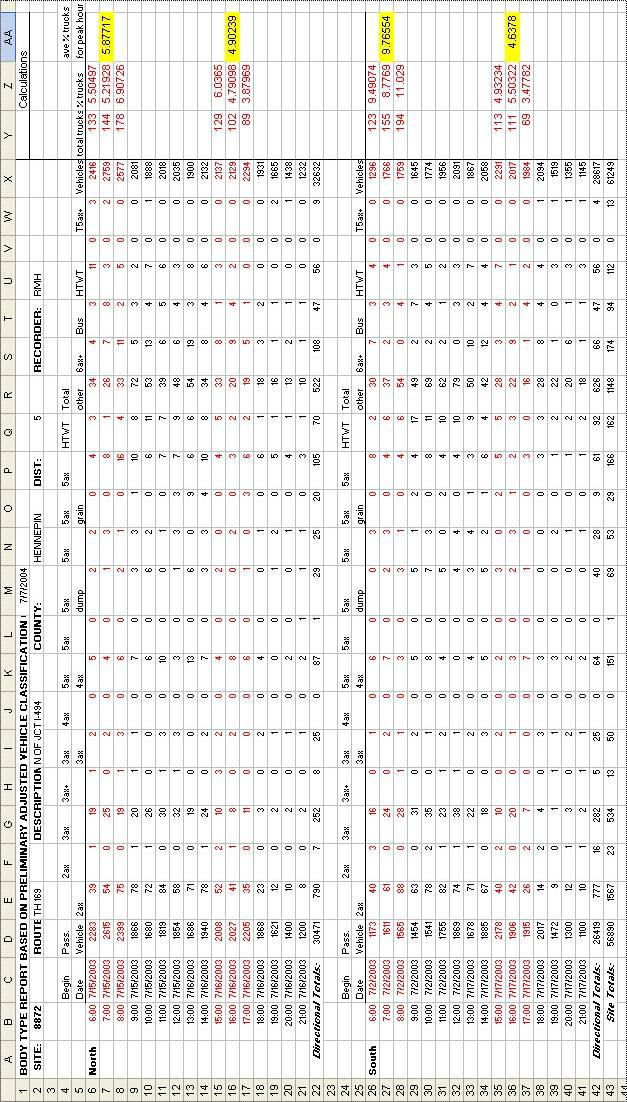
9 Figure 5: Diagram of detectors on TH-169 at I-494 (Full sized on next page) For the vehicle classification site 7999 in Figure 4 the closest detectors were used for acquiring the total volume. The site is located at Old Shakopee Road and TH169 (3.5 miles south of I-494), but since detectors on TH169 only go as far south as I-494, the most southern mainline detectors stations where used (Stations: 734 & 735). For the northbound direction, the volume on the roadway is the sum of detectors: 1310, 1401, and 1402; for southbound, it is the sum of detectors: 1456, 1457, and Data is collected for the AM and PM peak period. Figure 6 provides an example of the data extract file format for the 6:00am to 9:00 A.M. time period. Figure 6: Data Extract Data Note: The time stamp for each volume count is for the previous hour of data collection. But, in the vehicle classification site data the time noted is the time data collection started. So, for example, you will need the 7:00 A.M. line above for the 6:00 A.M. line in the vehicle classification file. 3.2 Example where passenger vehicle column is filled in Figure 7 is a vehicle classification site for TH169 north of I-494; this classification site has the passenger vehicles counted. In this instance, data extract and the detector volumes are not needed since the total volume is provided with just the vehicle classification data. 9
10 Figure 5: Diagram of detectors on TH 169 and I
11 Figure 7: Classification site data with passenger vehicle count 11

12 4.0 Calculating Truck Percents After incorporating the total hourly traffic volumes from the detectors into the developing Excel spreadsheet, a good organizational procedure would be to highlight the AM and PM peak periods that are being used in the operational models. This will help to distinguish which data and hours are being focused on. 4.1 Example of blank passenger vehicle column continued Figure 8: Truck percent calculations (Full sized on next page) To calculate the percent trucks column, the Vehicles column (This the total trucks since there were no passenger cars counted) is divided by the total vehicles counted by the detector station. Once the truck percentage has been calculated for each hour of the AM and PM periods, in both directions, find the average truck percent over the entire model period. The average percentage of trucks over the total model period is the value that needs to be coded into CORSIM. 12

13 Detectors 1310, 1401, 1402 Detectors 1456, 1457,

14 4.2 Continuation the passenger vehicles counted example If the data supplied from the site did include the passenger vehicles, then the total trucks is derived by subtracting the passenger vehicles from the total vehicles. Total Vehicles Passenger Vehicles = Total Trucks If the data comes in the form below, the total number of trucks is the sum of the heavy vehicles and total vehicles is the sum of the heavy vehicles and passenger vehicles. Passenger Vehicles + Heavy Vehicles = Total Vehicles The percent of trucks is calculated by dividing total trucks by the total vehicles, see Figure 9. Figure 9: Truck percent calculations with passenger vehicles known (Full sized on next page) Once the truck percentage has been calculated for each hour of the AM and PM periods, in both directions, find the average truck percent over the entire model period. The average percent of trucks over the total model period is the value that needs to be coded into CORSIM. 14
15 15

16 5.0 Coding CORSIM with truck percentages The truck percentage is coded into CORSIM at the entry nodes (8000) of the model. At these nodes the vehicles per hour are entered along with the truck percentage. Based on the above TH- 169/I-494 example, the AM average truck percent northbound for the site south of I-494 is going to be coded into the southern entry point of the roadway for the AM model. The PM average truck percent northbound at this station is also coded for the southern entry point of the roadway for the PM model. Then, the AM and PM average truck percents for the southbound portion of the station north of 494 will be entered the northern entry point of the roadway. 5.1 Coding into CORSIM using the *.tno file The truck percentage is entered by double-clicking on the entry node and entering the percentage in the box under the heading: Vehicle Types (other than passenger cars). The percentage of trucks can only be entered in whole numbers. The below figure is an example of the TSIS screen used to enter the truck percentages into the model for node 8100 (the northbound direction in the AM model for the site in examples one and three). AM peak percent for northbound is 6.67%, so input 7% Figure 10: TSIS screen used to enter truck percentages Reminder: A truck percentage must be entered for each time period. 16
17 5.2 Coding into CORSIM using the *.trf file Another option for coding the truck percentage is to edit record type 50. This is done by modifying the.trf file. To enter the truck percent for entry node #8100 from the above example, go to record type 50 and edit the columns and enter the percentage of trucks AM peak percent for northbound is 6.67%, so input 7% Figure 11: Record type 50 used to enter truck percentages The highlighted number is the truck percentage for node 8100, once again in whole numbers. After entering the truck percentage for each entry node in card 50 for the first time period, it can be copied and pasted in for all the other time periods in the model, since the truck percentage is an average of the whole simulated period and will stay the same throughout the entire simulated time. 17
18 6.0 Calculating Fleet Composition The fleet composition split between the different vehicle types is calculated using the vehicle classification data. For each of the four groups of vehicles (SUTs, 3&4 axle semis, 5+ axle semis, and double bottom trailers) the total amount of vehicles are calculated by adding together all the values for every direction, at every freeway or arterial classification site and in every hour of the model. For example, if the two stations below were the only two freeway sites in the model, the AM total amount of SUTs would be: ( )+( )+ ( )+( )+ ( )+( ) (19+5+4)+(34+7+0)+(41+7+0)+ + (26+5+0)+(30+3+0)+(65+3+0) = 696 Site one data Site two data Total SUTs Site One: Site Two: SUT 3 & 4 axle Semi-Trailer 5+ axle Semi-Trailer Double Bottom Trailer SUT 3 & 4 axle Semi-Trailer 5+ axle Double Bottom Semi-Trailer Trailer 18
 2")
")

 6+ axle")
")
19 Figure 12: Heavy Vehicle Types 1) 2 axle Single Unit 5) 4 axle Semi-Trailer 2) 3 axle Single Unit 6) 5 axle Semi-Trailer 3) 4+ axle Single Unit 7) 6+ axle Semi-Trailer 4) 3 axle Semi-Trailer 8) Double Bottom Trailer 19
20 Determining fleet vehicle split: % SUTs = Total SUTs _ Tot. SUT + Tot. 3&4 axle Semis + Tot. 5+ axle Semis + Tot. Double Semis % Double = Total Double Bottom Trailers _ Bottom Trailers Tot. SUT + Tot. 3&4 axle Semis + Tot. 5+ axle Semis + Tot. Dbl Semis To determine the split between medium and heavy semis, use the following Census Bureau counts to convert number of axles to weight: 13.9% of 3&4 axle semi-trailers are medium weight (under 26,000 lbs) 86.1% of 3&4 axle semi-trailers are heavy weight (over 26,000 lbs). For 5+ axle semi-trailers, 1.3% of 5+ axle semi-trailers are medium weight. The remaining 98.7% of 5+ axle semi-trailers are heavy weight. Thus, calculating the percent of medium weight and heavy weight semis is as follows: % Medium Semis = 0.139*(Total 3&4 axle Semis) *(Total 5+ axle Semis) _ Tot. SUT + Tot. 3&4 axle Semis + Tot. 5+ axle Semis + Tot. Dbl Semis % Heavy Semis = 0.861*(Total 3&4 axle Semis) *(Total 5+ axle Semis) _ Tot. SUT + Tot. 3&4 axle Semis + Tot. 5+ axle Semis + Tot. Dbl Semis * Note: After calculating the above percentages, round them to the nearest whole percentage and be sure they add to 100%, adjust if they do not. 20

21 7.0 Inserting Fleet Composition into CORSIM CORSIM uses global parameters to model the fleet composition. Record type 71 is used for the FRESIM network, and record type 58 is used for the NETSIM network. CORSIM defines vehicle types for FRESIM and NETSIM using the following table: Carpool vehicles Figure 13: Table of vehicle type descriptions For example, a low-performance passenger car is vehicle type 1 in FRESIM and vehicle type 5 in NETSIM. Similarly, a high performance passenger car is vehicle type 2 in FRESIM and vehicle type 1 in NETSIM, and so on. 7.1 Coding FRESIM network for fleet splits Create a spreadsheet similar to the one on the next page and enter the four truck-type percentages found for the freeway network in the highlighted cells of the % of trucks that are of this type column. All of the other numbers in the table can be duplicated from below. 21
22 RT 71: FRESIM Sub-model Vehicle Type Specifications (Fleet Composition) Entry Description Vehicle Type Vehicle Length Description Units Integer Feet Jerk Value Max Deceleration for vehicle type % of P.C. that are of this type % of Trucks that are of this type % of Mass transit % of carpool that are of this type Vehicle performance index Ft/sec 3 (10ths) ft/sec 2 % % % % Integer Ave No. of persons per veh People (100ths) Fleet Component Vehicle Type Range 9-Jan Jan Lane No. RT 1-Low Performance Passenger 2-High Cars Performance Truck 3-Single unit Semi-trailer with medium load Semi Trailer with full load Double bottom Trailer Bus 7-Conventional Low performance Carpool 9-High Performance Below is the card 71 that needs to be inserted into time period one of the model. The 3 rd, 4 th, 5 th, and 6 th, rows in column 6 of card 71 are the truck percentages as entered into the table above. 7.2 Coding NETSIM network for fleet splits Create a spreadsheet similar to below and enter the four truck type percents found for the freeway network in the highlighted cells of the % of trucks that are of this type column. All of the other numbers in the table can be duplicated from below. (Note the vehicle type column differs from the FRESIM table) 22
23 RT 58:NETSIM Sub-model Vehicle Type Specification (Fleet Composition) Entry Description Vehicle Type Vehicle Length Mean Queue Discharge Factor % of P.C. that are of this type % of Trucks that are of this type % of Mass transit % of carpool that are of this type Ave No. of persons per veh 7Description Units integer Feet % % % % % People (100ths) Fleet Component Vehicle Type Range 9-Jan Lane No. RT Passenger Cars 1-High Performance Low Performance Single unit Semi-trailer with medium load Semi Trailer with full load Truck 8-Double bottom Trailer Bus 4-Conventional Carpool 3-High performance Low Performance Below is the card 58 that needs to be inserted into the first time period of the model. The 3 rd, 4 th, 5 th, and 6 th, rows in column 5 are the truck percentages as entered into the table above. 23
24 8.0 Submittal Requirements 1. Electronic copy of raw data counts from the Mn/DOT Office of Transportation Data & Analysis See Figures 4 & 7 2. Electronic copy of the excel spreadsheet used to calculate truck percentages and fleet splits. See figures 8 & 9 3. Electronic and paper copies of the RT 58 and RT 71 spreadsheets. 4. Technical Memo explaining any deviations in CORSIM from the calculated numbers. 24
Interstate Operations Study: Fargo-Moorhead Metropolitan Area Simulation Output
 NDSU Dept #2880 PO Box 6050 Fargo, ND 58108-6050 Tel 701-231-8058 Fax 701-231-6265 www.ugpti.org www.atacenter.org Interstate Operations Study: Fargo-Moorhead Metropolitan Area 2015 Simulation Output Technical
Interstate Operations Study: Fargo-Moorhead Metropolitan Area Simulation Results
 NDSU Dept #2880 PO Box 6050 Fargo, ND 58108-6050 Tel 701-231-8058 Fax 701-231-6265 www.ugpti.org www.atacenter.org Interstate Operations Study: Fargo-Moorhead Metropolitan Area 2025 Simulation Results
Roundabout Modeling in CORSIM. Aaron Elias August 18 th, 2009
 Roundabout Modeling in CORSIM Aaron Elias August 18 th, 2009 Objective To determine the best method of roundabout implementation in CORSIM and make recommendations for its improvement based on comparisons
IMPROVEMENT CONCEPTS
 IMPROVEMENT CONCEPTS for the South Novato Transit Hub Study Prepared by: January 11, 2010 DKS Associates With Wilbur Smith Associates IMPROVEMENT CONCEPTS Chapter 1: Introduction 1. INTRODUCTION The strategic
Bennett Pit. Traffic Impact Study. J&T Consulting, Inc. Weld County, Colorado. March 3, 2017
 Bennett Pit Traffic Impact Study J&T Consulting, Inc. Weld County, Colorado March 3, 217 Prepared By: Sustainable Traffic Solutions, Inc. http://www.sustainabletrafficsolutions.com/ Joseph L. Henderson,
Metropolitan Freeway System 2013 Congestion Report
 Metropolitan Freeway System 2013 Congestion Report Metro District Office of Operations and Maintenance Regional Transportation Management Center May 2014 Table of Contents PURPOSE AND NEED... 1 INTRODUCTION...
LAWRENCE TRANSIT CENTER LOCATION ANALYSIS 9 TH STREET & ROCKLEDGE ROAD / 21 ST STREET & IOWA STREET LAWRENCE, KANSAS
 LAWRENCE TRANSIT CENTER LOCATION ANALYSIS 9 TH STREET & ROCKLEDGE ROAD / 21 ST STREET & IOWA STREET LAWRENCE, KANSAS TRAFFIC IMPACT STUDY FEBRUARY 214 OA Project No. 213-542 TABLE OF CONTENTS 1. INTRODUCTION...
Alpine Highway to North County Boulevard Connector Study
 Alpine Highway to North County Boulevard Connector Study prepared by Avenue Consultants March 16, 2017 North County Boulevard Connector Study March 16, 2017 Table of Contents 1 Summary of Findings... 1
To: File From: Adrian Soo, P. Eng. Markham, ON File: Date: August 18, 2015
 Memo To: From: Adrian Soo, P. Eng. Markham, ON : 165620021 Date: Reference: E.C. Row Expressway, Dominion Boulevard Interchange, Dougall Avenue Interchange, and Howard 1. Review of Interchange Geometry
Open House. Highway212. Meetings. Corridor Access Management, Safety & Phasing Plan. 5:30 to 6:30 p.m. - Southwest Corridor Transportation Coalition
 Welcome Meetings 5:30 to 6:30 p.m. - Southwest Corridor Transportation Coalition 6:30 to 8:00 p.m. - Open House Why is Highway 212 Project Important? Important Arterial Route Local Support Highway 212
Project Title: Using Truck GPS Data for Freight Performance Analysis in the Twin Cities Metro Area Prepared by: Chen-Fu Liao (PI) Task Due: 9/30/2013
 Task Due: 9/30/2013") MnDOT Contract No. 998 Work Order No.47 213 Project Title: Using Truck GPS Data for Freight Performance Analysis in the Twin Cities Metro Area Prepared by: Chen-Fu Liao (PI) Task Due: 9/3/213 TASK #4:
MnDOT Contract No. 998 Work Order No.47 213 Project Title: Using Truck GPS Data for Freight Performance Analysis in the Twin Cities Metro Area Prepared by: Chen-Fu Liao (PI) Task Due: 9/3/213 TASK #4:
TRAFFIC IMPACT STUDY. USD #497 Warehouse and Bus Site
 TRAFFIC IMPACT STUDY for USD #497 Warehouse and Bus Site Prepared by: Jason Hoskinson, PE, PTOE BG Project No. 16-12L July 8, 216 145 Wakarusa Drive Lawrence, Kansas 6649 T: 785.749.4474 F: 785.749.734
EXECUTIVE SUMMARY. The following is an outline of the traffic analysis performed by Hales Engineering for the traffic conditions of this project.
 EXECUTIVE SUMMARY This study addresses the traffic impacts associated with the proposed Shopko redevelopment located in Sugarhouse, Utah. The Shopko redevelopment project is located between 1300 East and
Metropolitan Freeway System 2007 Congestion Report
 Metropolitan Freeway System 2007 Congestion Report Minnesota Department of Transportation Office of Traffic, Safety and Operations Freeway Operations Section Regional Transportation Management Center March
Transportation & Traffic Engineering
 Transportation & Traffic Engineering 1) Project Description This report presents a summary of findings for a Traffic Impact Analysis (TIA) performed by A+ Engineering, Inc. for the Hill Country Family
2016 Congestion Report
 2016 Congestion Report Metropolitan Freeway System May 2017 2016 Congestion Report 1 Table of Contents Purpose and Need...3 Introduction...3 Methodology...4 2016 Results...5 Explanation of Percentage Miles
Re: Addendum No. 4 Transportation Overview 146 Mountshannon Drive Ottawa, Ontario
 April 18 th, 2017 Mr. Kevin Yemm Vice President, Land Development Richraft Group of Companies 2280 St. Laurent Boulevard, Suite 201 Ottawa, Ontario (Tel: 613.739.7111 / e-mail: keviny@richcraft.com) Re:
TRAFFIC IMPACT ANALYSIS RIZZO CONFERENCE CENTER EXPANSION FINAL REPORT
 TRAFFIC IMPACT ANALYSIS RIZZO CONFERENCE CENTER EXPANSION Chapel Hill, North Carolina FINAL REPORT Prepared for: The Town of Chapel Hill, NC Prepared by: Architects-Engineers-Planners, Inc. December 2010
2.0 Development Driveways. Movin Out June 2017
 Movin Out June 2017 1.0 Introduction The proposed Movin Out development is a mixed use development in the northeast quadrant of the intersection of West Broadway and Fayette Avenue in the City of Madison.
Southern Windsor County 2016 Traffic Count Program Summary April 2017
 Southern Windsor County 2016 Traffic Count Program Summary April 2017 The Southern Windsor County Regional Planning Commission (the RPC ) has been monitoring traffic at 19 locations throughout the southern
Transit City Etobicoke - Finch West LRT
 Delcan Corporation Transit City Etobicoke - Finch West LRT APPENDIX D Microsimulation Traffic Modeling Report March 2010 March 2010 Appendix D CONTENTS 1.0 STUDY CONTEXT... 2 Figure 1 Study Limits... 2
Proposed location of Camp Parkway Commerce Center. Vicinity map of Camp Parkway Commerce Center Southampton County, VA
 Proposed location of Camp Parkway Commerce Center Vicinity map of Camp Parkway Commerce Center Southampton County, VA Camp Parkway Commerce Center is a proposed distribution and industrial center to be
Traffic Engineering Study
 Traffic Engineering Study Bellaire Boulevard Prepared For: International Management District Technical Services, Inc. Texas Registered Engineering Firm F-3580 November 2009 Executive Summary has been requested
Project Advisory Committee
 Meredith US 3/NH 25 Improvements Transportation Planning Study Project Advisory Committee March 18, 2008 Meredith US 3/NH 25 Improvements Transportation Planning Study Meeting Agenda Welcome Traffic Model
Craigieburn Employment Precinct North and English Street
 Craigieburn Employment Precinct North and English Street METROPOLITAN PLANNING AUTHORITY Intersection Analyses 7 February 2014 Intersection Analyses Craigieburn Employment Precinct North and English Street
Appendix G Traffic Study Methodology
 REVISED DRAFT ENVIRONMENTAL IMPACT REPORT/ Appendix G Traffic Forecasting Model Methodology In addition to the existing/baseline condition (year 2005), a level of service (LOS) analysis was conducted for
Introduction and Background Study Purpose
 Introduction and Background The Brent Spence Bridge on I-71/75 across the Ohio River is arguably the single most important piece of transportation infrastructure the Ohio-Kentucky-Indiana (OKI) region.
Table 8-1: Service Frequencies for All Short-List Alternatives by Day of Week and Time of Day Frequency Day of Week Time of Day Time Period
 8. Operating Plans The following Section presents the operating plans for the Short-List Alternatives. The modern streetcar operating plans are presented for Alternatives 2 and 3, followed by bus rapid
Appendix J Traffic Impact Study
 MRI May 2012 Appendix J Traffic Impact Study Level 2 Traffic Assessment Limited Impact Review Appendix J [This page was left blank intentionally.] www.sgm-inc.com Figure 1. Site Driveway and Trail Crossing
Chapter 12 VEHICLE SPOT SPEED STUDY
 Chapter 12 VEHICLE SPOT SPEED STUDY 12.1 PURPOSE (1) The Vehicle Spot Speed Study is designed to measure the speed characteristics at a specified location under the traffic and environmental conditions
FIELD APPLICATIONS OF CORSIM: I-40 FREEWAY DESIGN EVALUATION, OKLAHOMA CITY, OK. Michelle Thomas
 Proceedings of the 1998 Winter Simulation Conference D.J. Medeiros, E.F. Watson, J.S. Carson and M.S. Manivannan, eds. FIELD APPLICATIONS OF CORSIM: I-40 FREEWAY DESIGN EVALUATION, OKLAHOMA CITY, OK Gene
HISTORIC TRAFFIC COUNT DATA ( )
") HISTORIC TRAFFIC COUNT DATA (1980 2015) Highlights The traffic trends for 25 locations in the 22202 zip code area have decreased by 20 percent (on average) since 2000, when traffic peaked. Currently, average
HISTORIC TRAFFIC COUNT DATA (1980 2015) Highlights The traffic trends for 25 locations in the 22202 zip code area have decreased by 20 percent (on average) since 2000, when traffic peaked. Currently, average
Plan Check Policies and Guidelines
 Plan Check Policies and Guidelines VII. A. INTRODUCTION Traffic signing and striping plans are required for all General Plan Roads and any roadway that is 56-foot wide curb-to-curb (78 R/W) or wider. Transportation
FREQUENTLY ASKED QUESTIONS
 THE PROJECT Last updated on 9/8/16 FREQUENTLY ASKED QUESTIONS What s happening on Highway 169? The Minnesota Department of Transportation (MnDOT) is planning to rebuild and repair the infrastructure on
MILLERSVILLE PARK TRAFFIC IMPACT ANALYSIS ANNE ARUNDEL COUNTY, MARYLAND
 MILLERSVILLE PARK TRAFFIC IMPACT ANALYSIS ANNE ARUNDEL COUNTY, MARYLAND Prepared for: Department of Public Works Anne Arundel County Prepared by: URS Corporation 4 North Park Drive, Suite 3 Hunt Valley,
Table of Contents INTRODUCTION... 3 PROJECT STUDY AREA Figure 1 Vicinity Map Study Area... 4 EXISTING CONDITIONS... 5 TRAFFIC OPERATIONS...
 Crosshaven Drive Corridor Study City of Vestavia Hills, Alabama Table of Contents INTRODUCTION... 3 PROJECT STUDY AREA... 3 Figure 1 Vicinity Map Study Area... 4 EXISTING CONDITIONS... 5 TRAFFIC OPERATIONS...
Table of Contents. Traffic Impact Analysis Capital One Building at Schilling Place
 Traffic Impact Analysis Capital One Building at Schilling Place Table of Contents Executive Summary... 1 1. Introduction... 4 2. Project Description... 4 3. Background Information... 4 4. Study Scope...
5. OPPORTUNITIES AND NEXT STEPS
 5. OPPORTUNITIES AND NEXT STEPS When the METRO Green Line LRT begins operating in mid-2014, a strong emphasis will be placed on providing frequent connecting bus service with Green Line trains. Bus hours
Speed measurements were taken at the following three locations on October 13 and 14, 2016 (See Location Map in Exhibit 1):
:") 2709 McGraw Drive Bloomington, Illinois 61704 p 309.663.8435 f 309.663.1571 www.f-w.com www.greennavigation.com November 4, 2016 Mr. Kevin Kothe, PE City Engineer City of Bloomington Public Works Department
2709 McGraw Drive Bloomington, Illinois 61704 p 309.663.8435 f 309.663.1571 www.f-w.com www.greennavigation.com November 4, 2016 Mr. Kevin Kothe, PE City Engineer City of Bloomington Public Works Department
MERIVALE PRIORITY SQUARE 2852 MERIVALE ROAD CITY OF OTTAWA TRANSPORTATION BRIEF. Prepared for: ONT Inc. 25 Winding Way Nepean, Ontario K2C 3H1
 MERIVALE PRIORITY SQUARE 2852 MERIVALE ROAD CITY OF OTTAWA TRANSPORTATION BRIEF Prepared for: 2190986ONT Inc. 25 Winding Way Nepean, Ontario K2C 3H1 October 6, 2010 110-502 Report_1.doc D. J. Halpenny
FREQUENTLY ASKED QUESTIONS
 THE PROJECT Last updated on 2/19/16 FREQUENTLY ASKED QUESTIONS What s happening on Highway 169? The Minnesota Department of Transportation (MnDOT) is planning to rebuild and repair the infrastructure on
Craig Scheffler, P.E., PTOE HNTB North Carolina, P.C. HNTB Project File: Subject
 TECHNICAL MEMORANDUM To Kumar Neppalli Traffic Engineering Manager Town of Chapel Hill From Craig Scheffler, P.E., PTOE HNTB North Carolina, P.C. Cc HNTB Project File: 38435 Subject Obey Creek TIS 2022
Fleet Penetration of Automated Vehicles: A Microsimulation Analysis
 Fleet Penetration of Automated Vehicles: A Microsimulation Analysis Corresponding Author: Elliot Huang, P.E. Co-Authors: David Stanek, P.E. Allen Wang 2017 ITE Western District Annual Meeting San Diego,
Traffic Impact Analysis 5742 BEACH BOULEVARD MIXED USE PROJECT
 Traffic Impact Analysis 5742 BEACH BOULEVARD MIXED USE PROJECT CITY OF BUENA PARK Prepared by Project No. 14139 000 April 17 th, 2015 DKS Associates Jeffrey Heald, P.E. Rohit Itadkar, T.E. 2677 North Main
Pembina Emerson Border Crossing Interim Measures Microsimulation
 Pembina Emerson Border Crossing Interim Measures Microsimulation Final Report December 2013 Prepared for: North Dakota Department of Transportation Prepared by: Advanced Traffic Analysis Center Upper Great
MEMORANDUM. Figure 1. Roundabout Interchange under Alternative D
 MEMORANDUM Date: To: Liz Diamond, Dokken Engineering From: Subject: Dave Stanek, Fehr & Peers Western Placerville Interchanges 2045 Analysis RS08-2639 Fehr & Peers has completed a transportation analysis
Plan Check Policies and Guidelines
 VIII. TRAFFIC SIGNING AND STRIPING PLANS A. INTRODUCTION Traffic signing and striping plans are required for all General Plan Roads and any roadway that is 56-foot wide curb-to-curb (78 R/W) or wider.
FINAL REPORT FORM 1 (Formerly titled Project Monitoring Form 1 - Ridesharing ) Total Project Cost: $
 Total Project Cost: $") FINAL REPORT FORM 1 (Formerly titled Project Monitoring Form 1 - Ridesharing ) For Ridesharing; Shuttle/Vanpool; Carpool/Transit Information; Rail-Bus Integration; and Smart Growth Projects TFCA Project
FINAL REPORT FORM 1 (Formerly titled Project Monitoring Form 1 - Ridesharing ) For Ridesharing; Shuttle/Vanpool; Carpool/Transit Information; Rail-Bus Integration; and Smart Growth Projects TFCA Project
FE Review-Transportation-II. D e p a r t m e n t o f C i v i l E n g i n e e r i n g U n i v e r s i t y O f M e m p h i s
 FE Review-Transportation-II D e p a r t m e n t o f C i v i l E n g i n e e r i n g U n i v e r s i t y O f M e m p h i s Learning Objectives Design, compute, and solve FE problems on Freeway level of
TIMBERVINE TRANSPORTATION IMPACT STUDY FORT COLLINS, COLORADO JANUARY Prepared for:
 TIMBERVINE TRANSPORTATION IMPACT STUDY FORT COLLINS, COLORADO JANUARY 2014 Prepared for: Hartford Companies 1218 W. Ash Street Suite A Windsor, Co 80550 Prepared by: DELICH ASSOCIATES 2272 Glen Haven Drive
1 TO 2 2 TO 3 12 TO 1 10 TO TO 12
 STATION: New York State Department of Transportation Traffic Count Hourly Report Page of ROUTE #: NY ROAD NAME: FROM: RT CENTRAL SQUARE : ACC RT I COUNTY: Oswego : Northbound FACR GROUP: REC. SERIAL #:
County State Aid Highway 30 (Diffley Road) and Dodd Road Intersection Study
 and Dodd Road Intersection Study") County State Aid Highway 30 (Diffley Road) and Dodd Road Intersection Study City of Eagan, Dakota County, Minnesota Date: March 2012 Project No. 14957.000 444 Cedar Street, Suite 1500 Saint Paul, MN 55101
County State Aid Highway 30 (Diffley Road) and Dodd Road Intersection Study City of Eagan, Dakota County, Minnesota Date: March 2012 Project No. 14957.000 444 Cedar Street, Suite 1500 Saint Paul, MN 55101
Escondido Marriott Hotel and Mixed-Use Condominium Project TRAFFIC IMPACT ANALYSIS REPORT
 Escondido Marriott Hotel and Mixed-Use Condominium Project TRAFFIC IMPACT ANALYSIS REPORT Prepared for Phelps Program Management 420 Sixth Avenue, Greeley, CO 80632 Prepared by 5050 Avenida Encinas, Suite
Traffic, Transportation & Civil Engineering Ali R. Khorasani, P.E. P.O. Box 804, Spencer, MA 01562, Tel: (508)
") Associates Traffic, Transportation & Civil Engineering Ali R. Khorasani, P.E. P.O. Box 804, Spencer, MA 01562, Tel: (508) 885-5121 Ms. Teri Ford, Associate 800 Boylston Street, Suite 1570 Boston, MA July
Associates Traffic, Transportation & Civil Engineering Ali R. Khorasani, P.E. P.O. Box 804, Spencer, MA 01562, Tel: (508) 885-5121 Ms. Teri Ford, Associate 800 Boylston Street, Suite 1570 Boston, MA July
Truck Priority at Signalized Intersections
 Truck Priority at Signalized Intersections SEH No. December 15, 2004 Truck Priority at Signalized Intersections SEH No. December 15, 2004 I hereby certify that this report was prepared by me or under my
I-820 (East) Project Description. Fort Worth District. Reconstruct Southern I-820/SH 121 Interchange
 Project Description. Fort Worth District. Reconstruct Southern I-820/SH 121 Interchange") I-820 (East) Project Description Fort Worth District Reconstruct Southern I-820/SH 121 Interchange I-820 from approximately 2,000 feet north of Pipeline Road/Glenview Drive to approximately 3,200 feet
I-820 (East) Project Description Fort Worth District Reconstruct Southern I-820/SH 121 Interchange I-820 from approximately 2,000 feet north of Pipeline Road/Glenview Drive to approximately 3,200 feet
Table Standardized Naming Convention for ERD Files
 S-1 (2399) PAVEMENT SURFACE SMOOTHNESS (2013 version) DO NOT REMOVE THIS. IT NEEDS TO STAY IN FOR THE CONTRACTORS. Always use with SP2005-111 (CONCRETE PAVING MIX SPECIFICATIONS PAVEMENT) and SP2005-140
TRAVEL DEMAND FORECASTS
 Jiangxi Ji an Sustainable Urban Transport Project (RRP PRC 45022) TRAVEL DEMAND FORECASTS A. Introduction 1. The purpose of the travel demand forecasts is to assess the impact of the project components
WIM #39 MN 43, MP 45.2 WINONA, MN APRIL 2010 MONTHLY REPORT
 WIM #39 MN 43, MP 45.2 WINONA, MN APRIL 2010 MONTHLY REPORT In order to understand the vehicle classes and groupings the Mn/DOT Vehicle Classification Scheme and the Vehicle Class Groupings for Forecasting
LADOT Railroad Preemption Form Instructions
 LADOT Railroad Preemption Form Instructions The LADOT Railroad Preemption Form is entirely contained on one worksheet within an Excel workbook. If Additional approaches to the crossing are analyzed, the
Central Park Drives Traffic Management Overview
 Central Park Drives Traffic Management Overview Spring 2015 New York City Department of Transportation Existing Traffic Management From Labor Day thru Last Day of NYC Public School: 8-10 AM weekdays (Southbound)
MEMO. McCORMICK RANKIN CORPORATION. File FROM: Keyur Shah DATE: February 1, 2010 COPIES: OUR FILE: SUBJECT: TO:
 McCORMICK RANKIN CORPORATION 2655 North Sheridan Way Mississauga, Ontario, L5K 2P8 Tel: (905)823-8500 Fax: (905) 823-8503 E-mail: mrc@mrc.ca Website: www.mrc.ca MEMO TO: File FROM: Keyur Shah DATE: February
WIM #41 CSAH 14, MP 14.9 CROOKSTON, MINNESOTA MAY 2013 MONTHLY REPORT
 WIM #41 CSAH 14, MP 14.9 CROOKSTON, MINNESOTA MAY 2013 MONTHLY REPORT In order to understand the vehicle classes and groupings the Mn/DOT Vehicle Classification Scheme and the Vehicle Classification Groupings
HIGHWAY 28 FUNCTIONAL DESIGN
 HIGHWAY 28 FUNCTIONAL DESIGN PUBLIC OPEN HOUSE #1 WEDNESDAY, MARCH 12, 2014 Stantec Presenters: Brad Vander Heyden, Project Engineer Neal Cormack, Project Manager Dave Parker, Project Engineer Beth Thola,
Traffic Management Plan and Queuing Analysis Lakehill Preparatory School Z Hillside Drive, Dallas, TX October 27, 2015
 Traffic Management Plan and Queuing Analysis Lakehill Preparatory School Z145-235 2720 Hillside Drive, Dallas, TX October 27, 2015 Introduction: The Lakehill Preparatory School is located on the northeast
Attachment D Environmental Justice and Outreach
 Attachment D Environmental Justice and Outreach ATTACHMENT D Environmental Justice and Outreach Indicate whether the project will have disproportionately high and adverse impacts on minority or low income
Tongaat Hullette Developments - Cornubia Phase 2. Technical Note 02 - N2/M41 AIMSUN Micro-simulation Analysis
 Technical Note 02 - N2/M41 AIMSUN Micro-simulation Tongaat Hullette Developments Cornubia Phase 2 Technical Note 02 - N2/M41 AIMSUN Micro-simulation Analysis Prepared by: 18/11/14 Justin Janki Date Approvals
INDUSTRIAL DEVELOPMENT
 INDUSTRIAL DEVELOPMENT Traffic Impact Study Plainfield, Illinois August 2018 Prepared for: Seefried Industrial Properties, Inc. TABLE OF CONTENTS Executive Summary 2 Introduction 3 Existing Conditions
King County Metro. Columbia Street Transit Priority Improvements Alternative Analysis. Downtown Southend Transit Study. May 2014.
 King County Metro Columbia Street Transit Priority Improvements Alternative Analysis Downtown Southend Transit Study May 2014 Parametrix Table of Contents Introduction... 1 Methodology... 1 Study Area...
TRAFFIC IMPACT ANALYSIS FOR. McDONALD S RESTAURANT IN CARMICAEL Sacramento County, CA. Prepared For:
 TRAFFIC IMPACT ANALYSIS FOR McDONALD S RESTAURANT IN CARMICAEL Sacramento County, CA Prepared For: McDonald s USA, LLC Pacific Sierra Region 2999 Oak Road, Suite 900 Walnut Creek, CA 94597 Prepared By:
Construction Realty Co.
 MEMORANDUM TO: FROM : Jeff Pickus Construction Realty Co. Luay R. Aboona, PE Principal 9575 West Higgins Road, Suite 400 Rosemont, Illinois 60018 p: 847-518-9990 f: 847-518-9987 DATE: May 22, 2014 SUBJECT:
WIM #41 CSAH 14, MP 14.9 CROOKSTON, MINNESOTA APRIL 2014 MONTHLY REPORT
 WIM #41 CSAH 14, MP 14.9 CROOKSTON, MINNESOTA APRIL 2014 MONTHLY REPORT In order to understand the vehicle classes and groupings, the MnDOT Vehicle Classification Scheme and the Vehicle Classification
Technical Memorandum. Purpose of Report and Study Objectives. Summary of Results
 Technical Memorandum To: Derek Leuer, MnDOT Traffic Safety Engineer From: Max Moreland, P.E. and Bryant Ficek, P.E., P.T.O.E. Date: February 17, 217 Re: Median Acceleration Lane Usage Purpose of Report
TECHNICAL MEMORANDUM. Part A: Introduction
 TECHNICAL MEMORANDUM To: David J. Decker Decker Properties, Inc. 5950 Seminole Centre Ct. Suite 200 Madison, Wisconsin 53711 608-663-1218 Fax: 608-663-1226 www.klengineering.com From: Mike Scarmon, P.E.,
June WASHINGTON STATE DEPARTMENT OF TRANSPORTATION Alaskan Way Viaduct and Seawall Replacement Program Seattle, Washington
 DESIGN DEVIATION NOs. 1 & 2 Horizontal Stopping Sight Distance and Shoulder Width Reduction SR 99 S. Holgate St to S. King St. Viaduct Replacement Stage 2 MP 29.89 TO MP 30.78 XL-3237 PIN-809936D June
TRAFFIC AND TRANSPORTATION TECHNICAL REPORT
 TRAFFIC AND TRANSPORTATION TECHNICAL REPORT for ENVIRONMENTAL ASSESSMENT Route 29 Bypass State Project No.: 0029-002-844, P101; UPC 102419 Federal Project Number: TBD From: Route 250 Bypass To: U.S. Route
TRAFFIC IMPACT STUDY VICDOM BROCK ROAD PIT EXPANSION
 TRAFFIC IMPACT STUDY VICDOM BROCK ROAD PIT EXPANSION TOWNSHIP OF UXBRIDGE P/N 05-1993 June 2011 Revised -August 2011 Prepared by: Skelton, Brumwell & Associates Inc. 93 Bell Farm Road, Suite 107 Barrie,
SANTA BARBARA COUNTY ASSOCIATION OF GOVERNMENTS GOLETA RAMP METERING STUDY MAY 8, 2018 FINAL REPORT
 SANTA BARBARA COUNTY ASSOCIATION OF GOVERNMENTS GOLETA RAMP METERING STUDY MAY 8, 2018 FINAL REPORT May 8, 2018 Page i TABLE OF CONTENTS Table of Contents... i 1. Introduction... 1 1.1 Summary... 1 2.
APPENDIX C ROADWAY BEFORE-AND-AFTER STUDY
 APPENDIX C ROADWAY BEFORE-AND-AFTER STUDY The benefits to pedestrians and bus patrons are numerous when a bus bay is replaced with a bus bulb. Buses should operate more efficiently at the stop when not
Evaluation of Renton Ramp Meters on I-405
 Evaluation of Renton Ramp Meters on I-405 From the SE 8 th St. Interchange in Bellevue to the SR 167 Interchange in Renton January 2000 By Hien Trinh Edited by Jason Gibbens Northwest Region Traffic Systems
APPENDIX B. Origin Destination Study Data
 APPENDIX B Origin Destination Study Data - TABLE OF CONTENTS - Page No. EXECUTIVE SUMMARY... 1 Map of the Study area with Site Locations... 2 Summary Table of Results for the TH 14 Corridor Study... 3
A IR Q UALITY A PPENDIX
 A P P E N D I X B A IR Q UALITY A PPENDIX... CO EWP Petaluma East Washington Place, Petaluma CARBON MONOXIDE ANALYSIS PM Peak Hour Assumes worst case of all intersections based on total volume, LOS and
TRAFFIC AND SAFETY NOTE 907B. Incentive/Disincentive Clause
 TRAFFIC AND SAFETY NOTE 97B SUBJECT: PURPOSE: Incentive/Disincentive Clause To Provide Guidance for Calculating Capacity in Determining if an Incentive/Disincentive is Warranted COORDINATING UNIT: Geometric
Interchange Justification Report
 Interchange Justification Report Interstate 29 at 85 th Street- Exit 74 Sioux Falls, SD SEH No. 132589 October 1, 2018 Prepared by: Short Elliott Hendrickson Inc. Executive Summary The Interchange Justification
Engineering Dept. Highways & Transportation Engineering
 The University College of Applied Sciences UCAS Engineering Dept. Highways & Transportation Engineering (BENG 4326) Instructors: Dr. Y. R. Sarraj Chapter 4 Traffic Engineering Studies Reference: Traffic
JCE 4600 Basic Freeway Segments
 JCE 4600 Basic Freeway Segments HCM Applications What is a Freeway? divided highway with full control of access two or more lanes for the exclusive use of traffic in each direction no signalized or stop-controlled
CHARACTERIZATION AND DEVELOPMENT OF TRUCK LOAD SPECTRA FOR CURRENT AND FUTURE PAVEMENT DESIGN PRACTICES IN LOUISIANA
 CHARACTERIZATION AND DEVELOPMENT OF TRUCK LOAD SPECTRA FOR CURRENT AND FUTURE PAVEMENT DESIGN PRACTICES IN LOUISIANA LSU Research Team Sherif Ishak Hak-Chul Shin Bharath K Sridhar OUTLINE BACKGROUND AND
TRAFFIC IMPACT ANALYSIS SHORTBREAD LOFTS 2009 MODIFICATION Chapel Hill, North Carolina
 TRAFFIC IMPACT ANALYSIS SHORTBREAD LOFTS 2009 MODIFICATION Chapel Hill, North Carolina Prepared for: The Town of Chapel Hill, NC Prepared by: Architects-Engineers-Planners, Inc. November 2009 Traffic Impact
TITLE 16. TRANSPORTATION CHAPTER 27. TRAFFIC REGULATIONS AND TRAFFIC CONTROL DEVICES
 NOTE: This is a courtesy copy of this rule. The official version can be found in the New Jersey Administrative Code. Should there be any discrepancies between this text and the official version, the official
REMOTE SENSING DEVICE HIGH EMITTER IDENTIFICATION WITH CONFIRMATORY ROADSIDE INSPECTION
 Final Report 2001-06 August 30, 2001 REMOTE SENSING DEVICE HIGH EMITTER IDENTIFICATION WITH CONFIRMATORY ROADSIDE INSPECTION Bureau of Automotive Repair Engineering and Research Branch INTRODUCTION Several
Quantitative analyses of weekday a.m. and p.m. commuter hour conditions have been conducted for the following five scenarios:
 6.1 TRANSPORTATION AND CIRCULATION 6.1.1 INTRODUCTION This section of the EIR presents the results of TJKM s traffic impact analysis of the proposed Greenbriar Development. The analysis includes consideration
Traffic Impact Statement (TIS)
") Traffic Impact Statement (TIS) Vincentian PUDA Collier County, FL 10/18/2013 Prepared for: Global Properties of Naples Prepared by: Trebilcock Consulting Solutions, PA 2614 Tamiami Trail N, Suite 615 1205
Traffic Impact Statement (TIS) Vincentian PUDA Collier County, FL 10/18/2013 Prepared for: Global Properties of Naples Prepared by: Trebilcock Consulting Solutions, PA 2614 Tamiami Trail N, Suite 615 1205
MEMORANDUM FPN: State Road: 91 County: Osceola (92)
") Traffic and Revenue Consultant Florida s Turnpike Enterprise Florida Department of Transportation MEMORANDUM Date: October 14, 2013 To: From: Copies: Subject: Tom Neyer, Production Project Manager Emam
Traffic and Revenue Consultant Florida s Turnpike Enterprise Florida Department of Transportation MEMORANDUM Date: October 14, 2013 To: From: Copies: Subject: Tom Neyer, Production Project Manager Emam
2002 Virginia Department of Transportation Daily Traffic Volume Estimates Including Vehicle Classification Estimates. Special Locality Report 129
 Daily Traffic Volume Estimates Including Vehicle Classification Estimates where available Special Locality Report 129 Prepared By In Cooperation With U.S. Department of Transportation Federal Highway Administration
Memorandum. To: Sue Polka, City Engineer, City of Arden Hills. From: Sean Delmore, PE, PTOE. Date: June 21, 2017
 Memorandum engineering planning environmental construction 701 Xenia Avenue South Suite 300 Minneapolis, MN 55416 Tel: 763-541-4800 Fax: 763-541-1700 To: Sue Polka, City Engineer, City of Arden Hills From:
Measuring Autonomous Vehicle Impacts on Congested Networks Using Simulation
 0 Measuring Autonomous Vehicle Impacts on Congested Networks Using Simulation Corresponding Author: David Stanek, PE Fehr & Peers 0 K Street, rd Floor, Sacramento, CA Tel: () -; Fax: () -0; Email: D.Stanek@fehrandpeers.com
SH 249 IN GRIMES COUNTY. Open House April 3, 2014
 SH 249 IN GRIMES COUNTY Open House April 3, 2014 Meeting Agenda Purpose of Meeting Today: Review the purpose and need for the SH 249 Grimes County project Review the proposed project and alternatives Discuss
TRAFFIC IMPACT ASSESSMENT PART OF AN ENVIRONMENTAL IMPACT ASSESSMENT FOR THE KEBRAFIELD ROODEPOORT COLLIERY IN THE PULLEN S HOPE AREA
 TRAFFIC IMPACT ASSESSMENT PART OF AN ENVIRONMENTAL IMPACT ASSESSMENT FOR THE KEBRAFIELD ROODEPOORT COLLIERY IN THE PULLEN S HOPE AREA 20 March 2014 Report prepared by: Corli Havenga Transportation Engineers
CHAPTER 7: EMISSION FACTORS/MOVES MODEL
 CHAPTER 7: EMISSION FACTORS/MOVES MODEL 7.1 Overview This chapter discusses development of the regional motor vehicle emissions analysis for the North Central Texas nonattainment area, including all key
I-405 Sepulveda Pass Improvements Project Wilshire Ramps Reconstruction
 metro.net/works I-405 Sepulveda Pass Improvements Project Wilshire Ramps Reconstruction We re working to create safer, smoother interchanges. Project Overview The primary goal of the I-405 Sepulveda Pass