Newark Future. Newark Highway Model Local Model Validation Report
|
|
|
- Morgan Townsend
- 5 years ago
- Views:
Transcription
1 Newark Future Newark Highway Model Local Model Validation Report
2
3
4 QM Issue/revision Issue 1 Revision 1 Revision 2 Revision 3 Remarks LMVR 1 LMVR 2 LMVR Final LMVR Model with Blocking Back Date January 2008 March 2008 July 2008 February 2010 Prepared by S Farrace Christine Palmer Michael Johns Michael Johns H Mansley Michael Johns Sally Johnson Signature SF / HM CP / MJ MJ MJ / SJ Checked by Paul Speirs Paul Speirs Paul Speirs Paul Speirs Signature PS PS PS PS Authorised by Mike Batheram Mike Batheram Mike Batheram Mike Batheram Signature MB MB MB MB Project number File reference Y:\Newark Y:\Newark Y:\Newark N:\Newark Transport Model, Transport Model, Transport Model, Transport Model Nottinghamshire\ Nottinghamshire\ Nottinghamshire\ Update\TEXT\RE TEXT\REPORTS TEXT\REPORTS TEXT\REPORTS PORTS\Newark \LMVR\Newark \LMVR\Newark \LMVR\Newark LMVR with LMVR V4.doc LMVR Draft LMVR FINAL Blocking Back March 2008 version July 2008 February 2010 (V7.0).doc (V8.1).doc (V9.0).doc WSP UK Limited Development & Transportation WSP House 70 Chancery Lane London WC2A 1AF Tel: +44 (0) Fax: +44 (0) Reg. No:
5 Contents EXECUTIVE SUMMARY 1 1 Introduction Background Model Requirements Report Purpose Report Structure 4 2 Model Overview Introduction Model Base Year and Time Periods Software Model Approach 5 3 Model Extent and Network Model Extent Highway Network Junctions Level Crossings Zoning System 10 4 Survey and Count Data Available Data Data Collection Count Balancing 16 5 Highway Matrix Development Introduction Highway Survey Data Model Zones Data Cleaning/Logic Checking Interview Sampling Observed Matrix Travel To Work Matrix Prior Matrix Matrix Estimation Final Highway Matrix Summary 25
6 6 Model Assignment, Calibration and Validation Procedures Assignment Volume-Delay Functions Calibration Procedures Validation Procedures Range Checking Route Choice Route Journey Time Validation GEH Statistic Screenline and Cordon Flows Junctions 30 7 Model Calibration and Validation Results Introduction Route Checking Convergence Calibration Traffic Counts Validation Traffic Counts All Traffic Counts Highway Screenline and Cordon Flows Highway Route Journey Time Comparisons 40 8 Conclusions Model Development Model Validation / Calibration Fit For Purpose 49 Appendix A Count Data Balancing Appendix B Matrix Expansion Factors Appendix C Prior and Final Matrix Comparison Appendix D Highway GEH Statistics Appendix E Journey Time Results
7 LIST OF FIGURES Figure 2.1 Base Year Model Development Flow Chart...6 Figure 3.1 NHM Network Coverage Study Area...7 Figure 3.2 NHM Network Coverage Wider Area...8 Figure 3.3 Simulated Junction Locations...9 Figure 3.4 Zone and Sector Plan (Newark)...11 Figure 3.5 Zone and Sector Plan (Countywide)...12 Figure 3.6 Zone and Sector Plan (England and Wales)...13 Figure 4.1 Newark-on-Trent Survey Sites...15 Figure RSI Sample Sizes...18 Figure 6.1 Screenlines and Cordons...31 Figure 7.1 Links with GEH>10 (in either AM or PM peak)...37 Figure 7.2 Journey Time Route Figure 7.3 Journey Time Route Figure 7.4 Journey Time Route Figure 7.5 Journey Time Route Figure 7.6 Calibration Count Sites...47 Figure Validation Count Sites...48 LIST OF TABLES Table 3.1 Level Crossing Timings...10 Table 5.1 Cleaned Data...17 Table AM RSI Sample Sizes...18 Table PM RSI Sample Sizes...18 Table 5.4 RSI Site 1 Interview Direction...21 Table 5.5 RSI 2 Interview Direction...21 Table 5.6 RSI 3 Interview Direction...21 Table 5.7 RSI 5 Interview Direction...22 Table 5.8 RSI 6 Interview Direction...22 Table 5.9 RSI 7 Interview Direction...22 Table Prior Highway Matrix Totals...24 Table 5.11 Final Highway Matrix Totals...26 Table 6.1 Volume-Delay Parameters...28 Table 6.2 Assignment Validation: Acceptability Guidelines...30 Table 7.1 Model Convergence (Duality Gap)...32 Table 7.2 Model Stability Indication (Percentage of links on which flows change by less than 5% between successive iterations)...33 Table 7.3 AM Peak Calibration Summary Results...33 Table 7.4 PM Peak Calibration Summary Results...34 Table AM Peak Validation Summary Results...35 Table 7.6 -PM Peak Validation Summary Results...36 Table 7.7 AM Peak All Count Sites Summary Results...38 Table 7.8 PM Peak All Count Sites Summary Results...38 Table 7.9 AM Peak Screenline and Cordon Summary Results...39 Table 7.10 PM Peak Screenline and Cordon Summary Results...40 Table 7.11 Journey Time Route 1 Timing Points...44 Table 7.12 Journey Time Route 2 Timing Points...44 Table 7.13 Journey Time Route 3 Timing Points...45 Table Journey Time Route 4 Timing Points...45 Table 7.15 AM Journey Time Summary Results...46 Table 7.16 PM Journey Time Summary Results...46
8
9 Executive Summary BACKGROUND WSP Development and Transportation was commissioned by Catesby Estates (Residential) Limited to provide transportation advice in respect of the proposed mixed use development in Newark-on-Trent known as Newark Future. The site is situated on the southern edge of the existing town, between the A46 to the west and the A1 to the east. The precise mix and size of development has yet to be determined, but is expected to consist of around 3,150 residential dwellings and 106,000 sqm of commercial development. As part of the development a Southern Link Road is proposed linking the A46 to the south west of Newark with the A1 to the south east of Newark. It was deemed appropriate to develop a strategic model using VISUM, an all encompassing transport modelling software package developed by PTV (Germany). VISUM is able to model the interaction of many modes in a holistic environment that negates the cumbersome interfaces that more traditional multi-modal models are burdened with. The model represents demand for Cars/LGVs and HGVs. The resultant validated Base model, described in the Local Model Validation Report (July 2008) has been updated to incorporate the VISUM blocking back function, which takes into account queuing or blocking back at junctions during route assignment. This means that where traffic is held in a queue at one junction, the assigned traffic flows at a downstream junction will be lower than if all traffic was able to reach it. This approach is intended to provide a more realistic representation of route assignment, since it is based on more detailed knowledge of the conditions in the network. This report describes the validation of this updated 2007 Base model. MODEL BASE AND TIME PERIODS Two time periods are represented; the AM peak from 0800 to 0900 and the PM peak from 1700 to These two hours represent the peak hours for highway traffic on an average weekday in a neutral month. PURPOSE OF THE MODEL The primary purpose of the model is to forecast the transport impacts of the proposed developments. Impacts that can be measured include: Highway traffic flow displacement Junction performance Changes to travel costs Impacts on queues MODEL LIMITATIONS Any transport model is a simplified representation of the real world and as such should be used as a decision guidance tool. The transport model s strengths lie in indicating the likely scale of changes bought about by the implementation of highway schemes, land use changes or policy driven measures and then using the outputs in a sensible and pragmatic fashion Newark Highway Model LMVR 1
10 DATA COLLECTION To create the model a comprehensive data collection exercise was undertaken that included: Roadside Interviews (to develop trip pattern matrices) Automatic and manual traffic counts Highway journey time surveys MODEL DEVELOPMENT The model network was generated from the NAVTEQ database, which provides highway classification and centre line geometry. Junctions were coded using signal layouts and timings, obtained from NCC complimented by site visits for all significant junctions within Newark. Range checking of the network coding was undertaken to ensure that the model route choices would behave in a realistic manner. MODEL CALIBRATION/VALIDATION The trip matrices for all modes were assigned to the network and comparisons of the outputs against observations were made regarding link flows and journey times. The model was developed to be as good a representation of the observations as possible before matrix estimation techniques were employed. Matrix estimation techniques adjust the demand matrices so that when assigned they better match the observed flows, these techniques were only employed to the non observed elements of the trip matrix. Approximately 85% of the count data was input into this calibration process with 15% held back for validation. Matrix sector and trip length distribution comparisons highlight the level of change in trips from the Prior to the Final matrices during the matrix estimation process. These comparisons demonstrate relatively similar profiles in trip length distribution. The matrix estimation process brought about a closer fitting model that meets Design Manual for Roads and Bridges (DMRB) standards with regards to calibration of link flows. Both the AM and PM peak models were validated against DMRB criteria for link flows, journey times and screenlines and cordons. The model was audited independently by NCC and the HA and was deemed fit for the purpose of assessing the forecast traffic impacts of the Newark Future development. SUMMARY WSP has built an AM and a PM highway VISUM model (2007 Base Year), capable of modelling cars and goods vehicles, which has been updated to incorporate the blocking back function within VISUM to allow more realistic representation of route assignment. The two models have been developed to DMRB standards and it has been agreed by all parties involved that the model is fit for purpose. 2 Newark Highway Model LMVR
11 1 Introduction 1.1 BACKGROUND Newark-on-Trent is a small town in Nottinghamshire located midway between Nottingham to the south-west and Lincoln to the north-east. Building on the quality of its historic core, the town has been greatly enhanced by regenerationled development in recent years. It has excellent strategic transport links given its location on the East Coast Main Rail line and A1/A46 road network Following a successful bid by Newark and Sherwood District Council, Newark was among 45 towns and cities nationwide selected as a New Growth Point by the government, meaning that additional housing and employment growth will be focused in the Newark area. With this designation the Government has recognised that Newark provides an excellent location for sustainable accelerated growth, which will provide further economic investment and deliver substantial affordable housing and new infrastructure for existing and new residents and businesses Catesby Estates (Residential) Limited appointed WSP to provide transportation advice in respect of the proposed mixed use development in Newark- Upon-Trent. The site is situated on the southern edge of the existing town, between the A46 to the west and the A1 to the east. At the time ofpreparing the base year model the precise mix and size of development was yet to be determined, but is expected to consist of around 3,150 residential dwellings and 106,000 sqm of commercial development. A Southern Link Road linking the A46 to the south west of Newark with the A1 to the south east of Newark is also proposed as part of the overall Newark Core Strategy As part of the transportation assessment of the proposed development, WSP was commissioned to provide a highway model to assess the impacts of the proposals on the transport network and to develop sustainable transport solutions The model specification was developed in accordance with current Department for Transport (DfT) guidelines detailed in the Design Manual for Roads & Bridges (DMRB). DMRB guidance is aimed at ensuring a consistent and reputable basis for forecasting and provides the framework for the development of highway models. The 2007 Base models have been validated to DMRB criteria, as described in the Local Model Validation Report (July 2008) WSP has since been instructed to update this 2007 Base model, incorporating the blocking back function within VISUM during the highway assignment. This allows for a more realistic representation of route choice, since the level of queuing and holding back of traffic at a junction is taken into account when calculating traffic flows and conditions at downstream junctions. This updated 2007 Base model has been revalidated to DMRB criteria, and is described in this updated Local Model Validation Report The model is of critical interest to three public sector bodies in addition to Catesby Estates (Residential) Limited, namely the Highways Agency (HA) as manager of key highways encompassing the development site, Nottinghamshire County Council (NCC), as local highways and transportation authority, and Newark and Sherwood District Council as the planning authority Newark Highway Model LMVR 3
12 1.2 MODEL REQUIREMENTS The purpose of the Newark Highway Model (NHM) is to assess the traffic impacts associated with the proposed development of the two sites in Newark-on- Trent and the Southern Link Road. This will encompass an assessment of: Highway traffic flow displacement Junction performance Changes to travel costs (e.g. journey times) Impacts on queues Identification of the demand for a Southern Link Road The appropriate design for the Southern Link Road including in particular identification of the necessary number of lanes Phasing of the Southern Link Road It is therefore necessary to obtain a particularly well validated model of Newark and the surrounding area Regular meetings between WSP, CPG, NCC and the HA were set up to agree modelling principles, methodologies, assumptions and scope. This provides a high degree of control and minimises grounds for disagreement at a later stage in the study process. All parties mentioned above have now agreed that the model is fit for purpose and forecasting can proceed. 1.3 REPORT PURPOSE The purpose of this report is to present the development and results of the Newark Highway Model Update, incorporating the VISUM blocking back function, and demonstrate that it was developed in a robust manner, meets DMRB criteria and is fit for purpose. 1.4 REPORT STRUCTURE The model development and calibration/validation performance are set out as follows: Section 2 Section 3 Section 4 Section 5 Section 6 Section 7 Section 8 Model Overview Model Extent and Network Survey and Count Data Highway Matrix Development Model Assignment, Calibration and Validation Procedures Model Calibration and Validation Results Conclusions 4 Newark Highway Model LMVR
13 2 Model Overview 2.1 INTRODUCTION The NHM was constructed to encompass a strategic model of the wider area to establish major routes into, out of and through Newark, and a more detailed model of the study area, capable of assessing the impacts of development proposals within Newark This section describes the model approach and the software applied in developing the NHM. 2.2 MODEL BASE YEAR AND TIME PERIODS The Base Year was taken to be 2007 as the model is primarily based on data collected in this year. Two time periods are represented; the AM peak from 0800 to 0900 and the PM peak from 1700 to These two hours represent the peak hours for highway traffic on an average weekday in a neutral month. 2.3 SOFTWARE WSP identified VISUM , developed by PTV, as the most appropriate strategic highway modelling package for development of the NHM. VISUM is a comprehensive and flexible software system which operates in a Windows and GIS environment making it a very user-friendly tool for assessing the impacts of new developments and infrastructure schemes. VISUM is capable of exporting whole models or parts thereof directly into VISSIM, a micro-simulation modelling tool also developed by PTV. It is also able to integrate any further modes required, in addition to car and goods vehicles, such as train or bus, into one holistic multi-modal model. 2.4 MODEL APPROACH A spatially accurate road network was constructed in VISUM using NAVTEQ data. NAVTEQ is a rich and detailed GIS based dataset used in major vehicle navigation systems, which includes exact link structures and attributes. Within the study area, satellite imagery and a site inventory complimented the NAVTEQ data to incorporate detailed and accurate junction, signal and link coding The model zone system was based upon the 2001 Census Output Areas to ensure compatibility with the 2001 Census data Base Year matrices were developed for each existing mode of travel (i.e. private vehicle and goods vehicle). These matrices were partially developed from observed trip behaviour determined through a combination of Roadside Interviews (RSIs), ATC and MCC surveys and data. The unobserved trips were infilled using 2001 Census Travel to Work (TTW) data. Matrix estimation techniques, which control the assigned flow to the observed flow, were employed to further improve the quality of the matrix in weak areas The final model was validated to DMRB Criteria and is described in the Local Model Validation Report (July 2008). The model update described in this report is based on these validated Base models and incorporates the VISUM blocking back function during assignment. This allows for a more realistic representation of route choice, since the level of queuing and holding back of traffic at a junction is taken into account when calculating traffic flows and conditions at downstream junctions. This model was revalidated to the same DMRB criteria Newark Highway Model LMVR 5
14 2.4.5 Figure 2.1 presents the Base Year Model development process in the form of a flow chart. The model is described in detail in the following sections. Figure 2.1 Base Year Model Development Flow Chart NAVTEQ Data Satellite Imagery Site Visits Census Output Areas RSIs Census Travel to Work Data NETWORK OD DEMAND ASSIGNMENT Turning Counts ATCs Turning Counts Journey Times ATCs MATRIX ESTIMATION VALIDATION CHECKS Controlling Criteria Yes Validated?? No Validated Model 6 Newark Highway Model LMVR

15 3 Model Extent and Network 3.1 MODEL EXTENT The extent of the detailed highway network is shown in Figure 3.1. This area was chosen to cover the proposed residential, employment and commercial centre development sites, Newark town centre and the strategic re-routing of trips associated with the introduction of a Southern Link Road. In addition to the detailed Newark network, a skeletal strategic network was included for the wider region and for the whole of England and Wales. This enabled the accurate routing of long distance trips into Newark. Figure 3.2 shows the modelled network surrounding area. Figure 3.1 NHM Network Coverage Study Area Reproduced from Ordnance Survey data by permission of the Controller of Her Majesty's Stationary Office Crown copyright (2008). All rights reserved. License No Newark Highway Model LMVR 7

16 Figure 3.2 NHM Network Coverage Wider Area Lincoln Newark Nottingham 3.2 HIGHWAY NETWORK The highway network was developed in a GIS environment from NAVTEQ and OS Meridian data, which included geographically correct lengths and position, road classification and the number of lanes. Following the development of the full network, an on-site inventory was carried out to check and clarify the number of lanes, link type, capacity and speed limit. The road network includes all A and B roads and other strategic local roads. Other unclassified local roads were also included to a high level of detail. 3.3 JUNCTIONS All modelled junctions within the Newark urban area and its immediate locality were simulated. The locations and types of simulated junctions are illustrated in Figure 3.3 where signalised junctions, roundabouts, and priority junctions are shown in blue, purple and red respectively. 8 Newark Highway Model LMVR


17 3.3.2 The junction coding for the network included junction type (priority, roundabout or signalised), the number of approach lanes, saturation flows, and signal configurations where relevant. Detailed junction information, including signal layouts and timings where appropriate, was obtained from NCC complimented by site visits for all significant junctions within Newark. Additional junction information was obtained from satellite imagery. This allowed those junctions likely to suffer the greatest impact from the development to be modelled in sufficient detail to enable the robust assessment of the highway network and formation of any mitigation measures. Figure 3.3 Simulated Junction Locations Key Give Way Roundabout Signalised Reproduced from Ordnance Survey data by permission of the Controller of Her Majesty's Stationary Office Crown copyright (2008). All rights reserved. License No Newark Highway Model LMVR 9
18 3.4 LEVEL CROSSINGS The level crossings located on the lines through Newark Castle and Newark North Gate were represented by fixed delays at intervals based on the number of scheduled passenger and freight trains. Typical vehicle stoppage times were gathered from site visits with the stoppage time incurred averaging 00:02:31 for a passenger train and 00:03:35 for a freight train. An average fixed delay was calculated for each peak hour by first multiplying the averaged observed stoppage times by the scheduled number of services for passenger and freight trains. These were then summed to represent the total delay in the peak hour, which was subsequently divided by the total number of peak hour services. The final modelled level crossing timings are shown in Table 3.1. Table 3.1 Level Crossing Timings Peak Hour Services Passenger Freight Total Modelled Delay Newark North Gate AM :03:03 every 15 minutes PM :02:41 every 10 minutes Newark Castle AM :03:14 every 20 minutes PM :02:56 every 12 minutes 3.5 ZONING SYSTEM The zone system was based on 2001 Census Output Areas (COA) and wards, ensuring compatibility with Census data. Within Newark, the COA were aggregated or disaggregated into different land uses where deemed appropriate. Beyond Newark, the COA were aggregated with the level of zoning detail centred on Newark, and the zones increasing in size with distance away from Newark In total there are 386 zones within the NHM, of which 123 were allocated to the Newark urban area. The zones were categorised into 22 regional sectors. Zone and sector plans of the Newark area and of the entire model are presented in Figure 3.4 to Figure Newark Highway Model LMVR
")
19 Figure 3.4 Zone and Sector Plan (Newark) Newark Highway Model LMVR 11
 12")
20 Figure 3.5 Zone and Sector Plan (Countywide) 12 Newark Highway Model LMVR
")
21 Figure 3.6 Zone and Sector Plan (England and Wales) Newark Highway Model LMVR 13
22 4 Survey and Count Data 4.1 AVAILABLE DATA Travel to Work data from the 2001 Census was extracted for the commuting movements pertaining to the Newark area. This data documents the origin and destination Census Output Area (COA) of a trip and by what mode of transport the trip was taken AM and PM peak hour flow data from the Highways Agency Traffic Flow Database System (TRADS) was obtained for all available sites in the Newark Area. The TRADS database holds hourly flow data collected by the HA on the strategic road network throughout England. The extracted data excludes days where road works or road traffic accidents may have affected the counts. A total of 16 one-way TRADS sites were employed for the NHM. The most recent neutral data available was averaged, with data from April to June 2007 used where obtainable, and between September and October 2006 otherwise Nottinghamshire County Council (NCC) provided WSP with information identifying existing data readily available for use in the development of the NHM. Following a review of the quality of the available data (age, time periods covered, location etc.), much of the data was deemed to be significantly dated or not useful. In total, four weeks of 2007 ATC data at only 3 two-way sites was requested AMScott provided WSP with 2004 turning count data collected at three locations in Newark on behalf of the Highways Agency. However, only the information collected at the A1 Slip (Northbound)/Lincoln Road junction was taken forward for use in the NHM development. The locations of the other two turning counts provided are key model junctions and were resurveyed due to the age of the data The locations of all the collated available data are shown in Figure DATA COLLECTION To provide a more comprehensive understanding of travel patterns in Newark-on-Trent, WSP commissioned the collection of new additional data. The following data was collected for use in developing the NHM: 2007 Roadside Interview (RSI) data at six one way locations over a 12 hour period 2007 Manual Classified Count (MCC) data over a 12 hour period at the six RSI site locations 2007 Automatic Traffic Count (ATC) data collected for two weeks at 13 two way locations and at the 6 RSI sites 2007 Turning Count Movements (TCM) at 19 locations The locations of the data collected by WSP are shown in Figure Newark Highway Model LMVR

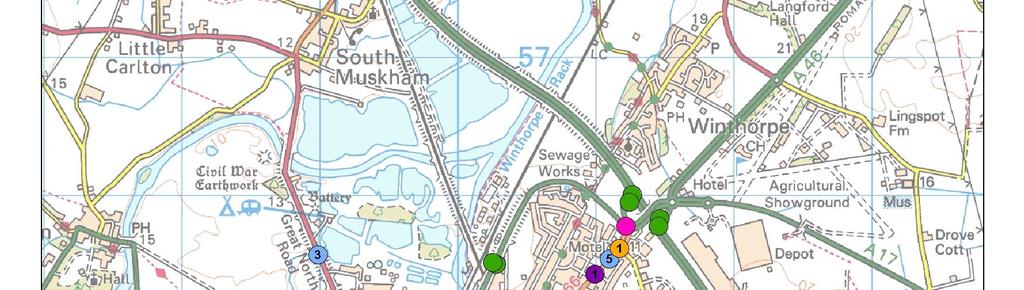

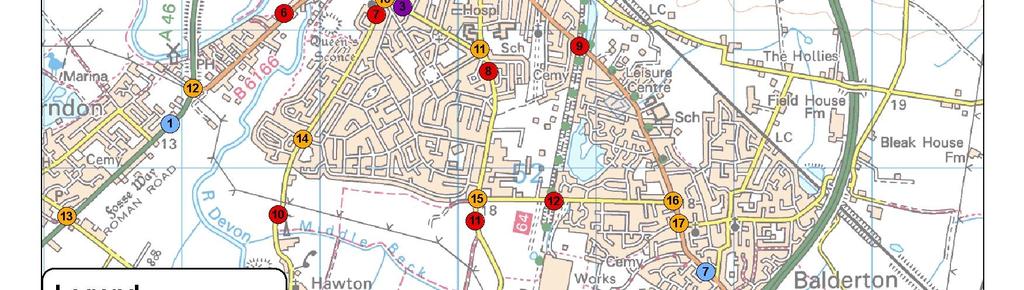

23 Figure 4.1 Newark-on-Trent Survey Sites Newark Highway Model LMVR 15
24 4.3 COUNT BALANCING Many of the count sites were located close together and were inconsistent with each other. To balance all the observed flows, the MCCs, Turning Count Movements and data collected prior to 2007 were manually adjusted proportionally to match the 2007 ATCs where possible. ATCs are considered to provide a more reliable estimate of average flows compared to manual counts taken in a single day. The pre and post balanced count data is tabulated in Appendix A. 16 Newark Highway Model LMVR
 matrix based fully on observed data and as such, called the Observed Matrix.")
25 5 Highway Matrix Development 5.1 INTRODUCTION The highway matrices were developed from a combination of Roadside Interview (RSI) data, and Travel to Work (TTW) data from the 2001 census. The RSI data was used to create an initial origin-destination (OD) matrix based fully on observed data and as such, called the Observed Matrix. TTW data providing OD movements for all commuting trips used to help infill trip patterns missed by the RSI surveys Highway matrices for Car/LGV and HGV vehicle classifications were developed independently. All Car/LGV and HGV volumes presented in this report are in Passenger Car Units (PCUs) rather than vehicles. 5.2 HIGHWAY SURVEY DATA Two sources of origin-destination data were available for the development of the highway matrices as follows: Six commissioned Roadside Interviews around Newark Travel to Work data from the 2001 census 5.3 MODEL ZONES Each highway interview record was assigned an origin and destination model zone number based upon the British national grid coordinates associated with the postcode details collected. 5.4 DATA CLEANING/LOGIC CHECKING Using a set of logical rules developed for each individual site, the interview and TTW data was cleaned of trips that were deemed to be illogical to produce sets of clean data covering a 12 hour period, summarised in Table 5.1 below Some data records for sites 2 and 3, collected by the survey contractor, were ambiguous and therefore removed. This accounts for the large percentage change from the total number of records to the cleaned number. However, the cleaned percentages remain within DMRB guidelines of sample to ATC flow ratios. Table 5.1 Cleaned Data Newark Highway Model LMVR 17

26 5.5 INTERVIEW SAMPLING The sample sizes of clean data collected are tabulated in Table 5.2 and Table 5.3 and displayed graphically in Figure 5.1. The peak period samples reported in Table 5.2 and 5.3 also include RSI records taken from the inter peak period. Table AM RSI Sample Sizes Table PM RSI Sample Sizes Figure RSI Sample Sizes 90% Percentage Sample rate 80% 70% 60% 50% 40% 30% 10% Error at 95% confidence limit Site 1 Site 2 Site 3 Site 5 Site 6 Site 7 20% 10% 0% Hour ATC 18 Newark Highway Model LMVR
27 5.6 OBSERVED MATRIX ROADSIDE INTERVIEW DATA The RSI data was used to construct the Observed Matrix based fully upon observed data. The surveyed movements represented the interview direction (ID), whereas the non-interview direction (NID) trips were derived from the transpose of the opposite time period; the origin and destinations of the AM peak ID records were reversed to represent the PM NID trips and vice versa. The process described below was applied on a site by site basis to the AM and PM peak periods in the interview and non-interview directions. INTERVIEW EXPANSION FACTORS The ten journey purposes (JPs) collected during the RSIs were aggregated into a total of five JPs as follows: Home Based Work (HBW) Home Based Other (HBO) Employer s Business (Emp Bus) Home Based Education (HEd) Non Home Based (NHB) The number of interviews obtained at an RSI site typically represents between 10-20% of the total flow. To develop an OD matrix representing the total observed traffic flow, the RSI data records must be factored up using expansion factors. The key to developing a well distributed matrix is to growth the RSI records by as small a factor as possible. To reduce the expansion factors, RSI survey data from the three hour peak periods were used to produce the peak hour distribution pattern. Table 5.4 to Table 5.9 present the RSI surveys completed across the day between 7:00-19:00 at the 7 RSI sites The peak hour MCC totals observed at each site were factored by the peak hour JP proportions obtained from the peak hour RSI records. This generated MCC based counts for the peak hours for each JP. The peak period records were then expanded to the peak hour total for each JP. The sample size was increased by using interviews from the three hour peak periods rather than only those from the peak hour. At the same time the peak hour journey purpose proportions were retained. LARGE EXPANSION FACTORS Where an expansion factor derived from the three hour peak period interviews was high, interview data from the inter peak RSI records (outside of the peak periods) was added to increase the sample size and reduce the expansion factor. Records were selected closest to the peak period in question. Table 5.4 to Table 5.9 records the amount of data added into each RSI site from outside the three hour peak period. The AM peak samples are shown in yellow and the PM peak samples are shown in Green Newark Highway Model LMVR 19
28 ATC FACTORS ATC data was collected over a two week period in May and June 2007 encompassing the day of the RSI at each site. ATCs are considered to provide a more reliable estimate of average flows compared to MCCs undertaken on the day of the RSI. Wednesday ATC data was not used as there is a market in the centre of Newark every Wednesday which may have an effect on traffic behaviour in the area. However, a comparison of ATC data on different days of the week showed no significant difference on a Wednesday. Friday PM ATC data was not substantially different from the rest of the ATC and so was included in calculations. The ATC flows for Mondays, Tuesdays, Thursdays and Fridays provided a total average vehicle flow. The MCCs were used to proportion the total average vehicle flow into average Car/LGV and HGV flows on a site by site basis. Each interview was then factored to account for the difference between the MCC and the average ATC flows. PCU FACTORS The RSI, MCC and ATC data was provided in vehicle totals. Cars and LGVs were assumed to have a PCU factor of 1.0 and HGVs were taken to have a PCU factor of 2. These factors were applied to data collected to convert the data from vehicles to PCUs. 20 Newark Highway Model LMVR
29 Table 5.4 RSI Site 1 Interview Direction 7:00-8:00-9:00-10:00-11:00-12:00-13:00-14:00-15:00-16:00-17:00-18:00-8:00 9:00 10:00 11:00 12:00 13:00 14:00 15:00 16:00 17:00 18:00 19:00 Total number of surveys IP samples used to increase AM sample size IP samples used to increase PM sample size Table 5.5 RSI 2 Interview Direction 7:00-8:00-9:00-10:00-11:00-12:00-13:00-14:00-15:00-16:00-17:00-18:00-8:00 9:00 10:00 11:00 12:00 13:00 14:00 15:00 16:00 17:00 18:00 19:00 Total number of surveys IP samples used to increase AM sample size IP samples used to increase PM sample size Table 5.6 RSI 3 Interview Direction 7:00-8:00-9:00-10:00-11:00-12:00-13:00-14:00-15:00-16:00-17:00-18:00-8:00 9:00 10:00 11:00 12:00 13:00 14:00 15:00 16:00 17:00 18:00 19:00 Total number of surveys IP samples used to increase AM sample size IP samples used to increase PM sample size Newark Highway Model LMVR 21
30 Table 5.7 RSI 5 Interview Direction 7:00-8:00-9:00-10:00-11:00-12:00-13:00-14:00-15:00-16:00-17:00-18:00-8:00 9:00 10:00 11:00 12:00 13:00 14:00 15:00 16:00 17:00 18:00 19:00 Total number of surveys IP samples used to increase AM sample size IP samples used to increase PM sample size Table 5.8 RSI 6 Interview Direction 7:00-8:00-9:00-10:00-11:00-12:00-13:00-14:00-15:00-16:00-17:00-18:00-8:00 9:00 10:00 11:00 12:00 13:00 14:00 15:00 16:00 17:00 18:00 19:00 Total number of surveys IP samples used to increase AM sample size IP samples used to increase PM * * sample size Table 5.9 RSI 7 Interview Direction 7:00-8:00-9:00-10:00-11:00-12:00-13:00-14:00-15:00-16:00-17:00-18:00-8:00 9:00 10:00 11:00 12:00 13:00 14:00 15:00 16:00 17:00 18:00 19:00 Total number of surveys IP samples used to increase AM sample size IP samples used to increase PM sample size 22 Newark Highway Model LMVR
31 5.6.8 The final expansion factors for each vehicle type and each journey purpose are tabulated in Appendix B. Typically expansion factors of less than 8 were sought. DOUBLE COUNTING FACTORS Through trips that pass through more than one RSI site are considered to be double counted. Movements considered to be through trips were those to and from zones external to the Newark sector, between areas covered by the RSIs Using a zone sectoring system, trips that potentially could pass through more than one RSI site were identified as double counted trips. The RSI records identified in this process had a factor of 0.5 applied to account for double counting. This is a manual process that is akin to the indicator matrix method sometimes employed to identify double counted movements. OBSERVED MATRIX The individual matrices for each JP in the ID and NID were combined to produce the Observed AM and PM Interview Matrices, containing all the trips considered to have passed through the RSI sites The observed matrix was developed from two sources; RSI & TTW. The RSI cordon is not complete or watertight with some holes and sections that are not captured in the surveys. Based on available count data, it is estimated 10-15% of all trips are not captured by the RSI sites. TTW data was used to in-fill these additional trips not captured by the RSI cordon. There is no other data available to in-fill non work based trips The Observed matrices were assigned to the network and subsequent sensitivity testing of traffic routings and comparisons between observed and modelled flows were undertaken. This ensured the best possible Observed Matrix, that produced the optimum fit to the observed flows, was progressed to the full matrix development. 5.7 TRAVEL TO WORK MATRIX 2001 TRAVEL TO WORK CENSUS DATA The TTW data collected as part of the 2001 census was used to infill the parts of the matrix not captured in the RSI exercise as the RSI cordon has some sections of road not captured in the surveys. These include A46 (to/from the east), Brunel Drive (north east), Beacon Hill Road (east) and areas/ villages south of Newark. Based upon count data available, this could account for approximately 10-15% of all trips passing through the cordon. A fair proportion of these trips are represented in the TTW survey data but identifying and separating these trips from those picked up in the RSI is difficult. Therefore the RSI HBW/WBH trips were amalgamated with TTW that cross the RSI cordon. This was achieved by factoring the TTW and and Home base work (HBW) elelments by 0.5 and then summing them together Newark Highway Model LMVR 23
32 Home to Work Trips The TTW data includes all trips to work taken at any time, and not just those taken during the AM Peak Hour. The RSI data was used to determine the proportion of daily TTW trips occurring during the AM peak hour. This proportion was used to reduce the TTW matrix down to an AM peak hour only matrix. A similar exercise was undertaken to determine the PM peak TTW trips (albeit a small proportion of total PM peak trips). Work to Home Trips The PM Peak Hour TTW matrix was calculated by transposing the trips from home to work (AM Peak Hour TTW matrix) to represent work to home trips. The proportion of work to home trips occurring in the PM peak was identified by using the RSI surveys, the same method used for calculating the AM peak TTW trips. 5.8 PRIOR MATRIX The Observed matrices were combined with the TTW matrices to produce the Prior Matrix. The total numbers of Cars/LGVs and HGVs in the Prior Matrix are displayed in Table The internal to internal TTW trips were factored up to represent unobserved internal to internal trips for all other journey purposes. The factors used were derived from the peak hour journey purpose proportions determined from the RSIs The Prior Matrix was assigned to the network and a series of sanity checks and adjustments to the model, such as signal changes where appropriate, were completed to produce the best possible match with the observed flows across the network with a view to meeting DMRB criteria With the unobserved element now included in the trip demand, the model results provided a good representation of flows across the network. However, the results did not fully meet DMRB criteria and highlighted areas of the matrix that were light on trips, for example between Newark and the rural area to its south and HGV movements within the urban area, and demonstrated that further matrix calibration was required. This was unsurprising given that information on trips made for reasons other than commuting purposes were not included in the TTW data. Table Prior Highway Matrix Totals Peak Hour Matrix Total (PCU) Car/LGV HGV AM PM MATRIX ESTIMATION Matrix estimation techniques were employed to further improve the quality of the matrix in weak areas. Matrix estimation aims to control the assigned flow to the observed flow, while maintaining the trip length distribution throughout the matrix. 24 Newark Highway Model LMVR
33 5.9.2 The matrix estimation procedure (know as TFlowFuzzy within VISUM) was run independently for Cars/LGVs and HGVs. The result of the matrix estimation exercise depended on the following inputs and controlling parameters: The model network The Prior Matrix Observed traffic count data Approximately 85% of available traffic count data was used as a target for matrix estimation, with the remaining count data reserved for validation purposes. A maximum of two iterations were performed to produce the final highway matrices All of the RSI observed matrix was frozen prior to matrix estimation and therefore matrix estimation techniques were only employed on the TTW census data in the matrix To assess the change in trip distribution brought about by the matrix estimation exercise, the following comparisons were made between the Prior and Final matrices: Change at matrix sector level Change in trip length distribution These comparisons provide some indication of the level of distortion caused by the matrix estimation process. The full results of the comparisons are detailed in Appendix C and are summarised below. MATRIX SECTOR COMPARISON The majority of sector to sector trips have increased significantly, particularly in the Newark Central sectors. This was expected as the Prior Matrix was very low in trips in some areas. TRIP LENGTH DISTRIBUTION COMPARISON TFlowFuzzy increased the total number of trips in the AM and PM matrices Overall, the Final Matrix for both the AM and PM models maintained the Prior Matrix trip length distributions well. Although the volume of trips in general has increased, the number of trips in each range as a percentage of the total number of trips was similar in the Prior and Final matrices, with the exception of the 2 5 km range. The increases were slightly biased towards 2 5 km trip lengths with the most gains experienced in this range. This reflected the missing movements in the Proxy Matrices non-commuter trips entirely within Newark itself, which were not picked up by the data collection at the RSI Sites on the boundary of the town and were not accounted for in the TTW census data FINAL HIGHWAY MATRIX SUMMARY The final highway matrices were developed using matrix estimation techniques with a maximum of two iterations performed. The trip distribution patterns of the Final Matrices were similar to those of the Prior Matrices. The total numbers of Cars/LGVs and HGVs in the model are detailed in Table 5.11 below Newark Highway Model LMVR 25
34 Table 5.11 Final Highway Matrix Totals Peak Hour Matrix Total (PCU) Car/LGV HGV AM PM Newark Highway Model LMVR
35 6 Model Assignment, Calibration and Validation Procedures MODEL ASSIGNMENT PROCEDURES 6.1 ASSIGNMENT The Equilibrium Lohse method was chosen as the most appropriate assignment method for the NHM and is described in Schnabel and Lohse, 1997 (W Schnabel, and D Lohse: Grundlagen der Straßenverkehrstechnik und der Verkehrsplanung, Band 2 ("Foundations of Traffic Engineering and Transportation Planning") Verlag für Bauwesen, Berlin, 1997). The Equilibrium Lohse method produces realistic, stable results This procedure models the learning process of road users using the network. The 1 st iteration step is an all or nothing assignment, which means that all trips are assigned onto the lowest impedance route of the unloaded network. In each subsequent iteration step, the new lowest impedance route for each OD pair is found. Drivers make use of information gained during their previous trips for the new route search and all known shortest routes are searched in an iterative process. For the route search the impedance is deduced from the impedance of the current volume and the estimated impedance from the previous iteration step During this model update, the blocking back function was switched on during assignment of the highway matrices. This is a relatively new feature which, at the time of development of the original models, had not been used much in the UK and so was not incorporated in the NHM. This update of the 2007 Base model validation now incorporates this function, which takes into account queuing or blocking back at junctions during route assignment. This means that where traffic is held in a queue at one junction, the assigned traffic flows at a downstream junction will be lower than if all traffic was able to reach it. This approach is intended to provide a more realistic representation of route assignment, since it is based on more detailed knowledge of the conditions in the network. 6.2 VOLUME-DELAY FUNCTIONS Volume-delay relationships were applied on all links outside of the study area, where junctions were not modelled in detail. Within the study area, volumedelay relationships were also applied on the A1 and A46 as here link capacities are not constrained by the capacities at the junctions. The volume-delay function used was as follows: t new t 0 (1 a sat b ) where sat q q c max t new = the volume dependent time; t 0 = the free flow time; q = the vehicle flow; q max = the link capacity; and Newark Highway Model LMVR 27
36 a, b and c are user defined parameters The parameters a, b and c were selected to best replicate the COBA speed-flow relationships described in DMRB Volume 12. The chosen parameters for each link type are detailed in Table 6.1. The capacity for all links was set per lane according to road type. Table 6.1 Volume-Delay Parameters Link Type Parameters a b c Motorway D4 and D Motorway D Primary and A Road D2 Rural A Road D2 Sub-Urban (Avg A-40mph) A Road Single B Road S2 Sub-Urban (Good B-40mph) Minor Urban Road B Road Rural Minor Road Rural Village For the strategic network where junctions were not modelled in detail, speed flow curves based on COBA were used to model the relationship between traffic volumes and vehicle travel times. CALIBRATION AND VALIDATION PROCEDURES 6.3 CALIBRATION PROCEDURES The calibration procedure involved the following activities: Adjustment and checking of the network to ensure plausible and realistic routing of traffic in the model through monitoring RSI matrix assignments; and Comparison of observed against modelled flows, where those flows were used explicitly in the creation of the demand matrix (including those used for developing the RSIs and those used in matrix estimation) across screenlines, cordons and at other locations. 6.4 VALIDATION PROCEDURES The validation procedure involved the following activities: Network validation, in terms of range checking and routing; Checking assignment model convergence; Comparison of modelled flows against independent observed flows (i.e. those not used in the matrix building process) across screenlines and cordons; Checks to ensure that speed/flow calculations on network links and delay calculations at junctions were operating as expected; and Comparison of observed and modelled journey time routes. 28 Newark Highway Model LMVR
37 6.5 RANGE CHECKING Range checking of the network parameters was undertaken and any counterintuitive data was verified against relevant source data. The parameters checked included: Link length and speeds Signal timings Saturation flows Number of lanes Junction type 6.6 ROUTE CHOICE A check on the validity of route choice within the model was undertaken by visual inspection of modelled routes through the study area. 6.7 ROUTE JOURNEY TIME VALIDATION A series of journey time surveys were undertaken through the study area to gain an understanding of link speeds. In all, four routes were surveyed at least six times in each direction during the AM and PM peak periods, with the exception of Route 4 which was only surveyed for the AM peak. To ensure that the model replicated the observed journey times, the model journey times were compared with the observations. DMRB suggests that the modelled journey times need to be within ±15% of the average observed times for 85% of the routes. 6.8 GEH STATISTIC The GEH statistic was adopted as the main indicator of goodness of fit, i.e. the extent to which modelled flows match corresponding observed values. The GEH statistic is a form of the chi-squared statistic described in DMRB Volume 12, Traffic Appraisal of Urban Areas Schemes (Section ). It is defined as: GEH = 2 ( M C) ( M C) 2 Where M = modelled flow, and C = observed flow (or count) A GEH value can be calculated for individual links or screenlines. A GEH value of less than 5 indicates a satisfactory fit between observed and modelled flows, while links with a GEH statistic greater than 10 probably require closer attention. It is generally accepted that a GEH value of less than 5 should be obtained on at least 85% of all links. For screenlines or other combinations of links a GEH value of less than 4 is sought. A further flow comparison measurement was also made as explained below in Table Newark Highway Model LMVR 29
38 Table 6.2 Assignment Validation: Acceptability Guidelines Criteria and Measures Acceptability Guideline Assigned Hourly Flow* Compared with Observed Flows: 1. Individual flows within 15% for flows vph 2. Individual flows within 100 vph for > 85% of cases flows < 700 vph 3. Individual flows within 400 vph for flows > 2700 vph 4. Total Screenline flows (normally > 5 links) to be within 5% 5. GEH Statistic: Individual flows: GEH < 5 > 85% of cases Screenline** totals: GEH < 4 All (or nearly all) screenlines * links or turning movements ** Screenlines containing high flow routes such as Motorways should be presented both including and excluding such routes (Source: Table taken from DMRB Vol 12, Table 4.2) 6.9 SCREENLINE AND CORDON FLOWS Screenline and cordon flow comparisons check that the modelled trips between particular geographical sectors correspond to those observed and provides a powerful demonstration of the overall performance of the model. Observed and modelled flows across the following screenlines and cordon were compared: Validation Screenlines: East-West Screenline North-South Screenline Calibration Cordons: Outer Cordon Inner Cordon RSI Cordon Count data for the sites located on the East-West and North-South Screenlines was held back from the calibration process to be used for validation comparisons. The locations of the screenlines and cordons are shown in Figure JUNCTIONS The Highway Capacity Manual (HCM) published by the US Transportation Research Board contains internationally recognised guidelines on calculating the level of service and other performance indicators for intersections, based on a wide range of control regimes ranging from non-signalised to roundabouts and traffic lights The modelled junctions were assessed using performance indicators calculated in VISUM according to the regulations set out in the HCM 2000 edition. 30 Newark Highway Model LMVR

39 Figure 6.1 Screenlines and Cordons Reproduced from Ordnance Survey data by permission of the Controller of Her Majesty's Stationary Office Crown copyright (2008). All rights reserved. License No Key East-West Screenline North-South Screenline Outer Cordon Inner Cordon RSI Cordon Screenline/Cordon Count Sites Newark Highway Model LMVR 31
40 7 Model Calibration and Validation Results 7.1 INTRODUCTION The NHM was validated in accordance with the procedures set out in DMRB. A number of key calibration and validation checks were made between the modelled flows and observed traffic data: Comparison between modelled and observed traffic flows at the calibration count sites; and Comparison of modelled and observed journey times In addition, checks were made to ensure that the assignment model achieved a satisfactory level of convergence. 7.2 ROUTE CHECKING The routing choices made in the NHM were verified by systematically plotting a series of test trees between specified zone pairs. This procedure identified, for a given journey, the preferred route through the network under peak hour conditions. Each tree was assessed carefully to ensure that the chosen path was sensible. Any counterintuitive results were investigated further. The exercise revealed no untoward routings and all routings of a slightly dubious nature were discounted as the consequence of congestion elsewhere in the network. 7.3 CONVERGENCE The NHM achieved a very good measure of convergence within 29 iterations in the AM peak, and within 33 iterations in the PM peak. The duality gap expresses the convergence quality as the volume-weighted difference between the total impedance calculated along the chosen routes and the hypothetical vehicle impedance if all vehicles used the minimum impedance routes, as a proportion of the minimum vehicle impedance. The duality gap is comparable to the delta described in the DMRB which asserts that iterations should continue until delta < 1%. The duality gap of the AM and PM Peak models were a fraction of a percent as shown in Table 7.1 below. Table 7.1 Model Convergence (Duality Gap) AM Peak PM peak Car HGV Car HGV Duality Gap 0.15% 0.08% 0.07% -0.04% The percentage of links on which flows change by less than 5% between successive iterations is often known as P. It is recommended in the DMRB that, in addition to satisfying the true convergence measures for the duality gap described above, assignment model iterations should continue until at least four successive values of P in excess of 90% have been obtained. This was achieved by the NHM for all cases and provides an indication of the stability of the NHM. The value of P for the last 4 iterations of the model assignment are shown in Table Newark Highway Model LMVR
41 Table 7.2 Model Stability Indication (Percentage of links on which flows change by less than 5% between successive iterations) AM Peak PM peak Iteration Car HGV Iteration Car HGV % 99.5% % 99.8% % 99.1% % 99.8% % 99.9% % 99.8% % 99.9% % 99.8% 7.4 CALIBRATION TRAFFIC COUNTS It is an important measure of model performance that the model reproduces the observed volumes of traffic that were used to calibrate the model. The DMRB criteria for comparing the performance of the model traffic counts are reproduced in Section 6. Modelled flows are expected to be within a certain tolerance of the observed values and this goodness of fit is measured using the GEH statistic. Both the flow comparison and GEH criteria are assessed in this report. The condition is expected to be satisfied for 85% of cases. The locations of the highway calibration sites are illustrated in Figure 7.6. Table 7.3 and Table 7.4 summarise the calibration results for the AM and PM peak models respectively. Table 7.3 AM Peak Calibration Summary Results Flow Criteria (PCU/hr) < to 2700 >2700 Total GEH < 5 Car / LGV Total % 92% 91% 0% 92% 92% HGV Total % 100% 0% 0% 100% 88% All Vehicles Total % 87% 90% 0% 88% 87% Newark Highway Model LMVR 33
42 Table 7.4 PM Peak Calibration Summary Results Flow Criteria (PCU/hr) < to 2700 >2700 Total GEH < 5 Car / LGV Total % 92% 89% 0% 92% 91% HGV Total % 100% 0% 0% 100% 92% All Vehicles Total % 93% 83% 0% 90% 91% The results from the calibration comparison exceed the DMRB criteria in both the AM and PM peaks. Appendix D contains full details of the calibration results on a link by link basis Something to note is that the A46 (west of the proposed Southern Link Road) is under-represented in the model. Care must be taken during forecasting to ensure that the model fully represents the volume of traffic likely to use this link. 7.5 VALIDATION TRAFFIC COUNTS Table 7.5 and Table 7.6 below summarise the validation results for the AM and PM peaks respectively. The locations of the validation count sites, which were held back from the calibration process, are illustrated in Figure Newark Highway Model LMVR
43 Table AM Peak Validation Summary Results Flow Criteria (PCU/hr) < to 2700 >2700 Total GEH < 5 Car / LGV Total % 74% 50% 0% 72% 64% HGV Total % 100% 0% 0% 100% 88% All Vehicles Total % 77% 67% 0% 76% 72% The AM validation results narrowly miss the DMRB standard of flow and GEH with six of the 25 validation counts sites falling outside. As most of these sites are minor roads it is considered this is a technical departure from the DMRB standard only, and does not show any systemic weakness in the validation. Appendix D presents all the GEH and flow statistics. The six locations are: A1 (exit for B6326) (NB) Bowbridge Lane (between Hawton Lane and Quarry Farm) (NB) Main Street (west of A46 Fosse Road / Main Street junction) (EB) Staple Lane (between Jericho Road and Hundred Acres Lane) (WB) Lincoln Road Bridge (between Northern Road and Trent Lane) (SB) Farndon Road (between Mill Gate and Dorner Avenue) (WB) Newark Highway Model LMVR 35
44 7.5.3 PM peak validation results are shown below. Table 7.6 -PM Peak Validation Summary Results Flow Criteria (PCU/hr) < to 2700 >2700 Total GEH < 5 Car / LGV Total % 86% 60% 0% 81% 67% HGV Total % 100% 0% 0% 100% 96% All Vehicles Total % 86% 60% 0% 81% 70% In the PM peak model only three of the 27 count sites do not meet either the GEH or flow DMRB validation criteria. These sites are located at: Beacon Hill Road (between Northern Road and Sleaford Road) (EB) Lincoln Road (between Stanhope Avenue and Gainsborough Drive) (NB) London Road (between Bancroft Road and The Orchard) (SB) Appendix D contains full details of the validation results on a link by link basis. Figure 7.1 highlights specific links in the AM and PM peak associated with the count locations that fall outside the DMRB criteria. 36 Newark Highway Model LMVR

45 Figure 7.1 Links with GEH>10 (in either AM or PM peak) TC4 TC13 ATC11 Reproduced from Ordnance Survey data by permission of the Controller of Her Majesty's Stationary Office Crown copyright (2008). All rights reserved. License No ATC ALL TRAFFIC COUNTS The results of the comparison between observed and modelled flows for all count sites are summarised in Table 7.7 and Table 7.8 and exceed the DMRB criteria in the AM Peak Newark Highway Model LMVR 37
46 Table 7.7 AM Peak All Count Sites Summary Results Flow Criteria (PCU/hr) < to 2700 >2700 Total GEH < 5 Car / LGV Total % 89% 89% 0% 89% 88% HGV Total % 100% 0% 0% 100% 88% All Vehicles Total % 85% 89% 0% 86% 85% Table 7.8 PM Peak All Count Sites Summary Results Flow Criteria (PCU/hr) < to 2700 >2700 Total GEH < 5 Car / LGV Total % 91% 86% 0% 90% 87% HGV Total % 100% 0% 0% 100% 93% All Vehicles Total % 92% 81% 0% 89% 87% 38 Newark Highway Model LMVR
47 7.7 HIGHWAY SCREENLINE AND CORDON FLOWS As described in the previous chapter, the following screenlines and cordon were assessed: Validation Screenlines: East-West Screenline North-South Screenline Calibration Cordons: Outer Cordon Inner Cordon RSI Cordon Their locations are illustrated in Figure 6.1 and the flows across the screenlines and cordons are summarised in Table 7.9 and Table Screenline / Cordon Table 7.9 AM Peak Screenline and Cordon Summary Results Direction Count (PCU/hr) Model (PCU/hr) Diff % GEH East/West Screenline Eastbound % 2.9 East/West Screenline Westbound % 2.6 North/South Screenline Northbound % 3.3 North/South Screenline Southbound % 2.1 Outer Cordon Inbound % 4.8 Outer Cordon Outbound % 8.1 Inner Cordon Inbound % 3.2 Inner Cordon Outbound % 1.6 RSI Cordon Inbound % 0 RSI Cordon Outbound % In the AM peak model 8 out of 10 screenlines and cordons have a GEH of less than 4. The discrepancy in this case, at the Outer Cordon Outbound sites, is a result of two prominent flow differences at the following locations: Staple Lane (between Jericho Road and Hundred Acres Lane) Bowbridge Lane (between Hawton Lane and Quarry Farm) Newark Highway Model LMVR 39
48 Screenline / Cordon Table 7.10 PM Peak Screenline and Cordon Summary Results Direction Count (PCU/hr) Model (PCU/hr) Diff % GEH East/West Screenline Eastbound % 4.7 East/West Screenline Westbound % 4.0 North/South Screenline Northbound % 1.0 North/South Screenline Southbound % 5.0 Outer Cordon Inbound % 7.0 Outer Cordon Outbound % 4.0 Inner Cordon Inbound % 2.3 Inner Cordon Outbound % 4.6 RSI Cordon Inbound % 3.0 RSI Cordon Outbound % The PM model has 6 out of 10 screenlines and cordons with a GEH of less than 4. The two main discrepancies are again a result of significant flow differences at particular locations: Outer Cordon Inbound Bowbridge Lane (between Hawton Lane and Quarry Farm) East/West Screenline Eastbound Barnby Road (between John Gold Avenue and Bridge Cottages) Inner Cordon Outbound Barnby Road (between John Gold Avenue and Bridge Cottages) Both the AM and PM peak models satisfy the DMRB criterion that requires the majority of screenlines and cordons to have a GEH value of less than 4. Appendix D contains full details of the screenline results on a link by link basis. 7.8 HIGHWAY ROUTE JOURNEY TIME COMPARISONS Journey times provide a good indication of the ability of a model to represent impedance and route choice accurately, both in the Base Year and Forecast Year. Journey time surveys provide an independent check of the validity of the model and the ability of the chosen software to replicate junction delays accurately. A total of four journey time surveys covering the main highway corridors in Newark were carried out as follows: Route 1: A46 Fosse Road/B6166 Farndon Road junction to/from B6326 London Road/Staple Lane junction via the A46/A1 Route 2: A46 Fosse Road/B6166 Farndon Road junction to/from A46/B6166 Lincoln Road junction via the B6166 Route 3: A46/A616/A617/B6326 junction to/from B6326 London Road/Sherwood Avenue/Bowbridge Road junction via the B6326/B6166 Route 4: A1/B6326 London Road junction to/from B6326 London Road/Sherwood Avenue/Bowbridge Road Junction 40 Newark Highway Model LMVR

49 7.8.2 The journey time routes are illustrated in Figure 7.2 to Figure 7.5 and the associated timing points are tabulated in Table 7.11 to Table Detailed results of the journey time analysis are presented in Appendix E. Figure 7.2 Journey Time Route 1 Reproduced from Ordnance Survey data by permission of the Controller of Her Majesty's Stationary Office Crown copyright (2008). All rights reserved. License No Newark Highway Model LMVR 41


50 Figure 7.3 Journey Time Route 2 Reproduced from Ordnance Survey data by permission of the Controller of Her Majesty's Stationary Office Crown copyright (2008). All rights reserved. License No Figure 7.4 Journey Time Route 3 Reproduced from Ordnance Survey data by permission of the Controller of Her Majesty's Stationary Office Crown copyright (2008). All rights reserved. License No Newark Highway Model LMVR

51 Figure 7.5 Journey Time Route 4 Reproduced from Ordnance Survey data by permission of the Controller of Her Majesty's Stationary Office Crown copyright (2008). All rights reserved. License No Newark Highway Model LMVR 43
52 Timing Point Clockwise Table 7.11 Journey Time Route 1 Timing Points Description 1 A46 Fosse Rd at junction with B6166 Farndon Rd 2 A46 at junction with A616/A617/B A46 Robert Dukeson Ave at junction with B6166 Lincoln Rd 4 A46 at junction with A1 southbound 5 A1 southbound at junction with Beacon Hill Rd 6 A1 southbound on slip at exit for B A1 southbound slip at junction with B6326 Anticlockwise 7 A1 southbound slip at junction with B B6326 at junction with A1 northbound slip 9 A1 northbound at entrance from B A1 northbound at junction with Beacon Hill Rd 11 A1 northbound on slip at exit for A46 12 A46 Robert Dukeson Ave at junction with B6166 Lincoln Rd 13 A46 at junction with A616/A617/B A46 Fosse Rd at junction with B6166 Farndon Rd Timing Point Northbound Table 7.12 Journey Time Route 2 Timing Points Description 1 B6166 Farndon Rd at junction with A46 Fosse Rd 2 B6166 Farndon Rd at junction with Mill Gate 3 B6166 Portland St at junction with B6326 London Rd 4 B6166 Lombard St at junction with Mill Gate 5 B6166 Castle Gate at junction with B6326 Great North Rd 6 B6166 North Gate at junction with Queen s Rd 7 B6166 North Gate at junction with Lincoln Rd Bridge 8 B6166 Lincoln Rd Bridge at junction with Northern Rd 9 B6166 Lincoln Rd at junction with Brunel Dr 10 B6166 Lincoln Rd at junction with A46 Southbound 10 B6166 Lincoln Rd at junction with A46 11 B6166 Lincoln Rd at junction with Brunel Dr 12 B6166 Lincoln Rd Bridge at junction with Northern Rd 13 B6166 North Gate at junction with Lincoln Rd Bridge 14 B6166 North Gate at junction with Queen s Rd 15 B6166 Castle Gate at junction with B6326 Great North Rd 16 B6166 Lombard St at junction with Mill Gate 17 B6166 Portland St at junction with B6326 London Rd 18 B6166 Farndon Rd at junction with Mill Gate 19 B6166 Farndon Rd at junction with A46 Fosse Rd 44 Newark Highway Model LMVR
53 Table 7.13 Journey Time Route 3 Timing Points Timing Point Description Southbound 1 A616 / B6326 / A617 Junction 2 Beast Market Hill / Bar Gate / Castle Gate Junction 3 B6166 Lombard Street / Castle Gate Junction 4 B6166 Lombard Street / Portland St / London Road Junction 5 London Rd / Sherwood Ave / Bowbridge Rd Junction Northbound 6 London Rd / Sherwood Ave / Bowbridge Rd Junction 7 B6166 Lombard Street / Portland St / London Road Junction 8 B6166 Lombard Street / Castle Gate Junction 9 Beast Market Hill / Bar Gate / Castle Gate Junction 10 A616 / B6326 / A617 Junction Timing Point Table Journey Time Route 4 Timing Points Description 1 London Rd / A1 Slips Roundabout (leaving) 2 London Rd / Main St Junction (leaving) 3 London Rd / Hawton Ln Junction (leaving) 4 London Rd / Shakespeare St Junction (passing) 5 London Rd / Sherwood Ave / Bowbridge Rd Junction (leaving) 6 Balderton Gate / London Rd Junction (leaving) 7 London Rd / Shakespeare St Junction (passing) 8 London Rd / Hawton Ln Junction (leaving) 9 London Rd / Main St Junction (leaving) 10 London Rd / A1 Slips Roundabout (entering) The journey time surveys were commissioned for this study and at least six observations in each direction during each time period were taken, with the exception of Route 4 which was only observed for the AM peak Following DMRB guidance, the total modelled journey time should be within ±15% of the observed average time for at least 85% of the journey time routes. The summary results for each time period are presented below in Table 7.15 and Table 7.16 for the AM and PM peaks respectively Newark Highway Model LMVR 45
54 Route Table 7.15 AM Journey Time Summary Results Total Journey Time Mean Observed ±15% Modelled Mean Observed Low High % Difference Within ±15%? Route 1 CW 09:18 09:07 07:45 10:30 2% ACW 09:38 09:37 08:10 11:03 0% Route 2 NB 08:51 09:25 08:01 10:50-6% SB 09:18 09:04 07:42 10:26 3% Route 3 NB 04:42 05:25 04:37 06:14-13% SB 06:00 05:55 05:02 06:48 1% Route 4-10:42 10:13 08:41 11:44 5% Route Table 7.16 PM Journey Time Summary Results Total Journey Time Mean Observed ±15% Modelled Mean Observed Low High % Difference Within ±15%? Route 1 CW 09:20 09:10 07:48 10:33 2% ACW 09:50 09:30 08:04 10:55 4% Route 2 NB 09:25 09:20 07:56 10:44 1% SB 09:50 09:09 07:47 10:32 7% Route 3 NB 05:28 05:42 04:51 06:33-4% SB 05:32 05:58 05:04 06:52-7% All overall modelled journey times in both the AM and PM peaks are within ±15% of the observed average exceeding DMRB criteria. Inspection of the graphs contained Appendix E, illustrating the modelled and observed journey time comparisons, shows that the modelled journey times match those observed throughout the routes very well. 46 Newark Highway Model LMVR

. All rights reserved.")
55 Figure 7.6 Calibration Count Sites Reproduced from Ordnance Survey data by permission of the Controller of Her Majesty's Stationary Office Crown copyright (2008). All rights reserved. License No Newark Highway Model LMVR 47

56 Figure Validation Count Sites Reproduced from Ordnance Survey data by permission of the Controller of Her Majesty's Stationary Office Crown copyright (2008). All rights reserved. License No Newark Highway Model LMVR
57 8 Conclusions 8.1 MODEL DEVELOPMENT A highway model has been developed using VISUM as a foundation for forecasting the effects and impacts of the proposed development in and around Newark. The use of PTV-VISUM transport modelling software, with its GIS capabilities, enables the accurate representation of the road network/junction and efficient data handling. The modelled modes included in the highway model are Car/LGV and HGV. The models have been developed in accordance with DMRB standards, representing the AM and PM peak hours in a typical neutral month in The update of the 2007 Base model validation, described in this report, incorporates the VISUM blocking back function during highway assignment. This allows for a more realistic representation of route choice, since the level of queuing and holding back of traffic at a junction is taken into account when calculating traffic flows and therefore conditions at downstream junctions Data collected for the highway model development includes comprehensive RSI surveys to cover trip distribution patterns for all modes, 2001 census data for journey to work trip distribution patterns for all modes, automatic and manual traffic counts including full junction turning counts and journey time surveys. 8.2 MODEL VALIDATION / CALIBRATION The robustness of the highway model as a forecasting tool was measured by comparing link flows and journey times against observations. The comparisons were benchmarked against DMRB calibration and validation standards. The final highway model validates very well against DMRB link flow criteria and modelled journey times exceed DMRB criteria in both the AM and PM peaks. 8.3 FIT FOR PURPOSE The model performance exceeds DMRB criteria in many instances and is deemed to be fit for assessing the impacts of the proposed mixed use development Newark Highway Model LMVR 49
58


59 Appendices, Figures & Tables
Bedford Town Centre Transport Modelling. Local Model Validation Report (LMVR) Final Draft
 Final Draft") Bedford Town Centre Transport Modelling Local Model Validation Report (LMVR) Final Draft Bedford Town Centre Transport Modelling Local Model Validation Report (LMVR) JMP Consultants Limited Abacus House
Bedford Town Centre Transport Modelling Local Model Validation Report (LMVR) Final Draft Bedford Town Centre Transport Modelling Local Model Validation Report (LMVR) JMP Consultants Limited Abacus House
HALTON REGION SUB-MODEL
 WORKING DRAFT GTA P.M. PEAK MODEL Version 2.0 And HALTON REGION SUB-MODEL Documentation & Users' Guide Prepared by Peter Dalton July 2001 Contents 1.0 P.M. Peak Period Model for the GTA... 4 Table 1 -
Wellington Transport Strategy Model. TN19.1 Time Period Factors Report Final
 Wellington Transport Strategy Model TN19.1 Time Period Factors Report Final Wellington Transport Strategy Model Time Period Factors Report Final July 2003 prepared for Greater Wellington The Regional Council
Development of the Idaho Statewide Travel Demand Model Trip Matrices Using Cell Phone OD Data and Origin Destination Matrix Estimation
 Portland State University PDXScholar TREC Friday Seminar Series Transportation Research and Education Center (TREC) 10-24-2016 Development of the Idaho Statewide Travel Demand Model Trip Matrices Using
CSTM Improvements. AITPM Canberra 11 May 2017
 CSTM Improvements AITPM Canberra 11 May 2017 7 December 2016 1 Introduction Josh Everett SMEC Australia Worked on modelling in Canberra for 11 years Used TransCAD, then EMME, now back to TransCAD Presentation
WATFORD LOCAL PLAN PART 2. Review of Car Parking Policy and Standards. Evidence Base. February 2012
 WATFORD LOCAL PLAN PART 2 Review of Car Parking Policy and Standards Evidence Base February 2012 1.0 Background 1.1 The Watford District Plan 2000 contains various policies relating to the provision of
Interstate Operations Study: Fargo-Moorhead Metropolitan Area Simulation Output
 NDSU Dept #2880 PO Box 6050 Fargo, ND 58108-6050 Tel 701-231-8058 Fax 701-231-6265 www.ugpti.org www.atacenter.org Interstate Operations Study: Fargo-Moorhead Metropolitan Area 2015 Simulation Output Technical
Alpine Highway to North County Boulevard Connector Study
 Alpine Highway to North County Boulevard Connector Study prepared by Avenue Consultants March 16, 2017 North County Boulevard Connector Study March 16, 2017 Table of Contents 1 Summary of Findings... 1
TRAVEL DEMAND FORECASTS
 Jiangxi Ji an Sustainable Urban Transport Project (RRP PRC 45022) TRAVEL DEMAND FORECASTS A. Introduction 1. The purpose of the travel demand forecasts is to assess the impact of the project components
WLTP DHC subgroup. Draft methodology to develop WLTP drive cycle
 WLTP DHC subgroup Date 30/10/09 Title Working paper number Draft methodology to develop WLTP drive cycle WLTP-DHC-02-05 1.0. Introduction This paper sets out the methodology that will be used to generate
Submission to Greater Cambridge City Deal
 What Transport for Cambridge? 2 1 Submission to Greater Cambridge City Deal By Professor Marcial Echenique OBE ScD RIBA RTPI and Jonathan Barker Introduction Cambridge Futures was founded in 1997 as a
Post Opening Project Evaluation. M6 Toll
 M6 Toll Five Post Years Opening After Study: Project Summary Evaluation Report Post Opening Project Evaluation M6 Toll Five Years After Study Summary Report October 2009 Document History JOB NUMBER: 5081587/905
CITY OF EDMONTON COMMERCIAL VEHICLE MODEL UPDATE USING A ROADSIDE TRUCK SURVEY
 CITY OF EDMONTON COMMERCIAL VEHICLE MODEL UPDATE USING A ROADSIDE TRUCK SURVEY Matthew J. Roorda, University of Toronto Nico Malfara, University of Toronto Introduction The movement of goods and services
M6 TOLL TRAFFIC MONITORING STUDY
 ` M6 TOLL TRAFFIC MONITORING STUDY Traffic Impact Study Report POST OPENING PROJECT EVALUATION M6 TOLL TRAFFIC IMPACT STUDY REPORT JOB NUMBER: 4416515.1525.600 DOCUMENT REF: M6 Toll Traffic Impact Study
HIGHWAYS AGENCY PINCH POINT SCHEMES A1(M) JUNCTION 6 & JUNCTION 7. Local Model Validation Report
 JUNCTION 6 & JUNCTION 7. Local Model Validation Report") HIGHWAYS AGENCY PINCH POINT SCHEMES A1(M) JUNCTION 6 & JUNCTION 7 Local Validation Report 24/1/212 Quality Management Issue/revision Issue 1 Revision 1 Revision 2 Revision 3 Remarks Date 24/1/12 Prepared
HIGHWAYS AGENCY PINCH POINT SCHEMES A1(M) JUNCTION 6 & JUNCTION 7 Local Validation Report 24/1/212 Quality Management Issue/revision Issue 1 Revision 1 Revision 2 Revision 3 Remarks Date 24/1/12 Prepared
EXECUTIVE SUMMARY. The following is an outline of the traffic analysis performed by Hales Engineering for the traffic conditions of this project.
 EXECUTIVE SUMMARY This study addresses the traffic impacts associated with the proposed Shopko redevelopment located in Sugarhouse, Utah. The Shopko redevelopment project is located between 1300 East and
Improvements to ramp metering system in England: VISSIM modelling of improvements
 Improvements to ramp metering system in Jill Hayden Managing Consultant Intelligent Transport Systems Roger Higginson Senior Systems Engineer Intelligent Transport Systems Abstract The Highways Agency
Downtown Lee s Summit Parking Study
 Downtown Lee s Summit Parking Study As part of the Downtown Lee s Summit Master Plan, a downtown parking and traffic study was completed by TranSystems Corporation in November 2003. The parking analysis
Mobile Area Transportation Study Urban Area and Planning Boundary
 Mobile Origin- Destination Study Mobile Origin- Destination Study Trip Distribution Calibration WHY? Some background on Mobile Long Range Transportation Plan Crash course in travel demand forecasting HOW?
Travel Demand Modeling at NCTCOG
 Travel Demand Modeling at NCTCOG Arash Mirzaei North Central Texas Council Of Governments for Southern Methodist University The ASCE Student Chapter October 24, 2005 Contents NCTCOG DFW Regional Model
Table of Contents INTRODUCTION... 3 PROJECT STUDY AREA Figure 1 Vicinity Map Study Area... 4 EXISTING CONDITIONS... 5 TRAFFIC OPERATIONS...
 Crosshaven Drive Corridor Study City of Vestavia Hills, Alabama Table of Contents INTRODUCTION... 3 PROJECT STUDY AREA... 3 Figure 1 Vicinity Map Study Area... 4 EXISTING CONDITIONS... 5 TRAFFIC OPERATIONS...
APPENDIX B. Speed Flow Curves
 APPENDIX B Speed Flow Curves 5048375 / LD / 0902 B -1 5048375 / LD / 0902 B -2 B.Speed Flow Curves INTRODUCTION B.1 This appendix describes the implementation of speed flow curves within a SATURN model.
Interstate Operations Study: Fargo-Moorhead Metropolitan Area Simulation Results
 NDSU Dept #2880 PO Box 6050 Fargo, ND 58108-6050 Tel 701-231-8058 Fax 701-231-6265 www.ugpti.org www.atacenter.org Interstate Operations Study: Fargo-Moorhead Metropolitan Area 2025 Simulation Results
Missouri Seat Belt Usage Survey for 2017
 Missouri Seat Belt Usage Survey for 2017 Conducted for the Highway Safety & Traffic Division of the Missouri Department of Transportation by The Missouri Safety Center University of Central Missouri Final
To: File From: Adrian Soo, P. Eng. Markham, ON File: Date: August 18, 2015
 Memo To: From: Adrian Soo, P. Eng. Markham, ON : 165620021 Date: Reference: E.C. Row Expressway, Dominion Boulevard Interchange, Dougall Avenue Interchange, and Howard 1. Review of Interchange Geometry
Project Advisory Committee
 Meredith US 3/NH 25 Improvements Transportation Planning Study Project Advisory Committee March 18, 2008 Meredith US 3/NH 25 Improvements Transportation Planning Study Meeting Agenda Welcome Traffic Model
Travel Forecasting Methodology
 Travel Forecasting Methodology Introduction This technical memorandum documents the travel demand forecasting methodology used for the SH7 BRT Study. This memorandum includes discussion of the following:
Department for Transport. Transport Analysis Guidance (TAG) Unit Values of Time and Operating Costs
 Unit Values of Time and Operating Costs") Department for Transport Transport Analysis Guidance (TAG) Unit 3.5.6 Values of Time and Operating Costs September 2006 1 Contents 1. Values of Time and Operating Costs 3 1.1 Introduction 3 1.2 Values
Department for Transport Transport Analysis Guidance (TAG) Unit 3.5.6 Values of Time and Operating Costs September 2006 1 Contents 1. Values of Time and Operating Costs 3 1.1 Introduction 3 1.2 Values
PS 127 Abnormal / Indivisible Loads Policy
 PS 127 Abnormal / Indivisible Loads Policy June 2017 Version 1.5 Statement of legislative compliance This document has been drafted to comply with the general and specific duties in the Equality Act 2010;
TRAFFIC IMPACT STUDY VICDOM BROCK ROAD PIT EXPANSION
 TRAFFIC IMPACT STUDY VICDOM BROCK ROAD PIT EXPANSION TOWNSHIP OF UXBRIDGE P/N 05-1993 June 2011 Revised -August 2011 Prepared by: Skelton, Brumwell & Associates Inc. 93 Bell Farm Road, Suite 107 Barrie,
GIBRALTAR ERDF OPERATIONAL PROGRAMME POST ADOPTION STATEMENT
 Intended for Government of Gibraltar Document type Report Date January 2015 GIBRALTAR ERDF OPERATIONAL PROGRAMME 2014-2020 POST ADOPTION STATEMENT GIBRALTAR ERDF OPERATIONAL PROGRAMME 2014-2020 POST ADOPTION
8. Network Calibration and Validation
 8. Network Calibration and Validation 8.1. Network Calibration The SBL highway network was developed from the earlier GBATS SBL 2009 v2 HAM model and updated to a 2012 base year, as described in Section
Traffic Micro-Simulation Assisted Tunnel Ventilation System Design
 Traffic Micro-Simulation Assisted Tunnel Ventilation System Design Blake Xu 1 1 Parsons Brinckerhoff Australia, Sydney 1 Introduction Road tunnels have recently been built in Sydney. One of key issues
Technical Memorandum Analysis Procedures and Mobility Performance Measures 100 Most Congested Texas Road Sections What s New for 2015
 Technical Memorandum Analysis Procedures and Mobility Performance Measures 100 Most Congested Texas Road Sections Prepared by Texas A&M Transportation Institute August 2015 This memo documents the analysis
Parks and Transportation System Development Charge Methodology
 City of Sandy Parks and Transportation System Development Charge Methodology March, 2016 Background In order to implement a City Council goal the City of Sandy engaged FCS Group in January of 2015 to update
Transportation Statistical Data Development Report BAY COUNTY 2035 LONG RANGE TRANSPORTATION PLAN
 Transportation Statistical Data Development Report BAY COUNTY 2035 LONG RANGE TRANSPORTATION PLAN Prepared for Bay County Transportation Planning Organization and The Florida Department of Transportation,
Subarea Study. Manning Avenue (CSAH 15) Corridor Management and Safety Improvement Project. Final Version 1. Washington County.
 Corridor Management and Safety Improvement Project. Final Version 1. Washington County.") Subarea Study Manning Avenue (CSAH 15) Corridor Management and Safety Improvement Project Final Version 1 Washington County June 12, 214 SRF No. 138141 Table of Contents Introduction... 1 Forecast Methodology
Subarea Study Manning Avenue (CSAH 15) Corridor Management and Safety Improvement Project Final Version 1 Washington County June 12, 214 SRF No. 138141 Table of Contents Introduction... 1 Forecast Methodology
Clean Harbors Canada, Inc.
 Clean Harbors Canada, Inc. Proposed Lambton Landfill Expansion Environmental Assessment Terms of Reference Transportation Assessment St. Clair Township, Ontario September 2009 itrans Consulting Inc. 260
Craig Scheffler, P.E., PTOE HNTB North Carolina, P.C. HNTB Project File: Subject
 TECHNICAL MEMORANDUM To Kumar Neppalli Traffic Engineering Manager Town of Chapel Hill From Craig Scheffler, P.E., PTOE HNTB North Carolina, P.C. Cc HNTB Project File: 38435 Subject Obey Creek TIS 2022
Traffic Monitoring Report 2016
 Summary SUMMARY Cambridge 1. In, there were 206,750 motor vehicles entering and leaving Cambridge per 12-hour day (7am to 7pm). This represents an increase of 0.2% compared with 2015. Prior to 2014 the
Project : A Prepared by: Jack Wellings / Andrew Hughes. Client: Wembdon Parish Council Approved by: Philip Weatherhead
 Technical Note 01 Project: Wembdon Neighbourhood Plan Office: Wellington Project : A108388 Prepared by: Jack Wellings / Andrew Hughes Client: Wembdon Parish Council Approved by: Philip Weatherhead Date:
Designation of a Community Safety Zone in Honey Harbour in the Township of Georgian Bay
 TO: FROM: Chair and Members Engineering and Public Works Committee Mark Misko, C.E.T. Manager, Roads Maintenance and Construction DATE: March 23, 2016 SUBJECT: REPORT NO: Designation of a Community Safety
Modernising the Great Western railway
 Report by the Comptroller and Auditor General Department for Transport and Network Rail Modernising the Great Western railway HC 781 SESSION 2016-17 9 NOVEMBER 2016 4 Key facts Modernising the Great Western
TRAFFIC SURVEY REPORT HARVINGTON PT1 (CREST HILL)
") TRAFFIC SURVEY REPORT HARVINGTON PT1 ( HILL) October 20-24th 2014 Conducted voluntarily by the residents of Harvington Village. This report has been prepared in light of the planning application W14/01788/OU
TRAFFIC SURVEY REPORT HARVINGTON PT1 ( HILL) October 20-24th 2014 Conducted voluntarily by the residents of Harvington Village. This report has been prepared in light of the planning application W14/01788/OU
APPENDIX C1 TRAFFIC ANALYSIS DESIGN YEAR TRAFFIC ANALYSIS
 APPENDIX C1 TRAFFIC ANALYSIS DESIGN YEAR TRAFFIC ANALYSIS DESIGN YEAR TRAFFIC ANALYSIS February 2018 Highway & Bridge Project PIN 6754.12 Route 13 Connector Road Chemung County February 2018 Appendix
Traffic Monitoring Report 2017
 Summary SUMMARY Cambridge 1. In, there were 203,329 motor vehicles entering and leaving Cambridge per 12-hour day (7am to 7pm). This is a decrease of 2% compared with 2016. 2. The number of motor vehicles
Transit City Etobicoke - Finch West LRT
 Delcan Corporation Transit City Etobicoke - Finch West LRT APPENDIX D Microsimulation Traffic Modeling Report March 2010 March 2010 Appendix D CONTENTS 1.0 STUDY CONTEXT... 2 Figure 1 Study Limits... 2
UTA Transportation Equity Study and Staff Analysis. Board Workshop January 6, 2018
 UTA Transportation Equity Study and Staff Analysis Board Workshop January 6, 2018 1 Executive Summary UTA ranks DART 6 th out of top 20 Transit Agencies in the country for ridership. UTA Study confirms
6. Strategic Screenlines
 6. Strategic Screenlines Introduction 6.1 Previous sections in this report have presented changes in traffic flows at individual count locations. Some of these count locations have also been grouped into
Travel Time Savings Memorandum
 04-05-2018 TABLE OF CONTENTS 1 Background 3 Methodology 3 Inputs and Calculation 3 Assumptions 4 Light Rail Transit (LRT) Travel Times 5 Auto Travel Times 5 Bus Travel Times 6 Findings 7 Generalized Cost
GTA A.M. PEAK MODEL. Documentation & Users' Guide. Version 4.0. Prepared by. Peter Dalton
 GTA A.M. PEAK MODEL Version 4.0 Documentation & Users' Guide Prepared by Peter Dalton August 19, 2003 Contents 1.0 Introduction... 1 1.1 Summary Description... 2 Figure 1 - Flow Diagram... 2 Table 1 -
TRAFFIC IMPACT ASSESSMENT PART OF AN ENVIRONMENTAL IMPACT ASSESSMENT FOR THE KEBRAFIELD ROODEPOORT COLLIERY IN THE PULLEN S HOPE AREA
 TRAFFIC IMPACT ASSESSMENT PART OF AN ENVIRONMENTAL IMPACT ASSESSMENT FOR THE KEBRAFIELD ROODEPOORT COLLIERY IN THE PULLEN S HOPE AREA 20 March 2014 Report prepared by: Corli Havenga Transportation Engineers
Traffic Impact Statement (TIS)
") Traffic Impact Statement (TIS) Vincentian PUDA Collier County, FL 10/18/2013 Prepared for: Global Properties of Naples Prepared by: Trebilcock Consulting Solutions, PA 2614 Tamiami Trail N, Suite 615 1205
Traffic Impact Statement (TIS) Vincentian PUDA Collier County, FL 10/18/2013 Prepared for: Global Properties of Naples Prepared by: Trebilcock Consulting Solutions, PA 2614 Tamiami Trail N, Suite 615 1205
Pembina Emerson Border Crossing Interim Measures Microsimulation
 Pembina Emerson Border Crossing Interim Measures Microsimulation Final Report December 2013 Prepared for: North Dakota Department of Transportation Prepared by: Advanced Traffic Analysis Center Upper Great
Tongaat Hullette Developments - Cornubia Phase 2. Technical Note 02 - N2/M41 AIMSUN Micro-simulation Analysis
 Technical Note 02 - N2/M41 AIMSUN Micro-simulation Tongaat Hullette Developments Cornubia Phase 2 Technical Note 02 - N2/M41 AIMSUN Micro-simulation Analysis Prepared by: 18/11/14 Justin Janki Date Approvals
Research Brief. Simulation and verification of results from 125mph current collection modelling for two pantographs. T841 - January 2011.
 Research Brief Simulation and verification of results from 125mph current collection modelling for two pantographs Overview On behalf of the Vehicle / Train Energy System Interface Committee (V/TE SIC),
Traffic Counts
 www.trafficcounts.co.nz www.trafficcounts.co.nz Quality Assurance Information Prepared for: Job Number: Prepared by: Reviewed by: Abley Limited 0000 Shane Ingley, Transportation Engineer Courtney Groundwater,
Sustainable Urban Transport Index (SUTI)
") Sustainable Urban Transport Index (SUTI) City Comparisons & Way Forward PROF. H.M SHIVANAND SWAMY, CEPT UNIVERSITY DHAKA SEPTEMBER 12, 2018 Purpose Discussion of Results from 5 Cities Reflections on the
Sustainable Urban Transport Index (SUTI) City Comparisons & Way Forward PROF. H.M SHIVANAND SWAMY, CEPT UNIVERSITY DHAKA SEPTEMBER 12, 2018 Purpose Discussion of Results from 5 Cities Reflections on the
Re: Addendum No. 4 Transportation Overview 146 Mountshannon Drive Ottawa, Ontario
 April 18 th, 2017 Mr. Kevin Yemm Vice President, Land Development Richraft Group of Companies 2280 St. Laurent Boulevard, Suite 201 Ottawa, Ontario (Tel: 613.739.7111 / e-mail: keviny@richcraft.com) Re:
Table 1 - Land Use Comparisons - Proposed King s Wharf Development. Retail (SF) Office (SF) 354 6,000 10, Land Uses 1
 Office (SF) 354 6,000 10, Land Uses 1") Ref. No. 171-6694 Phase 2 November 23, 217 Mr. David Quilichini, Vice President Fares & Co. Developments Inc. 31 Place Keelson Sales Centre DARTMOUTH NS B2Y C1 Sent Via Email to David@faresinc.com RE:
Ref. No. 171-6694 Phase 2 November 23, 217 Mr. David Quilichini, Vice President Fares & Co. Developments Inc. 31 Place Keelson Sales Centre DARTMOUTH NS B2Y C1 Sent Via Email to David@faresinc.com RE:
Driver Speed Compliance in Western Australia. Tony Radalj and Brian Kidd Main Roads Western Australia
 Driver Speed Compliance in Western Australia Abstract Tony Radalj and Brian Kidd Main Roads Western Australia A state-wide speed survey was conducted over the period March to June 2 to measure driver speed
Appendix F Model Development Report
 Appendix F Model Development Report This page intentionally left blank. Westside Mobility Plan Model Development Report December 2015 WESTSIDE MOBILITY PLAN MODEL DEVELOPMENT REPORT December 2015 Originally
The Value of Travel-Time: Estimates of the Hourly Value of Time for Vehicles in Oregon 2007
 The Value of Travel-Time: Estimates of the Hourly Value of Time for Vehicles in Oregon 2007 Oregon Department of Transportation Long Range Planning Unit June 2008 For questions contact: Denise Whitney
Residential Development Bearna Engineering Services Report
 Residential Development Bearna Engineering Services Report APPENDIX D Job No: B861G TRAFFIC REPORT TRAFFIC IMPACT ASSESSMENT RESIDENTIAL DEVELOPMENT, BEARNA, CO. GALWAY Burkeway Homes Project No. B861
Superfast Cornwall Baseline Summary Report
 Superfast Cornwall Cornwall Development Company Superfast Cornwall Baseline Summary Report April 2017 pfa-research.com Use of Data Market Research supporting PR activities All of the work carried out by
AGENDA ITEM 1: IMPROVED BPM FORECASTING WITH OUT OF REGION ANALYSIS (ORA)
") April 12, 2013 NYBPM 2010 - Approach to External & Truck Model Update 1 AGENDA ITEM 1: IMPROVED BPM FORECASTING WITH OUT OF REGION ANALYSIS (ORA) Core BPM and External Models April 12, 2013 NYBPM 2010
April 12, 2013 NYBPM 2010 - Approach to External & Truck Model Update 1 AGENDA ITEM 1: IMPROVED BPM FORECASTING WITH OUT OF REGION ANALYSIS (ORA) Core BPM and External Models April 12, 2013 NYBPM 2010
TRAFFIC IMPACT ANALYSIS
 TRAFFIC IMPACT ANALYSIS Emerald Isle Commercial Development Prepared by SEPI Engineering & Construction Prepared for Ark Consulting Group, PLLC March 2016 I. Executive Summary A. Site Location The Emerald
Appendix B: Travel Demand Forecasts July 2017
 Appendix B: Travel Demand Forecasts July 2017 Table of Contents 1 Introduction... 2 2 Model Review and Updates... 2 2.1 Overview of Smart Moves Model ( City of London Model )... 2 2.1.1 Network and Zone
ONE YEAR ON: THE IMPACTS OF THE LONDON CONGESTION CHARGING SCHEME ON VEHICLE EMISSIONS
 ONE YEAR ON: THE IMPACTS OF THE LONDON CONGESTION CHARGING SCHEME ON VEHICLE EMISSIONS Sean D Beevers and David C Carslaw Environmental Research Group, King s College London, 4 th Floor, Franklin Wilkins
A9 Data Monitoring and Analysis Report. January Content. 1. Executive Summary. 2. Overview. 3. Purpose. 4. Baseline Data Sources
 A9 Data Monitoring and Analysis Report January 2018 Content 1. Executive Summary 2. Overview 3. Purpose 4. Baseline Data Sources 5. Casualty Analysis 6. Vehicle Speed Data 7. Incident Frequency & Impact
Aging of the light vehicle fleet May 2011
 Aging of the light vehicle fleet May 211 1 The Scope At an average age of 12.7 years in 21, New Zealand has one of the oldest light vehicle fleets in the developed world. This report looks at some of the
STH 60 Northern Reliever Route Feasibility Study Report
 #233087 v3 STH 60 Northern Reliever Route Feasibility Study Report Washington County Public Works Committee Meeting September 28, 2016 1 STH 60 Northern Reliever Route Feasibility Study Hartford Area Development
A9 Data Monitoring and Analysis Report. March Content. 1. Executive Summary and Key Findings. 2. Overview. 3. Purpose
 A9 Data Monitoring and Analysis Report March 2018 Content 1. Executive Summary and Key Findings 2. Overview 3. Purpose 4. Baseline Data Sources and Methodology 5. Casualty Analysis 6. Vehicle Speed Data
MERIVALE PRIORITY SQUARE 2852 MERIVALE ROAD CITY OF OTTAWA TRANSPORTATION BRIEF. Prepared for: ONT Inc. 25 Winding Way Nepean, Ontario K2C 3H1
 MERIVALE PRIORITY SQUARE 2852 MERIVALE ROAD CITY OF OTTAWA TRANSPORTATION BRIEF Prepared for: 2190986ONT Inc. 25 Winding Way Nepean, Ontario K2C 3H1 October 6, 2010 110-502 Report_1.doc D. J. Halpenny
Craigieburn Employment Precinct North and English Street
 Craigieburn Employment Precinct North and English Street METROPOLITAN PLANNING AUTHORITY Intersection Analyses 7 February 2014 Intersection Analyses Craigieburn Employment Precinct North and English Street
Deriving Background Concentrations of NOx and NO 2 April 2016 Update
 Deriving Background Concentrations of NOx and NO 2 April 2016 Update April 2016 Prepared by: Dr Ben Marner Approved by: Prof. Duncan Laxen 1 Calibration of DEFRA Background Maps 1.1 Background concentrations
INCREASING electrical network interconnection is
 Analysis and Quantification of the Benefits of Interconnected Distribution System Operation Steven M. Blair, Campbell D. Booth, Paul Turner, and Victoria Turnham Abstract In the UK, the Capacity to Customers
Application of EMME3 and Transportation Tomorrow Survey (TTS) for Estimation of Zonal Time Varying Population Density Distribution in
 for Estimation of Zonal Time Varying Population Density Distribution in") Application of EMME3 and Transportation Tomorrow Survey (TTS) for Estimation of Zonal Time Varying Population Density Distribution in the Greater Toronto Area Prepared by: Matthew Roorda, Associate Professor
Application of EMME3 and Transportation Tomorrow Survey (TTS) for Estimation of Zonal Time Varying Population Density Distribution in the Greater Toronto Area Prepared by: Matthew Roorda, Associate Professor
MEMO VIA . Ms. Amy Roth DPS Director, City of Three Rivers. To:
 MEMO To: Ms. Amy Roth DPS Director, City of Three Rivers VIA EMAIL From: Michael J. Labadie, PE Julie M. Kroll, PE, PTOE Brandon Hayes, PE, P.Eng. Fleis & VandenBrink Date: January 5, 2017 Re: Proposed
TRAFFIC ENGINEERING ASSESSMENT MOUNT EDEN ROAD, MOUNT EDEN
 12 September 2017 Iain McManus Civitas Planning Consultants PO Box 47020 Ponsonby AUCKLAND 1144 Dear Iain, TRAFFIC ENGINEERING ASSESSMENT 43-45 45 MOUNT EDEN ROAD, MOUNT EDEN As requested, we have prepared
Findings from the Limassol SUMP study
 5 th European Conference on Sustainable Urban Mobility Plans 14-15 May 2018 Nicosia, Cyprus Findings from the Limassol SUMP study Apostolos Bizakis Deputy PM General Information The largest city in the
Cornubia Retail and Business Park Development
 Development July 2013 Tongaat Hulett Development (Pty) Ltd Tel. No.: 031 560 1900 Contact Person: Karen Petersen 21 West Riding Row, Sherwood Tel: 031 240 7300 Andrew McKune Andrew.McKune@smec.com SMEC
Appendix 3. DRAFT Policy on Vehicle Activated Signs
 Appendix 3 DRAFT Policy on Vehicle Activated Signs Ealing Council has been installing vehicle activated signs for around three years and there are now 45 across the borough. These signs help to reduce
CITY OF LONDON STRATEGIC MULTI-YEAR BUDGET ADDITIONAL INVESTMENTS BUSINESS CASE # 6
 2016 2019 CITY OF LONDON STRATEGIC MULTI-YEAR BUDGET ADDITIONAL INVESTMENTS BUSINESS CASE # 6 STRATEGIC AREA OF FOCUS: SUB-PRIORITY: STRATEGY: INITIATIVE: INITIATIVE LEAD(S): BUILDING A SUSTAINABLE CITY
WP3 Transport and Mobility Analysis. D.3.5. Transport Scenarios Results Report Nottingham
 WP3 Transport and Mobility Analysis D.3.5. Transport Scenarios Results Report Nottingham October 2015 314164 (ENER/FP7/314164) Project acronym: InSMART Project full title: Integrative Smart City Planning
Transport Model for Scotland TMfS14 Upgrade. Malcolm Neil (SYSTRA Limited), and Peter Davidson, Rob Culley (Peter Davidson Consultancy Limited)
, and Peter Davidson, Rob Culley (Peter Davidson Consultancy Limited)") Transport Model for Scotland TMfS14 Upgrade Malcolm Neil (SYSTRA Limited), and Peter Davidson, Rob Culley (Peter Davidson Consultancy Limited) 1 Introduction This paper follows on from the presentation
Transport Model for Scotland TMfS14 Upgrade Malcolm Neil (SYSTRA Limited), and Peter Davidson, Rob Culley (Peter Davidson Consultancy Limited) 1 Introduction This paper follows on from the presentation
TECHNICAL MEMORANDUM. Part A: Introduction
 TECHNICAL MEMORANDUM To: David J. Decker Decker Properties, Inc. 5950 Seminole Centre Ct. Suite 200 Madison, Wisconsin 53711 608-663-1218 Fax: 608-663-1226 www.klengineering.com From: Mike Scarmon, P.E.,
Addressing ambiguity in how electricity industry legislation applies to secondary networks
 In Confidence Office of the Minister of Energy and Resources Chair, Cabinet Business Committee Addressing ambiguity in how electricity industry legislation applies to secondary networks Proposal 1 This
Chapter 4. HS2 Route Capacity and Reliability. Prepared by Christopher Stokes
 Chapter 4 HS2 Route Capacity and Reliability Prepared by Christopher Stokes 4 HS2 ROUTE CAPACITY AND RELIABILITY Prepared by Christopher Stokes 4.1 This chapter relates to the following questions listed
Applicability for Green ITS of Heavy Vehicles by using automatic route selection system
 Applicability for Green ITS of Heavy Vehicles by using automatic route selection system Hideyuki WAKISHIMA *1 1. CTI Enginnering Co,. Ltd. 3-21-1 Nihonbashi-Hamacho, Chuoku, Tokyo, JAPAN TEL : +81-3-3668-4698,
DRP DER Growth Scenarios Workshop. DER Forecasts for Distribution Planning- Electric Vehicles. May 3, 2017
 DRP DER Growth Scenarios Workshop DER Forecasts for Distribution Planning- Electric Vehicles May 3, 2017 Presentation Outline Each IOU: 1. System Level (Service Area) Forecast 2. Disaggregation Approach
Appendix J Traffic Impact Study
 MRI May 2012 Appendix J Traffic Impact Study Level 2 Traffic Assessment Limited Impact Review Appendix J [This page was left blank intentionally.] www.sgm-inc.com Figure 1. Site Driveway and Trail Crossing
2030 Multimodal Transportation Study
 2030 Multimodal Transportation Study City of Jacksonville Planning and Development Department Prepared by Ghyabi & Associates April 29,2010 Introduction Presentation Components 1. Study Basis 2. Study
Mobility Fee Applications from Research Design
 PLANNING AND DEVELOPMENT D E P A R T M E N T Mobility Fee Applications from 2014-2016 Research Design The focus of this study is Mobility Fee applications submitted during the years between 2014 and 2016,
The Impact of Speed Enforcement and Increasing the HGV Speed Limit on the A9(T)
") The Impact of Speed Enforcement and Increasing the HGV Speed Limit on the A9(T) Transport Scotland Microsimulation Modelling and Accident Assessment May 2012 THE IMPACT OF SPEED ENFORCEMENT AND INCREASING
The Impact of Speed Enforcement and Increasing the HGV Speed Limit on the A9(T) Transport Scotland Microsimulation Modelling and Accident Assessment May 2012 THE IMPACT OF SPEED ENFORCEMENT AND INCREASING
BS EN :2011 BS :2002+A1:2013 UKSRG Guidelines-4:2011 EN124:1994 HA104\09
 PendulumTest(s) carried out in accordance with: BS EN 13036-4:2011 BS 7976-2:2002+A1:2013 UKSRG Guidelines-4:2011 EN124:1994 HA104\09 On behalf of: Fibrelite Limited. Prepared by: Phil Nolan GET-A-GRIP!
SUMMARY OF THE IMPACT ASSESSMENT
 COMMISSION OF THE EUROPEAN COMMUNITIES Brussels, 13.11.2008 SEC(2008) 2861 COMMISSION STAFF WORKING DOCUMT Accompanying document to the Proposal for a DIRECTIVE OF THE EUROPEAN PARLIAMT AND OF THE COUNCIL
Proposed location of Camp Parkway Commerce Center. Vicinity map of Camp Parkway Commerce Center Southampton County, VA
 Proposed location of Camp Parkway Commerce Center Vicinity map of Camp Parkway Commerce Center Southampton County, VA Camp Parkway Commerce Center is a proposed distribution and industrial center to be
TORONTO TRANSIT COMMISSION REPORT NO.
 Form Revised: February 2005 TORONTO TRANSIT COMMISSION REPORT NO. MEETING DATE: October 24, 2012 SUBJECT: DOWNTOWN RAPID TRANSIT EXPANSION STUDY (DRTES) PHASE 1 STRATEGIC PLAN ACTION ITEM RECOMMENDATIONS
2012 Air Emissions Inventory
 SECTION 6 HEAVY-DUTY VEHICLES This section presents emissions estimates for the heavy-duty vehicles (HDV) source category, including source description (6.1), geographical delineation (6.2), data and information