Travel Demand Modeling at NCTCOG
|
|
|
- Hubert Davis
- 6 years ago
- Views:
Transcription
1 Travel Demand Modeling at NCTCOG Arash Mirzaei North Central Texas Council Of Governments for Southern Methodist University The ASCE Student Chapter October 24, 2005
2 Contents NCTCOG DFW Regional Model Structure Application Examples
3 What is NCTCOG? The North Central Texas Council of Governments (NCTCOG) is a voluntary association of local governments, and was established to assist local governments in planning for common needs, cooperating for mutual benefit, and coordinating for sound regional development.
4 NCTCOG Departments 1. Executive Director s Office 2. Agency Administration 3. Community Services 4. Emergency Preparedness 5. Environment And Development 6. Public Affairs 7. Research And Information Resources 8. Transportation (Also Serves As The MPO) 9. Workforce Development
5 What is a MPO? Federal highway and transit statutes require, as a condition for spending federal highway or transit funds in urbanized areas, the designation of Metropolitan Planning Organizations (MPOs), which have responsibility for planning, programming and coordination of federal highway and transit investments ISTEA's requirement that a portion of Surface Transportation Program funds be made available for expenditure in metropolitan areas with populations over 200,000, along with project selection through the metropolitan planning process is one mechanism that has brought shared responsibility for highway and transit investment decisions in metropolitan regions
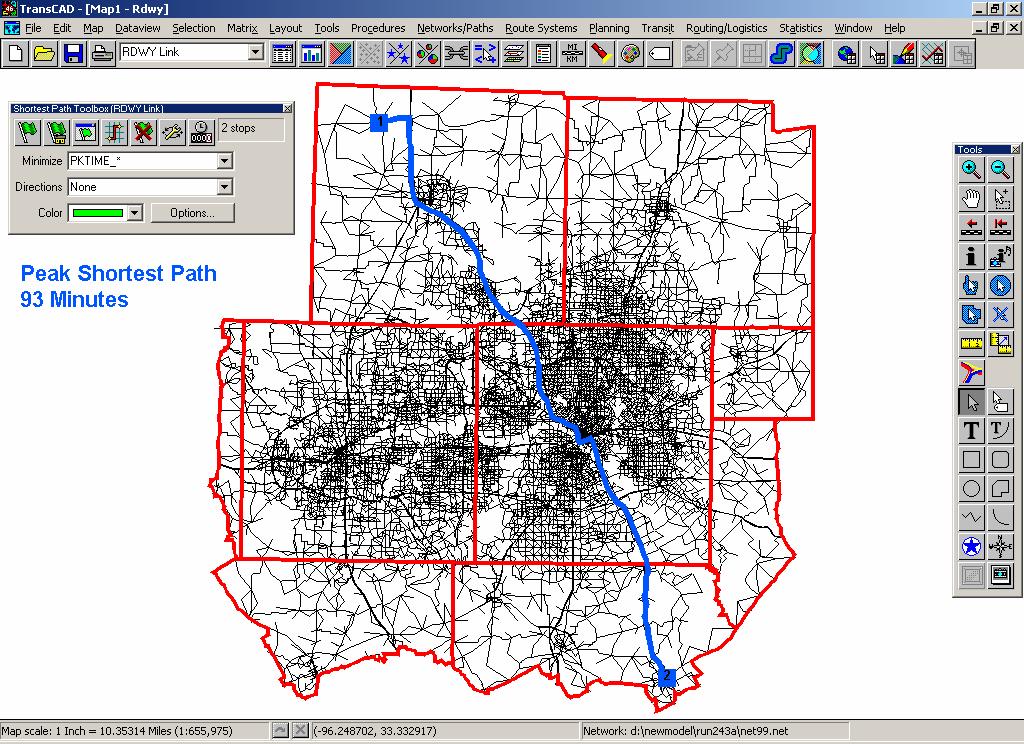
6
7 Total Population Within The Dallas Fort Worth Metropolitan Planning Area 10,000,000 9,000,000 8,000,000 7,952,070 (New Plan) 8,503,146 7,000,000 6,000,000 5,000,000 4,848,237 5,650,339 6,671,351 (Previous Plan) 4,000,000 4,536,010 3,000,000 2,000,000 1,000, Previous Plan Demographics (Mobility 2025 Update) New Plan Demographics (Mobility 2025, 2004 Update)
8 Transportation Department Program Areas 1. Administration 2. Air Quality Planning And Operations 3. Information Systems 4. Strategic Initiatives And Community Outreach 5. Transportation Planning 6. Transportation Programming And Operations
9 Information Systems Transportation Data Management (Including Web-Based Activities And GIS Support) Travel Model development and Traffic Simulation Computer Maintenance

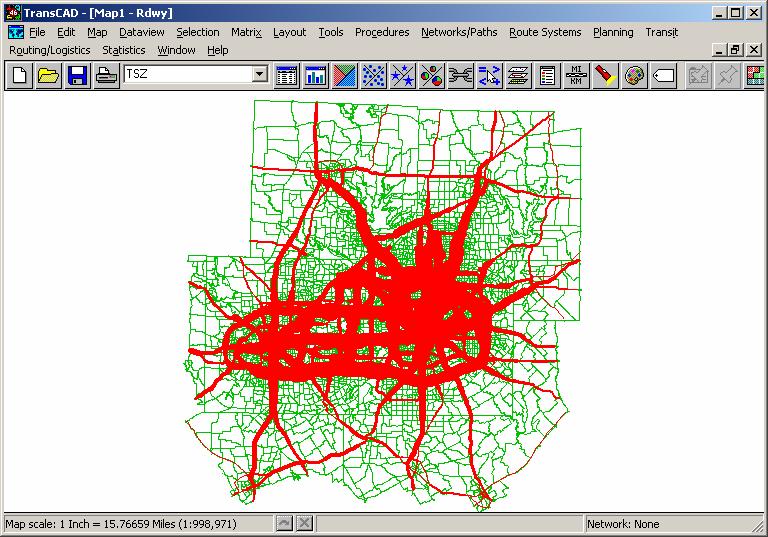
10 Regional Transportation Model
11 Modeling Environment NCTCOG-Developed FORTRAN Programs (Mainframe) MOBILE5A Emissions Analysis Latest Mobility Plan Update (Last Year) For Legacy Applications TRANPLAN (PC) Sub-area Traffic Modeling (Legacy Applications) TransCAD (PC-Windows) MOBILE6 Emissions Analysis Future 2030 Mobility Plan All New Travel Modeling Activities
12 Modeling Paradigm The Ideal Solution Ideally, we should build a detail model to replicate every person s daily travel decisions: travel or not? if yes, where to? at what time? using what mode (car drive alone, car shared-ride, transit, bicycle, walk)? path? Then, we should model long term decisions of a person to predict future Finally, we can aggregate everyone s decisions and observe the effect on a project. This approach is currently impractical. Why?
13 Modeling Paradigm The Practical Solution Practically, we model collective trip patterns for groups of people in a travel survey zone (TSZ). We estimate: number of motorized trips produced and attracted how trips are distributed among TSZs mode share of distributed trips(car drive alone, car sharedride, and transit)? assign trips to roadway or transit paths. Then, we model long term growth of population and employment for each zone. Finally, we aggregate collective decisions and observe the effect on a project. This approach is less than ideal but generally works for big decisions.
14 Travel Demand Forecasting Process Urban Activity Trip Frequency Destination Choice Mode Choice Roadway Route Choice Transit Route Choice
15 Four-Step TransCAD Modeling Process DEMOGRAPHIC INFORMATION ZONE LAYER ROADWAY NETWORK TRIP GENERATION ROADWAY SKIMS TRIP DISTRIBUTION TRANSIT NETWORK LOOP MODE CHOICE TRANSIT SKIMS ROADWAY ASSIGNMENT NO TRAVEL TIME CONVERGENCE YES INPUT PROCESS TRANSIT ASSIGNMENT DECISION
16 The Practicality Of Real-World Modeling Actual Scope Of Human Behavior Model Scope All Person Trips Motorized Person Trips All Travel Purposes HBW, HNW, NHB, And Truck Purpose Categories All Occupations Basic, Retail, And Service Jobs All Households Income And Household Size Categories (Plus Auto Ownership Breakdowns) All Streets Non-Local Streets Individual Data Aggregate Data (Zones)

17
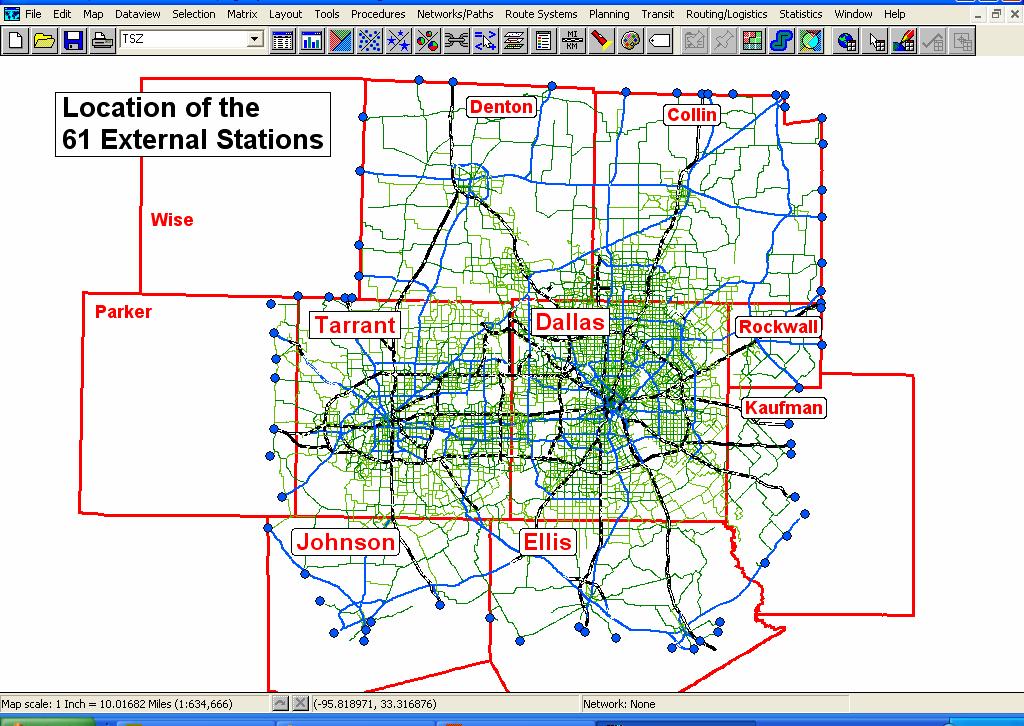
18 Creation Of 4,874-Zone Structure Start With Year 2000 Census Block Layer Ground Truth Rectification Some Block Splits (e.g., DFW And Love Field Airport) 76,336 Blocks Aggregated to 6,399 zones Add 61 External Station Tiny Circle Zones = 6,460 Total Zones Aggregate The 6,460-Zone Layer = 4,813 Internal Zones + 61 External Station Zones = 4,874 TransCAD Model Zones
19
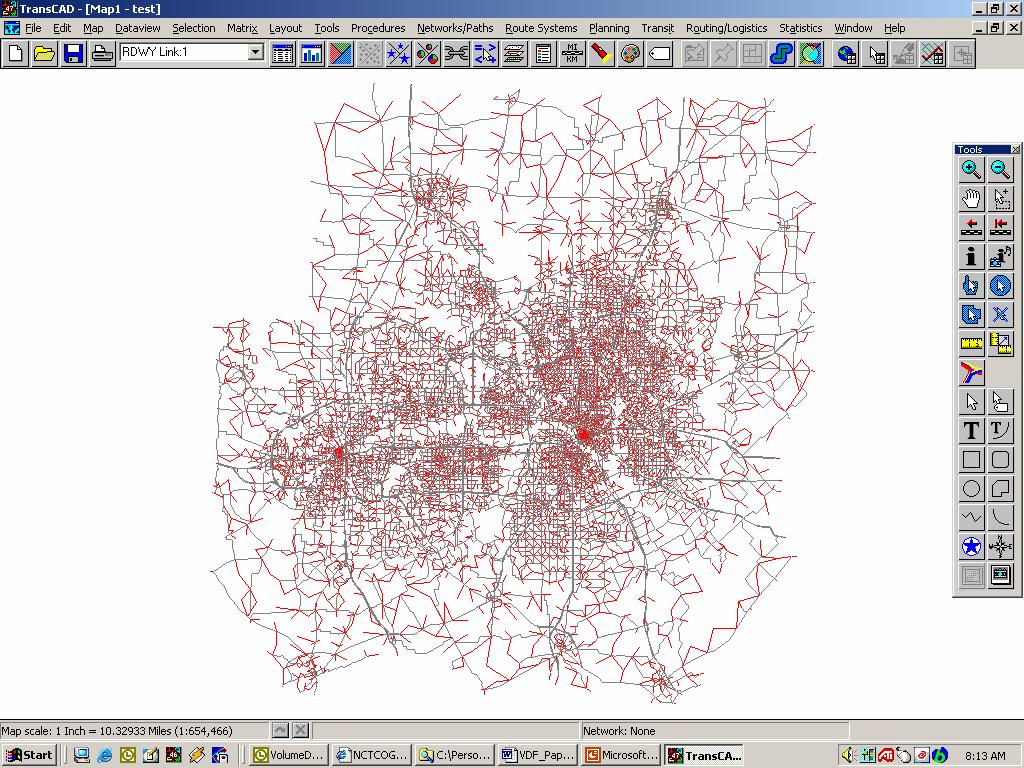
20 TransCAD Model Size 4874 Zones Retained For ALL Modeling Steps From Trip Generation To Traffic/Transit Assignment 4813 Internal + 61 External Number Of Zone-To-Zone Pairs = 23.8 Million Year 2025: 27,000 Roadway Links + 9,600 Zone Connectors Over 36,600 Coded Links 22,000 Network Nodes 2025 Transit 410 Coded One-Way Bus Lines And 36 Rail Lines 14,500 Bus Stops And 171 Rail Stations
21 Single-PC Model Run Times (For 3.2 GHz Pentium PC) Full No Feedback Model Run = 647 Minutes (10.8 Hours) Trip Generation = 1.0 minute Roadway Skimming (4) = 11 minutes Trip Distribution = 11 minutes Market Segmentation = 6 minutes Transit Prep And Skimming (4) = 77 minutes Mode Choice (13) = 65 minutes Matrix Preparations (For Transit Assignment) = 10 minutes Transit Assignment (4) = 21 minutes Matrix Preparations (For Traffic Assignment) = 98 minutes Traffic Assignment (3) = 347 minutes (5.8 hours)

22 AUTOMATED NETWORK CONVERSION
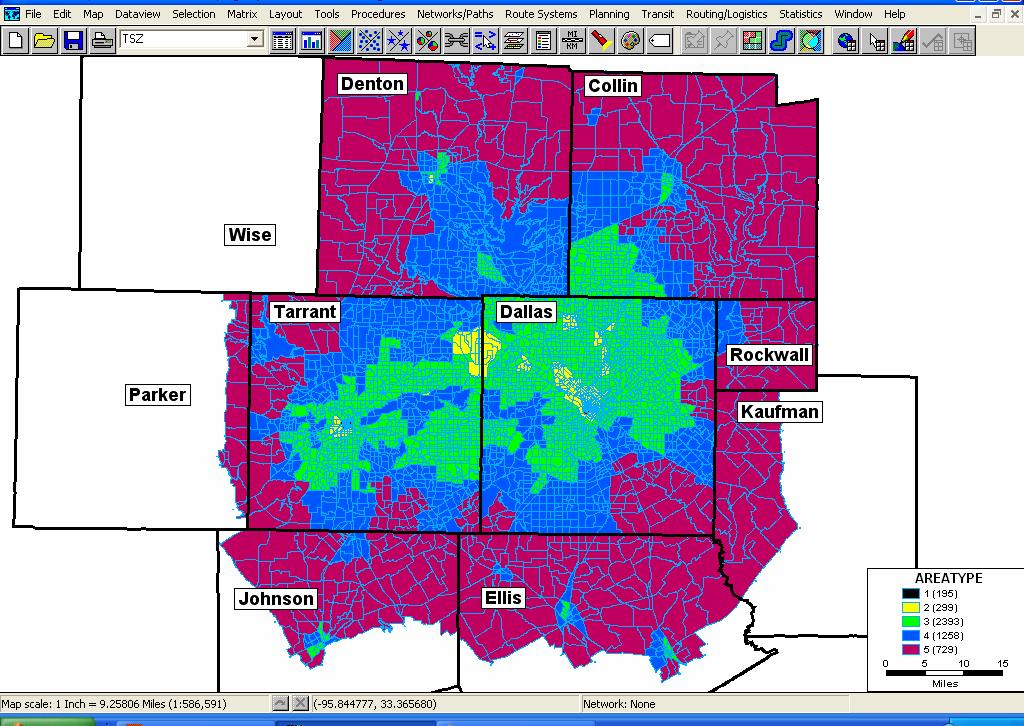
23 Roadway Preparation Link Free Speed Based On Speed Limit, Distance, Area Type, Functional Class, And Intersection Control Directional Hourly Capacity Based On Lanes, Area Type, Functional Class, And Divided/Undivided Designation Time Period Capacity AM Peak, PM Peak, And OffPeak
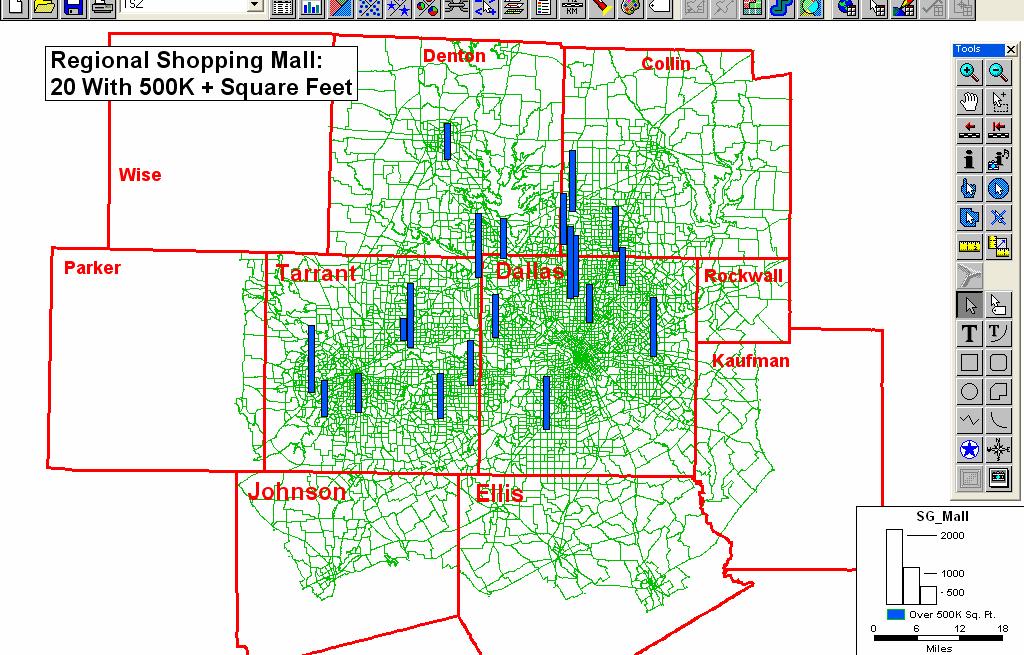
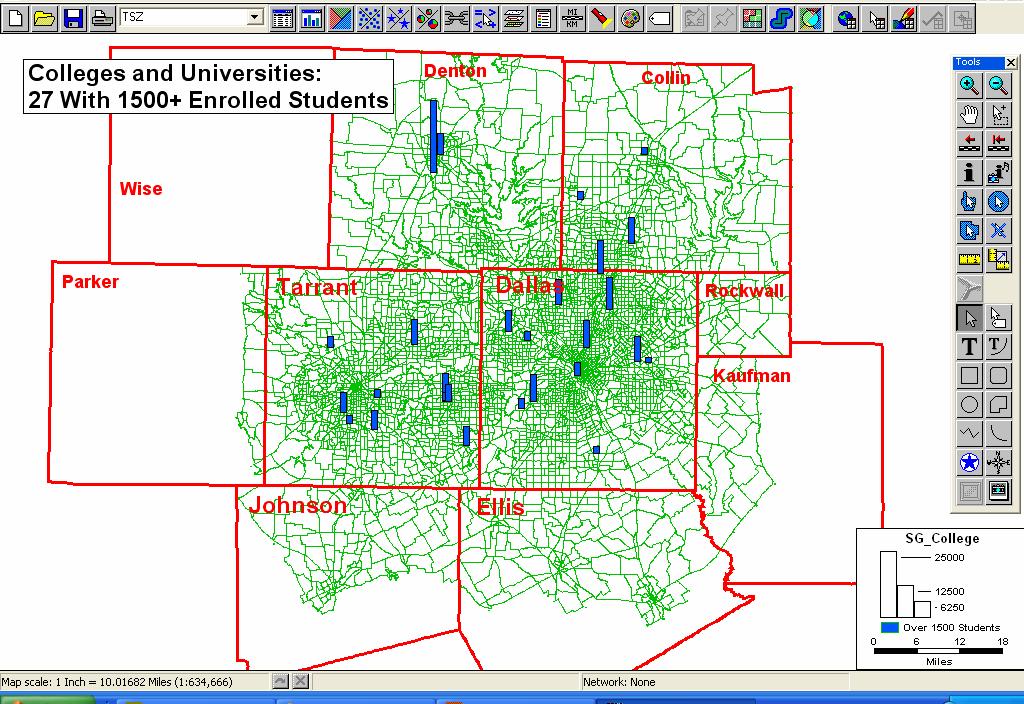
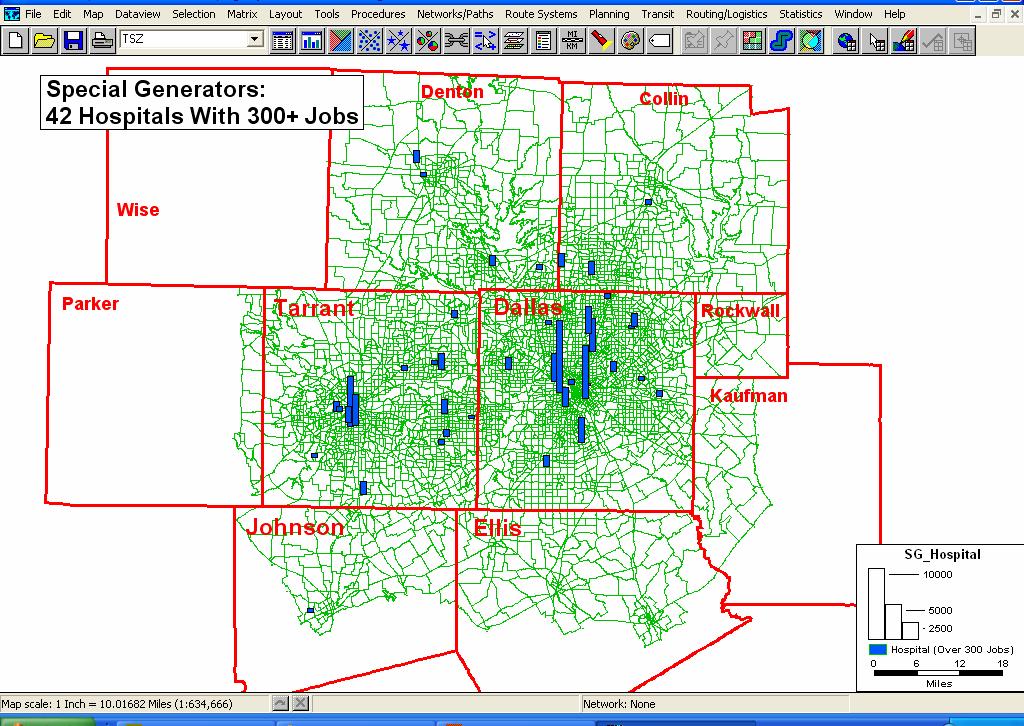
24 Trip Generation GISDK Macro Language Seven Regular Internal-Internal Trip Purposes 4 HBW, 1 HNW, 1 NHB, And 1 Truck Inputs Population, Households, Median Household Income Basic, Retail, And Service Jobs (From SIC Codes) Special Generators (Shopping Malls, Colleges, Hospitals, Airports)
25
26

27 SMU as a Special Generator
28
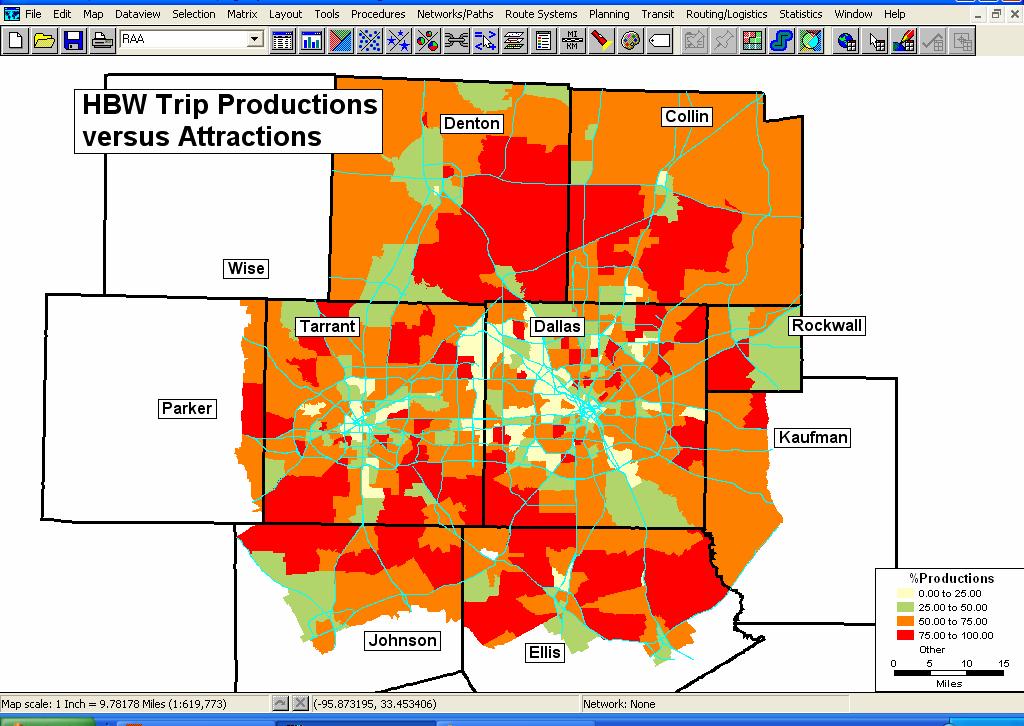
29 What Is A Trip Production And A Trip Attraction? TRIP = Use Of Motorized Transportation (Auto, Motorcycle, Truck, Or Public Transit) For At Least A Portion Of The Journey Between Two Activities Home to Work = Home-Based Work (HBW) trip; Home is both Origin and Production end, while Work is both Destination and Attraction end Work to Home = Also a HBW trip; Work is both Origin and Attraction end, while Home is both Destination and Production end Nonhome to Nonhome = Nonhome-Based (NHB) trip; first activity of a NHB trip is always the Origin and Production end, while the second activity is always the Destination and Attraction end
30
31 Trip Production Rate Table for HBW Inc.Q. Household Size
32
33 External Station Trip Tables Internal-External And External-Internal (IE/EI) Weekday Passenger Vehicles (Total Trip Ends) External-External (EE) Weekday Passenger Vehicles IE/EI Weekday Trucks (Six Or More Tires) EE Weekday Trucks (Six Or More Tires)
34 TRIP GENERATION LIMITATIONS Calibrated Trip Rates Represent Survey-Based Averages A low-income, two-person household in Frisco has the same number of HNW trip productions as a low-income, two-person household in downtown Dallas A suburban furniture store with 50 retail employees (jobs) has the same number of HNW attractions as a suburban grocery store with 50 retail employees Trip Rates Are Not Impacted By Changes In Accessibility Trip rates remain fixed, regardless of changes in roadway travel times or accessibility to transit
35 Trip Distribution Gamma-Format Gravity Model (7 Purposes) Four HBW Groups (Income Quartiles) AM Peak Skims HNW (Non-Airport) -- OffPeak NHB (Non-Airport) -- OffPeak Trucks (Vehicles With Six Or More Tires) -- OffPeak Base Year Trip Table Factoring (6 Purposes) HNW And NHB Airport Trips Four External-Related Auto/Truck Trips
36
37
38 Zone To Zone Skim Tables For Mode Choice Four AM Peak Skims (6:30a 8:59a) Roadway Without HOV Links Available (Drive Alone) Roadway With HOV Links Available (Shared Ride 2 And 3+) Transit Drive Access (PA Format) Transit Walk Access (PA Format) Four OffPeak Skims Roadway Is 18-hour Offpeak Without HOV Links Available (Drive Alone) With HOV Links Available (Shared Ride 2 And 3+) Transit Is 6-hour Mid-Day Offpeak (9:00a 2:59p) Drive Access (PA Format) Walk Access (PA Format)
39 Mode Choice Inputs Auto Travel Roadway Travel Time Roadway Length (Operating Cost) Daily Parking Cost Transit Travel In-Vehicle Transit Travel Time (Includes Dwell) Walk (Or Drive) Access Time Walk Transfer And Egress Time Initial And Transfer Wait Time Transit Fare Market Segment And Area Type Constants
40
41 HBW Mode Choice Model Structure Choice Auto Transit Drive Transit Walk Drive Alone Shared Ride 2 Shared Ride 3+
42 HNW Mode Choice Model Structure Choice Drive Alone Shared Ride Transit Drive Shared Ride 2 Shared Ride 3+ Transit Drive Transit Walk
43 NHB Mode Choice Model Structure Choice Drive Alone Shared Ride 2 Shared Ride 3+ Transit Drive Transit Walk
44 Mode Choice Outputs For each trip purpose, person trip tables by mode: Drive-alone Shared-ride Walk to Transit Drive to Transit
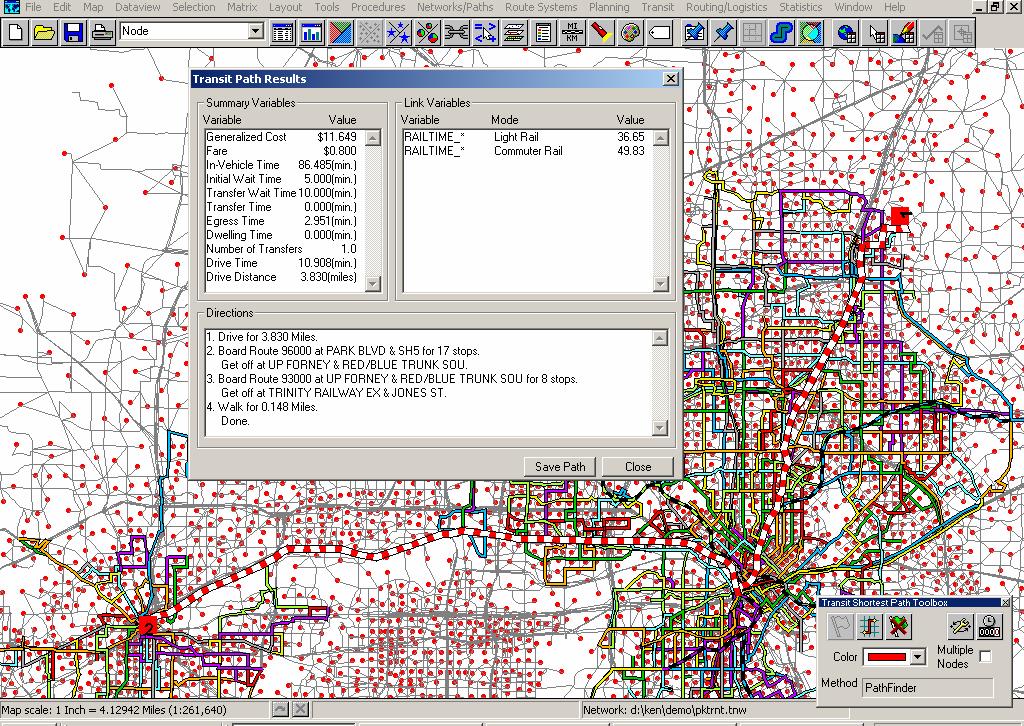
45 Transit Assignment Four Multi-Path (TransCAD Pathfinder) Production- Attraction Assignments For All HBW Transit Trips Peak Transit-Initial Drive Access (Park-and-Ride) Peak Transit-Initial Walk Access (No Park-and-Ride) For All HNW And NHB Transit Trips Offpeak Transit-Initial Drive Access (Park-and-Ride) Offpeak Transit-Initial Walk Access (No Park-and-Ride)
46 Traffic Assignment Preparation Production-Attraction To Origin-Destination Trip Table Transposing, Factoring, And Aggregation AM Peak Period (2.5 Hours) PM Peak Period (3.5 Hours) Off Peak Period (18 Hours)
47 Traffic Assignment User Equilibrium Generalized Cost (Three 30-Iteration Assignments) A.M. Peak (6:30a 8:59a: 2.5 hours) P.M. Peak (3:00p 6:29p: 3.5 hours) OffPeak (18 hours) Four Vehicle Classes Loaded Simultaneously Drive Alone Shared-Ride Sees HOV Lanes Shared-Ride Doesn t See HOV Lanes Trucks (Vehicles With 6 Or More Tires)
48 Post-Processing Of Link Speeds Example: AM Peak Directional Link Speeds Allocate (Based on Observed Time-Of-Day Factors) The 2.5-Hour AM Peak Assignment Volume Into Three Sub- Periods 6:30a 6:59a (30 Minutes) 7:00a 7:59a (60 Minutes) 8:00a 9:00a (60 Minutes) Calculate V/C ratios For Each Sub-Period Note: Capacity for 30-minute period is ½ the hourly capacity Apply The Post Process Volume Delay Curves
49 Model Outputs: Supply-Side Calculations Number Of Coded Transit Lines Roadway Network Links (Or Miles) With Transit Total Physical Stops And Line Stops How Many Are Rail Stations How Many Are Transit Park-And-Ride Locations AM Peak And Mid-Day OffPeak Vehicle Miles And Hours Of Travel Population And Employment Within Buffer Areas
50 Direct Model Outputs Person Trip (Production-Attraction) Matrices (4874 x 4874) By Trip Purpose And Mode Of Travel Roadway And Transit Skim Matrices (4874 x 4874) ONs And OFFs (Boardings And Alightings) For Each Coded Transit Stop Transit Link Flow File (Stop To Stop) Movements File (Line To Line Rider Transfers) Link-Level Traffic Volumes And Speeds By Vehicle Class and Time Of Day
51 Model Outputs: Demand-Side Calculations Transit Boardings And Alightings By Mode, By Route, By Line, Or By Rail Station For Weekday, Or For Each Of Four Assignments Regional Average Transfer Rates Boardings, Riders, And Boardings Per Rider Transit Passenger Miles And Hours Rail Station Mode-Of-Access/Egress Summaries
52
53
54
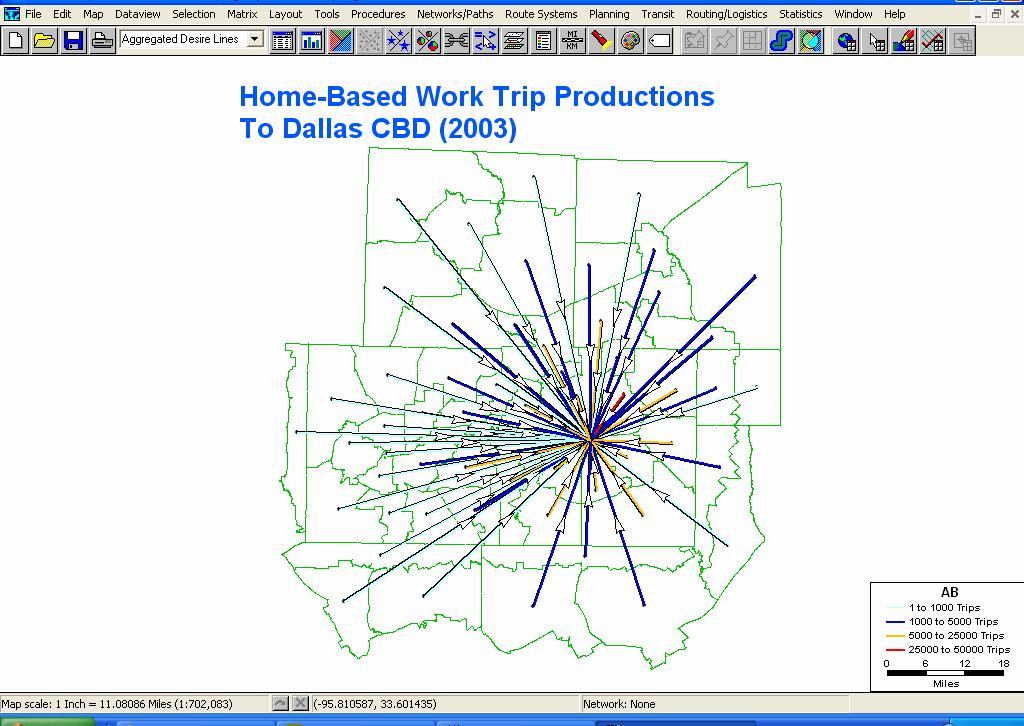
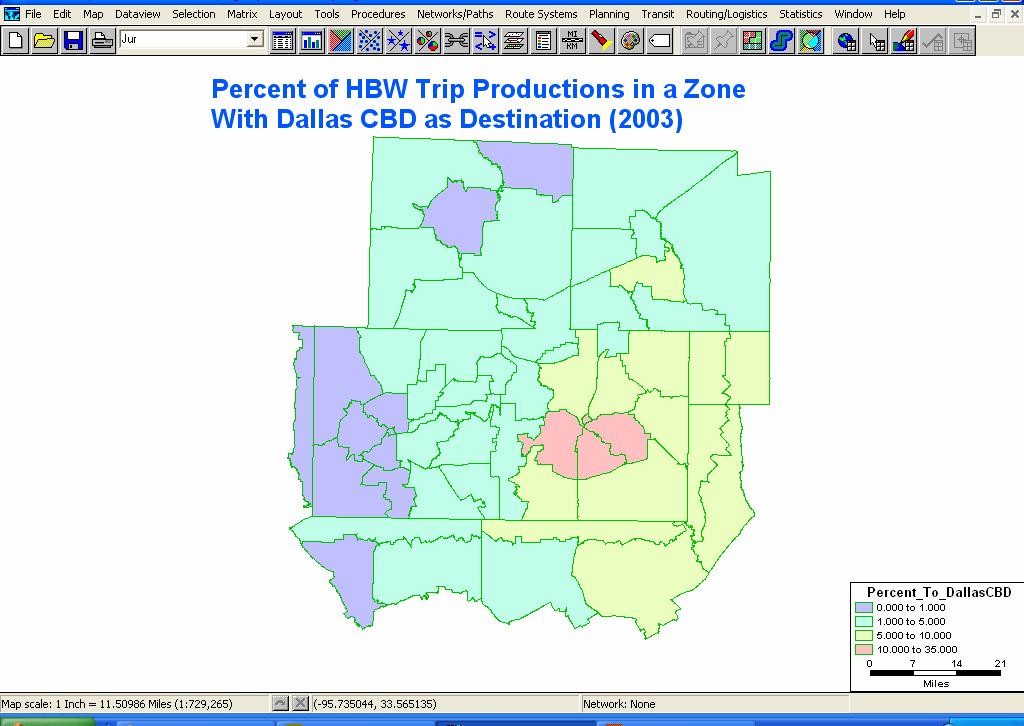
55 Some Application Examples Regional Rail Corridor Study Dallas CBD Study
Appendix F Model Development Report
 Appendix F Model Development Report This page intentionally left blank. Westside Mobility Plan Model Development Report December 2015 WESTSIDE MOBILITY PLAN MODEL DEVELOPMENT REPORT December 2015 Originally
CSTM Improvements. AITPM Canberra 11 May 2017
 CSTM Improvements AITPM Canberra 11 May 2017 7 December 2016 1 Introduction Josh Everett SMEC Australia Worked on modelling in Canberra for 11 years Used TransCAD, then EMME, now back to TransCAD Presentation
TRAVEL DEMAND FORECASTS
 Jiangxi Ji an Sustainable Urban Transport Project (RRP PRC 45022) TRAVEL DEMAND FORECASTS A. Introduction 1. The purpose of the travel demand forecasts is to assess the impact of the project components
Development of the Idaho Statewide Travel Demand Model Trip Matrices Using Cell Phone OD Data and Origin Destination Matrix Estimation
 Portland State University PDXScholar TREC Friday Seminar Series Transportation Research and Education Center (TREC) 10-24-2016 Development of the Idaho Statewide Travel Demand Model Trip Matrices Using
TEXAS CITY PARK & RIDE RIDERSHIP ANALYSIS
 TEXAS CITY PARK & RIDE RIDERSHIP ANALYSIS This document reviews the methodologies and tools used to calculate the projected ridership and parking space needs from the proposed Texas City Park & Ride to
Transit Modeling Update District One Implementation & Status Report. Purpose and Need
 Transit Modeling Update District One Implementation & Status Report presented to MTF Transit & Rail Committee presented by Dan Macmurphy, Traf-O-Data Corp. June 17, 2013 Purpose and Need Developed by FDOT
Yonge-Eglinton. Mobility Hub Profile. September 19, 2012 YONGE- EGLINTON
 September 19, 2012 PEEL YORK HALTON DURHAM HAMILTON TORONTO YONGE- EGLINTON MOBILITY HUBS: places of connectivity between regional and rapid transit services, where different modes of transportation come
PHILADELPHIA SUBURBAN RAIL SUMMARY (COMMUTER RAIL, REGIONAL RAIL)
") PHILADELPHIA SUBURBAN RAIL SUMMARY (COMMUTER RAIL, REGIONAL RAIL) October 2003 The Philadelphia commuter rail service area consists of 5.1 million people, spread over 1,800 square miles at an average population
PHILADELPHIA SUBURBAN RAIL SUMMARY (COMMUTER RAIL, REGIONAL RAIL) October 2003 The Philadelphia commuter rail service area consists of 5.1 million people, spread over 1,800 square miles at an average population
Speaker Information Tweet about this presentation #TransitGIS
 Making the Case for Transit: the Transit Competitiveness Index Title William E. Walter, GISP Speaker Information Tweet about this presentation #TransitGIS Understanding Conditions in Each Travel Market
BROWARD BOULEVARD CORRIDOR TRANSIT STUDY
 BROWARD BOULEVARD CORRIDOR TRANSIT STUDY FM # 42802411201 EXECUTIVE SUMMARY July 2012 GOBROWARD Broward Boulevard Corridor Transit Study FM # 42802411201 Executive Summary Prepared For: Ms. Khalilah Ffrench,
NEW YORK SUBURBAN RAIL SUMMARY (COMMUTER RAIL, REGIONAL RAIL)
") NEW YORK SUBURBAN RAIL SUMMARY (COMMUTER RAIL, REGIONAL RAIL) October 2003 New York: The New York commuter rail service area consists of 20.3 million people, spread over 4,700 square miles at an average
NEW YORK SUBURBAN RAIL SUMMARY (COMMUTER RAIL, REGIONAL RAIL) October 2003 New York: The New York commuter rail service area consists of 20.3 million people, spread over 4,700 square miles at an average
HALTON REGION SUB-MODEL
 WORKING DRAFT GTA P.M. PEAK MODEL Version 2.0 And HALTON REGION SUB-MODEL Documentation & Users' Guide Prepared by Peter Dalton July 2001 Contents 1.0 P.M. Peak Period Model for the GTA... 4 Table 1 -
March 2, 2017 Integrating Transportation Planning, Project Development, and Project Programming
 COORDINATION WITH VDOT DISTRICTS TO DELIVER IMPLEMENTABLE IMPROVEMENT PROJECTS March 2, 2017 Integrating Transportation Planning, Project Development, and Project Programming PRESENTATION OUTLINE What
Leadership NC. November 8, 2018
 v Leadership NC November 8, 2018 Planning for our region s growth The Triangle is one of the fastestgrowing regions in the nation. More than 2 million people are already part of the equation, and the
UTA Transportation Equity Study and Staff Analysis. Board Workshop January 6, 2018
 UTA Transportation Equity Study and Staff Analysis Board Workshop January 6, 2018 1 Executive Summary UTA ranks DART 6 th out of top 20 Transit Agencies in the country for ridership. UTA Study confirms
DEVELOPMENT OF RIDERSHIP FORECASTS FOR THE SAN BERNARDINO INFRASTRUCTURE IMPROVEMENT STUDY
 APPENDIX 1 DEVELOPMENT OF RIDERSHIP FORECASTS FOR THE SAN BERNARDINO INFRASTRUCTURE IMPROVEMENT STUDY INTRODUCTION: This Appendix presents a general description of the analysis method used in forecasting
5. OPPORTUNITIES AND NEXT STEPS
 5. OPPORTUNITIES AND NEXT STEPS When the METRO Green Line LRT begins operating in mid-2014, a strong emphasis will be placed on providing frequent connecting bus service with Green Line trains. Bus hours
2 VALUE PROPOSITION VALUE PROPOSITION DEVELOPMENT
 2 VALUE PROPOSITION The purpose of the Value Proposition is to define a number of metrics or interesting facts that clearly demonstrate the value of the existing Xpress system to external audiences including
Travel Forecasting Methodology
 Travel Forecasting Methodology Introduction This technical memorandum documents the travel demand forecasting methodology used for the SH7 BRT Study. This memorandum includes discussion of the following:
Appendix 3 CUUATS Transportation Model Report
 Appendix 3 CUUATS Transportation Model Report TRANSPORTATION MODEL LONG RANGE TRANSPORTATION PLAN 2025 Champaign-Urbana Urbanized Area Transportation Study (CUUATS) TABLE OF CONTENTS I. INTRODUCTION...1
Bi-County Transitway/ Bethesda Station Access Demand Analysis
 Bi-County Transitway/ Bethesda Station Access Demand Analysis Prepared for: Washington Metropolitan Area Transit Authority Office of Planning and Project Development May 2005 Prepared by: in conjunction
Trip Generation and Parking Study New Californian Apartments, Berkeley
 Trip Generation and Parking Study New Californian Apartments, Berkeley Institute of Transportation Engineers University of California, Berkeley Student Chapter Spring 2012 Background The ITE Student Chapter
Mobility 2045 Plan Workshop
 Mobility 2045 Plan Workshop Regional Transportation Council October 12, 2017 Agenda Mobility Planning Mobility 2045 Innovative Funding and Strategic Partnerships Public Outreach Efforts Next Steps 2 Mobility
Travel Time Savings Memorandum
 04-05-2018 TABLE OF CONTENTS 1 Background 3 Methodology 3 Inputs and Calculation 3 Assumptions 4 Light Rail Transit (LRT) Travel Times 5 Auto Travel Times 5 Bus Travel Times 6 Findings 7 Generalized Cost
Dallas Integrated Corridor Management System Lessons Learned. June 2, 2014
 Dallas Integrated Corridor Management System Lessons Learned June 2, 2014 US 75 Corridor Networks Freeway with continous Frontage Roads Managed HOV lanes Dallas North Tollway 167 Miles of Arterials DART
Chapter 7: Travel Demand Analysis. Chapter 8. Plan Scenarios. LaSalle Community Center. Image Credit: Town of LaSalle
 Chapter 7: Travel Demand Analysis Chapter 8 Plan Scenarios LaSalle Community Center. Image Credit: Town of LaSalle 164 Chapter 8: Plan Scenarios Moving Ahead for Progress in the 21 st Century Act (MAP
Transportation Statistical Data Development Report BAY COUNTY 2035 LONG RANGE TRANSPORTATION PLAN
 Transportation Statistical Data Development Report BAY COUNTY 2035 LONG RANGE TRANSPORTATION PLAN Prepared for Bay County Transportation Planning Organization and The Florida Department of Transportation,
Mobile Area Transportation Study Urban Area and Planning Boundary
 Mobile Origin- Destination Study Mobile Origin- Destination Study Trip Distribution Calibration WHY? Some background on Mobile Long Range Transportation Plan Crash course in travel demand forecasting HOW?
CHAPTER 7: EMISSION FACTORS/MOVES MODEL
 CHAPTER 7: EMISSION FACTORS/MOVES MODEL 7.1 Overview This chapter discusses development of the regional motor vehicle emissions analysis for the North Central Texas nonattainment area, including all key
Can Public Transportation Compete with Automated and Connected Cars?
 Can Public Transportation Compete with Automated and Connected Cars? RALPH BUEHLER, VIRGINIA TECH, ALEXANDRIA, VA Based on: Buehler, R. 2018. Can Public Transportation Compete with Automated and Connected
Green Line Long-Term Investments
 Enhancements Short-term improvements to keep Austin moving. Investments Long-term projects to support our future. Mobility Hubs MetroRapid MetroRail MetroExpress Connectors Circulators Project Connect
APPLICATION OF A PARCEL-BASED SUSTAINABILITY TOOL TO ANALYZE GHG EMISSIONS
 APPLICATION OF A PARCEL-BASED SUSTAINABILITY TOOL TO ANALYZE GHG EMISSIONS Jung Seo, Hsi-Hwa Hu, Frank Wen, Simon Choi, Cheol-Ho Lee Research & Analysis Southern California Association of Governments 2012
Metro Transit Update. Christina Morrison, Senior Planner Metro Transit BRT/Small Starts Project Office. John Dillery, Senior Transit Planner
 Metro Transit Update Christina Morrison, Senior Planner Metro Transit BRT/Small Starts Project Office John Dillery, Senior Transit Planner Metro Transit Service Development May 16, 2013 1 Transit Planning
Appendix G Traffic Study Methodology
 REVISED DRAFT ENVIRONMENTAL IMPACT REPORT/ Appendix G Traffic Forecasting Model Methodology In addition to the existing/baseline condition (year 2005), a level of service (LOS) analysis was conducted for
2.1 Outline of Person Trip Survey
 Trip Characteristics 2.1 Outline of Person Trip Survey 2.1.1 Outline of the Survey The Person Trip survey was carried out from 2006 to 2007 as a part of the Istanbul Transportation Master Plan undertaken
TECHNICAL COORDINATING COMMITTEE (TCC) UPDATE PRESENTATION APRIL 26, 2017
 UPDATE PRESENTATION APRIL 26, 2017") TECHNICAL COORDINATING COMMITTEE (TCC) UPDATE PRESENTATION APRIL 26, 2017 THE TRANSIT DEVELOPMENT PLAN (TDP) WILL IDENTIFY: TRANSIT NEEDS AND DESIRES OF THE COMMUNITY COMMUNITY AND AGENCY STAKEHOLDER S
TECHNICAL COORDINATING COMMITTEE (TCC) UPDATE PRESENTATION APRIL 26, 2017 THE TRANSIT DEVELOPMENT PLAN (TDP) WILL IDENTIFY: TRANSIT NEEDS AND DESIRES OF THE COMMUNITY COMMUNITY AND AGENCY STAKEHOLDER S
Shared Mobility and Transit It is The Road to Economic
 Shared Mobility and Transit It is The Road to Economic Mobility? February 20, 2018 Todd Plesko VP Planning & Development Dallas Area Rapid Transit 1 DART Transit Riders Are Disproportionately From Low
Community Advisory Committee. October 5, 2015
 Community Advisory Committee October 5, 2015 1 Today s Topics Hennepin County Community Works Update Project Ridership Estimates Technical Issue #4:Golden Valley Rd and Plymouth Ave Stations Technical
CONNECTED AND AUTOMATED TRANSPORTATION AND THE TEXAS AV PROVING GROUNDS PARTNERSHIP
 CONNECTED AND AUTOMATED TRANSPORTATION AND THE TEXAS AV PROVING GROUNDS PARTNERSHIP Christopher Poe, Ph.D., P.E. Assistant Director, Connected and Automated Transportation Strategy Texas A&M Transportation
Valley Metro Overview. ITE/IMSA Spring Conference March 6, 2014
 Valley Metro Overview ITE/IMSA Spring Conference March 6, 2014 Valley Metro Who Are We? Operate Regional Transit Services Valley Metro and Phoenix are region s primary service providers Light Rail and
Fresno County. Sustainable Communities Strategy (SCS) Public Workshop
 Public Workshop") Fresno County Sustainable Communities Strategy (SCS) Public Workshop Project Background Senate Bill 375 Regional Transportation Plan (RTP) Greenhouse gas emission reduction through integrated transportation
Fresno County Sustainable Communities Strategy (SCS) Public Workshop Project Background Senate Bill 375 Regional Transportation Plan (RTP) Greenhouse gas emission reduction through integrated transportation
Help shape your community investment in Wake Transit. Fiscal Year 2019 Draft Work Plan Summary
 Help shape your community investment in Wake Transit Fiscal Year 2019 Draft Work Plan Summary Wake County, growth and transit The Triangle is one of the fastest-growing regions in the nation. Wake County
Interstate Operations Study: Fargo-Moorhead Metropolitan Area Simulation Output
 NDSU Dept #2880 PO Box 6050 Fargo, ND 58108-6050 Tel 701-231-8058 Fax 701-231-6265 www.ugpti.org www.atacenter.org Interstate Operations Study: Fargo-Moorhead Metropolitan Area 2015 Simulation Output Technical
Transportation 2040: Plan Performance. Transportation Policy Board September 14, 2017
 Transportation 2040: Plan Performance Transportation Policy Board September 14, 2017 Today Background Plan Performance Today s Meeting Background Board and Committee Direction 2016-2017 Transportation
Draft Results and Open House
 Waco Rapid Transit Corridor (RTC) Feasibility Study Draft Results and Open House Chris Evilia, Director of Waco Metropolitan Planning Organization Allen Hunter, General Manager Waco Transit System Jimi
Trip Generation and Parking Utilization Data Collection at Mini-Mart with Gas Station
 Trip Generation and Parking Utilization Data Collection at Mini-Mart with Gas Station Final Report 2013 ITE District 6 - Data Collection Project Institute of Transportation Engineers Student Chapter at
TRANSIT FEASIBILITY STUDY Town of Bradford West Gwillimbury
 TRANSIT FEASIBILITY STUDY Town of Bradford West Gwillimbury Open House Presentation January 19, 2012 Study Objectives Quantify the need for transit service in BWG Determine transit service priorities based
Whither the Dashing Commuter?
 Whither the Dashing Commuter? The MTA in a Changing Region William Wheeler Director of Special Project Development and Planning Travel in the New York Region has changed from the days of the 9 to 5 commute
2030 Multimodal Transportation Study
 2030 Multimodal Transportation Study City of Jacksonville Planning and Development Department Prepared by Ghyabi & Associates April 29,2010 Introduction Presentation Components 1. Study Basis 2. Study
RTID Travel Demand Modeling: Assumptions and Method of Analysis
 RTID Travel Demand Modeling: Assumptions and Method of Analysis Overall Model and Scenario Assumptions The Puget Sound Regional Council s (PSRC) regional travel demand model was used to forecast travel
Parks and Transportation System Development Charge Methodology
 City of Sandy Parks and Transportation System Development Charge Methodology March, 2016 Background In order to implement a City Council goal the City of Sandy engaged FCS Group in January of 2015 to update
CEDAR AVENUE TRANSITWAY Implementation Plan Update
 CEDAR AVENUE TRANSITWAY Implementation Plan Update EECUTIVE SUMMARY DECEMBER 2015 Executive Summary In 2013, the Twin Cities metropolitan area s first bus rapid transit (BRT) line, the METRO Red Line,
FREQUENTLY ASKED QUESTIONS
 FREQUENTLY ASKED QUESTIONS 2018 What is the More MARTA Atlanta program? The More MARTA Atlanta program is a collaborative partnership between MARTA and the City of Atlanta to develop and implement a program
Developing a Toll Demand Model for DelDOT s Statewide Travel Demand Model
 Developing a Toll Demand Model for DelDOT s Statewide Travel Demand Model TRB 87 th Annual Meeting Washington, D.C. Introduction DelDOT is facing the same deteriorating infrastructure, increasing congestion
ConnectGreaterWashington: Can the Region Grow Differently?
 Washington Metropolitan Area Transit Authority ConnectGreaterWashington: Can the Region Grow Differently? Transportation Planning Board (TPB) Travel Forecasting Subcommittee July 17, 2015 1 Alternatives
Subarea Study. Manning Avenue (CSAH 15) Corridor Management and Safety Improvement Project. Final Version 1. Washington County.
 Corridor Management and Safety Improvement Project. Final Version 1. Washington County.") Subarea Study Manning Avenue (CSAH 15) Corridor Management and Safety Improvement Project Final Version 1 Washington County June 12, 214 SRF No. 138141 Table of Contents Introduction... 1 Forecast Methodology
Subarea Study Manning Avenue (CSAH 15) Corridor Management and Safety Improvement Project Final Version 1 Washington County June 12, 214 SRF No. 138141 Table of Contents Introduction... 1 Forecast Methodology
Executive Summary. Draft Environmental Impact Statement/Environmental Impact Report ES-1
 Executive Summary Introduction The Eastside Transit Corridor Phase 2 Project is a vital public transit infrastructure investment that would provide a transit connection to the existing Metro Gold Line
Executive Summary October 2013
 Executive Summary October 2013 Table of Contents Introduction... 1 Rider Transit and Regional Connectivity... 1 Plan Overview... 2 Network Overview... 2 Outreach... 3 Rider Performance... 4 Findings...
Draft Results and Recommendations
 Waco Rapid Transit Corridor (RTC) Feasibility Study Draft Results and Recommendations Chris Evilia, Director of Waco Metropolitan Planning Organization Allen Hunter, General Manager Waco Transit System
Troost Corridor Transit Study
 Troost Corridor Transit Study May 23, 2007 Kansas City Area Transportation Authority Agenda Welcome Troost Corridor Planning Study Public participation What is MAX? Survey of Troost Riders Proposed Transit
Appendix B: Travel Demand Forecasts July 2017
 Appendix B: Travel Demand Forecasts July 2017 Table of Contents 1 Introduction... 2 2 Model Review and Updates... 2 2.1 Overview of Smart Moves Model ( City of London Model )... 2 2.1.1 Network and Zone
WAKE TRANSIT PLAN Summer 2018
 WAKE TRANSIT PLAN Summer 2018 Planning for growth WAKE COUNTY s population already exceeds ONE MILLION and grows by more than 60 people a day. That s 23,000 people a year or basically another Morrisville.
SUPPORTING TOD IN METRO CHICAGO
 www.rtachicago.org SUPPORTING TOD IN METRO CHICAGO Tuesdays at APA November 18, 2014 OVERVIEW OF RTA 2 11/18/2014 Tuesdays at APA: Supporting TOD in Metro Chicago RTA Region 8.5 million people 3,700 square
Rail alignment and benefits (rab) study
 study") Rail alignment and benefits (rab) study previously known as railyard alternatives & i-280 boulevard study June 5, 2018 CONNECTING CALIFORNIA 4,300 lane miles + 115 Airport gates would be needed to create
Rail alignment and benefits (rab) study previously known as railyard alternatives & i-280 boulevard study June 5, 2018 CONNECTING CALIFORNIA 4,300 lane miles + 115 Airport gates would be needed to create
Alpine Highway to North County Boulevard Connector Study
 Alpine Highway to North County Boulevard Connector Study prepared by Avenue Consultants March 16, 2017 North County Boulevard Connector Study March 16, 2017 Table of Contents 1 Summary of Findings... 1
David Leard, Edward Potthoff, Andrew de Garmo and Kevin Welch
 Technical Memorandum Technical Memorandum Date: Monday, June 22, 2015 Project: To: From: Subject: Albuquerque Rapid Transit Study David Leard, Edward Potthoff, Andrew de Garmo and Kevin Welch Vijay Mahal,
6/6/2018. June 7, Item #1 CITIZENS PARTICIPATION
 June 7, 2018 Item #1 CITIZENS PARTICIPATION 1 Item #2 APPROVAL OF MINUTES Item #3 TRAC GOALS, FRAMEWORK & AGENDA REVIEW 2 COMMITTEE GOALS Learn about Southern Nevada s mobility challenges, new developments
West Broadway Transit Study. Community Advisory Committee September 17, 2015
 West Broadway Transit Study Community Advisory Committee September 17, 2015 Introductions Community Engagement Summer Outreach Fall Outreach Technical Analysis Process Update Alternatives Review Economic
Broward County Intermodal Center And People Mover. AASHTO Value Engineering Conference Presentation. September 1, 2009 San Diego, CA
 Project Development & Environment Study Broward County Intermodal Center And People Mover AASHTO Value Engineering Conference Presentation September 1, 2009 San Diego, CA Background P D & E Study Regional
2016 Congestion Report
 2016 Congestion Report Metropolitan Freeway System May 2017 2016 Congestion Report 1 Table of Contents Purpose and Need...3 Introduction...3 Methodology...4 2016 Results...5 Explanation of Percentage Miles
Transit System Technical Report
 Transit System Technical Report Table of Contents Introduction... 1 Regional Setting... 1 Road Network... 1 The Mass Transportation Authority FY 2016-2020 Plan... 2 Other Growth Areas... 5 Senior Citizens...
Finding Ways out of Congestion for the Chicago Loop. - - A Micro-simulation Approach
 Finding Ways out of Congestion for the Chicago Loop - - A Micro-simulation Approach By Shan Jiang Master of Science in Transportation and Master in City Planning Candidate Massachusetts Institute of Technology
Downtown Transit Connector. Making Transit Work for Rhode Island
 Downtown Transit Connector Making Transit Work for Rhode Island 3.17.17 Project Evolution Transit 2020 (Stakeholders identify need for better transit) Providence Core Connector Study (Streetcar project
Mobility on Demand, Mobility as a Service the new transport paradigm. Richard Harris, Xerox
 Mobility on Demand, Mobility as a Service the new transport paradigm Richard Harris, Xerox Xerox Transport Services 37 billion 100 million transit fare transactions processed annually and more public transport
Rideshare and TDM Part of the Transportation System
 Rideshare and TDM Part of the Transportation System 2014 TexITE Fall Meeting September 25, 2014 David McMaster Metropolitan Transit Authority of Harris County Texas Ridesharing A large factor in Transportation
STRATEGIC PRIORITIES AND POLICY COMMITTEE MAY 5, 2016
 STRATEGIC PRIORITIES AND POLICY COMMITTEE MAY 5, 2016 Shift Rapid Transit Initiative Largest infrastructure project in the city s history. Rapid Transit initiative will transform London s public transit
Transit Access Study
 West of Hudson Regional Transit Access Study Open House presentation July 20, 2010 1 Agenda Progress To date Summary of Level 2 Alternatives and Screening Service Plans Bus and Rail Operating and Capital
Utah Transit Authority Rideshare. CTAA Conference June 12, 2014
 Utah Transit Authority Rideshare CTAA Conference June 12, 2014 UTA Statistics and Info A Public Transit Agency Six counties, about 1600 square miles Within this area is 80% of the state s population, an
IH 45 (GULF FWY) IH 10 (Katy Fwy) to IH 610 S (South Loop) 2010 Rank: Rank: 12
 IH 10 (Katy Fwy) to IH 610 S (South Loop) 2010 Rank: Rank: 12") Mobility Investment Priorities Project Houston IH 45 IH 45 (GULF FWY) IH 10 (Katy Fwy) to IH 610 S (South Loop) Current Conditions From IH 10 to IH 610 south, IH 45 is a 6- to 9-lane facility with three
Mobility Investment Priorities Project Houston IH 45 IH 45 (GULF FWY) IH 10 (Katy Fwy) to IH 610 S (South Loop) Current Conditions From IH 10 to IH 610 south, IH 45 is a 6- to 9-lane facility with three
Northeast Corridor Alternatives Analysis. Public Involvement Round 2 Input on Alternatives for Further Study
 Northeast Corridor Alternatives Analysis Public Involvement Round 2 Input on Alternatives for Further Study Feb. 7-9, 2012 Agenda Review project background Progress summary Recommended alternatives for
Parking Management Element
 Parking Management Element The State Transportation Planning Rule, adopted in 1991, requires that the Metropolitan Planning Organization (MPO) area implement, through its member jurisdictions, a parking
Transportation Demand Management Element
 Transportation Demand Management Element Over the years, our reliance on the private automobile as our primary mode of transportation has grown substantially. Our dependence on the automobile is evidenced
Technical Memorandum Analysis Procedures and Mobility Performance Measures 100 Most Congested Texas Road Sections What s New for 2015
 Technical Memorandum Analysis Procedures and Mobility Performance Measures 100 Most Congested Texas Road Sections Prepared by Texas A&M Transportation Institute August 2015 This memo documents the analysis
Application of EMME3 and Transportation Tomorrow Survey (TTS) for Estimation of Zonal Time Varying Population Density Distribution in
 for Estimation of Zonal Time Varying Population Density Distribution in") Application of EMME3 and Transportation Tomorrow Survey (TTS) for Estimation of Zonal Time Varying Population Density Distribution in the Greater Toronto Area Prepared by: Matthew Roorda, Associate Professor
Application of EMME3 and Transportation Tomorrow Survey (TTS) for Estimation of Zonal Time Varying Population Density Distribution in the Greater Toronto Area Prepared by: Matthew Roorda, Associate Professor
Metropolitan Freeway System 2013 Congestion Report
 Metropolitan Freeway System 2013 Congestion Report Metro District Office of Operations and Maintenance Regional Transportation Management Center May 2014 Table of Contents PURPOSE AND NEED... 1 INTRODUCTION...
SAN BERNARDINO COUNTY TRANSPORTATION ANALYSIS MODEL SBTAM
 SAN BERNARDINO COUNTY TRANSPORTATION ANALYSIS MODEL SBTAM MODEL DEVELOPMENT AND VALIDATION Report and User s Guide Submitted to: San Bernardino Associated Governments 1170 W. 3rd Street, 2nd Floor San
KRM Corridor Transit Service Options: Frequently Asked Questions
 December 2008 KRM Corridor Transit Service Options: Frequently Asked Questions by Thomas A. Rubin and Robert W. Poole, Jr. FREQUENTLY ASKED QUESTIONS 1 2 3 4 5 6 7 8 How many net new transit riders would
CLRP. Performance Analysis of The Draft 2014 CLRP. Long-Range Transportation Plan For the National Capital Region
 NATIONAL CAPITAL REGION TRANSPORTATION PLANNING BOARD Item 12 CLRP Financially Constrained Long-Range Transportation Plan For the National Capital Region 2014 Performance Analysis of The Draft 2014 CLRP
TEXAS RURAL TRANSPORTATION PLAN 2035 (TRTP 2035)
") TEXAS RURAL TRANSPORTATION PLAN 2035 (TRTP 2035) Helping shape the future of rural Texas Texas Rural Transportation Plan 2035 Texas Rural Transportation Plan 2035 What is it? Component of the Statewide
TEXAS RURAL TRANSPORTATION PLAN 2035 (TRTP 2035) Helping shape the future of rural Texas Texas Rural Transportation Plan 2035 Texas Rural Transportation Plan 2035 What is it? Component of the Statewide
7 COMPARATIVE EVALUATION OF ALTERNATIVES
 7 COMPARATIVE EVALUATION OF ALTERNATIVES 7.1 INTRODUCTION This chapter presents the comparative analysis of the four Level 2 build alternatives along with a discussion of the relative performance of the
I-26 Fixed Guideway Alternatives Analysis
 I-26 Fixed Guideway Alternatives Analysis Steering & Technical Advisory Committees Joint Meeting January 15, 2016 @ 10:00 AM SC/TAC Meeting Winter 2016 Agenda I. Welcome & Introductions II. III. Project
TRANSIT DEMAND IN RURAL DOUGLAS COUNTY: PRELIMINARY BACKGROUND DATA
 TRANSIT DEMAND IN RURAL DOUGLAS COUNTY: PRELIMINARY BACKGROUND DATA Lawrence-Douglas County MPO Regional Transit Advisory Committee Lawrence, Kans. Tuesday October 31, 2017 Chris Zeilinger Assistant Director
Mountain Area Transportation Study Model Methodology and Assumptions Final
 Model Methodology and Assumptions Final February 19, 2017 Submitted to: 17J17-1768.17 Prepared by Iteris, Inc. Innovating Through Informatics TABLE OF CONTENTS 1.0 OVERVIEW... 1 1.1 Project Objective and
Engineering Dept. Highways & Transportation Engineering
 The University College of Applied Sciences UCAS Engineering Dept. Highways & Transportation Engineering (BENG 4326) Instructors: Dr. Y. R. Sarraj Chapter 4 Traffic Engineering Studies Reference: Traffic
Kendall Drive Premium Transit PD&E Study Project Kick-Off Meeting SR 94/Kendall Drive/SW 88 Street Project Development and Environment (PD&E) Study
 Study") Florida Department of Transportation District Six Kendall Drive Premium Transit PD&E Study Project Kick-Off Meeting SR 94/Kendall Drive/SW 88 Street Project Development and Environment (PD&E) Study What
Florida Department of Transportation District Six Kendall Drive Premium Transit PD&E Study Project Kick-Off Meeting SR 94/Kendall Drive/SW 88 Street Project Development and Environment (PD&E) Study What
V03. APTA Multimodal Operations Planning Workshop August Green Line LRT
 V03 APTA Multimodal Operations Planning Workshop August 2016 Green Line LRT 2 Presentation Outline Past Present Future 3 16/03/2016 RouteAhead Update 4 4 16/03/2016 RouteAhead Update 5 5 16/03/2016 6 6
Innovation and Transformation of Urban Mobility Role of Smart Demand Responsive Transport (DRT) service
 service") Innovation and Transformation of Urban Mobility Role of Smart Demand Responsive Transport (DRT) service Eng. Mohammed Abubaker Al Hashimi Director of Planning & Business Development, Public Transport Agency
Innovation and Transformation of Urban Mobility Role of Smart Demand Responsive Transport (DRT) service Eng. Mohammed Abubaker Al Hashimi Director of Planning & Business Development, Public Transport Agency
Waco Rapid Transit Corridor (RTC) Feasibility Study
 Feasibility Study") Waco Rapid Transit Corridor (RTC) Feasibility Study Chris Evilia, Director of Waco Metropolitan Planning Organization Allen Hunter, General Manager Waco Transit System Jimi Mitchell, Project Manager AECOM
Waco Rapid Transit Corridor (RTC) Feasibility Study Chris Evilia, Director of Waco Metropolitan Planning Organization Allen Hunter, General Manager Waco Transit System Jimi Mitchell, Project Manager AECOM
Policy Note. Vanpools in the Puget Sound Region The case for expanding vanpool programs to move the most people for the least cost.
 Policy Note Vanpools in the Puget Sound Region The case for expanding vanpool programs to move the most people for the least cost Recommendations 1. Saturate vanpool market before expanding other intercity
Rail alignment and benefits (rab) study
 study") Rail alignment and benefits (rab) study previously known as railyard alternatives & i-280 boulevard study May 22, 2018 CONNECTING CALIFORNIA 4,300 lane miles + 115 Airport gates would be needed to create
Rail alignment and benefits (rab) study previously known as railyard alternatives & i-280 boulevard study May 22, 2018 CONNECTING CALIFORNIA 4,300 lane miles + 115 Airport gates would be needed to create