Technical Report Documentation Page 2. Government Accession No. 3. Recipient's Catalog No. 1. Report No. FHWA/TX-09/
|
|
|
- Dwain Hudson
- 5 years ago
- Views:
Transcription
1 1. Report No. FHWA/TX-09/ Title and Subtitle ANALYSIS OF ROADSIDE SAFETY DEVICES FOR USE ON VERY HIGH-SPEED ROADWAYS Technical Report Documentation Page 2. Government Accession No. 3. Recipient's Catalog No. 5. Report Date February 2009 Published: September Performing Organization Code 7. Author(s) Nauman M. Sheikh, Rubiat Ferdous, Roger P. Bligh, and Akram Y. Abu-Odeh 9. Performing Organization Name and Address Texas Transportation Institute The Texas A&M University System College Station, Texas Sponsoring Agency Name and Address Texas Department of Transportation Research and Technology Implementation Office P.O. Box 5080 Austin, Texas Performing Organization Report No. Report Work Unit No. (TRAIS) 11. Contract or Grant No. Project Type of Report and Period Covered Technical Report: September 2007 February Sponsoring Agency Code 15. Supplementary Notes Project performed in cooperation with the Texas Department of Transportation and the Federal Highway Administration. Project Title: Development of Roadside Safety Devices for Very High-Speed Roadways URL: Abstract The Texas Department of Transportation (TxDOT) is embarking on a multi-decade effort to expand the state s transportation system. TxDOT has expressed an interest in using very high design speeds (above 80 mph) for some of these facilities to promote faster and more efficient travel within the state. Currently, roadside safety hardware is tested at a speed of 62 mph. This impact speed was derived from crash data collected on roads with design speeds up to 70 mph. The ability of existing roadside safety features to accommodate more severe, higher energy impacts is not known. The objective of this research is to develop roadside safety hardware suitable for use on very highspeed highways. Finite element simulations are used to evaluate the impact performance of selected roadside safety devices subjected to very high-speed impacts. Systems analyzed include single slope concrete barrier, modified thrie-beam guardrail, box beam guardrail, and slip-base sign supports. Design modifications to some of these systems are recommended for further consideration. 17. Key Words High-Speed Roadway, Bridge Rail, Guardrail, Sign Support, Finite Element Analysis, Simulation, Modeling, Roadside Safety, Crash Testing 19. Security Classif.(of this report) Unclassified 20. Security Classif.(of this page) Unclassified Form DOT F (8-72) Reproduction of completed page authorized 18. Distribution Statement No restrictions. This document is available to the public through NTIS: National Technical Information Service Springfield, Virginia No. of Pages Price
2
3 ANALYSIS OF ROADSIDE SAFETY DEVICES FOR USE ON VERY HIGH-SPEED ROADWAYS by Nauman M. Sheikh Associate Transportation Researcher Texas Transportation Institute Rubiat Ferdous Graduate Research Assistant Texas Transportation Institute Roger P. Bligh Research Engineer Texas Transportation Institute and Akram Y. Abu-Odeh Associate Research Scientist Texas Transportation Institute Report Project Project Title: Development of Roadside Safety Devices for Very High-Speed Roadways Performed in cooperation with the Texas Department of Transportation and the Federal Highway Administration February 2009 Published: September 2009 TEXAS TRANSPORTATION INSTITUTE The Texas A&M University System College Station, Texas
4
5 DISCLAIMER This research was performed in cooperation with the Texas Department of Transportation (TxDOT) and the Federal Highway Administration (FHWA). The contents of this report reflect the views of the authors, who are responsible for the facts and the accuracy of the data presented herein. The contents do not necessarily reflect the official view or policies of the FHWA or TxDOT. This report does not constitute a standard, specification, or regulation, and its contents are not intended for construction, bidding, or permit purposes. In addition, the above listed agencies assume no liability for its contents or use thereof. The names of specific products or manufacturers listed herein do not imply endorsement of those products or manufacturers. The engineer in charge of the project was Roger P. Bligh, P.E. (Texas, #78550). v
6 ACKNOWLEDGMENTS This project was conducted in cooperation with TxDOT and FHWA. This research project was conducted under a cooperative program between the Texas Transportation Institute, the Texas Department of Transportation, and the Federal Highway Administration. The TxDOT project director for this research was Bobby Dye (DES). Rory Meza (DES), John Holt (BRG), Jon Ries (BRG), Michael McKissick (AUS), and Edward Sewell (WFS) served on the project monitoring committee and helped guide this research. The authors acknowledge and appreciate their assistance. vi
7 TABLE OF CONTENTS Page List of Figures... ix List of Tables... xi CHAPTER 1. INTRODUCTION BACKGROUND OBJECTIVE AND SCOPE OF RESEARCH DESIGN CONSTRAINTS ANALYSIS APPROACH SELECTION OF ROADSIDE SAFETY FEATURES Guardrails Bridge Rails Breakaway Supports Median Barrier... 7 CHAPTER 2. MODIFIED THRIE-BEAM GUARDRAIL SYSTEM BACKGROUND SYSTEM DESCRIPTION FINITE ELEMENT MODEL DEVELOPMENT Introduction Model Details FINITE ELEMENT VEHICLE MODEL MODEL VALIDATION Vehicle Impact Simulation Summary of Model Evaluation HIGH-SPEED IMPACT PERFORMANCE OF MODIFIED THRIE-BEAM GUARDRAIL Impact Mid-Span between Posts Impact at Post Location SUMMARY AND CONCLUSIONS RECOMMENDATIONS CHAPTER 3. BOX BEAM GUARDRAIL SYSTEM INTRODUCTION SYSTEM DESCRIPTION FINITE ELEMENT MODEL DEVELOPMENT Introduction Model Details Model Validation HIGH-SPEED SIMULATION WITH BOX BEAM GUARDRAIL SYSTEM vii
8 TABLE OF CONTENTS (CONTINUED) Page 3.5 CONCLUSIONS RECOMMENDATIONS CHAPTER 4. CONCRETE BARRIER SYSTEMS INTRODUCTION ANALYSIS WITH PICKUP TRUCK Summary of Analysis with Pickup Truck ANALYSIS WITH SMALL PASSENGER CAR CONCLUSIONS CHAPTER 5. SLIP-BASE SIGN SUPPORTS INTRODUCTION ANALYSIS WITH SMALL PASSENGER CAR ANALYSIS WITH PICKUP TRUCK CONCLUSIONS CHAPTER 6. CONCLUSIONS GUARDRAIL Modified Thrie-Beam Guardrail Box Beam Guardrail BRIDGE RAIL SIGN SUPPORTS CHAPTER 7. IMPLEMENTATION RECOMMENDATIONS GUARDRAIL BRIDGE RAIL SIGN SUPPORTS REFERENCES viii
9 LIST OF FIGURES Page Figure 2.1. Typical Modified Thrie-Beam Guardrail System (SGR09b) Figure 2.2. Details of (a) Thrie-Beam Guardrail, (b) Modified Thrie-Beam Guardrail Blockout, and (c) Strong Steel Post Figure 2.3. Finite Element Model of the Modified Thrie-Beam Guardrail System Figure 2.4. Model for the Thrie-Beam Rail and Splice Connection Figure 2.5. (a) Bolt Model; and (b) Modified Thrie-Beam Guardrail Blockout Figure 2.6. Post-Soil Interaction Model Figure 2.7. (a) Typical Tangent Terminal System; and (b) Finite Element Model of the Terminal Figure 2.8. (a) Prescribed Displacement Curve Applied on the Terminal System; Figure 2.9. and (b) Force-Displacement Curve Obtained from the Simulation Comparison of Overall Weight Distribution of Vehicle Model with Crash Test Vehicle Figure Explicit Accelerometer Assembly Model Figure Sequential Photographs of Modified Thrie-Beam Simulation and Test Figure Vehicle Angular Displacement Comparison of Modified Thrie-beam Simulation and Test Figure Vehicle after (a) Simulation; and (b) Crash Test Figure Finite Element Model of 85 mph Impact at Center Post Location of Modified Thrie-Beam System Figure Simulation Results for High-Speed Impact of Modified Thrie-Beam System Mid-Span between Posts Figure Deformation of the Steel Posts and Blockouts Figure Contours of Plastic Strain in the Thrie-beam Segment Figure Finite Element Model of 85 mph Impact at One-Third Point of Installation at Post Location Figure Simulation Results of 85 mph Impact at One-Third Point of Installation at Post Location Figure 3.1. Typical Box Beam Guardrail System Figure 3.2. Detailed Drawings of (a) Box Beam Guardrail System; (b) Weak Steel Post; and (c) Splice Connections Figure 3.3. Finite Element Model for the Box Beam Guardrail System Figure 3.4. Model for the Splice Plate Connection Figure 3.5. Model for the Connection between Rail, Supporting Bracket, and Post Figure 3.6. Model for (a) Soil Bucket and and (b) Soil Plate Figure 3.7. Model of the Turned-Down End-Terminal Figure 3.8. Sequential Photographs for SGR03 Model Simulation and Test Figure 3.9. Vehicle Angular Displacement Comparison of Box Beam Guardrail Simulation and Test Figure Vehicle after (a) Simulation; and (b) Crash Test Figure System Model for High-Speed Impact of Box Beam Guardrail ix
10 LIST OF FIGURES (CONTINUED) Page Figure Simulation Results of 85 mph Impact of Box Beam Rail Figure Detachment of Posts from Rail near the End-Terminal Figure The Rail (a) Redirects the Vehicle and (b) Drops Down Figure 4.1. Finite Element Model of C2500 Pickup Impacting Single-Slope Barrier Figure 4.2. Time Sequence Comparison of Pickup Impact on Single-Slope Barrier at 62 mph (Left) and 85 mph (Right) Figure 4.3. Vehicle Deformations for 62 mph and 85 mph Impacts Figure 4.4. Occupant Compartment Deformations Due to 62 mph and 85 mph Impacts Figure 4.5. Deformed Pickup Truck Floorboards after Impact Figure 4.6. NCAC Dodge Neon Vehicle Model Figure 4.7. Finite Element Model of Dodge Neon Impacting Rigid NJ Profile Barrier Figure 4.8. Time-Sequence Comparison of Small Car Impact into NJ Profile Concrete Barrier Figure 4.9. Comparison of 62 mph (Left) and 85 mph (Right) Impact into NJ Barrier Figure Comparison of 85 mph (Left) and 62 mph (Right) Impact Simulations with SSB Figure 5.1. Dual Support Sign System Used for Validation of Simulation Model Figure 5.2. Vehicle after Crash Test (Impact was Slightly Offset to Right) Figure 5.3. Finite Element Model of Dual Slip-Base Sign Support System Figure 5.4. Finite Element Model of Dual Sign Support System for Slip-Base Calibration Figure 5.5. Time-Sequence Comparison of Simulation and Test Results on Dual-Support Slip-Base System Figure mph Impact of Dual Sign Support System with Plywood Sign Panel Figure 5.7. Finite Element Model of the Single Slip-Base Sign Support System Figure mph Impact of Single Support 4-ft 4-ft Plywood Sign Panel Figure mph Impact of Single Support 4-ft 4-ft Aluminum Sign Panel Figure mph Impact of 4-ft 4-ft Plywood Sign Panel Figure mph Impact of 4-ft 4-ft Plywood Sign Panel Figure mph Impact of 4-ft 4-ft Plywood Sign Panel Mounted at 10 ft Figure 7.1. Recommended Wood Post and Wood Block Modified Thrie-Beam System Figure 7.2. Concrete Parapet with Tubular Steel Rail and Elastomeric Offset Blocks Figure 7.3. Concrete Parapet with Tubular Steel Rail and Collapsible Pipe Spacers Figure mph Impact of Sign Support with 10-ft Mounting Height x
11 LIST OF TABLES Page Table 1.1. Recommended Design Impact Speeds for Passenger Vehicle Testing of Roadside Safety Features Table 2.1. Event Time-Sequence Comparison of Modified Thrie-Beam Simulation and Test Table 2.2. Damages to the Posts and the Guardrails after Crash Test and Model Simulation Table 3.1. Comparison of Vehicle Positions with Respect to the Guardrail after the Impact Table 3.2. Post Impact Conditions in Crash Test and Model Simulation Table 4.1. Occupant Risk Analysis of 62 mph and 85 mph Impact Simulations Table 4.2. Occupant Risk Analysis from Test and Simulation Results Table 4.3. Occupant Risk Analysis from 62 mph and 85 mph Impacts with NJ Barrier Table 4.4. Occupant Risk Analysis from 62 mph and 85 mph Impact with SSB xi
12
13 CHAPTER 1. INTRODUCTION 1.1 BACKGROUND The Texas Department of Transportation (TxDOT) is embarking on a multi-decade effort to expand the state s transportation system. TxDOT has expressed an interest in using very high design speeds (above 80 mph) for some of these facilities to promote faster and more efficient travel within the state. Currently, under National Cooperative Highway Research Program (NCHRP) Report 350, roadside hardware is tested at a speed of 62 mph for passenger cars (1). The update to NCHRP Report 350, known as the American Association of State Highway and Transportation Officials (AASHTO) Manual for Assessing Safety Hardware (MASH), proposes to retain these same design impact speeds (2). This impact speed was derived from analyses of reconstructed crash data collected on roads with design speeds up to 70 mph. It is reasonable to expect that both posted speeds and operating speeds will greatly exceed these values on the very high-speed roadways that are being considered by TxDOT. The increased speeds will place more demand on roadside safety features. The ability of existing roadside safety features to accommodate more severe, higher energy impacts is not known. For economic reasons, many existing roadside safety features are optimized for the current design impact conditions. Consequently, they have little or no factor of safety for accommodating more severe impacts. Thus, existing safety devices may not be appropriate for use on facilities with very high design speeds, and new designs may be required. 1.2 OBJECTIVE AND SCOPE OF RESEARCH The objective of this research is to develop roadside safety hardware suitable for use on very high-speed highways. Engineering analyses and finite element simulations are used to evaluate the impact performance of selected roadside safety devices subjected to very high-speed impacts. New or modified designs may be required to address limitations identified through these various analyses efforts and accommodate the increased impact severity. The impact performance of selected devices will ultimately be evaluated through full-scale crash testing. Categories of roadside safety hardware considered under the project include bridge rail, guardrail, median barrier, and breakaway support structures. Crash cushions and guardrail end treatments have been excluded from the scope of the project. These devices are almost exclusively proprietary in design, and adaptation of these systems to very high-speed applications will be the responsibility of the manufacturers of the devices. 1.3 DESIGN CONSTRAINTS The researchers met with the project monitoring committee to establish design requirements and prioritize the development of roadside safety features for use on roadways with very high design speeds. The first step in evaluating the performance of current safety hardware 1
14 or designing new hardware for very high-speed roadways is to define the design impact requirements. Impact conditions are generally defined by vehicle type, vehicle mass, impact speed, and impact angle. Under TxDOT Research Project , Development of High-speed Roadway Design Criteria and Evaluation of Roadside Safety Features, recommended design impact speeds for roadways with very high design speeds were derived (3). Table 1.1 presents the recommended design impact speeds for passenger vehicles associated with selected roadway design speeds. Table 1.1. Recommended Design Impact Speeds for Passenger Vehicle Testing of Roadside Safety Features (3). Design Speed (mph) Impact Speed (mph) These impact speeds were based on an extrapolation of impact speed distributions derived from the reconstruction of real-world crashes for different roadway functional classes. The extrapolation assumes that the mean impact speed for a given highway functional class is proportional to the design speed of the highway. Based on this assumption, a gamma function was defined for the roadway design speeds of interest, and the design impact speed was a selected percentile of the cumulative gamma distribution. Selection of a roadway design speed thus permits the reasonable selection of a design impact speed for the testing and evaluation of roadside safety features. The roadway design speed selected for the project is 100 mph. Based on this roadway design speed and recommendations developed under Research Project , a design impact speed of 85 mph was selected for the impact performance evaluation of high-speed roadside safety hardware under this project. The impact angle distributions derived from the real-world crash data do not vary significantly with functional class. This finding would seem to indicate that impact angle does not vary significantly with design speed. This assumption is supported by the very weak correlation observed between impact speed and impact angle. Under Project , researchers found little justification for decreasing the impact angle as the impact speed increases. It was recommended that an impact angle of 25 degrees be maintained for crash testing roadside safety devices for very high-speed roadways until better data become available. Researchers agreed to follow this recommendation, and a design impact angle of 25 degrees was chosen for this project. 2
15 It was further decided that the testing and evaluation of safety features under this project will follow the guidelines of the forthcoming AASHTO MASH. Once published, MASH will supersede NCHRP Report 350 as the recommended procedures for the impact performance evaluation of roadside safety features. The design test vehicles in MASH include a 2425-lb passenger car and a 5000-lb, ½-ton, 4-door, pickup truck. Both of these vehicles are heavier than the design vehicles recommended in NCHRP Report ANALYSIS APPROACH Due to the general lack of knowledge and experience of vehicle impact performance at very high-speeds, computer simulation techniques served as an important tool in support of the evaluation of roadside hardware for very high-speed applications. The code utilized in the computer modeling efforts is LS-DYNA. LS-DYNA is a general-purpose, explicit finite element code used to analyze the nonlinear dynamic response of three-dimensional inelastic structures. This code is capable of capturing the complex interactions that occur when a vehicle impacts a roadside safety structure. In recent years, LS-DYNA has been used extensively for crashworthiness simulations of automobiles and their components by automobile manufacturers and by researchers in the roadside safety community in the design and evaluation of roadside safety features. Several finite element vehicle models have been developed for use with LS-DYNA, including a 4409-lb pickup truck and 1975-lb passenger car, which are the two design test vehicles specified in NCHRP Report 350. FHWA is funding the development of vehicle models that conform to the specifications of the new design vehicles recommended in MASH, but they were not available during the first year of the project. Consequently, existing vehicle models were used to provide an initial assessment of the impact performance of selected roadside safety features evaluated for very high-speed applications. Finite element models of the selected roadside safety devices were developed under the project. Full-scale crash tests provided a level of validation for models of existing devices. Since this testing was typically performed in accordance with NCHRP Report 350, the impact speeds were limited to 62 mph. There was no test data available to validate the hardware models for very high-speed impacts. Thus, caution needs to be exercised when extrapolating the use of these models for very high-speed applications. The finite element hardware and vehicle models were being used to conduct simulated crash tests following the selected impact conditions to assess the ability of the selected devices to meet safety performance guidelines for very high-speed applications. The applicable evaluation criteria of MASH are used to assess performance. These include consideration of structural adequacy, vehicle stability, and occupant risk. If a hardware device exhibited unsatisfactory performance, recommendations for design modifications to address the deficiencies were developed for further consideration. Ultimately, selected hardware devices demonstrating a reasonable probability of success based on finite element impact simulations will be reviewed by TxDOT and subjected to full-scale crash testing in year two of the project. 3
16 1.5 SELECTION OF ROADSIDE SAFETY FEATURES There are many facets to the protection of motorists that encroach onto the roadside. Roadside safety hardware categories of interest include guardrail, median barrier, bridge rails, transitions, crash cushions, end treatments, and breakaway supports. Given the limited resources of the project, it was understood that not all of these device categories can be addressed. Therefore, the project monitoring panel prioritized the order in which roadside safety hardware for very high-speed roadways should be developed. The agreed upon priority is: guardrail, bridge rail, breakaway hardware, and median barrier. The design of a guardrail-to-bridge rail transition requires completion of the guardrail and bridge rail designs that will be connected to one another at bridge approaches. Since these designs are intended to be the end products of the project, a transition design will need to be addressed in a future project. Crash cushions and guardrail end treatments were excluded from the scope of the project. These devices are almost exclusively proprietary in design, and adaptation of these systems to very high-speed applications will be the responsibility of the manufacturers of the devices. When selecting specific designs to evaluate within each hardware category, consideration was given to existing systems that may have sufficient capacity to accommodate the increased severity associated with the high-speed impacts. Use of an existing system affords some basic knowledge of its function and performance, enables the finite element model to be validated against available crash test data (albeit at a lower impact speed), and provides for the economic availability of parts and materials. In addition to impact performance, other factors considered in the design and selection process include cost, maintenance/repair, and compatibility with other existing systems. Each of the prioritized hardware categories are discussed below Guardrails As stated in the AASHTO (2002) Roadside Design Guide, A roadside barrier is a longitudinal barrier used to shield motorists from natural or man-made obstacles located along either side of a traveled way (4). A barrier is typically warranted when the consequences of a vehicle leaving the traveled way and striking a fixed object or traversing a terrain feature is judged to be more severe than striking the barrier. The barrier functions by containing and either capturing or redirecting errant vehicles. Under NCHRP Project 22-14(2), the project under which the update to NCHRP Report 350 was developed, a limited number of crash tests have been conducted to assess the impact performance of W-beam guardrail when subjected to the revised impact conditions. Standard strong steel-post W-beam guardrail with routed, 8-inch deep wood offset blocks has been shown to have marginal performance when impacted by a 5000-lb pickup truck at 62 mph and 25 degrees. The W-beam rail ruptured completely through its cross section when impacted by a ¾-ton standard cab pickup truck ballasted to 5000-lb. In a subsequent test with a ½-ton, 4-door, quad-cab pickup truck, the pickup was redirected, but a vertical tear propagated through half the cross section of the W-beam. 4
17 Based on these results, standard W-beam guardrail appears to be at its performance limits under the MASH impact conditions and will not be able to accommodate the higher test impact speeds recommended for very high design speeds without modification. Other existing guardrail systems that may have sufficient added capacity to contain passenger vehicles impacting at higher speeds include the modified thrie-beam and weak-post box beam systems. The modified thrie-beam system was originally developed as a high-containment guardrail system. It successfully contained and redirected a 30,000-lb intercity bus impacting at a speed of 50 mph and an angle of 15 degrees. Subsequent testing demonstrated its ability to meet NCHRP Report 350 Test Level 4 (TL-4) impact conditions, which includes a test with an 18,000-lb single-unit truck impacting at a speed of 50 mph and an angle of 15 degrees. The thrie-beam rail has 58 percent more cross-sectional area than a W-beam rail, which gives it more structural capacity for accommodating more severe impacts. The modified thrie-beam system incorporates deep offset blocks that are designed to reduce snagging interaction between the impacting vehicle and support posts and helps keep the thrie-beam rail vertically aligned during impact to reduce the probability of vehicle climb, vaulting, and/or instability. However, structural adequacy, vehicle climb, and vehicle stability are all concerns that need to be evaluated for very high-speed impacts. The box beam guardrail system incorporates a strong tubular steel rail member supported on relatively weak steel posts. When tested under NCHRP Report 350 TL-3 conditions, the pickup truck was smoothly and stably contained and redirected. The substantial flexural and tensile strength of the tubular rail provides significant structural capacity beyond that required under NCHRP Report 350 or MASH. Additionally, the weak support posts essentially eliminate the snagging concerns that exist for strong-post systems. However, the long contact length and large deflections associated with impacts into weak-post systems can lead to an increased probability of vehicle override if there is a loss of rail height as the vehicle exits the system. Researchers need to evaluate this concern for very high-speed impacts Bridge Rails Simply stated, bridge rails are longitudinal barriers that keep vehicles from encroaching off bridge structures and encountering underlying hazards. Bridge rails are typically rigid in nature due to the lack of space on bridge structures to accommodate barrier deflection. Common types of bridge rails include continuous concrete barriers, metal rails mounted on concrete parapets, and both concrete and metal beam and post systems. TxDOT standards include various bridge rails that have been successfully tested or otherwise judged to meet the impact performance requirements of NCHRP Report 350. It is uncertain which, if any, of these rails will satisfy the increased impact speeds associated with roadways having very high design speeds. The project monitoring committee expressed a strong desire to have a concrete bridge rail alternative available for use on very high-speed roadways. Advantages of concrete over metal beam and post systems include low installation cost and low maintenance and repair needs. The low maintenance and repair character of concrete rails not only reduces the life-cycle cost associated with the rail, but also reduces exposure of 5
18 maintenance/repair personnel and potential traffic conflicts associated with temporary lane closures typically needed to perform rail repairs. Concrete median barriers that meet NCHRP Report 350 include the New Jersey, F-shape, single slope, and vertical wall. While the New Jersey profile has a long history of widespread use, it has been falling out of favor in recent years based on the realization that it can impart significant climb and instability to impacting vehicles. A vertical wall of proper height eliminates issues of vehicle instability, but will impart slightly higher decelerations and cause more damage. The performance of concrete median barriers at the significantly increased impact speeds proposed for very high design speed roadways are unknown. There is concern that the increased impact severity will result in unacceptably high acceleration levels and/or, in the case of safetyshape profiles, vehicle instability and rollover. When a New Jersey-profile concrete barrier was crash tested with a pickup truck at 100 km/h (62 mph) and 25 degrees under NCHRP Report 350, the barrier imparted significant climb, pitch, and roll to the pickup. A significant increase in impact speed could further aggravate vehicle instability and lead to rollover. While vehicle stability is not an issue for vertical concrete parapets such as the 32-inch tall T221, it is unknown whether the accelerations imparted by this bridge rail will be acceptable. The accelerations associated with high-speed impact into concrete barriers may be above the threshold of serious injury and/or result in unacceptable occupant compartment deformation to the vehicle. A barrier that has demonstrated a reasonable compromise between vehicle stability and occupant risk is the single-slope concrete barrier. TxDOT uses versions of the single-slope barrier (SSB) as both a bridge rail and median barrier. This barrier was selected for further evaluation as a possible concrete barrier design for use on very high-speed roadways Breakaway Supports It is often necessary to place signs or light support structures in close proximity to the edge of the travelway to provide information or illumination for motorists. Such structures within the clear zone are typically designed to breakaway to minimize the severity of impact. Breakaway supports can generally be classified into three broad categories: slip-base supports, frangible supports, and yielding supports. Base yielding supports typically yield and plastically deform around a vehicle and subsequently experience material failure or pullout from a socket in the ground. Concern exists regarding the crashworthiness of this category of breakaway supports when impacted at very high-speed. If the support does not fracture or readily release, it can potentially generate vehicle instability as it wraps around the front of the impacting vehicle or cause unacceptable occupant compartment deformation due to secondary contact with the roof and/or windshield of the vehicle. In a slip-base system, two plates are clamped together using three or four slip bolts. Upon impact of the support post, the slip bolts are pushed out of their slots, and the upper plate 6
19 attached to the support is free to move relative to the fixed lower foundation plate. The vehicle then travels under the rotating support structure. TxDOT uses slip-base systems for both small sign supports and large guide signs. Frangible supports breakaway by fracturing or failing components at the base of the support. Cast aluminum transformer bases and frangible anchor studs are examples of frangible breakaway structures. If these devices activate as designed, their performance should be comparable to that of slip-base supports. The performance of slip-bases may be satisfactory for passenger cars at very high-speeds. Provided the base activates as designed without collapse of the support post, the increased rotational velocity imparted to the support may be offset by the greater speed of the vehicle. In other words, although the support will be rotating faster, it may not contact the vehicle because the vehicle will be traveling faster beneath it. However, the test matrix for breakaway supports under MASH has been revised to include a high-speed test with a pickup truck in addition to a small car. Concern exists that secondary contact of the released sign support with the roof of the taller pickup truck design vehicle could lead to unacceptable occupant compartment deformation. This behavior needs to be further evaluated for very high-speed impacts Median Barrier The primary function of a median barrier is to separate opposing traffic and, thereby, reduce the probability of severe crossover crashes. Therefore, unlike roadside barriers that commonly shield motorists from discrete hazards (i.e., fixed objects), median barrier is often required along long stretches of highway. This makes the low installation cost of weak-post median barriers, such as cable barrier, very appealing. Additionally, the flexibility of these systems results in lower decelerations to an impacting vehicle, which lowers the probability of injury to occupants. However, sufficient space must be available to accommodate the greater design deflections associated with cable barrier systems. Most cable median barrier systems in use today are classified as high-tension cable barrier systems. The performance of high-tension cable barriers at the test impact speeds proposed for very high design speed roadways is unknown. However, even if these barriers cannot accommodate the increased impact severity in their current configurations, it is likely that they can be modified to do so. While associated design deflections will almost certainly increase, the expected increases in deflection can be at least partially offset through the use of reduced post spacing. Presently, all of the high-tension cable systems accepted for use on the National Highway System (NHS) are proprietary designs. Therefore, adaptation of these systems to very high-speed applications is most suitably the responsibility of the respective manufacturers. It is noted that any roadside guardrail and bridge rail systems developed under this project would also have application in medians. This is one of the reasons that the category of median barrier was given a lower priority. 7
20 The analyses of the existing hardware systems selected for evaluation for very high-speed applications are addressed in separate chapters of this report. Systems analyzed include modified thrie-beam guardrail, box beam guardrail, single slope concrete barrier, and slip-base sign supports. The report concludes with recommendations for further research and analyses under the second year of the project. 8
21 CHAPTER 2. MODIFIED THRIE-BEAM GUARDRAIL SYSTEM 2.1 BACKGROUND Thrie-beam guardrails were developed to extend the performance of strong post guardrails. The potential for rollover is reduced with the use of these guardrails due to their increased height. There are two basic types of thrie-beam guardrails: (a) standard strong steel or wood post thrie-beam and, (b) modified thrie-beam. The modified thrie-beam guardrail is the result of improvements to the standard thrie-beam and was specifically designed to reduce the rollover incidences for heavy vehicle impacts. The system is designed as SGR09b by AASHTO. This system is classified as a high containment level guardrail, which is the reason it was selected for evaluation under this project. Presented in this chapter is a brief description of the modified thrie-beam system, followed by details of the development and validation of a finite element model of the system. Also presented are the results of simulation analyses performed at an impact speed of 85 mph. 2.2 SYSTEM DESCRIPTION As shown in Figure 2.1, the modified thrie-beam guardrail system consists of 6 ft-9 inches long W6 9 steel posts, W14 22 blockouts, and 12.5 ft long sections of standard thrie-beam guardrail. Details of the thrie-beam guardrail, modified thrie-beam blockout, and the strong steel posts used for the system are shown in Figure 2.2. As shown in Figure 2.2(b), the blockouts are 22 inches deep and 5 inches wide at the flanges. The webbing of the blockout has a cutout measuring 6 inches at the bottom that angles upward at 40 degrees to the flange on which the thrie-beam is attached. This offset block design allows the lower portion of the thrie-beam and the flange of the steel offset block to bend inward during a crash, thus keeping the rail face nearly vertical in the impact zone as the posts deflect backwards. The blockout is attached to the post with four 5/8-inch diameter bolts and to the thrie-beam rail element with a single 5/8-inch diameter button head bolt without a washer under the head. The mounting height of the thrie-beam is 24 inches to the center and 34 inches to the top of the rail element. 2.3 FINITE ELEMENT MODEL DEVELOPMENT Introduction The finite element model of the modified thrie-beam system was developed to evaluate the performance of the rail for use on high-speed highways. The analysis was performed using the commercially available finite element software LS-DYNA. Dimensions of different components of the system were based on the latest specifications provided in the AASHTO Guide to Standardized Barrier Hardware. (4) The total length of the guardrail was 100 ft, not including the 37.5 ft terminals on each end. The final SGR09b model (shown in Figure 2.3) consisted of 172,796 elements and 200,109 nodes. 9


22 Figure 2.1. Typical Modified Thrie-Beam Guardrail System (SGR09b). 10
 Thrie-Beam Guardrail, (b) Modified Thrie-Beam")
23 (a) (c) (b) Figure 2.2. Details of (a) Thrie-Beam Guardrail, (b) Modified Thrie-Beam Guardrail Blockout, and (c) Strong Steel Post. 11

 in thickness and were modeled using shell elements.")

24 Figure 2.3. Finite Element Model of the Modified Thrie-Beam Guardrail System Model Details The system model was comprised of thrie-beam guardrail segments that were 12 gauge (0.105 inch) in thickness and were modeled using shell elements. Splice connections between two adjacent rails segments were modeled every 12.5 ft along the longitudinal direction. Figure 2.4 shows the splice connection model. The rail had a thrie-beam backup plate placed behind the guardrail element at each non-splice post location. The rail elements were meshed with an average element size of 0.75 inch. Figure 2.4. Model for the Thrie-Beam Rail and Splice Connection. 12


25 The bolts in the model were incorporated using beam elements for the bolt-shaft and shell elements for the bolt heads and nuts. The shell-element heads and nuts were constrained to the ends of the bolt shaft so that they could only move and rotate with the shaft. A cylindrical cover of shell elements surrounded the bolt shaft to incorporate the contact between the shaft and the edges of the rail slots. The complete bolt and nut model is shown in Figure 2.5(a). This technique of modeling bolts allows use of larger element sizes and reduces computation time when compared to modeling bolts with solid elements. The finite element model of the W14 22 blockout is shown in Figure 2.5(b) and is comprised of shell elements. (a) (b) Figure 2.5. (a) Bolt Model; and (b) Modified Thrie-Beam Guardrail Blockout. The W6X9 posts were also modeled using shell elements. The posts were embedded 46 inches in soil. Instead of using one large and continuous volume, the soil was modeled as rectangular buckets of solid elements at each post location. This helped reduce the size of the model and save computational time and cost. The rectangular soil buckets were 4 ft wide 5.8 ft long (laterally) 4.6 ft deep. These dimensions were chosen to accurately capture the post-soil interaction as the post deflected in soil. The soil was modeled using the *MAT_JOINTED_ ROCK (Type 198) material model in LS-DYNA. Figure 2.6 shows the complete post-soil model. Figure 2.6. Post-Soil Interaction Model. 13


26 To reduce the model size, and hence, the computation time and cost, the end terminals of the thrie-beam system were modeled using nonlinear springs. The force-deflection response of these springs was determined by performing a separate simulation of the end terminal model shown in Figure 2.7. This tangent end terminal model was developed in addition to the thriebeam model using similar modeling techniques to those described above. The end-terminal model was 37.5 ft long. The rail at the end of the terminal where it is attached to the standard guardrail system was pulled in a quasi-static manner by applying a linear longitudinal displacement. The resulting resistance force was measured to determine the overall forcedeflection response of the end terminal. The prescribed displacement applied to the rail end and the corresponding force-deflection response of the end terminal are shown in Figure 2.8. This response was then incorporated into the thrie-beam model by adding spring elements with the measured force-deflection properties. (a) (b) Figure 2.7. (a) Typical Tangent Terminal System; and (b) Finite Element Model of the Terminal. Displacement (in) Force (lb) 12 x Force-Disp. curve 50 ms Moving avg Time (sec) Displacement(in) (a) Figure 2.8. (a) Prescribed Displacement Curve Applied on the Terminal System; and (b) Force-Displacement Curve Obtained from the Simulation. (b) 14
27 2.4 FINITE ELEMENT VEHICLE MODEL The test matrix for longitudinal barriers in NCHRP Report 350 includes tests with an 1800-lb passenger car and a 4409-lb, ¾ ton, standard cab pickup truck. In the new MASH guidelines, the design vehicles have been changed to a 2425-lb passenger car and a 5000-lb, ½-ton, 4-door pickup truck. FHWA has funded development of a finite element model for a ½- ton, Chevrolet Silverado, 4-door, pickup truck, which meets the design test vehicle requirements of the forthcoming MASH. However, during the time the analyses were performed under this project, the new model had not been released into the public domain. Although planned, no work is currently underway to develop a finite element model for the 2425-lb small passenger car. In the absence of a valid finite element model for the MASH pickup truck vehicle, the researchers performed finite element analysis (FEA) simulations using a model of the 4409-lb pickup truck specified under NCHRP Report 350. The model used in the simulations was originally developed by the National Crash Analysis Center (NCAC) and was modified by the researchers over a period of time. Some modifications were made to the vehicle model specifically for this research project. Several vehicle characteristics were modified based on measured values of crash test vehicles representative of those used at the Texas Transportation Institute (TTI). The mass of the vehicle model was increased from 4215 lb to 4409 lb by adding mass to different vehicle parts. The overall mass distribution of the modified vehicle was verified by performing a zero-velocity simulation in which the truck reaches an equilibrium condition under gravity load. The reaction forces between the truck tires and the ground surface were obtained from the simulation and compared to the measured weight distribution from a representative test vehicle. Figure 2.9 shows the comparison between simulation and test vehicle reaction forces for all four tires. The oscillation in the simulation forces results from the sudden application of gravity, which causes the vehicle suspension to oscillate as it approaches a steady state response. As can be seen from the figure, a reasonable correlation was achieved between the simulation and test vehicle mass distribution. Some of the mass increase in the vehicle model was achieved by adding a nodal rigid body to the vehicle. The location and inertia of this nodal rigid body was adjusted to obtain a vehicle center-of-gravity (CG) height of 26.6 inches and to match the overall inertial properties of the vehicle model to measured values. The researchers also added an explicit model of the accelerometer assembly used at TTI. The use of this explicit accelerometer assembly model increases the reliability of the acceleration-time signal and, hence, the occupant risk indices calculated using the simulation results. Figure 2.10 shows the accelerometer assembly used in the vehicle model. The explicit accelerometer model incorporated the steel plates used in the actual test accelerometer assembly to mount the accelerometer box. The plates were attached to the vehicle using nodal constraints at the locations of bolts and welds in the actual crash test accelerometer assembly. An accelerometer element was placed inside a box comprised of solid elements as shown in Figure The mass of the plates and the box in the model corresponded to those of the actual accelerometer assembly used by TTI. 15

28 Figure 2.9. Comparison of Overall Weight Distribution of Vehicle Model with Crash Test Vehicle. Figure Explicit Accelerometer Assembly Model. 16
29 2.5 MODEL VALIDATION The modified thrie-beam system model was validated by performing a full-scale vehicle impact simulation and comparing the results to a previously conducted crash test of the system. The crash test used for the validation exercise was conducted at TTI under NCHRP Report 350 test level 3 impact conditions (5). The test article was a 100-ft long SGR09b modified thrie-beam guardrail system. At each end of the modified thrie-beam system, a 6 ft-3 inches long thrie-beam to W-beam transition section transitioned the thrie-beam to a 12.5-ft long section of standard steel-post W-beam guardrail that tapered in height down to a 37.5-ft long end terminal system. A 1989 Chevrolet C2500 pickup truck with a gross static weight of 4577 lb was used for the test. The heights to the upper and lower edges of the vehicle bumper were 26.4 inches and 18.5 inches, respectively. The vehicle impacted the modified thrie-beam guardrail at a speed of 62.3 mph and at an angle of 25.1 degrees. The vehicle was successfully contained and redirected by the guardrail system. The entire left wheel assembly of the vehicle was torn from the axle at sec. The vehicle became parallel with the installation at sec and exited the guardrail at 0.56 sec. The maximum dynamic and permanent deformations of the guardrail were 47.2 inches and 24.0 inches, respectively Vehicle Impact Simulation To validate the modified thrie-beam model, an impact simulation was performed using impact conditions similar to those used in the full-scale crash test described above. A finite element model of the Chevrolet C2500 pickup truck model, ballasted to a mass of 4520 lb, was used to impact the modified thrie-beam system model. The tire of the vehicle model was modified by the researchers to better match the stiffness and thickness of an actual LT 245/75 R16E type tire. As with all numerical models, certain assumptions and limitations are associated with the vehicle model used in the simulations. Failure of suspension components such as spindles, axles, control arms, tie rods, ball-joints, etc., and certain complex phenomenon such as sheet metal tearing and tire blowout are not incorporated in the model. While some of these limitations can possibly influence the outcome of the simulation analysis, a proper understanding of the capabilities and limitations of the models can produce valuable information useful for evaluating impact performance of the roadside safety device. As in the crash test, the vehicle model impacted the modified thrie-beam guardrail system model at a speed of 62.3 mph and an angle of 25.1 degrees. The vehicle in the simulation was successfully redirected, and the overall results matched closely with the crash test results. A detailed comparison of the simulation and test results is presented below. 17
30 Event Time-Sequence Comparison Figure 2.11 shows a time-sequence comparison between the simulation and crash test results. As can be seen from this figure, there is a reasonable overall correlation between the test and simulation results. It should be noted that at sec in the crash test, the left front wheel assembly failed and detached from the axle after snagging on post 17. In the simulation, balljoint failure was not incorporated into the model, and consequently, the wheel did not detach from the axle. Thus, in the simulation, the impact of the wheel with post 17 resulted in a greater loss of kinetic energy and reduction in vehicle velocity than in the crash test. A descriptive timesequence comparison is presented in Table 2.1 along with the maximum roll, pitch, and yaw angles observed in the simulation and test. The maximum roll angle recorded in the crash test was 4 degrees compared to 6 degrees in the simulation. The maximum pitch angles in test and simulation were 7 and 3.4 degrees, respectively. The maximum yaw angles in the test and simulation were 36 and 34.3 degrees, respectively. Figure 2.12 presents a comparison of vehicle yaw, pitch, and roll angles as a function of time Guardrail Damage Table 2.2 presents a comparison of post deformations and rail deflection. Three of the posts in the crash test were severely twisted while four were severely twisted in the simulation. Seven of the posts deflected laterally in both the simulation and test. One of the posts detached from the rail in the crash test while three were detached in the simulation. The maximum dynamic and permanent deflections of the rail in the simulation were in reasonable agreement with those measured in the crash test Vehicle Damage The vehicle sustained moderate damage in both the crash test and simulation. In the crash test, the left front wheel assembly detached from the vehicle s axle. In the simulation, the wheel assembly remained attached to the axle due to the lack of ball-joint failure in the suspension model as previously discussed. A comparison of the damaged vehicle profile in the simulation and the crash test is shown in Figure


31 Post sec sec sec sec Figure Sequential Photographs of Modified Thrie-Beam Simulation and Test. 19


32 0.240 sec sec sec sec Figure Sequential Photographs of Modified Thrie-Beam Simulation and Test (Continued). 20
33 Table 2.1. Event Time-Sequence Comparison of Modified Thrie-Beam Simulation and Test. Incident Crash test Model Simulation Left front tire made contact with flange sec sec and face of post 16 Post 17 started to rotate about vertical sec sec axis Post 18 started to rotate about vertical sec sec axis Left front assembly caught flange at post sec sec 17 (Impact wheel detached) Front of vehicle reached post 18 and.232 sec sec Rear of the vehicle made contact with.232 sec sec thrie-beam rail Vehicle became parallel with the.264 sec installation Velocity=46.2 mph Post Impact Behavior Max Roll angle (degree) Max Pitch angle (degree) Max Yaw angle (degree) Angular Displacement(degree) ROLL: Crash Test PITCH: Crash Test YAW: Crash Test ROLL: Simulation PITCH: Simulation YAW: Simulation Time (sec) Figure Vehicle Angular Displacement Comparison of Modified Thrie-beam Simulation and Test sec Velocity=28.8 mph 21
 4 (posts 16,17,18, and19) Deflected laterally 7 (posts 14-20) 7 (posts 14-20) Detached 1 (post 17) 3 (posts")
 (b) Figure 2.13. Vehicle after (a) Simulation; and (b) Crash Test 471470-30. 2.5.")
34 Table 2.2. Damages to the Posts and the Guardrails after Crash Test and Model Simulation. Incidents Crash Test Model Simulation Posts Severely twisted 3 (posts 16,17, and 18) 4 (posts 16,17,18, and19) Deflected laterally 7 (posts 14-20) 7 (posts 14-20) Detached 1 (post 17) 3 (posts 16,17,18) Guardrail Maximum dynamic deflection Maximum permanent deflection 3.35 ft 3.43 ft 2.00 ft 2.49 ft (a) (b) Figure Vehicle after (a) Simulation; and (b) Crash Test Summary of Model Evaluation Results of the simulation performed with the modified thrie-beam guardrail model showed acceptable correlation with crash test data. The maximum permanent and dynamic deflections of the rail in the simulation and test were reasonably matched. The yaw and pitch angles of the vehicle also matched reasonably well. There were some differences in the trend of the roll angles. However, the magnitude of the roll angles was small in both the test and the simulation. The front left wheel assembly failed and detached from the vehicle in the crash test. The failure of suspension components is not included in the public domain model used in the simulation, and thus, the detachment of the wheel assembly was not observed in the simulation. This caused some differences in vehicle velocity after the time at which the snagging contact occurred. However, since a reasonable overall correlation was achieved, the model was considered sufficiently valid to continue with the evaluation of the modified thrie-beam performance under high-speed impacts. 22
 for guardrail systems impacted at higher speeds.")
35 2.6 HIGH-SPEED IMPACT PERFORMANCE OF MODIFIED THRIE-BEAM GUARDRAIL Having validated the modified thrie-beam model, the researchers performed vehicle impact simulations at a speed of 85 mph to evaluate use of the guardrail system for high-speed highways. Currently, there is no guidance available on selecting the critical impact point (CIP) for guardrail systems impacted at higher speeds. Guardrail systems exhibit some sensitivity to impact point due to resulting differences in the interactions of the vehicle tires with the posts. Significant post-wheel interaction can promote vehicle climb and/or instability. In the absence of clear guidance on selecting the CIP for higher speeds, the researchers performed two impact simulations. In the first simulation, the vehicle impacted the guardrail system mid-span between posts. In the second simulation, the vehicle impacted the system at a post location. The results of the simulation analyses are presented next Impact Mid-Span between Posts In this simulation, a 4520-lb Chevrolet C2500 pickup truck vehicle model impacted the modified thrie-beam system model at its center point approximately mid-span between posts at a speed of 85 mph and an angle of 25 degrees as shown in Figure The results of the simulation analysis are shown in Figure It can be seen that the vehicle was successfully contained and redirected by the guardrail. The maximum dynamic and permanent deflections of the rail were 4.83 ft and 2.58 ft, respectively. Researchers noted that the vehicle exhibited significant climb as it was being redirected (see 0.3 sec and 0.45 sec in Figure 2.15). The deformations of the posts and the blockouts are shown in Figure It was observed that some of the blockouts collapsed and bent along the deep web, while the posts failed in a lateral torsional bending mode. Figure Finite Element Model of 85 mph Impact at Center Post Location of Modified Thrie-Beam System. 23


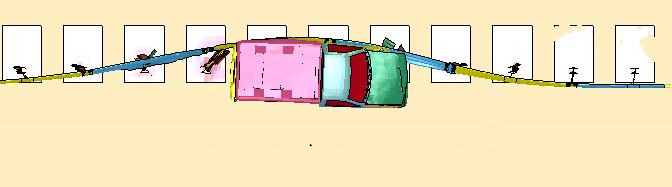


36 0.0 sec 0.15 sec 0.3 sec 0.45 sec 0.6 sec Figure Simulation Results for High-Speed Impact of Modified Thrie-Beam System Mid-Span between Posts. 24


37 Post twisting Blockout collapsing Figure Deformation of the Steel Posts and Blockouts. The researchers also evaluated the plastic strains in the thrie-beam rail to identify any areas of high strain that might indicate the possibility of rail rupture. Figure 2.17 shows the contours of the plastic strain in the rail for the deformed rail segments. As can be seen in the figure, no significant areas of high strain were identified. The highest observed values of plastic strain were in the range of 10 percent to 14 percent, which is less than the ductility of the thriebeam steel. This result implies that the increase in tensile force in the rail due to the higher impact speed does not pose a risk of exceeding the tensile capacity of the thrie-beam rail. Figure Contours of Plastic Strain in the Thrie-beam Segment. 25
. The simulation model setup is shown in Figure 2.18.")
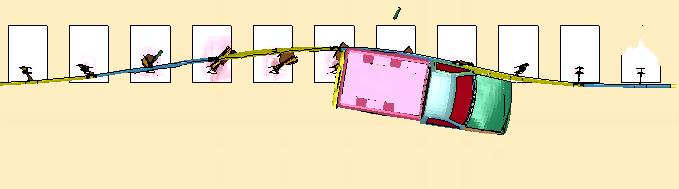
38 2.6.2 Impact at Post Location In the next simulation, the impact point of the vehicle was shifted upstream, close to the one-third point of the installation. The impact took place at a post location, and the impact speed and angle were the same as in the previous simulation (i.e., 85 mph and 25 degrees). The simulation model setup is shown in Figure Figure Finite Element Model of 85 mph Impact at One-Third Point of Installation at Post Location. The results of the simulation analysis are shown in Figure It can be seen in the figure that by changing the impact point, the vehicle exhibits a higher climb than in the previous impact simulation. In this case, the vehicle climbs above the rail and is not contained and redirected by the guardrail. The simulation was terminated at 0.47 sec when the vehicle was overriding the guardrail. The tires of the vehicle interacted with posts that were deformed and bent in their path. This imparted a vertical acceleration to the vehicle, which subsequently enabled the vehicle to climb the rail. The comparison of the two simulation results highlights the sensitivity of the performance of the modified thrie-beam guardrail to impact location. This sensitivity is heightened by the high impact speed. 2.7 SUMMARY AND CONCLUSIONS To evaluate the performance of modified thrie-beam guardrail under high-speed impacts, the researchers developed a finite element model of the system. The model was validated by performing a vehicle impact simulation and comparing the simulation results to the results of a full-scale crash test that was performed in accordance with NCHRP Report 350 Test Level 3. Results of the simulation showed reasonable correlation with the crash test data. The modified thrie-beam model showed the performance of the modified thrie-beam under high-speed impacts. 26


39 0.0 sec 0.34 sec 0.11 sec 0.45 sec 0.22 sec Figure Simulation Results of 85 mph Impact at One-Third Point of Installation at Post Location. 27
40 Due to the lack of any guidance on selecting the critical impact point for guardrail systems impacted at higher speeds, the researchers performed two high-speed simulations at different locations. In the first simulation, the vehicle impacted the guardrail system at its center, mid-span between posts. In the second simulation, the vehicle impacted the one-third point of the system length, at a post location. The difference in tire-post interaction arising from the two different impact points led to different outcomes. In the case of impact at mid-span between posts, the vehicle experienced some climb but was successfully contained and redirected. In the case of impact at a post location, the vehicle climbed on top of the guardrail system. Researchers noted that in a crash test, it is not uncommon for the front impact-side tire to blowout, or for the wheel to detach from the vehicle due to snagging interaction with a post. The tire model used in the simulation analyses does not have the ability to blowout nor does the wheel have the ability to detach from the vehicle due to lack of suspension failure in the vehicle model. Should these events occur, the vehicle would be expected to have reduced climb compared to that predicted in the simulation. Thus, it is difficult to know with a high degree of confidence that a crash test at 85 mph will result in the same amount of vehicle climb observed in the simulation. Nonetheless, the predicted climbing behavior should be carefully considered. It was observed in the high-speed simulations that the steel blockouts deformed and collapsed as the vehicle progressed through the system. Due to the collapse of the blockout, the offset distance between the rail and posts was reduced. This led to greater than desired wheel interaction with the posts. Simulation results also showed that the steel posts failed by twisting in a lateral torsional bending mode. The front wheel assembly was observed riding over the twisted and bent posts, which in turn imparted a vertical acceleration to the vehicle that helped it climb over the rail. Based on the results of the high-speed simulation analyses and consideration of the issues discussed above, the researchers recommend that design modifications to the modified thrie-beam system should be investigated to see if the climbing behavior can be mitigated. The objective of these design modifications will be to prevent the collapse of the blockouts and to reduce the interaction between the wheels and the posts. 2.8 RECOMMENDATIONS To maintain the offset distance between the rail and posts and, thereby, reduce the severity of any wheel-post interaction, it is recommended that the steel posts and blockouts be replaced with wood alternatives. Replacing the steel blockout with a wood blockout would prevent the collapse of the blockouts during impact, thus maintaining the desired spacing between the vehicle and the posts. Replacing the steel posts with wood posts eliminates the lateral torsional bending mode of failure of the posts. It is theorized that this will permit the posts to displace further laterally through the soil and further reduce the interaction between the wheels and posts. However, there is a possibility that the high-speed impact will promote fracture of the wood posts, which could lead to pocketing of the vehicle in the rail system. A simulation to evaluate the recommended design changes is currently being performed. If a significant reduction in vehicle climb is observed, the researchers will recommend testing of modified thrie-beam guardrail with wood posts and blockouts at the 85 mph design impact speed selected for the project. 28

41 CHAPTER 3. BOX BEAM GUARDRAIL SYSTEM 3.1 INTRODUCTION The box beam guardrail system can be classified as a weak post system. Weak post systems are generally very flexible and have large dynamic deflections. The weak posts of the box beam guardrail serve primarily to support the rail elements at their proper elevation for contact with an impacting vehicle. The posts are readily detached from the rail and dissipate little energy as they yield to the impacting vehicle and are pushed to the ground. Provided there is adequate space to accommodate the large lateral deflection, the box beam system imposes lower deceleration on the impacting vehicle, which makes it less likely to cause occupant injury or vehicle instability. 3.2 SYSTEM DESCRIPTION As shown in Figure 3.1, the box beam guardrail system consists of 5.25-ft long S3 5.7 steel posts spaced 6 ft apart. A 4.5-inch long L /8 inch shelf angle is attached to the post using a 0.5-inch diameter 1.5-inch long hex-head bolt with washer and nut. A TS6 6 3/16 inch tubular steel box beam rail element is attached to the support angle with a 3/8- inch diameter hex-head bolt as shown in Figure 3.2(a). The box beam rail is mounted at a height of 24 inches from ground level. As shown in Figure 3.2(b), an 8-inch 0.25-inch 24-inch soilplate is connected to the post below ground level. Two 5.25-inch wide 5/8-inch thick inch long splice plates are used to connect the 36-ft long box beam sections. The splice connection is shown in Figure 3.2(c). Figure 3.1. Typical Box Beam Guardrail System. 29
42 (a) (b) (c) Figure 3.2. Detailed Drawings of (a) Box Beam Guardrail System; (b) Weak Steel Post; and (c) Splice Connections. 30


43 3.3 FINITE ELEMENT MODEL DEVELOPMENT Introduction The finite element model of the box beam guardrail system was developed to evaluate the performance of the rail for use on high-speed highways. Researchers performed the analysis using the commercially available finite element software LS-DYNA. Dimensions of different components of the system were based on the latest specifications provided in the AASHTO Guide to Standardized Barrier Hardware. The total length of the box beam guardrail model was 150 ft with turned-down terminals on each end. The final box-beam system model (shown in Figure 3.3) is comprised of 201,988 elements and 234,611 nodes. Figure 3.3. Finite Element Model for the Box Beam Guardrail System Model Details The 36-ft long box beam rail segments were modeled using shell elements with a thickness of 3/16 inch. Splice connections between two rails were modeled every 36 ft (see Figure 3.4). The bolts in the connection between the splice plates and the rail elements were not modeled explicitly to avoid contact instabilities between bolt-shafts and bolt-hole edges. Instead, nodal constraints were used to model the bolted splice connections. The nodes on the edge of a specific bolt-hole in the splice plate were constrained to the edge nodes of the corresponding bolt-hole on the box beam rail. The constraints allowed relative rotation of the nodes and only tied the translational degrees of freedom. Since these bolts are not expected to shear or plastically deform, this assumption captures the bolt behavior in a reasonably accurate manner. Nodal constraints Figure 3.4. Model for the Splice Plate Connection. 31

44 The L /8-inch shelf angle support bracket and S3 5.7 structural steel posts were modeled using shell elements as shown in Figure 3.5. The bolt connecting the support bracket to the post was modeled using a combination of beam and shell elements in a manner similar to that described in Chapter 2 for the bolts used in the modified thrie-beam system model. Figure 3.5. Model for the Connection between Rail, Supporting Bracket, and Post. The support bracket and the box beam are connected using a 3/8-inch diameter (FB 08a) bolt. This bolt is designed to shear and release the rail from the post during impact. Shearing of metal is a complex phenomenon that is difficult to model explicitly using finite element modeling techniques. Instead, spot weld type constraints are commonly used to model the shear failure. The shear failure of the 3/8-inch diameter rail connection bolt was modeled using the CONSTRAINED_SPOTWELD_FILTERED_FORCE feature in LS-DYNA. The soil in the model was incorporated as 2-ft wide 2-ft long 4.36-ft deep rectangular buckets of solid elements around each post as shown in Figure 3.6. Figure 3.6(b) shows the soil plate attached to the post. The finite element model of the turned-down end-terminal of the box-beam system is shown in Figure 3.7. It was modeled on both sides of the 150-ft long box beam guardrail. The end of the rail near the ground was fully constrained to provide the anchorage. 32
 Soil Bucket and (b) Soil Plate. Rail constraints Figure 3.7.")


45 (a) Soil and post (b) Soil plate attached to post Figure 3.6. Model for (a) Soil Bucket and (b) Soil Plate. Rail constraints Figure 3.7. Model of the Turned-Down End-Terminal. Steel components such as box beam rail, splice plates, and support brackets were modeled using an elastic-plastic material representation. The material properties of the box beam rail correspond to AASHTO A-500 Grade B steel. The material properties of the posts, welded soil plates, splice plates, and supporting brackets correspond to AASHTO M270M (ASTM A709) grade 36 steel. The soil was modeled using the jointed rock material model in LS-DYNA. 33
46 3.3.3 Model Validation The box beam system model was validated by performing a full-scale vehicle impact simulation and comparing the results to the previously conducted crash test of the system. The crash test used for the validation exercise was conducted at TTI under NCHRP Report 350 test level 3 impact conditions (5). The test article consisted of a 150-ft long section of box beam guardrail with a 49-ft long telescoping tube terminal on the impact end and a turned-down terminal on the downstream end. A 1989 Chevrolet C2500 pickup truck with a test inertia weight of 4409 lb and a gross static weight of 4577 lb was used for the test. The heights of the upper and lower edges of the vehicle bumper were 25.2 inches and 16.3 inches, respectively. The vehicle impacted the guardrail section 2.95 ft upstream of post 15 at a speed of 59.2 mph and an angle of 25.5 degrees. The vehicle was successfully contained and redirected by the box beam guardrail system. After impact, the vehicle became parallel with the installation at sec while traveling at a speed of 45.4 mph. The vehicle lost contact with the installation at sec, traveling at a speed of 27.8 mph and at an exit angle of approximately 0.7 degrees toward the guardrail. The maximum dynamic and permanent deflections of the guardrail were 45.3 inches and 29.1 inches, respectively Vehicle Impact Simulation Event Time-Sequence Comparison. A time-sequence comparison between the simulation and test results is shown in Figure 3.8. As can be seen from the figure, there is a reasonable overall correlation between the test and simulation results. However, in the simulation, the vehicle lost contact with the rail slightly earlier than in the crash test. A descriptive time-sequence comparison is also presented in Table 3.1 along with the maximum roll, pitch, and yaw angles observed in the simulation and test Vehicle Kinematics. The comparisons of vehicle yaw, pitch, and roll angles as a function of time are presented in Figure 3.9. It can be seen that the vehicle s yaw, roll, and pitch angles obtained from the simulation closely follow the trend observed in the crash test. However, after losing contact with the guardrail, the vehicle s yaw in the crash test was toward the guardrail, whereas in the simulation, the vehicle continued to move away from the rail. This might be due to differences in friction and drag during the later stages of the impact. Because the deviation occurs after exit of the vehicle from the guardrail, it is not considered to be of significant consequence in terms of the validity of the model for evaluating containment and redirection under high-speed impact conditions. 34


47 Post sec sec sec sec Figure 3.8. Sequential Photographs for SGR03 Model Simulation and Test


48 0.375 sec sec sec sec Figure 3.8. Sequential Photographs for SGR03 Model Simulation and Test (Continued). 36
49 Table 3.1. Comparison of Vehicle Positions with Respect to the Guardrail after the Impact. Incident Crash Test Model Simulation Right front tire made contact with flange and sec sec face of post 15 Right front tire made contact with post sec sec Right front tire made contact with post sec sec Right front tire made contact with post sec 0.30 sec Vehicle became parallel with the installation sec (45.4 mph) sec (39.8 mph) The vehicle contacted post sec sec Maximum dynamic deflection occurred at sec 0.35 sec Vehicle lost contact with the installation sec (27.8 mph) 0.63 sec (33.8 mph) Post impact behavior Max roll angle (degree) Max pitch angle (degree) Max yaw angle (degree) Angular Displacement(degree) ROLL: Crash Test PITCH: Crash Test -30 YAW: Crash Test ROLL: Simulation -35 PITCH: Simulation YAW: Simulation Time (sec) Figure 3.9. Vehicle Angular Displacement Comparison of Box Beam Guardrail Simulation and Test. 37


50 Damage to Posts and Guardrail. In Table 3.2, comparisons of the post deformations and rail deflection are presented. Eleven of the posts deflected laterally in both the simulation and test. Five of the posts were bent to ground level in both test and simulation. Five of the posts were detached in the crash test while seven posts were detached in the simulation. The maximum permanent deflection of the rail was in close agreement with the crash test, but the maximum dynamic deflection was lower in the simulation. Table 3.2. Post Impact Conditions in Crash Test and Model Simulation. Incident Crash Test Model Simulation Posts bent laterally 11 (12 ~ 22) 11 (12-22) Posts bent to ground level 5 (16-20) 5 (15-19) Posts detached 5 (16-20) 7 (13-19) Maximum dynamic deflection 3.77 ft 2.86 ft Maximum permanent deflection 2.46 ft 2.29 ft Vehicle Damage. As shown in Figure 3.10, the vehicle sustained moderate damage in both the crash test and the simulation. The lower A-arm, stabilizer bar, tie rod ends, front and rear quarter panel, door, and front bumper on the impact side were damaged in both cases. (a) (b) Figure Vehicle after (a) Simulation; and (b) Crash Test Summary of Model Validation Results of the simulation performed with the box beam guardrail system showed reasonable overall correlation with the crash test data. The maximum permanent deflection of the rail showed good agreement, but there were some differences noted in the maximum dynamic deflection of the rail. The vehicle yaw, pitch, and roll angles matched reasonably well with the test results. Near the end of the crash event, some differences in vehicle yaw were observed. However, the differences were not considered significant to the validity of the model given that the deviation occurred after the vehicle exited the system. Damage characteristics of the test article and the test vehicle were very similar in the test and simulation. Based on this assessment, the model was considered sufficiently valid to proceed with the evaluation of the performance of the box beam guardrail under high-speed impact conditions. 38

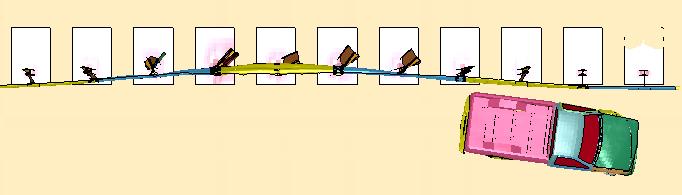
51 3.4 HIGH-SPEED SIMULATION WITH BOX BEAM GUARDRAIL SYSTEM After validation of the box beam system model, the researchers evaluated the performance of the box beam guardrail for an 85 mph impact speed. A simulation was performed with the 4519-lb pickup truck impacting the barrier at a speed of 85 mph and an angle of 25 degrees. The impact point was at the center post of the box beam guardrail system as shown in Figure This figure also shows an isometric view of the model setup. Figure System Model for High-Speed Impact of Box Beam Guardrail. Results of the simulation are shown in Figure As can be seen from the figure, the vehicle was parallel to the box beam guardrail at 0.23 sec. By 0.34 sec, the vehicle had been redirected and was beginning to exit the system. However, due to the large deflection of the system at the higher speed impact, all of the posts downstream of the vehicle were detached from the rail, and the end of the rail was only constrained by the turned-down end-terminal. An enlarged image of the rail deformation at 0.45 sec is shown in Figure As can be seen, the posts in front of the vehicle have detached from the rail, and the lateral movement of the rail is only constrained by the end-terminal. This result shows that a longer length of box beam system has to be simulated to more fully evaluate the impact performance of the system in absence of the influence of the end-terminal constraints. Such a simulation was attempted, but the analysis terminated prematurely due to numerical instabilities. The results are being debugged at the writing of this report, and the results of any additional simulations will be documented in future reports. 39


52 0.0 sec 0.11 sec 0.23 sec 0.34 sec 0.45 sec Figure Simulation Results of 85 mph Impact of Box Beam Rail. Figure Detachment of Posts from Rail near the End-Terminal. 40

. Once the vehicle has been redirected and becomes parallel to the rail, the lateral force applied to rail drops to near zero.")
53 However, some observations can be gleaned from the current simulation. The weak-post box beam guardrail experiences large lateral deflection when subjected to the high-speed impact. Even though the vehicle has been redirected, successful containment of the vehicle is doubtful because as the vehicle is redirected, the rail becomes detached from a significant number of posts both in front of and behind the vehicle. During the redirection phase, the lateral force applied by the vehicle engages the rail and prevents it from dropping in height as shown at 0.35 sec in Figure 3.14(a). Once the vehicle has been redirected and becomes parallel to the rail, the lateral force applied to rail drops to near zero. After losing support from the vehicle, the long length of unsupported box beam rail begins to drop in height as shown at 0.45 sec in Figure 3.14(b). In fact, between the time of 0.35 sec and 0.45 sec, the rail drops 13.4 inches to a height that is below the midpoint of the front wheel. Therefore, even though a longer simulation runtime is needed to verify the outcome, it seems highly probable that the vehicle will at least partially override the system sec 0.45 sec (a) (b) Figure The Rail (a) Redirects the Vehicle and (b) Drops Down. 3.5 CONCLUSIONS To evaluate the performance of box beam guardrail under high-speed impacts, the researchers developed a finite element model of the system. The model was validated by performing a vehicle impact simulation and comparing the simulation results to the results of a full-scale crash test that was performed in accordance with NCHRP Report 350 Test Level 3. Results of the simulation showed reasonable correlation with the crash test data. The box beam model was subsequently used to evaluate the performance of box beam guardrail under highspeed impacts conditions. In the high-speed impact simulation, the vehicle was redirected by the box beam rail. However, once the vehicle started to attempt to exit the system, the long unsupported span of box beam rail started to drop in height. This drop in height raised concerns that the vehicle may at least partially override the rail prior to fully exiting the system. 41
54 3.6 RECOMMENDATIONS A high-speed simulation with a longer run of box-beam rail will verify whether or not the vehicle will override the box beam rail. If the vehicle does override the rail as seems likely, the researchers will investigate increasing the strength of the post-rail connection to reduce the number of posts that release from the rail during redirection of the vehicle. However, there are limitations to the extent to which the post connection strength can be increased. Too much of an increase in the strength of the post connection can hinder release of the rail from the post, leading to a drop in rail height as the posts are bent down. Thus, any increase in post connection strength will have to be carefully balanced to prevent too many posts from detaching while, at the same time, allowing timely release of the rail from the posts as they bend in the impact region. 42
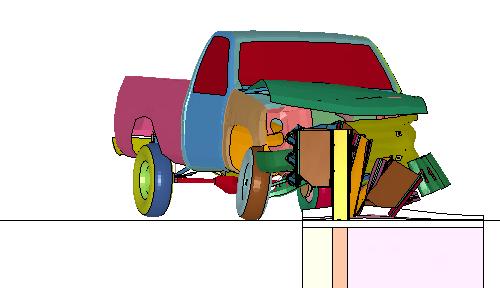
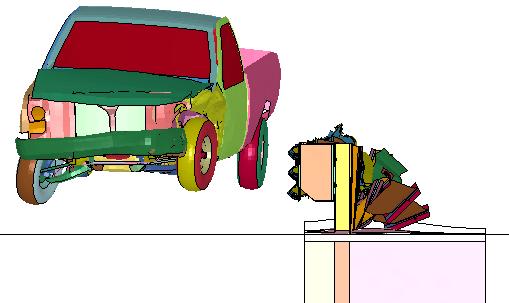
55 CHAPTER 4. CONCRETE BARRIER SYSTEMS 4.1 INTRODUCTION Concrete barriers may be used as bridge rails, median barriers, and roadside barriers. The rigid nature of these concrete barriers results in essentially no dynamic deflection. Thus, vehicle deceleration rates and probability of injury are greater for concrete barriers than for more flexible systems. Common concrete barrier profiles include the New Jersey (NJ) safety shape, F-shape, constant or single slope, and vertical wall. While the New Jersey profile has a long history of widespread use, it has been falling out of favor in recent years based on the realization that it can impart significant climb and instability to impacting vehicles. In general, the safety shaped barriers induce greater vehicular instability compared to the single slope barriers. The toe of the safety shaped barrier provides lift to the vehicle, thus resulting in greater vehicle climb and instability. The more vertical the face of the single-slope barrier, the more it tends to stabilize the vehicle during impact. While the single-slope barrier results in improved vehicular stability compared to safety shaped barriers, lateral decelerations and occupant compartment deformation (OCD) tend to be more severe. 4.2 ANALYSIS WITH PICKUP TRUCK Previous testing with 4409-lb pickup trucks impacting safety-shaped barriers at 62 mph has shown high vehicle climb and instability. At 85 mph, the safety-shaped barrier should result in even higher vehicular instability, and thus, the performance of the barrier was expected to be unacceptable or marginal. Due to this, only single-slope barrier was selected for evaluation at high-speed impacts with the pickup trucks. Several FEA simulations were performed to evaluate the performance of the single-slope barrier under high-speed impact conditions. Simulations were performed with the 4409-lb vehicle at 62 mph and 85 mph impact speeds. These simulations were compared to evaluate the effect of impact speed on vehicle stability, vehicle accelerations (i.e., occupant risk), and vehicle OCD. The single-slope barrier was modeled using a rigid material representation. The barrier was 32 inches tall and had a slope of 10.8 degrees from vertical on the impact face. In the initial simulation, the modified 4409-lb Chevrolet C2500 pickup truck vehicle impacted the single-slope barrier at a speed of 62 mph and an angle of 25 degrees. A simulation was also performed with the same vehicle model impacting the single-slope barrier at a speed of 85 mph. The finite element model is shown in Figure

 and the ride-down acceleration (RA) increase for the 85 mph impact.")
56 Figure 4.1. Finite Element Model of C2500 Pickup Impacting Single-Slope Barrier. Figure 4.2 shows a time sequence comparison of the 62 mph and 85 mph impacts. It can be seen that the vehicle impacting the barrier at 85 mph experiences greater climb, but is redirected in a stable manner. The occupant risk factors calculated from the two impact simulations are shown in Table 4.1. As expected, the occupant impact velocity (OIV) and the ride-down acceleration (RA) increase for the 85 mph impact. However, the values are still within the acceptable range of OIV and RA specified by MASH. Table 4.1. Occupant Risk Analysis of 62 mph and 85 mph Impact Simulations. 62 mph 85 mph Occupant Impact Velocity Longitudinal 21.3 ft/s 26.9 ft/s Lateral 26.2 ft/s 34.1 ft/s Ridedown Acceleration Longitudinal -8.4 G G Lateral G G Figure 4.3 shows an underneath view of the vehicle deformation after impact. As expected, the impacting corner of the vehicle undergoes higher deformation in the 85 mph impact. The frame rails and the front suspension components of the vehicle are significantly deformed in the high-speed impact. Simulation results indicate that the OCD is also higher for high-speed impact. Due to the higher speed, the impacting front corner of the vehicle crushes more, and the impact front tire is shoved further rearward into the occupant compartment. This can be seen in Figures 4.4 and 4.5. Figure 4.4 shows a view of the occupant compartment, while Figure 4.5 shows the deformation of the truck floorboard for both impact speeds. 44


57 62 mph Impact 85 mph Impact 0.0 sec 0.0 sec 0.06 sec 0.06 sec 0.15 sec 0.15 sec 0.25 sec 0.25 sec Figure 4.2. Time Sequence Comparison of Pickup Impact on Single-Slope Barrier at 62 mph (Left) and 85 mph (Right). 45


58 62 mph 85 mph Figure 4.3. Vehicle Deformations for 62 mph and 85 mph Impacts. 62 mph 85 mph Figure 4.4. Occupant Compartment Deformations Due to 62 mph and 85 mph Impacts. 46


59 62 mph 85 mph Figure 4.5. Deformed Pickup Truck Floorboards after Impact. It should be noted that the vehicle model used in the simulation analyses has not been validated for deterministic evaluation of the OCD. The ability to quantitatively assess OCD may be limited due to the lack of failure modes incorporated into the vehicle model s front suspension. In an actual vehicle model, the OCD often results from vehicle components pushing into the firewall or toe pan after failure of front suspension components such as the control-arm joints, wheel attachment to spindle, etc. However, such failure mechanisms are presently missing in the latest versions of the finite element pickup truck model, and it was beyond the scope of this project to incorporate these mechanisms into the model. Consequently, the mechanism by which OCD occurs in the simulation may be different than the mechanism by which it occurs in a test vehicle. Nevertheless, the increase in OCD observed in 85 mph impact simulation is indicative of the increased impact severity and a higher probability of unacceptable occupant risk Summary of Analysis with Pickup Truck In a crash test of a 4409-lb pickup truck into a safety-shaped barrier, the vehicle experienced substantial climb and instability. Researchers believe that this behavior would be aggravated by a higher speed impact. Therefore, the concrete barrier analyses focused on the single-slope barrier, which testing has shown exhibits better vehicle stability characteristics. Due to the unavailability of a MASH-compliant pickup truck model, the researchers used a 4409-lb vehicle model to compare the performance of a single-slope concrete barrier impacted at speeds of 62 mph and 85 mph. 47
60 Results of the 85 mph impact indicate that the single-slope barrier should redirect the pickup truck in a stable manner. The occupant risk factors are expected to be higher, but would likely remain within the acceptable limits recommended in the MASH evaluation criteria. Simulation results showed much higher deformation to the vehicle s front suspension and chassis in the 85 mph impact. Although lack of suspension failure in the vehicle model may limit the validity of the model, the results indicate that OCD of the pickup truck will be marginal. However, it should be noted that recent testing with MASH design pickup trucks has shown them to have improved energy management and crush characteristics, which generally results in less OCD compared to the older NCHRP Report 350 Chevrolet C2500 vehicle. Further, the threshold for acceptable OCD has increased from approximately 6 inches in NCHRP Report 350 to 9-12 inches in MASH depending on location. Thus, it can be argued that due to better vehicle design and relaxed evaluation criteria, the OCD of the MASH pickup truck may be within the acceptable range for high-speed impacts into a single-slope concrete barrier. Due to the above mentioned considerations, it can be concluded that the single-slope barrier, when impacted with a 5000-lb MASH pickup truck at 85 mph, is expected to have marginal performance. 4.3 ANALYSIS WITH SMALL PASSENGER CAR As mentioned earlier, the size of the small passenger car design vehicle increased from 1800-lb in NCHRP Report 350 to 2425-lb in MASH. Consequently, the 1800-lb Geo Metro vehicle model does not meet MASH specifications. Although FHWA plans to develop a vehicle model that meets the specifications for the 1100C design vehicle, this work has not been initiated. Upon evaluation of several public domain vehicle models, the researchers determined that the Dodge Neon model developed by the NCAC for the National Highway Transportation Safety Administration (NHTSA) was the closest match to the MASH design vehicle (see Figure 4.6). This vehicle model has a total mass of 2900-lb, which is 20 percent more than the weight specified by MASH. The model has approximately 284,000 nodes, which is fairly detailed for vehicle models currently being used in the roadside safety analysis. Although the Dodge Neon has not been validated for roadside safety applications, the researchers evaluated the use of this model as a MASH design vehicle using available crash test data. 48
 conducted a crash test of rigid New Jersey concrete barrier using a 2002 Kia Rio vehicle, which meets the MASH small car specifications.")
61 Figure 4.6. NCAC Dodge Neon Vehicle Model. In 2006, the Midwest Roadside Safety Facility (MwRSF) conducted a crash test of rigid New Jersey concrete barrier using a 2002 Kia Rio vehicle, which meets the MASH small car specifications. The vehicle mass in the test was 2579 lb, and it impacted the barrier at a nominal speed of 62 mph and a nominal angle of 25 degrees. The researchers performed a finite element simulation of this crash test using the Dodge Neon model. The objective of this simulation was to establish an approximate equivalence of the Dodge Neon model to a MASH design vehicle (e.g., Kia Rio) by comparing simulation and test results. If a reasonable correlation could be established between simulation and test results, it would enable the researchers to use the Dodge Neon model as a surrogate MASH design vehicle for further evaluation of the performance of concrete barriers at very high-impact speeds. Figure 4.7 shows the Dodge Neon vehicle model prior to impact into a model of a NJ profile concrete safety-shape barrier. The explicit accelerometer assembly developed earlier was added to the small car model to enhance the accuracy of occupant risk factors calculated from the simulation acceleration-time histories. The permanent NJ concrete barrier was modeled using a rigid material representation. The vehicle impacted the barrier at a nominal speed of 62 mph and a nominal angle of 25 degrees. A time-sequence comparison between the test and simulation results is shown in Figure 4.8. A comparison of the occupant risk factors calculated for the impact simulation and crash test is shown in Table 4.2. It can be seen that a reasonable correlation between simulation and test results was achieved in terms of vehicle dynamics and occupant risk indices. The researchers subsequently used the Dodge Neon model in further evaluation of concrete barriers for use on high-speed highways. A simulation was performed with the Dodge Neon impacting the rigid NJ concrete barrier at an impact speed of 85 mph and an impact angle of 25 degrees. Figure 4.9 shows a comparison of vehicle roll during the 62 mph and 85 mph impacts. The results show a significant increase in vehicle climb and roll during the 85 mph impact, with a high probability of vehicle rollover. The occupant risk numbers associated with the 85 mph impact were also higher as shown in Table 4.3, but were still predicted to be within the MASH requirements. Due to the high climb and roll of vehicle observed in the simulation analysis, the NJ profile concrete barrier is not recommended for very high-speed applications. 49


62 Figure 4.7. Finite Element Model of Dodge Neon Impacting Rigid NJ Profile Barrier. 50


63 Figure 4.8. Time-Sequence Comparison of Small Car Impact into NJ Profile Concrete Barrier. 51
 and 85 mph (Right) Impact into NJ Barrier. Table 4.3.")
64 Table 4.2. Occupant Risk Analysis from Test and Simulation Results. Test Simulation Occupant Impact Velocity Longitudinal 16.5 ft/s 17.1 ft/s Lateral 33.0 ft/s 28.5 ft/s Ridedown Acceleration Longitudinal 5.49 G 9.1 G Lateral 8.08 G 10.4 G Figure 4.9. Comparison of 62 mph (Left) and 85 mph (Right) Impact into NJ Barrier. Table 4.3. Occupant Risk Analysis from 62 mph and 85 mph Impacts with NJ Barrier. 62 mph Test 62 mph Simulation 85 mph Simulation Occupant Impact Velocity Longitudinal 16.5 ft/s 17.1 ft/s 20.7 ft/s Lateral 33.0 ft/s 28.5 ft/s 35.8 ft/s Ride-down Acceleration Longitudinal 5.5 G 9.1 G 8.0 G Lateral 8.1 G 10.4 G 14.5 G The researchers then evaluated the performance of single-slope barrier with the small car. The performance of SSB with the 2425-lb MASH design vehicle is unknown due to lack of any prior testing. For this reason, the researchers performed simulations at impact speeds of both 62 mph and 85 mph using the Dodge Neon vehicle model. Figure 4.10 shows a time-sequence comparison of the two simulations. Table 4.4 shows the results of the occupant risk analysis. 52


")
 Impact")
65 85 mph 62 mph 0.0 sec 0.0 sec 0.05 sec 0.05 sec 0.1 sec 0.1 sec sec sec Figure Comparison of 85 mph (Left) and 62 mph (Right) Impact Simulations with SSB. 53
66 Table 4.4. Occupant Risk Analysis from 62 mph and 85 mph Impact with SSB. 62 mph 85 mph Occupant Impact Velocity Longitudinal 18.0 ft/s 20.0 ft/s Lateral 29.5 ft/s 40.0 ft/s Ridedown Acceleration Longitudinal -9.2 G G Lateral G G The vehicle impacting at 85 mph showed slightly higher climb than the vehicle impacting at 62 mph, but was still redirected in a stable manner. However, the lateral OIV for the highspeed impact slightly exceeded the acceptable limit of 40 ft/s as required by the MASH evaluation criteria. Thus, based on simulation results, the use of single-slope barrier for 85 mph speed is not recommended. Due to the above mentioned considerations, it was concluded that the single-slope barrier, when impacted with a 2425-lb MASH passenger car at 85 mph, is expected to have marginal to unacceptable impact performance. 4.4 CONCLUSIONS For 85 mph impact speeds, the single-slope barrier is expected to result in marginal performance with a pickup truck. While the vehicle is expected to redirect in a stable manner, the occupant risk numbers are expected to be close to the upper limit of the MASH criteria. The increased occupant compartment deformation observed during the 85 mph impact is also of concern. Therefore, the performance of the SSB with the MASH design pickup truck is expected to be marginal at higher impact speeds. A marginal to unacceptable result is also expected for small passenger car impacts into the single-slope barrier at 85 mph. Although stable redirection of the vehicle is predicted, the lateral OIV is expected to be at or above the maximum acceptable value of 40 ft/s. To be an acceptable design, MASH requires that a barrier exhibit satisfactory performance for both pickup truck and small car impacts. Due to the probability of failure for both design vehicles, the single-slope barrier is not recommended for use on roadways with very high design speeds. However, known limitations and lack of validation of vehicle models for these very high-speed impacts precludes a deterministic conclusion. Crash testing needs to be conducted to provide a more definitive recommendation. Simulation results also showed that the New Jersey safety-shaped barrier is likely to result in high vehicle climb and roll, with a possibility of vehicle rollover when impacted by the small passenger car at 85 mph. Thus, the use of safety-shaped barriers is also not recommended for 85 mph impact speeds. The exclusion of single-slope and safety-shaped barriers practically implies that rigid concrete barriers cannot be used on highways with very high design speeds. To overcome the 54
67 identified problems and still provide a concrete bridge rail alternative for very high-speed roads, researchers recommend investigating the attachment of a more flexible metal rail to the surface of a concrete barrier. The flexible metal rail will potentially help absorb some of the energy of the impacting vehicle prior to the vehicle engaging the rigid concrete barrier system. Adding a mechanism to help manage the dissipation of energy can theoretically reduce occupant impact velocity and occupant compartment deformation, while maintaining vehicle stability. The simplest embodiment of this concept would be a tubular steel rail attached to the face of a vertical concrete parapet by means of energy dissipating offset blocks. The energy dissipating blockouts can potentially be fabricated from an elastomeric (i.e., rubber) material or a section of steel pipe with a prescribed crush strength. 55
68
69 CHAPTER 5. SLIP-BASE SIGN SUPPORTS 5.1 INTRODUCTION Sign supports installed adjacent to the edge of a roadway can become a serious hazard to the motoring public if they lack the ability to break away or yield upon impact by an errant vehicle. The sign support must be able to break away or yield in a manner that does not cause serious injury to the occupants of the impacting vehicle. In this research project, the researchers evaluated the application of slip-base breakaway sign supports for use on very high-speed highways. 5.2 ANALYSIS WITH SMALL PASSENGER CAR To evaluate the performance of slip-base sign supports at impacts speeds of 85 mph, the researchers developed a simplified finite element model of a slip-base and used available crash test data to validate the model. Once the slip-base model was validated, it was used to evaluate various sign support configurations during high-speed impact. The sign support system used for validating the slip-base model was a dual support system with a 6-ft 6-ft 5/8-inch plywood sign panel (see Figure 5.1). The mounting height of the sign panel was 7 ft from the ground. The two inch outside diameter (O.D.) schedule 80 pipe supports were spaced 3 ft apart. A 1989 Ford Festiva with a gross static mass of 1975 lb impacted both supports simultaneously at a speed of 63.6 mph and an angle of 0 degrees. The impact location on the front of the vehicle was slightly offset to the right side of the vehicle s centerline. This can be seen in the deformed front of the vehicle shown in Figure 5.2. The finite element model of the sign support and the slip-base are shown in Figure 5.3. The plywood sign panel was modeled using the elastic material representation. The panel was assigned the density of plywood to properly account for its mass distribution. The schedule 80 pipes were modeled using elastic-plastic material properties. Nodal rigid body constraints were used to attach the sign panel to the pipes at the location of connecting bolts. The upper triangular slip-base casting was explicitly modeled as shown in Figure 5.3 to properly account for the inertial properties of the sign support system. The casting was modeled using solid elements and a rigid material representation. Since the bottom triangular slip-plate remains fixed to the foundation without any significant movement, it was not explicitly modeled. The bolts of the triangular slip-base were also not modeled explicitly. Instead, three nonlinear springs were modeled as shown in Figure 5.3. One end of each spring was attached to the top slip-base casting, and the other end was attached to the rigid bottom plate. The force-deflection properties of the springs were calibrated using crash test results. The complexity of the slip-base model was greatly reduced using the above mentioned modeling techniques without significant loss of accuracy of results. This technique enabled multiple impact simulations to be conducted within the resources of the project. 57
.")
70 Figure 5.1. Dual Support Sign System Used for Validation of Simulation Model. Figure 5.2. Vehicle after Crash Test (Impact was Slightly Offset to Right). 58

71 Figure 5.3. Finite Element Model of Dual Slip-Base Sign Support System. The dual support slip-base model was impacted by a Geo Metro vehicle model as shown in Figure 5.4. This vehicle model was originally developed by the NCAC under the sponsorship of the FHWA. In the interest of performing faster computations, the researchers rigidized the rear parts of the vehicle. Since the rear of the vehicle does not undergo any significant deformation during initial impact with the sign support system, rigidizing these parts does not affect the simulation results. The objective of the simulations was to evaluate if the small car could activate the slip-base(s) and pass underneath the rotating sign support system without secondary contact on the roof of the vehicle. Since the goal was to simply predict the occurrence of secondary contact and not quantify the severity of this contact, it was not necessary to model the crushing of the vehicle s roof and windshield. The vehicle impacted the sign support model at 63.3 mph and 0 degrees to match the actual crash test conditions. The properties of the slip-base springs were calibrated to match the time of slip-base activation and kinematics of the released sign support. Figure 5.5 compares the results of the impact simulation with the calibrated slip-base model to those of the crash test. A reasonable correlation was achieved between simulation and test results. 59


72 Figure 5.4. Finite Element Model of Dual Sign Support System for Slip-Base Calibration sec sec sec sec sec sec sec sec Figure 5.5. Time-Sequence Comparison of Simulation and Test Results on Dual-Support Slip-Base System. The researchers then performed a simulation with the same dual slip-base sign support system with 6-ft 6-ft plywood sign panel at an impact speed of 85 mph. In this simulation, the mass of the partially rigidized vehicle model was ballasted to 2590 lb to meet the gross static vehicle mass specified in MASH for the small car design vehicle. Note that the gross static mass is the weight of the vehicle plus the weight of a crash dummy. While some differences are expected to exist in the frontal crush characteristics of the ballasted Geo Metro model and the actual MASH small car vehicle, the differences are not expected to have significant bearing on the performance of the slip-base sign supports. Thus, in the absence of a validated finite element 60


73 model of a MASH small car design vehicle, the researchers used a ballasted Geo Metro vehicle model to further evaluate various configurations of slip-base sign supports. The results of the 85 mph impact simulation are shown in Figure 5.6. After activation of the dual slip-base supports, the vehicle was able to pass underneath the rotating sign supports without any secondary contact. The performance of a single sign support system was also evaluated at the 85 mph design impact speed. The finite element model of the sign support was modified as shown in Figure 5.7. A 4-ft 4-ft sign panel was mounted to a inch O.D. schedule 80 pipe support at a height of 7 ft above ground. A inch O.D. schedule 10 pipe was used as a horizontal brace behind the sign panel. Simulations were conducted using both plywood and aluminum sign substrate materials. The thicknesses of the plywood and aluminum sign panels were inch and inch, respectively. The sign panel was attached to the support pipe and brace using nodal rigid body constraints at three locations shown in Figure 5.7. The slip-base model used in the single support system was the same as the one used in the dual sign support model. 0.0 sec 0.05 sec 0.1 sec 0.15 sec Figure mph Impact of Dual Sign Support System with Plywood Sign Panel. Figure 5.7. Finite Element Model of the Single Slip-Base Sign Support System. 61


74 The ballasted 2590-lb Geo Metro vehicle model impacted the single sign support at a speed of 85 mph and an angle of 0 degrees (i.e., perpendicular to the sign panel). The sign support was aligned with the centerline of the vehicle. Results of the simulations using plywood and aluminum sign panels are shown in Figures 5.8 and 5.9, respectively. The vehicle passes under the plywood sign panel without any secondary contact. In case of the aluminum sign panel, the sign support just misses the rear of the vehicle. Note that the ballasted Geo Metro model is a hatchback design, while the MASH small car is a coupe design, which is slightly longer in the rear. Thus, some contact between the rear of the MASH small car appears likely. However, this contact should be rearward of the occupant compartment and, thus, not a safety concern. Simulations performed with same size plywood and aluminum signs highlight the importance of mass distribution in the performance of slip-base sign support systems. The heavier plywood sign panel shifts the center of gravity of the sign support system higher. This upward shift in height of center of gravity increases the height of the point of rotation of the released sign support system, resulting in more vehicle clearance compared to the lighter aluminum sign panel. 0.0 sec 0.05 sec 0.1 sec 0.15 sec Figure mph Impact of Single Support 4-ft 4-ft Plywood Sign Panel. 0.0 sec 0.05 sec 0.1 sec 0.15 sec Figure mph Impact of Single Support 4-ft 4-ft Aluminum Sign Panel. 62


75 5.3 ANALYSIS WITH PICKUP TRUCK Unlike NCHRP Report 350, the test matrix for breakaway support structures in the AASHTO MASH includes evaluation with the pickup truck design vehicle. The researchers performed two simulations with the 4-ft 4-ft plywood sign using the Chevrolet C2500 vehicle model ballasted to a weight of 5000 lb. The results of the simulations performed at impact speeds of 62 mph and 85 mph and are shown in Figures 5.10 and 5.11, respectively. For both speeds, the sign panel is predicted to impact the roof of the pickup truck. It can be seen from the simulation results that the 7-ft mounting height of the sign support panels is not sufficient for the taller pickup truck to pass underneath to rotating sign support without secondary contact. The severity of this secondary contact at the very high impact speed is expected to result in unacceptable occupant deformation (i.e., > 4 inches of roof crush). 0.0 sec 0.05 sec 0.11 sec Figure mph Impact of 4-ft 4-ft Plywood Sign Panel. 0.0 sec 0.05 sec sec Figure mph Impact of 4-ft 4-ft Plywood Sign Panel. One means of avoiding the secondary contact with the roof of the pickup truck is to sufficiently increase the mounting height of the sign panel. Increasing the mounting height effectively increases the height of the center of mass and, hence, the point of rotation of the released sign support. The feasibility of this concept was explored by performing a simulation on a modified sign support system with a 4-ft 4-ft plywood sign panel mounted at a height of 10 ft above 63
76 ground. The simulation was performed with the ballasted 5,000-lb pickup truck impacting the sign support system head-on at a speed of 62 mph. The results of the simulation are shown in Figure There was a significant improvement in impact performance compared to the system with a 7-ft mounting height. The rotating sign support misses the occupant compartment and makes secondary contact with the bed of the pickup truck. However, it should be noted that the surrogate pickup truck used in the simulation was a standard cab design, whereas the MASH design pickup truck is a quad-cab design. The occupant compartment of the MASH pickup will, therefore, extend further rearward making it susceptible to secondary contact with the sign panel, even at a mounting height of 10 ft. 0.0 sec 0.05 sec 0.1 sec sec Figure mph Impact of 4-ft 4-ft Plywood Sign Panel Mounted at 10 ft. 5.4 CONCLUSIONS Simulation analysis of the slip-sign support panels impacted by small car vehicle at 85 mph showed that heavier sign panels perform better due to higher center of gravity of the sign support system. It was also seen that at higher speeds, the faster rotation of the sign support is countered by the faster exit of the vehicle from underneath the sign support. Impact analysis with the pickup trucks indicates that the 7-ft mounting height typically used for sign panels will have to be increased to allow the vehicle to pass underneath. Compared to the small passenger car, the taller pickup truck requires more room underneath the sign support. Furthermore, increased bumper height of the pickup truck impacts the sign support higher, which reduces the moment arm of force applied to the sign support about its center of gravity. This result, in turn, may affect the rotation of the sign support. Further investigation is needed to develop a feasible solution for a sign support that performs acceptably with pickup truck impacts. 64
77 CHAPTER 6. CONCLUSIONS TxDOT continues to plan for expansion of the state s transportation system. There is interest in using very high design speeds (above 80 mph) for some of these facilities to promote faster and more efficient travel within the state. As part of their proactive consideration of safety on these high-speed facilities, TxDOT funded Project The objective of this research is to develop roadside safety hardware suitable for use on very high-speed highways. The impact conditions selected for the design, testing, and evaluation of this high-speed hardware include a speed of 85 mph and an angle of 25 degrees for barrier impacts. The design vehicles are those specified by the pending AASHTO Manual for Assessing Safety Hardware and include a 5000-lb, ½-ton, 4-door pickup truck and a 2425-lb passenger coupe. There are many aspects to roadside safety design. Given the limited resources of the project, it was understood that not all categories of roadside safety devices can be addressed. Therefore, the project monitoring committee prioritized the order in which roadside safety hardware for very high-speed roadways should be developed. The agreed upon priority is: guardrail, bridge rail, breakaway hardware, and median barrier. When selecting specific designs to evaluate within these hardware categories, consideration was given to existing systems that may have sufficient capacity to accommodate the increased severity associated with the high-speed impacts. Use of an existing system affords some basic knowledge of its function and performance, facilitates validation of a finite element model of the system using available crash test data, and provides for the economic availability of parts and materials should the system ultimately be implemented. Systems analyzed in year one of the project include modified thrie-beam guardrail, box beam guardrail, single-slope concrete barrier, and slip-base sign supports. The selected high-speed design impact conditions are well beyond those used under MASH and its predecessors for the testing of roadside safety features. Therefore, conventional engineering design practice is of limited value. For this reason, finite element simulations were the primary tool used to evaluate the impact performance of the selected roadside safety devices. The code utilized in the computer modeling efforts is LS-DYNA, which is a general-purpose, explicit finite element code that has been used extensively in recent years for the design and evaluation of roadside safety features. Finite element models of the selected hardware devices were developed, validated, and used in high-speed impact simulations to assess the ability of each device to meet safety performance guidelines for very high-speed applications. The applicable evaluation criteria of MASH were used to evaluate performance and included consideration of structural adequacy, vehicle stability, and occupant risk. Results of the analyses were used to assess the ability of the selected roadside safety devices to perform acceptably under high-speed impact conditions. These conclusions are 65
78 summarized below. New and modified designs recommended for further analyses in year two of the project are described in the final chapter of this report. 6.1 GUARDRAIL Two guardrail systems considered to have potential for accommodating high-speed passenger vehicle impacts were evaluated. These are the modified thrie-beam and weak-post box beam systems Modified Thrie-Beam Guardrail The modified thrie-beam guardrail is the result of improvements to the standard thriebeam guardrail and was specifically designed as a high-containment system to reduce the rollover incidences for heavy vehicle impacts. The system incorporates deep offset blocks that are designed to reduce snagging interaction between the impacting vehicle and support posts, and help keep the thrie-beam rail vertically aligned during impact to reduce the probability of vehicle climb, vaulting, and/or instability. Researchers observed in the high-speed simulations that the steel blockouts deformed and collapsed as the vehicle progressed through the system. This collapse reduced the offset distance between the rail and posts and led to significant interaction between the front wheel assembly and the guardrail support posts. The front wheel assembly was observed to ride over the twisted and bent steel posts, which in turn imparted a vertical acceleration to the vehicle that helped it climb over the rail. Thus, although the rail was found to have sufficient structural capacity to accommodate the increased impact severity, the rail failed to contain the design pickup truck Box Beam Guardrail The box beam guardrail system incorporates a strong tubular steel rail member supported on relatively weak steel posts. The strength of the tubular rail provides significant structural capacity beyond current design requirements, and the weak support posts eliminate the snagging concerns that exist for strong-post systems. In the high-speed impact simulation, the pickup truck was redirected. However, the large lateral deflection of the system led to a long length of unsupported rail. The lack of vertical support allowed the tubular rail to drop in height when the lateral impact force diminished during the vehicle s attempt to exit the system. This behavior indicates a significant probability that the vehicle will override the system. 6.2 BRIDGE RAIL The project advisory committee expressed a strong desire to have a concrete bridge rail alternative available for use on very high-speed roadways. Advantages of concrete over metal beam and post systems include low installation cost and minimal maintenance and repair needs. The low maintenance and repair quality of concrete barriers reduces exposure of 66
79 maintenance/repair personnel and potential traffic conflicts associated with temporary lane closures, which is a significant concern for high-volume roads with very high-speeds. The concrete bridge rail selected for evaluation for high-speed applications was the single-slope barrier. The single-slope barrier has one constant sloping traffic face that is 10.8 degrees from vertical. Previous testing has shown it to provide a reasonable compromise between vehicle stability concerns associated with safety-shaped profiles and occupant risk concerns associated with vertical concrete parapets. The results of the high-speed impact simulations into the single-slope barrier indicate marginal to unacceptable performance. While it is predicted that the single slope barrier will contain and redirect the design pickup truck in a stable manner, the occupant risk numbers and occupant compartment deformation are expected to be close to the allowable limits of the MASH criteria. Although stable redirection of the design passenger car is also predicted, the lateral OIV is expected to be at or above the maximum acceptable recommended in MASH. In a separate analysis, simulation results confirmed that a high-speed impact into the New Jersey safety shape barrier is likely to result in high vehicle climb and roll, with a high probability of vehicle rollover when impacted by a small passenger car. 6.3 SIGN SUPPORTS The sign support system selected for high-speed performance evaluation was the slip-base. The slip-base has been used for decades to achieve acceptable breakaway performance for both small and large sign support systems. Upon impact with the support post, the upper foundation plate slips relative to the fixed lower foundation plate and the vehicle ideally travels under the rotating sign support structure with secondary contact. The performance of the slip-base sign support systems was found to be satisfactory for passenger cars impacts at very high-speeds. The increased rotational velocity imparted to the support was offset by the greater speed of the vehicle. The vehicle passed beneath the sign support system without secondary contact with the roof or windshield. However, the test matrix for breakaway supports under MASH has been revised to include a high-speed test with a pickup truck in addition to a small car. In an 85 mph head-on impact simulation with a pickup truck, the sign panel was predicted to impact the roof of the pickup with significant force. The severity of this secondary contact is expected to result in unacceptable occupant compartment deformation (i.e., > 4 inches of roof crush), leading to the conclusion that the standard 7-ft mounting height of the sign panel is not sufficient to accommodate the taller pickup truck at very high impact speeds. 67
80
81 CHAPTER 7. IMPLEMENTATION RECOMMENDATIONS The goal of this research project is to develop roadside safety hardware suitable for use on highways with very high design speed. For purposes of this project, a roadway design speed of 100 mph was selected, and the corresponding design impact speed for the evaluation and testing of roadside safety devices was taken to be 85 mph based on research conducted under Project This impact speed results in an impact severity far outside the normal design range. Under the first year of this two-year project, finite element models of selected roadside safety devices were developed and used to conduct high-speed impact simulations. The results of the simulations were used to assess the crashworthiness of the devices when subjected to high-speed impacts. Categories of roadside safety hardware considered under the project include bridge rail, guardrail, median barrier, and breakaway support structures. Crash cushions and guardrail end treatments have been excluded from the scope of the project. These devices are almost exclusively proprietary in design, and adaptation of these systems to very high-speed applications will be the responsibility of the manufacturers of the devices. As summarized in Chapter 6, all of the existing roadside safety devices selected for evaluation had performance concerns related to the very high-speed impacts. New or modified designs are, therefore, required to address these performance issues. This chapter presents design recommendations for further research and analyses during the second year of the project. 7.1 GUARDRAIL Based on the results of the high-speed impact simulations of the modified thrie-beam, the researchers identified some modifications designed to mitigate the climbing behavior of the pickup truck. The goal of these design modifications is to reduce the interaction between the front wheel assembly and the posts by preventing the collapse of the blockouts that offset the rail from the posts and changing the failure mode of the posts. Researchers recommend that the steel posts and the blockouts used in the current modified thrie-beam design be replaced with wood posts and wood blockouts as depicted in Figure 7.1. Replacing the W14 22 steel blockout with an equivalent depth 6-inch 14-inch wood blockout would prevent the collapse of the blockouts during impact, thus maintaining the desired spacing between the vehicle and the posts. Note that it is recommended that the height of the wood blockout be selected such that the lower corrugation of the thrie-beam is unsupported. This will permit the bottom of the thrie-beam to stay more vertically aligned during impact, further reducing the probability of vehicle climb, vaulting, and/or instability. Replacing the W6 9 steel posts with 6-inch 8-inch wood posts would eliminate the lateral torsional bending mode of failure observed in the steel posts. It is theorized that this will permit the posts to displace further laterally through the soil and further reduce the interaction between the wheels and posts. However, there is a possibility that the high-speed impact could 69
82 promote fracture of the wood posts, which could lead to pocketing of the vehicle in the rail system. If the design modifications result in stable containment and redirection of the pickup truck without significant climb, the researchers will recommend testing of modified thrie-beam guardrail with wood posts and blockouts at the 85 mph design impact speed. Figure 7.1. Recommended Wood Post and Wood Block Modified Thrie-Beam System. 7.2 BRIDGE RAIL As summarized in Chapter 6, the high-speed impact simulations identified performance issues with both the safety-shaped and single-slope concrete barriers. Simulation results confirmed that a high-speed impact into the New Jersey safety-shaped barrier is likely to result in high vehicle climb and roll, with a high probability of vehicle rollover when impacted by a small passenger car. While the simulation results indicate that the single-slope barrier will contain and redirect both the small car and pickup truck in a stable manner, the occupant risk numbers are predicted to be at or above the maximum allowable limits recommended in MASH criteria. Although the simulation results should perhaps be verified through a full-scale crash test, the exclusion of single-slope and safety-shaped profile barriers implies that rigid concrete 70
83 barriers are not suitable for use on highways with very high design speeds. To overcome the identified performance problems and still provide a concrete bridge rail alternative for very highspeed roads, it is recommended that a more flexible metal rail be attached to the traffic face of a concrete parapet to help manage the energy of the impacting vehicle. Adding a mechanism to help absorb some of the energy of the impacting vehicle prior to the vehicle engaging the rigid concrete barrier system would theoretically reduce occupant impact velocity and occupant compartment deformation while maintaining vehicle stability. Two variations of a recommended design concept are shown in Figures 7.2 and 7.3. Both designs incorporate dual tubular steel rail elements attached to the face of a vertical concrete parapet by means of energy dissipating offset blocks. Dual tubular steel rails are recommended to provide more contact surface area and better load distribution on the vehicle. The bending strength of the closed tubular rail sections also reduces the likelihood of plastic deformation during impact and, therefore, the need for repair. This design concept is an adaptation of a low-maintenance bridge rail concept originally developed by Beason et al. (6). This all-steel bridge rail system was successfully tested under NCHRP Report 230 and did not require repair after a design impact by a 4500-lb passenger sedan at a speed of 60 mph and an angle of 25 degrees (7). The energy dissipating blockouts can be fabricated from an elastomeric (i.e., rubber) material as initially conceived by Beason et al. and shown in Figure 7.2, or using a section of steel pipe with a prescribed crush strength as portrayed in Figure 7.3. The elastomeric blockout will likely be more expensive to fabricate and install. However, it would provide a self-restoring, low-maintenance rail that would not require repair after most impacts. The pipe spacer is designed to dissipate energy through controlled plastic deformation or crush. While it would likely have a lower initial cost and be easier to install, it would be expendable and require replacement after a design impact. Considering the high-speed, high-volume environment in which this bridge rail will be used, the researchers recommend the elastomeric blockout alternative. The higher initial cost would likely be offset by the reduced repair cost. More importantly, the exposure of maintenance personnel would be reduced, as would traffic incidents resulting from lane closures required for rail repair. Should analysis of this system indicate acceptable impact performance, it will be recommended for full-scale crash testing. 7.3 SIGN SUPPORTS The high-speed impact simulations of slip-base sign supports indicate that the standard 7-ft sign panel mounting height is not sufficient to avoid secondary contact of the rotating support system with the roof of the taller pickup truck design vehicle. One means of avoiding the secondary contact with the roof of the pickup truck is to sufficiently increase the mounting height of the sign panel. Increasing the mounting height effectively increases the height of the center of mass and, hence, the point of rotation of the released sign support. 71

84 72 Figure 7.2. Concrete Parapet with Tubular Steel Rail and Elastomeric Offset Blocks.
85 73 Figure 7.2. Concrete Parapet with Tubular Steel Rail and Elastomeric Offset Blocks (Continued).

86 74 Figure 7.3. Concrete Parapet with Tubular Steel Rail and Collapsible Pipe Spacers.
87 75 Figure 7.3. Concrete Parapet with Tubular Steel Rail and Collapsible Pipe Spacers (Continued).


88 The feasibility of this concept was explored by performing a simulation on a modified sign support system with a 4-ft 4-ft plywood sign panel mounted at a height of 10 ft above ground. The simulation was performed with a 5000-lb pickup truck impacting the sign support system head-on at a speed of 85 mph. The results of the simulation are shown in Figure 7.4. The increased mounting height resulted in a significant improvement in impact performance compared to the system with 7-ft mounting height. The rotating sign support misses the occupant compartment and makes secondary contact with the bed of the pickup truck. However, it should be noted that the surrogate pickup truck used in the simulation had a standard, 2-door cab, whereas the MASH design pickup truck has an extended 4-door cab. The occupant compartment of the MASH pickup will, therefore, extend further rearward making it susceptible to secondary contact with the sign panel, even at a mounting height of 10 ft. 0.0 sec 0.05 sec 0.1 sec sec Figure mph Impact of Sign Support with 10-ft Mounting Height. In order to avoid secondary contact with the occupant compartment of the 4-door pickup, it may be necessary to further increase the mounting height to 11 ft. One concern associated with an increase in mounting height of this magnitude is the loss of nighttime retroreflectivity due to the reduction in headlamp illumination. In practice, some large guide signs have sign panels that extend into this range, but the issue should be further explored before a recommendation is made in regard to crash testing. Any design alternatives in the selected hardware categories that have satisfactory performance indicated by the high-speed impact simulations will be submitted to the project director and project monitoring committee for review and approval. Approved designs will then be subjected to full-scale crash testing to verify impact performance for the prescribed highspeed impact conditions. 76
Advances in Simulating Corrugated Beam Barriers under Vehicular Impact
 13 th International LS-DYNA Users Conference Session: Automotive Advances in Simulating Corrugated Beam Barriers under Vehicular Impact Akram Abu-Odeh Texas A&M Transportation Institute Abstract W-beam
A MASH Compliant W-Beam Median Guardrail System
 0 0 0 0 0 A MASH Compliant W-Beam Median Guardrail System By A. Y. Abu-Odeh, R. P. Bligh, W. Odell, A. Meza, and W. L. Menges Submitted: July 0, 0 Word Count:, + ( figures + tables=,000) =, words Authors:
Evaluation of Barriers for Very High Speed Roadways
 TTI: 0-6071 Evaluation of Barriers for Very High Speed Roadways ISO 17025 Laboratory Testing Certificate # 2821.01 Crash testing performed at: TTI Proving Ground 3100 SH 47, Building 7091 Bryan, TX 77807
Manual for Assessing Safety Hardware
 American Association of State Highway and Transportation Officials Manual for Assessing Safety Hardware 2009 vii PREFACE Effective traffic barrier systems, end treatments, crash cushions, breakaway devices,
Evaluation and Design of ODOT s Type 5 Guardrail with Tubular Backup
 Evaluation and Design of ODOT s Type 5 Guardrail with Tubular Backup Draft Final Report Chuck A. Plaxico, Ph.D. James C. Kennedy, Jr., Ph.D. Charles R. Miele, P.E. for the Ohio Department of Transportation
SUMMARY CHANGES FOR NCHRP REPORT 350 GUIDELINES [NCHRP (02)] Keith A. Cota, Chairman Technical Committee on Roadside Safety June 14, 2007
![SUMMARY CHANGES FOR NCHRP REPORT 350 GUIDELINES [NCHRP (02)] Keith A. Cota, Chairman Technical Committee on Roadside Safety June 14, 2007](/thumbs/87/97351925.jpg "SUMMARY CHANGES FOR NCHRP REPORT 350 GUIDELINES [NCHRP (02)] Keith A. Cota, Chairman Technical Committee on Roadside Safety June 14, 2007") SUMMARY CHANGES FOR NCHRP REPORT 350 GUIDELINES [NCHRP 22-14 (02)] Keith A. Cota, Chairman Technical Committee on Roadside Safety June 14, 2007 BACKGROUND Circular 482 (1962) First full scale crash test
SUMMARY CHANGES FOR NCHRP REPORT 350 GUIDELINES [NCHRP 22-14 (02)] Keith A. Cota, Chairman Technical Committee on Roadside Safety June 14, 2007 BACKGROUND Circular 482 (1962) First full scale crash test
1962: HRCS Circular 482 one-page document, specified vehicle mass, impact speed, and approach angle for crash tests.
 1 2 3 1962: HRCS Circular 482 one-page document, specified vehicle mass, impact speed, and approach angle for crash tests. 1973: NCHRP Report 153 16-page document, based on technical input from 70+ individuals
MASH 2016 Implementation: What, When and Why
 MASH 2016 Implementation: What, When and Why Roger P. Bligh, Ph.D., P.E. Senior Research Engineer Texas A&M Transportation Institute June 7, 2016 2016 Traffic Safety Conference College Station, Texas Outline
AASHTO Manual for Assessing Safety Hardware, AASHTO/FHWA Joint Implementation Plan Standing Committee on Highways September 24, 2015
 AASHTO Manual for Assessing Safety Hardware, 2015 AASHTO/FHWA Joint Implementation Plan Standing Committee on Highways September 24, 2015 Full Scale MASH Crash Tests (NCHRP 22-14(02)) Conducted several
Crash Testing Growth Common Roadside Hardware Systems Draft FHWA and AASHTO Requirements for Implementing MASH 2015
 64 th Annual Illinois Traffic Safety and Engineering Conference October 14, 2015 Crash Testing Growth Common Roadside Hardware Systems Draft FHWA and AASHTO Requirements for Implementing MASH 2015 1 https://www.youtube.com/watch?feature
DEVELOPMENT OF A MASH TL-3 MEDIAN BARRIER GATE
 TTI: 9-1002 DEVELOPMENT OF A MASH TL-3 MEDIAN BARRIER GATE ISO 17025 Laboratory Testing Certificate # 2821.01 Crash testing performed at: TTI Proving Ground 3100 SH 47, Building 7091 Bryan, TX 77807 Research/Test
Development and Validation of a Finite Element Model of an Energy-absorbing Guardrail End Terminal
 Development and Validation of a Finite Element Model of an Energy-absorbing Guardrail End Terminal Yunzhu Meng 1, Costin Untaroiu 1 1 Department of Biomedical Engineering and Virginia Tech, Blacksburg,
Form DOT F (8-72) Texas Transportation Institute The Texas A&M University System College Station, Texas
 Texas Transportation Institute The Texas A&M University System College Station, Texas") 1. Report No. FHWA/TX-02/4162-1 Technical Report Documentation Page 2. Government Accession No. 3. Recipient's Catalog No. 4. Title and Subtitle EVALUATION OF TEXAS GRID-SLOT PORTABLE CONCRETE BARRIER
1. Report No. FHWA/TX-02/4162-1 Technical Report Documentation Page 2. Government Accession No. 3. Recipient's Catalog No. 4. Title and Subtitle EVALUATION OF TEXAS GRID-SLOT PORTABLE CONCRETE BARRIER
Texas Transportation Institute The Texas A&M University System College Station, Texas
 1. Report No. FHWA/TX-07/0-5527-1 4. Title and Subtitle DEVELOPMENT OF A LOW-PROFILE TO F-SHAPE TRANSITION BARRIER SEGMENT 2. Government Accession No. 3. Recipient's Catalog No. Technical Report Documentation
VULCAN BARRIER TL-3 GENERAL SPECIFICATIONS
 VULCAN BARRIER TL-3 GENERAL SPECIFICATIONS I. GENERAL A. The VULCAN BARRIER TL-3 (VULCAN TL-3) shall be a highly portable and crashworthy longitudinal barrier especially suited for use as a temporary barrier
Assessing Options for Improving Roadside Barrier Crashworthiness
 13 th International LS-DYNA Users Conference Session: Simulation Assessing Options for Improving Roadside Barrier Crashworthiness D. Marzougui, C.D. Kan, and K.S. Opiela Center for Collision Safety and
VULCAN BARRIER TL-3 GENERAL SPECIFICATIONS
 VULCAN BARRIER TL-3 GENERAL SPECIFICATIONS I. GENERAL A. The VULCAN BARRIER TL-3 (VULCAN TL-3) shall be a highly portable and crashworthy longitudinal barrier especially suited for use as a temporary barrier
CRASH TEST OF MILE POST MARKER. T. J. Hirsch Research Engineer. and. Eugene Buth Assistant Research Engineer. Research Report Number 146-8
 CRASH TEST OF MILE POST MARKER by T. J. Hirsch Research Engineer and Eugene Buth Assistant Research Engineer Research Report Number 146-8 Studies of Field Adaption of Impact Attenuation Systems Research
VERIFICATION & VALIDATION REPORT of MGS Barrier Impact with 1100C Vehicle Using Toyota Yaris Coarse FE Model
 VERIFICATION & VALIDATION REPORT of MGS Barrier Impact with 1100C Vehicle Using Toyota Yaris Coarse FE Model CCSA VALIDATION/VERIFICATION REPORT Page 1 of 4 Project: CCSA Longitudinal Barriers on Curved,
Implementation of AASHTO s Manual for Assessing Safety Hardware (MASH) 2016
 2016") Implementation of AASHTO s Manual for Assessing Safety Hardware (MASH) 2016 Update from the Technical Committee on Roadside Safety Keith Cota, New Hampshire DOT MASH 2016 Overview Background Ballot Results/Dates
Implementation of AASHTO s Manual for Assessing Safety Hardware (MASH) 2016 Update from the Technical Committee on Roadside Safety Keith Cota, New Hampshire DOT MASH 2016 Overview Background Ballot Results/Dates
Crash Performance of Strong-Post W-Beam Guardrail with Missing Blockouts Carolyn E. Hampton and Hampton C. Gabler
 Crash Performance of Strong-Post W-Beam Guardrail with Missing Blockouts Carolyn E. Hampton and Hampton C. Gabler Virginia Tech Center for Injury Biomechanics, Blacksburg VA 24061 Abstract Missing blockouts
PR V2. Submitted by. Professor MIDWEST Vine Street (402) Submitted to
 Submitted to") FINAL REPORT PR4893118-V2 ZONE OF INTRUSION STUDY Submitted by John D. Reid, Ph.D. Professor Dean L.. Sicking, Ph.D., P.E. Professorr and MwRSF Director MIDWEST ROADSIDE SAFETY FACILITY University of Nebraska-Lincoln
FINAL REPORT PR4893118-V2 ZONE OF INTRUSION STUDY Submitted by John D. Reid, Ph.D. Professor Dean L.. Sicking, Ph.D., P.E. Professorr and MwRSF Director MIDWEST ROADSIDE SAFETY FACILITY University of Nebraska-Lincoln
Improving Roadside Safety by Computer Simulation
 A2A04:Committee on Roadside Safety Features Chairman: John F. Carney, III, Worcester Polytechnic Institute Improving Roadside Safety by Computer Simulation DEAN L. SICKING, University of Nebraska, Lincoln
Working Paper. Development and Validation of a Pick-Up Truck Suspension Finite Element Model for Use in Crash Simulation
 Working Paper NCAC 2003-W-003 October 2003 Development and Validation of a Pick-Up Truck Suspension Finite Element Model for Use in Crash Simulation Dhafer Marzougui Cing-Dao (Steve) Kan Matthias Zink
June 5, In Reply Refer To: HSSD/B-178. Mr. Kevin K. Groeneweg Mobile Barriers LLC Genesee Trail Road Golden, CO Dear Mr.
 June 5, 2008 1200 New Jersey Avenue, SE. Washington, DC 20590 In Reply Refer To: HSSD/B-178 Mr. Kevin K. Groeneweg Mobile Barriers LLC 24918 Genesee Trail Road Golden, CO 80401 Dear Mr. Groeneweg: This
TEXAS TRANSPORTATION INSTITUTE THE TEXAS A & M UNIVERSITY SYSTEM COLLEGE STATION, TEXAS 77843
 NCHRP REPORT 350 ASSESSMENT OF EXISTING ROADSIDE SAFETY HARDWARE by C. Eugene Buth, P.E. Senior Research Engineer Wanda L. Menges Associate Research Specialist and Sandra K. Schoeneman Research Associate
COMPARISON OF THE IMPACT PERFORMANCE OF THE G4(1W) AND G4(2W) GUARDRAIL SYSTEMS UNDER NCHRP REPORT 350 TEST 3-11 CONDITIONS
 AND G4(2W) GUARDRAIL SYSTEMS UNDER NCHRP REPORT 350 TEST 3-11 CONDITIONS") Paper No. 00-0525 COMPARISON OF THE IMPACT PERFORMANCE OF THE G4(1W) AND G4(2W) GUARDRAIL SYSTEMS UNDER NCHRP REPORT 350 TEST 3-11 CONDITIONS by Chuck A. Plaxico Associate Research Engineer Worcester Polytechnic
Paper No. 00-0525 COMPARISON OF THE IMPACT PERFORMANCE OF THE G4(1W) AND G4(2W) GUARDRAIL SYSTEMS UNDER NCHRP REPORT 350 TEST 3-11 CONDITIONS by Chuck A. Plaxico Associate Research Engineer Worcester Polytechnic
safedirection.com.au Ref: PM 017/02
 DISTRIBUTOR 0 Product Manual Ref: PM 017/02 Table of Contents 1.0 Introduction... 3 2.0 The... 3 3.0 How the Functions... 4 4.0 Crash Test Performance... 4 5.0 Characteristics of Terminals... 5 5.1 Gating
DISTRIBUTION: Electronic Recipients List TRANSMITTAL LETTER NO. (15-01) MINNESOTA DEPARTMENT OF TRANSPORTATION. MANUAL: Road Design English Manual
 MINNESOTA DEPARTMENT OF TRANSPORTATION. MANUAL: Road Design English Manual") DISTRIBUTION: Electronic Recipients List MINNESOTA DEPARTMENT OF TRANSPORTATION DEVELOPED BY: Design Standards Unit ISSUED BY: Office of Project Management and Technical Support TRANSMITTAL LETTER NO.
DISTRIBUTION: Electronic Recipients List MINNESOTA DEPARTMENT OF TRANSPORTATION DEVELOPED BY: Design Standards Unit ISSUED BY: Office of Project Management and Technical Support TRANSMITTAL LETTER NO.
July 10, Refer to: HSA-10/CC-78A
 July 10, 2003 Refer to: HSA-10/CC-78A Barry D. Stephens, P.E. Senior Vice President of Engineering ENERGY ABSORPTION Systems, Inc. 3617 Cincinnati Avenue Rocklin, California 95765 Dear Mr. Stephens: Your
MODELING SUSPENSION DAMPER MODULES USING LS-DYNA
 MODELING SUSPENSION DAMPER MODULES USING LS-DYNA Jason J. Tao Delphi Automotive Systems Energy & Chassis Systems Division 435 Cincinnati Street Dayton, OH 4548 Telephone: (937) 455-6298 E-mail: Jason.J.Tao@Delphiauto.com
KENTUCKY TRANSPORTATION CENTER
 Research Report KTC-08-10/UI56-07-1F KENTUCKY TRANSPORTATION CENTER EVALUATION OF 70 MPH SPEED LIMIT IN KENTUCKY OUR MISSION We provide services to the transportation community through research, technology
DEFLECTION LIMITS FOR TEMPORARY CONCRETE BARRIERS
 Midwest State s Regional Pooled Fund Research Program Fiscal Year 1998-1999 (Year 9) NDOR Research Project Number SPR-3(017) DEFLECTION LIMITS FOR TEMPORARY CONCRETE BARRIERS Submitted by Dean L. Sicking,
OPTIMIZATION OF THRIE BEAM TERMINAL END SHOE CONNECTION
 TTI: 9-1002-15 OPTIMIZATION OF THRIE BEAM TERMINAL END SHOE CONNECTION ISO 17025 Laboratory Testing Certificate # 2821.01 Pendulum testing performed at: TTI Proving Ground 3100 SH 47, Building 7091 Bryan,
DEVELOPMENT OF A TRANSITION BETWEEN FREE-STANDING AND REDUCED-DEFLECTION PORTABLE CONCRETE BARRIERS PHASE I
 Research Project Number TPF-5(193) Supplement #78 DEVELOPMENT OF A TRANSITION BETWEEN FREE-STANDING AND REDUCED-DEFLECTION PORTABLE CONCRETE BARRIERS PHASE I Submitted by Mojdeh Asadollahi Pajouh, Ph.D.
BarrierGate. General Specifications. Manual Operations General Specifications
 BarrierGate General Specifications Manual Operations General Specifications BarrierGate GENERAL SPECIFICATIONS I. GENERAL A. The BarrierGate system (the gate) shall be designed and manufactured by Energy
Evaluation of the Midwest Guardrail System stiffness transition with curb
 University of Nebraska - Lincoln DigitalCommons@University of Nebraska - Lincoln Civil Engineering Faculty Publications Civil Engineering 2016 Evaluation of the Midwest Guardrail System stiffness transition
METAL BEAM GUARDFENCE TRANSITION AND END TREATMENT IDENTIFICATION GUIDE
 2016 TxDOT Design Division METAL BEAM GUARDFENCE TRANSITION AND END TREATMENT IDENTIFICATION GUIDE A guide to help TxDOT employees identify metal beam guardfence transitions and end treatments for the
Product Specification. ABSORB 350 TM TL-2 Non-Redirective, Gating, Crash Cushion Applied to Quickchange Moveable Barrier
 TB 000612 Rev. 0 Page 1 of 9 Product Specification ABSORB 350 TM TL-2 Non-Redirective, Gating, Crash Cushion Applied to Quickchange Moveable Barrier I. General The ABSORB 350 TM TL-2 System is a Non-Redirective,
CRASH TEST AND EVALUATION OF 3-FT MOUNTING HEIGHT SIGN SUPPORT SYSTEM
 TTI: 9-1002-15 CRASH TEST AND EVALUATION OF 3-FT MOUNTING HEIGHT SIGN SUPPORT SYSTEM ISO 17025 Laboratory Testing Certificate # 2821.01 Crash testing performed at: TTI Proving Ground 3100 SH 47, Building
February 8, In Reply Refer To: HSSD/CC-104
 February 8, 2008 200 New Jersey Avenue, SE. Washington, DC 20590 In Reply Refer To: HSSD/CC-04 Barry D. Stephens, P.E. Sr. Vice President Engineering Energy Absorption Systems, Inc. 367 Cincinnati Avenue
Technical Report Documentation Page Form DOT F (8-72) Reproduction of completed page authorized
 Reproduction of completed page authorized") 1. Report No. FHWA/TX-05/0-4162-3 4. Title and Subtitle 2. Government Accession No. 3. Recipient's Catalog No. DEVELOPMENT OF LOW-DEFLECTION PRECAST CONCRETE ARRIER 5. Report Date January 2005 Technical
1. Report No. FHWA/TX-05/0-4162-3 4. Title and Subtitle 2. Government Accession No. 3. Recipient's Catalog No. DEVELOPMENT OF LOW-DEFLECTION PRECAST CONCRETE ARRIER 5. Report Date January 2005 Technical
TRACC. Trinity Attenuating Crash Cushion
 TRACC Trinity Attenuating Crash Cushion CSP Pacific Business Unit of Fletcher Concrete & Infrastructure Limited 306 Neilson Street Onehunga, Auckland Phone: (09) 634 1239 or 0800 655 200 Fax: (09) 634
ROBUST PROJECT Norwegian Public Roads Administration / Force Technology Norway AS
 ROBUST PROJECT Norwegian Public Roads Administration / Force Technology Norway AS Evaluation of small car - RM_R1 - prepared by Politecnico di Milano Volume 1 of 1 January 2006 Doc. No.: ROBUST-5-002/TR-2004-0039
Midwest Guardrail System Without Blockouts
 Duplication for publication or sale is strictly prohibited without prior written permission of the Transportation Research Board Paper No. 13-0418 Midwest Guardrail System Without Blockouts by John D.
s MEDIAN BARRIERS FOR TEXAS HIGHWAYS
 s MEDIAN BARRIERS FOR TEXAS HIGHWAYS SUMMARY REPORT of Research Report Number 146-4 Study 2-8-68-146 Cooperative Research Program of the Texas Transportation Institute and the Texas Highway Department
PRODUCT DESCRIPTION. X-Tension DS. is suitable for all road types: Motorways, country roads, city streets for speed categories up to 110 km/h.
 INDEX Introduction 2 Product Description 3 Installation 6 Specifications 7 Crash Tests Table 8 Reusability 9 FAQ 10 Annexes 14 Drawings 15 Pictures 16 Crash Tests Results 18 Approvals 23 INTRODUCTION Improving
NUMERICAL ANALYSIS OF IMPACT BETWEEN SHUNTING LOCOMOTIVE AND SELECTED ROAD VEHICLE
 Journal of KONES Powertrain and Transport, Vol. 21, No. 4 2014 ISSN: 1231-4005 e-issn: 2354-0133 ICID: 1130437 DOI: 10.5604/12314005.1130437 NUMERICAL ANALYSIS OF IMPACT BETWEEN SHUNTING LOCOMOTIVE AND
Universal TAU-IIR Redirective, Non-Gating, Crash Cushion
 TB 110927 Rev. 0 Page 1 of 5 Product Specification Universal TAU-IIR Redirective, Non-Gating, Crash Cushion I. General The Universal TAU-IIR system is a Redirective, Non-Gating Crash Cushion in accordance
CRITICAL FLARE RATES FOR W-BEAM GUARDRAIL DETERMINING MAXIMUM CAPACITY USING COMPUTER SIMULATION NCHRP 17-20(3)
") CRITICAL FLARE RATES FOR W-BEAM GUARDRAIL DETERMINING MAXIMUM CAPACITY USING COMPUTER SIMULATION NCHRP 17-2(3) Submitted by Beau D. Kuipers, B.S.M.E., E.I.T. Graduate Research Assistant Ronald K. Faller,
CRITICAL FLARE RATES FOR W-BEAM GUARDRAIL DETERMINING MAXIMUM CAPACITY USING COMPUTER SIMULATION NCHRP 17-2(3) Submitted by Beau D. Kuipers, B.S.M.E., E.I.T. Graduate Research Assistant Ronald K. Faller,
Development of a Finite Element Model of a Motorcycle
 Development of a Finite Element Model of a Motorcycle N. Schulz, C. Silvestri Dobrovolny and S. Hurlebaus Texas A&M Transportation Institute Abstract Over the past years, extensive research efforts have
W-Beam Guiderail Transition from Light to Heavy Posts
 TRANSPORTATION RESEARCH RECORD 1198 55 W-Beam Guiderail Transition from Light to Heavy Posts DONALD G. HERRING AND JAMES E. BRYDEN Two full-scale crash tests evaluated a transition between lightand heavy-post
MASH TEST 3-10 ON 31-INCH W-BEAM GUARDRAIL WITH STANDARD OFFSET BLOCKS
 TTI: 9-1002 MASH TEST 3-10 ON 31-INCH W-BEAM GUARDRAIL WITH STANDARD OFFSET BLOCKS ISO 17025 Laboratory Testing Certificate # 2821.01 Crash testing performed at: TTI Proving Ground 3100 SH 47, Building
EXTENDING TL-2 SHORT-RADIUS GUARDRAIL TO LARGER RADII
 Research Project Number TPF-5(193) Supplement 27 EXTENDING TL-2 SHORT-RADIUS GUARDRAIL TO LARGER RADII Submitted by Cody S. Stolle, Ph.D., E.I.T. Post-Doctoral Research Associate Robert W. Bielenberg,
Vehicle Dynamic Simulation Using A Non-Linear Finite Element Simulation Program (LS-DYNA)
") Vehicle Dynamic Simulation Using A Non-Linear Finite Element Simulation Program (LS-DYNA) G. S. Choi and H. K. Min Kia Motors Technical Center 3-61 INTRODUCTION The reason manufacturers invest their time
Vehicle Dynamic Simulation Using A Non-Linear Finite Element Simulation Program (LS-DYNA) G. S. Choi and H. K. Min Kia Motors Technical Center 3-61 INTRODUCTION The reason manufacturers invest their time
FHWA/IN/JTRP-2000/23. Final Report. Sedat Gulen John Nagle John Weaver Victor Gallivan
 FHWA/IN/JTRP-2000/23 Final Report DETERMINATION OF PRACTICAL ESALS PER TRUCK VALUES ON INDIANA ROADS Sedat Gulen John Nagle John Weaver Victor Gallivan December 2000 Final Report FHWA/IN/JTRP-2000/23 DETERMINATION
Statement before Massachusetts Auto Damage Appraiser Licensing Board. Institute Research on Cosmetic Crash Parts. Stephen L. Oesch.
 Statement before Massachusetts Auto Damage Appraiser Licensing Board Institute Research on Cosmetic Crash Parts Stephen L. Oesch INSURANCE INSTITUTE FOR HIGHWAY SAFETY 1005 N. GLEBE RD. ARLINGTON, VA 22201-4751
INCREASED SPAN LENGTH FOR THE MGS LONG-SPAN GUARDRAIL SYSTEM
 University of Nebraska - Lincoln DigitalCommons@University of Nebraska - Lincoln Mechanical (and Materials) Engineering -- Dissertations, Theses, and Student Research Mechanical & Materials Engineering,
Guide Rail Safety Symposium
 Ministry of Transportation Guide Rail Safety Symposium MTO Provincial Roadside Safety Update Mark C. Ayton, P. Eng. Senior Engineer, Highway Design MTO Highway Standards Branch MTO Provincial Roadside
NCHRP Report 350 Crash Testing and Evaluation of the S-Square Mailbox System
 TTI: 0-5210 NCHRP Report 350 Crash Testing and Evaluation of the S-Square Mailbox System ISO 17025 Laboratory Testing Certificate # 2821.01 Crash testing performed at: TTI Proving Ground 3100 SH 47, Building
July 17, In Reply Refer To: HSSD/B-176A
 July 17, 2008 1200 New Jersey Avenue, SE. Washington, DC 20590 In Reply Refer To: HSSD/B-176A Mr. John Addy Hill & Smith Springvale Business and Industrial Park Bliston, Wolverhampton, West Midlands, UK,
DEVELOPMENT OF A MASH TL-3 TRANSITION BETWEEN GUARDRAIL AND PORTABLE CONCRETE BARRIERS
 Duplication for publication or sale is strictly prohibited without prior written permission of the Transportation Research Board Paper No. 17-01712 DEVELOPMENT OF A MASH TL-3 TRANSITION BETWEEN GUARDRAIL
Abaqus Technology Brief. Prediction of B-Pillar Failure in Automobile Bodies
 Prediction of B-Pillar Failure in Automobile Bodies Abaqus Technology Brief TB-08-BPF-1 Revised: September 2008 Summary The B-pillar is an important load carrying component of any automobile body. It is
Evaluation of the Midwest Guardrail System Stiffness Transition with Curb
 Duplication for publication or sale is strictly prohibited without prior written permission of the Transportation Research Board Paper No. -0 Evaluation of the Midwest Guardrail System Stiffness Transition
Methodologies and Examples for Efficient Short and Long Duration Integrated Occupant-Vehicle Crash Simulation
 13 th International LS-DYNA Users Conference Session: Automotive Methodologies and Examples for Efficient Short and Long Duration Integrated Occupant-Vehicle Crash Simulation R. Reichert, C.-D. Kan, D.
Evaluating The Relevancy Of Current Crash Test Guidelines For Roadside Safety Barriers On High Speed Roads
 Evaluating The Relevancy Of Current Crash Test Guidelines For Roadside Safety Barriers On High Speed Roads Connie Xavier Dominique Lord Chiara Dobrovolny Roger Bligh TRB 1 st International Roadside Safety
DYNAMICS AND SAFETY ASSESSMENT OF A TRUCK IMPACT ONTO VARIOUS TYPES OF ROADSIDE CONCRETE BARRIERS ON CURVED ROADS. A Thesis by. Prasanna K Parvatikar
 DYNAMICS AND SAFETY ASSESSMENT OF A TRUCK IMPACT ONTO VARIOUS TYPES OF ROADSIDE CONCRETE BARRIERS ON CURVED ROADS A Thesis by Prasanna K Parvatikar Master of Science, Wichita State University, 2007 Bachelor
Abaqus Technology Brief. Automobile Roof Crush Analysis with Abaqus
 Abaqus Technology Brief Automobile Roof Crush Analysis with Abaqus TB-06-RCA-1 Revised: April 2007. Summary The National Highway Traffic Safety Administration (NHTSA) mandates the use of certain test procedures
SAFETY PERFORMANCE OF WORK-ZONE DEVICES UNDER MASH TESTING
 SAFETY PERFORMANCE OF WORK-ZONE DEVICES UNDER MASH TESTING Schmidt, Faller, Lechtenberg, Sicking, Holloway Midwest Roadside Safety Facility Nebraska Transportation Center University of Nebraska-Lincoln
BLAST CAPACITY ASSESSMENT AND TESTING A-60 OFFSHORE FIRE DOOR
 BLAST CAPACITY ASSESSMENT AND TESTING Final Report December 11, 2008 A-60 OFFSHORE FIRE DOOR Prepared for: JRJ Alum Fab, Inc. Prepared by: Travis J. Holland Michael J. Lowak John R. Montoya BakerRisk Project
CRASH TEST AND EVALUATION OF TEMPORARY WOOD SIGN SUPPORT SYSTEM FOR LARGE GUIDE SIGNS
 TTI: 9-1002-15 CRASH TEST AND EVALUATION OF TEMPORARY WOOD SIGN SUPPORT SYSTEM FOR LARGE GUIDE SIGNS ISO 17025 Laboratory Testing Certificate # 2821.01 Crash testing performed at: TTI Proving Ground 3100
NCHRP Report 350 Test 4-12 of the Modified Thrie Beam Guardrail
 NCHRP Report 350 Test 4-12 of the Modified Thrie Beam Guardrail PUBLICATION NO. FHWA-RD-99-065 DECEMBER 1999 Research, Development, and Technology Turner-Fairbank Highway Research Center 6300 Georgetown
November 16, 1998 Refer to: HNG-14. Mr. David Allardyce Mechanical Engineer B&B Electromatic Main Street Norwood, Louisiana 70761
 November 16, 1998 Refer to: HNG-14 Mr. David Allardyce Mechanical Engineer B&B Electromatic 14113 Main Street Norwood, Louisiana 70761 Dear Mr. Allardyce: In your August 31 letter, you presented some preliminary
Simulation and Validation of FMVSS 207/210 Using LS-DYNA
 7 th International LS-DYNA Users Conference Simulation Technology (2) Simulation and Validation of FMVSS 207/210 Using LS-DYNA Vikas Patwardhan Tuhin Halder Frank Xu Babushankar Sambamoorthy Lear Corporation
ROBUST PROJECT Norwegian Public Roads Administration / Force Technology Norway AS
 ROBUST PROJECT Norwegian Public Roads Administration / Force Technology Norway AS Volume 1 of 1 April 2005 Doc. No.: ROBUST-05-009/TR-2005-0012 - Rev. 0 286-2-1-no-en Main Report Report title: Simulation
Texas Transportation Institute The Texas A&M University System College Station, Texas
 1. Report No. FHWA/TX-05/9-8132-P7 4. Title and Subtitle TL-4 CRASH TESTING OF THE F411 BRIDGE RAIL 2. Government Accession No. 3. Recipient's Catalog No. 5. Report Date October 2004 Technical Report Documentation
MASH Test 3-11 on the T131RC Bridge Rail
 TTI: 9-1002-12 MASH Test 3-11 on the T131RC Bridge Rail ISO 17025 Laboratory Testing Certificate # 2821.01 Crash testing performed at: TTI Proving Ground 3100 SH 47, Building 7091 Bryan, TX 77807 Test
Median Barriers in North Carolina -- Long Term Evaluation. Safety Evaluation Group Traffic Safety Systems Management Section
 Median Barriers in North Carolina -- Long Term Evaluation Safety Evaluation Group Traffic Safety Systems Management Section Background In 1998 North Carolina began a three pronged approach to prevent and
W-Beam Approach Treatment at Bridge Rail Ends Near Intersecting Roadways
 TRANSPORTATION RESEARCH RECORD 1133 51 W-Beam Approach Treatment at Bridge Rail Ends Near Intersecting Roadways M. E. BRONSTAD, M. H. RAY, J. B. MAYER, JR., AND c. F. MCDEVITT This paper is concerned with
MASH TEST 3-37 OF THE TxDOT 31-INCH W-BEAM DOWNSTREAM ANCHOR TERMINAL
 TTI: 9-1002 MASH TEST 3-37 OF THE TxDOT 31-INCH W-BEAM DOWNSTREAM ANCHOR TERMINAL ISO 17025 Laboratory Testing Certificate # 2821.01 Crash testing performed at: TTI Proving Ground 3100 SH 47, Building
Development of Turning Templates for Various Design Vehicles
 Transportation Kentucky Transportation Center Research Report University of Kentucky Year 1991 Development of Turning Templates for Various Design Vehicles Kenneth R. Agent Jerry G. Pigman University of
Simulating Rotary Draw Bending and Tube Hydroforming
 Abstract: Simulating Rotary Draw Bending and Tube Hydroforming Dilip K Mahanty, Narendran M. Balan Engineering Services Group, Tata Consultancy Services Tube hydroforming is currently an active area of
Illinois Safety Program IDOT District ATSSA Workshop
 Illinois Safety Program IDOT District ATSSA Workshop Roadway Departure & MASH DRAFT IDOT Facilitator: Dave Piper ATSSA Facilitator: Jim Thonn 1 Illinois Emphasis Area Priority Pyramid 2 Fatalities and
WP5 - Computational Mechanics B5 - Temporary Vertical Concrete Safety Barrier MAIN REPORT Volume 1 of 1
 ROBUST PROJECT TRL Limited WP5 - Computational Mechanics B5 - Temporary Vertical Concrete Safety Barrier MAIN REPORT Volume 1 of 1 December 2005 Doc. No.: ROBUST-5-010c Rev. 0. (Logo here) Main Report
Texas Transportation Institute The Texas A&M University System College Station, Texas
 2. Government Accession No. 3. Recipient's Catalog No. 1. Report No. FHWA/TX-03/0-4138-3 4. Title and Subtitle PERFORMANCE OF THE TXDOT T202 (MOD) BRIDGE RAIL REINFORCED WITH FIBER REINFORCED POLYMER BARS
*Friedman Research Corporation, 1508-B Ferguson Lane, Austin, TX ** Center for Injury Research, Santa Barbara, CA, 93109
 Analysis of factors affecting ambulance compartment integrity test results and their relationship to real-world impact conditions. G Mattos*, K. Friedman*, J Paver**, J Hutchinson*, K Bui* & A Jafri* *Friedman
WP5 - Computational Mechanics B1 (ESP-N2) Barrier Steel N2 MAIN REPORT Volume 2 of 2
 Barrier Steel N2 MAIN REPORT Volume 2 of 2") ROBUST PROJECT TRL Limited WP5 - Computational Mechanics B1 (ESP-N2) Barrier Steel N2 Volume 2 of 2 November 2005 Doc. No.: ROBUST 5-014b Rev. 1. (Logo here) Main Report Report title: WP5 - Computational
ROBUST PROJECT TRL Limited WP5 - Computational Mechanics B1 (ESP-N2) Barrier Steel N2 Volume 2 of 2 November 2005 Doc. No.: ROBUST 5-014b Rev. 1. (Logo here) Main Report Report title: WP5 - Computational
Virginia Department of Transportation
 TEST REPORT FOR: Virginia Department of Transportation SKT SP 350 50 (15.24 m) System PREPARED FOR: Virginia Department of Transportation 1401 E. Broad St. Richmond, VA 23219 TEST REPORT NUMBER: REPORT
June 27, In Reply Refer To: HSSD/B-176
 June 27, 2008 1200 New Jersey Avenue, SE. Washington, DC 20590 In Reply Refer To: HSSD/B-176 Mr. John Addy Hill & Smith Springvale Business and Industrial Park Bliston, Wolverhampton, West Midlands, UK,
The University of Texas at Arlington The University of Texas System Texas Transportation Institute The Texas A&M University System
 1. Report No. FHWA/TX-08/5-4385-01-1 4. Title and Subtitle PILOT IMPLEMENTATION OF BUMP DETECTION PROFILER Technical Report Documentation Page 2. Government Accession No. 3. Recipient's Catalog No. 5.
MINIMUM EFFECTIVE LENGTH FOR THE MIDWEST GUARDRAIL SYSTEM
 Duplication for publication or sale is strictly prohibited without prior written permission of the Transportation Research Board Paper No. 15-0484 MINIMUM EFFECTIVE LENGTH FOR THE MIDWEST GUARDRAIL SYSTEM
Texas Transportation Institute The Texas A&M University System College Station, Texas
 1. Report No. FHWA/TX-04/9-8132-1 4. Title and Subtitle TESTING AND EVALUATION OF THE FLORIDA JERSEY SAFETY SHAPED BRIDGE RAIL 2. Government Accession No. 3. Recipient's Catalog No. 5. Report Date February
Wyoming Road Closure Gate
 38 TRANSPORTATION RESEARCH RECORD 1528 Wyoming Road Closure Gate KING K. MAK, ROGER P. BLIGH, AND WILLIAM B. WILSON Road closure gates are used to close certain highways when driving conditions become
Petition for Rulemaking; 49 CFR Part 571 Federal Motor Vehicle Safety Standards; Rear Impact Guards; Rear Impact Protection
 The Honorable David L. Strickland Administrator National Highway Traffic Safety Administration 1200 New Jersey Avenue, SE Washington, D.C. 20590 Petition for Rulemaking; 49 CFR Part 571 Federal Motor Vehicle
CRASH TESTING AND EVALUATION OF WORK ZONE TRAFFIC CONTROL DEVICES
 Paper No. 980627 CRASH TESTING AND EVALUATION OF WORK ZONE TRAFFIC CONTROL DEVICES by King K. Mak Phone: 210-698-2068 Fax: 210-698-2068 e-mail: king@tti3a.tamu.edu Texas Transportation Institute The Texas
MASH TEST 3-11 OF THE TxDOT T222 BRIDGE RAIL
 TTI: 9-1002-12 MASH TEST 3-11 OF THE TxDOT T222 BRIDGE RAIL ISO 17025 Laboratory Testing Certificate # 2821.01 Crash testing performed at: TTI Proving Ground 3100 SH 47, Building 7091 Bryan, TX 77807 Test
EVALUATING THE RELEVANCY OF CURRENT CRASH TEST GUIDELINES FOR ROADSIDE SAFETY BARRIERS ON HIGH SPEED ROADS
 EVALUATING THE RELEVANCY OF CURRENT CRASH TEST GUIDELINES FOR ROADSIDE SAFETY BARRIERS ON HIGH SPEED ROADS CONNIE XAVIER DOMINIQUE LORD, PH.D. Zachry Department of Civil Engineering, Texas A&M University
April 22, In Reply Refer To: HSA-10/WZ-206. Mr. Jan Miller TrafFix Devices 220 Calle Pintoresco San Clemente, California Dear Mr.
 April 22, 2005 400 Seventh St., S.W. Washington, D.C. 20590 In Reply Refer To: HSA-10/WZ-206 Mr. Jan Miller TrafFix Devices 220 Calle Pintoresco San Clemente, California 92672 Dear Mr. Miller: Thank you
MASH TEST 3-11 OF THE TxDOT SINGLE SLOPE BRIDGE RAIL (TYPE SSTR) ON PAN-FORMED BRIDGE DECK
 ON PAN-FORMED BRIDGE DECK") TTI: 9-1002 MASH TEST 3-11 OF THE TxDOT SINGLE SLOPE BRIDGE RAIL (TYPE SSTR) ON PAN-FORMED BRIDGE DECK ISO 17025 Laboratory Testing Certificate # 2821.01 Crash testing performed at: TTI Proving Ground
TTI: 9-1002 MASH TEST 3-11 OF THE TxDOT SINGLE SLOPE BRIDGE RAIL (TYPE SSTR) ON PAN-FORMED BRIDGE DECK ISO 17025 Laboratory Testing Certificate # 2821.01 Crash testing performed at: TTI Proving Ground
TITLE: EVALUATING SHEAR FORCES ALONG HIGHWAY BRIDGES DUE TO TRUCKS, USING INFLUENCE LINES
 EGS 2310 Engineering Analysis Statics Mock Term Project Report TITLE: EVALUATING SHEAR FORCES ALONG HIGHWAY RIDGES DUE TO TRUCKS, USING INFLUENCE LINES y Kwabena Ofosu Introduction The impact of trucks