Evaluation of Barriers for Very High Speed Roadways
|
|
|
- Franklin Allison
- 5 years ago
- Views:
Transcription

1 TTI: Evaluation of Barriers for Very High Speed Roadways ISO Laboratory Testing Certificate # Crash testing performed at: TTI Proving Ground 3100 SH 47, Building 7091 Bryan, TX Research/Test Report Cooperative Research Program TEXAS TRANSPORTATION INSTITUTE THE TEXAS A&M UNIVERSITY SYSTEM COLLEGE STATION, TEXAS in cooperation with the Federal Highway Administration and the Texas Department of Transportation
2
3 1. Report No. FHWA/TX-10/ Title and Subtitle Evaluation of Barriers for Very High Speed Roadways Technical Report Documentation Page 2. Government Accession No. 3. Recipient's Catalog No. 5. Report Date January 2010 Published: March Performing Organization Code 7. Author(s) Roger P. Bligh, Nauman M. Sheikh, Akram Y. Abu-Odeh, and Wanda L. Menges 9. Performing Organization Name and Address Texas Transportation Institute Proving Ground The Texas A&M University System College Station, Texas Sponsoring Agency Name and Address Texas Department of Transportation Research and Technology Implementation Office P.O. Box 5080 Austin, Texas Performing Organization Report No. Report Work Unit No. (TRAIS) 11. Contract or Grant No. Project Type of Report and Period Covered Technical/Test Report: September 2007 August Sponsoring Agency Code 15. Supplementary Notes Project performed in cooperation with the Texas Department of Transportation and the Federal Highway Administration. Project Title: Development of Roadside Safety Devices for Very High Speed Roadways URL: Abstract As TxDOT plans for future expansion of the state s highway network, interest in higher design speeds has been expressed as a means of promoting faster and more efficient travel and movement of goods within the state. TxDOT funded project as part of a proactive consideration of safety on these highspeed facilities. This project began the process of developing roadside safety hardware suitable for use on high-speed highways. The impact conditions selected for the design, testing, and evaluation of this highspeed hardware include a speed of 85 mi/h and an angle of 25 degrees for barrier impacts. The design vehicles are those specified by the pending AASHTO Manual for Assessing Safety Hardware (MASH) and include a 5000-lb, ½-ton, 4-door pickup truck and a 2425-lb passenger car. After consideration of several barrier systems, two designs were selected for further evaluation through full-scale crash testing. These included an energy absorbing bridge rail concept and a modified wood post thrie beam guardrail. The results of the full-scale crash testing are presented and recommendations for future research are discussed. 17. Key Words High-Speed Roadways, Bridge Rail, Longitudinal Barriers, Crash Testing, Roadside Safety 19. Security Classif.(of this report) Unclassified Form DOT F (8-72) 20. Security Classif.(of this page) Unclassified Reproduction of completed page authorized 18. Distribution Statement No restrictions. This document is available to the public through NTIS: National Technical Information Service Springfield, Virginia No. of Pages Price
4
5 EVALUATION OF BARRIERS FOR VERY HIGH SPEED ROADWAYS by Roger P. Bligh, P.E. Research Engineer Texas Transportation Institute Nauman M. Sheikh Associate Transportation Researcher Texas Transportation Institute Akram Y. Obu-Odeh Associate Research Scientist Texas Transportation Institute and Wanda L. Menges Research Specialist Texas Transportation Institute Report Project Project Title: Development of Roadside Safety Devices for Very High Speed Roadways Performed in cooperation with the Texas Department of Transportation and the Federal Highway Administration January 2010 Published: March 2010 TEXAS TRANSPORTATION INSTITUTE The Texas A&M University System College Station, Texas
6
7 DISCLAIMER This research was performed in cooperation with the Texas Department of Transportation (TxDOT) and the Federal Highway Administration (FHWA). The contents of this report reflect the views of the authors, who are responsible for the facts and the accuracy of the data presented herein. The contents do not necessarily reflect the official view or policies of the FHWA or TxDOT. This report does not constitute a standard, specification, or regulation, and its contents are not intended for construction, bidding, or permit purposes. In addition, the above listed agencies assume no liability for its contents or use thereof. The United States Government and the State of Texas do not endorse products or manufacturers. Trade or manufacturers names appear herein solely because they are considered essential to the object of this report. The engineer in charge of the project was Roger P. Bligh, P.E. (Texas, #78550). TTI PROVING GROUND DISCLAIMER The results of the crash testing reported herein apply only to the article being tested. ISO Laboratory Testing Certificate # Crash testing performed at: TTI Proving Ground 3100 SH 47, Building 7091 Bryan, TX Wanda L. Menges, Research Specialist Deputy Quality Manager Richard A. Zimmer, Senior Research Specialist Test Facility Manager Quality Manager Technical Manager v
8 ACKNOWLEDGMENTS This research project was conducted under a cooperative program between the Texas Transportation Institute, the Texas Department of Transportation, and the Federal Highway Administration. The TxDOT project director for this research was Bobby Dye (DES). Rory Meza (DES), John Holt (BRG), Michael McKissick (AUS), Jon Ries (BRG), and Edward Sewell (WFS) served as project advisors, and Wade Odell (RTI) was the TxDOT research engineer. The authors acknowledge and appreciate their guidance and assistance. This work was partially supported by the U.S. Department of Transportation, the Illinois Department of Transportation, and the Transportation Research and Analysis Computing Center. Their support in providing computational resources for simulation analyses is greatly appreciated. vi
9 TABLE OF CONTENTS Page LIST OF FIGURES... x LIST OF TABLES... xiii CHAPTER 1. INTRODUCTION... 1 INTRODUCTION... 1 DESIGN IMPACT CONDITIONS... 1 OBJECTIVES/SCOPE OF RESEARCH... 2 CHAPTER 2. DESIGN AND ANALYSES OF AN ENERGY ABSORBING BRIDGE RAIL.. 3 INTRODUCTION... 3 DESIGN AND ANALYSIS... 3 Rail Size... 5 Rail Height... 5 Pipe Thickness... 7 Pipe Spacing... 7 CONCLUSIONS CHAPTER 3. ANALYSIS OF A MODIFIED WOOD POST THRIE BEAM GUARDRAIL SYSTEM MODELING AND SIMULATION CONCLUSIONS CHAPTER 4. FULL-SCALE CRASH TEST PROCEDURES TEST FACILITY CRASH TEST CONDITIONS EVALUATION CRITERIA CHAPTER 5. FULL-SCALE CRASH TESTING OF THE ENERGY ABSORBING BRIDGE RAIL TEST ARTICLE Design and Construction Material Specifications TEST NO (MASH TEST 3-10) Test Designation and Actual Impact Conditions Test Vehicle Weather Conditions Test Description Damage to Test Installation Vehicle Damage Occupant Risk Factors Assessment of Test Results vii
10 TABLE OF CONTENTS Page TEST NO (MASH TEST DESIGNATION 3-11) Test Designation and Actual Impact Conditions Test Vehicle Weather Conditions Test Description Damage to Test Installation Vehicle Damage Occupant Risk Factors Assessment of Test Results CHAPTER 6. FULL-SCALE CRASH TESTING OF THE MODIFIED WOOD POST THRIE BEAM GUARDRAIL TEST ARTICLE Design and Construction Material Specifications Soil Conditions TEST NO (MASH TEST DESIGNATION 3-11) Test Vehicle Weather Conditions Test Description Damage to Test Installation Vehicle Damage Occupant Risk Factors Assessment of Test Results CHAPTER 7. SUMMARY AND CONCLUSIONS ENERGY ABSORBING BRIDGE RAIL MODIFIED WOOD POST THRIE BEAM GUARDRAIL CHAPTER 8. IMPLEMENTATION STATEMENT BRIDGE RAIL GUARDRAIL REFERENCES APPENDIX A. CRASH TEST AND DATA ANALYSIS PROCEDURES ELECTRONIC INSTRUMENTATION AND DATA PROCESSING ANTHROPOMORPHIC DUMMY INSTRUMENTATION PHOTOGRAPHIC INSTRUMENTATION AND DATA PROCESSING TEST VEHICLE PROPULSION AND GUIDANCE APPENDIX B. DETAILS OF THE HIGH-SPEED ENERGY-ABSORBING BRIDGE RAIL. 73 viii
11 TABLE OF CONTENTS Page APPENDIX C. TEST VEHICLE PROPERTIES AND INFORMATION APPENDIX D. SEQUENTIAL PHOTOGRAPHS APPENDIX E. VEHICLE ANGULAR DISPLACEMENTS AND ACCELERATIONS APPENDIX F. DETAILS OF THE HIGH-SPEED THRIE BEAM GUARDRAIL APPENDIX G. SOIL STRENGTH DOCUMENTATION ix
12 LIST OF FIGURES Figure Page Figure 2.1. Conceptual Drawing of the Energy Absorbing Bridge Rail Figure 2.2. Finite Element Model of the Energy Absorbing Bridge Rail Figure 2.3. Finite Element Models Used in the Simulation Analysis Figure 2.4. Pickup Truck Redirects but has a High Roll after Impact with the Rail at 31-Inch Rail Height Figure 2.5. Deformation of the Small Car after Impact with the Rail at 36-Inch Rail Height... 6 Figure 2.6. Performance of Schedule 40 (Top) and Schedule 80 (Bottom) Pipe Spacers Figure 2.7. Affect of Pipe Spacing... 9 Figure 3.1. Cross Section of the Modified Wood Post Thrie-Beam System from Drawings and Model Figure 3.2. System Layout with Vehicle Impact Location Figure 3.3. Figure 3.4. Iso-Parametric View of the 2270 kg Vehicle Set Up with the Modified Thrie-Beam Rail Sequential Images of 2270P Impact with Modified Wood Post Thrie Beam Guardrail Figure 3.5. Impact at Time of Maximum Rail Deflection Figure 3.6. Longitudinal Acceleration History for CG of the 2270 kg Vehicle Figure 3.7. Damage to the Vehicle in the 85 mi/h Simulation Figure 5.1. Details of the High-Speed Energy-Absorbing Bridge Rail Figure 5.2. Energy-Absorbing Bridge Rail Installation before Test Nos and Figure 5.3. Vehicle/Installation Geometrics for Test No Figure 5.4. Vehicle before Test No Figure 5.5. Installation after Test No Figure 5.6. Vehicle after Test No Figure 5.7. Interior of Vehicle for Test No Figure 5.8. Summary of Results for MASH Test 3-10 on the Energy-Absorbing Bridge Rail Figure 5.9. Vehicle/Installation Geometrics for Test No Figure Vehicle before Test No Figure After Impact Trajectory Path for Test No Figure Installation after Test No Figure Vehicle after Test No Figure Interior of Vehicle for Test No Figure Summary of Results for MASH Test 3-11 on the Energy-Absorbing Bridge Rail Figure 6.1. Details of the High-Speed Thrie Beam Guardrail Figure 6.2. Test Article/Installation before Test No Figure 6.3. Vehicle/Installation Geometrics for Test No Figure 6.4. Vehicle before Test No Figure 6.5. After Impact Trajectory Path for Test No Figure 6.6. Installation after Test No Figure 6.7. Vehicle after Test No x
13 LIST OF FIGURES Figure Page Figure 6.8. Interior of Vehicle for Test No Figure 6.9. Summary of Results for MASH Test 3-11 on the Thrie Beam Guardrail Figure C1. Vehicle Properties for Test No Figure C2. Vehicle Properties for Test No Figure C3. Vehicle Properties for Test No Figure D1. Sequential Photographs for Test No (Overhead and Frontal Views) Figure D2. Sequential Photographs for Test No (Rear View) Figure D3. Sequential Photographs for Test (Overhead and Frontal Views) Figure D4. Sequential Photographs for Test (Rear View) Figure D5. Sequential Photographs for Test No (Overhead and Frontal Views) Figure D6. Sequential Photographs for Test No (Rear View) Figure E1. Vehicle Angular Displacements for Test No Figure E2. Vehicle Longitudinal Accelerometer Trace for Test No (Accelerometer Located at Center of Gravity) Figure E3. Vehicle Lateral Accelerometer Trace for Test No (Accelerometer Located at Center of Gravity) Figure E4. Vehicle Vertical Accelerometer Trace for Test No (Accelerometer Located at Center of Gravity) Figure E5. Vehicle Longitudinal Accelerometer Trace for Test No (Accelerometer Located over Rear Axle) Figure E6. Vehicle Lateral Accelerometer Trace for Test No (Accelerometer Located over Rear Axle) Figure E7. Vehicle Vertical Accelerometer Trace for Test No (Accelerometer Located over Rear Axle) Figure E8. Vehicle Angular Displacements for Test No Figure E9. Vehicle Longitudinal Accelerometer Trace for Test No (Accelerometer Located at Center of Gravity) Figure E10. Vehicle Lateral Accelerometer Trace for Test No (Accelerometer Located at Center of Gravity) Figure E11. Vehicle Vertical Accelerometer Trace for Test No (Accelerometer Located at Center of Gravity) Figure E12. Vehicle Longitudinal Accelerometer Trace for Test No (Accelerometer Located over Rear Axle) Figure E13. Vehicle Lateral Accelerometer Trace for Test No (Accelerometer Located over Rear Axle) Figure E14. Vehicle Vertical Accelerometer Trace for Test No (Accelerometer Located over Rear Axle) Figure E15. Vehicle Angular Displacements for Test No Figure E16. Vehicle Longitudinal Accelerometer Trace for Test No (Accelerometer Located at Center of Gravity) Figure E17. Vehicle Lateral Accelerometer Trace for Test No (Accelerometer Located at Center of Gravity) xi
14 LIST OF FIGURES Figure Page Figure E18. Vehicle Vertical Accelerometer Trace for Test No (Accelerometer Located at Center of Gravity) Figure E19. Vehicle Longitudinal Accelerometer Trace for Test No (Accelerometer Located over Rear Axle) Figure E20. Vehicle Lateral Accelerometer Trace for Test No (Accelerometer Located over Rear Axle) Figure E21. Vehicle Vertical Accelerometer Trace for Test No (Accelerometer Located over Rear Axle) Figure G1. Test Day Static Soil Strength Documentation Figure G2. Summary of Strong Soil Test Results for Establishing Installation Procedure xii
15 LIST OF TABLES Table Page Table 7.1. Performance Evaluation Summary for MASH Test 3-10 on the Energy-Absorbing Bridge Rail Table 7.2. Performance Evaluation Summary for MASH Test 3-11 on the Energy-Absorbing Bridge Rail Table 7.3. Performance Evaluation Summary for MASH Test 3-11 on the Thrie Beam Guardrail Table C1. Exterior Crush Measurements for Test No Table C2. Occupant Compartment Measurements for Test No Table C3. Exterior Crush Measurements for Test No Table C4. Occupant Compartment Measurements for Test No Table C5. Exterior Crush Measurements for Test No Table C6. Occupant Compartment Measurements for Test No xiii
16
17 CHAPTER 1. INTRODUCTION INTRODUCTION The Texas Department of Transportation (TxDOT) is embarking on a multi-decade effort to expand the state s transportation system. TxDOT has expressed an interest in using higher design speeds (above 80 mi/h) for some of these facilities to promote faster and more efficient travel within the state. Under National Cooperative Highway Research Program (NCHRP) Report 350, roadside hardware was tested at a speed of 62 mi/h for passenger vehicles (1). The update to NCHRP Report 350, known as the American Association of State Highway and Transportation Officials (AASHTO) Manual for Assessing Safety Hardware (MASH), retains this design impact speed (2). This impact speed was derived from analyses of reconstructed crash data collected on roads with design speeds up to 70 mi/h. It is reasonable to expect that both posted speeds and operating speeds will exceed these values on some of the high-speed roadways being considered by TxDOT. The increased speeds will place more demand on roadside safety features. The ability of existing roadside safety features to accommodate more severe, higher energy impacts is not known. For economic reasons, many existing roadside safety features are optimized for the current design impact conditions. Consequently, they have little or no factor of safety for accommodating more severe impacts. Thus, existing safety devices may not be appropriate for use on facilities with higher design or operating speeds and new designs may be required. DESIGN IMPACT CONDITIONS At the beginning of the project, the researchers met with the project monitoring committee to establish design impact conditions for the development of roadside safety features for use on roadways with high design speeds. Impact conditions are generally defined by vehicle type, vehicle mass, impact speed, and impact angle. Under TxDOT research project , Development of High Speed Roadway Design Criteria and Evaluation of Roadside Safety Features, recommended design impact speeds for roadways with high design speeds were derived (3). The roadway design speed selected for the project was 100 mi/h. Based on this roadway design speed and recommendations developed under research project , a design impact speed of 85 mi/h was selected for the impact performance evaluation of high-speed roadside safety hardware under this project. Under project , researchers found little justification for decreasing the impact angle as the impact speed increases. It was recommended that an impact angle of 25 degrees be maintained for crash testing roadside safety devices for very high speed roadways until better data become available. It was agreed to follow this recommendation, and a design impact angle of 25 degrees was chosen for this project. 1
18 Although it was not yet published during the performance of this project, it was decided that the testing and evaluation of safety features under this project follow the MASH guidelines. MASH has superseded NCHRP Report 350 as the recommended procedures for the impact performance evaluation of roadside safety features. The design test vehicles in MASH include a 2425-lb passenger car and a 5000-lb, ½-ton, 4-door, pickup truck. Both of these vehicles are heavier than the design vehicles utilized under NCHRP Report 350. OBJECTIVES/SCOPE OF RESEARCH The objective of this research was to initiate the development of roadside safety hardware suitable for use on very high speed highways. Engineering analyses and finite element simulations were used to evaluate the impact performance of selected roadside safety devices subjected to very high-speed impacts. Two systems were selected for further evaluation through full-scale crash tests: an energy-absorbing bridge rail concept and a modified wood post thrie beam guardrail system. This report presents the results of the analyses, testing, and evaluation of these two barrier systems. Chapter 2 presents the design and analysis of the energy absorbing bridge rail concept. Chapter 3 summarizes the simulation analyses of the modified wood post thrie beam. The full scale crash testing of the energy absorbing bridge rail and modified wood post thrie beam are presented in Chapter 4 and Chapter 5, respectively. A summary of the research results and conclusions is presented in Chapter 6, and implementation recommendations are discussed in Chapter 7. 2

19 CHAPTER 2. DESIGN AND ANALYSES OF AN ENERGY ABSORBING BRIDGE RAIL INTRODUCTION The researchers developed an energy absorbing bridge rail concept to try to accommodate MASH testing criteria at impact speeds of 85 mi/h. Several design parameters related to this concept were evaluated using finite element analyses. Details of the design and analysis process are presented in this chapter. DESIGN AND ANALYSIS TxDOT engineers requested that the bridge rail system incorporate a concrete parapet. Several common concrete barrier profiles were evaluated in a previous phase of this research using finite element simulation (4). While the performance issues varied depending on the profile of the concrete barrier, none were able to meet the MASH evaluation criteria for the highspeed impact conditions. Therefore, the basic concept of the energy absorbing bridge rail shown in Figure 2.1 was conceived. This concept involves using a vertical concrete wall to support two tubular steel rails. Pipe spacers are incorporated into the system to offset the tubular rails from the rigid concrete parapet and to function as an energy-absorbing mechanism. The spacers are intended to deform upon vehicle impact and, thereby, absorb some of the vehicle s kinetic energy to lessen the impact severity below that of impacting a rigid concrete wall. Figure 2.1. Conceptual Drawing of the Energy Absorbing Bridge Rail. 3

20 Vehicle impact simulations were performed on the conceptual design using the commercially available finite element analysis code LS-DYNA (5). LS-DYNA is a general purpose finite element code capable of simulating complex nonlinear dynamic impact problems. The performance of the bridge rail was evaluated following MASH criteria for a test level 3 (TL-3) impact, except that the impact speed of the vehicles was 85 mi/h rather than 62 mi/h. The finite element model of the rail is depicted in Figure 2.2. The 32-inch tall vertical concrete wall was modeled using a rigid material representation. The 12-inch tall, 8-inch diameter Schedule 40 pipe spacers were modeled using an elastic-plastic material representation with the properties of ASTM A53 steel. In the conceptual design, the pipes spacers were connected to the wall using bolts that pass through the concrete wall. A second bolt or stud is used to attach the two 6-inch 4-inch ¼-inch tubular steel rails to the traffic side of the pipe spacer. The two tubular steel rail sections were additionally connected to each other mid-span between pipe spacers using a through-bolt that passed from the top surface of the top rail to the bottom surface of the bottom rail. Since no significant damage of these bolts was anticipated, they were modeled using nodal-rigid-body constraints in LS-DYNA. The use of nodal rigid body constraints in lieu of an explicit bolt model reduces the complexity of the model by eliminating edge contacts between the bolt shaft and hole that are generally difficult to numerically enforce. It also reduces computational time by eliminating the need for further mesh refinement. Figure 2.2. Finite Element Model of the Energy Absorbing Bridge Rail. 4
.")

21 To evaluate the performance of the bridge rail under MASH criteria, impact simulations were performed with models of a pickup truck and small passenger car. The pickup truck model used was a ½-ton, 4-door Chevrolet Silverado with a weight of 5000 lb (see Figure 2.3). This model was developed by the National Crash Analysis Center under sponsorship from Federal Highway Administration and the National Highway Traffic Safety Administration. The MASH test matrix for longitudinal barriers also includes a test with a 2425-lb passenger car. Since a public domain finite element model of this design vehicle was not available at the time of this research, the researchers chose to use a 2900-lb Dodge Neon model to evaluate the impact performance of the bridge rail for test designation 3-10 (see Figure 2.3). This model was considered to be a reasonable alternative for the 2425-lb design passenger car vehicle in a previous phase of this research study (4). In all of the simulations performed, the vehicle impacted the rail at a speed of 85 mi/h and an angle of 25 degrees. Figure 2.3. Finite Element Models Used in the Simulation Analysis. Several key design parameters were evaluated using the finite element simulations. Findings from these simulation analyses are presented below. Rail Size The researchers initially performed a simulation with the pickup truck vehicle impacting two 6-inch 4-inch 0.25-inch tubular rail sections. The impact resulted in significant deformation of the steel tubes. A significant reduction in the rail deformation was observed in a subsequent impact simulation that incorporated two 6-inch 6-inch 0.25-inch tubular rail members. To reduce maintenance cost by reducing the amount of damage to the tubular rail elements, the researchers selected the 6-inch 6-inch 0.25-inch steel tubes for use in the bridge rail system. Rail Height The initial height of the tubular steel rails evaluated through simulation was 27 inches. The results of the simulation showed the pickup truck rolling over as it was redirected by the barrier. In a subsequent design iteration, the height of the rail was raised to 31 inches. Even though significant roll was observed (see Figure 2.4), the pickup truck did not rollover. 5

 that was at the allowable threshold of 12 m/s and significant damage to the vehicle s occupant compartment as shown in")
22 Although vehicle stability was judged to be marginal, the rail height was not further increased due to concern that it would degrade the impact performance of the small car as discussed below. Figure 2.4. Pickup Truck Redirects but has a High Roll after Impact with the Rail at 31-Inch Rail Height. A simulation with the 2900-lb passenger car model was performed with the tubular rails set at a height of 31 inches to the top of the stacked rails. The car was redirected in a stable manner. However, the high impact severity resulted in an occupant impact velocity (OIV) that was at the allowable threshold of 12 m/s and significant damage to the vehicle s occupant compartment as shown in Figure 2.5. The occupant compartment deformation was aggravated by the proximity of the tubular steel rails to the vehicles A-pillar. It was hypothesized that if the height of the steel rails could be reduced, or if the two rail tubes were separated such that the bottom rail could engage the small car at a lower height, it might prevent the vehicle from trying to under-ride the rails, thus lowering the occupant compartment deformation. Figure 2.5. Deformation of the Small Car after Impact with the Rail at 36-Inch Rail Height. 6
23 It was already known that reducing the height of the rail by four inches results in rollover of the pickup truck. The researchers performed another small car simulation with the height of the tubular steel rails lowered two inches (i.e., 29 inch mounting height). The simulation of the small car into the bridge rail with a 2-inch reduction in rail height did not result in any significant reduction in occupant compartment deformation. The researchers then performed another simulation in which the two 6-inch 6-inch rail sections were separated from one another. The height of the upper rail was kept at 31 inches to help maintain stability of the pickup truck. The height of the lower rail was reduced by 4 inches to determine if lower interaction on the small car could help reduce occupant compartment deformation. The results of this simulation did not show any significant differences in the occupant compartment deformation of the small car compared to that observed in the case of the stacked rail members. The height of the rail was thus kept at 31 inches to the top of the rail in the final design. Marginal impact performance was predicted for both design vehicles. Significant vehicle roll was expected for the pickup truck impact, and high occupant compartment deformation was expected for the small passenger car. Pipe Thickness Results of the simulation analysis indicated that some of the Schedule 40 pipe spacers collapsed quickly during the pickup truck impact prior to any substantial redirection of the vehicle. Once the pipes collapse in the region of impact, the stiffness of the rail increases significantly and the energy management becomes less controlled. It was theorized that if the rate of collapse of the pipe spacers could be reduced through the use of stiffer pipe sections, the impulse on the pickup truck would be reduced and vehicle stability could be improved. To investigate this theory, a pickup truck impact simulation was performed with thicker Schedule 80 pipe spacers substituted for the Schedule 40 pipe spacers. The results were not significantly different from those for the system with Schedule 40 pipes (see Figure 2.6). Furthermore, none of the Schedule 80 pipes spacers were fully collapsed and this raised concern that the added stiffness could further increase the severity of the small car impact. Therefore, Schedule 40 pipes spacers were used in the final design. Pipe Spacing The researchers also evaluated the affect of pipe spacing on the overall performance of the rail. It was expected the by placing the pipes closer, the collapse of the pipes will occur at a slower rate, which may reduce the occupant compartment deformation in the small passenger vehicle and/or improve stability of the pickup. A small passenger car impact simulation was performed with the Schedule 40 pipes spacing on 4-ft centers along the length of the rail. The results were compared to those for the rail with 6.25-ft pipe spacing. The results are shown in Figure 2.7. While the pipes collapsed at a slower rate when placed closer together, no significant differences were observed in the occupant compartment deformation. Thus the larger pipe spacing of 6.25-ft was selected for the final design. 7
 and")
24 Figure 2.6. Performance of Schedule 40 (Top) and Schedule 80 (Bottom) Pipe Spacers. 8

25 6.25-ft pipe spacing 4-ft pipe spacing 6.25-ft pipe spacing 4-ft pipe spacing Figure 2.7. Affect of Pipe Spacing. 9
26 CONCLUSIONS Based on the simulation analyses, the results of the 85 mi/h impacts into the energy absorbing bridge rail were expected to be marginal for both the small car and pickup truck. Even though the pickup truck did not roll over in the simulation analysis, the results predicted a high vehicle roll angle during redirection, which had the possibility of leading to a rollover in an actual crash test. The small passenger car impact simulations indicated an occupant impact velocity near the maximum acceptable value of 12 m/s and high deformation of the occupant compartment, more specifically to the A-pillar, side doors, front impact wheel area, and the windshield. However, although the results were predicted to be marginal, the analyses did not indicate any obvious failure for either vehicle. Therefore, after consultation with the project director, a decision was made to subject the bridge rail design to further evaluation through fullscale crash testing. The results of the crash testing are presented in Chapter 4. 10
27 CHAPTER 3. ANALYSIS OF A MODIFIED WOOD POST THRIE BEAM GUARDRAIL SYSTEM In the first year of this project, finite element models of the selected hardware devices were developed, validated, and used in high-speed impact simulations to assess the ability of each device to meet safety performance guidelines for very high speed applications. One of the guardrail systems evaluated was the modified thrie beam. The modified thrie beam guardrail is the result of improvements to the standard thrie beam guardrail and was specifically designed as a high-containment system to reduce the rollover incidences for heavy vehicle impacts. The system incorporates deep offset blocks that are designed to reduce snagging interaction between the impacting vehicle and support posts, and help keep the thrie beam rail vertically aligned during impact to reduce the probability of vehicle climb, vaulting, and/or instability. It was observed in the high-speed simulations that the steel blockouts deformed and collapsed as the vehicle progressed through the system. This reduced the offset distance between the rail and posts and led to significant interaction between the front wheel assembly and the guardrail support posts. The front wheel assembly was observed to ride over the twisted and bent steel posts, which in turn imparted a vertical acceleration to the vehicle that helped it climb over the rail. The researchers identified some modifications designed to mitigate the climbing behavior of the pickup truck. The goal of these design modifications was to reduce the interaction between the front wheel assembly and the posts by preventing the collapse of the blockouts that offset the rail from the posts and changing the failure mode of the posts. It was recommended that the steel posts and the blockouts used in the current modified thrie beam design be replaced with wood posts and wood blockouts. Replacing the W14 22 steel blockout with an appropriate depth wood blockout would prevent the collapse of the blockouts during impact, thus maintaining the desired spacing between the vehicle and the posts. It was further recommended that the height of the wood blockout be selected such that the lower corrugation of the thrie beam is unsupported. This permits the bottom of the thrie beam to stay more vertically aligned during impact, further reducing the probability of vehicle climb, vaulting, and/or instability. Replacing the W6 9 steel posts with 6-inch 8-inch wood posts would eliminate the lateral torsional bending mode of failure observed in the steel posts. It was theorized that this will permit the posts to displace further laterally through the soil and further reduce the interaction between the wheels and posts. However, it was recognized that the fracture of the wood posts could lead to pocketing of the vehicle in the rail system. MODELING AND SIMULATION The modified wood post thrie-beam guardrail that was modeled is shown in Figure 3.1. The thrie beam rail is mounted on 6-inch -8 inch wood posts at a height of 34 inches. The rail is offset from the post using partial depth 6-inch 12-inch wood spacer blocks. The bottom 11


28 corrugation of the thrie beam rail is left unsupported. The rail and the blockout are attached to the post using a 5/8-inch diameter 22-inch long bolt. Figure 3.1. Cross Section of the Modified Wood Post Thrie-Beam System from Drawings and Model. The length of the system modeled was 106 ft-3 inches and had 17 wood posts spaced 6 ft-3 inches center to center as shown in Figure 3.2. The ends of the thrie-beam rail were attached to springs that were assigned properties representative of the stiffness of a 37.5-ft long, NCHRP Report 350 TL-3 compliant terminal system. Figure 3.2. System Layout with Vehicle Impact Location. 12

29 The thrie beam rail section was assigned material properties based on published tensile tests of AASHTO M180 steel obtained from guardrail samples. This material was represented through an elastic-plastic definition in LS-DYNA. The soil surrounding the posts was assigned a pressure sensitive geological material definition with parameters that are representative of the AASHTO M147 road base material that is commonly used in test installations. The wood posts were assigned wood properties with a fracture strength derived from commonly known wood strength values. Bolts were assigned elastic-plastic material properties based on ASTM A307 material specifications. The vehicle model used in the impact simulation was a ½-ton, 4-door, Chevrolet Silverado that is representative of the 2270P design vehicle in MASH. This vehicle model was developed by the National Crash Analysis Center under the sponsorship of the Federal Highway Administration. The vehicle was assigned an initial velocity of 85 mi/h and had a 25 degree impact angle with the barrier as shown in Figures 3.2 and 3.3. The vehicle impact location was just before the 7 th post from the upstream end of the barrier as shown in Figure 3.2. Figure 3.3. Iso-Parametric View of the 2270 kg Vehicle Set Up with the Modified Thrie- Beam Rail. The modified wood post thrie beam guardrail system was able to contain and redirect the vehicle. Sequential images of the impact event are shown in Figure 3.4. A total of 11 posts were predicted to fracture during the impact, but there were no obvious signs of pocketing or rail rupture. The maximum rail deflection was 74 inches (see Figure 3.5). The longitudinal acceleration time history for the impact is shown in Figure 3.6. All occupant risk indices were predicted to be acceptable and overall damage to the vehicle was moderate (see Figure 3.7). 13


30 Figure 3.4. Sequential Images of 2270P Impact with Modified Wood Post Thrie Beam Guardrail. Figure 3.5. Impact at Time of Maximum Rail Deflection. 14
 SAE Class 60 Filter 50-msec average Figure 3.6. Longitudinal Acceleration History for CG of the 2270 kg Vehicle.")
31 20 X Acceleration at CG Longitudinal Acceleration (g's) Test Number: simulation Test Article: Mod-Thrie Beam Test Vehicle: 85 mph impact Inertial Mass: 2270 kg Gross Mass: 2270 kg Impact Speed: km/h Impact Angle: 25 degrees Time (sec) SAE Class 60 Filter 50-msec average Figure 3.6. Longitudinal Acceleration History for CG of the 2270 kg Vehicle. Figure 3.7. Damage to the Vehicle in the 85 mi/h Simulation. 15
32 CONCLUSIONS The simulation results indicated that the modified wood post thrie beam guardrail had a reasonable probability of accommodating an 85 mi/h impact. The fracture of the wood posts precluded issues with wheel snagging and vehicle stability that were observed in simulations with the steel post system. The predicted number of fractured posts (11) and the relatively large dynamic deflection (74 inches) raised some concern regarding pocketing and rail rupture. However, the thrie beam rail did not approach its failure strain, and there were not obvious geometric indicators of pocketing. In some respects, the high impact severity caused this strong post guardrail system to behave in a manner similar to a weak post system. After consultation with TxDOT personnel, a decision was made to subject the modified wood post thrie beam guardrail to further evaluation through full-scale crash testing. The results of the crash testing are presented in Chapter 5. 16
33 CHAPTER 4. FULL-SCALE CRASH TEST PROCEDURES TEST FACILITY The full-scale crash tests reported herein were performed at Texas Transportation Institute (TTI) Proving Ground. TTI Proving Ground is an International Standards Organization (ISO) accredited laboratory with American Association for Laboratory Accreditation (A2LA) Mechanical Testing certificate The full-scale crash test was performed according to TTI Proving Ground quality procedures and according to the MASH guidelines and standards. The test facilities at the TTI Proving Ground consist of a 2000 acre complex of research and training facilities situated 10 miles northwest of the main campus of Texas A&M University. The site, formerly an Air Force Base, has large expanses of concrete runways and parking aprons well suited for experimental research and testing in the areas of vehicle performance and handling, vehicle-roadway interaction, durability and efficacy of highway pavements, and safety evaluation of roadside safety hardware. The site selected for the placement of the high-speed bridge rail was along a wide out-of-service runway. The runway consists of an unreinforced jointed concrete pavement in 12.5 ft x 15 ft blocks nominally 8 12 inches deep. The runway is over 50 years old and the joints have some displacement, but are otherwise flat and level. CRASH TEST CONDITIONS Per MASH, the recommended test matrix for longitudinal barriers consists of: MASH test designation 3-10: An 1100C (2425 lb/1100 kg) vehicle impacting the critical impact point (CIP) of the length of need (LON) of the barrier at a nominal impact speed and angle of 62 mi/h and 25 degrees, respectively. The primary objective of this test is to evaluate risk of occupant injury. MASH test designation 3-11: A 2270P (5000 lb/2270 kg) vehicle impacting the critical impact point (CIP) of the length of need (LON) of the barrier at a nominal impact speed and angle of 62 mi/h and 25 degrees, respectively. This test is primary a strength test that evaluates the ability of the barrier to contain and redirect the vehicle in a stable manner. Both of these tests were performed on the energy-absorbing bridge rail. The CIP determined for these tests was 32 ft-8 inches downstream of the end of the bridge rail, or inches upstream of a splice. Only test designation 3-11 was performed on the modified thrie beam guardrail. The CIP determined for this test was midspan between posts 15 and
34 All crash test, data analysis, and evaluation and reporting procedures followed under this project were in accordance with guidelines presented in MASH with the exception of vehicle impact speed. Appendix A presents brief descriptions of these procedures. For this project, the impact speed was increased from the nominal 62 mi/h to 85 mi/h to assess the performance of the barriers under high-speed conditions. EVALUATION CRITERIA The crash tests performed were evaluated in accordance with MASH. As stated in MASH, Safety performance of a highway appurtenance cannot be measured directly but can be judged on the basis of three factors: structural adequacy, occupant risk, and vehicle trajectory after collision. Accordingly, researchers used the safety evaluation criteria from Table 5.1 of MASH to evaluate the crash tests reported herein. 18
35 CHAPTER 5. FULL-SCALE CRASH TESTING OF THE ENERGY ABSORBING BRIDGE RAIL TEST ARTICLE Design and Construction The concrete parapet portion of the bridge rail was similar in design to the TxDOT T221 bridge rail but with additional reinforcement to provide the strength necessary to resist the higher forces generated during the high-speed impacts. The parapet had a 10.5-inch wide wall, a 12-inch wide beam at the top, and was 32 inches tall. Vertical reinforcement in the parapet consisted of #4 U-shaped stirrups spaced on 6-inch centers. The longitudinal reinforcement consisted of six #5 bars spaced at inches on both the traffic and field side of the parapet. The parapet was anchored to an unreinforced concrete runway using two #5 bars. The bars were secured into drilled holes at an embedment depth of 5 inches using an epoxy adhesive. Two 6 inch 6 inch 1/4 inch tubular steel rails were attached to the traffic face of the concrete parapet at a height of 31 inches to the top of the upper rail. Adjacent rail sections were spliced to one another using a 5 inch 5 inch 3/8 inch tubular steel sleeve. A 5/16-inch steel plate was welded to adjoining sides of the 24-inch long sleeve to provide the desired fit inside the rail elements. The splice locations of the upper and lower rail sections were offset from one another a distance of 40 inches. The rails sections were connected to one another using a 3/4-inch diameter x 14-inch long A325 bolt that passed vertically through each of the rail members 20 inches from each splice location, which corresponded to the middle of the overlapped rail section. Pipe spacers were used to offset the steel rail from the concrete parapet and provide a mechanism for dissipating some of the energy of the impacting vehicle. The 8-inch diameter 12-inch long Schedule 40 pipe spacers were spaced 80 inches on center. The pipe spacers were attached to each of the tubular rail members using 5/8-inch diameter x 1-1/2-inch long A307 studs that were welded to the field side of the tubular rails. The pipe spacers were attached to the concrete parapet using a 1-inch diameter bolt inserted through a 3 inch x 1-1/2 inch 11 gauge A36 embedded sleeve. The sleeve provided horizontal tolerance to assist with assembly of the rail. A cross section of the high-speed energy absorbing bridge rail is shown in Figure 5.1. Photographs of the completed test installation are shown in Figure 5.2. Detailed drawings of the bridge rail are presented in Appendix B. Material Specifications The concrete for the parapet was specified to have a 28-day compressive strength of 3600 psi. The concrete strength on the day of the test was 4424 psi. All reinforcing steel was grade 60. The tubular rail sections and tubular splice sleeves were ASTM A500 steel. The pipe spacers were ASTM A53 steel, and the connection bolts used to attach the rails to one another and the pipe spacers to the concrete parapet were ASTM A325. The studs used to connect the pipe spacers to the tubular rail members were ASTM A
36 Figure 5.1. Details of the High-Speed Energy-Absorbing Bridge Rail. 20
37 Figure 5.2. Energy-Absorbing Bridge Rail Installation before Test Nos and 2. 21
38 TEST NO (MASH TEST 3-10) Test Designation and Actual Impact Conditions MASH test 3-10 involves an 1100C vehicle with test inertial mass of 2420 lb ±55 lb impacting the bridge rail at an impact speed of 62.2 mi/h ±2.5 mi/h and an angle of 25 degrees ±1.5 degrees. However, for this test, the target impact speed was 85 mi/h. The target impact point was 32 ft-8 inches downstream from the end of the bridge rail, which corresponded to inches upstream of a splice. The 2002 Kia Rio used in the test had a test inertial mass of 2438 lb, and the actual impact speed and angle were 85.2 mi/h and 25.7 degrees, respectively. The actual impact point was 32 ft-5 inches downstream from the end of the bridge rail. Test Vehicle A 2002 Kia Rio, shown in Figures 5.3 and 5.4, was used for the crash test. Test inertia weight of the vehicle was 2438 lb, and its gross static weight was 2606 lb. The height to the lower edge of the vehicle bumper was 8.50 inches, and the height to the upper edge of the bumper was inches. Figure C1 in Appendix C gives additional dimensions and information on the vehicle. The vehicle was directed into the installation using the cable reverse tow and guidance system and was released to be free-wheeling and unrestrained just prior to impact. Weather Conditions The test was performed on the morning of August 7, Weather conditions at the time of testing were as follows: Wind speed: 10 mi/h; Wind direction: 200 degrees with respect to the vehicle (vehicle was traveling in a southeasterly direction); Temperature: 93 o F, Relative humidity: 42 percent. Test Description The 2002 Kia Rio, traveling at an impact speed of 85.2 mi/h, impacted the energyabsorbing bridge rail 32 ft-5 inches downstream from the end of the bridge rail at an impact angle of 25.7 degrees. Shortly after impact, the metal rail began to deflect as the pipe spacers began to collapse. At s, the windshield began to shatter at the right lower corner. The frame of the passenger door began to deform at s, and the roof over the right front passenger began to deform at s. At s, the glass in the right front passenger door began to shatter at the lower front corner, and at s, the vehicle began to redirect. The glass in the right front passenger door separated from the door frame at s, and the roof reached its maximum deformation at s. 22
39 Figure 5.3. Vehicle/Installation Geometrics for Test No
40 Figure 5.4. Vehicle before Test No
41 At s, the head of the dummy began to extend out of the right front passenger window. The rear of the vehicle contacted the rail at s. At s, the head of the dummy was extended its maximum distance out of the right front passenger window. Due to dust obscuring the view, it could not be ascertained if the head of the dummy actually touched the bridge rail. By s, the head of the dummy re-entered the interior of the vehicle. At s, the vehicle lost contact with the rail traveling at an exit speed and angle of 67.6 mi/h and 3.9 degrees, respectively. As the vehicle continued tracking forward after exiting the test installation, the left front of the vehicle impacted a secondary rigid concrete structure, which induced significant additional damage to the front of the vehicle. The vehicle subsequently came to rest 230 ft downstream of impact and 42 ft toward traffic lanes. Figures D1 and D2 in Appendix D show sequential photographs of the test period. Damage to Test Installation The vehicle contacted the energy-absorbing bridge rail 32 ft-5 inches downstream from the end of the bridge rail and remained in contact with the metal rail element for a distance of 13 ft. The maximum rail deflection was 5.25 inches at joint 2-3. No damage to the concrete wall was evident. Figure 5.5 shows damage to the installation. Vehicle Damage A secondary frontal impact of the redirected vehicle with the end of another rigid concrete barrier complicated the damage assessment of the vehicle. The secondary impact occurred on the left side of the vehicle and, therefore, the following damage on the right side of the vehicle was attributed to the initial impact with the bridge rail. The front bumper, hood, right front fender, right front tire and wheel rim, roof over the passenger side, right B-post, right door and door glass, right rear quarter panel, rear bumper, right side floor pan, right side firewall, and right side kickpanel were damaged due to impact with the energy-absorbing bridge rail. Maximum exterior crush to the right side of the vehicle was 16 inches in the side plane at the right front corner at bumper height. Maximum occupant compartment deformation (OCD) on the right side was 9.0 inches in the firewall area. It is believed that the secondary impact likely contributed to the damage in this area, but the OCD measurement was not adjusted for this. Photographs of the vehicle after the test are shown in Figures 5.6 and 5.7. Exterior crush and occupant compartment measurements are documented in Appendix C, Tables C1 and C2. 25
42 Figure 5.5. Installation after Test No
43 Figure 5.6. Vehicle after Test No
44 Before Test After Test Figure 5.7. Interior of Vehicle for Test No
45 Occupant Risk Factors Data from the accelerometer, located at the vehicle center of gravity, were digitized for evaluation of occupant risk. In the longitudinal direction, the occupant impact velocity was 40.8 ft/s at s, the highest s occupant ridedown acceleration was G from to s, and the maximum s average acceleration was G between and s. In the lateral direction, the occupant impact velocity was 40.7 ft/s at s, the highest s occupant ridedown acceleration was G from to s, and the maximum s average was G between and s. Figure 5.8 summarizes these data and other pertinent information from the test. Figures E1 through E7 in Appendix E present vehicle angular displacements and accelerations versus time traces. Assessment of Test Results An assessment of the test based on the applicable MASH safety evaluation criteria is provided below. Structural Adequacy A. Test article should contain and redirect the vehicle or bring the vehicle to a controlled stop; the vehicle should not penetrate, underride, or override the installation although controlled lateral deflection of the test article is acceptable. Results: The energy-absorbing bridge rail contained and redirected the 1100C vehicle. The vehicle did not penetrate, underride, or override the bridge rail. Maximum dynamic deflection of the metal rail element was 5.25 inches at joint 2-3. (PASS) Occupant Risk D. Detached elements, fragments, or other debris from the test article should not penetrate or show potential for penetrating the occupant compartment, or present an undue hazard to other traffic, pedestrians, or personnel in a work zone. Deformation of, or intrusions into, the occupant compartment should not exceed limits set forth in Section 5.3 and Appendix E of MASH. (roof <4.0 inches; windshield = 3.0 inches; side windows = no shattering by test article structural member; wheel/foot well/toe pan <9.0 inches; forward of A-pillar <12.0 inches; front side door area above seat <9.0 inches; front side door below seat <12.0 inches; floor pan/transmission tunnel area <12.0 inches) 29


46 0.000 s s s s General Information Test Agency... Test No.... Date... Test Article Type... Name... Installation Length... Material or Key Elements... Soil Type and Condition... Test Vehicle Type/Designation... Make and Model... Curb... Test Inertial... Dummy... Gross Static... Texas Transportation Institute Longitudinal Barrier High-Speed Energy-Absorbing Bridge Rail 100 ft Reinforced concrete parapet; tubular steel rails; collapsible pipe spacers Concrete pavement 1100C 2002 Kia Rio 2399 lb 2438 lb 168 lb 2606 lb Impact Conditions Speed... Angle... Location/Orientation... Exit Conditions Speed... Angle... Occupant Risk Values Impact Velocity Longitudinal... Lateral... THIV... Ridedown Accelerations Longitudinal... Lateral... PHD... ASI... Max s Average Longitudinal... Lateral... Vertical mi/h 25.7 degrees 1/3 point 67.6 mi/h 3.9 degrees 24.6 ft/s 40.7 ft/s 48.2 km/h G G 19.0 G G G -5.0 G Post-Impact Trajectory Stopping Distance... Vehicle Stability Maximum Yaw Angle... Maximum Pitch Angle... Maximum Roll Angle... Vehicle Snagging... Vehicle Pocketing... Test Article Deflections Dynamic... Permanent... Working Width... Vehicle Damage VDS... CDC... Max. Exterior Deformation... OCDI... Max. Occupant Compartment Deformation... Figure 5.8. Summary of Results for MASH Test 3-10 on the Energy-Absorbing Bridge Rail. 230 ft dwns 42 ft twd traffic -40 degrees 10 degrees 12 degrees No No 7.5 inches 5.25 inches 1.0 ft 01RFQ6 01FREW inches RF inches 30
47 Occupant Risk (continued) Results: No detached elements, fragments, or other debris from the bridge rail were present to penetrate or show potential for penetrating the occupant compartment, or to present undue hazard to others in the area. (PASS) Maximum occupant compartment deformation was 9.0 inches in the right side floor pan/toe pan area. (PASS) F. The vehicle should remain upright during and after collision. The maximum roll and pitch angles are not to exceed 75 degrees. Results: The 1100C vehicle remained upright during and after the collision event. Maximum roll angle was 13 degrees at 1.7 s, and maximum pitch angle was 10 degrees at 2.00 s. (PASS) H. Occupant impact velocities should satisfy the following: Longitudinal and Lateral Occupant Impact Velocity Preferred Maximum 30 ft/s 40 ft/s Results: Longitudinal occupant impact velocity was 24.6 ft/s, and lateral occupant impact velocity was 40.7 ft/s. (MARGINAL) I. Occupant ridedown accelerations should satisfy the following: Longitudinal and Lateral Occupant Ridedown Accelerations Preferred Maximum 15.0 Gs Gs Results: Longitudinal ridedown acceleration was G, and lateral ridedown acceleration was G. (PASS) Vehicle Trajectory For redirective devices, the vehicle shall exit the barrier within the exit box. Result: The 1100C vehicle exited within the exit box. (PASS) The vehicle came to rest 230 ft downstream of impact and 42 ft toward traffic lanes. 31
48 TEST NO (MASH TEST DESIGNATION 3-11) Test Designation and Actual Impact Conditions MASH test 3-11 involves a 2270P vehicle weighing 5000 lb ±100 lb impacting the bridge rail at an impact speed of 62.2 mi/h ±2.5 mi/h and an angle of 25 degrees ±1.5 degrees. However, for this test, the target impact speed was 85 mi/h. The target impact point was 24 inches upstream of the centerline of the sixth pipe spacer. The Dodge Ram 1500 Quad-Cab pickup used in the test weighed 5006 lb, and the actual impact speed and angle were 86.4 mi/h and 25.3 degrees, respectively. The actual impact point was 24 inches upstream of the centerline of the sixth spacer. Test Vehicle A 2002 Dodge Ram 1500 Quad-Cab pickup, shown in Figures 5.9 and 5.10, was used for the crash test. Test inertia weight of the vehicle was 5006 lb, and its gross static weight was 5006 lb. The height to the lower edge of the pickup bumper was 13.5 inches, and height to the upper edge of the bumper was 26.0 inches. Height to the center of gravity of the pickup was inches. Figure C2 in Appendix C gives additional dimensions and information on the vehicle. The vehicle was directed into the installation using the cable reverse tow and guidance system, and was released to be free-wheeling and unrestrained just prior to impact. Weather Conditions The test was performed on the morning of August 14, Weather conditions at the time of testing were as follows: Wind speed: 10 mi/h; Wind direction: 192 degrees with respect to the vehicle (vehicle was traveling in a southeasterly direction); Temperature: 88 o F, Relative humidity: 59 percent. Test Description The 2002 Dodge Ram 1500 Quad-Cab pickup, traveling at an impact speed of 86.4 mi/h, impacted the energy absorbing bridge rail 2 ft upstream of the centerline of the sixth pipe spacer. Shortly after impact, the metal rail began to deflect as the pipe spacers began to collapse. At s, the top of the right front passenger door separated from the door frame of the vehicle. At s, the windshield began to crack in the lower right corner and the top of the right rear door began to separate from the door frame. At s, the vehicle began to redirect, and at s, the right front door glass began to shatter. At s, the vehicle was parallel to the barrier and was traveling at a speed of 73.1 mi/h. The rear of the vehicle reached its maximum pitch at s. At s, the vehicle lost contact with the bridge rail traveling at an exit speed and exit angle of 71.6 mi/h and 4.6 degrees, respectively. After losing contact with the rail, the vehicle rolled onto its impact side and then flipped several times before coming to rest. Figures D3 and D4 in Appendix D show sequential photographs of the test period. 32
49 Figure 5.9. Vehicle/Installation Geometrics for Test No
50 Figure Vehicle before Test No
51 Damage to Test Installation Damage to the bridge rail is shown in Figures 5.11 and The fifth through eighth pipe spacers between the concrete parapet and the metal rail were deformed. The rail had a maximum permanent deflection of 6.5 inches between the sixth and seventh pipe spacer. Working width was 2.38 ft. Vehicle Damage After redirecting and exiting the barrier, the pickup truck rolled over two and one-half times, struck a tree, and subsequently came to rest on its wheels. Damage to the vehicle due to the rollover event was extensive, and it is unclear how much damage is attributable to the secondary impact with the tree. The right side frame rail, left rear spring, the right front upper and lower A-arms and ball joints were deformed, the right front wheel assembly separated at the ball joints, and the right rear wheel assembly separated at the rear axle. The right front door also separated from the truck. Also damaged were the front bumper, hood, grill, radiator and support, fan, water pump, windshield, right side A-B-C posts, right passenger door and glass, roof and rear glass, cargo bed, tailgate, and rear bumper. Maximum exterior crush to the vehicle was estimated to be 20 inches. Maximum occupant compartment deformation was 8.3 inches near the floor pan in the lateral area across the cab from kickpanel to kickpanel. Photographs of the vehicle after the test are shown in Figures 5.13 and Exterior crush and occupant compartment measurements are documented in Appendix C, Tables C3 and C4. Occupant Risk Factors Data from the accelerometer, located at the vehicle center of gravity, were digitized for evaluation of occupant risk. In the longitudinal direction, the occupant impact velocity was 17.4 ft/s at s, the highest s occupant ridedown acceleration was -7.9 G from to s, and the maximum s average acceleration was -9.0 G between and s. In the lateral direction, the occupant impact velocity was 31.8 ft/s at s, the highest s occupant ridedown acceleration was G from to s, and the maximum s average was G between and s. Figure 5.15 presents these data and other pertinent information from the test. Figures E8 through E14 in Appendix E presents vehicle angular displacements and accelerations versus time traces. 35

52 Figure After Impact Trajectory Path for Test No
53 Figure Installation after Test No


54 Figure Vehicle after Test No

55 Figure Interior of Vehicle for Test No

56 0.000 s s s s General Information Test Agency... Test No.... Date... Test Article Type... Name... Installation Length... Material or Key Elements... Soil Type and Condition... Test Vehicle Type/Designation... Make and Model... Curb... Test Inertial... Dummy... Gross Static... Texas Transportation Institute Longitudinal Barrier Energy-Absorbing Bridge Rail High-Speed Energy-Absorbing Bridge Rail 100 ft Reinforced concrete parapet; tubular steel rails; collapsible pipe spacers Concrete pavement 2270P 2002 Dodge Ram 1500 Pickup No dummy 5006 Impact Conditions Speed... Angle... Location/Orientation... Exit Conditions Speed... Angle... Occupant Risk Values Impact Velocity Longitudinal... Lateral... THIV... Ridedown Accelerations Longitudinal... Lateral... PHS... ASI... Max s Average Longitudinal... Lateral... Vertical mi/h 25.3 degrees 71.6 mi/h 4.6 degrees 17.4 ft/s 31.8 ft/s 37.9 km/h -7.9 G G 13.6 G G G 4.9 G Post-Impact Trajectory Stopping Distance... Vehicle Stability Maximum Yaw Angle... Maximum Pitch Angle... Maximum Roll Angle... Vehicle Snagging... Vehicle Pocketing... Test Article Deflections Dynamic... Permanent... Working Width... Vehicle Damage VDS... CDC... Max. Exterior Deformation... OCDI... Max. Occupant Compartment Deformation ft ds 23 ft twd traffic -130 deg -7 deg 168 deg No No Not obtainable 6.5 inches 2.38 ft 01RFQ6 01FREW6 ~20 inches RF inches Figure Summary of Results for MASH Test 3-11 on the Energy-Absorbing Bridge Rail. 40
57 Assessment of Test Results An assessment of the test based on the applicable MASH safety evaluation criteria is provided below. Structural Adequacy B. Test article should contain and redirect the vehicle or bring the vehicle to a controlled stop; the vehicle should not penetrate, underride, or override the installation although controlled lateral deflection of the test article is acceptable. Results: The energy-absorbing bridge rail contained and redirected the 2270P vehicle. The vehicle did not penetrate, underride, or override the installation. Maximum deformation of the metal rail was 6.5 inches. (PASS) Occupant Risk D. Detached elements, fragments, or other debris from the test article should not penetrate or show potential for penetrating the occupant compartment, or present an undue hazard to other traffic, pedestrians, or personnel in a work zone. Deformation of, or intrusions into, the occupant compartment should not exceed limits set forth in Section 5.3 and Appendix E of MASH. (roof <4.0 inches; windshield = <3.0 inches; side windows = no shattering by test article structural member; wheel/foot well/toe pan <9.0 inches; forward of A-pillar <12.0 inches; front side door area above seat <9.0 inches; front side door below seat <12.0 inches; floor pan/transmission tunnel area <12.0 inches) Results: No detached elements, fragments, or other debris from the bridge rail were present to penetrate or to show potential for penetrating the occupant compartment, or to present undue hazard to others in the area. (PASS) Maximum occupant compartment deformation was 8.3 inches in the lateral area across the cab from kickpanel to kickpanel near the floor pan. (PASS) F. The vehicle should remain upright during and after collision. The maximum roll and pitch angles are not to exceed 75 degrees. Results: The 2270P vehicle remained upright during the collision event. However, upon exiting the bridge rail, the vehicle rolled several times and came to rest upright. (FAIL) 41
58 I. Occupant impact velocities should satisfy the following: Longitudinal and Lateral Occupant Impact Velocity Preferred Maximum 30 ft/s 40 ft/s Results: Longitudinal occupant impact velocity was 17.4 ft/s, and lateral occupant impact velocity was 31.8 ft/s. (PASS) I. Occupant ridedown accelerations should satisfy the following: Longitudinal and Lateral Occupant Ridedown Accelerations Preferred Maximum 15.0 Gs Gs Results: Longitudinal occupant ridedown acceleration was -7.9 G, and lateral occupant ridedown acceleration was G. (PASS) Vehicle Trajectory For redirective devices, the vehicle shall exit the barrier within the exit box. Result: The 2270P vehicle exited within the exit box. (PASS) The vehicle came to rest 85 ft downstream of impact and 23 ft toward traffic lanes. 42
59 CHAPTER 6. FULL-SCALE CRASH TESTING OF THE MODIFIED WOOD POST THRIE BEAM GUARDRAIL TEST ARTICLE Design and Construction The modified wood post thrie beam guardrail incorporates a standard 12-gauge thrie beam rail section mounted at a height of 34 inches on 6-inch x 8-inch x 6 ft-6 inch long wood posts. The posts were spaced on 6 ft-3 inch centers and embedded 43 inches a compacted road base material. The rail was offset from the posts using 6-inch wide x 12-inch deep wood spacer blocks. The length of the spacer blocks was 16 inches, which left the bottom corrugation of the thrie beam rail unsupported. The rail was attached to the blockout and post using a single 5/8-inch diameter x 22-inch long button head bolt through the upper post bolt slot in the thrie beam section. The rail splices were located midspan between posts. The length of the thrie beam rail section was 150 ft. A 6 ft-3 inch transition section was used to transition the thrie beam to a W-beam rail. A 37.5 ft, wood post ET-PLUS terminal was attached to the transition section. The W-beam rail in the terminal section was tapered down from a height of 30 inches to 27 inches over a distance of 25 ft. The overall length of the installation was ft. A cross section of the modified wood post thrie beam guardrail is shown in Figure 6.1. Photographs of the completed test installation are shown in Figure 6.2. Detailed drawings of the bridge rail are presented in Appendix F. Material Specifications The thrie beam and W-beam guardrail conformed to AASHTO M180. The wood posts were Grade 1 southern yellow pine. The posts were installed in soil meeting AASHTO standard specifications for Materials for Aggregate and Soil Aggregate Subbase, Base and Surface Courses, designated M147-65(2004), grading B. The guardrail post bolts and rail splice bolts were ASTM A307. Soil Conditions No rainfall occurred during the 10 days prior to the test. Moisture content of the AASHTO M147-65(2004), grading B base in which the modified thrie beam guardrail was installed was 6.1 percent. In accordance with Appendix B of MASH, soil strength was measured the day of the crash test (see Appendix G, Figure G1). During installation of the modified thrie beam guardrail, two W6x16 posts were installed in the immediate vicinity of the barrier utilizing the same fill material and installation procedures used in the previously conducted standard dynamic test (see Appendix G, Figure G2). 43
60 As determined from the test results shown in Appendix G, Figure G2, the minimum post load required for deflections at 5 inches, 10 inches, and 15 inches, measured at a height of 25 inches, is 3940 lb, 5500 lb, and 6540 lb, respectively (90 percent of static load for the initial standard installation). On the day of the test, April 14, 2009, loads on the post at deflections of 5 inches, 10 inches, and 15 inches were 7000 lbf, 9060 lbf, and 10,000 lbf, respectively. The strength of the backfill material met minimum requirements. Figure 6.1. Details of the High-Speed Thrie Beam Guardrail. 44
61 Figure 6.2. Test Article/Installation before Test No
62 TEST NO (MASH TEST DESIGNATION 3-11) Test Vehicle A 2003 Dodge Ram 1500 Quad-Cab pickup, shown in Figures 6.3 and 6.4, was used for the crash test. Test inertia weight of the vehicle was 5019 lb, and its gross static weight was 5019 lb. The height to the lower edge of the vehicle bumper was 13.5 inches, and height to the upper edge of the bumper was 26.0 inches. Height to the center of gravity of the pickup was inches. Figure C3 in Appendix C gives additional dimensions and information on the vehicle. The vehicle was directed into the installation using the cable reverse tow and guidance system, and was released to be free-wheeling and unrestrained just prior to impact. Weather Conditions The test was performed on the morning of August 21, No rainfall occurred during the 10 days prior to the test date. Weather conditions at the time of testing were as follows: Wind speed: 5 mi/h; Wind direction: 213 degrees with respect to the vehicle (vehicle was traveling in a northerly direction); Temperature: 88 o F, Relative humidity: 66 percent. Test Description The 2003 Dodge Ram 1500 Quad-Cab pickup impacted the thrie beam guardrail at midspan between posts 15 and 16 at an impact speed of 84.1 mi/h and an impact angle of 25.6 degrees. At s after impact, the bumper of the vehicle reached post 16, and post 15 began to deflect toward the field side. Post 17 began to move toward the field side at s, and post 16 fractured at ground level at s. At s, post 18 began to move toward the field side and posts began to rotate clockwise. Post 17 fractured at ground level at s, and the vehicle began to redirect slightly as the vehicle bumper reached post 17 at s. At s, post 19 began to move toward the field side, and at s, post 18 fractured at ground level. The blockout at post 15 separated from the rail at s. Between s and s, the end anchorage failed and released the upstream end of the rail. Post 19 fractured at ground level at s. At s, the rail separated from post 13, and at s, the rail began to pull post 20 toward traffic lanes. At s, the left front corner of the vehicle contacted the elbow that had formed at the location of post 20. The rail separated from post 14 at s, and the rail wrapped around the side of post 21 at s as the vehicle traveled behind the post. The vehicle continued to travel behind the guardrail and came to rest facing the field side 19 ft away from the field side of the guardrail between posts 30 and 31. Figures D5 and D6 in Appendix D show sequential photographs of the test period. 46
63 Figure 6.3. Vehicle/Installation Geometrics for Test No


64 Figure 6.4. Vehicle before Test No
65 Damage to Test Installation Damage to the thrie beam guardrail is shown in Figures 6.5 and 6.6. Post 1 moved downstream through the soil 1 inch, and post 2 was rotated 30 degrees clockwise and leaning downstream 10 degrees. The anchor bracket connecting the anchor cable to the rail between posts 1 and 2 was pulled out of the rail. Posts 3 5 and 7 were split vertically and the thrie beam rail separated from the posts. Post 6 was split vertically and fractured at ground level. The thrie beam rail separated from posts 8 23, and posts were fractured at ground level. The thrie beam rail element was wrapped around post 24, which was leaning downstream at an angle of 6 degrees and had moved upstream through the soil 2.75 inches. Vehicle Damage The 2270P vehicle sustained damage to the right upper and lower ball joints, right upper and lower A-arms, right tie rod, and sway bar. Also, the front bumper, hood, right front fender, right front tire and wheel rim, right front door, right rear door, right rear exterior bed, right rear wheel rim, and rear bumper were deformed. The left front fender was dented. Maximum exterior crush to the vehicle was 18 inches in the front plane at the right front corner at bumper height. No deformation or intrusion of the occupant compartment occurred. Photographs of the vehicle are shown in Figures 6.7 and 6.8. Exterior crush and occupant compartment measurements are documented in Appendix C, Tables C5 and C6. Occupant Risk Factors Data from the accelerometer, located at the vehicle center of gravity, were digitized for evaluation of occupant risk. In the longitudinal direction, the occupant impact velocity was 15.4 ft/s at s, the highest s occupant ridedown acceleration was G from to s, and the maximum s average acceleration was -9.0 G between and s. In the lateral direction, the occupant impact velocity was 16.1 ft/s at s, the highest s occupant ridedown acceleration was -5.9 G from to s, and the maximum s average was -5.7 G between and s. Figure 6.9 summarizes these data and other pertinent information from the test. Figures E15 through E21 in Appendix E presents vehicle angular displacements and accelerations versus time traces. 49
66 Figure 6.5. After Impact Trajectory Path for Test No
67 Figure 6.6. Installation after Test No
68 Figure 6.7. Vehicle after Test No

69 Before Test After Test Figure 6.8. Interior of Vehicle for Test No

70 0.000 s s s s General Information Test Agency... Test No.... Date... Test Article Type... Name... Installation Length... Material or Key Elements... Soil Type and Condition... Test Vehicle Type/Designation... Make and Model... Curb... Test Inertial... Dummy... Gross Static... Texas Transportation Institute Longitudinal Barrier High-Speed Thire Beam Guardrail ft 12 ga. Thrie beam rail; 6 in x 8 in. wood posts; 12 in deep wood blocks; rail splices at midspan 2270P 2003 Dodge Ram 1500 Pickup No dummy 5019 Impact Conditions Speed... Angle... Location/Orientation... Exit Conditions Speed... Angle... Occupant Risk Values Impact Velocity Longitudinal... Lateral... THIV... Ridedown Accelerations Longitudinal... Lateral... PHS... ASI... Max s Average Longitudinal... Lateral... Vertical mi/h 25.6 degrees Out of view Out of view 15.4 ft/s 16.1 ft/s 23.0 km/h G -5.9 G 14.0 G G -5.7 G -3.9 G Post-Impact Trajectory Stopping Distance... Vehicle Stability Maximum Yaw Angle... Maximum Pitch Angle... Maximum Roll Angle... Vehicle Snagging... Vehicle Pocketing... Test Article Deflections Dynamic... Permanent... Working Width... Vehicle Damage VDS... CDC... Max. Exterior Deformation... OCDI... Max. Occupant Compartment Deformation... Figure 6.9. Summary of Results for MASH Test 3-11 on the Thrie Beam Guardrail. 94 ft dwnst 19 ft twd field side -124 deg -15 deg 38 deg No Yes Ruptured Ruptured 39.5 ft 11LFQ6 11FLEW6 18 inches LF
71 Assessment of Test Results An assessment of the test based on the applicable MASH safety evaluation criteria is provided below. Structural Adequacy A. Test article should contain and redirect the vehicle or bring the vehicle to a controlled stop; the vehicle should not penetrate, underride, or override the installation although controlled lateral deflection of the test article is acceptable. Results: The high-speed thrie beam guardrail did not contain the 2270P vehicle. The vehicle penetrated the rail and came to rest on the field side. (FAIL) Occupant Risk D. Detached elements, fragments, or other debris from the test article should not penetrate or show potential for penetrating the occupant compartment, or present an undue hazard to other traffic, pedestrians, or personnel in a work zone. Deformation of, or intrusions into, the occupant compartment should not exceed limits set forth in Section 5.3 and Appendix E of MASH. (roof <4.0 inches; windshield = <3.0 inches; side windows = no shattering by test article structural member; wheel/foot well/toe pan <9.0 inches; forward of A-pillar <12.0 inches; front side door area above seat <9.0 inches; front side door below seat <12.0 inches; floor pan/transmission tunnel area <12.0 inches) Results: Several posts fractured at ground level, but remained relatively close to the installation. This debris did not penetrate or show potential for penetrating the occupant compartment, or to present hazard to others in the area. No occupant compartment deformation occurred. (PASS) F. The vehicle should remain upright during and after collision. The maximum roll and pitch angles are not to exceed 75 degrees. Results: The 2270P vehicle remained upright during and after the collision event. (PASS) H. Occupant impact velocities should satisfy the following: Longitudinal and Lateral Occupant Impact Velocity Preferred Maximum 30 ft/s 40 ft/s Results: Longitudinal occupant impact velocity was 15.4 ft/s, and lateral occupant impact velocity was 16.1 ft/s. (PASS) 55
72 I. Occupant ridedown accelerations should satisfy the following: Longitudinal and Lateral Occupant Ridedown Accelerations Preferred Maximum 15.0 Gs Gs Results: Longitudinal occupant ridedown acceleration was G, and lateral occupant ridedown acceleration was -5.9 G. (PASS) Vehicle Trajectory For redirective devices, the vehicle shall exit the barrier within the exit box. Result: The 2270P vehicle exited toward the field side of the barrier. (N/A) 56
73 CHAPTER 7. SUMMARY AND CONCLUSIONS As TxDOT plans for future expansion of the state s highway network, interest in higher design speeds has been expressed as a means of promoting faster and more efficient travel and movement of goods within the state. TxDOT funded project as part of a proactive consideration of safety on these high-speed facilities. This project began the process of developing roadside safety hardware suitable for use on high-speed highways. The impact conditions selected for the design, testing, and evaluation of this high-speed hardware include a speed of 85 mi/h and an angle of 25 degrees for barrier impacts. The design vehicles are those specified by the pending AASHTO Manual for Assessing Safety Hardware (MASH) and include a 5000-lb, ½-ton, 4-door pickup truck and a 2425-lb passenger car. After evaluation of several barrier systems using finite element simulation, two designs were selected for further evaluation through full-scale crash testing. These included an energy absorbing bridge rail concept and a modified wood post thrie beam guardrail. The 85 mi/h impact simulations of the energy absorbing bridge rail predicted marginal performance for both the small car and pickup truck. The results showed a high vehicle roll angle during redirection, which indicated the possibility of vehicle instability and rollover. The simulated small passenger car impact indicated an occupant impact velocity near the maximum acceptable value of 12 m/s and significant occupant compartment deformation. However, considering the challenge of accommodating these severe impact conditions and in absence of any obvious failure for either vehicle, TxDOT elected to approve some full-scale crash tests. ENERGY ABSORBING BRIDGE RAIL The energy-absorbing bridge rail contained and redirected the 1100C vehicle. The 1100C vehicle remained upright during and after the collision event. Maximum roll angle was 13 degrees at 1.7 s, and maximum pitch angle was 10 degrees at 2.00 s. Maximum occupant compartment deformation was 9.0 inches in the right side floor pan/toe pan area, which is the allowable limit for this area recommended in MASH. Longitudinal occupant impact velocity was 24.6 ft/s, and lateral occupant impact velocity was 40.7 ft/s. The maximum limit according to MASH is 40 ft/s, which was slightly exceeded in the lateral direction. It is noted that under NCHRP Report 350, a value of 41 ft/s (12.49 m/s) was considered acceptable by FHWA. Longitudinal and lateral ridedown accelerations were G and G, respectively, both of which are below the recommended threshold of 20 G. As summarized in Table 7.1, the performance of the energy absorbing bridge rail was considered marginal. In a subsequent test, the energy-absorbing bridge rail contained and redirected the 2270P vehicle. However, upon exiting the bridge rail, the vehicle rolled over. As summarized in Table 7.2, this outcome is unacceptable. This stability issue is discussed further in Chapter 8. It is of interest to note that the occupant compartment deformation and occupant risk indices were within the limits specified in MASH. 57
74 MODIFIED WOOD POST THRIE BEAM GUARDRAIL A performance assessment of the modified wood post thrie beam guardrail is presented in Table 7.3. As shown in this table, the 2270P vehicle was not successfully contained and redirected. Failure of the upstream anchorage permitted the vehicle to penetrate behind the guardrail. Although the outcome of the test was unacceptable, it is not necessarily an indictment of the modified wood post thrie beam guardrail system. Further discussion and recommendations regarding this system are presented in Chapter 8. 58
75 Table 7.1. Performance Evaluation Summary for MASH Test 3-10 on the Energy-Absorbing Bridge Rail. Test Agency: Texas Transportation Institute Test No.: Test Date: MASH Test 3-10 Evaluation Criteria Test Results Assessment Structural Adequacy A. Test article should contain and redirect the vehicle or bring the vehicle to a controlled stop; the vehicle should not penetrate, underride, or override the installation although controlled lateral deflection of the test article is acceptable Occupant Risk D. Detached elements, fragments, or other debris from the test article should not penetrate or show potential for penetrating the occupant compartment, or present an undue hazard to other traffic, pedestrians, or personnel in a work zone. Deformations of, or intrusions into, the occupant compartment should not exceed limits set forth in Section 5.3 and Appendix E of MASH. F. The vehicle should remain upright during and after collision. The maximum roll and pitch angles are not to exceed 75 degrees. H. Longitudinal and lateral occupant impact velocities should fall below the preferred value of 30 ft/s, or at least below the maximum allowable value of 40 ft/s. I. Longitudinal and lateral occupant ridedown accelerations should fall below the preferred value of 15.0 Gs, or at least below the maximum allowable value of Gs. Vehicle Trajectory It is preferable that the vehicle leave the barrier within the exit box. The energy-absorbing bridge rail contained and redirected the 1100C vehicle. The vehicle did not penetrate, underride, or override the bridge rail. Maximum dynamic deflection of the metal rail element was 5.25 inches at joint 2-3. No detached elements, fragments, or other debris from the bridge rail were present to penetrate or show potential for penetrating the occupant compartment, or to present undue hazard to others in the area. Pass Pass Maximum occupant compartment deformation was 9.0 inches in the right side floor pan/toe pan area. Pass The 1100C vehicle remained upright during and after the collision event. Maximum roll angle was 13 degrees at 1.7 s and maximum pitch angle was Pass 10 degrees at 2.00 s. Longitudinal occupant impact velocity was 24.6 ft/s, and lateral occupant impact velocity was 40.7 ft/s. Marginal Longitudinal ridedown acceleration was G, and lateral ridedown acceleration was G. Pass The vehicle exited the barrier within the exit box and came to rest 230 ft downstream of impact and 42 ft toward traffic lanes. Pass 59
76 Table 7.2. Performance Evaluation Summary for MASH Test 3-11 on the Energy-Absorbing Bridge Rail. Test Agency: Texas Transportation Institute Test No.: Test Date: MASH Test 3-11 Evaluation Criteria Test Results Assessment Structural Adequacy A. Test article should contain and redirect the vehicle or bring the vehicle to a controlled stop; the vehicle should not penetrate, underride, or override the installation although controlled lateral deflection of the test article is acceptable Occupant Risk D. Detached elements, fragments, or other debris from the test article should not penetrate or show potential for penetrating the occupant compartment, or present an undue hazard to other traffic, pedestrians, or personnel in a work zone. Deformations of, or intrusions into, the occupant compartment should not exceed limits set forth in Section 5.3 and Appendix E of MASH. F. The vehicle should remain upright during and after collision. The maximum roll and pitch angles are not to exceed 75 degrees. H. Longitudinal and lateral occupant impact velocities should fall below the preferred value of 30 ft/s, or at least below the maximum allowable value of 40 ft/s. I. Longitudinal and lateral occupant ridedown accelerations should fall below the preferred value of 15.0 Gs, or at least below the maximum allowable value of Gs. Vehicle Trajectory It is preferable that the vehicle leave the barrier within the exit box. The energy-absorbing bridge rail contained and redirected the 2270P vehicle. The vehicle did not penetrate, underride, or override the installation. Maximum deformation of the metal rail was 6.5 inches. No detached elements, fragments, or other debris from the bridge rail were present to penetrate or to show potential for penetrating the occupant compartment, or to present undue hazard to others in the area. Maximum occupant compartment deformation was 8.3 inches in the lateral area across the cab from kickpanel to kickpanel near the floor pan. The 2270P vehicle remained upright during the collision event. However, upon exiting the bridge rail, the vehicle rolled several times before coming to Pass Pass Pass Fail rest upright. Longitudinal occupant impact velocity was 17.4 ft/s, and lateral occupant impact velocity was 31.8 ft/s. Pass Longitudinal occupant ridedown acceleration was -7.9 G, and lateral occupant ridedown acceleration was G. The 2270P vehicle exited within the exit box and came to rest 85 ft downstream of impact and 23 ft toward traffic lanes. Pass Pass 60
77 Table 7.3. Performance Evaluation Summary for MASH Test 3-11 on the Thrie Beam Guardrail. Test Agency: Texas Transportation Institute Test No.: Test Date: MASH Test 3-11 Evaluation Criteria Test Results Assessment Structural Adequacy A. Test article should contain and redirect the vehicle or bring the vehicle to a controlled stop; the vehicle should not penetrate, underride, or override the installation although controlled lateral deflection of the test article is acceptable Occupant Risk D. Detached elements, fragments, or other debris from the test article should not penetrate or show potential for penetrating the occupant compartment, or present an undue hazard to other traffic, pedestrians, or personnel in a work zone. Deformations of, or intrusions into, the occupant compartment should not exceed limits set forth in Section 5.3 and Appendix E of MASH. F. The vehicle should remain upright during and after collision. The maximum roll and pitch angles are not to exceed 75 degrees. H. Longitudinal and lateral occupant impact velocities should fall below the preferred value of 30 ft/s, or at least below the maximum allowable value of 40 ft/s. I. Longitudinal and lateral occupant ridedown accelerations should fall below the preferred value of 15.0 Gs, or at least below the maximum allowable value of Gs. Vehicle Trajectory It is preferable that the vehicle leave the barrier within the exit box. The high-speed thrie beam guardrail did not contain the 2270P vehicle. The vehicle penetrated the rail and came to rest on the field side. Several posts fractured at ground level, but remained relatively close to the installation. This debris did not penetrate or show potential for penetrating the occupant compartment, or to present hazard to others in the area. No occupant compartment deformation occurred. Fail Pass Pass The 2270P vehicle remained upright during and after the collision event. Pass Longitudinal occupant impact velocity was 15.4 ft/s, and lateral occupant impact velocity was 16.1 ft/s. Pass Longitudinal occupant ridedown acceleration was G, and lateral occupant ridedown acceleration was -5.9 G. The 2270P vehicle penetrated the guardrail. Pass N/A 61
78
79 CHAPTER 8. IMPLEMENTATION STATEMENT The goal of this research project was to identify roadside safety hardware suitable for use on highways with very high design speed. For purposes of this project, a roadway design speed of 100 mi/h was selected and the corresponding design impact speed for the evaluation and testing of roadside safety devices was taken to be 85 mi/h based on research conducted under project This impact speed results in an impact severity far outside the normal design range. Therefore, conventional engineering design practice was of limited value. Finite element simulation was used as a tool to evaluate the impact performance of selected barrier designs. Although some performance concerns related to the very high-speed impacts were noted, a decision was made in conjunction with TxDOT personnel to test two systems: an energy absorbing bridge rail and a modified wood post thrie beam guardrail. The simulation results indicated that these two systems had a reasonable probability of meeting the required performance criteria. The tests were also designed to develop an enhanced understanding of vehicle and hardware performance at very high impact speeds and serve as a means of validating simulation models. Validity of the models could not be established during the initial phase of this research due to the absence of testing under these severe impact conditions. The energy absorbing bridge rail and modified wood post thrie beam guardrail failed to meet all of the evaluation criteria recommended in the new AASHTO Manual for Assessing Safety Hardware (MASH). New or modified designs are required to address these performance issues before implementation can be addressed. Recommendations for further research and development of these systems are discussed below. BRIDGE RAIL Simulation analyses identified performance issues with common concrete barriers profiles under high-speed impact conditions. Although the results varied for the different profiles evaluated, the concerns were generally related to vehicle stability, occupant risk, and occupant compartment deformation. Since TxDOT engineers desired to retain a concrete rail if possible, researchers recommended that a more flexible metal rail be attached to the traffic face of a concrete parapet to help manage the energy of the impacting vehicle. The idea was to absorb some of the energy of the impacting vehicle prior to the vehicle engaging the rigid concrete barrier system to help moderate occupant impact velocity and occupant compartment deformation while maintaining vehicle stability. The design evolved to include dual tubular steel rail elements attached to the face of a vertical concrete parapet by means of energy dissipating spacer pipes. The energy absorbing bridge rail design met the MASH performance evaluation criteria when impacted by a 2425-lb passenger car at 85 mi/h. However, a subsequent test with a 5000-lb pickup truck was 63
80 unsuccessful due to rollover of the vehicle after it exited the barrier. It was noted that the occupant risk and occupant compartment deformation criteria were met. Therefore, if the stability problem can be addressed, a satisfactory high-speed bridge rail solution appears achievable. The pipe spacers are designed to help control energy dissipation through their plastic deformation. It was noted that at least one of the pipe spacers was completely collapsed during the pickup truck impact. After this collapse, the rail system imparted a significant impulse to the pickup truck that induced instability as it completed its redirection and exited the barrier system. Increasing the rail height through the addition of a third tubular section or providing separation between the two existing rail elements is a possible solution that can be explored. In addition to providing a higher reaction point that can impart a greater restoring moment, the addition of a third tubular steel rail would provide more contact surface area and better load distribution on the vehicle. However, increasing the rail height and stiffness raises concerns related to small passenger car impacts because it can aggravate already marginal performance in terms of occupant impact velocity and occupant compartment deformation and would increase the potential for an occupant s head to contact the rail during impact. Another potential means of improving vehicle stability and achieving acceptable impact performance is to incorporate larger diameter pipe spacers. If complete collapse of the spacer pipes can be avoided or delayed, the impulse on the pickup truck can be reduced and stability will be improved. The concept is to provide more collapse distance without significantly changing the stiffness of the rail system. Therefore, the impact performance with the small car should not degrade. The disadvantage of this modification is that it will increase the lateral footprint of the barrier and require additional deck space to install. GUARDRAIL It was observed in the high-speed simulations of the standard modified steel post thrie beam guardrail that the steel blockouts deformed and collapsed. This led to significant interaction between the front wheel assembly of the impacting vehicle and the guardrail support posts that led to the vehicle climbing over the rail. The researchers proposed some modifications to mitigate this behavior. It was recommended that the steel posts and the blockouts be replaced with wood posts and wood blockouts. The objective was to eliminate vehicle climb by preventing collapse of the blockouts and changing the failure mode of the posts. The impact simulation of this modified wood post thrie beam guardrail predicted stable containment and redirection of the pickup truck. During the full-scale crash test, the upstream end anchorage failed and released the rail. This allowed the pickup truck to penetrate behind the guardrail system. The terminal system was not explicitly modeled in the simulation. The length of the guardrail installation was believed to be sufficient to limit the forces reaching the anchor assembly. 64
81 Unfortunately, the failure of the anchorage precluded a complete evaluation of the modified wood post thrie beam guardrail design. The guardrail performed as intended until the time of anchor failure. The vehicle was being redirected and there was no evidence of vehicle pocketing. However, no conclusions regarding the ability of the guardrail to accommodate highspeed impact conditions can be drawn without further testing. If the need for a high-speed guardrail system persists, the researchers recommend that the modified wood post thrie beam system be further tested in combination with a modified anchorage system with increased capacity. The weak-post W-beam barrier also showed promise for high-speed vehicle containment and could be further evaluated in any subsequent research. 65
82
83 REFERENCES 1. H. E. Ross, Jr., D. L. Sicking, R. A. Zimmer and J. D. Michie. Recommended Procedures for the Safety Performance Evaluation of Highway Features, National Cooperative Highway Research Program Report 350, Transportation Research Board, National Research Council, Washington, D.C., American Association of State Highway and Transportation Officials. Manual for Assessing Safety Hardware. AASHTO, Washington, DC, October K. Fitzpatrick, K. Zimmerman, R. Bligh, S. Chrysler, and B. Blaschke. Criteria for High Speed Design Facilities. Research Report , Texas Transportation Institute, College Station, TX. March N.M. Sheikh, R. Ferdous, R.P. Bligh, A. Abu-Odeh. Analysis of Roadside Safety Devices for Use on Very High-Speed Roadways. Research Report , Texas Transportation Institute, College Station, TX. September J. O. Hallquist. LS-DYNA Theory Manual. Livermore Software Technology Corporation, Livermore, CA. March
84
85 APPENDIX A. CRASH TEST AND DATA ANALYSIS PROCEDURES The crash test and data analysis procedures were in accordance with guidelines presented in MASH. Brief descriptions of these procedures are presented as follows. ELECTRONIC INSTRUMENTATION AND DATA PROCESSING The test vehicle was instrumented with three solid-state angular rate transducers to measure roll, pitch, and yaw rates; a triaxial accelerometer near the vehicle center of gravity (C.G.) to measure longitudinal, lateral, and vertical acceleration levels; and a backup biaxial accelerometer in the rear of the vehicle to measure longitudinal and lateral acceleration levels. These accelerometers were ENDEVCO Model 2262CA, piezoresistive accelerometers with a ±100 G range. The accelerometers are strain gauge type with a linear millivolt output proportional to acceleration. Angular rate transducers are solid state, gas flow units designed for high- g service. Signal conditioners and amplifiers in the test vehicle increase the low-level signals to a ±2.5 volt maximum level. The signal conditioners also provide the capability of a resistive calibration (R-cal) or shunt calibration for the accelerometers and a precision voltage calibration for the rate transducers. The electronic signals from the accelerometers and rate transducers are transmitted to a base station by means of a 15-channel, constant bandwidth, Inter-Range Instrumentation Group (I.R.I.G.), FM/FM telemetry link for recording and for display. Calibration signals from the test vehicle are recorded before the test and immediately afterwards. A crystal-controlled time reference signal is simultaneously recorded with the data. Wooden dowels actuate pressure-sensitive switches on the bumper of the impacting vehicle prior to impact by wooden dowels to indicate the elapsed time over a known distance to provide a measurement of impact velocity. The initial contact also produces an event mark on the data record to establish the instant of contact with the installation. The multiplex of data channels, transmitted on one radio frequency, is received and demultiplexed onto a TEAC instrumentation data recorder. After the test, the data are played back from the TEAC recorder and digitized. A proprietary software program (WinDigit) converts the analog data from each transducer into engineering units using the R-cal and pre-zero values at 10,000 samples per second per channel. WinDigit also provides Society of Automotive Engineers (SAE) J211 class 180 phaseless digital filtering and vehicle impact velocity. All accelerometers are calibrated annually according to the SAE J by means of an ENDEVCO 2901, precision primary vibration standard. This device and its support instruments are returned to the factory annually for a National Institute of Standards Technology (NIST) traceable calibration. The subsystems of each data channel are also evaluated annually, using instruments with current NIST traceability, and the results are factored into the accuracy of the total data channel, per SAE J211. Calibrations and evaluations are made any time data are suspect. 69
86 The Test Risk Assessment Program (TRAP) uses the data from WinDigit to compute occupant/compartment impact velocities, time of occupant/compartment impact after vehicle impact, and the highest 10-millisecond (ms) average ridedown acceleration. WinDigit calculates change in vehicle velocity at the end of a given impulse period. In addition, WinDigit computes maximum average accelerations over 50-ms intervals in each of the three directions. For reporting purposes, the data from the vehicle-mounted accelerometers are filtered with a 60-Hz digital filter, and acceleration versus time curves for the longitudinal, lateral, and vertical directions are plotted using TRAP. TRAP uses the data from the yaw, pitch, and roll rate transducers to compute angular displacement in degrees at s intervals and then plots yaw, pitch, and roll versus time. These displacements are in reference to the vehicle-fixed coordinate system with the initial position and orientation of the vehicle-fixed coordinate systems being initial impact. ANTHROPOMORPHIC DUMMY INSTRUMENTATION An Alderson Research Laboratories Hybrid II, 50 th percentile male anthropomorphic dummy, restrained with lap and shoulder belts, was placed in the driver s position of the 1100C vehicle. The dummy was uninstrumented. Use of a dummy in the 2270P vehicle is optional according to NCHRP Report 350, and there was no dummy used in the tests with the 2000P vehicle. PHOTOGRAPHIC INSTRUMENTATION AND DATA PROCESSING Photographic coverage of the test included three high-speed cameras: one overhead with a field-of-view perpendicular to the ground and directly over the impact point; one placed behind the installation at an angle; and a third placed to have a field-of-view parallel to and aligned with the installation at the downstream end. A flash bulb activated by pressure-sensitive tape switches was positioned on the impacting vehicle to indicate the instant of contact with the installation and was visible from each camera. The films from these high-speed cameras were analyzed on a computer-linked Motion Analyzer to observe phenomena occurring during the collision and to obtain time-event, displacement, and angular data. A 16-mm movie cine, a BetaCam, a VHS-format video camera and recorder, and still cameras were used to record and document conditions of the test vehicle and installation before and after the test. TEST VEHICLE PROPULSION AND GUIDANCE The test vehicle was towed into the test installation using a steel cable guidance and reverse tow system. A steel cable for guiding the test vehicle was tensioned along the path, anchored at each end, and threaded through an attachment to the front wheel of the test vehicle. An additional steel cable was connected to the test vehicle, passed around a pulley near the impact point, through a pulley on the tow vehicle, and then anchored to the ground such that the tow vehicle moved away from the test site. A 2-to-1 speed ratio between the test and tow vehicle 70
87 existed with this system. Just prior to impact with the installation, the test vehicle was released to be free-wheeling and unrestrained. The vehicle remained free-wheeling, i.e., no steering or braking inputs, until the vehicle cleared the immediate area of the test site, at which time the vehicle s brakes were activated to bring it to a safe and controlled stop. 71
88
89 APPENDIX B. DETAILS OF THE HIGH-SPEED ENERGY-ABSORBING BRIDGE RAIL 73
90 74
91 75
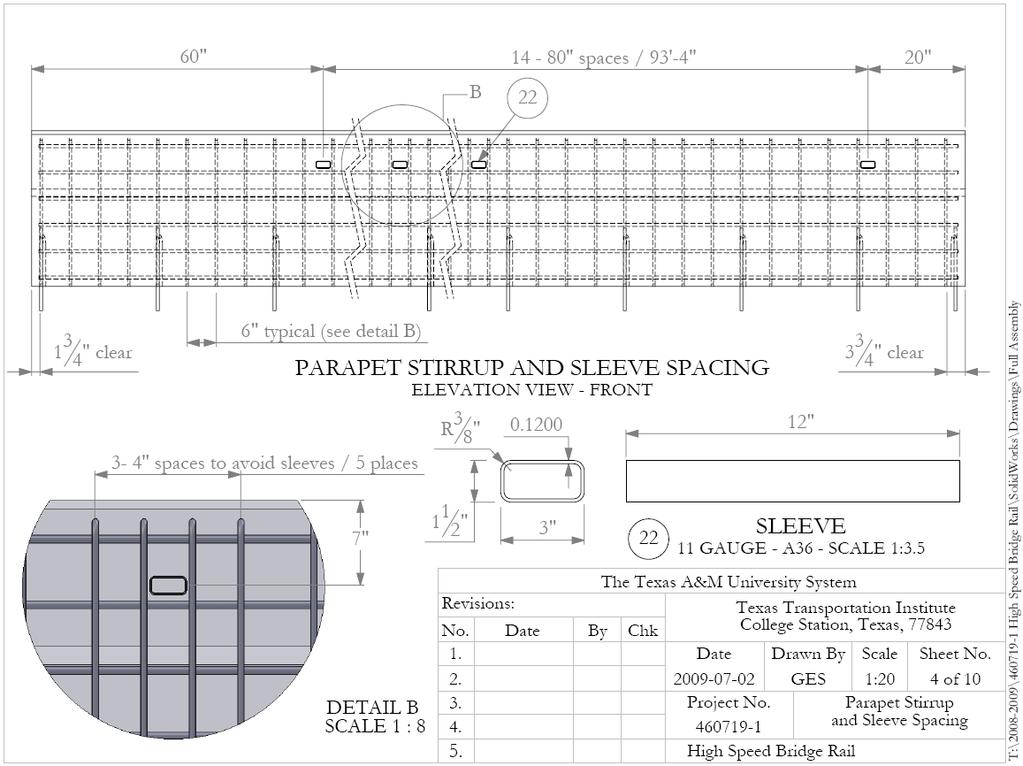
92 76
93 77
94 78
95 79
96 80
97 81
98 82
99 APPENDIX C. TEST VEHICLE PROPERTIES AND INFORMATION Date: Test No.: VIN No.: KNADC Year: 2002 Make: Kia Model: Rio Tire Inflation Pressure: 29 psi Odometer: Tire Size: P185/65R14 Describe any damage to the vehicle prior to test: Denotes accelerometer location. NOTES: Engine Type: 4 cylinder Engine CID: 1.5 liter Transmission Type: x Auto or Manual x FWD RWD 4WD Optional Equipment: Dummy Data: Type: Mass: Seat Position: 95 th percentile male 168 lb Passenger Side Geometry: inches A F K P 3.25 U B G L Q V C H M R W D I 8.50 N S 8.62 X E J O T Wheel Center Ht Front Wheel Center Ht Rear RANGE LIMIT: A = 65 ±3 inches; C = 168 ±8 inches; E = 98 ±5 inches; F = 35 ±4 inches; G = 39 ±4 inches; O = 24 ±4 inches; M+N/2 = 56 ±2 inches GVWR Ratings: Mass: lb Curb Test Inertial Gross Static Front 1691 M front Allowable 1593 Allowable Back 1559 M rear Range 1013 Range = Total 3250 M Total ±55 lb ±55 lb Mass Distribution: lb LF: 786 RF: 725 LR: 460 RR: 467 Figure C1. Vehicle Properties for Test No
100 Table C1. Exterior Crush Measurements for Test No Date: Test No.: VIN No.: KNADC Year: 2002 Make: Kia Model: Rio VEHICLE CRUSH MEASUREMENT SHEET 1 Complete When Applicable End Damage Side Damage Undeformed end width Bowing: B1 X1 Corner shift: A1 End shift at frame (CDC) (check one) A2 < 4 inches 4 inches Bowing constant X 1+ X 2 2 B2 X2 = Note: Measure C 1 to C 6 from Driver to Passenger side in Front or Rear impacts Rear to Front in Side Impacts. Specific Impact Number Plane* of C-Measurements Direct Damage Width** (CDC) Max*** Crush Field L** C 1 C 2 C 3 C 4 C 5 C 6 ±D 1 Front plane at bumper ht Side plane above bump Measurements recorded in inches 1 Table taken from National Accident Sampling System (NASS). *Identify the plane at which the C-measurements are taken (e.g., at bumper, above bumper, at sill, above sill, at beltline, etc.) or label adjustments (e.g., free space). Free space value is defined as the distance between the baseline and the original body contour taken at the individual C locations. This may include the following: bumper lead, bumper taper, side protrusion, side taper, etc. Record the value for each C-measurement and maximum crush. **Measure and document on the vehicle diagram the beginning or end of the direct damage width and field L (e.g., side damage with respect to undamaged axle). ***Measure and document on the vehicle diagram the location of the maximum crush. Note: Use as many lines/columns as necessary to describe each damage profile. 84
101 Table C2. Occupant Compartment Measurements for Test No Date: Test No.: VIN No.: KNADC Year: 2002 Make: Kia Model: Rio F G H I B1, B2, B3, B4, B5, B6 A1, A2, &A 3 D1, D2, & D3 C1, C2, & C3 B1 B2 B3 E1 & E2 *Lateral area across the cab from driver s side kickpanel to passenger s side kickpanel. OCCUPANT COMPARTMENT DEFORMATION MEASUREMENT Before After ( inches ) ( inches ) A A A B B B B B B C C C D D D E E F G H I J*
102 Date: Test No.: VIN No.: 3D7HA18N22G Year: 2002 Make: Dodge Model: Ram 1500 Quad-Cab Tire Size: 245/70R17 Tire Inflation Pressure: 44 psi Tread Type: Highway Odometer: Note any damage to the vehicle prior to test: Denotes accelerometer location. NOTES: Engine Type: V-8 Engine CID: 4.7 Liter Transmission Type: x Auto or Manual FWD x RWD 4WD Optional Equipment: Dummy Data: Type: Mass: Seat Position: No Dummy Geometry: inches A F K P 3.00 U B G L Q V C H M R W D I N S X E J O T Wheel Center Ht Front Wheel Well Clearance (FR) 6.12 Frame Ht (FR) Wheel Center Ht Rear Wheel Well Clearance (RR) Frame Ht (RR) RANGE LIMIT: A=78 ±2 inches; C=237 ±13 inches; E=148 ±12 inches; F=39 ±3 inches; G = > 28 inches; H = 63 ±4 inches; O=43 ±4 inches; M+N/2=67 ±1.5 inches GVWR Ratings: Mass: lb Curb Test Inertial Gross Static Front 3650 M front Allowable Allowable Back 3900 M rear Range Range Total 6650 M Total ±110 lb 5000 ±110 lb Mass Distribution: lb LF: 1411 RF: 1373 LR: 1071 RR: 1151 Figure C2. Vehicle Properties for Test No
103 Table C3. Exterior Crush Measurements for Test No Date: Test No.: VIN No.: 3D7HA18N22G Year: 2002 Make: Dodge Model: Ram 1500 VEHICLE CRUSH MEASUREMENT SHEET 1 Complete When Applicable End Damage Side Damage Undeformed end width Bowing: B1 X1 Corner shift: A1 End shift at frame (CDC) (check one) A2 < 4 inches 4 inches Bowing constant X 1+ X 2 2 B2 X2 = Note: Measure C 1 to C 6 from Driver to Passenger side in Front or Rear impacts Rear to Front in Side Impacts. Specific Impact Number Plane* of C-Measurements Direct Damage Width** (CDC) Max*** Crush Front plane 20 Side plane 18 Field L** C 1 C 2 C 3 C 4 C 5 C 6 ±D Measurements recorded in inches 1 Table taken from National Accident Sampling System (NASS). *Identify the plane at which the C-measurements are taken (e.g., at bumper, above bumper, at sill, above sill, at beltline, etc.) or label adjustments (e.g., free space). Free space value is defined as the distance between the baseline and the original body contour taken at the individual C locations. This may include the following: bumper lead, bumper taper, side protrusion, side taper, etc. Record the value for each C-measurement and maximum crush. **Measure and document on the vehicle diagram the beginning or end of the direct damage width and field L (e.g., side damage with respect to undamaged axle). ***Measure and document on the vehicle diagram the location of the maximum crush. Note: Use as many lines/columns as necessary to describe each damage profile. 87
104 Table C4. Occupant Compartment Measurements for Test No Date: Test No.: VIN No.: 3D7HA18N22G Year: 2002 Make: Dodge Model: Ram 1500 *Lateral area across the cab from driver s side kickpanel to passenger s side kickpanel. OCCUPANT COMPARTMENT DEFORMATION MEASUREMENT Before After ( inches ) ( inches ) A A A B B B B B B C C C D D N/A D E N/A E N/A E N/A E F G H N/A I J*
105 Date: Test No.: VIN No.: 1K7HA18NX3S Year: 2003 Make: Dodge Model: Ram 1500 Quad-Cab Tire Size: 245/70R17 Tire Inflation Pressure: 35 psi Tread Type: Highway Odometer: Note any damage to the vehicle prior to test: Denotes accelerometer location. NOTES: Engine Type: Engine CID: V8 4.7 liger Transmission Type: x Auto or Manual FWD x RWD 4WD Optional Equipment: Dummy Data: Type: Mass: Seat Position: No dummy Geometry: inches A F K P 3.00 U B G L Q V C H M R W D I N S X E J O T Wheel Center Ht Front Wheel Well Clearance (FR) 6.12 Frame Ht (FR) Wheel Center Ht Rear Wheel Well Clearance (RR) Frame Ht (RR) RANGE LIMIT: A=78 ±2 inches; C=237 ±13 inches; E=148 ±12 inches; F=39 ±3 inches; G = > 28 inches; H = 63 ±4 inches; O=43 ±4 inches; M+N/2=67 ±1.5 inches GVWR Ratings: Mass: lb Curb Test Inertial Gross Static Front 3650 M front Allowable Allowable Back 6900 M rear Range Range Total 6650 M Total ±110 lb 5000 ±110 lb Mass Distribution: lb LF: 1398 RF: 1371 LR: 1113 RR: 1137 Figure C3. Vehicle Properties for Test No
106 Table C5. Exterior Crush Measurements for Test No Date: Test No.: VIN No.: 1K7HA18NX3S Year: 2003 Make: Dodge Model: Ram 1500 Quad-Cab VEHICLE CRUSH MEASUREMENT SHEET 1 Complete When Applicable End Damage Side Damage Undeformed end width Bowing: B1 X1 Corner shift: A1 End shift at frame (CDC) (check one) A2 < 4 inches 4 inches Bowing constant X 1+ X 2 2 B2 X2 = Note: Measure C 1 to C 6 from Driver to Passenger side in Front or Rear impacts Rear to Front in Side Impacts. Specific Impact Number Plane* of C-Measurements Direct Damage Width** (CDC) Max*** Crush Field L** C 1 C 2 C 3 C 4 C 5 C 6 ±D 1 Front plane at bumper ht Side plane at bumper ht Measurements recorded in inches 1 Table taken from National Accident Sampling System (NASS). *Identify the plane at which the C-measurements are taken (e.g., at bumper, above bumper, at sill, above sill, at beltline, etc.) or label adjustments (e.g., free space). Free space value is defined as the distance between the baseline and the original body contour taken at the individual C locations. This may include the following: bumper lead, bumper taper, side protrusion, side taper, etc. Record the value for each C-measurement and maximum crush. **Measure and document on the vehicle diagram the beginning or end of the direct damage width and field L (e.g., side damage with respect to undamaged axle). ***Measure and document on the vehicle diagram the location of the maximum crush. Note: Use as many lines/columns as necessary to describe each damage profile. 90
107 Table C6. Occupant Compartment Measurements for Test No Date: Test No.: VIN No.: 1K7HA18NX3S Year: 2003 Make: Dodge Model: Ram 1500 Quad-Cab *Lateral area across the cab from driver s side kickpanel to passenger s side kickpanel. OCCUPANT COMPARTMENT DEFORMATION MEASUREMENT Before After ( inches ) ( inches ) A A A B B B B B B C C C D D D E E E E F G H I J*
108
. 93")
109 APPENDIX D. SEQUENTIAL PHOTOGRAPHS s s s s Figure D1. Sequential Photographs for Test No (Overhead and Frontal Views). 93

110 0.196 s s s s Figure D1. Sequential Photographs for Test No (Overhead and Frontal Views) (Continued). 94


111 0.000 s s s s s s s s Figure D2. Sequential Photographs for Test No (Rear View). 95


112 0.000 s s s s Figure D3. Sequential Photographs for Test (Overhead and Frontal Views). 96


113 0.196 s s s s Figure D3. Sequential Photographs for Test (Overhead and Frontal Views) (Continued). 97

114 0.000 s s s s s s s s Figure D4. Sequential Photographs for Test (Rear View). 98

115 0.000 s s s s Figure D5. Sequential Photographs for Test No (Overhead and Frontal Views). 99


116 0.197 s s s s Figure D5. Sequential Photographs for Test No (Overhead and Frontal Views) (Continued). 100

117 0.000 s s s s s s s s Figure D6. Sequential Photographs for Test No (Rear View). 101
118
119 APPENDIX E. VEHICLE ANGULAR DISPLACEMENTS AND ACCELERATIONS Roll, Pitch, and Yaw Angles Test Number: Test Date: August 7, 2009 Test Article: Energy-Absorbing Bridge Rail Test Vehicle: 2002 Kia Rio Inertial Mass: 2438 lb Gross Mass: 2606 lb Impact Speed: 85.2 mi/h Impact Angle: 25.7 degrees Roll Pitch Yaw Time (s) Axes are vehicle-fixed. Sequence for determining orientation: 1. Yaw. 2. Pitch. 3. Roll. Figure E1. Vehicle Angular Displacements for Test No Angles (degrees) 103
120 X Acceleration at CG Test Number: Test Date: August 7, 2009 Test Article: Energy-Absorbing Bridge Rail Test Vehicle: 2002 Kia Rio Inertial Mass: 2438 lb Gross Mass: 2606 lb Impact Speed: 85.2 mi/h Impact Angle: 25.7 degrees Time (s) Time of OIV ( sec) SAE Class 60 Filter Figure E2. Vehicle Longitudinal Accelerometer Trace for Test No (Accelerometer Located at Center of Gravity). Longitudinal Acceleration (G) 104
121 Y Acceleration at CG Test Number: Test Date: August 7, 2009 Test Article: Energy-Absorbing Bridge Rail Test Vehicle: 2002 Kia Rio Inertial Mass: 2438 lb Gross Mass: 2606 lb Impact Speed: 85.2 mi/h Impact Angle: 25.7 degrees Time (s) Time of OIV ( sec) SAE Class 60 Filter Figure E3. Vehicle Lateral Accelerometer Trace for Test No (Accelerometer Located at Center of Gravity). Lateral Acceleration (G) 105
122 Z Acceleration at CG Test Number: Test Date: August 7, 2009 Test Article: Energy-Absorbing Bridge Rail Test Vehicle: 2002 Kia Rio Inertial Mass: 2438 lb Gross Mass: 2606 lb Impact Speed: 85.2 mi/h Impact Angle: 25.7 degrees Time (s) SAE Class 60 Filter Figure E4. Vehicle Vertical Accelerometer Trace for Test No (Accelerometer Located at Center of Gravity). Vertical Acceleration (G) 106
123 X Acceleration over Rear Axle Test Number: Test Article: Energy-Absorbing Bridge Rail Test Vehicle: 2002 Kia Rio Inertial Mass: 2438 lb Gross Mass: 2606 lb Impact Speed: 85.2 mi/h Impact Angle: 25.7 degrees Time (s) Time of OIV ( sec) SAE Class 60 Filter Figure E5. Vehicle Longitudinal Accelerometer Trace for Test No (Accelerometer Located over Rear Axle). Longitudinal Acceleration (G) 107
124 Y Acceleration over Rear Axle Test Number: Test Article: Energy-Absorbing Bridge Rail Test Vehicle: 2002 Kia Rio Inertial Mass: 2438 lb Gross Mass: 2606 lb Impact Speed: 85.2 mi/h Impact Angle: 25.7 degrees Time (s) Time of OIV ( sec) SAE Class 60 Filter Figure E6. Vehicle Lateral Accelerometer Trace for Test No (Accelerometer Located over Rear Axle). Lateral Acceleration (G) 108
125 Z Acceleration over Rear Axle Test Number: Test Article: Energy-Absorbing Bridge Rail Test Vehicle: 2002 Kia Rio Inertial Mass: 2438 lb Gross Mass: 2606 lb Impact Speed: 85.2 mi/h Impact Angle: 25.7 degrees Time (s) SAE Class 60 Filter Figure E7. Vehicle Vertical Accelerometer Trace for Test No (Accelerometer Located over Rear Axle). Vertical Acceleration (G) 109
126 Roll, Pitch, and Yaw Angles Test Number: Test Date: August 14, 2009 Test Article: Energy Absorbing Bridge Rail Test Vehicle: 2002 Dodge Ram 1500 Quad-Cab Pickup Inertial Mass: 5006 lb Impact Speed: 86.4 mi/h Impact Angle: 25.3 degrees Roll Pitch Yaw Time (s) Axes are vehicle-fixed. Sequence for determining orientation: 1. Yaw. 2. Pitch. 3. Roll. Figure E8. Vehicle Angular Displacements for Test No Angles (degrees) 110
127 X Acceleration at CG Test Number: Test Date: August 14, 2009 Test Article: Energy Absorbing Bridge Rail Test Vehicle: 2002 Dodge Ram 1500 Quad-Cab Pickup Inertial Mass: 5006 lb Impact Speed: 86.4 mi/h Impact Angle: 25.3 degrees Time (s) Time of OIV ( sec) SAE Class 60 Filter Figure E9. Vehicle Longitudinal Accelerometer Trace for Test No (Accelerometer Located at Center of Gravity). Longitudinal Acceleration (G) 111
128 Y Acceleration at CG Test Number: Test Date: August 14, 2009 Test Article: Energy Absorbing Bridge Rail Test Vehicle: 2002 Dodge Ram 1500 Quad-Cab Pickup Inertial Mass: 5006 lb Impact Speed: 86.4 mi/h Impact Angle: 25.3 degrees Time (s) Time of OIV ( sec) SAE Class 60 Filter Figure E10. Vehicle Lateral Accelerometer Trace for Test No (Accelerometer Located at Center of Gravity). Lateral Acceleration (G) 112
129 Z Acceleration at CG Test Number: Test Date: August 14, 2009 Test Article: Energy Absorbing Bridge Rail Test Vehicle: 2002 Dodge Ram 1500 Quad-Cab Pickup Inertial Mass: 5006 lb Impact Speed: 86.4 mi/h Impact Angle: 25.3 degrees Time (s) SAE Class 60 Filter Figure E11. Vehicle Vertical Accelerometer Trace for Test No (Accelerometer Located at Center of Gravity). Vertical Acceleration (G) 113
130 X Acceleration over Rear Axle Test Number: Test Date: August 14, 2009 Test Article: Energy Absorbing Bridge Rail Test Vehicle: 2002 Dodge Ram 1500 Quad-Cab Pickup Inertial Mass: 5006 lb Impact Speed: 86.4 mi/h Impact Angle: 25.3 degrees Time (s) SAE Class 60 Filter Figure E12. Vehicle Longitudinal Accelerometer Trace for Test No (Accelerometer Located over Rear Axle). Longitudinal Acceleration (G) 114
131 Y Acceleration over Rear Axle Test Number: Test Date: August 14, 2009 Test Article: Energy Absorbing Bridge Rail Test Vehicle: 2002 Dodge Ram 1500 Quad-Cab Pickup Inertial Mass: 5006 lb Impact Speed: 86.4 mi/h Impact Angle: 25.3 degrees Time (s) SAE Class 60 Filter Figure E13. Vehicle Lateral Accelerometer Trace for Test No (Accelerometer Located over Rear Axle). Lateral Acceleration (G) 115
132 Z Acceleration over Rear Axle Test Number: Test Date: August 14, 2009 Test Article: Energy Absorbing Bridge Rail Test Vehicle: 2002 Dodge Ram 1500 Quad-Cab Pickup Inertial Mass: 5006 lb Impact Speed: 86.4 mi/h Impact Angle: 25.3 degrees Time (s) SAE Class 60 Filter Figure E14. Vehicle Vertical Accelerometer Trace for Test No (Accelerometer Located over Rear Axle). Vertical Acceleration (G) 116
133 Roll, Pitch, and Yaw Angles Test Number: Test Date: August 21, 2009 Test Article: Modified Wood Post Thrie Beam Test Vehicle: 2003 Dodge Ram 1500 Quad-Cab Pickup Inertial Mass: 5019 lb Impact Speed: 84.1 mi/h Impact Angle: 25.6 degrees Roll Pitch Yaw Time (sec) Axes are vehicle-fixed. Sequence for determining orientation: 1. Yaw. 2. Pitch. 3. Roll. Figure E15. Vehicle Angular Displacements for Test No Angles (degrees) 117
134 X Acceleration at CG Test Number: Test Date: August 21, 2009 Test Article: Modified Wood Post Thrie Beam Test Vehicle: 2003 Dodge Ram 1500 Quad-Cab Pickup Inertial Mass: 5019 lb Impact Speed: 84.1 mi/h Impact Angle: 25.6 degrees Time (s) Time of OIV ( sec) SAE Class 60 Filter Figure E16. Vehicle Longitudinal Accelerometer Trace for Test No (Accelerometer Located at Center of Gravity). Longitudinal Acceleration (G) 118
135 Y Acceleration at CG Test Number: Test Date: August 21, 2009 Test Article: Modified Wood Post Thrie Beam Test Vehicle: 2003 Dodge Ram 1500 Quad-Cab Pickup Inertial Mass: 5019 lb Impact Speed: 84.1 mi/h Impact Angle: 25.6 degrees Time (s) Time of OIV ( sec) SAE Class 60 Filter Figure E17. Vehicle Lateral Accelerometer Trace for Test No (Accelerometer Located at Center of Gravity). Lateral Acceleration (Gs) 119
136 Z Acceleration at CG Test Number: Test Date: August 21, 2009 Test Article: Modified Wood Post Thrie Beam Test Vehicle: 2003 Dodge Ram 1500 Quad-Cab Pickup Inertial Mass: 5019 lb Impact Speed: 84.1 mi/h Impact Angle: 25.6 degrees Time (s) SAE Class 60 Filter Figure E18. Vehicle Vertical Accelerometer Trace for Test No (Accelerometer Located at Center of Gravity). Vertical Acceleration (G) 120
137 X Acceleration over Rear Axle Test Number: Test Date: August 21, 2009 Test Article: Modified Wood Post Thrie Beam Test Vehicle: 2003 Dodge Ram 1500 Quad-Cab Pickup Inertial Mass: 5019 lb Impact Speed: 84.1 mi/h Impact Angle: 25.6 degrees Time (s) SAE Class 60 Filter Figure E19. Vehicle Longitudinal Accelerometer Trace for Test No (Accelerometer Located over Rear Axle). Longitudinal Acceleration (G) 121
138 Y Acceleration over Rear Axle Test Number: Test Date: August 21, 2009 Test Article: Modified Wood Post Thrie Beam Test Vehicle: 2003 Dodge Ram 1500 Quad-Cab Pickup Inertial Mass: 5019 lb Impact Speed: 84.1 mi/h Impact Angle: 25.6 degrees Time (s) SAE Class 60 Filter Figure E20. Vehicle Lateral Accelerometer Trace for Test No (Accelerometer Located over Rear Axle). Lateral Acceleration (G) 122
139 Z Acceleration over Rear Axle Test Number: Test Date: August 21, 2009 Test Article: Modified Wood Post Thrie Beam Test Vehicle: 2003 Dodge Ram 1500 Quad-Cab Pickup Inertial Mass: 5019 lb Impact Speed: 84.1 mi/h Impact Angle: 25.6 degrees Time (s) SAE Class 60 Filter Figure E21. Vehicle Vertical Accelerometer Trace for Test No (Accelerometer Located over Rear Axle). Vertical Acceleration (G) 123
140
141 APPENDIX F. DETAILS OF THE HIGH-SPEED THRIE BEAM GUARDRAIL 125
142 126
143 127
144 128
145 129
146 130
147 131
148 132
149 133
150
 APPENDIX G. SOIL STRENGTH DOCUMENTATION *Winch truck slipping, so test was stopped. Static Load Setup Post-Test Photo of Post Date.")
 and sieve analysis... AASHTO Grade B Soil-Aggregate (see sieve analysis) Description of Fill Placement Procedure.")
151 12000 Comparison of Static Load Test Results and Required Minimum: Load versus Displacement at 25 inch Height (lb d a o L Displacement (inch) Load vs. Displacement from Static Load Test Minimum Static Load ) APPENDIX G. SOIL STRENGTH DOCUMENTATION *Winch truck slipping, so test was stopped. Static Load Setup Post-Test Photo of Post Date Test Facility and Site Location... TTI Proving Ground 3100 SH 47, Bryan, Tx In Situ Soil Description (ASTM D2487)... Sandy gravel with silty fines Fill Material Description (ASTM D2487) and sieve analysis... AASHTO Grade B Soil-Aggregate (see sieve analysis) Description of Fill Placement Procedure... 6-inch lifts tamped with a pneumatic compactor Figure G1. Test Day Static Soil Strength Documentation. 135

 Static Load Test Installation")

 Description of Fill Placement Procedure.")
152 Dynamic Setup Post-Test Photo Post-Test Photo of Post Static Load Test Dynamic Test Installation Details Comparison of Load vs. Displacement at 25-inch height (lb d a o L Bogie Data Dynamic Post Load Required Dynamic Static Pull Displacement (inch) Static Load Test Installation Details Date Test Facility and Site Location... TTI Proving Ground, 3100 SH 47, Bryan, TX In Situ Soil Description (ASTM D Sandy gravel with silty fines Fill Material Description (ASTM D2487) and sieve analysis... AASHTO Grade B Soil-Aggregate (see sieve analysis above) Description of Fill Placement Procedure... 6-inch lifts tamped with a pneumatic compactor Bogie Weight lb Impact Velocity mi/h Figure G2. Summary of Strong Soil Test Results for Establishing Installation Procedure. ) 136
A MASH Compliant W-Beam Median Guardrail System
 0 0 0 0 0 A MASH Compliant W-Beam Median Guardrail System By A. Y. Abu-Odeh, R. P. Bligh, W. Odell, A. Meza, and W. L. Menges Submitted: July 0, 0 Word Count:, + ( figures + tables=,000) =, words Authors:
Advances in Simulating Corrugated Beam Barriers under Vehicular Impact
 13 th International LS-DYNA Users Conference Session: Automotive Advances in Simulating Corrugated Beam Barriers under Vehicular Impact Akram Abu-Odeh Texas A&M Transportation Institute Abstract W-beam
Form DOT F (8-72) Texas Transportation Institute The Texas A&M University System College Station, Texas
 Texas Transportation Institute The Texas A&M University System College Station, Texas") 1. Report No. FHWA/TX-02/4162-1 Technical Report Documentation Page 2. Government Accession No. 3. Recipient's Catalog No. 4. Title and Subtitle EVALUATION OF TEXAS GRID-SLOT PORTABLE CONCRETE BARRIER
1. Report No. FHWA/TX-02/4162-1 Technical Report Documentation Page 2. Government Accession No. 3. Recipient's Catalog No. 4. Title and Subtitle EVALUATION OF TEXAS GRID-SLOT PORTABLE CONCRETE BARRIER
DEVELOPMENT OF A MASH TL-3 MEDIAN BARRIER GATE
 TTI: 9-1002 DEVELOPMENT OF A MASH TL-3 MEDIAN BARRIER GATE ISO 17025 Laboratory Testing Certificate # 2821.01 Crash testing performed at: TTI Proving Ground 3100 SH 47, Building 7091 Bryan, TX 77807 Research/Test
CRASH TEST AND EVALUATION OF 3-FT MOUNTING HEIGHT SIGN SUPPORT SYSTEM
 TTI: 9-1002-15 CRASH TEST AND EVALUATION OF 3-FT MOUNTING HEIGHT SIGN SUPPORT SYSTEM ISO 17025 Laboratory Testing Certificate # 2821.01 Crash testing performed at: TTI Proving Ground 3100 SH 47, Building
MASH Test 3-11 on the T131RC Bridge Rail
 TTI: 9-1002-12 MASH Test 3-11 on the T131RC Bridge Rail ISO 17025 Laboratory Testing Certificate # 2821.01 Crash testing performed at: TTI Proving Ground 3100 SH 47, Building 7091 Bryan, TX 77807 Test
Texas Transportation Institute The Texas A&M University System College Station, Texas
 1. Report No. FHWA/TX-07/0-5527-1 4. Title and Subtitle DEVELOPMENT OF A LOW-PROFILE TO F-SHAPE TRANSITION BARRIER SEGMENT 2. Government Accession No. 3. Recipient's Catalog No. Technical Report Documentation
Technical Report Documentation Page 2. Government Accession No. 3. Recipient's Catalog No. 1. Report No. FHWA/TX-09/
 1. Report No. FHWA/TX-09/0-6071-1 4. Title and Subtitle ANALYSIS OF ROADSIDE SAFETY DEVICES FOR USE ON VERY HIGH-SPEED ROADWAYS Technical Report Documentation Page 2. Government Accession No. 3. Recipient's
Manual for Assessing Safety Hardware
 American Association of State Highway and Transportation Officials Manual for Assessing Safety Hardware 2009 vii PREFACE Effective traffic barrier systems, end treatments, crash cushions, breakaway devices,
MASH TEST 3-11 OF THE TxDOT SINGLE SLOPE BRIDGE RAIL (TYPE SSTR) ON PAN-FORMED BRIDGE DECK
 ON PAN-FORMED BRIDGE DECK") TTI: 9-1002 MASH TEST 3-11 OF THE TxDOT SINGLE SLOPE BRIDGE RAIL (TYPE SSTR) ON PAN-FORMED BRIDGE DECK ISO 17025 Laboratory Testing Certificate # 2821.01 Crash testing performed at: TTI Proving Ground
TTI: 9-1002 MASH TEST 3-11 OF THE TxDOT SINGLE SLOPE BRIDGE RAIL (TYPE SSTR) ON PAN-FORMED BRIDGE DECK ISO 17025 Laboratory Testing Certificate # 2821.01 Crash testing performed at: TTI Proving Ground
NCHRP Report 350 Crash Testing and Evaluation of the S-Square Mailbox System
 TTI: 0-5210 NCHRP Report 350 Crash Testing and Evaluation of the S-Square Mailbox System ISO 17025 Laboratory Testing Certificate # 2821.01 Crash testing performed at: TTI Proving Ground 3100 SH 47, Building
TEXAS TRANSPORTATION INSTITUTE THE TEXAS A & M UNIVERSITY SYSTEM COLLEGE STATION, TEXAS 77843
 NCHRP REPORT 350 ASSESSMENT OF EXISTING ROADSIDE SAFETY HARDWARE by C. Eugene Buth, P.E. Senior Research Engineer Wanda L. Menges Associate Research Specialist and Sandra K. Schoeneman Research Associate
OPTIMIZATION OF THRIE BEAM TERMINAL END SHOE CONNECTION
 TTI: 9-1002-15 OPTIMIZATION OF THRIE BEAM TERMINAL END SHOE CONNECTION ISO 17025 Laboratory Testing Certificate # 2821.01 Pendulum testing performed at: TTI Proving Ground 3100 SH 47, Building 7091 Bryan,
MASH TEST 3-10 ON 31-INCH W-BEAM GUARDRAIL WITH STANDARD OFFSET BLOCKS
 TTI: 9-1002 MASH TEST 3-10 ON 31-INCH W-BEAM GUARDRAIL WITH STANDARD OFFSET BLOCKS ISO 17025 Laboratory Testing Certificate # 2821.01 Crash testing performed at: TTI Proving Ground 3100 SH 47, Building
MASH TEST 3-37 OF THE TxDOT 31-INCH W-BEAM DOWNSTREAM ANCHOR TERMINAL
 TTI: 9-1002 MASH TEST 3-37 OF THE TxDOT 31-INCH W-BEAM DOWNSTREAM ANCHOR TERMINAL ISO 17025 Laboratory Testing Certificate # 2821.01 Crash testing performed at: TTI Proving Ground 3100 SH 47, Building
MASH TEST 3-11 OF THE TxDOT T222 BRIDGE RAIL
 TTI: 9-1002-12 MASH TEST 3-11 OF THE TxDOT T222 BRIDGE RAIL ISO 17025 Laboratory Testing Certificate # 2821.01 Crash testing performed at: TTI Proving Ground 3100 SH 47, Building 7091 Bryan, TX 77807 Test
Texas Transportation Institute The Texas A&M University System College Station, Texas
 2. Government Accession No. 3. Recipient's Catalog No. 1. Report No. FHWA/TX-03/0-4138-3 4. Title and Subtitle PERFORMANCE OF THE TXDOT T202 (MOD) BRIDGE RAIL REINFORCED WITH FIBER REINFORCED POLYMER BARS
CRASH TEST AND EVALUATION OF TEMPORARY WOOD SIGN SUPPORT SYSTEM FOR LARGE GUIDE SIGNS
 TTI: 9-1002-15 CRASH TEST AND EVALUATION OF TEMPORARY WOOD SIGN SUPPORT SYSTEM FOR LARGE GUIDE SIGNS ISO 17025 Laboratory Testing Certificate # 2821.01 Crash testing performed at: TTI Proving Ground 3100
Technical Report Documentation Page Form DOT F (8-72) Reproduction of completed page authorized
 Reproduction of completed page authorized") 1. Report No. FHWA/TX-05/0-4162-3 4. Title and Subtitle 2. Government Accession No. 3. Recipient's Catalog No. DEVELOPMENT OF LOW-DEFLECTION PRECAST CONCRETE ARRIER 5. Report Date January 2005 Technical
1. Report No. FHWA/TX-05/0-4162-3 4. Title and Subtitle 2. Government Accession No. 3. Recipient's Catalog No. DEVELOPMENT OF LOW-DEFLECTION PRECAST CONCRETE ARRIER 5. Report Date January 2005 Technical
Texas Transportation Institute The Texas A&M University System College Station, Texas
 1. Report No. FHWA/TX-04/9-8132-1 4. Title and Subtitle TESTING AND EVALUATION OF THE FLORIDA JERSEY SAFETY SHAPED BRIDGE RAIL 2. Government Accession No. 3. Recipient's Catalog No. 5. Report Date February
Texas Transportation Institute The Texas A&M University System College Station, Texas
 1. Report No. FHWA/TX-05/9-8132-P7 4. Title and Subtitle TL-4 CRASH TESTING OF THE F411 BRIDGE RAIL 2. Government Accession No. 3. Recipient's Catalog No. 5. Report Date October 2004 Technical Report Documentation
Evaluation and Design of ODOT s Type 5 Guardrail with Tubular Backup
 Evaluation and Design of ODOT s Type 5 Guardrail with Tubular Backup Draft Final Report Chuck A. Plaxico, Ph.D. James C. Kennedy, Jr., Ph.D. Charles R. Miele, P.E. for the Ohio Department of Transportation
MASH 2016 Implementation: What, When and Why
 MASH 2016 Implementation: What, When and Why Roger P. Bligh, Ph.D., P.E. Senior Research Engineer Texas A&M Transportation Institute June 7, 2016 2016 Traffic Safety Conference College Station, Texas Outline
ASTM F TEST M30 ON THE RSS-3000 DROP BEAM SYSTEM
 Proving Ground Test Report No.: 510602-RSS3 Test Report Date: January 2014 ASTM F2656-07 TEST M30 ON THE RSS-3000 DROP BEAM SYSTEM by Dean C. Alberson, Ph.D., P.E. Research Engineer Michael S. Brackin,
NCHRP Report 350 Test 4-12 of the Modified Thrie Beam Guardrail
 NCHRP Report 350 Test 4-12 of the Modified Thrie Beam Guardrail PUBLICATION NO. FHWA-RD-99-065 DECEMBER 1999 Research, Development, and Technology Turner-Fairbank Highway Research Center 6300 Georgetown
MASH08 TEST 3-11 OF THE ROCKINGHAM PRECAST CONCRETE BARRIER
 Proving Ground Report No. 400001-RPC4 Report Date: July 2009 MASH08 TEST 3-11 OF THE ROCKINGHAM PRECAST CONCRETE BARRIER by C. Eugene Buth, P.E. Research Engineer William F. Williams, P.E. Assistant Research
MASH TEST 3-21 ON TL-3 THRIE BEAM TRANSITION WITHOUT CURB
 TTI: 9-1002-12 MASH TEST 3-21 ON TL-3 THRIE BEAM TRANSITION WITHOUT CURB ISO 17025 Laboratory Testing Certificate # 2821.01 Crash testing performed at: TTI Proving Ground 3100 SH 47, Building 7091 Bryan,
Improving Roadside Safety by Computer Simulation
 A2A04:Committee on Roadside Safety Features Chairman: John F. Carney, III, Worcester Polytechnic Institute Improving Roadside Safety by Computer Simulation DEAN L. SICKING, University of Nebraska, Lincoln
Crash Testing Growth Common Roadside Hardware Systems Draft FHWA and AASHTO Requirements for Implementing MASH 2015
 64 th Annual Illinois Traffic Safety and Engineering Conference October 14, 2015 Crash Testing Growth Common Roadside Hardware Systems Draft FHWA and AASHTO Requirements for Implementing MASH 2015 1 https://www.youtube.com/watch?feature
1962: HRCS Circular 482 one-page document, specified vehicle mass, impact speed, and approach angle for crash tests.
 1 2 3 1962: HRCS Circular 482 one-page document, specified vehicle mass, impact speed, and approach angle for crash tests. 1973: NCHRP Report 153 16-page document, based on technical input from 70+ individuals
Development and Validation of a Finite Element Model of an Energy-absorbing Guardrail End Terminal
 Development and Validation of a Finite Element Model of an Energy-absorbing Guardrail End Terminal Yunzhu Meng 1, Costin Untaroiu 1 1 Department of Biomedical Engineering and Virginia Tech, Blacksburg,
Assessing Options for Improving Roadside Barrier Crashworthiness
 13 th International LS-DYNA Users Conference Session: Simulation Assessing Options for Improving Roadside Barrier Crashworthiness D. Marzougui, C.D. Kan, and K.S. Opiela Center for Collision Safety and
VULCAN BARRIER TL-3 GENERAL SPECIFICATIONS
 VULCAN BARRIER TL-3 GENERAL SPECIFICATIONS I. GENERAL A. The VULCAN BARRIER TL-3 (VULCAN TL-3) shall be a highly portable and crashworthy longitudinal barrier especially suited for use as a temporary barrier
Evaluation of the Midwest Guardrail System stiffness transition with curb
 University of Nebraska - Lincoln DigitalCommons@University of Nebraska - Lincoln Civil Engineering Faculty Publications Civil Engineering 2016 Evaluation of the Midwest Guardrail System stiffness transition
GUARDRAIL TESTING MODIFIED ECCENTRIC LOADER TERMINAL (MELT) AT NCHRP 350 TL-2. Dean C. Alberson, Wanda L. Menges, and Rebecca R.
 AT NCHRP 350 TL-2. Dean C. Alberson, Wanda L. Menges, and Rebecca R.") GUARDRAIL TESTING MODIFIED ECCENTRIC LOADER TERMINAL (MELT) AT NCHRP 350 TL-2 Dean C. Alberson, Wanda L. Menges, and Rebecca R. Haug Prepared for The New England Transportation Consortium July 2002 NETCR
GUARDRAIL TESTING MODIFIED ECCENTRIC LOADER TERMINAL (MELT) AT NCHRP 350 TL-2 Dean C. Alberson, Wanda L. Menges, and Rebecca R. Haug Prepared for The New England Transportation Consortium July 2002 NETCR
VULCAN BARRIER TL-3 GENERAL SPECIFICATIONS
 VULCAN BARRIER TL-3 GENERAL SPECIFICATIONS I. GENERAL A. The VULCAN BARRIER TL-3 (VULCAN TL-3) shall be a highly portable and crashworthy longitudinal barrier especially suited for use as a temporary barrier
Working Paper. Development and Validation of a Pick-Up Truck Suspension Finite Element Model for Use in Crash Simulation
 Working Paper NCAC 2003-W-003 October 2003 Development and Validation of a Pick-Up Truck Suspension Finite Element Model for Use in Crash Simulation Dhafer Marzougui Cing-Dao (Steve) Kan Matthias Zink
SUMMARY CHANGES FOR NCHRP REPORT 350 GUIDELINES [NCHRP (02)] Keith A. Cota, Chairman Technical Committee on Roadside Safety June 14, 2007
![SUMMARY CHANGES FOR NCHRP REPORT 350 GUIDELINES [NCHRP (02)] Keith A. Cota, Chairman Technical Committee on Roadside Safety June 14, 2007](/thumbs/87/97351925.jpg "SUMMARY CHANGES FOR NCHRP REPORT 350 GUIDELINES [NCHRP (02)] Keith A. Cota, Chairman Technical Committee on Roadside Safety June 14, 2007") SUMMARY CHANGES FOR NCHRP REPORT 350 GUIDELINES [NCHRP 22-14 (02)] Keith A. Cota, Chairman Technical Committee on Roadside Safety June 14, 2007 BACKGROUND Circular 482 (1962) First full scale crash test
SUMMARY CHANGES FOR NCHRP REPORT 350 GUIDELINES [NCHRP 22-14 (02)] Keith A. Cota, Chairman Technical Committee on Roadside Safety June 14, 2007 BACKGROUND Circular 482 (1962) First full scale crash test
COMPARISON OF THE IMPACT PERFORMANCE OF THE G4(1W) AND G4(2W) GUARDRAIL SYSTEMS UNDER NCHRP REPORT 350 TEST 3-11 CONDITIONS
 AND G4(2W) GUARDRAIL SYSTEMS UNDER NCHRP REPORT 350 TEST 3-11 CONDITIONS") Paper No. 00-0525 COMPARISON OF THE IMPACT PERFORMANCE OF THE G4(1W) AND G4(2W) GUARDRAIL SYSTEMS UNDER NCHRP REPORT 350 TEST 3-11 CONDITIONS by Chuck A. Plaxico Associate Research Engineer Worcester Polytechnic
Paper No. 00-0525 COMPARISON OF THE IMPACT PERFORMANCE OF THE G4(1W) AND G4(2W) GUARDRAIL SYSTEMS UNDER NCHRP REPORT 350 TEST 3-11 CONDITIONS by Chuck A. Plaxico Associate Research Engineer Worcester Polytechnic
DEVELOPMENT OF A TRANSITION BETWEEN FREE-STANDING AND REDUCED-DEFLECTION PORTABLE CONCRETE BARRIERS PHASE I
 Research Project Number TPF-5(193) Supplement #78 DEVELOPMENT OF A TRANSITION BETWEEN FREE-STANDING AND REDUCED-DEFLECTION PORTABLE CONCRETE BARRIERS PHASE I Submitted by Mojdeh Asadollahi Pajouh, Ph.D.
CRITICAL FLARE RATES FOR W-BEAM GUARDRAIL DETERMINING MAXIMUM CAPACITY USING COMPUTER SIMULATION NCHRP 17-20(3)
") CRITICAL FLARE RATES FOR W-BEAM GUARDRAIL DETERMINING MAXIMUM CAPACITY USING COMPUTER SIMULATION NCHRP 17-2(3) Submitted by Beau D. Kuipers, B.S.M.E., E.I.T. Graduate Research Assistant Ronald K. Faller,
CRITICAL FLARE RATES FOR W-BEAM GUARDRAIL DETERMINING MAXIMUM CAPACITY USING COMPUTER SIMULATION NCHRP 17-2(3) Submitted by Beau D. Kuipers, B.S.M.E., E.I.T. Graduate Research Assistant Ronald K. Faller,
PR V2. Submitted by. Professor MIDWEST Vine Street (402) Submitted to
 Submitted to") FINAL REPORT PR4893118-V2 ZONE OF INTRUSION STUDY Submitted by John D. Reid, Ph.D. Professor Dean L.. Sicking, Ph.D., P.E. Professorr and MwRSF Director MIDWEST ROADSIDE SAFETY FACILITY University of Nebraska-Lincoln
FINAL REPORT PR4893118-V2 ZONE OF INTRUSION STUDY Submitted by John D. Reid, Ph.D. Professor Dean L.. Sicking, Ph.D., P.E. Professorr and MwRSF Director MIDWEST ROADSIDE SAFETY FACILITY University of Nebraska-Lincoln
Development of a Finite Element Model of a Motorcycle
 Development of a Finite Element Model of a Motorcycle N. Schulz, C. Silvestri Dobrovolny and S. Hurlebaus Texas A&M Transportation Institute Abstract Over the past years, extensive research efforts have
Crash Performance of Strong-Post W-Beam Guardrail with Missing Blockouts Carolyn E. Hampton and Hampton C. Gabler
 Crash Performance of Strong-Post W-Beam Guardrail with Missing Blockouts Carolyn E. Hampton and Hampton C. Gabler Virginia Tech Center for Injury Biomechanics, Blacksburg VA 24061 Abstract Missing blockouts
Sponsored by Roadside Safety Research Program Pooled Fund Study No. TPF-5(114)
") Proving Ground Test Report No. 405160-23-2 Test Report Date: February 2012 MASH TEST 3-11 OF THE W-BEAM GUARDRAIL ON LOW-FILL BOX CULVERT by William F. Williams, P.E. Associate Research Engineer and Wanda
Proving Ground Test Report No. 405160-23-2 Test Report Date: February 2012 MASH TEST 3-11 OF THE W-BEAM GUARDRAIL ON LOW-FILL BOX CULVERT by William F. Williams, P.E. Associate Research Engineer and Wanda
Evaluation of the Midwest Guardrail System Stiffness Transition with Curb
 Duplication for publication or sale is strictly prohibited without prior written permission of the Transportation Research Board Paper No. -0 Evaluation of the Midwest Guardrail System Stiffness Transition
CRASH TEST OF MILE POST MARKER. T. J. Hirsch Research Engineer. and. Eugene Buth Assistant Research Engineer. Research Report Number 146-8
 CRASH TEST OF MILE POST MARKER by T. J. Hirsch Research Engineer and Eugene Buth Assistant Research Engineer Research Report Number 146-8 Studies of Field Adaption of Impact Attenuation Systems Research
DEVELOPMENT OF A MASH TL-3 TRANSITION BETWEEN GUARDRAIL AND PORTABLE CONCRETE BARRIERS
 Duplication for publication or sale is strictly prohibited without prior written permission of the Transportation Research Board Paper No. 17-01712 DEVELOPMENT OF A MASH TL-3 TRANSITION BETWEEN GUARDRAIL
July 10, Refer to: HSA-10/CC-78A
 July 10, 2003 Refer to: HSA-10/CC-78A Barry D. Stephens, P.E. Senior Vice President of Engineering ENERGY ABSORPTION Systems, Inc. 3617 Cincinnati Avenue Rocklin, California 95765 Dear Mr. Stephens: Your
VERIFICATION & VALIDATION REPORT of MGS Barrier Impact with 1100C Vehicle Using Toyota Yaris Coarse FE Model
 VERIFICATION & VALIDATION REPORT of MGS Barrier Impact with 1100C Vehicle Using Toyota Yaris Coarse FE Model CCSA VALIDATION/VERIFICATION REPORT Page 1 of 4 Project: CCSA Longitudinal Barriers on Curved,
Virginia Department of Transportation
 TEST REPORT FOR: Virginia Department of Transportation SKT SP 350 50 (15.24 m) System PREPARED FOR: Virginia Department of Transportation 1401 E. Broad St. Richmond, VA 23219 TEST REPORT NUMBER: REPORT
TEXAS TRANSPORTATION INSTITUTE THE TEXAS A & M UNIVERSITY SYSTEM COLLEGE STATION, TEXAS 77843
 NCHRP REPORT 350 TEST 3-11 OF THE NEW YORK DOT PORTABLE CONCRETE BARRIER WITH I-BEAM CONNECTION (RETEST) by Roger P. Bligh, P.E. Assistant Research Engineer Wanda L. Menges Associate Research Specialist
TRACC. Trinity Attenuating Crash Cushion
 TRACC Trinity Attenuating Crash Cushion CSP Pacific Business Unit of Fletcher Concrete & Infrastructure Limited 306 Neilson Street Onehunga, Auckland Phone: (09) 634 1239 or 0800 655 200 Fax: (09) 634
METAL BEAM GUARDFENCE TRANSITION AND END TREATMENT IDENTIFICATION GUIDE
 2016 TxDOT Design Division METAL BEAM GUARDFENCE TRANSITION AND END TREATMENT IDENTIFICATION GUIDE A guide to help TxDOT employees identify metal beam guardfence transitions and end treatments for the
Product Specification. ABSORB 350 TM TL-2 Non-Redirective, Gating, Crash Cushion Applied to Quickchange Moveable Barrier
 TB 000612 Rev. 0 Page 1 of 9 Product Specification ABSORB 350 TM TL-2 Non-Redirective, Gating, Crash Cushion Applied to Quickchange Moveable Barrier I. General The ABSORB 350 TM TL-2 System is a Non-Redirective,
CRASH TESTING OF RSA/K&C ANTI-RAM FOUNDATION BOLLARD PAD IN ACCORDANCE WITH U.S. DEPARTMENT OF STATE DIPLOMATIC SECURITY SD-STD-02.
 CRASH TESTING OF RSA/K&C ANTI-RAM FOUNDATION BOLLARD PAD IN ACCORDANCE WITH U.S. DEPARTMENT OF STATE DIPLOMATIC SECURITY SD-STD-02.01 REVISION A Prepared for RSA Protective Technologies, LLC FINAL REPORT
BLAST CAPACITY ASSESSMENT AND TESTING A-60 OFFSHORE FIRE DOOR
 BLAST CAPACITY ASSESSMENT AND TESTING Final Report December 11, 2008 A-60 OFFSHORE FIRE DOOR Prepared for: JRJ Alum Fab, Inc. Prepared by: Travis J. Holland Michael J. Lowak John R. Montoya BakerRisk Project
PRODUCT DESCRIPTION. X-Tension DS. is suitable for all road types: Motorways, country roads, city streets for speed categories up to 110 km/h.
 INDEX Introduction 2 Product Description 3 Installation 6 Specifications 7 Crash Tests Table 8 Reusability 9 FAQ 10 Annexes 14 Drawings 15 Pictures 16 Crash Tests Results 18 Approvals 23 INTRODUCTION Improving
TEXAS TRANSPORTATION INSTITUTE THE TEXAS A & M UNIVERSITY SYSTEM COLLEGE STATION, TEXAS 77843
 NCHRP REPORT 350 TEST 3-11 OF THE STEEL-BACKED TIMBER GUARDRAIL by D. Lance Bullard, Jr., P.E. Associate Research Engineer Wanda L. Menges Associate Research Specialist and Sandra K. Schoeneman Research
INCREASED SPAN LENGTH FOR THE MGS LONG-SPAN GUARDRAIL SYSTEM
 University of Nebraska - Lincoln DigitalCommons@University of Nebraska - Lincoln Mechanical (and Materials) Engineering -- Dissertations, Theses, and Student Research Mechanical & Materials Engineering,
DISTRIBUTION: Electronic Recipients List TRANSMITTAL LETTER NO. (15-01) MINNESOTA DEPARTMENT OF TRANSPORTATION. MANUAL: Road Design English Manual
 MINNESOTA DEPARTMENT OF TRANSPORTATION. MANUAL: Road Design English Manual") DISTRIBUTION: Electronic Recipients List MINNESOTA DEPARTMENT OF TRANSPORTATION DEVELOPED BY: Design Standards Unit ISSUED BY: Office of Project Management and Technical Support TRANSMITTAL LETTER NO.
DISTRIBUTION: Electronic Recipients List MINNESOTA DEPARTMENT OF TRANSPORTATION DEVELOPED BY: Design Standards Unit ISSUED BY: Office of Project Management and Technical Support TRANSMITTAL LETTER NO.
Development of Turning Templates for Various Design Vehicles
 Transportation Kentucky Transportation Center Research Report University of Kentucky Year 1991 Development of Turning Templates for Various Design Vehicles Kenneth R. Agent Jerry G. Pigman University of
AASHTO Manual for Assessing Safety Hardware, AASHTO/FHWA Joint Implementation Plan Standing Committee on Highways September 24, 2015
 AASHTO Manual for Assessing Safety Hardware, 2015 AASHTO/FHWA Joint Implementation Plan Standing Committee on Highways September 24, 2015 Full Scale MASH Crash Tests (NCHRP 22-14(02)) Conducted several
ROBUST PROJECT Norwegian Public Roads Administration / Force Technology Norway AS
 ROBUST PROJECT Norwegian Public Roads Administration / Force Technology Norway AS Evaluation of small car - RM_R1 - prepared by Politecnico di Milano Volume 1 of 1 January 2006 Doc. No.: ROBUST-5-002/TR-2004-0039
Heating Comparison of Radial and Bias-Ply Tires on a B-727 Aircraft
 'S Heating Comparison of Radial and Bias-Ply Tires on a B-727 Aircraft November 1997 DOT/FAA/AR-TN97/50 This document is available to the U.S. public through the National Technical Information Service
I. 22. Price. Technical Report Documentation Page
 1. Report No. TX-00/1914-5 1 2. Government Accession No. 4. Title and Subtitle THE 1995 PERFORMANCE RESULTS FOR SLOPE PROTECTION PRODUCTS, HYDRAULIC MULCHES, AND FLEXIBLE CHANNEL LINERS Technical Report
June 5, In Reply Refer To: HSSD/B-178. Mr. Kevin K. Groeneweg Mobile Barriers LLC Genesee Trail Road Golden, CO Dear Mr.
 June 5, 2008 1200 New Jersey Avenue, SE. Washington, DC 20590 In Reply Refer To: HSSD/B-178 Mr. Kevin K. Groeneweg Mobile Barriers LLC 24918 Genesee Trail Road Golden, CO 80401 Dear Mr. Groeneweg: This
s MEDIAN BARRIERS FOR TEXAS HIGHWAYS
 s MEDIAN BARRIERS FOR TEXAS HIGHWAYS SUMMARY REPORT of Research Report Number 146-4 Study 2-8-68-146 Cooperative Research Program of the Texas Transportation Institute and the Texas Highway Department
BarrierGate. General Specifications. Manual Operations General Specifications
 BarrierGate General Specifications Manual Operations General Specifications BarrierGate GENERAL SPECIFICATIONS I. GENERAL A. The BarrierGate system (the gate) shall be designed and manufactured by Energy
Universal TAU-IIR Redirective, Non-Gating, Crash Cushion
 TB 110927 Rev. 0 Page 1 of 5 Product Specification Universal TAU-IIR Redirective, Non-Gating, Crash Cushion I. General The Universal TAU-IIR system is a Redirective, Non-Gating Crash Cushion in accordance
KENTUCKY TRANSPORTATION CENTER
 Research Report KTC-08-10/UI56-07-1F KENTUCKY TRANSPORTATION CENTER EVALUATION OF 70 MPH SPEED LIMIT IN KENTUCKY OUR MISSION We provide services to the transportation community through research, technology
February 8, In Reply Refer To: HSSD/CC-104
 February 8, 2008 200 New Jersey Avenue, SE. Washington, DC 20590 In Reply Refer To: HSSD/CC-04 Barry D. Stephens, P.E. Sr. Vice President Engineering Energy Absorption Systems, Inc. 367 Cincinnati Avenue
Midwest Guardrail System Without Blockouts
 Duplication for publication or sale is strictly prohibited without prior written permission of the Transportation Research Board Paper No. 13-0418 Midwest Guardrail System Without Blockouts by John D.
TEXAS TRANSPORTATION INSTITUTE THE TEXAS A & M UNIVERSITY SYSTEM COLLEGE STATION, TEXAS
 NCHRP REPORT 350 TEST 4-21 OF THE ALASKA MULTI-STATE BRIDGE RAIL THRIE-BEAM TRANSITION by C. Eugene Buth Senior Research Engineer William F. Williams Assistant Research Engineer Wanda L. Menges Associate
Development of Combination Pedestrian-Traffic Bridge Railings
 TRANSPORTATION RESEARCH RECORD 1468 41 Development of Combination Pedestrian-Traffic Bridge Railings D. LANCE BULLARD, JR., WANDA L. MENGES, AND C. EUGENE BUTH Two bridge railing designs have been developed
STI Project: Barrier Systems, Inc. RTS-QMB Longitudinal Barrier. Page 38 of 40 QBOR1. Appendix F (Continued) Figure F-3
 Figure F-3") Barrier Systems, Inc. RTS-QMB Longitudinal Barrier STI Project: QBOR1 Page 38 of 40 Appendix F (Continued) Figure F-3 t=.500sec 115 meters overall 37.1 Impact Severity (kj).. 141.6 Angle (deg).. 25 Speed
Barrier Systems, Inc. RTS-QMB Longitudinal Barrier STI Project: QBOR1 Page 38 of 40 Appendix F (Continued) Figure F-3 t=.500sec 115 meters overall 37.1 Impact Severity (kj).. 141.6 Angle (deg).. 25 Speed
REPORT NUMBER: 301-CAL SAFETY COMPLIANCE TESTING FOR FMVSS 301 FUEL SYSTEM INTEGRITY HONDA MOTOR COMPANY 2007 HONDA ACCORD 4-DOOR SEDAN
 REPORT NUMBER: 301-CAL-07-05 SAFETY COMPLIANCE TESTING FOR FMVSS 301 FUEL SYSTEM INTEGRITY HONDA MOTOR COMPANY 2007 HONDA ACCORD 4-DOOR SEDAN NHTSA NUMBER: C75304 CALSPAN TEST NUMBER: 8832-F301-05 CALSPAN
EXTENDING TL-2 SHORT-RADIUS GUARDRAIL TO LARGER RADII
 Research Project Number TPF-5(193) Supplement 27 EXTENDING TL-2 SHORT-RADIUS GUARDRAIL TO LARGER RADII Submitted by Cody S. Stolle, Ph.D., E.I.T. Post-Doctoral Research Associate Robert W. Bielenberg,
Remote Combination Adaptive Driving Equipment Investigation Dynamic Science, Inc. (DSI), Case Number G 1990 Ford Bronco Arizona October
, Case Number G 1990 Ford Bronco Arizona October") Remote Combination Adaptive Driving Equipment Investigation Dynamic Science, Inc. (DSI), Case Number 2007-76-131G 1990 Ford Bronco Arizona October 2007 This document is disseminated under the sponsorship
Remote Combination Adaptive Driving Equipment Investigation Dynamic Science, Inc. (DSI), Case Number 2007-76-131G 1990 Ford Bronco Arizona October 2007 This document is disseminated under the sponsorship
Performance Based Design for Bridge Piers Impacted by Heavy Trucks
 Performance Based Design for Bridge Piers Impacted by Heavy Trucks Anil K. Agrawal, Ph.D., P.E., Ran Cao and Xiaochen Xu The City College of New York, New York, NY Sherif El-Tawil, Ph.D. University of
DEFLECTION LIMITS FOR TEMPORARY CONCRETE BARRIERS
 Midwest State s Regional Pooled Fund Research Program Fiscal Year 1998-1999 (Year 9) NDOR Research Project Number SPR-3(017) DEFLECTION LIMITS FOR TEMPORARY CONCRETE BARRIERS Submitted by Dean L. Sicking,
Vehicle Dynamic Simulation Using A Non-Linear Finite Element Simulation Program (LS-DYNA)
") Vehicle Dynamic Simulation Using A Non-Linear Finite Element Simulation Program (LS-DYNA) G. S. Choi and H. K. Min Kia Motors Technical Center 3-61 INTRODUCTION The reason manufacturers invest their time
Vehicle Dynamic Simulation Using A Non-Linear Finite Element Simulation Program (LS-DYNA) G. S. Choi and H. K. Min Kia Motors Technical Center 3-61 INTRODUCTION The reason manufacturers invest their time
The University of Texas at Arlington The University of Texas System Texas Transportation Institute The Texas A&M University System
 1. Report No. FHWA/TX-08/5-4385-01-1 4. Title and Subtitle PILOT IMPLEMENTATION OF BUMP DETECTION PROFILER Technical Report Documentation Page 2. Government Accession No. 3. Recipient's Catalog No. 5.
Implementation of AASHTO s Manual for Assessing Safety Hardware (MASH) 2016
 2016") Implementation of AASHTO s Manual for Assessing Safety Hardware (MASH) 2016 Update from the Technical Committee on Roadside Safety Keith Cota, New Hampshire DOT MASH 2016 Overview Background Ballot Results/Dates
Implementation of AASHTO s Manual for Assessing Safety Hardware (MASH) 2016 Update from the Technical Committee on Roadside Safety Keith Cota, New Hampshire DOT MASH 2016 Overview Background Ballot Results/Dates
Remote, Redesigned Air Bag Special Study Dynamic Science, Inc., Case Number ( C) 1998 Nissan Altima Texas August/1998
 1998 Nissan Altima Texas August/1998") Remote, Redesigned Air Bag Special Study Dynamic Science, Inc., Case Number ( 1998-49-136C) 1998 Nissan Altima Texas August/1998 Technical Report Documentation Page 1. Report No. 2. Government Accession
Remote, Redesigned Air Bag Special Study Dynamic Science, Inc., Case Number ( 1998-49-136C) 1998 Nissan Altima Texas August/1998 Technical Report Documentation Page 1. Report No. 2. Government Accession
CRASH TEST REPORT FOR PERIMETER BARRIERS AND GATES TESTED TO SD-STD-02.01, REVISION A, MARCH Anti-Ram Bollards
 CRASH TEST REPORT FOR PERIMETER BARRIERS AND GATES TESTED TO SD-STD-02.01, REVISION A, MARCH 2003 Anti-Ram Bollards Prepared for: RSA Protective Technologies, LLC 1573 Mimosa Court Upland, CA 91784 Test
FHWA/IN/JTRP-2000/23. Final Report. Sedat Gulen John Nagle John Weaver Victor Gallivan
 FHWA/IN/JTRP-2000/23 Final Report DETERMINATION OF PRACTICAL ESALS PER TRUCK VALUES ON INDIANA ROADS Sedat Gulen John Nagle John Weaver Victor Gallivan December 2000 Final Report FHWA/IN/JTRP-2000/23 DETERMINATION
W-Beam Guiderail Transition from Light to Heavy Posts
 TRANSPORTATION RESEARCH RECORD 1198 55 W-Beam Guiderail Transition from Light to Heavy Posts DONALD G. HERRING AND JAMES E. BRYDEN Two full-scale crash tests evaluated a transition between lightand heavy-post
Wyoming Road Closure Gate
 38 TRANSPORTATION RESEARCH RECORD 1528 Wyoming Road Closure Gate KING K. MAK, ROGER P. BLIGH, AND WILLIAM B. WILSON Road closure gates are used to close certain highways when driving conditions become
Impact analysis of a vertical flared back bridge rail-to-guardrail transition structure using simulation
 Finite Elements in Analysis and Design 41 (2005) 371 396 www.elsevier.com/locate/finel Impact analysis of a vertical flared back bridge rail-to-guardrail transition structure using simulation Ali O. Atahan,
W-Beam Approach Treatment at Bridge Rail Ends Near Intersecting Roadways
 TRANSPORTATION RESEARCH RECORD 1133 51 W-Beam Approach Treatment at Bridge Rail Ends Near Intersecting Roadways M. E. BRONSTAD, M. H. RAY, J. B. MAYER, JR., AND c. F. MCDEVITT This paper is concerned with
REPORT NUMBER: 301-MGA SAFETY COMPLIANCE TESTING FOR FMVSS 301R FUEL SYSTEM INTEGRITY REAR IMPACT
 REPORT NUMBER: 301-MGA-2011-008 SAFETY COMPLIANCE TESTING FOR FMVSS 301R FUEL SYSTEM INTEGRITY REAR IMPACT MAZDA MOTOR CORPORATION 2011 MAZDA 2 SPORT MT NHTSA NUMBER: CB5400 PREPARED BY: MGA RESEARCH CORPORATION
April 22, In Reply Refer To: HSA-10/WZ-206. Mr. Jan Miller TrafFix Devices 220 Calle Pintoresco San Clemente, California Dear Mr.
 April 22, 2005 400 Seventh St., S.W. Washington, D.C. 20590 In Reply Refer To: HSA-10/WZ-206 Mr. Jan Miller TrafFix Devices 220 Calle Pintoresco San Clemente, California 92672 Dear Mr. Miller: Thank you
REPORT NUMBER: 301-MGA SAFETY COMPLIANCE TESTING FOR FMVSS 301R FUEL SYSTEM INTEGRITY REAR IMPACT
 REPORT NUMBER: 301-MGA-2010-007 SAFETY COMPLIANCE TESTING FOR FMVSS 301R FUEL SYSTEM INTEGRITY REAR IMPACT NISSAN MOTOR COMPANY LTD 2010 NISSAN CUBE NHTSA NUMBER: CA5205 PREPARED BY: MGA RESEARCH CORPORATION
Methodologies and Examples for Efficient Short and Long Duration Integrated Occupant-Vehicle Crash Simulation
 13 th International LS-DYNA Users Conference Session: Automotive Methodologies and Examples for Efficient Short and Long Duration Integrated Occupant-Vehicle Crash Simulation R. Reichert, C.-D. Kan, D.
November 16, 1998 Refer to: HNG-14. Mr. David Allardyce Mechanical Engineer B&B Electromatic Main Street Norwood, Louisiana 70761
 November 16, 1998 Refer to: HNG-14 Mr. David Allardyce Mechanical Engineer B&B Electromatic 14113 Main Street Norwood, Louisiana 70761 Dear Mr. Allardyce: In your August 31 letter, you presented some preliminary
Performance Level 1 Bridge Railings
 80 TRANSPORTATION RESEARCH RECORD 1500 Performance Level 1 Bridge Railings DEAN C. ALBERSON, WANDA L. MENGES, AND C. EUGENE BUTH Twenty-three states, FHW A, and the District of Columbia sponsored the project
CRASH TEST REPORT FOR PERIMETER BARRIERS AND GATES TESTED TO SD-STD-02.01, REVISION A, MARCH Anti-Ram Bollards
 CRASH TEST REPORT FOR PERIMETER BARRIERS AND GATES TESTED TO SD-STD-02.01, REVISION A, MARCH 2003 Anti-Ram Bollards Prepared for: RSA Protective Technologies, LLC 1573 Mimosa Court Upland, CA 91784 Test
REPORT NUMBER: 301-CAL SAFETY COMPLIANCE TESTING FOR FMVSS 301 FUEL SYSTEM INTEGRITY REAR IMPACT FORD MOTOR COMPANY 2009 FORD F150 2-DOOR PICKUP
 REPORT NUMBER: 301-CAL-09-03 SAFETY COMPLIANCE TESTING FOR FMVSS 301 FUEL SYSTEM INTEGRITY REAR IMPACT FORD MOTOR COMPANY 2009 FORD F150 2-DOOR PICKUP NHTSA NUMBER: C90206 CALSPAN TRANSPORTATION SCIENCES
Evaluating The Relevancy Of Current Crash Test Guidelines For Roadside Safety Barriers On High Speed Roads
 Evaluating The Relevancy Of Current Crash Test Guidelines For Roadside Safety Barriers On High Speed Roads Connie Xavier Dominique Lord Chiara Dobrovolny Roger Bligh TRB 1 st International Roadside Safety