DEVELOPMENT OF A TRANSITION BETWEEN FREE-STANDING AND REDUCED-DEFLECTION PORTABLE CONCRETE BARRIERS PHASE I
|
|
|
- Clarence Flowers
- 6 years ago
- Views:
Transcription

 472-0965 Submitted to WISCONSIN")
1 Research Project Number TPF-5(193) Supplement #78 DEVELOPMENT OF A TRANSITION BETWEEN FREE-STANDING AND REDUCED-DEFLECTION PORTABLE CONCRETE BARRIERS PHASE I Submitted by Mojdeh Asadollahi Pajouh, Ph.D. Post-Doctoral Research Associate Robert W. Bielenberg, M.S.M.E., E.I.T. Research Engineer Jennifer D. Schmidt, Ph.D., P.E. Research Assistant Professor Ronald K. Faller, Ph.D., P.E. Research Associate Professor MwRSF Director MIDWEST ROADSIDE SAFETY FACILITY Nebraska Transportation Center University of Nebraska-Lincoln 130 Whittier Research Center 2200 Vine Street Lincoln, Nebraska (402) Submitted to WISCONSIN DEPARTMENT OF TRANSPORTATION 4802 Sheboygan Avenue Madison, Wisconsin MwRSF Research Report No. TRP August 8, 2017
2 TECHNICAL REPORT DOCUMENTATION PAGE 1. Report No Recipient s Accession No. TRP Title and Subtitle 5. Report Date Development of a Transition Between Free-Standing and Reduced-Deflection Portable Concrete Barriers Phase I August 8, Author(s) 8. Performing Organization Report No. Asadollahi Pajouh, M., Schmidt, J.D., Bielenberg, R.W., and Faller, R.K. 6. TRP Performing Organization Name and Address 10. Project/Task/Work Unit No. Midwest Roadside Safety Facility (MwRSF) Nebraska Transportation Center University of Nebraska-Lincoln 130 Whittier Research Center 2200 Vine Street Lincoln, Nebraska Contract or Grant (G) No. TPF-5(193) Supplement # Sponsoring Organization Name and Address 13. Type of Report and Period Covered Wisconsin Department of Transportation 4802 Sheboygan Avenue Madison, Wisconsin Supplementary Notes Final Report: Sponsoring Agency Code 16. Abstract The objective of this research effort was to develop a Manual for Assessing Safety Hardware 2016 (MASH) Test Level 3 (TL-3) transition between the recently developed non-anchored, reduced-deflection, F-shape, Portable Concrete Barrier (PCB) system and free-standing, F-shape PCB segments. The reduced-deflection PCB system consisted of a cap plate bolted across the PCB joint and continuous tubes running along the sides of the barriers, which was successfully crash tested under MASH 2016 TL-3. A transition was developed between the reduced-deflection PCB and free-standing PCB systems through engineering analysis and LS-DYNA computer simulation. First, the continuous steel tubes in the reduced-deflection system were tapered down to match the surface of the free-standing PCB segments at a 1:6 lateral-to-longitudinal rate to reduce the potential for vehicle snag. An HSS 3½x3½x⅜ steel tube was added between adjacent PCB segments at the base of two joints upstream from the reduced-deflection system to improve transition performance. Simulations were performed to determine the critical impact points (CIP) for full-scale crash testing of the selected design. It was recommended to conduct three fullscale crash tests, two tests with test designation no with a 2270P pickup truck vehicle, and one test with test designation no using an 1100C passenger car to evaluate the system. For test designation no. 3-21, two impact locations were deemed critical, one at 4.3 ft (1.3 m) upstream from the transition joint (i.e., upstream from the end of the free-standing PCB and upstream from the reduced-deflection PCB system), which is the MASH 2016 recommended CIP, and one at 55.7 ft (17 m) upstream from the transition joint. For test designation no. 3-20, the CIP was recommended to be 3.6 ft (1.1 m) upstream from the transition joint. 17. Document Analysis/Descriptors 18. Availability Statement Highway Safety, Roadside Appurtenances, MASH, Computer Simulation, LS-DYNA, Temporary Concrete Barrier, Portable Concrete Barrier, Reduced Deflection, Transition No restrictions. Document available from: National Technical Information Services, Springfield, Virginia Security Class (this report) 20. Security Class (this page) 21. No. of Pages 22. Price Unclassified Unclassified 59 i
3 DISCLAIMER STATEMENT This report was completed with funding from the Wisconsin Department of Transportation. The contents of this report reflect the views and opinions of the authors who are responsible for the facts and the accuracy of the data presented herein. The contents do not necessarily reflect the official views or policies of the Wisconsin Department of Transportation. This report does not constitute a standard, specification, regulation, product endorsement, or an endorsement of manufacturers. ii
4 ACKNOWLEDGEMENTS The authors wish to acknowledge several sources that made a contribution to this project: (1) Wisconsin Department of Transportation for funding this project and (2) the Holland Computing Center at the University of Nebraska for the high-performance computing resources. Acknowledgement is also given to the following individuals who made a contribution to the completion of this research project. Midwest Roadside Safety Facility J.D. Reid, Ph.D., Professor J.C. Holloway, M.S.C.E., E.I.T., Test Site Manager K.A. Lechtenberg, M.S.M.E., E.I.T., Research Engineer S.K. Rosenbaugh, M.S.C.E., E.I.T., Research Engineer C.S. Stolle, Ph.D., Research Assistant Professor A.T. Russell, B.S.B.A., Shop Manager S.M. Tighe, Laboratory Mechanic D.S. Charroin, Laboratory Mechanic M.A. Rasmussen, Laboratory Mechanic E.W. Krier, Laboratory Mechanic Undergraduate and Graduate Research Assistants Wisconsin Department of Transportation Jerry Zogg, P.E., Chief Roadway Standards Engineer Erik Emerson, P.E., Standards Development Engineer Rodney Taylor, P.E., Roadway Design Standards Unit Supervisor iii
5 TABLE OF CONTENTS TECHNICAL REPORT DOCUMENTATION PAGE... i DISCLAIMER STATEMENT... ii ACKNOWLEDGEMENTS... iii TABLE OF CONTENTS... iv LIST OF FIGURES... vi LIST OF TABLES... viii 1 INTRODUCTION Background and Problem Statement Objective Scope LITERATURE REVIEW NCHRP Report 350 PCB Testing MASH 2009 PCB Testing Free-Standing F-Shape PCB Transition from Temporary to Permanent Median Barrier (MwRSF) Transition from Pinned PCB to Rigid Concrete Barrier (TTI) Termination of Box Beam in Roadside Systems Other Horizontal Flares in Barrier Systems TRANSITION DESIGN AND ANALYSIS Design Criteria Design Concepts TEST REQUIREMENTS AND EVALUATION CRITERIA Test Requirements Evaluation Criteria LS-DYNA MODEL PCB Model Reduced-Deflection Steel Components Model Baseline model SIMULATIONS WITH SLOPED TUBES Sloped Tubes Model Simulation of Sloped Tube Model with Different Impact Points SIMULATION OF PROPOSED TRANSITION DESIGN MODIFICATIONS Evaluation Criteria Tube Spacer Added at Joint No Tube Spacers Added at Joints Nos. 1 and iv
6 7.3.1 Single Tubes with Increased Thickness Simulations of Dual Tubes Selected Design Modification DETERMINATION OF CRITICAL IMPACT POINTS Determination of CIPs Test Designation No Determination of CIP Test Designation No MASH 2016 TL-3 Test Matrix for Evaluation of Transition SUMMARY, CONCLUSIONS, AND RECOMMENDATIONS REFERENCES v
7 LIST OF FIGURES Figure 1. WisDOT Modified Reduced-Deflection Portable Concrete Barrier [4]...2 Figure 2. Free-standing F-Shape PCB to Rigid Barrier Transition [8]...4 Figure 3. Temporary Concrete Barrier to Permanent Concrete Barrier Transition, Test Nos. TCBT-1 and TCBT-2 [10]...7 Figure 4. Transition Design for Anchored Temporary Barrier to Rigid Concrete Barrier [11]...8 Figure 5. Layout of Transition Design for Anchored Temporary Barrier to Rigid Concrete Barrier [11]...9 Figure 6. BEAT-SSCC Configuration [12-14]...10 Figure 7. State of New York Standard Details for Box-Beam to Concrete Parapet Transition [16-17]...11 Figure 8. Tapered Concrete Bridge Parapets [18]...12 Figure 9. Tubes Tapered Down to Reduced-Deflection PCB Segments Surface...14 Figure 10. Details of Tubes Tapered Down to Reduced-Deflection PCB Segment Surface...15 Figure 11. Joint Spacer (Steel Tube) at Transition Joint...15 Figure 12. F-shape PCB Barrier Model...19 Figure 13. Sequential Photographs: Simulation of Test No. 2214TB Figure 14. Test No. RDTCB-1 Model...22 Figure 15. Test No. RDTCB-2 Final Barrier Model...23 Figure 16. Sequential Photographs: Baseline Simulation of Test No. RDTCB Figure 17. Simulated Tubes Tapered Along Reduced-Deflection PCB Segments Surface...25 Figure 18. Simulated Tubes Tapered Along Reduced-Deflection PCB Segments Surface...26 Figure 19. Simulated Vehicle Snag on Knee in Transition Region Impact Point in. (5,730 mm) Upstream from Transition Joint...28 Figure 20. Simulated Vehicle Damage Caused by Knee Impact Point in. (5,730 mm) Upstream from Transition Joint...28 Figure 21. Sequential Photographs: Impact Point at in. (5,730 mm) Upstream from Transition Joint (Left) and Impact Point at in. (8,930 mm) Upstream from Transition Joint (Right)...29 Figure 22. Transition with Single Steel Tube at Joint No Figure 23. Steel Tube Model HSS 3½x3½x¼...31 Figure 24. Crushed Steel Tube at Joint No. 1 After Impact: (a) Tube on Ground, (b) Tube Raised ½ in...32 Figure 25. Simulated Cases with One Tube at Joint No. 1 Impact Points...33 Figure 26. Knee Contact on Vehicle Door Impact Point in. (5,730 mm) Upstream from Transition Joint...34 Figure 27. Sequential Photographs: Impact Point at in. (5,730 mm) Upstream from Transition Joint with One Steel Tube...35 Figure 28. Single Steel Tube Added at Joint Nos. 1 and Figure 29. Simulated Cases with Tube at Joints Nos. 1 and 2 Impact Points...37 Figure 30. (a) Tube Added at Joint No. 1, (b) Tube Added at Joint Nos. 1 and 2 Impact Point in. (8,930 mm) Upstream from Transition Joint...38 Figure 31. (a) HSS 3½x3½x¼ Tube Added at Joint Nos. 1 and 2, (b) HSS 3½x3½x⅜ Tube Added at Joint Nos. 1 and 2 Impact Point in. (5,730 mm) Upstream from Transition Joint...39 vi
8 Figure 32. Single Tube HSS 3½x3½x⅜ Added at Joint Nos. 1 and 2 After Impact...39 Figure 33. Dual Tubes HSS 3½x3½x¼ Tube with HSS 2½x2½x¼ Tube Inside Added at Joint Nos. 1 and Figure 34. Dual Tubes Stack of Two HSS 3½x1½x ¼ Tubes Added at Joint Nos. 1 and Figure 35. Modified Transition Design: (a) HSS 3½x3½x¼ Tube Added, (b) HSS 3½x3½x¼ Tube with HSS 2½x2½x¼ Tube Inside, and (c) Stack of Two HSS 3½x1½x¼ Tubes Added at Joint Nos. 1 and 2 Impact Point in. (5,730 mm) Upstream from Transition Joint...42 Figure 36. Single Tube HSS 3½x3½x⅜ Added at Joint Nos. 1 and Figure 37. Simulated Cases with Tube at Two Joints Nos. 1 and 2 Impact Points...45 Figure 38. Vehicle Snag on Box Tubes Along Reduced-Deflection PCB Impact Point 4.3 ft (1.3 m) Upstream from Transition Joint...46 Figure 39. Knee Contact Impact Point in. (17,000 mm) Upstream from Transition Joint...47 Figure 40. Sequential Photographs: Impact at MASH 2016-Recommended CIP 4.3 ft (1.3 m) Upstream from Transition Joint 2270P Vehicle...49 Figure 41. Sequential Photographs: Impact at MASH 2016-Recommended CIP in. (17,000 mm) Upstream from Transition Joint 2270P Vehicle...50 Figure 42. Sequential Photographs: Impact Point at 3.6 ft (1.1 m) Upstream from Transition Joint...52 Figure 43. Recommended CIPs 3.6 ft (1.1 m) Upstream from Transition Joint for 1100C Vehicle Testing (Blue Arrow) and 4.3 ft and 55.7 ft (1.3 m and 17 m) upstream from Transition joint for 2270P Vehicle Testing (Red Arrows)...56 vii
9 LIST OF TABLES Table 1. F-Shape PCB Deflections...6 Table 2. MASH 2016 TL-3 Crash Test Conditions for Transitions...16 Table 3. MASH 2016 Evaluation Criteria for Transitions...17 Table 4. Comparison of Reduced-Deflection PCB System Test and Simulation...21 Table 5. Summary of Simulation Results Only Tapered Tubes, No Transition in Stiffness...27 Table 6. Summary of Simulation Results Tube on Ground and Raised Tube...32 Table 7. Summary of Simulation Results One Steel Tube at Base of Joint No Table 8. Summary of Simulation Results Single Steel Tube at Base of Joint Nos. 1 and Table 9. Summary of Simulation Results Impact Point in. (5,730 mm) Upstream from Transition Joint Single and Dual Tubes...43 Table 10. Summary of Simulation Results HSS 3½x3½x⅜ Single Tube at Joints Nos. 1 and Table 11. Summary of Simulation Results Thick Single Tube and Dual Tubes...51 Table 12. MASH 2016 TL-3 Test Matrix for Evaluation of Transition...53 viii
10 1.1 Background and Problem Statement 1 INTRODUCTION Portable concrete barriers (PCBs) are often used in applications where it is desired that their deflection during vehicular impacts be limited, such as on bridge decks and in some workzones. The Wisconsin Department of Transportation (WisDOT) currently employs the F-shape PCB design previously developed by the Midwest Roadside Safety Facility (MwRSF) [1-4]. However, this system has large deflections which may restrict it from being used in limited-sized construction zones. WisDOT desired a concept for reducing barrier deflections without the need for additional tie-down anchors and that could be retrofitted to their current PCB with minimal modification. MwRSF recently completed a research effort to develop and test a new, low-deflection system that utilized the F-shape PCB without anchorage to the roadway surface [5, 6]. The initial system design consisted of a cap plate bolted across the PCB joint and continuous tubes running along the sides of the barriers. It was anticipated that the combination of the steel cap and tubes would be effective in limiting barrier deflection through composite action. Further, the continuous tubes would interlock with a vehicle s sheet metal and provide increased vehicle stability by presenting a more vertical barrier face. Full-scale crash test no. RDTCB-1 was conducted on the initial low-deflection PCB design, with the back of the PCB system offset 24 in. (610 mm) away from the edge of a simulated bridge deck. Test no. RDTCB-1 consisted of a 4,998- lb (2,267-kg) pickup truck impacting the low-deflection PCB system at a speed of 63.6 mph (102.4 km/h) and at an angle of 24.9 degrees. The impacting vehicle was safely and smoothly redirected in the test, and all of the barrier segments were safely retained on the edge of the bridge deck. The peak dynamic lateral deflection of the barrier system was 43.0 in. (1,092 mm), which represented a 46 percent reduction in deflection as compared to the free-standing, F-shape PCB crash testing under Manual for Assessing Safety Hardware 2016 (MASH) Test Level 3 (TL-3) [7]. Following the crash test of the initial low-deflection PCB system, design modifications were proposed and investigated to further reduce dynamic system deflections. The proposed design modifications included: (1) increased barrier-to-ground friction; (2) increased tube thickness; (3) increased cap thickness; (4) reduced joint gap tolerance; and (5) additional attachment points for the tubes to the PCB segments. An LS-DYNA model of the low-deflection PCB system in test no. RDTCB-1 was created and validated, and this model was used to evaluate the proposed design modifications. The simulation results and input from the sponsor led to the selection of additional attachment points between the tubes and the PCB to further stiffen the barrier system. Test no. RDTCB-2 was conducted to evaluate the modified barrier system. The modified system consisted of a cap plate bolted across the PCB joint, continuous tubes running along the sides of the barriers, and the additional attachment points, as shown in Figure 1. Full-scale crash test no. RDTCB-2 was conducted on the final iteration of the low-deflection PCB with the back of the PCBs offset 24 in. (610 mm) away from the edge of a simulated bridge deck. Test no. RDTCB-2 consisted of a 4,978-lb (2,258-kg) pickup truck impacting the low-deflection PCB system at a speed of 64.8 mph (104.3 km/h) and at an angle of 25.4 degrees. The impacting vehicle was safely and smoothly redirected in the test, and all of the barrier segments were safely retained on the edge of the bridge deck. The peak dynamic lateral deflection of the barrier system 1
, which represented a 49")


11 was 40.7 in. (1,034 mm), which represented a 49 percent reduction in deflection as compared to the free-standing, F-shape PCB under MASH 2016 crash testing. Figure 1. WisDOT Modified Reduced-Deflection Portable Concrete Barrier [5] 2
12 This research project focused on the design and evaluation of the length-of-need of the new, low-deflection PCB system. However, additional considerations must be taken into account when implementing the barrier system outside the length-of-need, including within transitions to other barrier systems. The design of transitions to other barrier systems, including free-standing, F-shape PCB segments, was outside the scope of this original study and would require further research to design and evaluate. A new transition between the reduced-deflection PCB system and free-standing F-shape PCB would need to consider several factors. First, the deflections of the two systems vary by approximately 50 percent. Thus, a stiffness transition may be needed to prevent barrier pocketing and provide safe and stable vehicle redirection. Second, the horizontal steel tubes of the reduced-deflection system would need to be tapered down to match the surface of the freestanding PCB segments in a manner that reduces the potential for vehicle snag without inducing vehicle climb or instability. Thus, a need exists to develop and evaluate a crashworthy transition between the new reduced-deflection system and free-standing PCB segments. 1.2 Objective The objective of this research effort was to develop a MASH 2016 TL-3 transition between the recently-developed, non-anchored, reduced-deflection, F-shape PCB system and free-standing, F-shape PCB segments. The research effort focused on development of a design that safely transitioned between two barrier systems with varying deflections while maintaining vehicle stability. The design focused on minimizing the length of the transition and additional hardware components. 1.3 Scope The Phase I research effort to design and evaluate a MASH 2016 TL-3 transition between the recently-developed, non-anchored, reduced-deflection, PCB system and free-standing, F-shape PCB segments consisted of a literature review, concept development, computer simulation, and a summary report. The research effort began with a brief literature search to review previous transitions for PCB systems as well as termination and transition elements used for box-beam guardrail and steel tube bridge rail transitions. This information provided insight on potential transition designs and methods for safely tapering and terminating horizontal steel tubes. Following the literature search, transition design concepts were brainstormed and developed. The transition design concepts were evaluated based on potential safety performance, ease of installation, and length. The most promising design concepts were submitted to the sponsor for review and comment, and design revisions were made based on state feedback. LS-DYNA simulations were used to evaluate selected design concepts according to their safety performance. Validated models of the reduced-deflection and free-standing PCB systems from previous research were used in the LS-DYNA analysis. The computer simulation analysis began with the simplest, sponsor-favored design concepts, and complexity was added as needed to improve safety performance. After a transition design was developed to meet the MASH 2016 TL-3 impact criteria, a simulation study was performed to determine critical impact points (CIPs) for full-scale crash testing. A summary report of the research was completed detailing the literature search, computer simulation modeling, and recommendations for full-scale crash testing. 3
13 2.1 NCHRP Report 350 PCB Testing 2 LITERATURE REVIEW An F-shape PCB is used by WisDOT and a number of other states. It was developed through the Midwest States Pooled Fund Program [1-4]. This PCB system consists of a 32-in. (813-mm) tall x 22½-in. (572-mm) wide x 12½-ft (3.8-m) long F-shape concrete barrier segment with a pin-and-loop type connection. The barrier has been tested to TL-3 under the National Cooperative Highway Research Program (NCHRP) Report 350 [1, 2, 8]. In the NCHRP Report 350 crash testing program, test no. ITMP-2 demonstrated that the F-shape PCB was capable of safely redirecting a 4,409-lb (2,000-kg) vehicle (designated 2000P) when impacted at a speed of 62.3 mph (100.3 km/h) and an angle of 27.1 degrees [1]. The maximum dynamic deflection of the PCB system in test no. ITMP-2 was 45.3 in. (1,151 mm). Two anchored variations of the F-shape temporary concrete barrier system were tested under NCHRP Report 350 TL-3 [9]. In test no. FTB-1, three 1½-in. (38-mm) x 36-in. (914-mm) steel pins anchored the front face of each barrier segment through a 2-in. (51-mm) asphalt pad on soil. A 2000P pickup truck impacted the barrier system according to NCHRP Report 350 test designation no. 3-11, and the test was acceptable according to the safety performance criteria. The maximum dynamic deflection was 21.8 in. (554 mm) at the top of the barriers, and all of the barriers in the system were safely restrained on the asphalt road surface. The second variation was transitioning from completely free-standing temporary concrete barriers to a rigid barrier through a pinned-barrier transition. Four transition barriers were pinned in the layout shown in Figure 2 with 1½-in. (38-mm) x 38½-in. (978-mm) steel pins anchored the front face of each barrier segment through a 2-in. (51-mm) asphalt pad on soil. In addition, either 10-gauge or nested 12-gauge thrie beam should be bolted across both sides of the joint between the pinned barriers and the rigid barrier system in order to reduce the potential for vehicle snag at the joint. In test no. FTB-2, a 2000P pickup truck impacted the first transition barrier (with only one asphalt pin) according to NCHRP Report 350 test designation no. 3-21, and the test was acceptable according to the safety performance criteria. The maximum dynamic deflection was 18.4 in. (467 mm) at the top of the barriers. Figure 2. Free-standing F-Shape PCB to Rigid Barrier Transition [9] 4
14 2.2 MASH 2009 PCB Testing Free-Standing F-Shape PCB Two full-scale crash tests were conducted on the F-shape PCB during the development of the MASH 2009 safety requirements in NCHRP Project No [1, 4, 10]. Note that for this system, there is no difference between the MASH 2009 and MASH 2016 test evaluation criteria. The MASH 2009 testing used a 5,000-lb (2,268-kg) pickup truck rather than the 4,409-lb (2,000 kg) pickup truck specified in NCHRP Report 350. In test no. 2214TB-1, the F-shape PCB was impacted with a 2002 GMC 2500 ¾-ton, single-cab pickup truck with a mass of 5,000 lb (2,268 kg) at a speed of 61.8 mph (99.5 km/h) and at an angle of 25.7 degrees [1]. The PCB system safely redirected the impacting vehicle with a maximum lateral dynamic barrier deflection of 56.7 in. (1,440 mm). Significant vehicle climb was observed during test no. 2214TB-1. It should be noted that the vehicle used in this test had a center of gravity (CG) lower than desired for use in MASH 2009, and subsequent testing with a higher CG vehicle was recommended. A second test of the F-shape PCB was then conducted using a 2002 Dodge Ram 1500 Quad Cab pickup truck with a mass of 5,000 lb (2,268 kg) [4]. Test no. 2214TB-2 consisted of the 2270P vehicle impacting the PCB system at a speed of 62.0 mph (99.8 km/h) and at an angle of 25.4 degrees. The PCB system safely redirected the impacting vehicle with a maximum lateral dynamic barrier deflection of 79.6 in. (2,022 mm). Free-standing PCB deflections were significantly higher when testing was conducted with the 2270P vehicle under the MASH 2009 criteria as opposed to testing conducted with the 2000P vehicle under the NCHRP Report 350 criteria. PCB deflections increased 25 to 76 percent when the F-shape PCB was tested under MASH 2009 impact criteria, as shown in Table 1. This increase in deflection was due to a couple of factors: (1) higher vehicle mass induced more inertia and higher load transfer; (2) higher vehicle stability encouraged less climb and less vehicle rotation, which allowed the vehicle to directly load the barrier longer. In test no. 2214TB-2, the vehicle was engaged with the barrier for a longer period of time. Thus, it was believed a combination of increased kinetic energy, inertial transfer, and increased vehicle interaction with the barrier led to large barrier deflections. There were two successful MASH 2009 TL-3 crash tests on the low-deflection PCB system, which consisted of a cap plate bolted across the PCB joint and continuous tubes running along the sides of the barriers, as mentioned previously. Test no. RDTCB-1 consisted of a 4,998- lb (2,267-kg) pickup truck impacting the low-deflection PCB system at a speed of 63.6 mph (102.4 km/h) and at an angle of 24.9 degrees [5]. The peak dynamic lateral deflection of the barrier system was 43 in. (1,092 mm). Full-scale crash test no. RDTCB-2 was conducted on the final iteration of the lowdeflection PCB with the back of the PCBs offset 24 in. (610 mm) away from the edge of a simulated bridge deck. Test no. RDTCB-2 consisted of a 4,978-lb (2,258-kg) pickup truck impacting the low-deflection PCB system at a speed of 64.8 mph (104.3 km/h) and at an angle of 25.4 degrees [5]. The peak dynamic lateral deflection of the barrier system was 40.7 in. (1,034 mm). 5
15 Table 1. F-Shape PCB Deflections Test No. Variation Vehicle Mass lb (kg) Speed mph (km/h) Angle deg. Impact Severity kip-ft (kj) Dynamic Deflection in. (mm) Static Deflection in. (mm) ITMP-2 Freestanding 2000P 4,420 (2,005) 62.3 (100.3) (161.5) 45.3 (1,151) 44.9 (1,140) 2214TB-2 Freestanding 2270P 5,000 (2,268) 62.0 (99.8) (160.0) 79.6 (2,022) 73.0 (1,854) RDTCB-1 Freestanding with Tubes 2270P 4,998 (2,267) 63.6 (102.4) (162.4) 43.0 (1,092) 41.5 (1,054) RDTCB-2 Freestanding with Tubes 2270P 4,978 (2,258) 64.8 (104.3) (174.4) 40.7 (1,034) 39.5 (1,003) Transition from Temporary to Permanent Median Barrier (MwRSF) An approach transition was designed between free-standing, F-shape temporary concrete barriers and a permanent concrete median barrier [11]. The 42-in. (1,067-mm) tall, California single-slope, concrete median barrier was found to be most critical due to its height as compared to the F-shape temporary concrete barrier. The researchers utilized a combination of free-standing and tied-down Kansas Temporary F-shape Barriers, nested thrie beam on each side of the barriers for the transition to the single-slope permanent barrier, and transition cap, as shown in Figure 3. Two full-scale vehicle crash tests were performed on the system under MASH 2009 safety requirements. In crash test no. TCBT-1, a 5,006-lb (2,271-kg) pickup truck impacted the temporary barriers 56⅜ in. (1,432 mm) upstream from the permanent barrier at a speed of 62.4 mph (100.7 km/h) and an angle of 24.7 degrees. Crash test no. TCBT-2 was performed using a 4,990-lb (2,263- kg) pickup truck, which impacted the temporary barriers 54 ft - 6¾ in. (16.6 m) upstream from the permanent barrier at a speed of 62.2 mph (100.1 km/h) and an angle of 26.2 degrees. Both tests were determined to be acceptable according to the MASH 2009 TL-3 evaluation criteria. 6


16 Figure 3. Temporary Concrete Barrier to Permanent Concrete Barrier Transition, Test Nos. TCBT-1 and TCBT-2 [11] Transition from Pinned PCB to Rigid Concrete Barrier (TTI) The Texas A&M Transportation Institute (TTI) developed a transition from the pinneddown F-shape temporary concrete barrier to a permanent concrete barrier [12]. The transition was crash tested under MASH 2009 TL-3 criteria using a 32-in. (813-mm) tall, pinned-down (with angled pins), anchored F-shape temporary concrete barrier connected to a 42-in. (1,067-mm) tall, single-slope, concrete median barrier. The transition consisted of a 12-gauge (2.7-mm) thrie beam connected to the traffic-side face of the barriers, a ⅛-in. (3-mm) thick steel cap attached to the top of the F-shape and single-slope barriers, and a ¼-in. (6-mm) think steel plate fastened to the nontraffic side faces of the barriers. The cap transitioned 10 in. (254 mm) vertically over a longitudinal length of 48 in. (1,219 mm) from a 32-in. (813-mm) tall F-shape barrier to the 42-in. (1,067-mm) tall, single-slope barrier, as shown in Figures 4 and 5. The transition for the anchored temporary barrier to rigid concrete barrier safely redirected the 2270P vehicle and performed acceptably to MASH 2009 criteria test designation no Maximum dynamic deflection and permanent set of the transition were 5.7 in. (145 mm) and 2.5 in. (64 mm), respectively. 7


17 Figure 4. Transition Design for Anchored Temporary Barrier to Rigid Concrete Barrier [12] 8
18 Figure 5. Layout of Transition Design for Anchored Temporary Barrier to Rigid Concrete Barrier [12] 2.3 Termination of Box Beam in Roadside Systems Previous designs exist to taper box-beam guardrail to a concrete barrier. The box-beam burster, energy-absorbing, single-sided crash cushion (BEAT-SSCC) includes a configuration with 6-in. x 6-in. (152-mm x 152-mm) box-beam tapered to a concrete barrier, as shown in Figure 6 [13-15]. The last 7 in. (178 mm) is tapered at a 1:2.14 lateral-to-longitudinal rate. The upstream tube is tapered at a 1:6 lateral-to-longitudinal rate until connecting to 6-in. x 6-in. (152-mm x 152- mm) box beam with no taper. This crash cushion was successfully evaluated with a 2000P pickup truck in test no. SSC-4 in the reverse direction (impacting the tapered tube section at 20-degree angle) according to NCHRP Report 350 test no A very similar connection with the same taper rate was utilized in a Wyoming Department of Transportation transition design from a boxbeam guardrail to a permanent concrete barrier [16]. 9

19 Figure 6. BEAT-SSCC Configuration [13-15] 10
20 The State of New York Department of Transportation developed standard plans for their box-beam guardrail to concrete parapet transition, as shown in Figure 7 [17-18]. The 6-in. x 6-in. (152-mm x 152-mm) box beam rail is tapered to the face of the concrete barrier over 3 ft (914 mm) at a 1:6 lateral-to-longitudinal rate. Figure 7. State of New York Standard Details for Box-Beam to Concrete Parapet Transition [17-18] 2.4 Other Horizontal Flares in Barrier Systems In January 1988, the Federal Highway Administration (FHWA) provided recommendations on commonly used flare rates of concrete bridge rails [19]. Two examples of concrete bridge parapets had a 1:4 lateral-to-longitudinal flare rate, as shown in Figure 8. 11

21 Figure 8. Tapered Concrete Bridge Parapets [19] 12
22 3 TRANSITION DESIGN AND ANALYSIS 3.1 Design Criteria Prior to developing design concepts for a transition between the reduced-deflection PCB and free-standing PCB, the following design criteria were identified: 1. Design concepts should meet MASH 2016 TL-3 safety performance criteria. 2. The dynamic deflection of the transition system should range between deflections found for the reduced-deflection system (40.7 in. (1,034 mm)) and the free-standing PCB system (79.6 in. (2,022 mm)). 3. The transition design requires minimal modification to the barrier. This system should not include modifications to the pin-and-loop connection. 4. The concepts fabrication and installation should be easy. 5. The length of the transition and the required hardware should be minimized. These criteria were considered during the development of transition design concepts. The deflections of the reduced-deflection PCB and free-standing PCB systems vary by approximately 50 percent. No stiffness transition is desired for ease of installation. However, a stiffness transition may be necessary in order to prevent barrier pocketing and provide safe and stable vehicle redirection. Concepts with and without a stiffness transition were considered. 3.2 Design Concepts First, it was anticipated that the sharp, blunt ends of the HSS 5x5x 3 /16 continuous tubes running along the sides of the reduced-deflection PCB segments would increase the potential for vehicle snag. The researchers recommended that the HSS 5x5x 3 /16 tubes be tapered down to match the PCB surface. As previously noted in the literature review, several existing designs use tapered box beam ends to match the face of a concrete barrier. The BEAT-SSCC utilized a two-stage end taper with 1:2.14 and 1:6 lateral-to-longitudinal flare rates, which was successfully crash tested to NCHRP Report 350 criteria with a 2000P pickup truck [13-15]. Similarly, in a Wyoming Department of Transportation transition design, the box-beam guardrail ends were tapered to match a concrete barrier at the same rates. In the State of New York Department of Transportation transition design from a box-beam guardrail to a concrete parapet, the box-beam rail was tapered to match the concrete barrier at a 1:6 lateral-to-longitudinal rate. Other lateral-to-longitudinal flare rates utilized in roadside barriers vary from 1:4 to 1:10. In the current transition design, it was recommended to initially taper the HSS 5x5x 3 /16 tubes to the concrete segments at a 1:6 lateral-tolongitudinal rate, as shown in Figures 9 and 10. The drawings do not depict the final transition design. The design modification of tapering tubes at a 1:6 lateral-to-longitudinal rate with no incremental transition in stiffness was the first concept evaluated. If an incremental transition in stiffness was necessary, the researchers further brainstormed a number of ideas to improve the transition performance from the reduced-deflection PCB to the free-standing PCB. The concepts were grouped into four main categories based on the mechanism for mitigating significant changes in stiffness between adjacent barrier segments. The four concept categories for the transition were as follows: 13


23 1. Reduction of Joint Tolerance in Transition Region Reduction in the tolerance or gaps in the barrier joints such that the barrier segments engage each other more rapidly during impact to avoid knee-shape contact between the vehicle and the barrier segments. 2. Composite Action Development of tension and compression loads across the barrier joints in the transition region in order to develop moment continuity in the adjacent barrier segments in transition region. 3. Increased Barrier-to-Ground Friction Increasing friction between barrier and roadway surface in the transition region. 4. Increased Barrier Mass of Free-Standing Segment Adding mass or ballast to the freestanding barrier segment adjacent to the transition joint in order to provide increased inertial and friction resistance to motion. Following the review of the design concepts, it was concluded that the concept of reducing joint tolerance by adding a joint spacer (e.g., a steel tube) would be a simple yet functional option if a transition in stiffness was required. An example of a joint spacer is shown in Figure 11. 1:6 Taper Figure 9. Tubes Tapered Down to Reduced-Deflection PCB Segments Surface 14


24 1:6 Taper Figure 10. Details of Tubes Tapered Down to Reduced-Deflection PCB Segment Surface Steel Tube Spacer Figure 11. Joint Spacer (Steel Tube) at Transition Joint 15
25 4.1 Test Requirements 4 TEST REQUIREMENTS AND EVALUATION CRITERIA Transitions, including those between free-standing PCBs and reduced-deflection PCBs, must satisfy impact safety standards in order to be declared eligible for federal reimbursement by the FHWA for use on the National Highway System (NHS). For new hardware, these safety standards consist of the guidelines and procedures published in MASH 2016 [7]. According to TL- 3 of MASH 20016, transitions must be subjected to two full-scale vehicle crash tests, as summarized in Table 2. Note that there is no difference between MASH 2009 and MASH 2016 evaluation criteria for this system. Table 2. MASH 2016 TL-3 Crash Test Conditions for Transitions Test Article Transitions Test Designation No. Test Vehicle C P 1 Evaluation criteria explained in Table 3. Vehicle Weight lb (kg) 2,425 (1,100) 5,000 (2,268) Impact Conditions Speed mph (km/h) 62 (100) 62 (100) Angle deg. Evaluation Criteria 1 25 A,D,F,H,I 25 A,D,F,H,I 4.2 Evaluation Criteria Evaluation criteria for full-scale vehicle crash testing are based on three appraisal areas: (1) structural adequacy; (2) occupant risk; and (3) vehicle trajectory after collision. Criteria for structural adequacy are intended to evaluate the ability of the transition to contain and redirect impacting vehicles. In addition, controlled lateral deflection of the test article is acceptable. Occupant risk evaluates the degree of hazard to occupants in the impacting vehicle. Post-impact vehicle trajectory is a measure of the potential of the vehicle to result in a secondary collision with other vehicles and/or fixed objects, thereby increasing the risk of injury to the occupants of the impacting vehicle and/or other vehicles. These evaluation criteria are summarized in Table 3 and defined in greater detail in MASH In lieu of conducting full-scale crash tests to evaluate the initial design concepts, a computer simulation effort was conducted and the results were evaluated according to MASH 2016 test designation nos and 3-21 evaluation criteria. 16
26 Table 3. MASH 2016 Evaluation Criteria for Transitions Structural Adequacy Occupant Risk A. Test article should contain and redirect the vehicle or bring the vehicle to a controlled stop; the vehicle should not penetrate, underride, or override the installation although controlled lateral deflection of the test article is acceptable. D. Detached elements, fragments or other debris from the test article should not penetrate or show potential for penetrating the occupant compartment, or present an undue hazard to other traffic, pedestrians, or personnel in a work zone. Deformations of, or intrusions into, the occupant compartment should not exceed limits set forth in Section and Appendix E of MASH F. The vehicle should remain upright during and after collision. The maximum roll and pitch angles are not to exceed 75 degrees. H. Occupant Impact Velocity (OIV) (see Appendix A, Section A5.2.2 of MASH 2016 for calculation procedure) should satisfy the following limits: Occupant Impact Velocity Limits Component Preferred Maximum 30 ft/s 40 ft/s Longitudinal and Lateral (9.1 m/s) (12.2 m/s) I. The Occupant Ridedown Acceleration (ORA) (see Appendix A, Section A5.2.2 of MASH 2016 for calculation procedure) should satisfy the following limits: Occupant Ridedown Acceleration Limits Component Preferred Maximum Longitudinal and Lateral 15.0 g s g s 17
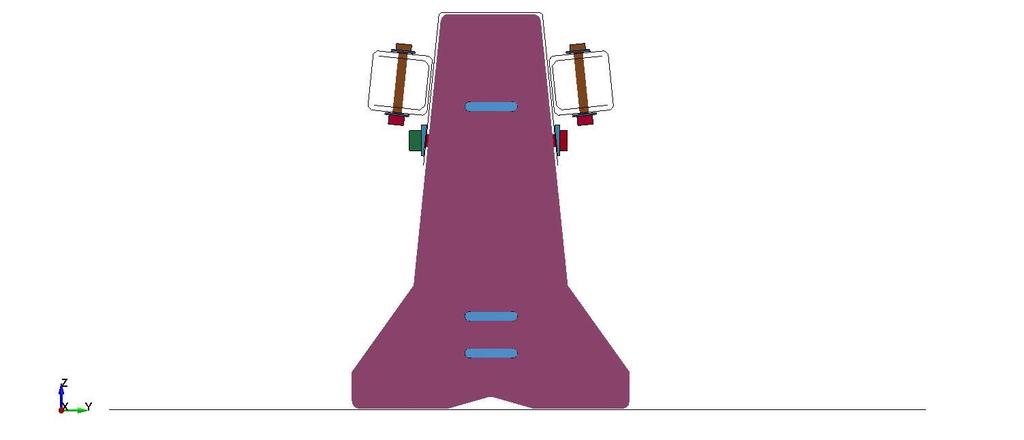
27 5 LS-DYNA MODEL 5.1 PCB Model The LS-DYNA computer simulation model of the F-shape temporary concrete barrier was based on a model developed previously at MwRSF for determining the deflection of tied-down, F-shape barrier systems [11, 20]. The model consisted of the F-shape barrier, the end connection loops, and the connection pins, as shown in Figure 12. The main body of the F-shape barrier model was created using shell elements with a rigid material definition. The rigid material definition allowed the proper mass and rotational inertias to be defined for the barrier even though it was essentially hollow. The barrier segments were assigned a mass of 4,976 lb (2,257 kg) based on measurements taken from actual barrier segments. The rotational inertias were determined based on SolidWorks models of the PCB segment. The SolidWorks models used tended to overestimate the mass and rotational inertia of the PCB segment as the solid model included the mass of the concrete body and the reinforcing steel, but did not account for the volume of concrete lost due to the reinforcing steel. Thus, the rotational inertias determined by the software were scaled down based on the ratio of the actual measured mass of the barrier segment to the software-estimated mass of the segment. The use of the shell elements improved the overall contact of the barrier and the vehicle. In addition, the use of shell elements made it easier to fillet the corners and edges of the barrier. By rounding off the barrier edges, the edge contacts and penetrations were reduced, thus further improving the contact interface. The loops in the barrier model were also modified to match the current configuration, which consisted of two sets of three rebar loops. The connection loops were modeled with a rigid material as previous testing of the barrier in various configurations showed little to no deformation of the connection loops. The connection pin was modeled with the MAT_PIECEWISE_LINEAR_PLASTICITY material in LS-DYNA with the appropriate properties for ASTM A36 steel. The barrier system model incorporated a total of sixteen barrier segments for a total barrier length of 200 ft (61.0 m). The simulated F-shape barrier model was impacted under the MASH 2016 TL-3 impact conditions for test designation no It was then compared to actual tests on free-standing, F- shape barriers (test no. 2214TB-2) to ensure that it provided reasonable estimates of the barrier deflection prior to implementing deflection-limiting concepts. Details of the comparison can be found in Bielenberg et al. [5]. Sequential photographs of the baseline simulation for test no. RDTCB-2 are shown in Figure Reduced-Deflection Steel Components Model The PCB model geometry was modified to add holes for the reduced-deflection steel component connections [5]. A simulation model of test no. RDTCB-1, as shown in Figure 14, was constructed to serve as a baseline for comparison of proposed design modifications for further reducing the deflections of the PCB system. The steel cap across the barrier joint and the steel tubes on the side of the barrier were added using shell elements. MAT_24_PIECEWISE_LINEAR_PLASTICITY was used to define the steel material properties for these components. The tubes were welded to the cap using constrained nodal rigid bodies to create a simplified weld. The connection hardware, including the bolts, nuts, and splice 18

 model developed at the National Crash Analysis Center (NCAC). The vehicle impacted the system 4.3 ft (1.")
28 plates were modeled explicitly in the model. Bolt preload was achieved using the INITIAL_STRESS_SECTION command in LS-DYNA. The baseline model was simulated for a 2270P vehicle impacting the system with the same impact conditions as test no. RDTCB-1. Thus, the Chevy Silverado model impacted the barrier system at a speed of 63.6 mph (102.4 km/h) and an angle of 24.9 degrees. The vehicle model used for the simulation was the Chevy Silverado Version 3 (v3) model developed at the National Crash Analysis Center (NCAC). The vehicle impacted the system 4.3 ft (1.3 m) upstream from the center of the joint between the eighth and ninth barrier segments. Comparison of the simulation results with full-scale crash test no. RDTCB-1 found that the model provided good correlation with the full-scale test and was appropriate for use in evaluation of the deflection-limiting mechanisms. Details of the comparison can be found in Bielenberg et al. [5]. Figure 12. F-shape PCB Barrier Model 19


29 0.000 sec sec sec sec sec sec sec sec sec sec sec sec Figure 13. Sequential Photographs: Simulation of Test No. 2214TB-2 20
30 The additional attachment points that were utilized in test no. RDPCB-2 were incorporated into the model with 3 /8-in. (10-mm) thick and 12-in. (305-mm) long steel brackets that were welded on the top and bottom of the steel tubes on each side of the splice at the center of the length of the PCB segment. These angles were bolted through the barrier, similar to the other bolted connections in the model, as shown in Figure 15. Initial simulations of test no. RDTCB-2 demonstrated significantly lower deflections than the full-scale test. The discrepancy between the physical test and the model was attributed largely to the concrete damage and fracture observed in the test which was not reproduced in the rigid PCB model as it could not fracture. As a compromise, the simulation model of test no. RDTCB-2 was modified to reduce the barrier-to-ground friction coefficient of 0.4 to 0.24 to reproduce the dynamic barrier deflections observed in the full-scale test. The results from this model estimated a dynamic lateral barrier deflection of 41.1 in. (1,044 mm). This value correlated very well with the 39.5 in. (1,003 mm) permanent set deflection and 40.7 in. (1,034 mm) dynamic lateral barrier deflection from test no. RDTCB-2. Complete details of the simulations can be found in Bielenberg et al. [5]. 5.3 Baseline model The previously-developed model of the low-deflection, PCB system was further calibrated by modeling an impact with the Chevrolet Silverado Version 2 (v2) pickup truck originally developed by NCAC [21]. The Silverado v2 has a softer tire and no steering defined, whereas the Silverado v3 has a harder tire with steering defined. The barrier geometry and parameters remained the same as in the previous model. A summary of the results from numerical simulation and test no. RDTCB-2 is shown in Table 4. Sequential photographs of the baseline simulation for test no. RDTCB-2 are shown in Figure 16. Table 4. Comparison of Reduced-Deflection PCB System Test and Simulation Evaluation Parameters Test No. RDTCB-2 Simulation Max. Dynamic Deflection in. (mm) 40.7 (1,034) 39.7 (1,008) Max. Roll Angle (deg.) Max. Pitch Angle (deg.) Max. Yaw Angle (deg.) Long. ORA (g s) Lateral ORA (g s) Long. OIV ft/s (m/s) 12.5 (3.8) 16.4 (5.0) Lateral OIV ft/s (m/s) 21.3 (6.5) 19.7 (6.0) 21


31 Figure 14. Test No. RDTCB-1 Model 22


32 Comparison of the simulation results with full-scale crash test no. RDTCB-2 found that the model provided good correlation with the full-scale test and was appropriate for use in evaluation of the transition. As shown in Table 4, LS-DYNA simulation tended to predict slightly larger lateral and longitudinal ORAs as compared to the crash testing results, which may be due to lack of failure in the wheel, tire, and suspension model assembly. In addition, as noted previously, the coefficient of friction between the barriers and ground was decreased from 0.4 to 0.24 to accurately model deflections, which were inaccurate due to the lack of concrete material failure in the model. Since the impacts in the transition region would be upstream from the reduced-deflection PCB system, a coefficient of friction of 0.40 was utilized, which was previously used to accurately model freestanding PCB deflections. However, it was noted that the deflections in the model just upstream from the reduced-deflection PCB system may be lower than what would actually occur. This discrepancy was considered throughout the analysis. Figure 15. Test No. RDTCB-2 Final Barrier Model 23


33 0.000 sec sec sec sec sec sec sec sec sec sec sec sec Figure 16. Sequential Photographs: Baseline Simulation of Test No. RDTCB-2 24

 length.")
34 6.1 Sloped Tubes Model 6 SIMULATIONS WITH SLOPED TUBES As previously discussed, the end section of the HSS 5x5x 3 /16 continuous tubes running along the sides of the reduced-deflection PCB segments could pose vehicle snag risk. Thus, the tubes along the reduced-deflection PCB segments were tapered down to the PCB surface upstream from the joint between the free-standing and reduced-deflection PCB systems at a 1:6 lateral-tolongitudinal rate over a 30-in. (762-mm) length. Computer simulations of the barrier with only the tapered tubes and no transition in the barrier stiffness were evaluated to the MASH 2016 safety performance criteria. The tapered tube model is shown in Figure 17. Figure 17. Simulated Tubes Tapered Along Reduced-Deflection PCB Segments Surface 6.2 Simulation of Sloped Tube Model with Different Impact Points Several impact points upstream from the joint between the reduced-deflection PCB system and the free-standing PCB (Joint no. 1), as shown in Figure 18 and Table 5, were simulated using the 2270P Silverado model. Initially the impact points were picked every 39.4 in. (1,000 mm), while more impact points with a 7.8-in. (200-mm) increment were selected in the critical regions. The simulation results are summarized in Table 5. The simulations ended early with impact points 25
35 194.1 and in. (4,930 and 5,130 mm) upstream from the transition joint due to numerical instability errors and low occupant risk values. With no transition in the barrier stiffness, several impact points including in., in., in., in., in., and in. (4,530 mm, 4,930 mm, 5,130 mm, 5,730 mm, 6930 mm, and 8,930 mm) upstream from the transition joint had a predominant knee-shape that formed in the system and contacted the impact-side door, as shown in Figure 19. For example, the simulated vehicle damage due to the vehicle snag on the knee for the case with a in. (5,730 mm) impact point is shown in Figure 20. Sequential photographs for the simulations with the knee hitting the vehicle s side-door are shown in Figure 21. This knee contact did not appear to be critically detrimental to the vehicle or the barrier performance in the simulations. However, the impact of the knee into the vehicle s door has been shown to increase vehicle instability in previous PCB tests. In test no. NELON-2, which was a modified MASH 2009 test designation no on the end of the length-of-need of a 100-ft (30.5-m) long PCB installation, the vehicle had a roll angle in excess of 75 degrees and failed to meet MASH 2009 safety criteria [22]. A knee formed in the system, which extended forward laterally from the original barrier line and impacted the vehicle s door. The knee contact accentuated vehicle roll and likely contributed to the excessive roll angle. This excessive roll was not captured in computer simulations of the system. Since the same barrier model was used in this research project, attention was paid to the indications of knee formation and vehicle s door impact. Other safety measures, including occupant risk values, barrier deflection, vehicle roll and pitch angles, and vehicle climb did not appear critical. As noted previously, LS-DYNA tends to predict larger lateral and longitudinal ORAs as compared to the crash testing results, likely due to lack of failure in the wheel, tire, and suspension model assembly. Therefore, the lateral ORAs that were larger than the MASH 2016 limit (20.49 g s) (including impact points 115.4, 123.2, 131.1, 139.0, in. (2,930, 3,130, 3,330, 3,530, and 5,530 mm) upstream from the transition joint) would likely be below the MASH 2016 limit in an actual crash test. In the simulations with impact points just upstream from Joint no. 1, the truck model s fender and door contacted the tapered tube and caused vehicle damage. The tapered tube was fixed to the PCB model and could not separate from the barrier. However, the actual connection may have some flexibility and allow the truck fender to get between the tapered tubes and PCB face. Thus, there was potential for vehicle snag on tapered box tube ends along the reduced-deflection PCB when impacted at the points upstream from transition joint. Joint #1 Figure 18. Simulated Tubes Tapered Along Reduced-Deflection PCB Segments Surface 26
36 27 August 8, 2017 Table 5. Summary of Simulation Results Only Tapered Tubes, No Transition in Stiffness Simulation No. Impact Point in. (mm) US or DS Joint No. 1 Lat. OIV ft/s (m/s) Long. OIV ft/s (m/s) Lat. ORA g s Long. ORA g s Roll deg. Pitch deg. Lateral Barrier Deflection in. (mm) Increase in Vertical Bumper Height in. (mm) (630) downstream (-5.6) (-5.9) (1,549) 1.4 (36) (930) upstream (-6.0) -21 (-6.4) (1,643) 5.6 (142) (1,930) upstream (-5.7) (-4.6) (1,552) 6.9 (175) (2,930) upstream (-6.1) (-4.0) (1,361) 9.3 (236) (3,130) upstream (-6.1) (-4.2) (1,331) 10.3 (262) (3,330) upstream (-6.2) (-4.3) (1,483) 10.1 (257) (3,530) upstream (-6.2) (-4.4) (1,511) 10.3 (262) (3,730) upstream (-6.1) (-4.3) (1,524) 9.4 (239) (3,930) upstream (-5.9) (-5.0) (1,534) 24.6 (625) (4,130) upstream (-5.7) (-5.0) (1,593) 25.3 (643) (4,330) upstream (-5.7) (-5.0) (1,631) 19.4 (493) (4,530) upstream (-5.5) (-4.8) (1,148) 11.9 (302) (4,730) upstream (-5.6) (-5.0) (1,580) 17.8 (452) 14* (4,930) upstream (-5.9) (-4.9) (919) 11.3 (287) 15* (5,130) upstream (-5.2) (-4.5) (935) 9.2 (234) (5,530) upstream (-5.0) (-4.2) (1,595) 5.3 (135) (5,730) upstream (-5.1) (-3.1) (1,659) 6.1 (155) (5,930) upstream (-5.7) (-3.6) (1,656) 7.3 (185) (6,930) upstream (-6.0) (-4.2) (1,768) 9.6 (244) (7,930) upstream (-5.9) (-5.2) (2,035) 25.8 (655) (8,930) upstream (-5.3) (-4.6) (1,882) 7.9 (201) * Simulation terminated early due to numerical instabilities

 Upstream from Transition")

37 Figure 19. Simulated Vehicle Snag on Knee in Transition Region Impact Point in. (5,730 mm) Upstream from Transition Joint Figure 20. Simulated Vehicle Damage Caused by Knee Impact Point in. (5,730 mm) Upstream from Transition Joint 28


 Upstream")
 and Impact")
 Upstream")
38 0.000 sec sec sec sec sec sec sec sec sec sec sec sec Figure 21. Sequential Photographs: Impact Point at in. (5,730 mm) Upstream from Transition Joint (Left) and Impact Point at in. (8,930 mm) Upstream from Transition Joint (Right) 29
39 7 SIMULATION OF PROPOSED TRANSITION DESIGN MODIFICATIONS For simulated impacts on the free-standing PCB adjacent to the reduced-deflection PCB, it was noted that a knee formed in the system, which contacted the vehicle s door and could increase the potential for vehicle instability. In order to mitigate this concern and provide a smooth and safe transition in barrier stiffness, several design modifications were considered, as discussed in Chapter 3. The concept of reducing joint tolerance by adding a steel tube spacer was preferred as it was a simple option for resolving the safety concerns in the transition area, as shown in Figure 11. Thus, an investigation was conducted using LS-DYNA computer simulation [20] to evaluate the effects of adding steel tubes at the joints on the transition performance during an impact. Joint spacers with various configurations, stiffnesses, and strengths were added to an LS-DYNA model of a free-standing PCB system connected to a reduced-deflection PCB in order to evaluate impact performance. The design modifications were evaluated based on safety performance, ease of installation, and minimizing the length of the transition and additional hardware components. LS-DYNA simulations were performed to evaluate the selected design concepts according to MASH 2016 safety performance criteria. 7.1 Evaluation Criteria In addition to MASH 2016 safety performance criteria, including vehicle stability (roll and pitch) and occupant risk measures, other concerns including vehicle snag (knee hitting door), vehicle climbing, and barrier deflection were also considered. Thus, these criteria were evaluated in each simulation. Euler angles, including roll, pitch, and yaw angles, were used to evaluate vehicle stability. Roll and pitch angles should not exceed 75 degrees according to MASH 2016 [7]. Occupant risk measures, which evaluate the degree of hazard to the occupants in the impacting vehicle, included the longitudinal and lateral OIV as well as longitudinal and lateral ORA. According to MASH 2016, longitudinal and lateral OIV should fall below the maximum allowable value of 40.0 ft/s (12.2 m/s). MASH 2016 also states that longitudinal and lateral ORAs should fall below the maximum allowable value of g s [7]. The vehicle bumper climb, which can be an indicator of vehicle instability, was also examined. In addition, the barrier dynamic deflection was measured in each simulation. System and vehicle damage were also considered. In order to identify the concern of knee hitting the vehicle door, the forward deflection of barrier segments was measured and the PCB and door contact was closely monitored. 7.2 Tube Spacer Added at Joint No. 1 Initially, an 18-in. (457-mm) long HSS 3½x3½x¼ steel tube spacer was modeled and added at the base of Joint no. 1 (i.e., the transition joint between the reduced-deflection PCB and the free-standing PCB) in order to add a transition in the barrier stiffness, as shown in Figure 22. The nominal PCB gap distance was 4 in. ±0.5 in. (102 mm ±13 mm). Thus, an HSS 3½x3½x¼ would properly fit in the gap. In order to pass the connection pin through the tube, a 2-in. (51-mm) diameter hole was created on the top surface of the tube, as shown in Figure 23. In addition, the tube was raised ½ in. (13 mm) in the simulations in order to account for the rounded edges on the PCB model, which were necessary to prevent numerical instabilities. When the tube was on the 30


 did not significantly affect the simulation results. Joint No. 1 HSS 3½ x 3½ x ¼ Figure 22.")
40 ground, the rounded edges on the PCB model caused the tube to crush asymmetrically, as shown in Figure 24a. In reality, the concrete segments do not have rounded edges and the tube would crush symmetrically, as shown in Figure 24b. Thus, raising the tube ½ in. (13 mm) would allow the tube to crush similarly to an actual test. A comparison between the simulation results with the tube spacer on the ground and the tube spacer raised is shown in Table 6. As shown in Table 6, raising the tube ½ in. (13 mm) did not significantly affect the simulation results. Joint No. 1 HSS 3½ x 3½ x ¼ Figure 22. Transition with Single Steel Tube at Joint No. 1 Figure 23. Steel Tube Model HSS 3½x3½x¼ 31
 -17.4 (-5.3) -17.4 (-5.3) Long.")
 74.7 (1,897) 75.5 (1,918) Increase in Vertical Bumper Height in. (mm) 6.")
 Tube on Ground, (b) Tube Raised ½ in.")

41 Table 6. Summary of Simulation Results Tube on Ground and Raised Tube Simulation No. Case with Tube on Ground Case with Raised Tube Lat. OIV ft/s (m/s) (-5.3) (-5.3) Long. OIV ft/s (m/s) (-3.2) (-3.2) Lat. ORA g s Long. ORA g s Roll deg. Pitch deg Lat. Barrier Deflection in. (mm) 74.7 (1,897) 75.5 (1,918) Increase in Vertical Bumper Height in. (mm) 6.9 (175) 6.3 (160) (a) (b) Figure 24. Crushed Steel Tube at Joint No. 1 After Impact: (a) Tube on Ground, (b) Tube Raised ½ in. A number of simulations were conducted using the 2270P pickup truck impacting the system with one tube at Joint no. 1 (i.e., the transition joint between the reduced-deflection PCB and the free-standing PCB) with different impact points, as shown in Figure 25. The simulation results with one steel tube at the base of Joint no. 1 and with no tube spacer are shown in Table 7. 32
42 33 August 8, 2017 Table 7. Summary of Simulation Results One Steel Tube at Base of Joint No. 1 Impact Point in. (mm) Upstream Joint No (4,930) (5,130) (5,330) (5,530) (5,730) Tube Location Lat. OIV ft/s (m/s) Long. OIV ft/s (m/s) Lat. ORA g s Long. ORA g s Roll deg. Pitch deg. Lateral Barrier Deflection in. (mm) Increase in Vertical Bumper Height in. (mm) Joint No (-5.4) (-4.9) (1,633) 12.2 (310) None * (-5.4) (-4.9) (935) 11.3 (287) Joint No (-5.2) (-4.6) (1,572) 6.7 (170) None * (-5.2) (-4.5) (919) 9.2 (234) Joint No (-4.9) (-4.9) (1,674) 7.8 (198) None (-4.9) (-4.9) (1,621) 7.0 (178) Joint No (-4.9) (-4.1) (1,664) 5.7 (145) None (-4.9) (-4.2) (1,595) 5.3 (135) Joint No (-5.3) (-3.2) (1,628) 6.2 (157) None (-5.1) -9.8 (-3.0) (1,659) 6.1 (155) (7,930) Joint No (-5.9) (-5.1) (2,012) 24.9 (632) None (-5.9) (-5.2) (2,035) 25.8 (655) Joint No (-5.3) (-4.7) (1,951) 8.3 (211) (8,930) None (-5.3) (-4.6) (1,882) 7.9 (201) * Simulation terminated early due to numerical instabilities Figure 25. Simulated Cases with One Tube at Joint No. 1 Impact Points

43 Adding a single tube at the base of Joint no. 1 improved the transition behavior slightly in terms of knee formation and contact with the vehicle s side. However, this concern was not completely resolved. In a number of cases, including the impact points 202.0, 217.7, and in. (5,130, 5,530, and 5,730 mm) upstream from the transition joint, the knee formed and hit the vehicle door. The knee contact on the vehicle door and propensity for instability with the impact point at in. (5,730 mm) upstream from the transition joint is shown in Figure 26. Additional sequential photographs of this simulation are shown in Figure 27. In the cases with one tube spacer, the occupant risk values and the roll and pitch angles did not change significantly. In most of the cases with one tube, a slight increase in barrier deflection of approximately 2 in. (51 mm) was observed. In these simulations, the steel tube joint spacer was completely crushed. This behavior itself was not of concern. Stiffer tubes may help prevent the knee from forming and providing smoother redirection. Figure 26. Knee Contact on Vehicle Door Impact Point in. (5,730 mm) Upstream from Transition Joint 34


44 0.000 sec sec sec sec sec sec sec sec sec sec sec sec Figure 27. Sequential Photographs: Impact Point at in. (5,730 mm) Upstream from Transition Joint with One Steel Tube 35
45 7.3 Tube Spacers Added at Joints Nos. 1 and 2 After it was determined that adding a single HSS 3½x3½x¼ tube at one joint (Joint no. 1) improved the vehicle and barrier performance, another tube (HSS 3½x3½x¼) was added at the base of the next joint upstream from the previous joint with a tube spacer. Thus, a total of two joints had a tube spacer, as shown in Figure 28. A number of simulations were conducted with the 2270P pickup truck model impacting the system with one tube at Joint nos. 1 and 2 at different impact points. A summary of simulation results with one steel tube at the base of Joint nos. 1 and 2 and one steel tube at the base of Joint no. 1 is shown in Table 8. Joint No. 2 Joint No. 1 Figure 28. Single Steel Tube Added at Joint Nos. 1 and 2 The simulations with tubes at two joints had lateral ORA values 10 to 20 percent less than the simulations with a tube at one joint. Adding tubes at two joints created a smoother redirection as more barrier segments were engaged throughout the impact. In most of the simulations, including impact points at 224.4, 217.7, 312.2, and in. (5,700, 5,530, 5,730, 7,930, and 8,930 mm) upstream from the transition joint, the roll angle decreased with tubes at two joints. The vehicle snag and knee hitting the vehicle s door were less pronounced in the simulations with one tube at two joints as compared to one tube at one joint. An example comparison of simulations with a tube at one joint and a tube at two joints is shown in Figure 30. The deflection of the system increased approximately 10 in. (254 mm), but it was still in desired deflection range. In the simulations with tubes at two joints, the crushing of tubes was moderate. Utilizing stiffer tubes at two joints would further decrease the potential for vehicle snag, decrease ORAs, provide smoother vehicle redirection, and mitigate knee and door contact concerns. Thus, various alternatives, including utilizing thicker tubes (HSS 3½x3½x⅜ tubes), utilizing two tubes with different sizes (HSS 3½x3½x¼ tube with HSS 2½x2½x¼ tube inside), and utilizing a stack of two tubes (HSS 3½x1½x¼ tube at the base and HSS 3½x1½x¼ tube on top) at Joint nos. 1 and 2 were investigated through simulations, as described in the following sections. The simulations included a 2270P vehicle model impacting the concrete barriers in. (5,730 mm) upstream from the transition joint to evaluate and compare the effectiveness of different stiffer tubes configurations with the same impact conditions and impact location. 36
46 37 August 8, 2017 Table 8. Summary of Simulation Results Single Steel Tube at Base of Joint Nos. 1 and 2 Impact Point in. (mm) Upstream Joint No (4,930) (5,130) (5,330) (5,530) (5,730) (7,930) (8,930) Tube Location Lat. OIV ft/s (m/s) Long. OIV ft/s (m/s) Lat. ORA g s Long. ORA g s Roll deg. Pitch deg. Lateral Barrier Deflection in. (mm) Increase in Vertical Bumper Height in. (mm) Joint No (-5.4) (-4.9) (1,633) 12.2 (310) Joint Nos. 1 and (-5.6) (-4.9) (1,897) 10.8 (274) Joint No (-5.2) (-4.6) (1,572) 6.7 (170) Joint Nos. 1 and (-5.3) (-4.3) (1,880) 9.4 (239) Joint No (-4.9) (-4.9) (1,674) 7.8 (198) Joint Nos. 1 and (-5.0) (-4.3) (1,920) 5.4 (137) Joint No (-4.9) (-4.1) (1,664) 5.7 (145) Joint Nos. 1 and (-5.0) (-4.0) (1,966) 6.3 (160) Joint No (-5.3) (-3.2) (1,628) 6.2 (157) Joint Nos. 1 and (-5.4) (-3.2) (1,918) 6.3 (160) Joint No (-5.9) (-5.1) (2,011) 24.9 (632) Joint Nos. 1 and (-5.8) (-5.1) (2,111) 25.4 (645) Joint No (-5.3) (-4.7) (1,951) 8.3 (211) Joint Nos. 1 and (-5.1) (-4.8) (1,511) 11.3 (287) Figure 29. Simulated Cases with Tube at Joints Nos. 1 and 2 Impact Points
47 Forward Deflection of PCB Segment (Green One): 70 mm Forward Deflection of PCB Segment (Green One): 50 mm Figure 30. (a) Tube Added at Joint No. 1, (b) Tube Added at Joint Nos. 1 and 2 Impact Point in. (8,930 mm) Upstream from Transition Joint Single Tubes with Increased Thickness The simplest alternative to stiffen the tube spacer was to increase the tube thickness. Computer simulations were performed with ⅜-in. (10-mm) thick steel tubes at joint nos. 1 and 2. The transition performance was significantly improved. In most of the simulations with different impact points, the concern of knee contact with the door was resolved. As shown in Figure 31 and by comparing the cases with an impact point in. (5,730 mm) upstream from the transition joint, one HSS 3½x3½x⅜ tube at two joints indicated less knee contact with the door as compared to the one HSS 3½x3½x¼ tube at two joints. A comparison between these simulations with ¼-in. and ⅜-in. (6-mm and 10-mm) thick tubes with an impact point of in. (5,730 mm) upstream from the transition joint is shown in Table 9. The occupant risk values, roll and pitch angles, and vehicle bumper climb slightly increased with the ⅜-in. (10-mm) thick tube. However, these values were still within the acceptable MASH 2016 limits. The dynamic deflection of the system decreased from 75.5 in. (1,918 mm) with ¼-in. (6-mm) thick tubes to 56.1 in. (1,425 mm) with ⅜- in. (10 mm) thick tubes. The tubes were partially crushed. 38
: 30 mm (a) Dynamic Deflection: 56.1 in.")
 HSS 3½x3½x¼ Tube Added at Joint Nos. 1 and 2, (b) HSS 3½x3½x⅜ Tube Added at Joint Nos.")
48 Dynamic Deflection: 75.5 in. Forward Deflection of PCB Segment (Yellow One): 30 mm (a) Dynamic Deflection: 56.1 in. Forward Deflection of PCB Segment (Yellow One): 20 mm (b) Figure 31. (a) HSS 3½x3½x¼ Tube Added at Joint Nos. 1 and 2, (b) HSS 3½x3½x⅜ Tube Added at Joint Nos. 1 and 2 Impact Point in. (5,730 mm) Upstream from Transition Joint Figure 32. Single Tube HSS 3½x3½x⅜ Added at Joint Nos. 1 and 2 After Impact 39


49 7.3.2 Simulations of Dual Tubes Another stiffened transition design utilized an HSS 3½x3½x¼ tube with an HSS 2½x2½x¼ tube inside, as shown in Figure 33. The other dual tube alternative with an HSS 3½x1½x¼ tube at the base and another HSS 3½x1½x¼ tube on top was also evaluated through simulations, as shown in Figure 34. A comparison between the cases with single and dual tubes with an impact point of in. (5,730 mm) upstream from the transition joint is shown in Table 9. Both dual tube alternatives indicated an improved performance in terms of knee and door contact as compared to a single HSS 3½x3½x¼ tube. As shown in Figure 35, the knee was much less prominent than observed for the single HSS 3½x3½x¼ tube simulation. The occupant risk values, roll and pitch angles, and vehicle bumper climbing were similar to the single ⅜-in. thick tube option and were within the acceptable MASH 2016 limits. The dynamic deflection of the system decreased from 75.5 in. (1,918 mm) with ¼-in. (6-mm) thick tubes to 60 in. (1,524 mm) and 58.8 in. (1,494 mm) with concentric dual tubes and stack of two tubes at Joint nos. 1 and 2, respectively. The dual tubes were also partially crushed. Figure 33. Dual Tubes HSS 3½x3½x¼ Tube with HSS 2½x2½x¼ Tube Inside Added at Joint Nos. 1 and 2 40


50 Figure 34. Dual Tubes Stack of Two HSS 3½x1½x ¼ Tubes Added at Joint Nos. 1 and 2 41
: 25 mm (b) Dynamic Deflection: 58.8 in.")
 HSS 3½x3½x¼ Tube Added, (b) HSS 3½x3½x¼ Tube with HSS 2½x2½x¼ Tube Inside, and (c) Stack of Two")
51 Dynamic Deflection: 75.5 in. Forward Deflection of PCB Segment (Yellow One): 30 mm (a) Dynamic Deflection: 60 in. Forward Deflection of PCB Segment (Yellow One): 25 mm (b) Dynamic Deflection: 58.8 in. Forward Deflection of PCB Segment (Yellow One): 25 mm Figure 35. Modified Transition Design: (a) HSS 3½x3½x¼ Tube Added, (b) HSS 3½x3½x¼ Tube with HSS 2½x2½x¼ Tube Inside, and (c) Stack of Two HSS 3½x1½x¼ Tubes Added at Joint Nos. 1 and 2 Impact Point in. (5,730 mm) Upstream from Transition Joint (c) 42
52 Table 9. Summary of Simulation Results Impact Point in. (5,730 mm) Upstream from Transition Joint Single and Dual Tubes Simulation Single ¼-in. (6-mm) Tube Single ⅜-in. (10-mm) Tube Dual Tubes Concentric Dual Tubes Stacked Lat. OIV ft/s (m/s) (-5.4) (-5.6) (-5.4) (-5.7) Long. OIV ft/s (m/s) (-3.2) (-3.7) (-3.3) (-4.2) Lat. ORA g s Long. ORA g s Roll deg. Pitch deg Lat. Barrier Deflection in. (mm) 75.5 (1,918) 56.1 (1,425) 60.0 (1,524) 58.8 (1,494) Increase in Vertical Bumper Height in. (mm) 6.3 (160) 7.2 (183) 7.1 (180) 7.5 (191) Selected Design Modification All three alternatives indicated a promising improvement in vehicle and barrier performance in terms of decreased potential for vehicle snag, decreased ORAs, smoother vehicle redirection, and mitigation of knee contact. It was recommended to pursue the option of thicker tubes one HSS 3½x3½x⅜ at the two joints upstream from the reduced-deflection system due to its ease of fabrication and installation. Details of this concept design are shown in Figure
53 44 August 8, 2017 Figure 36. Single Tube HSS 3½x3½x⅜ Added at Joint Nos. 1 and 2
54 8 DETERMINATION OF CRITICAL IMPACT POINTS As previously discussed, it was recommended to pursue the option of thicker tubes, one HSS 3½x3½x⅜ at the base of two joints upstream from the reduced deflection system, due to its ease of fabrication and installation. Further simulations were performed to determine the CIPs for full-scale crash testing of the selected design. Computer simulations were performed on the selected design modifications with different impact points upstream from the transition joint, and the results are discussed in the subsequent sections. 8.1 Determination of CIPs Test Designation No In order to identify the CIPs for test designation no upstream from the stiffness transition, pickup truck impacts on the barrier were simulated using a single HSS 3½x3½x⅜ tube at the base of two joints located upstream from the reduced-deflection system. The impact points, ranging from 17.7 in. to in. (450 mm to 20,850 mm) upstream from Joint no. 1, as shown in Figure 37 and Table 10, covered both regions with stiffness changes, one from the reduceddeflection PCB to the transition section and the other from the transition section to the freestanding PCB. A summary of the simulation results with thicker tubes (i.e., ⅜-in. (10-mm) thick tubes) with different impact points is shown in Table 10. Figure 37. Simulated Cases with Tube at Two Joints Nos. 1 and 2 Impact Points MASH 2016 recommends an impact point 4.3 ft (1.3 m) upstream from a joint between PCB segments to investigate the potential for vehicle snag. The dynamic deflection of the system with the impact point of 4.3 ft (1.3 m) upstream from the transition joint was 53 in. (1,346 mm), which ranged between the deflection of the reduced-deflection PCB (40.7 in. (1,034 mm)) and the deflection of the free-standing PCB (79.6 in. (2,022 mm)). The pickup truck fender contacted the box beam and indicated a potential for vehicle snag on the tapered box tube ends along the reduceddeflection PCB at an impact point 4.3 ft (1.3 m) upstream from transition joint, as shown in Figure 38. In the simulations, the tapered tubes were constrained to the PCB segments. Although the boxbeam tube connection to the PCB has not been designed, tubes may flex away from the PCB segments and induce increased potential for vehicle snag under the end of the tapered tubes. Other measures, including occupant risk values, roll and pitch angles, and bumper climb, were acceptable. 45
 Upstream from Transition Joint As shown in Table 10, the impact points farther upstream from the reduced-deflection system, including 352.0 in. (8,940 mm) through 820.9 in.")
) and the free-standing PCB system (79.6 in.")
55 Figure 38. Vehicle Snag on Box Tubes Along Reduced-Deflection PCB Impact Point 4.3 ft (1.3 m) Upstream from Transition Joint As shown in Table 10, the impact points farther upstream from the reduced-deflection system, including in. (8,940 mm) through in. (20,850 mm), had larger deflections and behaved more like the free-standing PCB system. One of the design criteria was to ensure that barrier deflections range between those observed for the reduced-deflection system (40.7 in. (1,034 mm)) and the free-standing PCB system (79.6 in. (2,022 mm)). In the impact points, including in. (12,680 mm) through in. (20,850 mm), barrier deflections exceeded the freestanding PCB deflection (i.e., > 79.6 in. (2,022 mm)). The increased deflections may be due to the proximity of the impact points to the upstream end of barrier model. Since the barrier model ends were not anchored, vehicle impacts close to the upstream barrier end may cause larger deflections. In the simulation of the impact point at in. (20,850 mm) upstream from the transition joint, the vehicle impact was 410 in. (10,405 mm) away from the end of the barrier model. As such, there was a possibility that the short distance between the impact point and the barrier end would affect the results (i.e., PCB deflections and the knee formation). In the simulation of this impact point, three identical concrete segments were added to the barrier model. The results of the longer barrier with impact point at in. (20,850 mm) are provided in Table 10. Based on this numerical study, a minimum of eight barriers would be needed upstream the transition joint. In addition, the impact points farther upstream, including in. (13,000 mm) through in. (20,850 mm), generally had larger roll and pitch angles. Two impact points, in. (15,000 mm) and in. (18,900 mm), indicated relatively high lateral ORAs (22.5 g s). However, as previously noted, LS-DYNA simulation tends to over-predict lateral ORA, as the back of the pickup truck model appears to be stiffer than actual pickup truck test vehicles. Therefore, these ORAs were not a concern. The impact points, including 669.3, 744.1, and in. (17,000, 18,900, and 20,850 mm) upstream from the transition joint, showed potential concern for the PCB knee contacting the vehicle s door. In these impacts, one of the PCB segments upstream from the transition joint deflected forward and hit the vehicle s door. In simulations of these impact points (669.3, 744.1, and in. (17,000, 18,900, and 20,850 mm) upstream from the transition joint), the maximum forward deflection of the PCB segments, that formed the knee and contacted the vehicle, was measured 9, 2, and 7 in. (228, 51, and 180 mm), respectively. In the simulations, the PCB-knee contact was closely examined to determine the most critical cases. The impact point at in. (17,000 mm) upstream from the transition joint had a 46

 upstream from the transition joint.")
56 maximum forward deflection of a PCB segment of 9 in. (228 mm), a maximum roll angle of 18.5 degrees, a dynamic deflection of 83 in. (2,108 mm), and the PCB knee contacted the vehicle s door. Note that knee contact, as shown in Figure 39, did not seem aggressive in the simulations. However, there may be a need to evaluate this impact condition and evaluate the risk of vehicle instability due to the knee contact, based on previous PCB crash testing with a knee forming between adjacent PCBs and the highest roll angle. Thus, a CIP for 2270P vehicle crash testing test under designation no was recommended to be in. (17,000 mm) upstream from the transition joint. Sequential photographs for the simulation with an impact point at 4.3 ft (1.3 m) and in. (17,000 mm) upstream from transition joint are shown in Figures 40 and 41, respectively. Forward Deflection of PCB Segment Figure 39. Knee Contact Impact Point in. (17,000 mm) Upstream from Transition Joint 47
57 48 August 8, 2017 Table 10. Summary of Simulation Results HSS 3½x3½x⅜ Single Tube at Joints Nos. 1 and 2 Simulation No. Impact Point in. (mm) Upstream Joint No.1 Lat. OIV ft/s (m/s) * Simulation terminated early due to numerical instability Long. OIV ft/s (m/s) Lat. ORA g s Long. ORA g s Roll deg. Pitch deg. Lat. Barrier Deflection in. (mm) Increase in Vertical Bumper Height in. (mm) (450) (-6.2) 22.0 (-6.7) (1,544) 3.5 (89) (850) (-6.4) 21.7 (-6.6) (1,633) 6.6 (168) (930) (-6.4) 21.0 (-6.4) (1,532) 6.2 (157) (1,300) (-6) 14.4 (-4.4) (1,346) 7.6 (193) (3,250) (-6.2) 13.8 (-4.2) (1,130) 9 (229) (4,950) -18 (-5.5) 16.4 (-5) (1,687) 9.2 (234) (5,150) (-5.2) 16.1 (-4.9) (1,427) 7.3 (185) (5,210) (-5.3) 13.1 (-4) (1,509) 5.7 (145) (5,520) (-5.3) 13.8 (-4.2) (1,430) 6.9 (175) (5,730) (-5.6) 12.1 (-3.7) (1,425) 7.2 (183) (5,930) (-5.6) 12.5 (-3.8) (1,407) 7.5 (191) (6,930) (-5.8) 13.8 (-4.2) (1,676) 9.6 (244) (7,160) (-6.1) 14.1 (-4.3) (1,775) 10.4 (264) (7,800) (-5.8) 16.4 (-5.0) (1,897) 23 (584) (8,940) (-5.6) 15.1 (-4.6) (2,032) 6.5 (165) (9,120) (-4.8) 15.1 (-4.6) (2,045) 5.8 (147) (10,930) (-5.9) 14.1 (-4.3) (1,669) 9.8 (249) (11,075) (-6.2) 14.1 (-4.3) (2,019) 10.4 (264) (12,680) (-5.3) 17.4 (-5.3) (2,103) 15.6 (396) (13,000)* (-4.9) 14.4 (-4.4) (1,471) 9 (229) (15,000) (-5.9) 13.8 (-4.2) (2,134) 10.6 (269) (17,000) (-5.0) 15.1 (-4.6) (2,108) 6.7 (170) (18,900) (-6) 13.8 (-4.2) (2,283) 10.9 (277) (20,850) (-5.6) 15.7 (-4.8) (2,065) 8.7 (221)


 Upstream from Transition Joint 2270P")
58 0.000 sec sec sec sec sec sec sec sec sec sec sec sec Figure 40. Sequential Photographs: Impact at MASH 2016-Recommended CIP 4.3 ft (1.3 m) Upstream from Transition Joint 2270P Vehicle 49


59 0.000 sec sec sec sec sec sec sec sec sec sec sec sec Figure 41. Sequential Photographs: Impact at MASH 2016-Recommended CIP in. (17,000 mm) Upstream from Transition Joint 2270P Vehicle 50
60 8.2 Determination of CIP Test Designation No The numerical analysis primarily focused on the 2270P vehicle due to its higher potential for vehicle snag, climbing, and instability. However, 1100C vehicle impacts on the transition were also evaluated. Simulations were performed using single steel tubes at Joint nos. 1 and 2 with both ¼ in. (6 mm) and ⅜ in. (10 mm) thicknesses. For test no. 3-20, MASH 2016 recommends a CIP 3.6 ft (1.1 m) upstream from a joint between adjacent barrier segments. This CIP would evaluate the potential for the small car to snag on the tapered HSS 5x5 tube ends along the reduceddeflection system. Other impact points were not critical, since the knee contact with the vehicle s door would not be a concern as the PCB deflection in the small car impacts is much lower than the pickup truck, and the small car instability due to knee contact seems unlikely. In addition, other safety concerns, including occupant risk values, barrier deflection, and bumper climb, were not believed to be more critical with other impact points. Thus, the 1100C vehicle impacting at 3.6 ft (1.1 m) upstream from the transition joint and tapered tubes was simulated. The simulation used a Toyota Yaris model developed by NCAC [21] and modified by MwRSF. A summary of the simulation results for 1100C vehicle impacts with one tube (¼-in. (6-mm) and ⅜-in. (10-mm) thick tube) at the base of Joint nos. 1 and 2 is provided in Table 11. Sequential photographs for the simulation with the Yaris vehicle model are shown in Figure 42. Table 11. Summary of Simulation Results Thick Single Tube and Dual Tubes Simulation No. ¼-in. (6-mm) Thick Steel Tubes 3 / 8-in. (10-mm) Thick Steel Tubes Lat. OIV ft/s (m/s) 0.7 (0.2) 9.2 (2.8) Long. OIV ft/s (m/s) 17.1 (5.2) 18 (5.5) Lat. ORA g s Long. ORA g s Roll deg. Pitch deg Lat. Barrier Deflection in. (mm) 38.2 (970) 32.8 (833) Increase in Vertical Bumper Height in. (mm) 11.9 (302) 11.6 (295) 51


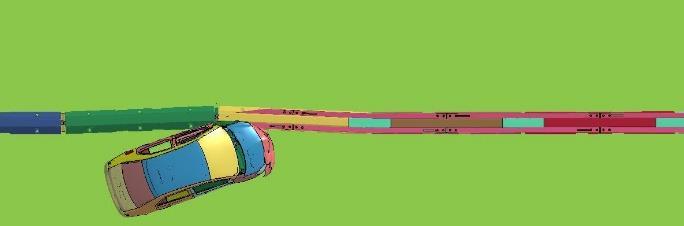
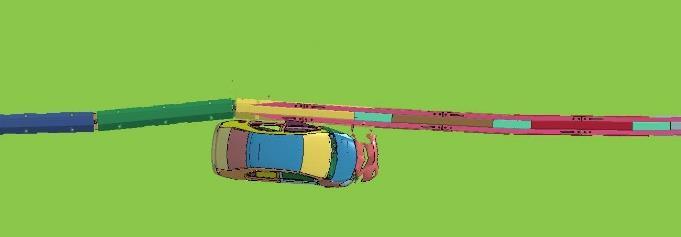
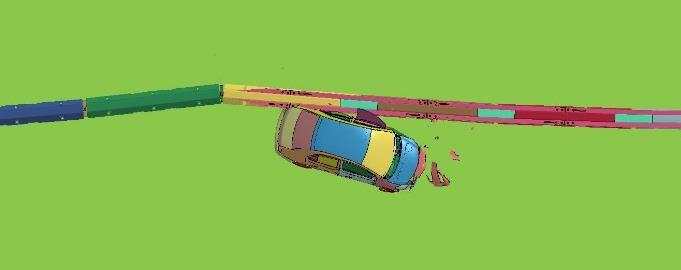
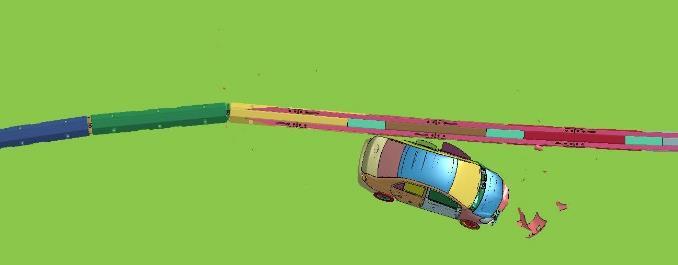
61 0.000 sec sec sec sec sec sec sec sec sec sec sec sec Figure 42. Sequential Photographs: Impact Point at 3.6 ft (1.1 m) Upstream from Transition Joint 52
EXTENDING TL-2 SHORT-RADIUS GUARDRAIL TO LARGER RADII
 Research Project Number TPF-5(193) Supplement 27 EXTENDING TL-2 SHORT-RADIUS GUARDRAIL TO LARGER RADII Submitted by Cody S. Stolle, Ph.D., E.I.T. Post-Doctoral Research Associate Robert W. Bielenberg,
PR V2. Submitted by. Professor MIDWEST Vine Street (402) Submitted to
 Submitted to") FINAL REPORT PR4893118-V2 ZONE OF INTRUSION STUDY Submitted by John D. Reid, Ph.D. Professor Dean L.. Sicking, Ph.D., P.E. Professorr and MwRSF Director MIDWEST ROADSIDE SAFETY FACILITY University of Nebraska-Lincoln
FINAL REPORT PR4893118-V2 ZONE OF INTRUSION STUDY Submitted by John D. Reid, Ph.D. Professor Dean L.. Sicking, Ph.D., P.E. Professorr and MwRSF Director MIDWEST ROADSIDE SAFETY FACILITY University of Nebraska-Lincoln
DEVELOPMENT OF A MASH TL-3 TRANSITION BETWEEN GUARDRAIL AND PORTABLE CONCRETE BARRIERS
 Duplication for publication or sale is strictly prohibited without prior written permission of the Transportation Research Board Paper No. 17-01712 DEVELOPMENT OF A MASH TL-3 TRANSITION BETWEEN GUARDRAIL
DEFLECTION LIMITS FOR TEMPORARY CONCRETE BARRIERS
 Midwest State s Regional Pooled Fund Research Program Fiscal Year 1998-1999 (Year 9) NDOR Research Project Number SPR-3(017) DEFLECTION LIMITS FOR TEMPORARY CONCRETE BARRIERS Submitted by Dean L. Sicking,
MINIMUM EFFECTIVE LENGTH FOR THE MIDWEST GUARDRAIL SYSTEM
 Duplication for publication or sale is strictly prohibited without prior written permission of the Transportation Research Board Paper No. 15-0484 MINIMUM EFFECTIVE LENGTH FOR THE MIDWEST GUARDRAIL SYSTEM
Midwest Guardrail System Without Blockouts
 Duplication for publication or sale is strictly prohibited without prior written permission of the Transportation Research Board Paper No. 13-0418 Midwest Guardrail System Without Blockouts by John D.
VERIFICATION & VALIDATION REPORT of MGS Barrier Impact with 1100C Vehicle Using Toyota Yaris Coarse FE Model
 VERIFICATION & VALIDATION REPORT of MGS Barrier Impact with 1100C Vehicle Using Toyota Yaris Coarse FE Model CCSA VALIDATION/VERIFICATION REPORT Page 1 of 4 Project: CCSA Longitudinal Barriers on Curved,
TEST MATRICES FOR EVALUATING CABLE MEDIAN BARRIERS PLACED IN V-DITCHES
 Midwest States Regional Pooled Fund Research Program Fiscal Year 2012 (Year 22) Research Project Number TPF-5(193) Supplement #44 NDOR Sponsoring Agency Code RPFP-12-CABLE1&2 TEST MATRICES FOR EVALUATING
VULCAN BARRIER TL-3 GENERAL SPECIFICATIONS
 VULCAN BARRIER TL-3 GENERAL SPECIFICATIONS I. GENERAL A. The VULCAN BARRIER TL-3 (VULCAN TL-3) shall be a highly portable and crashworthy longitudinal barrier especially suited for use as a temporary barrier
Continued Development of a Non-Proprietary, High-Tension, Cable End Terminal System
 University of Nebraska - Lincoln DigitalCommons@University of Nebraska - Lincoln Nebraska Department of Transportation Research Reports Nebraska LTAP 4-29-2016 Continued Development of a Non-Proprietary,
AASHTO Manual for Assessing Safety Hardware, AASHTO/FHWA Joint Implementation Plan Standing Committee on Highways September 24, 2015
 AASHTO Manual for Assessing Safety Hardware, 2015 AASHTO/FHWA Joint Implementation Plan Standing Committee on Highways September 24, 2015 Full Scale MASH Crash Tests (NCHRP 22-14(02)) Conducted several
Research Project Number SPR-P1(13)M326 DEVELOPMENT OF A MASH TL-3 TRANSITION BETWEEN GUARDRAIL AND PORTABLE CONCRETE BARRIERS.
M326 DEVELOPMENT OF A MASH TL-3 TRANSITION BETWEEN GUARDRAIL AND PORTABLE CONCRETE BARRIERS.") Research Project Number SPR-P1(13)M326 DEVELOPMENT OF A MASH TL-3 TRANSITION BETWEEN GUARDRAIL AND PORTABLE CONCRETE BARRIERS Submitted by David A. Gutierrez, B.S.C.E., E.I.T. Graduate Research Assistant
Research Project Number SPR-P1(13)M326 DEVELOPMENT OF A MASH TL-3 TRANSITION BETWEEN GUARDRAIL AND PORTABLE CONCRETE BARRIERS Submitted by David A. Gutierrez, B.S.C.E., E.I.T. Graduate Research Assistant
VULCAN BARRIER TL-3 GENERAL SPECIFICATIONS
 VULCAN BARRIER TL-3 GENERAL SPECIFICATIONS I. GENERAL A. The VULCAN BARRIER TL-3 (VULCAN TL-3) shall be a highly portable and crashworthy longitudinal barrier especially suited for use as a temporary barrier
Advances in Simulating Corrugated Beam Barriers under Vehicular Impact
 13 th International LS-DYNA Users Conference Session: Automotive Advances in Simulating Corrugated Beam Barriers under Vehicular Impact Akram Abu-Odeh Texas A&M Transportation Institute Abstract W-beam
Evaluation and Design of ODOT s Type 5 Guardrail with Tubular Backup
 Evaluation and Design of ODOT s Type 5 Guardrail with Tubular Backup Draft Final Report Chuck A. Plaxico, Ph.D. James C. Kennedy, Jr., Ph.D. Charles R. Miele, P.E. for the Ohio Department of Transportation
CRITICAL FLARE RATES FOR W-BEAM GUARDRAIL DETERMINING MAXIMUM CAPACITY USING COMPUTER SIMULATION NCHRP 17-20(3)
") CRITICAL FLARE RATES FOR W-BEAM GUARDRAIL DETERMINING MAXIMUM CAPACITY USING COMPUTER SIMULATION NCHRP 17-2(3) Submitted by Beau D. Kuipers, B.S.M.E., E.I.T. Graduate Research Assistant Ronald K. Faller,
CRITICAL FLARE RATES FOR W-BEAM GUARDRAIL DETERMINING MAXIMUM CAPACITY USING COMPUTER SIMULATION NCHRP 17-2(3) Submitted by Beau D. Kuipers, B.S.M.E., E.I.T. Graduate Research Assistant Ronald K. Faller,
INCREASED SPAN LENGTH FOR THE MGS LONG-SPAN GUARDRAIL SYSTEM PART III: FAILURE ANALYSIS
 Midwest States Pooled Fund Research Program Fiscal Years 2013 (Years 23) Research Project Number TPF-5(193) Supplement #56 NDOR Sponsoring Agency Code RPFP-13-MGS-3 INCREASED SPAN LENGTH FOR THE MGS LONG-SPAN
Evaluation of the Midwest Guardrail System Stiffness Transition with Curb
 Duplication for publication or sale is strictly prohibited without prior written permission of the Transportation Research Board Paper No. -0 Evaluation of the Midwest Guardrail System Stiffness Transition
A MASH Compliant W-Beam Median Guardrail System
 0 0 0 0 0 A MASH Compliant W-Beam Median Guardrail System By A. Y. Abu-Odeh, R. P. Bligh, W. Odell, A. Meza, and W. L. Menges Submitted: July 0, 0 Word Count:, + ( figures + tables=,000) =, words Authors:
Evaluation of the Midwest Guardrail System stiffness transition with curb
 University of Nebraska - Lincoln DigitalCommons@University of Nebraska - Lincoln Civil Engineering Faculty Publications Civil Engineering 2016 Evaluation of the Midwest Guardrail System stiffness transition
Assessing Options for Improving Roadside Barrier Crashworthiness
 13 th International LS-DYNA Users Conference Session: Simulation Assessing Options for Improving Roadside Barrier Crashworthiness D. Marzougui, C.D. Kan, and K.S. Opiela Center for Collision Safety and
Manual for Assessing Safety Hardware
 American Association of State Highway and Transportation Officials Manual for Assessing Safety Hardware 2009 vii PREFACE Effective traffic barrier systems, end treatments, crash cushions, breakaway devices,
1962: HRCS Circular 482 one-page document, specified vehicle mass, impact speed, and approach angle for crash tests.
 1 2 3 1962: HRCS Circular 482 one-page document, specified vehicle mass, impact speed, and approach angle for crash tests. 1973: NCHRP Report 153 16-page document, based on technical input from 70+ individuals
Development and Implementation of the Simplified MGS Stiffness Transition
 Duplication for publication or sale is strictly prohibited without prior written permission of the Transportation Research Board Paper No. 12-3367 Development and Implementation of the Simplified MGS Stiffness
Texas Transportation Institute The Texas A&M University System College Station, Texas
 1. Report No. FHWA/TX-07/0-5527-1 4. Title and Subtitle DEVELOPMENT OF A LOW-PROFILE TO F-SHAPE TRANSITION BARRIER SEGMENT 2. Government Accession No. 3. Recipient's Catalog No. Technical Report Documentation
Universal TAU-IIR Redirective, Non-Gating, Crash Cushion
 TB 110927 Rev. 0 Page 1 of 5 Product Specification Universal TAU-IIR Redirective, Non-Gating, Crash Cushion I. General The Universal TAU-IIR system is a Redirective, Non-Gating Crash Cushion in accordance
Form DOT F (8-72) Texas Transportation Institute The Texas A&M University System College Station, Texas
 Texas Transportation Institute The Texas A&M University System College Station, Texas") 1. Report No. FHWA/TX-02/4162-1 Technical Report Documentation Page 2. Government Accession No. 3. Recipient's Catalog No. 4. Title and Subtitle EVALUATION OF TEXAS GRID-SLOT PORTABLE CONCRETE BARRIER
1. Report No. FHWA/TX-02/4162-1 Technical Report Documentation Page 2. Government Accession No. 3. Recipient's Catalog No. 4. Title and Subtitle EVALUATION OF TEXAS GRID-SLOT PORTABLE CONCRETE BARRIER
Cable-to-Post Attachments for Use in Non- Proprietary High-Tension Cable Median Barrier Phase II
 University of Nebraska - Lincoln DigitalCommons@University of Nebraska - Lincoln Nebraska Department of Transportation Research Reports Nebraska LTAP 3-24-2016 Cable-to-Post Attachments for Use in Non-
Product Specification. ABSORB 350 TM TL-2 Non-Redirective, Gating, Crash Cushion Applied to Quickchange Moveable Barrier
 TB 000612 Rev. 0 Page 1 of 9 Product Specification ABSORB 350 TM TL-2 Non-Redirective, Gating, Crash Cushion Applied to Quickchange Moveable Barrier I. General The ABSORB 350 TM TL-2 System is a Non-Redirective,
SUMMARY CHANGES FOR NCHRP REPORT 350 GUIDELINES [NCHRP (02)] Keith A. Cota, Chairman Technical Committee on Roadside Safety June 14, 2007
![SUMMARY CHANGES FOR NCHRP REPORT 350 GUIDELINES [NCHRP (02)] Keith A. Cota, Chairman Technical Committee on Roadside Safety June 14, 2007](/thumbs/87/97351925.jpg "SUMMARY CHANGES FOR NCHRP REPORT 350 GUIDELINES [NCHRP (02)] Keith A. Cota, Chairman Technical Committee on Roadside Safety June 14, 2007") SUMMARY CHANGES FOR NCHRP REPORT 350 GUIDELINES [NCHRP 22-14 (02)] Keith A. Cota, Chairman Technical Committee on Roadside Safety June 14, 2007 BACKGROUND Circular 482 (1962) First full scale crash test
SUMMARY CHANGES FOR NCHRP REPORT 350 GUIDELINES [NCHRP 22-14 (02)] Keith A. Cota, Chairman Technical Committee on Roadside Safety June 14, 2007 BACKGROUND Circular 482 (1962) First full scale crash test
Crash Testing Growth Common Roadside Hardware Systems Draft FHWA and AASHTO Requirements for Implementing MASH 2015
 64 th Annual Illinois Traffic Safety and Engineering Conference October 14, 2015 Crash Testing Growth Common Roadside Hardware Systems Draft FHWA and AASHTO Requirements for Implementing MASH 2015 1 https://www.youtube.com/watch?feature
February 8, In Reply Refer To: HSSD/CC-104
 February 8, 2008 200 New Jersey Avenue, SE. Washington, DC 20590 In Reply Refer To: HSSD/CC-04 Barry D. Stephens, P.E. Sr. Vice President Engineering Energy Absorption Systems, Inc. 367 Cincinnati Avenue
Development and Validation of a Finite Element Model of an Energy-absorbing Guardrail End Terminal
 Development and Validation of a Finite Element Model of an Energy-absorbing Guardrail End Terminal Yunzhu Meng 1, Costin Untaroiu 1 1 Department of Biomedical Engineering and Virginia Tech, Blacksburg,
Evaluation of Barriers for Very High Speed Roadways
 TTI: 0-6071 Evaluation of Barriers for Very High Speed Roadways ISO 17025 Laboratory Testing Certificate # 2821.01 Crash testing performed at: TTI Proving Ground 3100 SH 47, Building 7091 Bryan, TX 77807
PERFORMANCE EVALUATION OF THE FREE-STANDING TEMPORARY BARRIER UPDATE TO NCHRP 350 TEST NO WITH 28" C.G. HEIGHT (2214TB-2)
") PERFORMANCE EVALUATION OF THE FREE-STANDING TEMPORARY BARRIER UPDATE TO NCHRP 350 TEST NO. 3-11 WITH 28" C.G. HEIGHT (2214TB-2) Submitted by Karla A. Polivka, M.S.M.E., E.I.T. Research Associate Engineer
PERFORMANCE EVALUATION OF THE FREE-STANDING TEMPORARY BARRIER UPDATE TO NCHRP 350 TEST NO. 3-11 WITH 28" C.G. HEIGHT (2214TB-2) Submitted by Karla A. Polivka, M.S.M.E., E.I.T. Research Associate Engineer
Implementation of AASHTO s Manual for Assessing Safety Hardware (MASH) 2016
 2016") Implementation of AASHTO s Manual for Assessing Safety Hardware (MASH) 2016 Update from the Technical Committee on Roadside Safety Keith Cota, New Hampshire DOT MASH 2016 Overview Background Ballot Results/Dates
Implementation of AASHTO s Manual for Assessing Safety Hardware (MASH) 2016 Update from the Technical Committee on Roadside Safety Keith Cota, New Hampshire DOT MASH 2016 Overview Background Ballot Results/Dates
July 10, Refer to: HSA-10/CC-78A
 July 10, 2003 Refer to: HSA-10/CC-78A Barry D. Stephens, P.E. Senior Vice President of Engineering ENERGY ABSORPTION Systems, Inc. 3617 Cincinnati Avenue Rocklin, California 95765 Dear Mr. Stephens: Your
BarrierGate. General Specifications. Manual Operations General Specifications
 BarrierGate General Specifications Manual Operations General Specifications BarrierGate GENERAL SPECIFICATIONS I. GENERAL A. The BarrierGate system (the gate) shall be designed and manufactured by Energy
June 5, In Reply Refer To: HSSD/B-178. Mr. Kevin K. Groeneweg Mobile Barriers LLC Genesee Trail Road Golden, CO Dear Mr.
 June 5, 2008 1200 New Jersey Avenue, SE. Washington, DC 20590 In Reply Refer To: HSSD/B-178 Mr. Kevin K. Groeneweg Mobile Barriers LLC 24918 Genesee Trail Road Golden, CO 80401 Dear Mr. Groeneweg: This
Analysis of Existing Work-Zone Sign Supports Using Manual for Assessing Safety Hardware Safety Performance Criteria
 University of Nebraska - Lincoln DigitalCommons@University of Nebraska - Lincoln Civil Engineering Faculty Publications Civil Engineering 2011 Analysis of Existing Work-Zone Sign Supports Using Manual
PERFORMANCE EVALUATION OF THE FREE-STANDING TEMPORARY BARRIER UPDATE TO NCHRP 350 TEST NO (2214TB-1)
") PERFORMANCE EVALUATION OF THE FREE-STANDING TEMPORARY BARRIER UPDATE TO NCHRP 350 TEST NO. 3-11 (2214TB-1) Submitted by Karla A. Polivka, M.S.M.E., E.I.T. Research Associate Engineer Dean L. Sicking, Ph.D.,
PERFORMANCE EVALUATION OF THE FREE-STANDING TEMPORARY BARRIER UPDATE TO NCHRP 350 TEST NO. 3-11 (2214TB-1) Submitted by Karla A. Polivka, M.S.M.E., E.I.T. Research Associate Engineer Dean L. Sicking, Ph.D.,
SAFETY PERFORMANCE OF WORK-ZONE DEVICES UNDER MASH TESTING
 SAFETY PERFORMANCE OF WORK-ZONE DEVICES UNDER MASH TESTING Schmidt, Faller, Lechtenberg, Sicking, Holloway Midwest Roadside Safety Facility Nebraska Transportation Center University of Nebraska-Lincoln
Technical Report Documentation Page Form DOT F (8-72) Reproduction of completed page authorized
 Reproduction of completed page authorized") 1. Report No. FHWA/TX-05/0-4162-3 4. Title and Subtitle 2. Government Accession No. 3. Recipient's Catalog No. DEVELOPMENT OF LOW-DEFLECTION PRECAST CONCRETE ARRIER 5. Report Date January 2005 Technical
1. Report No. FHWA/TX-05/0-4162-3 4. Title and Subtitle 2. Government Accession No. 3. Recipient's Catalog No. DEVELOPMENT OF LOW-DEFLECTION PRECAST CONCRETE ARRIER 5. Report Date January 2005 Technical
PERFORMANCE EVALUATION OF THE MODIFIED G4(1S) GUARDRAIL UPDATE TO NCHRP 350 TEST NO WITH 28" C.G. HEIGHT (2214WB-2)
 GUARDRAIL UPDATE TO NCHRP 350 TEST NO WITH 28 C.G. HEIGHT (2214WB-2)") PERFORMANCE EVALUATION OF THE MODIFIED G4(1S) GUARDRAIL UPDATE TO NCHRP 350 TEST NO. 3-11 WITH 28" C.G. HEIGHT (2214WB-2) Submitted by Karla A. Polivka, M.S.M.E., E.I.T. Research Associate Engineer Dean
PERFORMANCE EVALUATION OF THE MODIFIED G4(1S) GUARDRAIL UPDATE TO NCHRP 350 TEST NO. 3-11 WITH 28" C.G. HEIGHT (2214WB-2) Submitted by Karla A. Polivka, M.S.M.E., E.I.T. Research Associate Engineer Dean
ROBUST PROJECT Norwegian Public Roads Administration / Force Technology Norway AS
 ROBUST PROJECT Norwegian Public Roads Administration / Force Technology Norway AS Evaluation of small car - RM_R1 - prepared by Politecnico di Milano Volume 1 of 1 January 2006 Doc. No.: ROBUST-5-002/TR-2004-0039
Development of Iowa Dot Combination Bridge Separation Barrier with Bicycle Railing
 University of Nebraska - Lincoln DigitalCommons@University of Nebraska - Lincoln Engineering Mechanics Dissertations & Theses Mechanical & Materials Engineering, Department of 8-2018 Development of Iowa
INCREASED SPAN LENGTH FOR THE MGS LONG-SPAN GUARDRAIL SYSTEM
 University of Nebraska - Lincoln DigitalCommons@University of Nebraska - Lincoln Mechanical (and Materials) Engineering -- Dissertations, Theses, and Student Research Mechanical & Materials Engineering,
TRACC. Trinity Attenuating Crash Cushion
 TRACC Trinity Attenuating Crash Cushion CSP Pacific Business Unit of Fletcher Concrete & Infrastructure Limited 306 Neilson Street Onehunga, Auckland Phone: (09) 634 1239 or 0800 655 200 Fax: (09) 634
PERFORMANCE EVALUATION OF THE PERMANENT NEW JERSEY SAFETY SHAPE BARRIER UPDATE TO NCHRP 350 TEST NO (2214NJ-2)
") PERFORMANCE EVALUATION OF THE PERMANENT NEW JERSEY SAFETY SHAPE BARRIER UPDATE TO NCHRP 350 TEST NO. 4-12 (2214NJ-2) Submitted by Karla A. Polivka, M.S.M.E., E.I.T. Research Associate Engineer Dean L.
PERFORMANCE EVALUATION OF THE PERMANENT NEW JERSEY SAFETY SHAPE BARRIER UPDATE TO NCHRP 350 TEST NO. 4-12 (2214NJ-2) Submitted by Karla A. Polivka, M.S.M.E., E.I.T. Research Associate Engineer Dean L.
MASH 2016 Implementation: What, When and Why
 MASH 2016 Implementation: What, When and Why Roger P. Bligh, Ph.D., P.E. Senior Research Engineer Texas A&M Transportation Institute June 7, 2016 2016 Traffic Safety Conference College Station, Texas Outline
Development of a Finite Element Model of a Motorcycle
 Development of a Finite Element Model of a Motorcycle N. Schulz, C. Silvestri Dobrovolny and S. Hurlebaus Texas A&M Transportation Institute Abstract Over the past years, extensive research efforts have
Technical Report Documentation Page 2. Government Accession No. 3. Recipient's Catalog No. 1. Report No. FHWA/TX-09/
 1. Report No. FHWA/TX-09/0-6071-1 4. Title and Subtitle ANALYSIS OF ROADSIDE SAFETY DEVICES FOR USE ON VERY HIGH-SPEED ROADWAYS Technical Report Documentation Page 2. Government Accession No. 3. Recipient's
STI Project: Barrier Systems, Inc. RTS-QMB Longitudinal Barrier. Page 38 of 40 QBOR1. Appendix F (Continued) Figure F-3
 Figure F-3") Barrier Systems, Inc. RTS-QMB Longitudinal Barrier STI Project: QBOR1 Page 38 of 40 Appendix F (Continued) Figure F-3 t=.500sec 115 meters overall 37.1 Impact Severity (kj).. 141.6 Angle (deg).. 25 Speed
Barrier Systems, Inc. RTS-QMB Longitudinal Barrier STI Project: QBOR1 Page 38 of 40 Appendix F (Continued) Figure F-3 t=.500sec 115 meters overall 37.1 Impact Severity (kj).. 141.6 Angle (deg).. 25 Speed
MASH Test 3-11 on the T131RC Bridge Rail
 TTI: 9-1002-12 MASH Test 3-11 on the T131RC Bridge Rail ISO 17025 Laboratory Testing Certificate # 2821.01 Crash testing performed at: TTI Proving Ground 3100 SH 47, Building 7091 Bryan, TX 77807 Test
NCHRP Report 350 Test 4-12 of the Modified Thrie Beam Guardrail
 NCHRP Report 350 Test 4-12 of the Modified Thrie Beam Guardrail PUBLICATION NO. FHWA-RD-99-065 DECEMBER 1999 Research, Development, and Technology Turner-Fairbank Highway Research Center 6300 Georgetown
Impact analysis of a vertical flared back bridge rail-to-guardrail transition structure using simulation
 Finite Elements in Analysis and Design 41 (2005) 371 396 www.elsevier.com/locate/finel Impact analysis of a vertical flared back bridge rail-to-guardrail transition structure using simulation Ali O. Atahan,
Improving Roadside Safety by Computer Simulation
 A2A04:Committee on Roadside Safety Features Chairman: John F. Carney, III, Worcester Polytechnic Institute Improving Roadside Safety by Computer Simulation DEAN L. SICKING, University of Nebraska, Lincoln
COMPARISON OF THE IMPACT PERFORMANCE OF THE G4(1W) AND G4(2W) GUARDRAIL SYSTEMS UNDER NCHRP REPORT 350 TEST 3-11 CONDITIONS
 AND G4(2W) GUARDRAIL SYSTEMS UNDER NCHRP REPORT 350 TEST 3-11 CONDITIONS") Paper No. 00-0525 COMPARISON OF THE IMPACT PERFORMANCE OF THE G4(1W) AND G4(2W) GUARDRAIL SYSTEMS UNDER NCHRP REPORT 350 TEST 3-11 CONDITIONS by Chuck A. Plaxico Associate Research Engineer Worcester Polytechnic
Paper No. 00-0525 COMPARISON OF THE IMPACT PERFORMANCE OF THE G4(1W) AND G4(2W) GUARDRAIL SYSTEMS UNDER NCHRP REPORT 350 TEST 3-11 CONDITIONS by Chuck A. Plaxico Associate Research Engineer Worcester Polytechnic
MASH TEST 3-11 OF THE TxDOT T222 BRIDGE RAIL
 TTI: 9-1002-12 MASH TEST 3-11 OF THE TxDOT T222 BRIDGE RAIL ISO 17025 Laboratory Testing Certificate # 2821.01 Crash testing performed at: TTI Proving Ground 3100 SH 47, Building 7091 Bryan, TX 77807 Test
SGR52 TOP-MOUNTED WEAK-POST GUARDRAIL ATTACHED TO CULVERT PLAN VIEW ELEVATION VIEW DETAIL B DETAIL A SHEET NO. DATE: 37 1/2" 953 (TYP) 150" 3810
 150 3810") PLAN VIEW C 150" 3810 37 1/2" 953 (TYP) A B C 8-FBB01 RWB01a FWR01 RWM04a FWR01 RWB01a RWM04a PSF01 FBX08a PSF01 FBX08a DETAIL A DETAIL B 1 of 7 12/5/2016 INTENDED USE The Top-Mounted Weak-Post Guardrail
PLAN VIEW C 150" 3810 37 1/2" 953 (TYP) A B C 8-FBB01 RWB01a FWR01 RWM04a FWR01 RWB01a RWM04a PSF01 FBX08a PSF01 FBX08a DETAIL A DETAIL B 1 of 7 12/5/2016 INTENDED USE The Top-Mounted Weak-Post Guardrail
s MEDIAN BARRIERS FOR TEXAS HIGHWAYS
 s MEDIAN BARRIERS FOR TEXAS HIGHWAYS SUMMARY REPORT of Research Report Number 146-4 Study 2-8-68-146 Cooperative Research Program of the Texas Transportation Institute and the Texas Highway Department
Texas Transportation Institute The Texas A&M University System College Station, Texas
 1. Report No. FHWA/TX-04/9-8132-1 4. Title and Subtitle TESTING AND EVALUATION OF THE FLORIDA JERSEY SAFETY SHAPED BRIDGE RAIL 2. Government Accession No. 3. Recipient's Catalog No. 5. Report Date February
Development of Combination Pedestrian-Traffic Bridge Railings
 TRANSPORTATION RESEARCH RECORD 1468 41 Development of Combination Pedestrian-Traffic Bridge Railings D. LANCE BULLARD, JR., WANDA L. MENGES, AND C. EUGENE BUTH Two bridge railing designs have been developed
W-Beam Guiderail Transition from Light to Heavy Posts
 TRANSPORTATION RESEARCH RECORD 1198 55 W-Beam Guiderail Transition from Light to Heavy Posts DONALD G. HERRING AND JAMES E. BRYDEN Two full-scale crash tests evaluated a transition between lightand heavy-post
MASH TEST 3-10 ON 31-INCH W-BEAM GUARDRAIL WITH STANDARD OFFSET BLOCKS
 TTI: 9-1002 MASH TEST 3-10 ON 31-INCH W-BEAM GUARDRAIL WITH STANDARD OFFSET BLOCKS ISO 17025 Laboratory Testing Certificate # 2821.01 Crash testing performed at: TTI Proving Ground 3100 SH 47, Building
Development of a TL-5 Vertical Faced Concrete Median Barrier Incorporating Head Ejection Criteria
 Midwest States Regional Pooled Fund Research Program Fiscal Year 2004-2005 (Year 15) Research Project Number SPR-3(017) NDOR Sponsoring Agency Code RPFP-05-01 Development of a TL-5 Vertical Faced Median
Working Paper. Development and Validation of a Pick-Up Truck Suspension Finite Element Model for Use in Crash Simulation
 Working Paper NCAC 2003-W-003 October 2003 Development and Validation of a Pick-Up Truck Suspension Finite Element Model for Use in Crash Simulation Dhafer Marzougui Cing-Dao (Steve) Kan Matthias Zink
MASH08 TEST 3-11 OF THE ROCKINGHAM PRECAST CONCRETE BARRIER
 Proving Ground Report No. 400001-RPC4 Report Date: July 2009 MASH08 TEST 3-11 OF THE ROCKINGHAM PRECAST CONCRETE BARRIER by C. Eugene Buth, P.E. Research Engineer William F. Williams, P.E. Assistant Research
TEXAS TRANSPORTATION INSTITUTE THE TEXAS A & M UNIVERSITY SYSTEM COLLEGE STATION, TEXAS 77843
 NCHRP REPORT 350 ASSESSMENT OF EXISTING ROADSIDE SAFETY HARDWARE by C. Eugene Buth, P.E. Senior Research Engineer Wanda L. Menges Associate Research Specialist and Sandra K. Schoeneman Research Associate
Texas Transportation Institute The Texas A&M University System College Station, Texas
 1. Report No. FHWA/TX-05/9-8132-P7 4. Title and Subtitle TL-4 CRASH TESTING OF THE F411 BRIDGE RAIL 2. Government Accession No. 3. Recipient's Catalog No. 5. Report Date October 2004 Technical Report Documentation
CRASH TESTING OF RSA/K&C ANTI-RAM FOUNDATION BOLLARD PAD IN ACCORDANCE WITH U.S. DEPARTMENT OF STATE DIPLOMATIC SECURITY SD-STD-02.
 CRASH TESTING OF RSA/K&C ANTI-RAM FOUNDATION BOLLARD PAD IN ACCORDANCE WITH U.S. DEPARTMENT OF STATE DIPLOMATIC SECURITY SD-STD-02.01 REVISION A Prepared for RSA Protective Technologies, LLC FINAL REPORT
DEVELOPMENT OF A MASH TL-3 MEDIAN BARRIER GATE
 TTI: 9-1002 DEVELOPMENT OF A MASH TL-3 MEDIAN BARRIER GATE ISO 17025 Laboratory Testing Certificate # 2821.01 Crash testing performed at: TTI Proving Ground 3100 SH 47, Building 7091 Bryan, TX 77807 Research/Test
NUMERICAL ANALYSIS OF IMPACT BETWEEN SHUNTING LOCOMOTIVE AND SELECTED ROAD VEHICLE
 Journal of KONES Powertrain and Transport, Vol. 21, No. 4 2014 ISSN: 1231-4005 e-issn: 2354-0133 ICID: 1130437 DOI: 10.5604/12314005.1130437 NUMERICAL ANALYSIS OF IMPACT BETWEEN SHUNTING LOCOMOTIVE AND
MASH TEST 3-11 OF THE TxDOT SINGLE SLOPE BRIDGE RAIL (TYPE SSTR) ON PAN-FORMED BRIDGE DECK
 ON PAN-FORMED BRIDGE DECK") TTI: 9-1002 MASH TEST 3-11 OF THE TxDOT SINGLE SLOPE BRIDGE RAIL (TYPE SSTR) ON PAN-FORMED BRIDGE DECK ISO 17025 Laboratory Testing Certificate # 2821.01 Crash testing performed at: TTI Proving Ground
TTI: 9-1002 MASH TEST 3-11 OF THE TxDOT SINGLE SLOPE BRIDGE RAIL (TYPE SSTR) ON PAN-FORMED BRIDGE DECK ISO 17025 Laboratory Testing Certificate # 2821.01 Crash testing performed at: TTI Proving Ground
Performance Based Design for Bridge Piers Impacted by Heavy Trucks
 Performance Based Design for Bridge Piers Impacted by Heavy Trucks Anil K. Agrawal, Ph.D., P.E., Ran Cao and Xiaochen Xu The City College of New York, New York, NY Sherif El-Tawil, Ph.D. University of
Vehicle Crash Tests of Concrete Median Barrier Retrofitted with Slipformed Concrete Glare Screen
 TRANSPORTATION RESEARCH RECORD 1419 35 Vehicle Crash Tests of Concrete Median Barrier Retrofitted with Slipformed Concrete Glare Screen PAYAM RowHANI, DoRAN GLAuz, AND RoGER L. STOUGHTON Two vehicle crash
safedirection.com.au Ref: PM 017/02
 DISTRIBUTOR 0 Product Manual Ref: PM 017/02 Table of Contents 1.0 Introduction... 3 2.0 The... 3 3.0 How the Functions... 4 4.0 Crash Test Performance... 4 5.0 Characteristics of Terminals... 5 5.1 Gating
ROBUST PROJECT Norwegian Public Roads Administration / Force Technology Norway AS
 ROBUST PROJECT Norwegian Public Roads Administration / Force Technology Norway AS Volume 1 of 1 April 2005 Doc. No.: ROBUST-05-009/TR-2005-0012 - Rev. 0 286-2-1-no-en Main Report Report title: Simulation
OPTIMIZATION OF THRIE BEAM TERMINAL END SHOE CONNECTION
 TTI: 9-1002-15 OPTIMIZATION OF THRIE BEAM TERMINAL END SHOE CONNECTION ISO 17025 Laboratory Testing Certificate # 2821.01 Pendulum testing performed at: TTI Proving Ground 3100 SH 47, Building 7091 Bryan,
CRASH TEST AND EVALUATION OF 3-FT MOUNTING HEIGHT SIGN SUPPORT SYSTEM
 TTI: 9-1002-15 CRASH TEST AND EVALUATION OF 3-FT MOUNTING HEIGHT SIGN SUPPORT SYSTEM ISO 17025 Laboratory Testing Certificate # 2821.01 Crash testing performed at: TTI Proving Ground 3100 SH 47, Building
W-Beam Approach Treatment at Bridge Rail Ends Near Intersecting Roadways
 TRANSPORTATION RESEARCH RECORD 1133 51 W-Beam Approach Treatment at Bridge Rail Ends Near Intersecting Roadways M. E. BRONSTAD, M. H. RAY, J. B. MAYER, JR., AND c. F. MCDEVITT This paper is concerned with
PRODUCT DESCRIPTION. X-Tension DS. is suitable for all road types: Motorways, country roads, city streets for speed categories up to 110 km/h.
 INDEX Introduction 2 Product Description 3 Installation 6 Specifications 7 Crash Tests Table 8 Reusability 9 FAQ 10 Annexes 14 Drawings 15 Pictures 16 Crash Tests Results 18 Approvals 23 INTRODUCTION Improving
Methodologies and Examples for Efficient Short and Long Duration Integrated Occupant-Vehicle Crash Simulation
 13 th International LS-DYNA Users Conference Session: Automotive Methodologies and Examples for Efficient Short and Long Duration Integrated Occupant-Vehicle Crash Simulation R. Reichert, C.-D. Kan, D.
CRASH TEST OF MILE POST MARKER. T. J. Hirsch Research Engineer. and. Eugene Buth Assistant Research Engineer. Research Report Number 146-8
 CRASH TEST OF MILE POST MARKER by T. J. Hirsch Research Engineer and Eugene Buth Assistant Research Engineer Research Report Number 146-8 Studies of Field Adaption of Impact Attenuation Systems Research
*Friedman Research Corporation, 1508-B Ferguson Lane, Austin, TX ** Center for Injury Research, Santa Barbara, CA, 93109
 Analysis of factors affecting ambulance compartment integrity test results and their relationship to real-world impact conditions. G Mattos*, K. Friedman*, J Paver**, J Hutchinson*, K Bui* & A Jafri* *Friedman
WP5 - Computational Mechanics B5 - Temporary Vertical Concrete Safety Barrier MAIN REPORT Volume 1 of 1
 ROBUST PROJECT TRL Limited WP5 - Computational Mechanics B5 - Temporary Vertical Concrete Safety Barrier MAIN REPORT Volume 1 of 1 December 2005 Doc. No.: ROBUST-5-010c Rev. 0. (Logo here) Main Report
Guide Rail Safety Symposium
 Ministry of Transportation Guide Rail Safety Symposium MTO Provincial Roadside Safety Update Mark C. Ayton, P. Eng. Senior Engineer, Highway Design MTO Highway Standards Branch MTO Provincial Roadside
DISTRIBUTION: Electronic Recipients List TRANSMITTAL LETTER NO. (15-01) MINNESOTA DEPARTMENT OF TRANSPORTATION. MANUAL: Road Design English Manual
 MINNESOTA DEPARTMENT OF TRANSPORTATION. MANUAL: Road Design English Manual") DISTRIBUTION: Electronic Recipients List MINNESOTA DEPARTMENT OF TRANSPORTATION DEVELOPED BY: Design Standards Unit ISSUED BY: Office of Project Management and Technical Support TRANSMITTAL LETTER NO.
DISTRIBUTION: Electronic Recipients List MINNESOTA DEPARTMENT OF TRANSPORTATION DEVELOPED BY: Design Standards Unit ISSUED BY: Office of Project Management and Technical Support TRANSMITTAL LETTER NO.
MASH TEST 3-21 ON TL-3 THRIE BEAM TRANSITION WITHOUT CURB
 TTI: 9-1002-12 MASH TEST 3-21 ON TL-3 THRIE BEAM TRANSITION WITHOUT CURB ISO 17025 Laboratory Testing Certificate # 2821.01 Crash testing performed at: TTI Proving Ground 3100 SH 47, Building 7091 Bryan,
Crash Performance of Strong-Post W-Beam Guardrail with Missing Blockouts Carolyn E. Hampton and Hampton C. Gabler
 Crash Performance of Strong-Post W-Beam Guardrail with Missing Blockouts Carolyn E. Hampton and Hampton C. Gabler Virginia Tech Center for Injury Biomechanics, Blacksburg VA 24061 Abstract Missing blockouts
METAL BEAM GUARDFENCE TRANSITION AND END TREATMENT IDENTIFICATION GUIDE
 2016 TxDOT Design Division METAL BEAM GUARDFENCE TRANSITION AND END TREATMENT IDENTIFICATION GUIDE A guide to help TxDOT employees identify metal beam guardfence transitions and end treatments for the
Evaluating The Relevancy Of Current Crash Test Guidelines For Roadside Safety Barriers On High Speed Roads
 Evaluating The Relevancy Of Current Crash Test Guidelines For Roadside Safety Barriers On High Speed Roads Connie Xavier Dominique Lord Chiara Dobrovolny Roger Bligh TRB 1 st International Roadside Safety
Non-contact Deflection Measurement at High Speed
 Non-contact Deflection Measurement at High Speed S.Rasmussen Delft University of Technology Department of Civil Engineering Stevinweg 1 NL-2628 CN Delft The Netherlands J.A.Krarup Greenwood Engineering
July 17, In Reply Refer To: HSSD/B-176A
 July 17, 2008 1200 New Jersey Avenue, SE. Washington, DC 20590 In Reply Refer To: HSSD/B-176A Mr. John Addy Hill & Smith Springvale Business and Industrial Park Bliston, Wolverhampton, West Midlands, UK,
Texas Transportation Institute The Texas A&M University System College Station, Texas
 2. Government Accession No. 3. Recipient's Catalog No. 1. Report No. FHWA/TX-03/0-4138-3 4. Title and Subtitle PERFORMANCE OF THE TXDOT T202 (MOD) BRIDGE RAIL REINFORCED WITH FIBER REINFORCED POLYMER BARS
MASH TEST 3-37 OF THE TxDOT 31-INCH W-BEAM DOWNSTREAM ANCHOR TERMINAL
 TTI: 9-1002 MASH TEST 3-37 OF THE TxDOT 31-INCH W-BEAM DOWNSTREAM ANCHOR TERMINAL ISO 17025 Laboratory Testing Certificate # 2821.01 Crash testing performed at: TTI Proving Ground 3100 SH 47, Building
November 16, 1998 Refer to: HNG-14. Mr. David Allardyce Mechanical Engineer B&B Electromatic Main Street Norwood, Louisiana 70761
 November 16, 1998 Refer to: HNG-14 Mr. David Allardyce Mechanical Engineer B&B Electromatic 14113 Main Street Norwood, Louisiana 70761 Dear Mr. Allardyce: In your August 31 letter, you presented some preliminary
Slotted Rail Guardrail Terminal
 TRANSPORTATION RESEARCH RECORD 1500 43 Slotted Rail Guardrail Terminal KING K. MAK, ROGER P. BLIGH, HAYES E. Ross, JR., AND DEAN L. SICKING A slotted rail terminal (SRT) for W-beam guardrails was successfully
April 22, In Reply Refer To: HSA-10/WZ-206. Mr. Jan Miller TrafFix Devices 220 Calle Pintoresco San Clemente, California Dear Mr.
 April 22, 2005 400 Seventh St., S.W. Washington, D.C. 20590 In Reply Refer To: HSA-10/WZ-206 Mr. Jan Miller TrafFix Devices 220 Calle Pintoresco San Clemente, California 92672 Dear Mr. Miller: Thank you
ArmorGuard Barrier Portable Longitudinal Barrier
 ArmorGuard Barrier Portable Longitudinal Barrier Installation & Maintenance Manual AGB I&M 082409 Page 1 of 12 ArmorGuard Barrier Table of contents Preface... 2 Applications and System Characteristics