DEVELOPMENT OF A MASH TL-3 MEDIAN BARRIER GATE
|
|
|
- Justin White
- 5 years ago
- Views:
Transcription

1 TTI: DEVELOPMENT OF A MASH TL-3 MEDIAN BARRIER GATE ISO Laboratory Testing Certificate # Crash testing performed at: TTI Proving Ground 3100 SH 47, Building 7091 Bryan, TX Research/Test Report Cooperative Research Program TEXAS TRANSPORTATION INSTITUTE THE TEXAS A&M UNIVERSITY SYSTEM COLLEGE STATION, TEXAS TEXAS DEPARTMENT OF TRANSPORTATION in cooperation with the Federal Highway Administration and the Texas Department of Transportation
2
3 1. Report No. FHWA/TX-11/ Title and Subtitle DEVELOPMENT OF A MASH TL-3 MEDIAN BARRIER GATE Technical Report Documentation Page 2. Government Accession No. 3. Recipient's Catalog No. 5. Report Date February 2011 Published June Performing Organization Code 7. Author(s) Roger P. Bligh, Dusty R. Arrington, Nauman M. Sheikh, Chiara Silvestri, and Wanda L. Menges 9. Performing Organization Name and Address Texas Transportation Institute Proving Ground The Texas A&M University System College Station, Texas Sponsoring Agency Name and Address Texas Department of Transportation Research and Technology Implementation Office P.O. Box 5080 Austin, Texas Performing Organization Report No. Test Report Work Unit No. (TRAIS) 11. Contract or Grant No. Project Type of Report and Period Covered Technical/Test Report: September 2008 August Sponsoring Agency Code 15. Supplementary Notes Project performed in cooperation with the Texas Department of Transportation and the Federal Highway Administration. Project Title: Roadside Safety Device Crash Testing Program URL: Abstract Median barriers are commonly used to separate opposing lanes of traffic on divided highways and to separate managed lanes from general purpose lanes. Concrete median barriers (CMBs) are often preferred on urban freeways with narrow medians due to their minimal deflection and low maintenance. However, long, continuous runs of CMBs limit access of emergency and maintenance vehicles to the other side of a roadway or a managed lane. Implementation of crashworthy median barrier gates at these locations can maintain the desired level of median protection for motorists while offering improved cross-median access for emergency and/or maintenance vehicles. A new median barrier gate was developed and crash tested under this project. The gate spans a 30-ft opening in a concrete median barrier and consists of two vertically stacked 12-inch 12-inch ¼-inch steel tubes connected to steel end brackets with 2¼-inch diameter steel pins. The gate is economical to fabricate and install. It can be manually operated by a single person and is designed to accommodate reversible traffic flow on both sides of the median and be operable in both directions on each end. The median barrier gate satisfies MASH Test Level 3 (TL-3) impact performance criteria and is considered suitable for implementation on Texas highways where cross-median access is desired. 17. Key Words Median Barrier, Gate, Roadside Safety, Crash Test, MASH 19. Security Classif.(of this report) Unclassified Form DOT F (8-72) 20. Security Classif.(of this page) Unclassified Reproduction of completed page authorized 18. Distribution Statement No restrictions. This document is available to the public through NTIS: National Technical Information Service Springfield, Virginia No. of Pages Price
4
5 DEVELOPMENT OF A MASH TL-3 MEDIAN BARRIER GATE by Roger P. Bligh, P.E. Research Engineer Texas Transportation Institute Dusty R. Arrington Engineering Research Associate Texas Transportation Institute Nauman M. Sheikh, P.E. Assistant Research Engineer Texas Transportation Institute Chiara Silvestri Post Doctoral Research Associate Texas Transportation Institute and Wanda L. Menges Research Specialist Texas Transportation Institute Report Project Project Title: Roadside Safety Device Crash Testing Program Performed in cooperation with the Texas Department of Transportation and the Federal Highway Administration February 2011 Published: June 2011 TEXAS TRANSPORTATION INSTITUTE The Texas A&M University System College Station, Texas
6
7 DISCLAIMER This research was performed in cooperation with the Texas Department of Transportation (TxDOT) and the Federal Highway Administration (FHWA). The contents of this report reflect the views of the authors, who are responsible for the facts and the accuracy of the data presented herein. The contents do not necessarily reflect the official view or policies of the FHWA or TxDOT. This report does not constitute a standard, specification, or regulation, and its contents are not intended for construction, bidding, or permit purposes. In addition, the above listed agencies assume no liability for its contents or use thereof. The United States Government and the State of Texas do not endorse products or manufacturers. Trade or manufacturers names appear herein solely because they are considered essential to the object of this report. The engineer in charge of the project was Roger P. Bligh, P.E. (Texas, #78550). TTI PROVING GROUND DISCLAIMER The results of the crash testing reported herein apply only to the article being tested. Wanda L. Menges, Research Specialist Deputy Quality Manager ISO Laboratory Testing Certificate # Crash testing performed at: TTI Proving Ground 3100 SH 47, Building 7091 Bryan, TX Richard A. Zimmer, Senior Research Specialist Test Facility Manager Quality Manager Technical Manager v
8 ACKNOWLEDGMENTS This research project was conducted under a cooperative program between the Texas Transportation Institute, the Texas Department of Transportation, and the Federal Highway Administration. The TxDOT project director for this research was Rory Meza, P.E. Bobby Dye with the Design Division served as project advisor and was also actively involved in this research. The authors acknowledge and appreciate their guidance and assistance. vi
9 TABLE OF CONTENTS Page LIST OF FIGURES... x LIST OF TABLES... xii CHAPTER 1. INTRODUCTION INTRODUCTION BACKGROUND OBJECTIVES/SCOPE OF RESEARCH... 4 CHAPTER 2. MEDIAN BARRIER GATE DESIGN DESIGN CONSIDERATIONS Snagging Rail Member Selection FINITE ELEMENT ANALYSIS... 7 CHAPTER 3. MEDIAN BARRIER GATE DETAILS TEST ARTICLE DESIGN AND CONSTRUCTION MATERIAL SPECIFICATIONS SOIL CONDITIONS CHAPTER 4. TEST REQUIREMENTS AND EVALUATION CRITERIA CRASH TEST MATRIX EVALUATION CRITERIA CHAPTER 5. CRASH TEST PROCEDURES TEST FACILITY VEHICLE TOW AND GUIDANCE PROCEDURES DATA ACQUISITION SYSTEMS Vehicle Instrumentation and Data Processing Anthropomorphic Dummy Instrumentation Photographic Instrumentation and Data Processing CHAPTER 6. CRASH TEST (MASH TEST 3-20) TEST DESIGNATION AND ACTUAL IMPACT CONDITIONS TEST VEHICLE WEATHER CONDITIONS TEST DESCRIPTION DAMAGE TO TEST INSTALLATION VEHICLE DAMAGE OCCUPANT RISK FACTORS ASSESSMENT OF TEST RESULTS vii
10 TABLE OF CONTENTS (CONTINUED) Page Structural Adequacy Occupant Risk Vehicle Trajectory CHAPTER 7. CRASH TEST (MASH TEST 3-11) TEST DESIGNATION AND ACTUAL IMPACT CONDITIONS TEST VEHICLE WEATHER CONDITIONS TEST DESCRIPTION DAMAGE TO TEST INSTALLATION VEHICLE DAMAGE OCCUPANT RISK FACTORS ASSESSMENT OF TEST RESULTS Structural Adequacy Occupant Risk Vehicle Trajectory CHAPTER 8. CRASH TEST (MASH TEST 3-21) TEST DESIGNATION AND ACTUAL IMPACT CONDITIONS TEST VEHICLE WEATHER CONDITIONS TEST DESCRIPTION DAMAGE TO TEST INSTALLATION VEHICLE DAMAGE OCCUPANT RISK FACTORS ASSESSMENT OF TEST RESULTS Structural Adequacy Occupant Risk Vehicle Trajectory CHAPTER 9. SUMMARY AND CONCLUSIONS CHAPTER 10. IMPLEMENTATION STATEMENT REFERENCES APPENDIX A. DETAILS OF THE TXDOT MEDIAN BARRIER GATE APPENDIX B. CERTIFICATION DOCUMENTATION APPENDIX C. TEST VEHICLE PROPERTIES AND INFORMATION viii
11 TABLE OF CONTENTS (CONTINUED) Page APPENDIX D. SEQUENTIAL PHOTOGRAPHS APPENDIX E. VEHICLE ANGULAR DISPLACEMENTS AND ACCELERATIONS APPENDIX F. RECOMMENDED MEDIAN BARRIER GATE DETAILS ix
12 LIST OF FIGURES Page Figure 1.1. Emergency Opening System (EOS)... 3 Figure 2.1. Mid-Span Impact of Pickup Truck into EOS: (a) Initial Impact Conditions and (b) High Vehicle Roll Angle Figure 2.2. Pickup Truck in Relation to Different Rail Geometries Chosen for Evaluation Figure 2.3. Rail Deformation and Deflection Results Figure 2.4. Vehicle Roll Angle Results Figure 2.5. Predicted Vehicle Roll Outcomes for Different Rail Configurations Figure 3.1. Details of the TxDOT Median Barrier Gate Installation Figure 3.2. Details of the TxDOT Median Barrier Gate Figure 3.3. TxDOT Median Barrier Gate Installation before Testing Figure 6.1. Vehicle/Barrier Geometrics for Test No Figure 6.2. Vehicle before Test No Figure 6.3. Vehicle/Barrier Positions after Test No Figure 6.4. TxDOT Median Barrier Gate after Test No Figure 6.5. Vehicle after Test No Figure 6.6. Interior of Vehicle for Test No Figure 6.7. Summary of Results for MASH Test 3-20 on the TxDOT Median Barrier Gate.. 31 Figure 7.1. Vehicle/Gate Geometrics for Test No Figure 7.2. Vehicle before Test No Figure 7.3. Vehicle/Gate Positions after Test No Figure 7.4. TxDOT Median Barrier Gate after Test No Figure 7.5. Vehicle after Test No Figure 7.6. Interior of Vehicle for Test No Figure 7.7. Summary of Results for MASH Test 3-11 on the TxDOT Median Barrier Gate.. 43 Figure 8.1. Vehicle/Gate Geometrics for Test No Figure 8.2. Vehicle before Test No Figure 8.3. Position of Vehicle/Gate after Test No Figure 8.4. Installation after Test No Figure 8.5. Vehicle after Test No Figure 8.6. Interior of Vehicle for Test No Figure 8.7. Summary of Results for MASH Test 3-21 on the TxDOT Median Barrier Gate.. 55 Figure C1. Vehicle Properties for Test No Figure C2. Vehicle Properties for Test No Figure C3. Vehicle Properties for Test No Figure D1. Sequential Photographs for Test No (Overhead and Frontal Views) Figure D2. Sequential Photographs for Test No (Rear View) Figure D3. Sequential Photographs for Test No (Overhead and Frontal Views) Figure D4. Sequential Photographs for Test No (Rear View) Figure D5. Sequential Photographs for Test No (Overhead and Frontal Views) x
13 LIST OF FIGURES (CONTINUED) Page Figure D6. Sequential Photographs for Test No (Rear View) Figure E1. Vehicle Angular Displacements for Test No Figure E2. Vehicle Longitudinal Accelerometer Trace for Test No (Accelerometer Located at Center of Gravity) Figure E3. Vehicle Lateral Accelerometer Trace for Test No (Accelerometer Located at Center of Gravity) Figure E4. Vehicle Vertical Accelerometer Trace for Test No (Accelerometer Located at Center of Gravity) Figure E5. Vehicle Longitudinal Accelerometer Trace for Test No (Accelerometer Located over Rear Axle) Figure E6. Vehicle Lateral Accelerometer Trace for Test No (Accelerometer Located over Rear Axle) Figure E7. Vehicle Vertical Accelerometer Trace for Test No (Accelerometer Located over Rear Axle) Figure E8. Vehicle Angular Displacements for Test No Figure E9. Vehicle Longitudinal Accelerometer Trace for Test No (Accelerometer Located at Center of Gravity) Figure E10. Vehicle Lateral Accelerometer Trace for Test No (Accelerometer Located at Center of Gravity) Figure E11. Vehicle Vertical Accelerometer Trace for Test No (Accelerometer Located at Center of Gravity) Figure E12. Vehicle Longitudinal Accelerometer Trace for Test No (Accelerometer Located over Rear Axle) Figure E13. Vehicle Lateral Accelerometer Trace for Test No (Accelerometer Located over Rear Axle) Figure E14. Vehicle Vertical Accelerometer Trace for Test No (Accelerometer Located over Rear Axle) Figure E15. Vehicle Angular Displacements for Test No Figure E16. Vehicle Longitudinal Accelerometer Trace for Test No (Accelerometer Located at Center of Gravity) Figure E17. Vehicle Lateral Accelerometer Trace for Test No (Accelerometer Located at Center of Gravity) Figure E18. Vehicle Vertical Accelerometer Trace for Test No (Accelerometer Located at Center of Gravity) Figure E19. Vehicle Longitudinal Accelerometer Trace for Test No (Accelerometer Located over Rear Axle) Figure E20. Vehicle Lateral Accelerometer Trace for Test No (Accelerometer Located over Rear Axle) Figure E21. Vehicle Vertical Accelerometer Trace for Test No (Accelerometer Located over Rear Axle) xi
14 LIST OF TABLES Page Table 2.1. Comparison of Tubular Rail Properties Table 9.1. Performance Evaluation Summary for MASH Test 3-20 on the TxDOT Median Barrier Gate Table 9.2. Performance Evaluation Summary for MASH Test 3-11 on the TxDOT Median Barrier Gate Table 9.3. Performance Evaluation Summary for MASH Test 3-21 on the TxDOT Median Barrier Gate Table C1. Exterior Crush Measurements for Test No Table C2. Occupant Compartment Measurements for Test No Table C3. Vehicle Parametric Measurements for Vertical CG for Test No Table C4. Exterior Crush Measurements for Test No Table C5. Occupant Compartment Measurements for Test No Table C6. Vehicle Parametric Measurements for Vertical CG for Test No Table C7. Exterior Crush Measurements for Test No Table C8. Occupant Compartment Measurements for Test No xii
15 CHAPTER 1. INTRODUCTION 1.1 INTRODUCTION This project was set up to provide Texas Department of Transportation (TxDOT) with a mechanism to quickly and effectively evaluate high priority issues related to roadside safety devices. Roadside safety devices shield motorists from roadside hazards such as non-traversable terrain and fixed objects. To maintain the desired level of safety for the motoring public, these safety devices must be designed to accommodate a variety of site conditions, placement locations, and a changing vehicle fleet. Periodically, there is a need to assess the compliance of existing safety devices with current vehicle testing criteria. Under this project, roadside safety issues are identified and prioritized for investigation. Each roadside safety issue is addressed with a separate work plan, and the results are summarized in an individual test report. 1.2 BACKGROUND Median barriers are commonly used to separate opposing lanes of traffic on divided highways. Concrete median barriers (CMBs) are often preferred on urban freeways with narrow medians. They are also used along heavily traveled highways to separate managed lanes from general purpose lanes. The rigid nature of concrete barriers results in little or no deflection and makes them relatively maintenance free. This reduces life-cycle cost, congestion due to lane closures, and exposure of maintenance personnel. However, long, continuous runs of CMBs limit access of emergency and maintenance vehicles to the other side of the roadway or a managed lane. Periodic openings in the barrier can provide needed cross-median access. However, the exposed barrier ends resulting from openings in a concrete median barrier pose an impact hazard for traffic. Even if the exposed barrier ends are safety treated with crash attenuators, median protection is lost along the length of the opening. Implementation of crashworthy median barrier gates at these locations can maintain the desired level of median protection for motorists while offering improved cross-median access for emergency and/or maintenance vehicles. A median barrier gate must be able to function as a median barrier to contain and redirect errant vehicles impacting along its length, be able to open and close, and be properly transitioned to the CMB on both ends. The Texas Transportation Institute (TTI) developed an emergency opening system (EOS) for the Texas State Department of Highways and Public Transportation (SDHPT) in the early 1980s (1). The system was comprised of two tubular steel beams mounted vertically on top of each other with a separation of 3 inches. A W-beam rail was attached to the face of the steel beams and terminated with W-beam end connectors to minimize snagging potential. The beams spanned 30 ft between free-standing CMB sections that were modified to transition from a New Jersey safety shape profile to a vertical face. Steel brackets with three 7/8-inch thick horizontal steel plates were anchored to the ends of the CMB sections using eight 1.5-inch diameter anchor bolts. The steel box beams were pinned to the brackets using a 1
16 3.25-inch diameter pin at each end. A jack and caster mechanism was used to raise the beams off of the horizontal bracket plates to permit it to be pushed open. Three full-scale crash tests were conducted to evaluate the impact performance of the system under NCHRP Report 230 (2). Two tests were performed to evaluate the transition of the steel beams to the CMB and the effects of vehicle snagging on the concrete barrier ends. One test involved an 1800-lb small passenger car impacting the EOS at a nominal speed of 60 mi/h and a nominal angle of 15 degrees. The other transition test involved a 4500-lb passenger sedan impacting the EOS at nominal speed of 60 mi/h and a nominal angle of 25 degrees. The impact point for both tests was 6 ft upstream of the downstream end of the system. Another test was conducted 6 ft upstream of the midpoint of the gate to evaluate the strength and maximum deflection of the steel beams. A 4500-lb passenger sedan impacted the EOS at nominal speed of 60 mi/h and a nominal angle of 25 degrees. The crash tests were successful, and the design was implemented by the SDHPT on selected projects along Interstate 45 (1). As traffic volumes have continued to increase, additional lanes have been added to increase capacity. This has resulted in narrower medians and the use of more concrete median barrier to separate traffic. The use of managed lanes has also increased significantly in recent years as another means of addressing growing congestion problems. Consequently, the need for median barrier gates to provide emergency and other authorized vehicles access to these lanes has also increased. TTI conducted further testing of both the original and a modified version of the EOS for the TxDOT under research project (3). The objective of the testing was to determine if the EOS complies with the new Manual for Assessing Safety Hardware (MASH) that was published by the American Association of State Highway and Transportation Officials (AASHTO) in October 2009 (4). MASH has superseded NCHRP Report 350 (5) as the recommended guidance for the safety performance evaluation of roadside safety features. MASH test designation 3-10 was performed on the original EOS barrier design with some minor modifications incorporated to reduce the potential for vehicle snagging. The horizontal plates on the steel end bracket were tapered, and the curb protruding from the end of the concrete parapet was constructed with a straight taper rather than a rounded nose. Figure 1.1 shows the test installation. The test conditions were a 2420 lb vehicle (denoted 1100C) impacting the gate 3.6 ft upstream of the end of the concrete parapet at a nominal impact speed and angle of 62 mi/h and 25 degrees, respectively. The 1100C test vehicle was contained and redirected. However, the gate failed to comply with MASH due to excessive occupant compartment deformation inside the vehicle (3). 2


17 Figure 1.1. Emergency Opening System (EOS). Several modifications were made to the end of the EOS to help mitigate the severe vehicle snagging. These changes were developed with retrofit of the existing design as a goal. The horizontal steel plates on the end brackets were replaced with tapered sections of 2 inch ¼-inch thick steel tubing. The ends of the tubular steel beams were cut off and tapered sections of tubing were added. These tubes tapered out 2 inches from the sides of the steel beams and then tapered back down to a width that was less than the width of the end of the concrete parapet to reduce snagging potential from a reverse direction impact. When assembled and installed, the tapered sections of tubing on the steel beams and end bracket overlapped each other to resemble 3
18 a finger joint. Other details of the median barrier gate, including the concrete parapet details, remained the same as in the previous tests. MASH test 3-10 was performed on the modified design. Once again, the modified gate did not perform acceptably due to excessive occupant compartment deformation inside the vehicle (3). Further research was needed to develop a median barrier gate that satisfies MASH impact performance criteria. 1.3 OBJECTIVES/SCOPE OF RESEARCH The objective of this research was to develop a median barrier gate that meets the Test Level 3 (TL-3) impact performance requirements of MASH. TxDOT requested that the gate be designed to accommodate reversible traffic flow on both sides of the median and that the gate be operable in both directions on each end. The research approach consisted of engineering analysis, finite element simulation, and full-scale crash testing. Three tests were performed to evaluate different aspects of the design. Test 3-11 evaluated the strength of the median barrier gate and its ability to function as a longitudinal barrier. Tests 3-20 and 3-21 assessed the transition of the median barrier gate to the adjacent concrete median barrier. Reported herein are details of the design and analysis of the TxDOT median barrier gate, descriptions of the tests performed, assessment of the test results, and implementation recommendations. 4
19 CHAPTER 2. MEDIAN BARRIER GATE DESIGN * A median barrier gate must function as a median barrier. Adequate strength is necessary to maintain continuity of protection between the sections of concrete median barrier it spans. The gate must be capable of containing and redirecting errant vehicles that impact along its length. Additionally, the stiffness of the gate must be properly transitioned to the adjacent concrete median barrier to prevent excessive vehicle snagging or vehicle pocketing into the more flexible gate in advance of the rigid barrier end. As the name implies, the median barrier gate must also function as a gate. It must be capable of being readily opened and closed from both directions on either end. The gate must be sufficiently light to permit manual operation and the components, including any wheels or casters must be durable and suitable for operation in a highway environment. Key design considerations that must be addressed include vehicle snagging on exposed CMB surfaces, structural adequacy to accommodate the increased impact severity of the design impact conditions prescribed by the AASHTO MASH, and stability of the pickup truck design test vehicle. 2.1 DESIGN CONSIDERATIONS Snagging As discussed in Chapter 1, the original EOS failed to comply with MASH. Exposed surfaces on the CMB to which the gate was attached permitted severe vehicle snagging to occur. The snagging forces led to excessive occupant compartment deformation inside the vehicle. Various design features were incorporated into the new median barrier gate to help mitigate snagging potential. The vertical spacing between the rail elements was eliminated. This not only reduced snagging, but also simplified fabrication. Stacking the two rails on top of one another eliminates the need for welded spacers. Thus, the rails can be individually galvanized and assembled with through bolts rather than being welded together with channel spacers and galvanized as a unit. Additionally, the width of the tubular rail members was increased to match the width of the end of the concrete parapet to which it is attached. This decreases the ability of the vehicle to make direct contact with the end of the concrete parapet. When making this change, it was important to account for the tolerance in the pinned connection and any lateral shift that the connection permits in the rail members. Too much shift could expose the edge of the rail members and result in snagging in a reverse direction impact. * The opinions/interpretations expressed in this section are outside the scope of TTI Proving Ground s A2LA accreditation. 5
20 Finally, the gap between the ends of the tubular rails and the concrete parapet was minimized. Some offset was required to accommodate the travel arc of the rails as they are opened and closed Rail Member Selection The selection of a rail member to serve as the beams in the median barrier gate involved consideration of several factors. The bending capacity of the rails had to be sufficient to contain and redirect a pickup truck impacting at the design test conditions specified in MASH. The EOS was connected to free-standing barrier ends when it was crash tested. The resulting lateral barrier deflection reduced the impact forces compared to a system connected to a rigid barrier. Furthermore, the heavier design test vehicle specified in MASH increased the impact severity by 13 percent compared to the nominal test conditions used to evaluate the EOS. Geometry of the rails was an important consideration in addition to strength. As mentioned in the previous section, it was desirable that the width of the rail match the width of the end of the concrete parapet to which it was attached to reduce snagging potential. Further, several constraints existed on the depth of the rail members. The combined height of the two rail members had to provide sufficient rail height to maintain vehicle stability during redirection while maintaining a clear opening from the ground to the bottom of the lower rail of no more than 11 inches. An empirical relationship between clear opening and post setback distance is presented in Section 13 Railings of the 2004 AASHTO LRFD Bridge Design Specifications (6). This guidance, which was based on crash test performance, recommends that the clear opening beneath a rail be no more than 11 inches when the post setback distance is zero. In the case of the median barrier gate, the post is the end of the concrete parapet and the setback distance is zero (i.e., the edge of the concrete parapet is aligned with the face of the tubular steel rail elements). Weight, cost, and availability were other important factors in the selection of a rail member for use in the median barrier gate. If the tubular steel rails were too heavy, it would make their use in a manually operated gate impractical. Some districts have found the cost of proprietary gate systems in the market to be prohibitive. One of the design objectives for the new median barrier gate was to keep its cost comparable to that of the existing EOS. The availability of tubular steel members in large sizes can be very limited. Selection of a rail size with very limited availability could adversely affect fabrication and delivery schedules. The researchers contacted several steel suppliers in Texas to obtain cost information and verify availability of the members being considered for use in the median barrier gate system. Table 2.1 shows the weight, cost, and plastic section modulus for the 8-inch 8-inch ½-inch steel tube used in the EOS and other sizes with possible application in the new median barrier gate. Tubular members with a width of 12 inches were selected to match the width of the concrete parapet needed to develop the strength of the barrier gate. The selection of member depth was a function of rail height. Stacked 12-inch 10-inch steel tubes could provide a maximum height of 31 inches when constrained by a maximum clear opening of 11 inches. The 12-inch 12-inch section could provide rail heights up to 35 inches. 6

21 Several thicknesses were available for these two sizes of steel tubes. The selection of a thickness is based on the required strength. Impact simulations were performed to aid in the selection of a rail height based on vehicle stability and a rail thickness based on strength. Table 2.1. Comparison of Tubular Rail Properties. 2.2 FINITE ELEMENT ANALYSIS Finite element models were developed for use in impact simulations to determine the optimal rail member size for the new median barrier gate. The objective was to meet strength and crashworthiness requirements while minimizing weight and cost. This was accomplished through a parametric study of the performance of different rail sizes and thicknesses. The LS-DYNA finite element code was used for the simulations (7). LS-DYNA is a general purpose explicit finite element code capable of simulating complex nonlinear dynamic impact problems. LS-DYNA incorporates state-of-the-art contact algorithms that can be used to model vehicular collisions with roadside objects and is widely used within the roadside safety research community for analyzing the impact performance of roadside safety hardware. The analyses were performed using the impact conditions of MASH test This test involves a 5000-lb pickup truck (denoted 2270P) impacting the barrier at a speed of 62 mi/h and an angle of 25 degrees. The impact point was approximately 4 ft upstream of the midpoint of the gate. The vehicle model used in the simulations was a 2007 Chevrolet Silverado 1500, 2-wheel drive (2WD), crew cab, short box, pickup truck (8). This model was developed by the National Crash Analysis Center (NCAC) under sponsorship of the Federal Highway Administration (FHWA) to represent the MASH design vehicle. An initial simulation was performed on the EOS. This system incorporates two 8-inch 8-inch ½-inch steel tubes vertically separated 3 inches and mounted at a height of 28.5 inches. The pickup truck exhibited a high roll angle as shown in Figure 2.1, and rollover was the predicted outcome. It was concluded from the results of this simulation that the rail height needed to be increased to improve stability of the pickup truck. 7
 available were selected for evaluation.")

22 Figure 2.1. Mid-Span Impact of Pickup Truck into EOS: (a) Initial Impact Conditions and (b) High Vehicle Roll Angle. Additional simulations were performed with the 12-inch 10-inch and 12-inch 12-inch steel tubes. The lightest sections (i.e., minimum thickness) available were selected for evaluation. The 12-inch 10-inch ¼-inch tube was evaluated at a height of 31 inches, which was the maximum height that could be achieved while maintaining a maximum clear opening of 11 inches below the rail. A 12-inch 12-inch ¼-inch steel tube was evaluated at heights of 34 inches and 36 inches. Figure 2.2 shows the pickup truck in relation to these rail configurations. As a consequence of these first findings, the barrier design process concentrated in investigating the impact response behavior of the device with alternative heights and sections. At first, various 12-inch wide tube sections were evaluated with different rail heights, as it is shown in Figure 2.2. Figure 2.2. Pickup Truck in Relation to Different Rail Geometries Chosen for Evaluation. As shown in Figure 2.3, the maximum dynamic deflection and permanent deflection was similar for all three rail configurations. Some localized buckling was observed in the 12-inch 12-inch ¼-inch tube. 8
, the vehicle roll angle for the 31 inch rail height was 35 degrees and still increasing. Vehicle rollover for this configuration is likely.")
23 Figure 2.3. Rail Deformation and Deflection Results. Figure 2.4 shows vehicle roll angle versus time. At time of termination of the simulation runs (0.55 seconds), the vehicle roll angle for the 31 inch rail height was 35 degrees and still increasing. Vehicle rollover for this configuration is likely. The vehicle was very stable in the impact with the 36 inch rail height, with a maximum roll angle of only 17 degrees. The vehicle was also successfully redirected in the simulation with the 34 inch rail height, but the vehicle had a higher roll angle of 27 degrees. Results showed that a 12-inch 10-inch tube section was not feasible as a rail member for the new median barrier gate. It was not capable of redirecting the pickup truck in a stable manner at its maximum height of 31 inches. Thus, further evaluation efforts focused on the 12-inch 12-inch steel tube sections. Two additional simulations were performed. One simulation evaluated vehicle stability associated with a 35 inch rail height. A 12-inch 12-inch -¼ inch tube was used in this simulation. The final simulation was performed with a thicker 12-inch 12-inch 5 16-inch tube at a height of 34 inches. The purpose of this simulation was to evaluate if the local buckling phenomenon observed in the simulation of the thin-walled tube affected vehicle stability. In other words, would the reduced deformation of a thicker, stronger tube improve vehicle stability and enable a lower mounting height to be utilized. 9
24 Figure 2.4. Vehicle Roll Angle Results. Figure 2.5 shows vehicle roll angle versus time for these additional simulations superimposed on the results from the previous simulations. Results from the two cases with different rail thickness (cases B and E) are similar in terms of vehicle roll angle, indicating that the increase in rail thickness did not affect vehicle stability. Consequently, there was no compelling reason to adopt a thicker, heavier, more costly rail section. It was concluded that the 12-inch 12-inch ¼-inch tube section was the optimal choice as a rail member for the new median barrier gate. Not only does it provide adequate strength to contain and redirect the pickup truck, it is a lighter and less expensive section than the 8-inch 8-inch ½-inch tube section used in the EOS (refer to Table 2.1). The rail height selected for the new median barrier gate was 35 inches. The pickup truck was stably redirected at this rail height as shown in Figure 2.5. Further, this is the maximum height that can be achieved with the stacked 12-inch 12-inch ¼-tubes when constrained by a maximum clear opening of 11 inches between the ground and bottom of the rail to reduce potential for vehicle snagging. The impact forces derived from the simulation of the selected rail configuration were used to size the connection pins, design the steel anchor bracket, and engineer the reinforcement in the concrete parapet ends. The design recommendations were reviewed and approved by TxDOT. Full-scale crash tests were performed to verify the impact performance of the median barrier gate. Details of the median barrier gate and crash tests are described in the following sections of this report. 10

25 Figure 2.5. Predicted Vehicle Roll Outcomes for Different Rail Configurations. 11
26
27 CHAPTER 3. MEDIAN BARRIER GATE DETAILS 3.1 TEST ARTICLE DESIGN AND CONSTRUCTION The total length of the installation was 50 ft-0 inch and was comprised of two 10 ft castin-place concrete barrier sections with a 30 ft long median barrier gate spanning between them. The concrete parapets were cast in place on top of a 6-inch thick reinforced concrete slab. They were tied to the slab using fourteen #5 stirrups spaced at 8 inches, followed by three #5 stirrups spaced at 4 inches at the gate end of the parapet. The concrete parapets transitioned from a 32-inch tall F-shape that was 9½ inches wide on top and 24 inches wide on bottom to a vertical wall that was 36½ inches tall and 12 inches wide over a distance of 5 ft. A 9½-inch tall curb protruded 16 inches out from the end of the concrete parapet to support the steel end bracket and steel connection pin. Horizontal reinforcement in the F-shape portion of the concrete parapets consisted of four pairs of #5 bars located 5 inches, 10 inches, 16 inches, and 30½ inches from the bottom of the parapet. These bars were symmetric about the vertical centerline of the parapet and followed its profile. In the transition section, the horizontal reinforcement included two pairs of #5 bars located 5 inches and 10 inches from the bottom of the parapet, and three pairs of #7 Richmond anchors located 14 inches, 20½ inches, and 25½ inches from the bottom of the parapet. Another set of #7 Richmond anchors were bent to follow the vertical taper of the transition and terminated at a height of 31 inches from the bottom of the parapet. The Richmond anchors formed a rectangular bolt pattern to which the steel anchor brackets were attached. The vertical reinforcement in the 5-ft transition section of the parapet near the gate connection was comprised of pairs of #5 U-bars that created closed stirrups spaced on 4-inch centers. This was followed by four more pairs of U-bars spaced at 8 inches. These U-bars were positioned between #5 open stirrups that were bent to match the profile of the F-shape barrier and spaced on 8-inch centers along the 5-ft length of F-shape barrier. A 16-inch long, 9½-inch high curb was cast on the inside face of each concrete parapet. A 9½-inch long section of 3-inch schedule 40 pipe that was cast inside the curb and reinforced with two #5 U-bars that extended out of the end of the parapet. The steel end brackets rested on top of the curb, and the connecting pins extended into the embedded pipe section. The median barrier gate itself was comprised of two 29-ft long, 12-inch 12-inch ¼-inch A500 Grade B steel tubes. The tubes were stacked vertically on top of one another and bolted together using three ¾-inch diameter 26-inch long ASTM A325 or equivalent grade bolts spaced on 80-inch centers. A 2½-inch schedule 40 pipe section was welded inside the ends of the tubes for the connecting pins. The ends of the tubes were reinforced with a tubing support bracket fabricated from ASTM A36 steel plate. The tubing support bracket slides into the end of the tubes around the pipe inserts and is secured in place using two ¾-inch diameter 26-inch long ASTM A325 or equivalent grade bolts. 13
28 Steel end brackets were fabricated from ASTM A36 steel plate. The vertical plate of the end bracket that connected to the end of the concrete parapet was 12 inches wide and 2 inches thick. Two 1-inch thick tapered horizontal steel plates were welded to the top and bottom of the end plate. A 2½-inch 3-inch slot was cut into each plate to accept the connecting pin. The end brackets were bolted to the ends of the concrete parapets using eight 1-inch diameter 3¾-inch long ASTM A325 high-strength bolts. The bolts threaded into the Richmond anchors that were cast inside the concrete parapet. The median barrier gate was connected to the end brackets using 2¼-inch diameter 32-inch long ASTM A36 cold rolled steel pins. The pins passed through the horizontal plates in the end bracket, the pipe sections inside the tubular steel rails, and inserted into the pipe sleeve embedded in the parapet curb. The median barrier was supported by a heavy duty 8-inch diameter swivel caster wheel. The wheel provides a mounting height of 35 inches to the top of the upper steel tube. Figure 3.1, Figure 3.2, and Appendix A show details of the median barrier gate installation. Figure 3.3 presents photographs of the completed test installation. 3.2 MATERIAL SPECIFICATIONS Concrete used for parapet portion of the barrier was specified to have a 28-day unconfined compressive strength of 3600 psi. All reinforcing steel was grade 60. The rails that comprised the gate were ASTM A500 Grade B steel tubes. The end bracket, tubing support bracket, and caster mounting plate were fabricated from ASTM A36 steel plate. The bolts used to connect the end bracket to the concrete parapet, secure the tubing support bracket inside the tubes, connect the tubes together, and connect the swivel caster were all ASTM A325 or equivalent grade. The connecting pin was specified to be ASTM A36 cold rolled steel. The handle on the pin was fabricated from ASTM A36 steel rod. Appendix B presents materials certifications related to the materials used to construct the median barrier gate. 3.3 SOIL CONDITIONS The test installation was installed on an existing concrete apron. 14


29 15 Figure 3.1. Details of the TxDOT Median Barrier Gate Installation.


30 16 Figure 3.2. Details of the TxDOT Median Barrier Gate.


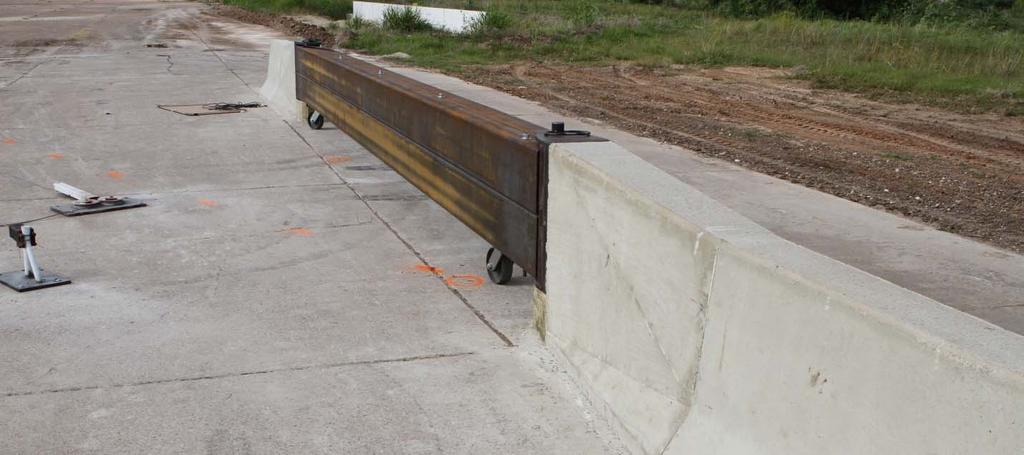
31 Figure 3.3. TxDOT Median Barrier Gate Installation before Testing. 17
32
33 CHAPTER 4. TEST REQUIREMENTS AND EVALUATION CRITERIA 4.1 CRASH TEST MATRIX Three full-scale crash tests were performed to evaluate the impact performance of the TxDOT median barrier gate and assess its compliance with MASH guidelines. The first test performed on the TxDOT median barrier gate was MASH test This test involves a 2420-lb passenger car (denoted 1100C) impacting the median barrier gate upstream of its connection to the rigid concrete parapet at a nominal speed of 62 mi/h and an angle of 25 degrees. The intent of this test is to evaluate the transition of the median barrier gate to the concrete parapet and assesses the potential for vehicle snagging. The critical impact point (CIP) for this test was determined to be 3.6 ft upstream of the concrete parapet end. The second test was MASH test This test involves a 5000 lb pickup truck (denoted 2270P) impacting the CIP of the length of need (LON) of the median barrier at a nominal impact speed and angle of 62 mi/h and 25 degrees, respectively. This is a strength test that verifies the structural adequacy of the median barrier gate for impacts involving light trucks and sport utility vehicles (SUVs). Vehicle stability is also a primary evaluation criterion for this test. The CIP for this test was selected to be 4.3 ft upstream of the midpoint of the median barrier gate. The third test performed on the median barrier gate was MASH test This test involves a 5000 lb pickup truck impacting the median barrier gate upstream of its connection to the rigid concrete parapet at a nominal speed of 62 mi/h and angle 25 degrees. The purpose of this test is to evaluate the strength of the connection between the median barrier gate and concrete parapet as well as the potential for vehicle snagging in the transition section. The critical impact point (CIP) for this test was determined to be 4.3 ft upstream of the concrete parapet end. The crash test and data analysis procedures followed for these tests were in accordance with guidelines presented in MASH. Chapter 4 presents brief descriptions of these procedures. 4.2 EVALUATION CRITERIA The crash tests were evaluated in accordance with the criteria presented in MASH. The performance of the TxDOT median barrier gate was judged on the basis of three factors: structural adequacy, occupant risk, and post impact vehicle trajectory. Structural adequacy criteria assess the median barrier gate s ability to contain and redirect the vehicle. Occupant risk criteria evaluate the potential risk of hazard to occupants in the impacting vehicle, and to some extent other traffic, pedestrians, or workers in construction zones, if applicable. Post impact vehicle trajectory is evaluated to determine potential for secondary impact with other vehicles or fixed objects that may create further risk of injury to occupants of the impacting vehicle and/or risk of injury to occupants in other vehicles. The appropriate safety evaluation criteria from table 5.1 of MASH were used to evaluate the crash tests reported herein. These criteria are described in further detail for each crash test. 19
34
35 CHAPTER 5. CRASH TEST PROCEDURES 5.1 TEST FACILITY The full-scale crash tests reported herein were performed at TTI Proving Ground. TTI Proving Ground is an International Standards Organization (ISO) accredited laboratory with American Association for Laboratory Accreditation (A2LA) Mechanical Testing certificate The full-scale crash tests were performed according to TTI Proving Ground quality procedures and according to the MASH guidelines and standards. The Texas Transportation Institute Proving Ground is a 2000-acre complex of research and training facilities located 10 miles northwest of the main campus of Texas A&M University. The site, formerly an Air Force base, has large expanses of concrete runways and parking aprons well suited for experimental research and testing. The site selected for construction and testing of the TxDOT median barrier gate evaluated under this project was on the surface of an out-ofservice concrete apron. The apron consists of unreinforced jointed-concrete pavement in 12.5-ft by 15-ft blocks nominally 8 to 12 inches deep. The apron is over 50 years old, and the joints have some displacement, but are otherwise flat and level. 5.2 VEHICLE TOW AND GUIDANCE PROCEDURES The test vehicle was towed into the median barrier gate using a steel cable guidance and reverse tow system. A steel cable for guiding the test vehicle was tensioned along the path, anchored at each end, and threaded through an attachment to the front wheel of the test vehicle. An additional steel cable was connected to the test vehicle, passed around a pulley near the impact point, through a pulley on the tow vehicle, and then anchored to the ground such that the tow vehicle moved away from the test site. A two-to-one speed ratio between the test and tow vehicle existed with this system. Just prior to impact with the installation, the test vehicle was released to be free-wheeling and unrestrained. The vehicle remained free-wheeling, i.e., no steering or braking inputs, until the vehicle cleared the immediate area of the test site, at which time brakes on the vehicle were activated to bring it to a safe and controlled stop. 5.3 DATA ACQUISITION SYSTEMS Vehicle Instrumentation and Data Processing The test vehicle was instrumented with a self-contained, on-board data acquisition system. The signal conditioning and acquisition system is a 16-channel, Tiny Data Acquisition System (TDAS) Pro produced by Diversified Technical Systems, Inc. The accelerometers, that measure the x, y, and z axis of vehicle acceleration, are strain gauge type with linear millivolt output proportional to acceleration. Angular rate sensors, measuring vehicle roll, pitch, and yaw rates, are ultra small size, solid state units designs for crash test service. The TDAS Pro 21
36 hardware and software conform to the latest SAE J211, Instrumentation for Impact Test. Each of the 16 channels is capable of providing precision amplification, scaling, and filtering based on transducer specifications and calibrations. During the test, data are recorded from each channel at a rate of 10,000 values per second with a resolution of one part in 65,536. Once recorded, the data are backed up inside the unit by internal batteries should the primary battery cable be severed. Initial contact of the pressure switch on the vehicle bumper provides a time zero mark as well as initiating the recording process. After each test, the data are downloaded from the TDAS Pro unit into a laptop computer at the test site. The raw data are then processed by the Test Risk Assessment Program (TRAP) software to produce detailed reports of the test results. Each of the TDAS Pro units is returned to the factory annually for complete recalibration. Accelerometers and rate transducers are also calibrated annually with traceability to the National Institute for Standards and Technology. TRAP uses the data from the TDAS Pro to compute occupant/compartment impact velocities, time of occupant/compartment impact after vehicle impact, and the highest 10- millisecond (ms) average ridedown acceleration. TRAP calculates change in vehicle velocity at the end of a given impulse period. In addition, maximum average accelerations over 50-ms intervals in each of the three directions are computed. For reporting purposes, the data from the vehicle-mounted accelerometers are filtered with a 60-Hz digital filter, and acceleration versus time curves for the longitudinal, lateral, and vertical directions are plotted using TRAP. TRAP uses the data from the yaw, pitch, and roll rate transducers to compute angular displacement in degrees at s intervals and then plots yaw, pitch, and roll versus time. These displacements are in reference to the vehicle-fixed coordinate system with the initial position and orientation of the vehicle-fixed coordinate systems being initial impact Anthropomorphic Dummy Instrumentation An Alderson Research Laboratories Hybrid II, 50 th percentile male anthropomorphic dummy, restrained with lap and shoulder belts, was placed in the driver s position of the 1100C vehicle. The dummy was uninstrumented. Use of a dummy in the 2270P vehicle is optional according to MASH, and there was no dummy used in the tests with the 2270P vehicle Photographic Instrumentation and Data Processing Photographic coverage of the test included three high-speed cameras: one overhead with a field of view perpendicular to the ground and directly over the impact point; one placed behind the installation at an angle; and a third placed to have a field of view parallel to and aligned with the installation at the downstream end. A flashbulb activated by pressure-sensitive tape switches was positioned on the impacting vehicle to indicate the instant of contact with the installation and was visible from each camera. The footage from these high-speed cameras was analyzed on a computer-linked motion analyzer to observe phenomena occurring during the collision and to obtain time-event, displacement, and angular data. A mini-dv camera and still cameras recorded and documented conditions of the test vehicle and median barrier gate installation before and after the test. 22
37 CHAPTER 6. CRASH TEST (MASH TEST 3-20) 6.1 TEST DESIGNATION AND ACTUAL IMPACT CONDITIONS MASH test 3-20 involves an 1100C vehicle weighing 2420 lb ±55 lb impacting the median barrier gate at a speed of 62.2 mi/h ±2.5 mi/h and an angle of 25 degrees ±1.5 degrees. The target impact point was 3.6 ft upstream of the end of the concrete parapet. The 2003 Kia Rio used in the test weighed 2424 lb and the actual impact speed and angle were 62.6 mi/h and 24.6 degrees, respectively. The actual impact point was 4.1 ft upstream of the end of the concrete parapet. 6.2 TEST VEHICLE A 2003 Kia Rio, shown in Figures 6.1 and 6.2, was used for the crash test. Test inertial weight of the vehicle was 2424 lb, and its gross static weight was 2592 lb. The height to the lower edge of the vehicle bumper was 8.50 inches, and it was inches to the upper edge of the bumper. Figure C1 in Appendix C gives additional dimensions and information on the vehicle. The vehicle was directed into the installation using the cable reverse tow and guidance system, and was released to be free-wheeling and unrestrained just prior to impact. 6.3 WEATHER CONDITIONS The test was performed on the morning of July 15, Eight days prior to test date, a total of 0.17 inch of rainfall was recorded. Weather conditions at the time of testing were as follows: wind speed: 6 mi/h; wind direction: 184 degrees with respect to the vehicle (vehicle was traveling in a northerly direction); temperature: 88 F, relative humidity: 66 percent. 6.4 TEST DESCRIPTION The 2003 Kia Rio, traveling at a speed of 62.6 mi/h, impacted the TxDOT median barrier gate 49 inches upstream of the end of the concrete parapet at an angle of 24.6 degrees. At approximately s after impact, the left front tire of the vehicle contacted the downstream caster wheel of the gate, and at s, the left front tire contacted the toe of the concrete barrier. The vehicle began to redirect s after impact. At s, the vehicle was traveling parallel with the median barrier gate and traveling at a speed of 45.6 mi/h. The rear of the vehicle contacted the barrier s after impact. At s, the vehicle lost contact with the barrier and was traveling at an exit speed and angle of 49.3 mi/h and 11.6 degrees, respectively. Brakes on the vehicle were applied at 1.4 s after impact, and the vehicle subsequently came to rest 183 ft downstream of impact and 27 ft toward traffic lanes. Figures D1 and D2 in Appendix D show sequential photographs of the test period. 23


38 Figure 6.1. Vehicle/Barrier Geometrics for Test No


39 Figure 6.2. Vehicle before Test No
40 6.5 DAMAGE TO TEST INSTALLATION Damage to the gate itself was only cosmetic and consisted of scuff marks as shown in Figures 6.3 and 6.4. The end of the upstream concrete parapet sustained two thin stress cracks on the field side. Minor concrete spalling was observed on the field side of the end of the downstream concrete parapet. No rebar was exposed and the spall was considered to be cosmetic in nature. The vehicle was in contact with the installation 10.2 ft. No measurable dynamic or permanent deflection was noted. 6.6 VEHICLE DAMAGE As shown in Figure 6.5, the vehicle sustained damage to the front and left side. The left front strut, strut tower, and A-post were deformed. Also damaged were the front bumper, hood, grill, radiator and support, left front fender, left front tire and wheel rim, left front door and glass, the left rear door, and left rear quarter panel. The roof was deformed and the windshield sustained stress cracking. Maximum exterior crush to the vehicle was 12.0 inches in the side plane at the left front corner at bumper height. Maximum occupant compartment deformation was 3.0 inches in the firewall area near the toe pan on the driver side. Figure 6.6 shows photographs of the interior of the vehicle. Exterior crush and occupant compartment deformation measurements are provided in Appendix C, Tables C1 and C OCCUPANT RISK FACTORS Data from the accelerometer, located at the vehicle center of gravity, were digitized for evaluation of occupant risk. In the longitudinal direction, the occupant impact velocity was 26.6 ft/s at s, the highest s occupant ridedown acceleration was 4.0 Gs from to s, and the maximum s average acceleration was 14.9 Gs between and s. In the lateral direction, the occupant impact velocity was 31.2 ft/s at s, the highest s occupant ridedown acceleration was 6.4 Gs from to s, and the maximum s average acceleration was 17.6 Gs between and s. Theoretical Head Impact Velocity (THIV) was 43.1 km/h or 12.0 m/s at s; Post-Impact Head Decelerations (PHD) was 7.1 Gs between and s; and Acceleration Severity Index (ASI) was 2.28 between and s. Figure 6.7 summarizes these data and other pertinent information from the test. Vehicle angular displacements and accelerations versus time traces are presented in Appendix E, Figures E1 through E7. 26

41 Figure 6.3. Vehicle/Barrier Positions after Test No


42 Figure 6.4. TxDOT Median Barrier Gate after Test No


43 Figure 6.5. Vehicle after Test No


44 Before Test After Test Figure 6.6. Interior of Vehicle for Test No

45 0.000 s s s s ft *not to scale 183 ft* General Information Test Agency... Test Standard Test No.... TTI Test No.... Date... Test Article Type... Name... Installation Length... Material or Key Elements... Soil Type and Condition... Test Vehicle Type/Designation... Make and Model... Curb... Test Inertial... Dummy... Gross Static... Texas Transportation Institute (TTI) MASH Test Median Barrier Gate TxDOT Median Barrier Gate 50 ft 12-inch x 12-inch x ¼-inch steel tubes connected to concrete parapets using 2¼-inch steel pins Anchored to existing concrete 1100C 2003 Kia Rio 2357 lb 2424 lb 168 lb 2592 lb Impact Conditions Speed... Angle... Location/Orientation... Exit Conditions Speed... Angle... Occupant Risk Values Impact Velocity Longitudinal... Lateral... Ridedown Accelerations Longitudinal... Lateral... THIV... PHD... ASI... Max s Average Longitudinal... Lateral... Vertical mi/h 24.6 degrees 4.1 ft upstrm of parapet end 49.3 mi/h 11.6 degrees 26.6 ft/s 31.2 ft/s -4.0 G 6.4 G 43.1 km/h 7.1 G G 17.6 G -3.9 G Post-Impact Trajectory Stopping Distance... Vehicle Stability Maximum Yaw Angle... Maximum Pitch Angle... Maximum Roll Angle... Vehicle Snagging... Vehicle Pocketing... Test Article Deflections Dynamic... Permanent... Working Width... Vehicle Damage VDS... CDC... Max. Exterior Deformation... OCDI... Max. Occupant Compartment Deformation... Figure 6.7. Summary of Results for MASH Test 3-20 on the TxDOT Median Barrier Gate. 183 ft dwnstr 27 ft twd traffic -184 degrees 10 degrees -12 degrees No No Nil Nil Nil 11LFQ6 11FDEW inches LS inches 31
46 6.8 ASSESSMENT OF TEST RESULTS An assessment of the test based on applicable MASH safety evaluation criteria is provided below Structural Adequacy A. Test article should contain and redirect the vehicle or bring the vehicle to a controlled stop; the vehicle should not penetrate, underride, or override the installation although controlled lateral deflection of the test article is acceptable. Results: The TxDOT median barrier gate contained and redirected the 1100C vehicle. The vehicle did not penetrate, underride, or over the installation. No measureable deformation was noted. (PASS) Occupant Risk D. Detached elements, fragments, or other debris from the test article should not penetrate or show potential for penetrating the occupant compartment, or present an undue hazard to other traffic, pedestrians, or personnel in a work zone. Deformation of, or intrusions into, the occupant compartment should not exceed limits set forth in Section 5.3 and Appendix E of MASH. (roof 102 mm (4.0 inches); windshield = 76 mm (3.0 inches); side windows = no shattering by test article structural member; wheel/foot well/toe pan 229 mm (9.0 inches); forward of A-pillar 305 mm (12.0 inches); front side door area above seat 229 mm (9.0 inches); front side door below seat 305 mm (12.0 inches); floor pan/transmission tunnel area 305 mm (12.0 inches)) Results: No detached elements, fragments, or other debris was present to penetrate or to show potential for penetrating the 1100C vehicle, nor to present hazard to others in the area. (PASS) Maximum occupant compartment deformation was 3.0 inches in the firewall area near the toe pan on the driver side. (PASS) F. The vehicle should remain upright during and after collision. The maximum roll and pitch angles are not to exceed 75 degrees. Results: The 1100C vehicle remained upright during and after the collision event. Maximum roll and pitch angles were 12 degrees and 10 degrees, respectively. (PASS) H. Occupant impact velocities should satisfy the following: Longitudinal and Lateral Occupant Impact Velocity Preferred Maximum 30 ft/s 40 ft/s 32
47 Results: Longitudinal occupant impact velocity was 26.6 ft/s, and lateral occupant impact velocity was 31.2 ft/s. (PASS) I. Occupant ridedown accelerations should satisfy the following: Longitudinal and Lateral Occupant Ridedown Accelerations Preferred Maximum 15.0 Gs Gs Results: Longitudinal ridedown acceleration was 4.0 G, and lateral ridedown acceleration was 6.4 G. (PASS) Vehicle Trajectory For redirective devices, the vehicle shall exit the barrier within the exit box. Result: The vehicle exited within the exit box. (PASS) 33
48
49 CHAPTER 7. CRASH TEST (MASH TEST 3-11) 7.1 TEST DESIGNATION AND ACTUAL IMPACT CONDITIONS MASH test 3-11 involves a 2270P vehicle weighing 5000 lb ±100 lb impacting the TxDOT median barrier gate at a speed of 62.2 mi/h ±2.5 mi/h and an angle of 25 degrees ±1.5 degrees. The target impact point was 4.3 ft upstream of the mid-span of the gate. The 2003 Dodge Ram 1500 Quad-Cab pickup used in the test weighed 5015 lb and the actual impact speed and angle were 63.1 mi/h and 24.7 degrees, respectively. The actual impact point was 4.8 ft upstream of the mid-span of the gate. 7.2 TEST VEHICLE A 2003 Dodge Ram 1500 Quad-Cab pickup, shown in Figures 7.1 and 7.2, was used for the crash test. Test inertia weight of the vehicle was 5015 lb, and its gross static weight was 5015 lb. The height to the lower edge of the vehicle bumper was 13.5 inches, and it was 26.0 inches to the upper edge of the bumper. The vertical center of gravity (CG) height of the pickup truck was measured to be inches. Figure C2 and Table C3 in Appendix C gives additional dimensions and information on the vehicle. The vehicle was directed into the installation using the cable reverse tow and guidance system, and was released to be freewheeling and unrestrained just prior to impact. 7.3 WEATHER CONDITIONS The test was performed on the morning of July 19, No rainfall was recorded for the 10 days prior to the test date. Weather conditions at the time of testing were as follows: wind speed: 6 mi/h; wind direction: 218 degrees with respect to the vehicle (vehicle was traveling in a northerly direction); temperature: 87 F, relative humidity: 69 percent. 7.4 TEST DESCRIPTION The 2003 Dodge Ram 1500 Quad-Cab pickup, traveling at a speed of 63.1 mi/h, impacted the TxDOT median barrier gate 4.8 ft upstream of the mid-span of the gate at an angle of 24.7 degrees. At approximately s, the left front tire contacted the gate and the left front tire aired out. The gate began to deflect s after impact, and the vehicle began to redirect at s. At s after impact, the vehicle was traveling parallel with the barrier at a speed of 55.1 mi/h. Maximum deflection of the barrier of 1.1 ft occurred s after impact. At s, the 2270P vehicle lost contact with the barrier and was traveling at an exit speed and angle of 50.1 mi/h and 12.2 degrees, respectively. Brakes on the vehicle were applied at 1.2 s after impact, and the vehicle subsequently came to rest 100 ft downstream of impact and 25 ft toward traffic lanes. Figures D3 and D4 in Appendix D show sequential photographs of the test period. 35


50 Figure 7.1. Vehicle/Gate Geometrics for Test No


51 Figure 7.2. Vehicle before Test No
52 7.5 DAMAGE TO TEST INSTALLATION The steel barrier gate sustained moderate damage as shown in Figures 7.3 and 7.4. The traffic faces of the steel tubes were deformed inward and the tubular rails were buckled near midspan. There was no damage noted to the concrete parapets. The vehicle was in contact with the installation a distance of 14.9 ft. Working width was 1.1 ft. Maximum dynamic deflection of the median barrier gate during the test was 1.1 ft, and maximum permanent deformation was 0.8 ft. 7.6 VEHICLE DAMAGE As shown in Figure 7.5, the majority of the damage sustained by the 2270P vehicle was to the left front corner and above the top wheel line along the left side. The left upper A-arm was deformed. Also damaged were the front bumper, grill, left front fender, left front tire and wheel rim, left front and rear doors, rear of the cab, left exterior bed, left rear wheel rim (no loss of air in the tire), rear bumper, and tailgate. Maximum exterior crush to the vehicle was 12.0 inches in the side plane in the left front corner at bumper height. Maximum occupant compartment deformation was 0.5 inches across the cab at hip level on the driver side. Figure 7.6 shows photographs of the interior of the vehicle. Exterior crush measurements and occupant compartment deformation are provided in Appendix C, Tables C4 and C OCCUPANT RISK FACTORS Data from the accelerometer, located at the vehicle center of gravity, were digitized for evaluation of occupant risk. In the longitudinal direction, the occupant impact velocity was 11.5 ft/s at s, the highest s occupant ridedown acceleration was 7.4 Gs from to s, and the maximum s average acceleration was 5.0 Gs between and s. In the lateral direction, the occupant impact velocity was 27.2 ft/s at s, the highest s occupant ridedown acceleration was 12.8 Gs from to s, and the maximum s average acceleration was 12.9 Gs between and s. THIV was 32.2 km/h or 8.9 m/s at s; PHD was 14.2 Gs between and s; and ASI was 1.49 between and s. Figure 7.7 summarizes these data and other pertinent information from the test. Vehicle angular displacements and accelerations versus time traces are presented in Appendix E, Figures E8 through E14. 38

53 Figure 7.3. Vehicle/Gate Positions after Test No


54 Figure 7.4. TxDOT Median Barrier Gate after Test No


55 Figure 7.5. Vehicle after Test No


56 Before Test After Test Figure 7.6. Interior of Vehicle for Test No

57 0.000 s s s s ft *not to scale 100 ft* General Information Test Agency... Test Standard Test No.... TTI Test No.... Date... Test Article Type... Name... Installation Length... Material or Key Elements... Soil Type and Condition... Test Vehicle Type/Designation... Make and Model... Curb... Test Inertial... Dummy... Gross Static... Texas Transportation Institute (TTI) MASH Test Median Barrier Gate TxDOT Median Barrier Gate 50.0 ft 12-inch x 12-inch x ¼-inch steel tubes connected to concrete parapets using 2¼-inch steel pins Anchored on existing concrete apron 2270P 2003 Dodge Ram 1500 Quad-Cab 4699 lb 5015 lb No dummy 5015 lb Impact Conditions Speed... Angle... Location/Orientation... Exit Conditions Speed... Angle... Occupant Risk Values Impact Velocity Longitudinal... Lateral... Ridedown Accelerations Longitudinal... Lateral... THIV... PHD... ASI... Max s Average Longitudinal... Lateral... Vertical mi/h 24.7 degrees 4.8 ft upstream of mid-span 50.1 mi/h 12.2 degrees 11.5 ft/s 27.2 ft/s -7.4 G 12.8 G 32.2 kmh 14.2 G G 12.9 G -3.7 G Post-Impact Trajectory Stopping Distance... Vehicle Stability Maximum Yaw Angle... Maximum Pitch Angle... Maximum Roll Angle... Vehicle Snagging... Vehicle Pocketing... Test Article Deflections Dynamic... Permanent... Working Width... Vehicle Damage VDS... CDC... Max. Exterior Deformation... OCDI... Max. Occupant Compartment Deformation... Figure 7.7. Summary of Results for MASH Test 3-11 on the TxDOT Median Barrier Gate. 100 ft dwnstrm 25 ft twd traffic 38 degrees 6 degrees -21 degrees No No 1.1 ft 0.8 ft 1.1 ft 11LFQ4 11FLEW inches LS inches 43
58 7.8 ASSESSMENT OF TEST RESULTS An assessment of the test based on the applicable MASH safety evaluation criteria is provided below Structural Adequacy A. Test article should contain and redirect the vehicle or bring the vehicle to a controlled stop; the vehicle should not penetrate, underride, or override the installation although controlled lateral deflection of the test article is acceptable. Results: The TxDOT median barrier gate contained and redirected the 2270P vehicle. The vehicle did not penetrate, underride, or override the installation. Maximum dynamic deflection during the test was 1.1 ft. (PASS) Occupant Risk D. Detached elements, fragments, or other debris from the test article should not penetrate or show potential for penetrating the occupant compartment, or present an undue hazard to other traffic, pedestrians, or personnel in a work zone. Deformation of, or intrusions into, the occupant compartment should not exceed limits set forth in Section 5.3 and Appendix E of MASH. (roof 102 mm (4.0 inches); windshield = 76 mm (3.0 inches); side windows = no shattering by test article structural member; wheel/foot well/toe pan 229 mm (9.0 inches); forward of A-pillar 305 mm (12.0 inches); front side door area above seat 229 mm (9.0 inches); front side door below seat 305 mm (12.0 inches); floor pan/transmission tunnel area 305 mm (12.0 inches)) Results: No detached elements, fragments, or other debris was present to penetrate or to show potential for penetrating the occupant compartment, nor to present undue hazard to others in the area. (PASS) Maximum occupant compartment deformation was 0.5 inches at the hip level on the driver side. (PASS) F. The vehicle should remain upright during and after collision. The maximum roll and pitch angles are not to exceed 75 degrees. Results: The 2270P vehicle remained upright during and after the collision event. Maximum roll and pitch angles were 21 degrees and 6 degrees, respectively. (PASS) H. Occupant impact velocities should satisfy the following: Longitudinal and Lateral Occupant Impact Velocity Preferred Maximum 30 ft/s 40 ft/s 44
59 Results: Longitudinal occupant impact velocity was 11.5 ft/s, and lateral occupant impact velocity was 27.2 ft/s. (PASS) I. Occupant ridedown accelerations should satisfy the following: Longitudinal and Lateral Occupant Ridedown Accelerations Preferred Maximum 15.0 Gs Gs Results: Longitudinal ridedown acceleration was 7.4 G, and lateral ridedown acceleration was 12.8 G. (PASS) Vehicle Trajectory For redirective devices, the vehicle shall exit the barrier within the exit box. Result: The 2270P vehicle exited within the exit box. (PASS) 45
60
61 CHAPTER 8. CRASH TEST (MASH TEST 3-21) 8.1 TEST DESIGNATION AND ACTUAL IMPACT CONDITIONS MASH test 3-21 involves a 2270P vehicle weighing 5000 lb ±100 lb impacting the TxDOT median barrier gate at a speed of 62.2 mi/h ±2.5 mi/h and an angle of 25 degrees ±1.5 degrees. The target impact point was 4.3 ft upstream of the end of the concrete parapet. The 2003 Dodge Ram 1500 Quad-Cab pickup used in the test weighed 5008 lb and the actual impact speed and angle were 63.1 mi/h and 25.5 degrees, respectively. The actual impact point was 3.9 ft upstream of the end of the concrete parapet. 8.2 TEST VEHICLE A 2003 Dodge Ram 1500 Quad-Cab pickup, shown in Figures 8.1 and 8.2, was used for the crash test. Test inertia weight of the vehicle was 5008 lb, and its gross static weight was 5008 lb. The height to the lower edge of the vehicle bumper was 13.5 inches, and it was 26.0 inches to the upper edge of the bumper. The vertical CG height of the pickup truck was inches. Figure C3 and Table C6 in Appendix C gives additional dimensions and information on the vehicle. The vehicle was directed into the installation using the cable reverse tow and guidance system, and was released to be free-wheeling and unrestrained just prior to impact. 8.3 WEATHER CONDITIONS The test was performed on the morning of July 21, Three days prior to the test date 0.41 inch of rain was recorded. Weather conditions at the time of testing were as follows: Wind speed: 5 mi/h; wind direction: 88 degrees with respect to the vehicle (vehicle was traveling in a southwesterly direction); temperature: 90 F, relative humidity: 65 percent. 8.4 TEST DESCRIPTION The 2003 Dodge Ram 1500 Quad-Cab pickup, traveling at a speed of 63.1 mi/h, impacted the TxDOT median barrier gate 3.9 ft upstream of the end of the concrete parapet at an angle of 25.5 degrees. At approximately 0.49 s after impact, the right front corner of the vehicle contacted the concrete parapet, and at s, the vehicle began to redirect. The caster wheel under the gate separated from the gate at s. At s after impact, the vehicle was traveling parallel with the barrier at a speed of 49.4 mi/h. The rear of the vehicle contacted the gate at s after impact, and then the concrete barrier at s. At s, the vehicle lost contact with the barrier and was traveling at an exit speed and angle of 46.3 mi/h and 6.6 degrees, respectively. Brakes on the vehicle were applied 1.2 s after impact, and the vehicle subsequently came to rest 190 ft downstream of impact with the rear toward the field side of the installation. Figures D5 and D6 in Appendix D show sequential photographs of the test period. 47


62 Figure 8.1. Vehicle/Gate Geometrics for Test No


63 Figure 8.2. Vehicle before Test No
64 8.5 DAMAGE TO TEST INSTALLATION The lower toe and end of the concrete barrier sustained significant damage, as shown in Figures 8.3 and 8.4. The concrete was cracked and fell away from the reinforcement in the toe of the concrete barrier and also from the field side of the barrier. The concrete on the end of the traffic face of the barrier was cracked, but remained in place. The end bracket was pushed toward the field side 1.0 inch. Tire marks were present along the traffic face of the steel gate and traffic face of the concrete barrier for a distance of ft. Working width, maximum dynamic deflection, and maximum permanent deformation were 1.25 inches. 8.6 VEHICLE DAMAGE Figure 8.5 shows the damage to the vehicle, which was mostly in the right front quarter in the side plane. The right upper and lower ball joint, right tie rod end, right frame rail, right front upper and lower A-arms, drive shaft, rear axle, and rear U-bolts and springs were damaged. Also damaged were the front bumper, hood, grill, right front fender, right front tire and wheel rim, right front and rear doors, right rear cab, right rear exterior bed, right rear tire and wheel rim, rear bumper, and tailgate. The windshield sustained stress cracks. Maximum exterior crush to the vehicle was 19 inches in the side plane at the right front corner at bumper height. Maximum occupant compartment deformation was 5.25 inches in the right firewall area near the toe pan on the front passenger side. Figure 8.6 shows photographs of the interior of the vehicle. Exterior crush and occupant compartment deformation are provided in Appendix C, Tables C7 and C OCCUPANT RISK FACTORS Data from the accelerometer, located at the vehicle center of gravity, were digitized for evaluation of occupant risk. In the longitudinal direction, the occupant impact velocity was 22.6 ft/s at s, the highest s occupant ridedown acceleration was 6.5 Gs from to s, and the maximum s average acceleration was 11.8 Gs between and s. In the lateral direction, the occupant impact velocity was 27.9 ft/s at s, the highest s occupant ridedown acceleration was 9.4 Gs from to s, and the maximum s average acceleration was 14.9 Gs between and s. THIV was 38.8 km/h or 10.8 m/s at s; PHD was 11.1 Gs between and s; and ASI was 1.92 between and s. Figure 8.7 summarizes these data and other pertinent information from the test. Vehicle angular displacements and accelerations versus time traces are presented in Appendix E, Figures E15 through E21. 50

65 Figure 8.3. Position of Vehicle/Gate after Test No

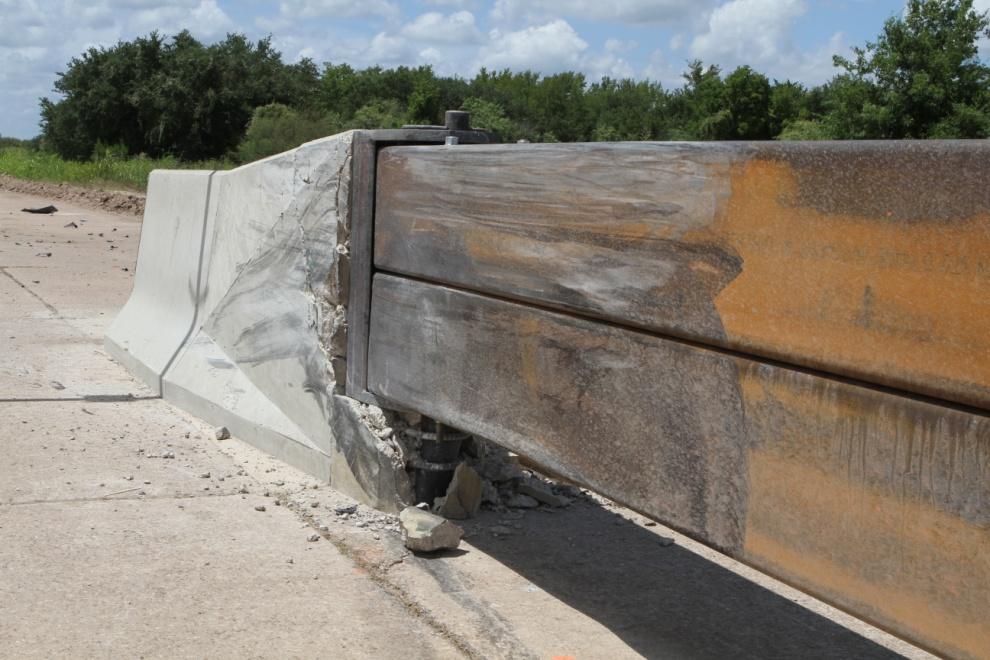
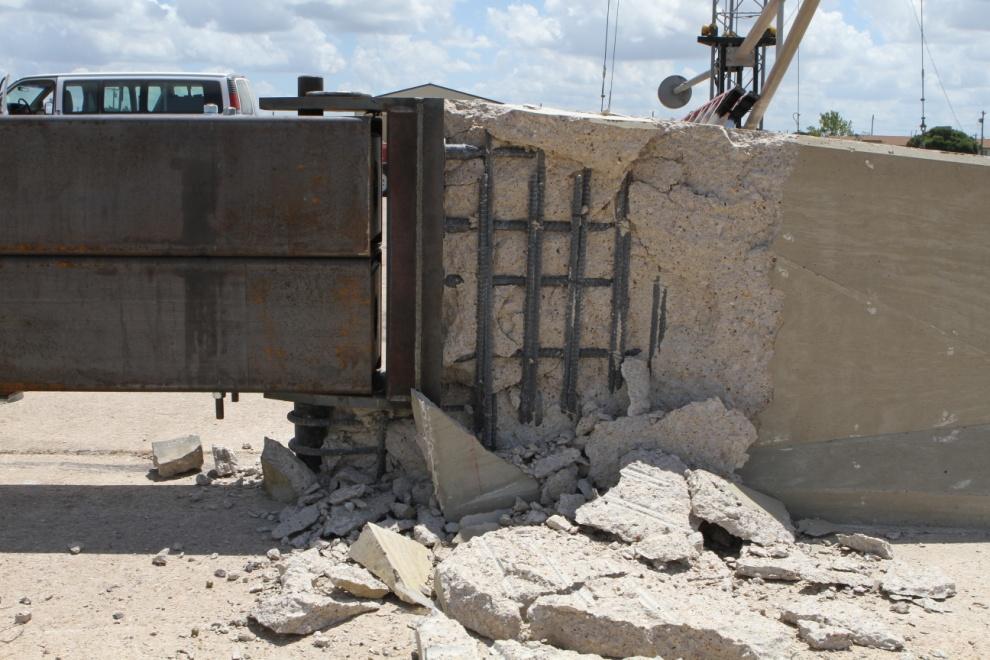
66 Rear of barrier Figure 8.4. Installation after Test No


67 Figure 8.5. Vehicle after Test No


68 Before Test After Test Figure 8.6. Interior of Vehicle for Test No


69 0.000 s s s s 25.5 *not to scale 190 ft* General Information Test Agency... Test Standard Test No.... TTI Test No.... Date... Test Article Type... Name... Installation Length... Material or Key Elements... Soil Type and Condition... Test Vehicle Type/Designation... Make and Model... Curb... Test Inertial... Dummy... Gross Static... Texas Transportation Institute (TTI) MASH Test Median Barrier Gate TxDOT Median Barrier Gate 50.0 ft 12-inch x 12-inch x ¼-inch steel tubes connected to concrete parapets using 2¼-inch steel pins Anchored on existing concrete apron 2270P 2003 Dodge Ram 1500 Quad-Cab 4765 lb 5008 lb No dummy 5008 lb Impact Conditions Speed... Angle... Location/Orientation... Exit Conditions Speed... Angle... Occupant Risk Values Impact Velocity Longitudinal... Lateral... Ridedown Accelerations Longitudinal... Lateral... THIV... PHD... ASI... Max s Average Longitudinal... Lateral... Vertical mi/h 25.5 degrees 46.3 mi/h 6.6 degrees 22.6 ft/s 27.9 ft/s -6.5 G -9.4 G 38.8 km/h 11.1 G G G -4.9 G Post-Impact Trajectory Stopping Distance... Vehicle Stability Maximum Yaw Angle... Maximum Pitch Angle... Maximum Roll Angle... Vehicle Snagging... Vehicle Pocketing... Test Article Deflections Dynamic... Permanent... Working Width... Vehicle Damage VDS... CDC... Max. Exterior Deformation... OCDI... Max. Occupant Compartment Deformation... Figure 8.7. Summary of Results for MASH Test 3-21 on the TxDOT Median Barrier Gate. 190 ft dwnstrm -32 degrees -8 degrees 20 degrees Yes No 1.25 inches 1.25 inches 1.25 inches 02RFQ5 02RFEW inches RF inches 55
70 8.8 ASSESSMENT OF TEST RESULTS An assessment of the test based on the applicable MASH safety evaluation criteria is provided below Structural Adequacy B. Test article should contain and redirect the vehicle or bring the vehicle to a controlled stop; the vehicle should not penetrate, underride, or override the installation although controlled lateral deflection of the test article is acceptable. Results: The TxDOT median barrier gate contained and redirected the 2270P vehicle. The vehicle did not penetrate, underride, or override the installation. Maximum dynamic deflection during the test was 1.25 inches. (PASS) Occupant Risk D. Detached elements, fragments, or other debris from the test article should not penetrate or show potential for penetrating the occupant compartment, or present an undue hazard to other traffic, pedestrians, or personnel in a work zone. Deformation of, or intrusions into, the occupant compartment should not exceed limits set forth in Section 5.3 and Appendix E of MASH. (roof 102 mm (4.0 inches); windshield = 76 mm (3.0 inches); side windows = no shattering by test article structural member; wheel/foot well/toe pan 229 mm (9.0 inches); forward of A-pillar 305 mm (12.0 inches); front side door area above seat 229 mm (9.0 inches); front side door below seat 305 mm (12.0 inches); floor pan/transmission tunnel area 305 mm (12.0 inches)) Results: The toe and end of the concrete parapet cracked and pieces of concrete fell off in small pieces. This debris did not penetrate or show potential to penetrate the occupant compartment, nor to present undue hazard to others in the area. (PASS) Maximum occupant compartment deformation was 5.25 inches in the firewall area near the toe pan on the front passenger side. (PASS) F. The vehicle should remain upright during and after collision. The maximum roll and pitch angles are not to exceed 75 degrees. Results: The 2270P vehicle remained upright during and after the collision event. Maximum roll and pitch angles were 20 degrees and 8 degrees, respectively. (PASS) 56
71 H. Occupant impact velocities should satisfy the following: Longitudinal and Lateral Occupant Impact Velocity Preferred Maximum 9.0 m/s (30 ft/s) 12.2 m/s (40 ft/s) Results: Longitudinal occupant impact velocity was 22.6 ft/s, and lateral occupant impact velocity was 27.9 ft/s. (PASS) I. Occupant ridedown accelerations should satisfy the following: Longitudinal and Lateral Occupant Ridedown Accelerations Preferred Maximum 15.0 Gs Gs Results: Longitudinal ridedown acceleration was 6.5 G, and lateral ridedown acceleration was 9.4 G. (PASS) Vehicle Trajectory For redirective devices, the vehicle shall exit the barrier within the exit box. Result: The vehicle exited within the exit box. (PASS) 57
72
73 CHAPTER 9. SUMMARY AND CONCLUSIONS Concrete median barrier is commonly used to separate opposing lanes of traffic on highspeed, urban freeways with high average daily traffic (ADT) and narrow medians. The resulting long, continuous runs of CMBs limit access of emergency and maintenance vehicles to the other side of the roadway or managed lane. Periodic implementation of crashworthy median barrier gates can maintain the desired level of median protection for motorists while offering improved cross-median access for authorized vehicles. TxDOT has been using an Emergency Opening System developed in the early 1980s to satisfy this need. The EOS was recently crash tested in accordance with the latest guidelines for the impact performance of roadside safety features contained in the AASHTO Manual for Assessing Safety Hardware. The gate failed to comply with MASH due to excessive occupant compartment deformation inside the vehicle. A new crashworthy median barrier gate was developed to replace the EOS and meet the continuing needs of TxDOT. Three crash tests were performed to evaluate the impact performance of different aspects of the median barrier gate. Test 3-11 evaluated the strength of the median barrier gate and its ability to function as a longitudinal barrier. Tests 3-20 and 3-21 assessed the transition of the median barrier gate to the adjacent concrete median barrier. As summarized in Table 9.1 through Table 9.3, the new median barrier gate passed all of the required evaluation criteria for each test and meets the Test Level 3 (TL-3) impact performance requirements of MASH. 59
74 Table 9.1. Performance Evaluation Summary for MASH Test 3-20 on the TxDOT Median Barrier Gate. Test Agency: Texas Transportation Institute Test No.: Test Date: MASH Test 3-10 Evaluation Criteria Test Results Assessment Structural Adequacy A. Test article should contain and redirect the vehicle or bring the vehicle to a controlled stop; the vehicle should not penetrate, underride, or override the installation although controlled lateral deflection of the test article is acceptable Occupant Risk D. Detached elements, fragments, or other debris from the test article should not penetrate or show potential for penetrating the occupant compartment, or present an undue hazard to other traffic, pedestrians, or personnel in a work zone. Deformations of, or intrusions into, the occupant compartment should not exceed limits set forth in Section 5.3 and Appendix E of MASH. F. The vehicle should remain upright during and after collision. The maximum roll and pitch angles are not to exceed 75 degrees. H. Longitudinal and lateral occupant impact velocities should fall below the preferred value of 30 ft/s, or at least below the maximum allowable value of 40 ft/s. I. Longitudinal and lateral occupant ridedown accelerations should fall below the preferred value of 15.0 Gs, or at least below the maximum allowable value of Gs. Vehicle Trajectory For redirective devices, the vehicle shall exit the barrier within the exit box. The TxDOT median barrier gate contained and redirected the 1100C vehicle. The vehicle did not penetrate, underride, or over the installation. No measureable deformation was noted. No detached elements, fragments, or other debris was present to penetrate or to show potential for penetrating the 1100C vehicle, nor to present hazard to others in the area. Maximum occupant compartment deformation was 3.0 inches in the firewall area near the toe pan on the driver side. The 1100C vehicle remained upright during and after the collision event. Maximum roll and pitch angles were 12 degrees and 10 degrees, respectively. Longitudinal occupant impact velocity was 26.6 ft/s, and lateral occupant impact velocity was 31.2 ft/s. Maximum longitudinal ridedown acceleration was 4.0 G, and maximum lateral ridedown acceleration was 6.4 G. The vehicle exited within the exit box. Pass Pass Pass Pass Pass Pass Pass 60
75 Table 9.2. Performance Evaluation Summary for MASH Test 3-11 on the TxDOT Median Barrier Gate. Test Agency: Texas Transportation Institute Test No.: Test Date: MASH Test 3-11 Evaluation Criteria Test Results Assessment Structural Adequacy A. Test article should contain and redirect the vehicle or bring the vehicle to a controlled stop; the vehicle should not penetrate, underride, or override the installation although controlled lateral deflection of the test article is acceptable Occupant Risk D. Detached elements, fragments, or other debris from the test article should not penetrate or show potential for penetrating the occupant compartment, or present an undue hazard to other traffic, pedestrians, or personnel in a work zone. Deformations of, or intrusions into, the occupant compartment should not exceed limits set forth in Section 5.3 and Appendix E of MASH. F. The vehicle should remain upright during and after collision. The maximum roll and pitch angles are not to exceed 75 degrees. H. Longitudinal and lateral occupant impact velocities should fall below the preferred value of 30 ft/s, or at least below the maximum allowable value of 40 ft/s. I. Longitudinal and lateral occupant ridedown accelerations should fall below the preferred value of 15.0 Gs, or at least below the maximum allowable value of Gs. Vehicle Trajectory For redirective devices, the vehicle shall exit the barrier within the exit box. The TxDOT median barrier gate contained and redirected the 2270P vehicle. The vehicle did not penetrate, underride, or override the installation. Maximum dynamic deflection during the test was 1.1 ft. No detached elements, fragments, or other debris was present to penetrate or to show potential for penetrating the occupant compartment, nor to present undue hazard to others in the area. Pass Pass Maximum occupant compartment deformation was 0.5 inches at the hip level on the driver side. Pass The 2270P vehicle remained upright during and after the collision event. Maximum roll and pitch angles were 21 degrees and 6 degrees, respectively. Longitudinal occupant impact velocity was 11.5 ft/s, and lateral occupant impact velocity was 27.2 ft/s. Longitudinal ridedown acceleration was 7.4 G, and lateral ridedown acceleration was 12.8 G. The 2270P vehicle exited within the exit box. Pass Pass Pass Pass 61
76 Table 9.3. Performance Evaluation Summary for MASH Test 3-21 on the TxDOT Median Barrier Gate. Test Agency: Texas Transportation Institute Test No.: Test Date: MASH Test 3-21 Evaluation Criteria Test Results Assessment Structural Adequacy A. Test article should contain and redirect the vehicle or bring the vehicle to a controlled stop; the vehicle should not penetrate, underride, or override the installation although controlled lateral deflection of the test article is acceptable Occupant Risk D. Detached elements, fragments, or other debris from the test article should not penetrate or show potential for penetrating the occupant compartment, or present an undue hazard to other traffic, pedestrians, or personnel in a work zone. Deformations of, or intrusions into, the occupant compartment should not exceed limits set forth in Section 5.3 and Appendix E of MASH. F. The vehicle should remain upright during and after collision. The maximum roll and pitch angles are not to exceed 75 degrees. H. Longitudinal and lateral occupant impact velocities should fall below the preferred value of 30 ft/s, or at least below the maximum allowable value of 40 ft/s. I. Longitudinal and lateral occupant ridedown accelerations should fall below the preferred value of 15.0 Gs, or at least below the maximum allowable value of Gs. Vehicle Trajectory For redirective devices, the vehicle shall exit the barrier within the exit box. The TxDOT median barrier gate contained and redirected the 2270P vehicle. The vehicle did not penetrate, underride, or override the installation. Maximum dynamic deflection during the test was 1.25 inches. The toe and end of the concrete parapet cracked and pieces of concrete fell off in small pieces. This debris did not penetrate or show potential to penetrate the occupant compartment, nor to present undue hazard to others in the area. Maximum occupant compartment deformation was 5.25 inches in the firewall area near the toe pan on the front passenger side. The 2270P vehicle remained upright during and after the collision event. Maximum roll and pitch angles Pass Pass Pass Pass were 20 degrees and 8 degrees, respectively. Longitudinal occupant impact velocity was 22.6 ft/s, and lateral occupant impact velocity was 27.9 ft/s. Pass Longitudinal ridedown acceleration was 6.5 G, and lateral ridedown acceleration was 9.4 G. Pass The vehicle exited within the exit box. Pass 62
77 CHAPTER 10. IMPLEMENTATION STATEMENT A new median barrier gate was developed and crash tested. The gate spans a 30-ft opening in a concrete median barrier. The gate consists of two vertically stacked 12-inch 12-inch ¼-inch steel tubes connected to steel and brackets with 2¼-inch diameter steel pins. The 35-inch rail height dramatically improves vehicle stability during impacts along the length of the gate. The 12-inch width of the tubular steel rails matches the width of the concrete parapet to which the gate is attached. This significantly reduces snagging potential on the end of the rigid concrete parapet. The weight and material cost of the tubular steel rails are less than those used in the existing EOS. Thus, it will be more economical to deploy and easier to operate. Testing with a prototype built for the full-scale crash test program demonstrated that the gate can be readily operated by one person. Bolted connections are used to reduce welding and decrease fabrication cost. It also permits the rail members and components to be individually galvanized and assembled rather than as a complete unit. The gate is designed to accommodate reversible traffic flow on both sides of the median and be operable in both directions on each end. This versatility enables the gate to be used in the median of a divided highway or as a means of separating main lanes from managed lanes with changing traffic direction. The heavy duty swivel caster wheels support the weight of the gate and eliminate the need for a jack to raise and lower the gate as part of the operation sequence. This will expedite operations for authorized vehicles requiring access through the gate. The median barrier gate satisfies MASH Test Level 3 (TL-3) impact performance criteria and is suitable for immediate implementation on Texas highways where cross-median access is desired. Statewide implementation can be achieved through the development and issuance of a standard detail sheet by the Design Division. A few design changes and options are recommended for consideration. It is recommended to increase the height of the fabricated steel end bracket by 1 inch. This modification will provide an additional ½-inch tolerance between the upper and lower horizontal plates and the tubular steel rail members for gate operation. A design option is the use of a fabricated steel curb rather than a concrete curb beneath the fabricated steel end bracket. Steel plates can be welded to the bottom of the lower horizontal plate of the end bracket to form a curb. If this option is used, the end bracket can be attached to the Richmond anchors and used as an end form for the concrete parapet. It eliminates the need to separately form, reinforce and cast a concrete curb, and eliminates the need for the pipe sleeve in the curb. The opinions/interpretations expressed in this section are outside the scope of TTI Proving Ground s A2LA accreditation. 63
78 Finally, an optional pry bar can be included in the design. During installation and operation, it is possible for the rails to shift longitudinally against the connecting pins. The resulting bearing pressure can make it difficult to extract the pin to operate the gate. A pry bar can be used between the end plate and the tubular steel rails to shift the rail and release the bearing pressure on the pin. This can be easily accomplished by a single person if necessary. The pry bar design option calls for the incorporation of a pry bar in the system that will be available to the gate operator if needed. The pry bar is stowed by inserting it vertically into prefabricated holes in the steel rails. Appendix F provides these recommended design changes and options. 64
79 REFERENCES 1. Strybos, J. W., Morgan, J. R., and Ross, Jr., H. E., Emergency Opening System for an Authorized Vehicle Lane, Research Report TX-84/105-1F, Texas Transportation Institute, College Station, TX, March Michie, J.D., Recommended Procedures for the Safety Performance Evaluation of Highway Features, NCHRP Report 230, Transportation Research Board, National Research Council, Washington, D.C., March Bligh, R. P. and Menges, W. L., Median Barrier Gate, Technical Memorandum # , Texas Transportation Institute, College Station, TX, June AASHTO, Manual for Assessing Safety Hardware, Washington, D.C., American Association of State Highway and Transportation Officials, Ross, Jr., H.E., Sicking, D.L., Zimmer, R.A. and Michie, J.D., Recommended Procedures for the Safety Performance Evaluation of Highway Features, National Cooperative Highway Research Program Report 350, Transportation Research Board, National Research Council, Washington, D.C., AASHTO, LRFD Bridge Design Specifications, Washington, D.C., American Association of State Highway and Transportation Officials, Hallquist, J. O., LS-DYNA: Keyword User s Manual, Version 971, Livermore Software Technology Corporation (LSTC), Livermore, California, National Crash Analysis Center (NCAC) website for Silverado truck model: Accessed February 7,
80

81 APPENDIX A. DETAILS OF THE TXDOT MEDIAN BARRIER GATE 67
82 68
83 69
84 70
85 71
86 72
87 73
88 74
89 75
90 76
91 77
92 78
93 79
94 80
95 81
96 82
97 APPENDIX B. CERTIFICATION DOCUMENTATION 83
98 84
99 85
100 86
101 87
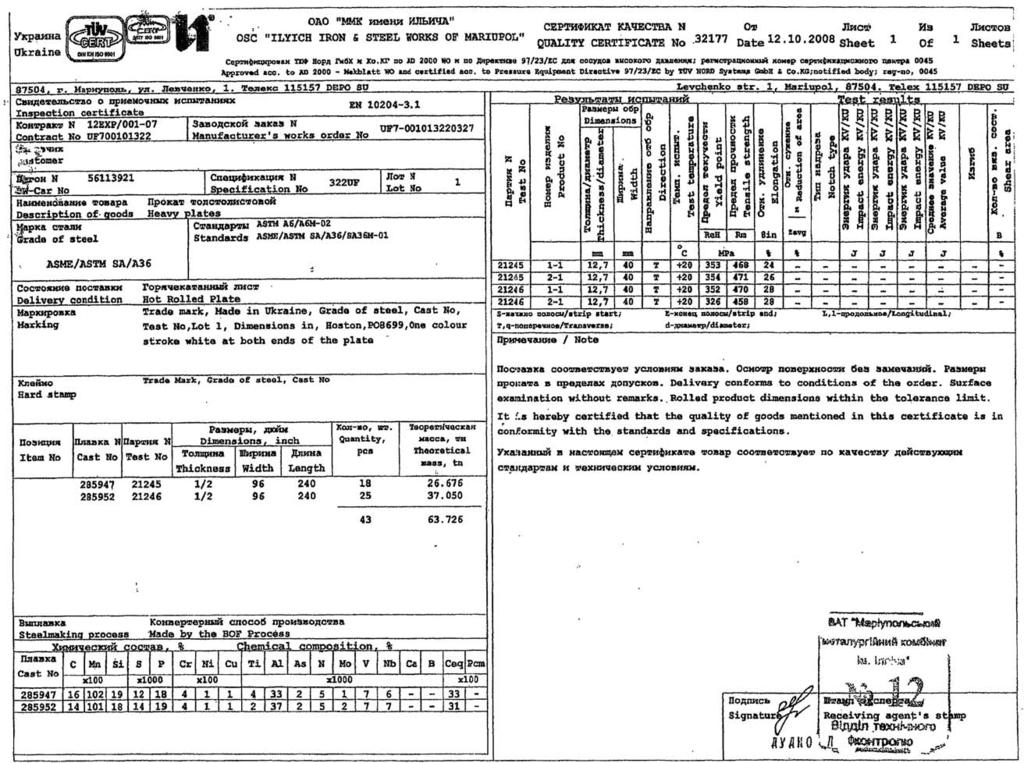
102 88
103 89
104 90
105 91
106 92
107 93
108
109 APPENDIX C. TEST VEHICLE PROPERTIES AND INFORMATION Date: Test No.: VIN No.: KNADC Year: 2003 Make: Kia Model: Rio Tire Inflation Pressure: 32 psi Odometer: Tire Size: P175/65R14 Describe any damage to the vehicle prior to test: Denotes accelerometer location. NOTES: Engine Type: 4 cylinder Engine CID: 1.6 Liter Transmission Type: Auto or x Manual x FWD RWD 4WD Optional Equipment: Dummy Data: Type: Mass: Seat Position: 50 th percentile male 168 lb Frt Passenger Seat Geometry: inches A F K P 3.25 U B G L Q V C H M R W D I 8.50 N S 8.62 X E J O T Wheel Center Ht Front Wheel Center Ht Rear RANGE LIMIT: A = 65 ±3 inches; C = 168 ±8 inches; E = 98 ±5 inches; F = 35 ±4 inches; G = 39 ±4 inches; O = 24 ±4 inches; M+N/2 = 56 ±2 inches GVWR Ratings: Mass: lb Curb Test Inertial Gross Static Front 1808 M front Allowable 1586 Allowable Back 1742 M rear Range 1006 Range = Total 3379 M Total ±55 lb ±55 lb Mass Distribution: lb LF: 780 RF: 721 LR: 445 RR: 478 Figure C1. Vehicle Properties for Test No
110 Table C1. Exterior Crush Measurements for Test No Date: Test No.: VIN No.: KNADC Year: 2003 Make: Kia Model: Rio VEHICLE CRUSH MEASUREMENT SHEET 1 Complete When Applicable End Damage Side Damage Undeformed end width Bowing: B1 X1 Corner shift: A1 End shift at frame (CDC) (check one) A2 < 4 inches 4 inches Bowing constant X 1 + X 2 2 B2 X2 = Note: Measure C 1 to C 6 from Driver to Passenger Side in Front or Rear Impacts Rear to Front in Side Impacts. Specific Impact Number Plane* of C-Measurements Direct Damage Width** (CDC) Max*** Crush Field L** C 1 C 2 C 3 C 4 C 5 C 6 ±D 1 Front plane at bumper ht Side plane at bumper ht Measurements recorded in inches 1 Table taken from National Accident Sampling System (NASS). *Identify the plane at which the C-measurements are taken (e.g., at bumper, above bumper, at sill, above sill, at beltline, etc.) or label adjustments (e.g., free space). Free space value is defined as the distance between the baseline and the original body contour taken at the individual C locations. This may include the following: bumper lead, bumper taper, side protrusion, side taper, etc. Record the value for each C-measurement and maximum crush. **Measure and document on the vehicle diagram the beginning or end of the direct damage width and field L (e.g., side damage with respect to undamaged axle). ***Measure and document on the vehicle diagram the location of the maximum crush. Note: Use as many lines/columns as necessary to describe each damage profile. 96
111 Table C2. Occupant Compartment Measurements for Test No Date: Test No.: VIN No.: KNADC Year: 2003 Make: Kia Model: Rio F G H I B1, B2, B3, B4, B5, B6 A1, A2, &A 3 D1, D2, & D3 C1, C2, & C3 B1 B2 B3 E1 & E2 *Lateral area across the cab from driver s side kickpanel to passenger s side kickpanel. OCCUPANT COMPARTMENT DEFORMATION MEASUREMENT Before After ( inches ) ( inches ) A A A B B B B B B C C C D D D E E F G H I J*
112 Date: Test No.: VIN No.: 1D7HA18N Year: 2003 Make: Dodge Model: Ram 1500 Quad-Cab Tire Size: 245/70R17 Tire Inflation Pressure: 35 psi Tread Type: Highway Odometer: Note any damage to the vehicle prior to test: Denotes accelerometer location. NOTES: Engine Type: Engine CID: V8 4.7 Liter Transmission Type: x Auto or Manual FWD x RWD 4WD Optional Equipment: Dummy Data: Type: Mass: Seat Position: No dummy Geometry: inches A F K P 3.00 U B G L Q V C H M R W D I 13.5 N S X E J O T Wheel Center Ht Front Wheel Well Clearance (FR) 6.12 Frame Ht (FR) Wheel Center Ht Rear Wheel Well Clearance (RR) Frame Ht (RR) RANGE LIMIT: A=78 ±2 inches; C=237 ±13 inches; E=148 ±12 inches; F=39 ±3 inches; G = > 28 inches; H = 63 ±4 inches; O=43 ±4 inches; M+N/2=67 ±1.5 inches GVWR Ratings: Mass: lb Curb Test Inertial Gross Static Front 3650 M front Allowable Allowable Back 3900 M rear Range Range Total 6650 M Total ±110 lb 5000 ±110 lb Mass Distribution: lb LF: 1380 RF: 1378 LR: 1110 RR: 1147 Figure C2. Vehicle Properties for Test No
113 Table C3. Vehicle Parametric Measurements for Vertical CG for Test No Date: Test No.: VIN: 1D7HA18N Year: 2003 Make: Dodge Model: Ra, 1500 Body Style: Quad Cab Mileage: Engine: 4.7 liter Transmission: Automatic Fuel Level: Empty Ballast: lb at front of bed (440 lb max) Tire Pressure: Front: 35 psi Rear: 35 psi Size: 245/70R17 Measured Vehicle Weights: (lb) LF: 1400 RF: 1334 Front Axle: 2734 LR: 1114 RR: 1122 Rear Axle: 2236 Left: 2514 Right: 2456 Total: ±110 lb allowed Wheel Base: inches Track: F: inches R: inches 148 ±12 inches allowed Track = (F+R)/2 = 67 ±1.5 inches allowed Center of Gravity, SAE J874 Suspension Method X: in Rear of Front Axle (63 ±4 inches allowed) Y: in Left - Right + of Vehicle Centerline Z: in Above Ground (minumum 28.0 inches allowed) Hood Height: inches Front Bumper Height: 26.0 inches 43 ±4 inches allowed Front Overhang: 39.0 inches Rear Bumper Height: inches 39 ±3 inches allowed Overall Length: inches 237 ±13 inches allowed 99
114 Table C4. Exterior Crush Measurements for Test No Date: Test No.: VIN No.: 1D7HA18N Year: 2003 Make: Dodge Model: Ram 1500 Quad-Cab VEHICLE CRUSH MEASUREMENT SHEET 1 Complete When Applicable End Damage Side Damage Undeformed end width Bowing: B1 X1 Corner shift: A1 End shift at frame (CDC) (check one) A2 < 4 inches 4 inches Bowing constant X 1 + X 2 2 B2 X2 = Note: Measure C 1 to C 6 from Driver to Passenger side in Front or Rear impacts Rear to Front in Side Impacts. Specific Impact Number Plane* of C-Measurements Direct Damage Width** (CDC) Max*** Crush Field L** C 1 C 2 C 3 C 4 C 5 C 6 ±D 1 Front plane at bumper ht Side plane at bumper ht Measurements recorded in inches mm 1 Table taken from National Accident Sampling System (NASS). *Identify the plane at which the C-measurements are taken (e.g., at bumper, above bumper, at sill, above sill, at beltline, etc.) or label adjustments (e.g., free space). Free space value is defined as the distance between the baseline and the original body contour taken at the individual C locations. This may include the following: bumper lead, bumper taper, side protrusion, side taper, etc. Record the value for each C-measurement and maximum crush. **Measure and document on the vehicle diagram the beginning or end of the direct damage width and field L (e.g., side damage with respect to undamaged axle). ***Measure and document on the vehicle diagram the location of the maximum crush. Note: Use as many lines/columns as necessary to describe each damage profile. 100
115 Table C5. Occupant Compartment Measurements for Test No Date: Test No.: VIN No.: 1D7HA18N Year: 2003 Make: Dodge Model: Ram 1500 Quad-Cab *Lateral area across the cab from driver s side kickpanel to passenger s side kickpanel. OCCUPANT COMPARTMENT DEFORMATION MEASUREMENT Before After ( inches ) ( inches ) A A A B B B B B B C C C D D D E E E E F G H I J*
116 Date: Test No.: VIN No.: 1D7HA18N Year: 2003 Make: Dodge Model: Ram 1500 Quad-Cab Tire Size: 245/70R17 Tire Inflation Pressure: 35 psi Tread Type: Highway Odometer: Note any damage to the vehicle prior to test: Denotes accelerometer location. NOTES: Engine Type: Engine CID: V8 4.7 Liter Transmission Type: x Auto or Manual FWD x RWD 4WD Optional Equipment: Dummy Data: Type: Mass: Seat Position: No dummy Geometry: inches A F K P 3.00 U B G L Q V C H M R W D I 13.5 N S X E J O T Wheel Center Ht Front Wheel Well Clearance (FR) 6.12 Frame Ht (FR) Wheel Center Ht Rear Wheel Well Clearance (RR) Frame Ht (RR) RANGE LIMIT: A=78 ±2 inches; C=237 ±13 inches; E=148 ±12 inches; F=39 ±3 inches; G = > 28 inches; H = 63 ±4 inches; O=43 ±4 inches; M+N/2=67 ±1.5 inches GVWR Ratings: Mass: lb Curb Test Inertial Gross Static Front 3650 M front Allowable Allowable Back 3900 M rear Range Range Total 6650 M Total ±110 lb 5000 ±110 lb Mass Distribution: lb LF: 1420 RF: 1366 LR: 1110 RR: 1112 Figure C3. Vehicle Properties for Test No
117 Table C6. Vehicle Parametric Measurements for Vertical CG for Test No Date: Test No.: VIN: 1D7HA18N Year: 2003 Make: Dodge Model: Ram 1500 Body Style: Quad Cab Mileage: Engine: 4.7 liter Transmission: Automatic Fuel Level: Empty Ballast: lb at front of bed (440 lb max) Tire Pressure: Front: psi Rear: psi Size: Measured Vehicle Weights: (lb) LF: 1408 RF: 1368 Front Axle: 2776 LR: 1132 RR: 1132 Rear Axle: 2264 Left: 2540 Right: 2500 Total: ±110 lb allowed Wheel Base: inches Track: F: inches R: inches 148 ±12 inches allowed Track = (F+R)/2 = 67 ±1.5 inches allowed Center of Gravity, SAE J874 Suspension Method X: in Rear of Front Axle (63 ±4 inches allowed) Y: in Left - Right + of Vehicle Centerline Z: in Above Ground (minumum 28.0 inches allowed) Hood Height: inches Front Bumper Height: 26.0 inches 43 ±4 inches allowed Front Overhang: 39.0 inches Rear Bumper Height: inches 39 ±3 inches allowed Overall Length: inches 237 ±13 inches allowed 103
118 Table C7. Exterior Crush Measurements for Test No Date: Test No.: VIN No.: 1D7HA18N Year: 2003 Make: Dodge Model: Ram 1500 Quad-Cab VEHICLE CRUSH MEASUREMENT SHEET 1 Complete When Applicable End Damage Side Damage Undeformed end width Bowing: B1 X1 Corner shift: A1 End shift at frame (CDC) (check one) A2 < 4 inches 4 inches Bowing constant X 1 + X 2 2 B2 X2 = Note: Measure C 1 to C 6 from Driver to Passenger side in Front or Rear impacts Rear to Front in Side Impacts. Specific Impact Number Plane* of C-Measurements Direct Damage Width** (CDC) Max*** Crush Field L** C 1 C 2 C 3 C 4 C 5 C 6 ±D 1 Front plane at bumper ht Side plane at bumper ht Measurements recorded in inches mm 1 Table taken from National Accident Sampling System (NASS). *Identify the plane at which the C-measurements are taken (e.g., at bumper, above bumper, at sill, above sill, at beltline, etc.) or label adjustments (e.g., free space). Free space value is defined as the distance between the baseline and the original body contour taken at the individual C locations. This may include the following: bumper lead, bumper taper, side protrusion, side taper, etc. Record the value for each C-measurement and maximum crush. **Measure and document on the vehicle diagram the beginning or end of the direct damage width and field L (e.g., side damage with respect to undamaged axle). ***Measure and document on the vehicle diagram the location of the maximum crush. Note: Use as many lines/columns as necessary to describe each damage profile. 104
119 Table C8. Occupant Compartment Measurements for Test No Date: Test No.: VIN No.: 1D7HA18N Year: 2003 Make: Dodge Model: Ram 1500 Quad-Cab *Lateral area across the cab from driver s side kickpanel to passenger s side kickpanel. OCCUPANT COMPARTMENT DEFORMATION MEASUREMENT Before After ( inches ) ( inches ) A A A B B B B B B C C C D D D E E E E F G H I J*
120


121 APPENDIX D. SEQUENTIAL PHOTOGRAPHS s s s s Figure D1. Sequential Photographs for Test No (Overhead and Frontal Views). 107


122 0.280s s s s Figure D1. Sequential Photographs for Test No (Overhead and Frontal Views) (Continued). 108

123 0.000 s s s s s s s s Figure D2. Sequential Photographs for Test No (Rear View). 109


124 0.000 s s s s Figure D3. Sequential Photographs for Test No (Overhead and Frontal Views). 110


125 0.280 s s s s Figure D3. Sequential Photographs for Test No (Overhead and Frontal Views) (Continued). 111


126 0.000 s s s s s s s s Figure D4. Sequential Photographs for Test No (Rear View). 112


127 0.000 s s s s Figure D5. Sequential Photographs for Test No (Overhead and Frontal Views). 113


128 0.280 s s s s Figure D5. Sequential Photographs for Test No (Overhead and Frontal Views) (Continued). 114


129 0.000 s s s s s s s s Figure D6. Sequential Photographs for Test No (Rear View). 115
130
131 APPENDIX E. VEHICLE ANGULAR DISPLACEMENTS AND ACCELERATIONS Roll, Pitch, and Yaw Angles Test Number: Test Standard Test No.: MASH Test 3-20 Test Date: July 15, 2010 Test Article: TxDOT Median Barrier Gate Test Vehicle: 2003 Kia Rio Inertial Mass: 2424 lb Gross Mass: 2592 lb Impact Speed: 62.6 mi/h Impact Angle: 24.6 degrees Roll Pitch Yaw Time (s) Axes are vehicle-fixed. Sequence for determining orientation: 1. Yaw. 2. Pitch. 3. Roll. Figure E1. Vehicle Angular Displacements for Test No Angles (degrees) 117
132 X Acceleration at CG Test Number: Test Standard Test No.: MASH Test 3-20 Test Date: July 15, 2010 Test Article: TxDOT Median Barrier Gate Test Vehicle: 2003 Kia Rio Inertial Mass: 2424 lb Gross Mass: 2592 lb Impact Speed: 62.6 mi/h Impact Angle: 24.6 degrees Time (s) Time of OIV ( sec) SAE Class 60 Filter 50-msec average Figure E2. Vehicle Longitudinal Accelerometer Trace for Test No (Accelerometer Located at Center of Gravity). Longitudinal Acceleration (G) 118
133 Y Acceleration at CG Test Number: Test Standard Test No.: MASH Test 3-20 Test Date: July 15, 2010 Test Article: TxDOT Median Barrier Gate Test Vehicle: 2003 Kia Rio Inertial Mass: 2424 lb Gross Mass: 2592 lb Impact Speed: 62.6 mi/h Impact Angle: 24.6 degrees Time (s) Time of OIV ( sec) SAE Class 60 Filter 50-msec average Figure E3. Vehicle Lateral Accelerometer Trace for Test No (Accelerometer Located at Center of Gravity). Lateral Acceleration (G) 119
134 Z Acceleration at CG Test Number: Test Standard Test No.: MASH Test 3-20 Test Date: July 15, 2010 Test Article: TxDOT Median Barrier Gate Test Vehicle: 2003 Kia Rio Inertial Mass: 2424 lb Gross Mass: 2592 lb Impact Speed: 62.6 mi/h Impact Angle: 24.6 degrees Time (s) SAE Class 60 Filter 50-msec average Figure E4. Vehicle Vertical Accelerometer Trace for Test No (Accelerometer Located at Center of Gravity). Vertical Acceleration (G) 120
135 X Acceleration over Rear Axle Test Number: Test Standard Test No.: MASH Test 3-20 Test Date: July 15, 2010 Test Article: TxDOT Median Barrier Gate Test Vehicle: 2003 Kia Rio Inertial Mass: 2424 lb Gross Mass: 2592 lb Impact Speed: 62.6 mi/h Impact Angle: 24.6 degrees Time (s) SAE Class 60 Filter 50-msec average Figure E5. Vehicle Longitudinal Accelerometer Trace for Test No (Accelerometer Located over Rear Axle). Longitudinal Acceleration (G) 121
136 Y Acceleration over Rear Axle Test Number: Test Standard Test No.: MASH Test 3-20 Test Date: July 15, 2010 Test Article: TxDOT Median Barrier Gate Test Vehicle: 2003 Kia Rio Inertial Mass: 2424 lb Gross Mass: 2592 lb Impact Speed: 62.6 mi/h Impact Angle: 24.6 degrees Time (s) SAE Class 60 Filter 50-msec average Figure E6. Vehicle Lateral Accelerometer Trace for Test No (Accelerometer Located over Rear Axle). Lateral Acceleration (G) 122
137 Z Acceleration over Rear Axle Test Number: Test Standard Test No.: MASH Test 3-20 Test Date: July 15, 2010 Test Article: TxDOT Median Barrier Gate Test Vehicle: 2003 Kia Rio Inertial Mass: 2424 lb Gross Mass: 2592 lb Impact Speed: 62.6 mi/h Impact Angle: 24.6 degrees Time (s) SAE Class 60 Filter 50-msec average Figure E7. Vehicle Vertical Accelerometer Trace for Test No (Accelerometer Located over Rear Axle). Vertical Acceleration (G) 123
138 Roll, Pitch, and Yaw Angles Test Number: Test Standard Test No.: MASH Test 3-11 Test Date: July 19, 2010 Test Article: TxDOT Median Barrier Gate Test Vehicle: 2003 Dodge Ram 1500 Pickup Inertial Mass: 5015 lb Gross Mass: 5015 lb Impact Speed: 63.1 mi/h Impact Angle: 24.7 degrees Roll Pitch Yaw Time (s) Axes are vehicle-fixed. Sequence for determining orientation: 1. Yaw. 2. Pitch. 3. Roll. Figure E8. Vehicle Angular Displacements for Test No Angles (degrees) 124
139 X Acceleration at CG Test Number: Test Standard Test No.: MASH Test 3-11 Test Date: July 19, 2010 Test Article: TxDOT Median Barrier Gate Test Vehicle: 2003 Dodge Ram 1500 Pickup Inertial Mass: 5015 lb Gross Mass: 5015 lb Impact Speed: 63.1 mi/h Impact Angle: 24.7 degrees Time (s) Time of OIV ( sec) SAE Class 60 Filter 50-msec average Figure E9. Vehicle Longitudinal Accelerometer Trace for Test No (Accelerometer Located at Center of Gravity). Longitudinal Acceleration (G) 125
140 Y Acceleration at CG Test Number: Test Standard Test No.: MASH Test 3-11 Test Date: July 19, 2010 Test Article: TxDOT Median Barrier Gate Test Vehicle: 2003 Dodge Ram 1500 Pickup Inertial Mass: 5015 lb Gross Mass: 5015 lb Impact Speed: 63.1 mi/h Impact Angle: 24.7 degrees Time (s) Time of OIV ( sec) SAE Class 60 Filter 50-msec average Figure E10. Vehicle Lateral Accelerometer Trace for Test No (Accelerometer Located at Center of Gravity). Lateral Acceleration (G) 126
141 Z Acceleration at CG Test Number: Test Standard Test No.: MASH Test 3-11 Test Date: July 19, 2010 Test Article: TxDOT Median Barrier Gate Test Vehicle: 2003 Dodge Ram 1500 Pickup Inertial Mass: 5015 lb Gross Mass: 5015 lb Impact Speed: 63.1 mi/h Impact Angle: 24.7 degrees Time (s) SAE Class 60 Filter 50-msec average Figure E11. Vehicle Vertical Accelerometer Trace for Test No (Accelerometer Located at Center of Gravity). Vertical Acceleration (G) 127
142 X Acceleration over Rear Axle Test Number: Test Standard Test No.: MASH Test 3-11 Test Date: July 19, 2010 Test Article: TxDOT Median Barrier Gate Test Vehicle: 2003 Dodge Ram 1500 Pickup Inertial Mass: 5015 lb Gross Mass: 5015 lb Impact Speed: 63.1 mi/h Impact Angle: 24.7 degrees Time (s) SAE Class 60 Filter 50-msec average Figure E12. Vehicle Longitudinal Accelerometer Trace for Test No (Accelerometer Located over Rear Axle). Longitudinal Acceleration (G) 128
143 Y Acceleration over Rear Axle Test Number: Test Standard Test No.: MASH Test 3-11 Test Date: July 19, 2010 Test Article: TxDOT Median Barrier Gate Test Vehicle: 2003 Dodge Ram 1500 Pickup Inertial Mass: 5015 lb Gross Mass: 5015 lb Impact Speed: 63.1 mi/h Impact Angle: 24.7 degrees Time (s) SAE Class 60 Filter 50-msec average Figure E13. Vehicle Lateral Accelerometer Trace for Test No (Accelerometer Located over Rear Axle). Lateral Acceleration (G) 129
144 Z Acceleration over Rear Axle Test Number: Test Standard Test No.: MASH Test 3-11 Test Date: July 19, 2010 Test Article: TxDOT Median Barrier Gate Test Vehicle: 2003 Dodge Ram 1500 Pickup Inertial Mass: 5015 lb Gross Mass: 5015 lb Impact Speed: 63.1 mi/h Impact Angle: 24.7 degrees Time (s) SAE Class 60 Filter 50-msec average Figure E14. Vehicle Vertical Accelerometer Trace for Test No (Accelerometer Located over Rear Axle). Vertical Acceleration (G) 130
145 Test Number: Test Standard Test No.: MASH Test 3-21 Test Date: July 21, 2010 Test Article: TxDOT Median Barrier Gate Test Vehicle: 2003 Dodge Ram 1500 Pickup Inertial Mass: 5008 lb Gross Mass: 5008 lb Impact Speed: 63.1 mi/h Impact Angle: 25.5 degrees Roll, Pitch, and Yaw Angles Roll Pitch Yaw Time (s) Axes are vehicle-fixed. Sequence for determining orientation: 4. Yaw. 5. Pitch. 6. Roll. Figure E15. Vehicle Angular Displacements for Test No Angles (degrees) 131
146 X Acceleration at CG Test Number: Test Standard Test No.: MASH Test 3-21 Test Date: July 21, 2010 Test Article: TxDOT Median Barrier Gate Test Vehicle: 2003 Dodge Ram 1500 Pickup Inertial Mass: 5008 lb Gross Mass: 5008 lb Impact Speed: 63.1 mi/h Impact Angle: 25.5 degrees Time (s) Time of OIV ( sec) SAE Class 60 Filter 50-msec average Figure E16. Vehicle Longitudinal Accelerometer Trace for Test No (Accelerometer Located at Center of Gravity). Longitudinal Acceleration (G) 132
147 Y Acceleration at CG Test Number: Test Standard Test No.: MASH Test 3-21 Test Date: July 21, 2010 Test Article: TxDOT Median Barrier Gate Test Vehicle: 2003 Dodge Ram 1500 Pickup Inertial Mass: 5008 lb Gross Mass: 5008 lb Impact Speed: 63.1 mi/h Impact Angle: 25.5 degrees Time (s) Time of OIV ( sec) SAE Class 60 Filter 50-msec average Figure E17. Vehicle Lateral Accelerometer Trace for Test No (Accelerometer Located at Center of Gravity). Lateral Acceleration (G) 133
148 Z Acceleration at CG Test Number: Test Standard Test No.: MASH Test 3-21 Test Date: July 21, 2010 Test Article: TxDOT Median Barrier Gate Test Vehicle: 2003 Dodge Ram 1500 Pickup Inertial Mass: 5008 lb Gross Mass: 5008 lb Impact Speed: 63.1 mi/h Impact Angle: 25.5 degrees Time (s) SAE Class 60 Filter 50-msec average Figure E18. Vehicle Vertical Accelerometer Trace for Test No (Accelerometer Located at Center of Gravity). Vertical Acceleration (G) 134
149 X Acceleration over Rear Axle Test Number: Test Standard Test No.: MASH Test 3-21 Test Date: July 21, 2010 Test Article: TxDOT Median Barrier Gate Test Vehicle: 2003 Dodge Ram 1500 Pickup Inertial Mass: 5008 lb Gross Mass: 5008 lb Impact Speed: 63.1 mi/h Impact Angle: 25.5 degrees Time (s) SAE Class 60 Filter 50-msec average Figure E19. Vehicle Longitudinal Accelerometer Trace for Test No (Accelerometer Located over Rear Axle). Longitudinal Acceleration (G) 135
150 Y Acceleration over Rear Axle Test Number: Test Standard Test No.: MASH Test 3-21 Test Date: July 21, 2010 Test Article: TxDOT Median Barrier Gate Test Vehicle: 2003 Dodge Ram 1500 Pickup Inertial Mass: 5008 lb Gross Mass: 5008 lb Impact Speed: 63.1 mi/h Impact Angle: 25.5 degrees Time (s) SAE Class 60 Filter 50-msec average Figure E20. Vehicle Lateral Accelerometer Trace for Test No (Accelerometer Located over Rear Axle). Lateral Acceleration (G) 136
151 Z Acceleration over Rear Axle Test Number: Test Standard Test No.: MASH Test 3-21 Test Date: July 21, 2010 Test Article: TxDOT Median Barrier Gate Test Vehicle: 2003 Dodge Ram 1500 Pickup Inertial Mass: 5008 lb Gross Mass: 5008 lb Impact Speed: 63.1 mi/h Impact Angle: 25.5 degrees Time (s) SAE Class 60 Filter 50-msec average Figure E21. Vehicle Vertical Accelerometer Trace for Test No (Accelerometer Located over Rear Axle). Vertical Acceleration (G) 137
152
153 APPENDIX F. RECOMMENDED MEDIAN BARRIER GATE DETAILS 139
154 140
155 141
156 142
157 143
158 144
159 145
160 146
161 147
162 148
163 149
164 150
165 151
166 152
167 153
168 154
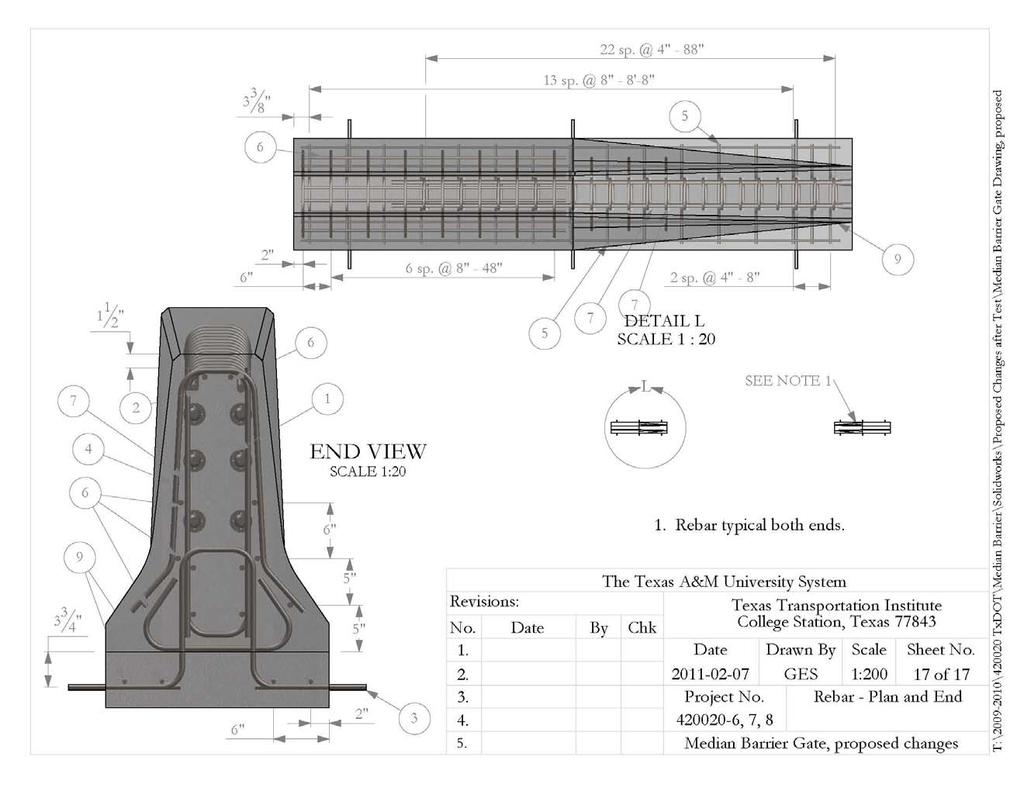
169 155
Evaluation of Barriers for Very High Speed Roadways
 TTI: 0-6071 Evaluation of Barriers for Very High Speed Roadways ISO 17025 Laboratory Testing Certificate # 2821.01 Crash testing performed at: TTI Proving Ground 3100 SH 47, Building 7091 Bryan, TX 77807
CRASH TEST AND EVALUATION OF 3-FT MOUNTING HEIGHT SIGN SUPPORT SYSTEM
 TTI: 9-1002-15 CRASH TEST AND EVALUATION OF 3-FT MOUNTING HEIGHT SIGN SUPPORT SYSTEM ISO 17025 Laboratory Testing Certificate # 2821.01 Crash testing performed at: TTI Proving Ground 3100 SH 47, Building
A MASH Compliant W-Beam Median Guardrail System
 0 0 0 0 0 A MASH Compliant W-Beam Median Guardrail System By A. Y. Abu-Odeh, R. P. Bligh, W. Odell, A. Meza, and W. L. Menges Submitted: July 0, 0 Word Count:, + ( figures + tables=,000) =, words Authors:
MASH Test 3-11 on the T131RC Bridge Rail
 TTI: 9-1002-12 MASH Test 3-11 on the T131RC Bridge Rail ISO 17025 Laboratory Testing Certificate # 2821.01 Crash testing performed at: TTI Proving Ground 3100 SH 47, Building 7091 Bryan, TX 77807 Test
Advances in Simulating Corrugated Beam Barriers under Vehicular Impact
 13 th International LS-DYNA Users Conference Session: Automotive Advances in Simulating Corrugated Beam Barriers under Vehicular Impact Akram Abu-Odeh Texas A&M Transportation Institute Abstract W-beam
Form DOT F (8-72) Texas Transportation Institute The Texas A&M University System College Station, Texas
 Texas Transportation Institute The Texas A&M University System College Station, Texas") 1. Report No. FHWA/TX-02/4162-1 Technical Report Documentation Page 2. Government Accession No. 3. Recipient's Catalog No. 4. Title and Subtitle EVALUATION OF TEXAS GRID-SLOT PORTABLE CONCRETE BARRIER
1. Report No. FHWA/TX-02/4162-1 Technical Report Documentation Page 2. Government Accession No. 3. Recipient's Catalog No. 4. Title and Subtitle EVALUATION OF TEXAS GRID-SLOT PORTABLE CONCRETE BARRIER
MASH TEST 3-11 OF THE TxDOT SINGLE SLOPE BRIDGE RAIL (TYPE SSTR) ON PAN-FORMED BRIDGE DECK
 ON PAN-FORMED BRIDGE DECK") TTI: 9-1002 MASH TEST 3-11 OF THE TxDOT SINGLE SLOPE BRIDGE RAIL (TYPE SSTR) ON PAN-FORMED BRIDGE DECK ISO 17025 Laboratory Testing Certificate # 2821.01 Crash testing performed at: TTI Proving Ground
TTI: 9-1002 MASH TEST 3-11 OF THE TxDOT SINGLE SLOPE BRIDGE RAIL (TYPE SSTR) ON PAN-FORMED BRIDGE DECK ISO 17025 Laboratory Testing Certificate # 2821.01 Crash testing performed at: TTI Proving Ground
MASH TEST 3-37 OF THE TxDOT 31-INCH W-BEAM DOWNSTREAM ANCHOR TERMINAL
 TTI: 9-1002 MASH TEST 3-37 OF THE TxDOT 31-INCH W-BEAM DOWNSTREAM ANCHOR TERMINAL ISO 17025 Laboratory Testing Certificate # 2821.01 Crash testing performed at: TTI Proving Ground 3100 SH 47, Building
MASH TEST 3-11 OF THE TxDOT T222 BRIDGE RAIL
 TTI: 9-1002-12 MASH TEST 3-11 OF THE TxDOT T222 BRIDGE RAIL ISO 17025 Laboratory Testing Certificate # 2821.01 Crash testing performed at: TTI Proving Ground 3100 SH 47, Building 7091 Bryan, TX 77807 Test
CRASH TEST AND EVALUATION OF TEMPORARY WOOD SIGN SUPPORT SYSTEM FOR LARGE GUIDE SIGNS
 TTI: 9-1002-15 CRASH TEST AND EVALUATION OF TEMPORARY WOOD SIGN SUPPORT SYSTEM FOR LARGE GUIDE SIGNS ISO 17025 Laboratory Testing Certificate # 2821.01 Crash testing performed at: TTI Proving Ground 3100
Texas Transportation Institute The Texas A&M University System College Station, Texas
 1. Report No. FHWA/TX-07/0-5527-1 4. Title and Subtitle DEVELOPMENT OF A LOW-PROFILE TO F-SHAPE TRANSITION BARRIER SEGMENT 2. Government Accession No. 3. Recipient's Catalog No. Technical Report Documentation
NCHRP Report 350 Crash Testing and Evaluation of the S-Square Mailbox System
 TTI: 0-5210 NCHRP Report 350 Crash Testing and Evaluation of the S-Square Mailbox System ISO 17025 Laboratory Testing Certificate # 2821.01 Crash testing performed at: TTI Proving Ground 3100 SH 47, Building
Manual for Assessing Safety Hardware
 American Association of State Highway and Transportation Officials Manual for Assessing Safety Hardware 2009 vii PREFACE Effective traffic barrier systems, end treatments, crash cushions, breakaway devices,
ASTM F TEST M30 ON THE RSS-3000 DROP BEAM SYSTEM
 Proving Ground Test Report No.: 510602-RSS3 Test Report Date: January 2014 ASTM F2656-07 TEST M30 ON THE RSS-3000 DROP BEAM SYSTEM by Dean C. Alberson, Ph.D., P.E. Research Engineer Michael S. Brackin,
Texas Transportation Institute The Texas A&M University System College Station, Texas
 1. Report No. FHWA/TX-05/9-8132-P7 4. Title and Subtitle TL-4 CRASH TESTING OF THE F411 BRIDGE RAIL 2. Government Accession No. 3. Recipient's Catalog No. 5. Report Date October 2004 Technical Report Documentation
MASH 2016 Implementation: What, When and Why
 MASH 2016 Implementation: What, When and Why Roger P. Bligh, Ph.D., P.E. Senior Research Engineer Texas A&M Transportation Institute June 7, 2016 2016 Traffic Safety Conference College Station, Texas Outline
MASH08 TEST 3-11 OF THE ROCKINGHAM PRECAST CONCRETE BARRIER
 Proving Ground Report No. 400001-RPC4 Report Date: July 2009 MASH08 TEST 3-11 OF THE ROCKINGHAM PRECAST CONCRETE BARRIER by C. Eugene Buth, P.E. Research Engineer William F. Williams, P.E. Assistant Research
OPTIMIZATION OF THRIE BEAM TERMINAL END SHOE CONNECTION
 TTI: 9-1002-15 OPTIMIZATION OF THRIE BEAM TERMINAL END SHOE CONNECTION ISO 17025 Laboratory Testing Certificate # 2821.01 Pendulum testing performed at: TTI Proving Ground 3100 SH 47, Building 7091 Bryan,
MASH TEST 3-10 ON 31-INCH W-BEAM GUARDRAIL WITH STANDARD OFFSET BLOCKS
 TTI: 9-1002 MASH TEST 3-10 ON 31-INCH W-BEAM GUARDRAIL WITH STANDARD OFFSET BLOCKS ISO 17025 Laboratory Testing Certificate # 2821.01 Crash testing performed at: TTI Proving Ground 3100 SH 47, Building
TEXAS TRANSPORTATION INSTITUTE THE TEXAS A & M UNIVERSITY SYSTEM COLLEGE STATION, TEXAS 77843
 NCHRP REPORT 350 ASSESSMENT OF EXISTING ROADSIDE SAFETY HARDWARE by C. Eugene Buth, P.E. Senior Research Engineer Wanda L. Menges Associate Research Specialist and Sandra K. Schoeneman Research Associate
MASH TEST 3-21 ON TL-3 THRIE BEAM TRANSITION WITHOUT CURB
 TTI: 9-1002-12 MASH TEST 3-21 ON TL-3 THRIE BEAM TRANSITION WITHOUT CURB ISO 17025 Laboratory Testing Certificate # 2821.01 Crash testing performed at: TTI Proving Ground 3100 SH 47, Building 7091 Bryan,
Technical Report Documentation Page Form DOT F (8-72) Reproduction of completed page authorized
 Reproduction of completed page authorized") 1. Report No. FHWA/TX-05/0-4162-3 4. Title and Subtitle 2. Government Accession No. 3. Recipient's Catalog No. DEVELOPMENT OF LOW-DEFLECTION PRECAST CONCRETE ARRIER 5. Report Date January 2005 Technical
1. Report No. FHWA/TX-05/0-4162-3 4. Title and Subtitle 2. Government Accession No. 3. Recipient's Catalog No. DEVELOPMENT OF LOW-DEFLECTION PRECAST CONCRETE ARRIER 5. Report Date January 2005 Technical
Technical Report Documentation Page 2. Government Accession No. 3. Recipient's Catalog No. 1. Report No. FHWA/TX-09/
 1. Report No. FHWA/TX-09/0-6071-1 4. Title and Subtitle ANALYSIS OF ROADSIDE SAFETY DEVICES FOR USE ON VERY HIGH-SPEED ROADWAYS Technical Report Documentation Page 2. Government Accession No. 3. Recipient's
Evaluation and Design of ODOT s Type 5 Guardrail with Tubular Backup
 Evaluation and Design of ODOT s Type 5 Guardrail with Tubular Backup Draft Final Report Chuck A. Plaxico, Ph.D. James C. Kennedy, Jr., Ph.D. Charles R. Miele, P.E. for the Ohio Department of Transportation
Crash Testing Growth Common Roadside Hardware Systems Draft FHWA and AASHTO Requirements for Implementing MASH 2015
 64 th Annual Illinois Traffic Safety and Engineering Conference October 14, 2015 Crash Testing Growth Common Roadside Hardware Systems Draft FHWA and AASHTO Requirements for Implementing MASH 2015 1 https://www.youtube.com/watch?feature
NCHRP Report 350 Test 4-12 of the Modified Thrie Beam Guardrail
 NCHRP Report 350 Test 4-12 of the Modified Thrie Beam Guardrail PUBLICATION NO. FHWA-RD-99-065 DECEMBER 1999 Research, Development, and Technology Turner-Fairbank Highway Research Center 6300 Georgetown
Universal TAU-IIR Redirective, Non-Gating, Crash Cushion
 TB 110927 Rev. 0 Page 1 of 5 Product Specification Universal TAU-IIR Redirective, Non-Gating, Crash Cushion I. General The Universal TAU-IIR system is a Redirective, Non-Gating Crash Cushion in accordance
Product Specification. ABSORB 350 TM TL-2 Non-Redirective, Gating, Crash Cushion Applied to Quickchange Moveable Barrier
 TB 000612 Rev. 0 Page 1 of 9 Product Specification ABSORB 350 TM TL-2 Non-Redirective, Gating, Crash Cushion Applied to Quickchange Moveable Barrier I. General The ABSORB 350 TM TL-2 System is a Non-Redirective,
Texas Transportation Institute The Texas A&M University System College Station, Texas
 2. Government Accession No. 3. Recipient's Catalog No. 1. Report No. FHWA/TX-03/0-4138-3 4. Title and Subtitle PERFORMANCE OF THE TXDOT T202 (MOD) BRIDGE RAIL REINFORCED WITH FIBER REINFORCED POLYMER BARS
VULCAN BARRIER TL-3 GENERAL SPECIFICATIONS
 VULCAN BARRIER TL-3 GENERAL SPECIFICATIONS I. GENERAL A. The VULCAN BARRIER TL-3 (VULCAN TL-3) shall be a highly portable and crashworthy longitudinal barrier especially suited for use as a temporary barrier
Texas Transportation Institute The Texas A&M University System College Station, Texas
 1. Report No. FHWA/TX-04/9-8132-1 4. Title and Subtitle TESTING AND EVALUATION OF THE FLORIDA JERSEY SAFETY SHAPED BRIDGE RAIL 2. Government Accession No. 3. Recipient's Catalog No. 5. Report Date February
DISTRIBUTION: Electronic Recipients List TRANSMITTAL LETTER NO. (15-01) MINNESOTA DEPARTMENT OF TRANSPORTATION. MANUAL: Road Design English Manual
 MINNESOTA DEPARTMENT OF TRANSPORTATION. MANUAL: Road Design English Manual") DISTRIBUTION: Electronic Recipients List MINNESOTA DEPARTMENT OF TRANSPORTATION DEVELOPED BY: Design Standards Unit ISSUED BY: Office of Project Management and Technical Support TRANSMITTAL LETTER NO.
DISTRIBUTION: Electronic Recipients List MINNESOTA DEPARTMENT OF TRANSPORTATION DEVELOPED BY: Design Standards Unit ISSUED BY: Office of Project Management and Technical Support TRANSMITTAL LETTER NO.
Development of a Finite Element Model of a Motorcycle
 Development of a Finite Element Model of a Motorcycle N. Schulz, C. Silvestri Dobrovolny and S. Hurlebaus Texas A&M Transportation Institute Abstract Over the past years, extensive research efforts have
1962: HRCS Circular 482 one-page document, specified vehicle mass, impact speed, and approach angle for crash tests.
 1 2 3 1962: HRCS Circular 482 one-page document, specified vehicle mass, impact speed, and approach angle for crash tests. 1973: NCHRP Report 153 16-page document, based on technical input from 70+ individuals
VULCAN BARRIER TL-3 GENERAL SPECIFICATIONS
 VULCAN BARRIER TL-3 GENERAL SPECIFICATIONS I. GENERAL A. The VULCAN BARRIER TL-3 (VULCAN TL-3) shall be a highly portable and crashworthy longitudinal barrier especially suited for use as a temporary barrier
BarrierGate. General Specifications. Manual Operations General Specifications
 BarrierGate General Specifications Manual Operations General Specifications BarrierGate GENERAL SPECIFICATIONS I. GENERAL A. The BarrierGate system (the gate) shall be designed and manufactured by Energy
Development and Validation of a Finite Element Model of an Energy-absorbing Guardrail End Terminal
 Development and Validation of a Finite Element Model of an Energy-absorbing Guardrail End Terminal Yunzhu Meng 1, Costin Untaroiu 1 1 Department of Biomedical Engineering and Virginia Tech, Blacksburg,
SUMMARY CHANGES FOR NCHRP REPORT 350 GUIDELINES [NCHRP (02)] Keith A. Cota, Chairman Technical Committee on Roadside Safety June 14, 2007
![SUMMARY CHANGES FOR NCHRP REPORT 350 GUIDELINES [NCHRP (02)] Keith A. Cota, Chairman Technical Committee on Roadside Safety June 14, 2007](/thumbs/87/97351925.jpg "SUMMARY CHANGES FOR NCHRP REPORT 350 GUIDELINES [NCHRP (02)] Keith A. Cota, Chairman Technical Committee on Roadside Safety June 14, 2007") SUMMARY CHANGES FOR NCHRP REPORT 350 GUIDELINES [NCHRP 22-14 (02)] Keith A. Cota, Chairman Technical Committee on Roadside Safety June 14, 2007 BACKGROUND Circular 482 (1962) First full scale crash test
SUMMARY CHANGES FOR NCHRP REPORT 350 GUIDELINES [NCHRP 22-14 (02)] Keith A. Cota, Chairman Technical Committee on Roadside Safety June 14, 2007 BACKGROUND Circular 482 (1962) First full scale crash test
TEXAS TRANSPORTATION INSTITUTE THE TEXAS A & M UNIVERSITY SYSTEM COLLEGE STATION, TEXAS 77843
 NCHRP REPORT 350 TEST 3-11 OF THE NEW YORK DOT PORTABLE CONCRETE BARRIER WITH I-BEAM CONNECTION (RETEST) by Roger P. Bligh, P.E. Assistant Research Engineer Wanda L. Menges Associate Research Specialist
February 8, In Reply Refer To: HSSD/CC-104
 February 8, 2008 200 New Jersey Avenue, SE. Washington, DC 20590 In Reply Refer To: HSSD/CC-04 Barry D. Stephens, P.E. Sr. Vice President Engineering Energy Absorption Systems, Inc. 367 Cincinnati Avenue
June 5, In Reply Refer To: HSSD/B-178. Mr. Kevin K. Groeneweg Mobile Barriers LLC Genesee Trail Road Golden, CO Dear Mr.
 June 5, 2008 1200 New Jersey Avenue, SE. Washington, DC 20590 In Reply Refer To: HSSD/B-178 Mr. Kevin K. Groeneweg Mobile Barriers LLC 24918 Genesee Trail Road Golden, CO 80401 Dear Mr. Groeneweg: This
CRASH TEST OF MILE POST MARKER. T. J. Hirsch Research Engineer. and. Eugene Buth Assistant Research Engineer. Research Report Number 146-8
 CRASH TEST OF MILE POST MARKER by T. J. Hirsch Research Engineer and Eugene Buth Assistant Research Engineer Research Report Number 146-8 Studies of Field Adaption of Impact Attenuation Systems Research
November 16, 1998 Refer to: HNG-14. Mr. David Allardyce Mechanical Engineer B&B Electromatic Main Street Norwood, Louisiana 70761
 November 16, 1998 Refer to: HNG-14 Mr. David Allardyce Mechanical Engineer B&B Electromatic 14113 Main Street Norwood, Louisiana 70761 Dear Mr. Allardyce: In your August 31 letter, you presented some preliminary
Assessing Options for Improving Roadside Barrier Crashworthiness
 13 th International LS-DYNA Users Conference Session: Simulation Assessing Options for Improving Roadside Barrier Crashworthiness D. Marzougui, C.D. Kan, and K.S. Opiela Center for Collision Safety and
s MEDIAN BARRIERS FOR TEXAS HIGHWAYS
 s MEDIAN BARRIERS FOR TEXAS HIGHWAYS SUMMARY REPORT of Research Report Number 146-4 Study 2-8-68-146 Cooperative Research Program of the Texas Transportation Institute and the Texas Highway Department
KENTUCKY TRANSPORTATION CENTER
 Research Report KTC-08-10/UI56-07-1F KENTUCKY TRANSPORTATION CENTER EVALUATION OF 70 MPH SPEED LIMIT IN KENTUCKY OUR MISSION We provide services to the transportation community through research, technology
SAFETY COMPLIANCE TESTING FOR FMVSS NO. 214S SIDE IMPACT PROTECTION (STATIC)
") REPORT NUMBER 214-GTL-09-002 SAFETY COMPLIANCE TESTING FOR S SIDE IMPACT PROTECTION (STATIC) MAZDA MOTOR CORPORATION 2009 MAZDA 3, PASSENGER CAR NHTSA NO. C95400 GENERAL TESTING LABORATORIES, INC. 1623
REPORT NUMBER 214-GTL-09-002 SAFETY COMPLIANCE TESTING FOR S SIDE IMPACT PROTECTION (STATIC) MAZDA MOTOR CORPORATION 2009 MAZDA 3, PASSENGER CAR NHTSA NO. C95400 GENERAL TESTING LABORATORIES, INC. 1623
PR V2. Submitted by. Professor MIDWEST Vine Street (402) Submitted to
 Submitted to") FINAL REPORT PR4893118-V2 ZONE OF INTRUSION STUDY Submitted by John D. Reid, Ph.D. Professor Dean L.. Sicking, Ph.D., P.E. Professorr and MwRSF Director MIDWEST ROADSIDE SAFETY FACILITY University of Nebraska-Lincoln
FINAL REPORT PR4893118-V2 ZONE OF INTRUSION STUDY Submitted by John D. Reid, Ph.D. Professor Dean L.. Sicking, Ph.D., P.E. Professorr and MwRSF Director MIDWEST ROADSIDE SAFETY FACILITY University of Nebraska-Lincoln
VERIFICATION & VALIDATION REPORT of MGS Barrier Impact with 1100C Vehicle Using Toyota Yaris Coarse FE Model
 VERIFICATION & VALIDATION REPORT of MGS Barrier Impact with 1100C Vehicle Using Toyota Yaris Coarse FE Model CCSA VALIDATION/VERIFICATION REPORT Page 1 of 4 Project: CCSA Longitudinal Barriers on Curved,
Development of Turning Templates for Various Design Vehicles
 Transportation Kentucky Transportation Center Research Report University of Kentucky Year 1991 Development of Turning Templates for Various Design Vehicles Kenneth R. Agent Jerry G. Pigman University of
REPORT NUMBER: 301-CAL SAFETY COMPLIANCE TESTING FOR FMVSS 301 FUEL SYSTEM INTEGRITY HONDA MOTOR COMPANY 2007 HONDA ACCORD 4-DOOR SEDAN
 REPORT NUMBER: 301-CAL-07-05 SAFETY COMPLIANCE TESTING FOR FMVSS 301 FUEL SYSTEM INTEGRITY HONDA MOTOR COMPANY 2007 HONDA ACCORD 4-DOOR SEDAN NHTSA NUMBER: C75304 CALSPAN TEST NUMBER: 8832-F301-05 CALSPAN
Virginia Department of Transportation
 TEST REPORT FOR: Virginia Department of Transportation SKT SP 350 50 (15.24 m) System PREPARED FOR: Virginia Department of Transportation 1401 E. Broad St. Richmond, VA 23219 TEST REPORT NUMBER: REPORT
I. 22. Price. Technical Report Documentation Page
 1. Report No. TX-00/1914-5 1 2. Government Accession No. 4. Title and Subtitle THE 1995 PERFORMANCE RESULTS FOR SLOPE PROTECTION PRODUCTS, HYDRAULIC MULCHES, AND FLEXIBLE CHANNEL LINERS Technical Report
FHWA/IN/JTRP-2000/23. Final Report. Sedat Gulen John Nagle John Weaver Victor Gallivan
 FHWA/IN/JTRP-2000/23 Final Report DETERMINATION OF PRACTICAL ESALS PER TRUCK VALUES ON INDIANA ROADS Sedat Gulen John Nagle John Weaver Victor Gallivan December 2000 Final Report FHWA/IN/JTRP-2000/23 DETERMINATION
Sponsored by Roadside Safety Research Program Pooled Fund Study No. TPF-5(114)
") Proving Ground Test Report No. 405160-23-2 Test Report Date: February 2012 MASH TEST 3-11 OF THE W-BEAM GUARDRAIL ON LOW-FILL BOX CULVERT by William F. Williams, P.E. Associate Research Engineer and Wanda
Proving Ground Test Report No. 405160-23-2 Test Report Date: February 2012 MASH TEST 3-11 OF THE W-BEAM GUARDRAIL ON LOW-FILL BOX CULVERT by William F. Williams, P.E. Associate Research Engineer and Wanda
REPORT NO. TR-P NC SAFETY COMPLIANCE TESTING FOR FMVSS 223 REAR IMPACT GUARDS 2007 TRANSFREIGHT TECHNOLOGY NHTSA NO.
 REPORT NO. SAFETY COMPLIANCE TESTING FOR FMVSS 223 REAR IMPACT GUARDS 2007 TRANSFREIGHT TECHNOLOGY NHTSA NO. RIG 009 PREPARED BY: KARCO ENGINEERING, LLC. 9270 HOLLY ROAD ADELANTO, CALIFORNIA 92301 SEPTEMBER
GUARDRAIL TESTING MODIFIED ECCENTRIC LOADER TERMINAL (MELT) AT NCHRP 350 TL-2. Dean C. Alberson, Wanda L. Menges, and Rebecca R.
 AT NCHRP 350 TL-2. Dean C. Alberson, Wanda L. Menges, and Rebecca R.") GUARDRAIL TESTING MODIFIED ECCENTRIC LOADER TERMINAL (MELT) AT NCHRP 350 TL-2 Dean C. Alberson, Wanda L. Menges, and Rebecca R. Haug Prepared for The New England Transportation Consortium July 2002 NETCR
GUARDRAIL TESTING MODIFIED ECCENTRIC LOADER TERMINAL (MELT) AT NCHRP 350 TL-2 Dean C. Alberson, Wanda L. Menges, and Rebecca R. Haug Prepared for The New England Transportation Consortium July 2002 NETCR
AASHTO Manual for Assessing Safety Hardware, AASHTO/FHWA Joint Implementation Plan Standing Committee on Highways September 24, 2015
 AASHTO Manual for Assessing Safety Hardware, 2015 AASHTO/FHWA Joint Implementation Plan Standing Committee on Highways September 24, 2015 Full Scale MASH Crash Tests (NCHRP 22-14(02)) Conducted several
DEFLECTION LIMITS FOR TEMPORARY CONCRETE BARRIERS
 Midwest State s Regional Pooled Fund Research Program Fiscal Year 1998-1999 (Year 9) NDOR Research Project Number SPR-3(017) DEFLECTION LIMITS FOR TEMPORARY CONCRETE BARRIERS Submitted by Dean L. Sicking,
STI Project: Barrier Systems, Inc. RTS-QMB Longitudinal Barrier. Page 38 of 40 QBOR1. Appendix F (Continued) Figure F-3
 Figure F-3") Barrier Systems, Inc. RTS-QMB Longitudinal Barrier STI Project: QBOR1 Page 38 of 40 Appendix F (Continued) Figure F-3 t=.500sec 115 meters overall 37.1 Impact Severity (kj).. 141.6 Angle (deg).. 25 Speed
Barrier Systems, Inc. RTS-QMB Longitudinal Barrier STI Project: QBOR1 Page 38 of 40 Appendix F (Continued) Figure F-3 t=.500sec 115 meters overall 37.1 Impact Severity (kj).. 141.6 Angle (deg).. 25 Speed
July 10, Refer to: HSA-10/CC-78A
 July 10, 2003 Refer to: HSA-10/CC-78A Barry D. Stephens, P.E. Senior Vice President of Engineering ENERGY ABSORPTION Systems, Inc. 3617 Cincinnati Avenue Rocklin, California 95765 Dear Mr. Stephens: Your
Remote Combination Adaptive Driving Equipment Investigation Dynamic Science, Inc. (DSI), Case Number G 1990 Ford Bronco Arizona October
, Case Number G 1990 Ford Bronco Arizona October") Remote Combination Adaptive Driving Equipment Investigation Dynamic Science, Inc. (DSI), Case Number 2007-76-131G 1990 Ford Bronco Arizona October 2007 This document is disseminated under the sponsorship
Remote Combination Adaptive Driving Equipment Investigation Dynamic Science, Inc. (DSI), Case Number 2007-76-131G 1990 Ford Bronco Arizona October 2007 This document is disseminated under the sponsorship
TEXAS TRANSPORTATION INSTITUTE THE TEXAS A & M UNIVERSITY SYSTEM COLLEGE STATION, TEXAS 77843
 NCHRP REPORT 350 TEST 3-11 OF THE STEEL-BACKED TIMBER GUARDRAIL by D. Lance Bullard, Jr., P.E. Associate Research Engineer Wanda L. Menges Associate Research Specialist and Sandra K. Schoeneman Research
CRASH TEST REPORT FOR PERIMETER BARRIERS AND GATES TESTED TO SD-STD-02.01, REVISION A, MARCH Anti-Ram Bollards
 CRASH TEST REPORT FOR PERIMETER BARRIERS AND GATES TESTED TO SD-STD-02.01, REVISION A, MARCH 2003 Anti-Ram Bollards Prepared for: RSA Protective Technologies, LLC 1573 Mimosa Court Upland, CA 91784 Test
TEXAS TRANSPORTATION INSTITUTE THE TEXAS A & M UNIVERSITY SYSTEM COLLEGE STATION, TEXAS
 NCHRP REPORT 350 TEST 4-21 OF THE ALASKA MULTI-STATE BRIDGE RAIL THRIE-BEAM TRANSITION by C. Eugene Buth Senior Research Engineer William F. Williams Assistant Research Engineer Wanda L. Menges Associate
July 17, In Reply Refer To: HSSD/B-176A
 July 17, 2008 1200 New Jersey Avenue, SE. Washington, DC 20590 In Reply Refer To: HSSD/B-176A Mr. John Addy Hill & Smith Springvale Business and Industrial Park Bliston, Wolverhampton, West Midlands, UK,
Working Paper. Development and Validation of a Pick-Up Truck Suspension Finite Element Model for Use in Crash Simulation
 Working Paper NCAC 2003-W-003 October 2003 Development and Validation of a Pick-Up Truck Suspension Finite Element Model for Use in Crash Simulation Dhafer Marzougui Cing-Dao (Steve) Kan Matthias Zink
The University of Texas at Arlington The University of Texas System Texas Transportation Institute The Texas A&M University System
 1. Report No. FHWA/TX-08/5-4385-01-1 4. Title and Subtitle PILOT IMPLEMENTATION OF BUMP DETECTION PROFILER Technical Report Documentation Page 2. Government Accession No. 3. Recipient's Catalog No. 5.
Crash Performance of Strong-Post W-Beam Guardrail with Missing Blockouts Carolyn E. Hampton and Hampton C. Gabler
 Crash Performance of Strong-Post W-Beam Guardrail with Missing Blockouts Carolyn E. Hampton and Hampton C. Gabler Virginia Tech Center for Injury Biomechanics, Blacksburg VA 24061 Abstract Missing blockouts
METAL BEAM GUARDFENCE TRANSITION AND END TREATMENT IDENTIFICATION GUIDE
 2016 TxDOT Design Division METAL BEAM GUARDFENCE TRANSITION AND END TREATMENT IDENTIFICATION GUIDE A guide to help TxDOT employees identify metal beam guardfence transitions and end treatments for the
CRASH TEST REPORT FOR PERIMETER BARRIERS AND GATES TESTED TO SD-STD-02.01, REVISION A, MARCH Anti-Ram Bollards
 CRASH TEST REPORT FOR PERIMETER BARRIERS AND GATES TESTED TO SD-STD-02.01, REVISION A, MARCH 2003 Anti-Ram Bollards Prepared for: RSA Protective Technologies, LLC 1573 Mimosa Court Upland, CA 91784 Test
TRACC. Trinity Attenuating Crash Cushion
 TRACC Trinity Attenuating Crash Cushion CSP Pacific Business Unit of Fletcher Concrete & Infrastructure Limited 306 Neilson Street Onehunga, Auckland Phone: (09) 634 1239 or 0800 655 200 Fax: (09) 634
Heating Comparison of Radial and Bias-Ply Tires on a B-727 Aircraft
 'S Heating Comparison of Radial and Bias-Ply Tires on a B-727 Aircraft November 1997 DOT/FAA/AR-TN97/50 This document is available to the U.S. public through the National Technical Information Service
safedirection.com.au Ref: PM 017/02
 DISTRIBUTOR 0 Product Manual Ref: PM 017/02 Table of Contents 1.0 Introduction... 3 2.0 The... 3 3.0 How the Functions... 4 4.0 Crash Test Performance... 4 5.0 Characteristics of Terminals... 5 5.1 Gating
ArmorGuard Barrier Portable Longitudinal Barrier
 ArmorGuard Barrier Portable Longitudinal Barrier Installation & Maintenance Manual AGB I&M 082409 Page 1 of 12 ArmorGuard Barrier Table of contents Preface... 2 Applications and System Characteristics
CRITICAL FLARE RATES FOR W-BEAM GUARDRAIL DETERMINING MAXIMUM CAPACITY USING COMPUTER SIMULATION NCHRP 17-20(3)
") CRITICAL FLARE RATES FOR W-BEAM GUARDRAIL DETERMINING MAXIMUM CAPACITY USING COMPUTER SIMULATION NCHRP 17-2(3) Submitted by Beau D. Kuipers, B.S.M.E., E.I.T. Graduate Research Assistant Ronald K. Faller,
CRITICAL FLARE RATES FOR W-BEAM GUARDRAIL DETERMINING MAXIMUM CAPACITY USING COMPUTER SIMULATION NCHRP 17-2(3) Submitted by Beau D. Kuipers, B.S.M.E., E.I.T. Graduate Research Assistant Ronald K. Faller,
Wyoming Road Closure Gate
 38 TRANSPORTATION RESEARCH RECORD 1528 Wyoming Road Closure Gate KING K. MAK, ROGER P. BLIGH, AND WILLIAM B. WILSON Road closure gates are used to close certain highways when driving conditions become
REPORT NUMBER: 301-MGA SAFETY COMPLIANCE TESTING FOR FMVSS 301R FUEL SYSTEM INTEGRITY REAR IMPACT
 REPORT NUMBER: 301-MGA-2011-008 SAFETY COMPLIANCE TESTING FOR FMVSS 301R FUEL SYSTEM INTEGRITY REAR IMPACT MAZDA MOTOR CORPORATION 2011 MAZDA 2 SPORT MT NHTSA NUMBER: CB5400 PREPARED BY: MGA RESEARCH CORPORATION
CRASH TESTING OF RSA/K&C ANTI-RAM FOUNDATION BOLLARD PAD IN ACCORDANCE WITH U.S. DEPARTMENT OF STATE DIPLOMATIC SECURITY SD-STD-02.
 CRASH TESTING OF RSA/K&C ANTI-RAM FOUNDATION BOLLARD PAD IN ACCORDANCE WITH U.S. DEPARTMENT OF STATE DIPLOMATIC SECURITY SD-STD-02.01 REVISION A Prepared for RSA Protective Technologies, LLC FINAL REPORT
REPORT NUMBER: 301-CAL SAFETY COMPLIANCE TESTING FOR FMVSS 301 FUEL SYSTEM INTEGRITY REAR IMPACT FORD MOTOR COMPANY 2009 FORD F150 2-DOOR PICKUP
 REPORT NUMBER: 301-CAL-09-03 SAFETY COMPLIANCE TESTING FOR FMVSS 301 FUEL SYSTEM INTEGRITY REAR IMPACT FORD MOTOR COMPANY 2009 FORD F150 2-DOOR PICKUP NHTSA NUMBER: C90206 CALSPAN TRANSPORTATION SCIENCES
DEVELOPMENT OF A TRANSITION BETWEEN FREE-STANDING AND REDUCED-DEFLECTION PORTABLE CONCRETE BARRIERS PHASE I
 Research Project Number TPF-5(193) Supplement #78 DEVELOPMENT OF A TRANSITION BETWEEN FREE-STANDING AND REDUCED-DEFLECTION PORTABLE CONCRETE BARRIERS PHASE I Submitted by Mojdeh Asadollahi Pajouh, Ph.D.
Methodologies and Examples for Efficient Short and Long Duration Integrated Occupant-Vehicle Crash Simulation
 13 th International LS-DYNA Users Conference Session: Automotive Methodologies and Examples for Efficient Short and Long Duration Integrated Occupant-Vehicle Crash Simulation R. Reichert, C.-D. Kan, D.
Implementation of AASHTO s Manual for Assessing Safety Hardware (MASH) 2016
 2016") Implementation of AASHTO s Manual for Assessing Safety Hardware (MASH) 2016 Update from the Technical Committee on Roadside Safety Keith Cota, New Hampshire DOT MASH 2016 Overview Background Ballot Results/Dates
Implementation of AASHTO s Manual for Assessing Safety Hardware (MASH) 2016 Update from the Technical Committee on Roadside Safety Keith Cota, New Hampshire DOT MASH 2016 Overview Background Ballot Results/Dates
REPORT NUMBER: 301-MGA SAFETY COMPLIANCE TESTING FOR FMVSS 301R FUEL SYSTEM INTEGRITY REAR IMPACT
 REPORT NUMBER: 301-MGA-2010-007 SAFETY COMPLIANCE TESTING FOR FMVSS 301R FUEL SYSTEM INTEGRITY REAR IMPACT NISSAN MOTOR COMPANY LTD 2010 NISSAN CUBE NHTSA NUMBER: CA5205 PREPARED BY: MGA RESEARCH CORPORATION
800 Access Control, R/W Use Permits and Drive Design
 Table of Contents 801 Access Control... 8-1 801.1 Access Control Directives... 8-1 801.2 Access Control Policies... 8-1 801.2.1 Interstate Limited Access... 8-1 801.2.2 Limited Access... 8-1 801.2.3 Controlled
June 27, In Reply Refer To: HSSD/B-176
 June 27, 2008 1200 New Jersey Avenue, SE. Washington, DC 20590 In Reply Refer To: HSSD/B-176 Mr. John Addy Hill & Smith Springvale Business and Industrial Park Bliston, Wolverhampton, West Midlands, UK,
COMPARISON OF THE IMPACT PERFORMANCE OF THE G4(1W) AND G4(2W) GUARDRAIL SYSTEMS UNDER NCHRP REPORT 350 TEST 3-11 CONDITIONS
 AND G4(2W) GUARDRAIL SYSTEMS UNDER NCHRP REPORT 350 TEST 3-11 CONDITIONS") Paper No. 00-0525 COMPARISON OF THE IMPACT PERFORMANCE OF THE G4(1W) AND G4(2W) GUARDRAIL SYSTEMS UNDER NCHRP REPORT 350 TEST 3-11 CONDITIONS by Chuck A. Plaxico Associate Research Engineer Worcester Polytechnic
Paper No. 00-0525 COMPARISON OF THE IMPACT PERFORMANCE OF THE G4(1W) AND G4(2W) GUARDRAIL SYSTEMS UNDER NCHRP REPORT 350 TEST 3-11 CONDITIONS by Chuck A. Plaxico Associate Research Engineer Worcester Polytechnic
SAFETY COMPLIANCE TESTING FOR FMVSS 124 ACCELERATOR CONTROL SYSTEMS
 REPORT NUMBER 124-GTL-07-001 SAFETY COMPLIANCE TESTING FOR FMVSS 124 ACCELERATOR CONTROL SYSTEMS HYUNDAI MOTOR COMPANY 2007 HYUNDAI ELANTRA 4-DOOR PASSENGER CAR NHTSA NO. C70502 GENERAL TESTING LABORATORIES,
ArmorGuard Barrier Portable Longitudinal Barrier
 ArmorGuard Barrier Portable Longitudinal Barrier Installation & Maintenance Manual AGB I&M 112811 Page 1 of 13 ArmorGuard Barrier Table of contents Preface... 2 Applications and System Characteristics
Crashworthiness Evaluation. Roof Strength Test Protocol (Version III)
") Crashworthiness Evaluation Roof Strength Test Protocol (Version III) July 2016 CRASHWORTHINESS EVALUATION ROOF STRENGTH TEST PROTOCOL (VERSION III) Supporting documents for the Insurance Institute for
Crashworthiness Evaluation Roof Strength Test Protocol (Version III) July 2016 CRASHWORTHINESS EVALUATION ROOF STRENGTH TEST PROTOCOL (VERSION III) Supporting documents for the Insurance Institute for
REPORT NUMBER: 301-CAL SAFETY COMPLIANCE TESTING FOR FMVSS 301 FUEL SYSTEM INTEGRITY REAR IMPACT MAZDA MOTOR CORPORATION 2008 MAZDA CX-9 SUV
 REPORT NUMBER: 301-CAL-08-03 SAFETY COMPLIANCE TESTING FOR FMVSS 301 FUEL SYSTEM INTEGRITY REAR IMPACT MAZDA MOTOR CORPORATION 2008 MAZDA CX-9 SUV NHTSA NUMBER: C85401 CALSPAN TRANSPORTATION SCIENCES CENTER
Evaluating The Relevancy Of Current Crash Test Guidelines For Roadside Safety Barriers On High Speed Roads
 Evaluating The Relevancy Of Current Crash Test Guidelines For Roadside Safety Barriers On High Speed Roads Connie Xavier Dominique Lord Chiara Dobrovolny Roger Bligh TRB 1 st International Roadside Safety
Improving Roadside Safety by Computer Simulation
 A2A04:Committee on Roadside Safety Features Chairman: John F. Carney, III, Worcester Polytechnic Institute Improving Roadside Safety by Computer Simulation DEAN L. SICKING, University of Nebraska, Lincoln
REPORT NUMBER: 301-CAL SAFETY COMPLIANCE TESTING FOR FMVSS 301 FUEL SYSTEM INTEGRITY REAR IMPACT
 REPORT NUMBER: 301-CAL-09-01 SAFETY COMPLIANCE TESTING FOR FMVSS 301 FUEL SYSTEM INTEGRITY REAR IMPACT HYUNDAI MOTOR COMPANY 2009 HYUNDAI ACCENT 4-DOOR SEDAN NHTSA NUMBER: C90503 CALSPAN TRANSPORTATION
Sight Distance. A fundamental principle of good design is that
 Session 9 Jack Broz, PE, HR Green May 5-7, 2010 Sight Distance A fundamental principle of good design is that the alignment and cross section should provide adequate sight lines for drivers operating their
REPORT NUMBER: NCAP305I-MGA NEW CAR ASSESSMENT PROGRAM (NCAP) FMVSS No. 305 Indicant Test
 FMVSS No. 305 Indicant Test") REPORT NUMBER: NCAP305I-MGA-2012-008 NEW CAR ASSESSMENT PROGRAM (NCAP) FMVSS No. 305 Indicant Test GENERAL MOTORS LLC 2013 Chevrolet Malibu ECO4-Dr Hybrid Sedan NHTSA NUMBER: MD0101 MGA RESEARCH CORPORATION
REPORT NUMBER: NCAP305I-MGA-2012-008 NEW CAR ASSESSMENT PROGRAM (NCAP) FMVSS No. 305 Indicant Test GENERAL MOTORS LLC 2013 Chevrolet Malibu ECO4-Dr Hybrid Sedan NHTSA NUMBER: MD0101 MGA RESEARCH CORPORATION
COMPLIANCE TESTING FOR FMVSS 207 SEATING SYSTEMS
 REPORT NO. COMPLIANCE TESTING FOR FMVSS 207 SEATING SYSTEMS 2008 CHEVROLET IMPALA 4-DOOR NHTSA NO.C80102 PREPARED BY: KARCO ENGINEERING, LLC 9270 HOLLY ROAD ADELANTO, CALIFORNIA 92301 September 24, 2008
Remote, Redesigned Air Bag Special Study FOR NHTSA S INTERNAL USE ONLY Dynamic Science, Inc., Case Number ( E) 1998 Buick Century Colorado
 1998 Buick Century Colorado") Remote, Redesigned Air Bag Special Study FOR NHTSA S INTERNAL USE ONLY Dynamic Science, Inc., Case Number (1998-075-803E) 1998 Buick Century Colorado October, 1998 Technical Report Documentation Page 1.
Remote, Redesigned Air Bag Special Study FOR NHTSA S INTERNAL USE ONLY Dynamic Science, Inc., Case Number (1998-075-803E) 1998 Buick Century Colorado October, 1998 Technical Report Documentation Page 1.
PRODUCT DESCRIPTION. X-Tension DS. is suitable for all road types: Motorways, country roads, city streets for speed categories up to 110 km/h.
 INDEX Introduction 2 Product Description 3 Installation 6 Specifications 7 Crash Tests Table 8 Reusability 9 FAQ 10 Annexes 14 Drawings 15 Pictures 16 Crash Tests Results 18 Approvals 23 INTRODUCTION Improving
Remote, Redesigned Air Bag Special Study Dynamic Science, Inc., Case Number ( C) 1998 Nissan Altima Texas August/1998
 1998 Nissan Altima Texas August/1998") Remote, Redesigned Air Bag Special Study Dynamic Science, Inc., Case Number ( 1998-49-136C) 1998 Nissan Altima Texas August/1998 Technical Report Documentation Page 1. Report No. 2. Government Accession
Remote, Redesigned Air Bag Special Study Dynamic Science, Inc., Case Number ( 1998-49-136C) 1998 Nissan Altima Texas August/1998 Technical Report Documentation Page 1. Report No. 2. Government Accession