STATE HIGHWAY 58 SAFETY IMPROVEMENTS
|
|
|
- Chrystal Leonard
- 6 years ago
- Views:
Transcription

1 STATE HIGHWAY 58 SAFETY IMPROVEMENTS STATE HIGHWAY 2 TO LANES FLAT S CHEME ASSESSMENT ADDENDUM Prepared for NZ Transport Agency S eptember 2016
2
3 State Highway 58 Safety Improvements This document has been prepared for the benefit of NZ Transport Agency. No liability is accepted by this company or any employee or sub-consultant of this company with respect to its use by any other person. This disclaimer shall apply notwithstanding that the report may be made available to other persons for an application for permission or approval to fulfil a legal requirement. QUALITY STATEMENT PROJECT MANAGER Ali Sher Siddiqui PROJECT TECHNICAL LEAD Jamie Povall PREPARED BY Jamie Povall, Dhimantha Ranatunga CHECKED BY Jamie Povall REVIEWED BY Phil Peet APPROVED FOR ISSUE BY Ali Sher Siddiqui /11/16 8/11/16 8/11/16 / / WELLINGTON Level 13, 80 The Terrace, Wellington 6011 PO Box , Armagh, Christchurch 8141 TEL , FAX REVISION SCHEDULE Rev No Date Description Signature or Typed Name (documentation on file). Prepared by Checked by Reviewed by Approved by - 24 March April 2016 Working Draft for Client Comment Working Draft for Client Comment JP, DR JP PP JP, DR JP PP 1 20 June 2016 Final Draft JP, DR JP PP AS 2 27 Sept 2016 Update following client feedback JP JP DR AS Status: Final Draft Project No.: September 2016 Our ref: \\nzchc2s01\projects\_2012 Onwards\NZ Transport Agency\ NZTA SH58 SAR Update\Reporting\Issued to Client\November 2016\SH58 Addendum Report_Final Draft.docx
4 State Highway 58 Safety Improvements Executive Summary Provided in separate report. Project number: Our ref: SH58 Addendum Report_Final Draft
5 NZ Transport Agency State Highway 58 Safety Improvements State Highway 2 to Lanes Flat CONTENTS Executive Summary... i 1 Introduction Addendum Purpose Report Context Project Scope Problem Description Safety Travel Time Reliability Site Description Regional Context Project Location and Highway Characteristics Recent and planned works affecting the project length Proposed Realignment Sites Services Data & Evidence Base Traffic Volume and Capacity Traffic Composition Travel Speed Resilience and Reliability Crash Data Active Modes Data Public Transport Data Consultation & Stakeholders Pre-existing information Consultation Process Stakeholders Consultation Outcomes Option Description Option Development & Refinement Option 5 Development Median Barrier Provision Project Access Plan Project No.: Page 1 Our ref: SH58 Addendum Report_Final Draft
6 7 Legal Speed Background Speed Limit Change Economic Assessment Speed Limit Summary Option Evaluation Assessment Against Objectives Preferred Option Traffic Volumes and Capacity Costs Option Crash Risk Economic Evaluation Construction Staging Planning & RMA Background Planning context Required Environmental approvals Timeframes Risk Conclusion & Recommendation Assessment Findings Next Steps Recommendations LIST OF TABLES Table 3-1: Existing Structures Table 3-2: Realignment Site Details Table 4-1: Current Traffic Volumes Table 4-2: 2014 Traffic Monitoring Site Traffic Composition Table 4-3: TomTom 2013 Weekday Peak Average Route Travel Speeds Table 4-4: HTS and TDG Dual Tube Speed Surveys Table 4-5: Estimated Realignment Travel Speeds Table 4-6: TREIS SH58 Events between SH2 and Pauatahanui 2011 to Table 4-7: Annual Distribution of Crashes Table 4-8: CAS Crash Type Table 4-9: High Risk Rural Roads Guide (HRRRG) Crash Type Table 4-10: Environment Factors Crash Summary Table 4-11: Hit Object Crashes Table 4-12: Crash Causation Factors of Reported Injury Crashes Table 4-13: Crash Summary Table 4-14: Intersection Risk Summary Project No.: Page 2 Our ref: SH58 Addendum Report_Final Draft
7 Table 4-15: Realignment Crash Rate Table 4-16: Summary of Cyclist Activity SH Table 6-1: Initial High Level Structural Assessment Summary Table 6-2: Option 5 Intersection Access Arrangements Table 7-1: Speed Limit Change: Economic Summary Table 8-1: Summary of MCA Scoring Table 8-2: WTSM 2011 AM Peak Volume to Capacity Ratios (Eastbound) Table 8-3: HCM AM peak (Decreasing - Eastbound) LoS Table 8-4: Summary of Modelling Outcomes Table 8-5: Scheme Estimates Table 8-6: Summary of Costs Table 8-7: KiwiRAP Option Assessment Table 8-8: Option 5 Benefit Cost Ratio Table 8-9: Option 5 Sensitivity Testing Table 8-10: Safety Staging Programme Detail Table 8-11: Safety Staging Programme Delivery Risks Table 9-1: Existing Designations Table 9-2: Timeframes for consents Table B-1: Estimation of DSIEQ Collective Risk Using Severity Index SH58/Moonshine Road Intersection Table B-2: Estimation of F&S Collective Risk Using Severity Index SH58 and Flightys/Murphys Road Intersection LIST OF FIGURES Figure 1-1: SAR Addendum Development Graphic... 6 Figure 3-1: Regional context plan... 9 Figure 3-2: Study Area Overview Plan Figure 3-3: Approach to Site 1 from the east (Increasing RP0/0.62) Figure 3-4: Approach to the tight, uphill, right hand curve on Site 2 from the east (Increasing RP 0/1.42) Figure 3-5: Approach to the short straight between the two left hand curves in the broken back alignment heading west (Increasing RP 0/2.58) Figure 3-6: First curve in the broken back alignment heading west (Increasing) Figure 3-7: Second curve in the broken back alignment heading west (Increasing) Figure 3-8: Approach to 185m radius curve heading west (Increasing RP 0/1.84) Figure 4-1: Haywards SH58 Traffic Growth Figure 4-2: SH58 Modelled Traffic Demands (WTSM 2011 Base) Figure 4-3: West of SH2 Count Site Traffic Composition Figure 4-4: Pauatahanui East Count Site Traffic Composition Figure 4-5: West of SH2 Count Site Traffic Composition Growth Figure 4-6: Pauatahanui East Count Site Traffic Composition Growth Project No.: Page 3 Our ref: SH58 Addendum Report_Final Draft
8 Figure 4-7: SH58 Weekday Route Travel Speed (TomTom 2013) Westbound Figure 4-8: SH58 Realignment Site Average Speeds Figure 4-9: Wellington Region Major Earthquake Network Availability (Source: GWRC/WeLG/WREMO Transport Access Report March 2013) Figure 4-10: Earthquake Hazard and Slope Failure (Combined Risk, red = high) (Source: GWRC GIS) 27 Figure 4-11: SH58 10 year Crash History Figure 4-12: Crash Distribution and Out of Context Curves (Source: NZ Transport Agency SafetyNET) 30 Figure 4-13: Realignment Site Crash Summary Figure 4-14: SH58 Collective Risk and Intersection Risk (Source: NZTA SafetyNET) Figure 4-15: Strava Labs Heatmap for cyclist activity for Figure 6-1: Original Option 3 Cross Section Typical Detail Figure 6-2: Typical Cross Section Detail of Scour Site Realignment Works Figure 6-3: Photograph of Scour Site Realignment works during construction Figure 6-4: Proposed project works Figure 7-1: SH58 Weekday Route Travel Speed (TomTom 2013) Westbound Figure 7-2: Speed limit change and mean speed relationship (Source: NZTA HRRRG) Figure 7-3: Draft speed management guide - safe and appropriate speeds Figure 8-1: SH58 Modelled Traffic Demands (WTSM 2011 Base) Figure 8-2: Staging Regions Figure 9-1: District Boundaries APPENDICES Appendix A Traffic Data A.1 Traffic Volume Data A.2 Traffic Growth Data A.3 Speed Data Appendix B Crash Data B.1 Crash Data B.2 Crash Risk Intersection Appendix C Option Evaluation C.1 Modelling Outputs C.2 Speed Limit Change C.3 Costs C.4 Economic Evaluation Appendix D MCA Appendix E Staging Assessment Appendix F Scheme Drawings Appendix G Risk Register Project No.: Page 4 Our ref: SH58 Addendum Report_Final Draft
9 1 Introduction State Highway 58 is a Regional highway which connects the major urban centres within Kapiti and Porirua to the west to the urban centres of Hutt City and Upper Hutt to the east. State Highway 58 is narrow and windy and has many roadside hazards. This has contributed to a large number of high severity crashes in recent years and it is therefore classified as a high risk rural road. The Transmission Gully (TG) and Petone to Grenada Link Road (P2G Link Road) state highway projects will result in changes to traffic volumes on this link and the function of this route in the future. This Report discusses the strategic context and problems with the current corridor and presents recommendations for improving safety and efficiency. 1.1 Addendum Purpose This Addendum to the SH58 Scheme Assessment Report (SAR) is provided to document the various developments to the SH58 Safety Improvement project and wider environment since the original SAR was commenced in Given the elapsed time and piecemeal nature of the SAR and subsequent revisions, coupled with the considerable network changes that are proposed (either currently being investigated, designed or constructed 1 ), a more significant update to the previous SAR is deemed necessary. The most recent update of the SH58 SAR, Revision 4, was undertaken in July Whilst this was relatively recent, this followed earlier updates from the original draft SAR submission in September 2013 and is therefore a mixture of older and newer content. Further, Rev4 does not provide the most effective case for the project in terms of the justification for investment and remains solely safety focused. Rather than re-writing the SAR, and potentially losing some of the project development story, this Addendum seeks to build on Rev4. In a small number of aspects, the Addendum refers back to Rev4 where there is no material difference however for the most part the Addendum provides a thorough update and introduces additional information where it is necessary. Additional information is required to better demonstrate the case for investment, the benefits sought and expected, and the wider implications of the proposed improvements particularly given the wider network changes that are expected (or possible). 1.2 Report Context This SAR Addendum is intended as primarily a technical document, and continues the style of the Scheme Assessment Report. During this project s development, the NZ Transport Agency has developed its own Business Case approach (an adaptation of the Treasury s Better Business Case approach) for project identification and development. Whilst much of the information supplied within the previous reports remains relevant, there are a number of aspects that need to be addressed to satisfy the Business Case approach. Accordingly, an additional report 2 has been produced to cover the overall strategic context project development requirements of the business case process. Within the Executive Summary & Business Case (BC) Alignment Report, the project development history has also been described to record the various investigations that have been undertaken on SH58 in recent years and explains how the current corridor proposals have been developed and adapted over time. The diagram below shows how this report refers to information from the previous SAR (Rev 4 and appendices) and the concurrently developed Executive Summary & BC Alignment Report. 1 Refer Section 3.1 for further Regional Context 2 Executive Summary & Business Case (BC) Alignment Report Project No.: Page 5 Our ref: SH58 Addendum Report_Final Draft
 of horizontal curve realignments.")
10 1.3 Project Scope Figure 1-1: SAR Addendum Development Graphic The project scope has evolved throughout the course of the SAR development and is now substantially different from the original scope. In summary, the original project scope was to consider improvements to the cross section in combination with a small number (originally three, then increased to four) of horizontal curve realignments. The original extent of the project is from east of (and excluding) the intersection with SH2, to the intersection with (but exclusive of) the Pauatahanui Roundabout. The project scope has developed throughout the course of the project progression during the investigations. The current scope is best defined as follows: Project extent from east of the proposed SH2/58 interchange works, to Bradey Road (Lanes Flat), a distance of 9km, recognising the TG interchange that will be provided at Pauatahanui; Cross section improvements that provide 1.5m sealed shoulders, 3.5m traffic lanes (single lane except for where existing passing lanes exist and are to be retained) and 2.0m median, including upgrades of structures as required; Median barrier provision throughout, broken only at key intersections where there is a demonstrable requirement to do so; Suitable turnaround facilities to account for median barrier turning restrictions; Extensive edge barrier that protects against roadside hazards; and Horizontal curve realignments to provide a largely consistent horizontal alignment. A further aspect of the project scope is to ensure the proposed improvements consider the longer term trends, regional development aspirations and identify how increased demand on the corridor in the future is likely to affect the level of service and operation. Project No.: Page 6 Our ref: SH58 Addendum Report_Final Draft
11 2 Problem Description The project was originally proposed as a safety improvement project based upon the observed poor crash history along the corridor. As the project has developed and adjacent projects, such as TG and P2G Link Road, have become more certain, a more holistic approach to improving SH58 has been adopted to ensure improvements are consistent with the wider regional context and long term strategy. Safety remains the primary driver for the project, but the project scope is now broader to incorporate other issues that require consideration. The project objectives are: To enhance safety of travel on the Wellington State Highway network, and specifically SH58 To maintain or improve journey times and journey time reliability between SH2 in the Hutt Valley, and Transmission Gully To enhance resilience of the Wellington State Highway network To appropriately balance the needs of local and state highway traffic By developing and constructing a cost effective roading solution that is consistent with a standard expected for a Regional state highway under the One Network Road Classification. Key project outcomes being sought are: To reduce the number of deaths and serious injuries along SH58 by investing in cost effective treatments that promote a Safe System; by focusing on providing safer roads and roadsides, and safe speeds To maintain travel time reliability along the corridor by reducing the number of journeys impacted by closures and ensuring that the highway has adequate capacity in the medium to long term Further information in regards to these outcomes is presented in Section 4, however a brief summary is presented below. 2.1 Safety The project length has experienced a large number of high severity (fatal and serious) crashes in recent years. In the last five-year period from 2010 to 2014 there have been a total of 118 crashes, including three fatal and nine serious injury crashes resulting in 13 deaths and serious injuries (DSI). Run off road and head on crashes contributed to 75% of the reported crashes and 83% of the high severity crashes. Compared to national figures, this section of highway is over-represented in high severity run off road crashes. Overall, 42% of the total fatal and serious crashes occurred in the wet, higher than the regional average of 28% 3. As a result of high severity crash density, this section of highway (and the rural entir ety of SH58) is classified as a high-risk rural road. The key issues and deficiencies relating to the high crash rate and low 2.7 KiwiRAP star rating include: The project length contains 24 horizontal curves which could be considered as out of context 4 given they are on a rural road with a radius less than 400 m and curve speeds 10 km/h lower 3 High Risk Rural Roads Guide (HRRRG), Appendix B, proportion of rural state highways severe crashes occurring in the wet for the South-west North Island region. 4 Whether a curve is out of context is dependent upon the approach and departure speed relative to the curve sp eed but this measure is a simplistic method of categorisation. Project No.: Page 7 Our ref: SH58 Addendum Report_Final Draft
12 than the approach speed. A number of these are in succession, creating tight reverse curves and broken-back 5 alignments, which reduce forward sight distance. The road exhibits a high-speed environment 6. The curves in question have curve advisory speeds between km/h. Research has shown that curves requiring a reduction in speed of more than 15% from the surrounding speed environment are difficult for drivers to read and will increase the risk of loss of control crashes occurring 7. The SH58 carriageway is narrow, with 73% of shoulders along the 9 km section being below 1.5 m; reducing the recovery room for errant vehicles 8. 80% of the project length has moderate to severe (34% severe) roadside hazards, consisting of steep slopes, power poles and drop offs. The roadside hazards and narrow shoulders have resulted in approximately half of all injury crashes involving a hit object (cliff, fence, tree etc.). Lack of continuous median barrier protection; there is a single 750 m section of wire rope barrier in the 9 km project length 9. o o Research has shown that as traffic volumes exceed 6,000 AADT, the head on high severity crash rate exceeds the run off road crash rate 10. As the project length has an AADT of 14,250 (2015), the head on crash risk is approximately 1.6 times greater than the run off road risk. Therefore, although there have been few head-on crashes when compared to run off road crashes, the potential crash risk is high. In summary, the poor horizontal alignment (out of context curves), roadside hazards and narrow cross section all contribute to the high injury crash risk. At least an additional six DSI (or two DSI/year) are estimated to occur on SH58 in the time between TG opening (est. 2020) and P2G Link Road opening (est. 2023) as a result of the increased volumes on a KiwiRAP 2 star road. The additional 2 DSI per year is in addition to the 2.6 DSI/year, which is already occurring. 2.2 Travel Time Reliability Average travel times along the corridor at the moment are approximately 7 to 7.5 minutes with 95%ile travel times typically 8.5 to 9.5 minutes, equating to a buffer time 11 of approximately 2 minutes. Travel time reliability appears to be worse in the interpeak compared to the peak which shows that it is likely that the highway form is affecting travel times rather than high traffic volumes. Overall, based on Austroads metrics 12, travel time reliability is not currently an issue along the corridor. Nevertheless, with TG and nearby growth areas, traffic volumes will be increasing over the next 20 years, even with the P2G Link Road in place. Traffic volumes in excess of 20,000 vehicles per day once TG opens are predicted, with SH58 expected to be operating near capacity. With the P2G Link Road in place, traffic volumes are expected to be approaching 17,000 vehicles per day by As a result, 5 NZTA, SHGDM, Section 4, Two horizontal curves in the same direction, sometimes joined by a short straight, can form an unsightly alignment which is commonly known as a 'broken back' alignment. These alignments are hazardous as drivers expect to have exited the curve when in reality they are required to negotiate the next curve almost immediately. 6 Refer Section 4.3 for speed survey data. 7 NZTA, Research Report 371, Relationship between Road Geometry, Observed Travel Speed and Rural Accidents and NZTA (LTNZ), Research Report 323, Curve speed management July Austroads, Road Geometry Study for Improved Rural Safety, Technical Report AP-T295-15, Section A Additional median barrier, around 650m in length, is due to be installed in 2016 as part of the scour site realignment works which is discussed further in Section NZTA, High Risk Rural Roads Guide, Figure The buffer time represents the extra time (buffer) most travellers add to their average travel time when planning trips. This is the extra time between the average travel time and near-worst case travel time (95th percentile). 12 Coefficient of variation in peak periods ranges between 0.08 and 0.15, this correlates to a Low / Low-Medium band according to Austroads. Refer Section 4.3 for further detail on coefficient of variation and buffer time indices. Project No.: Page 8 Our ref: SH58 Addendum Report_Final Draft

13 travel time reliability issues, due to recurrent congestion may arise, especially prior to the opening of the P2G Link Road. The number of crashes, as a result of the corresponding road closures/delays, is also causing travel time reliability issues, refer Section 4.4. The predicted increase in traffic volumes, and the resulting increase in crashes, will further compound the crash related, travel time reliability issue. Accordingly, there is a need to ensure that any investment along this corridor reduces the number of incidents that close the highway and also takes the future traffic volumes into consideration to ensure this link continues to be efficient. 3 Site Description 3.1 Regional Context The SH58 corridor is classified as a Regional highway 13, recognising its contribution to the social and economic wellbeing of the Wellington region, which provides an east-west link connecting SH2 Hutt Valley with SH1 Paremata. In the wider area, there are numerous improvement projects in various stages of development or construction. These projects all have a relationship with SH58, to varying degrees and ar e described below, and shown in Figure 3-1. Figure 3-1: Regional context plan 13 NZTA, One Network Road Classification (ONRC), Project No.: Page 9 Our ref: SH58 Addendum Report_Final Draft
14 SH2/SH58 Interchange: Removal of the at-grade traffic signal intersection, and replacement with a grade separated roundabout interchange. This project is currently in the early stages of construction and expected to be open to traffic in mid Transmission Gully: A new motorway between Linden and Mackays that crosses SH58 at Lanes Flat where there is a new grade separated service interchange proposed. Transmission Gully is currently being constructed and is due to be open to traffic in Petone to Grenada Link Road: Investigations are continuing for a new link road connecting Petone to Grenada which is likely to comprise a six lane highway. A preliminary alignment has been confirmed 14 but it is not yet certain that the project will be delivered. SH2/Melling Interchange: Removal of the at-grade traffic signal intersection, and replacement with a grade separated interchange. This project is only in the early stages of development and does not yet have an Indicative Business Case but is due for investigations to commence in Should a project proceed here, the current indications are that improvements would not be open to traffic for at least 4-5 years, but this has little certainty. SH2/Kennedy Good Bridge (KGB): Removal of the at-grade traffic signal intersection, and replacement with a grade separated interchange. Similar to SH2/Melling, this potential project has not yet commenced the investigation phase, and no firm investigation commencement date is currently programmed. Given that no investigations are currently programmed, a new interchange is likely to be in the 5-10 year horizon period. Lincolnshire Farm Structure Plan: The 2006 plan proposes the development of the Lincolnshire Farms area which is located between SH1 and SH2 over years including new road connections, 45 hectare business area, 900 new households and new link road connecting Grenada and Petone (i.e. P2G Link Road described above). Pauatahanui-Judgeford Structure Plan: Includes a large geographical area either side of SH58 (east and west) and could result in additional lifestyle-residential, light-industrial and commercial activities. The plan assumes certain transportation improvements to support the plan growth, such as roundabouts on SH58 at Moonshine Road and Flightys/Murphys Road however, any infrastructure improvements to give effect to the plan need to be confirmed. The area shown in Figure 3-1 is approximate only. 3.2 Project Location and Highway Characteristics The project length negotiates a series of hills from SH2 in the Hutt Valley (RP) 0/0.1), rising to Mount Cecil Road in Haywards Hill, through to Lanes Flat and Bradey Road in the west (RP 0/9.3). The carriageway consists of a standard two-way two-lane rural highway, but with one eastbound passing lane and one westbound passing lane. The width of the highway is constrained in a number of locations due to the rolling/mountainous terrain. There are a series of high-speed horizontal and vertical curves. Several of the horizontal curves are out of context and have been posted with curve speed advisory signs of between 65 and 85 km/h. The dominant land uses adjacent to this stretch of road are rural, with the remainder being ruralresidential, park reserve or industrial, such as two Transpower substations 15, Griffiths Drilling (on the former Downer Edi site), Winstone Dry Creek Quarry and a logging mill. Beyond the immediate neighbouring properties there is a greater focus on rural-lifestyle properties, and also includes commercial activities, such as BRANZ. Winstones also have a long standing interest in developing a new cleanfill site on the western side of SH58, between Mount Cecil Road and Moonshine Road 16. A detailed location plan, showing the study area and proposed realignment and widening extents, is shown below in Figure Located at Haywards and just east of the Pauatahanui roundabout. 16 The application for a Winstones Cleanfill site at this location was rejected by a panel of independent commissioners in Janua ry However, it is understood Winstones may retain a possible interest for a new cleanfill site along SH58. Project No.: Page 10 Our ref: SH58 Addendum Report_Final Draft
15 RP 0/9.8 To Pauatahanui To SH1 Paremata Flightys Road Moonshine Road N Judgeford Murphys Road Harris Road RP 0/4.0 Transmission Gully Proposed Route (Grade separated interchange with SH58) Haywards Substation Project Extent Winstones Aggregates Dry Creek Quarry To SH2 Manor Park RP 0/0.57 RP 0/0.13 Figure 3-2: Study Area Overview Plan Key highway features and constraints along the project length include: Highway Alignment o o The current State Highway 58 length within the project area is characterised by significant vertical curvature, in additional to the curvilinear horizontal alignment. This is a direct result of the existing topography, with the road running through rolling and mountainous terrain. The result of the topography on the SH58 road geometry is considerable with significant grades, 24 out of context curves and narrow shoulders that affect the operation of the road. Project No.: Page 11 Our ref: SH58 Addendum Report_Final Draft
16 Guardrail and Median Barriers o 760m 17 of wire rope median barrier from RP 0/ , installed in o Limited side protection in the form of W-section guardrail along the project length. Passing and Overtaking o o Two passing lanes 1.37 km westbound (increasing) uphill passing lane at Haywards, from RP 0/ (excluding tapers) km eastbound (decreasing) downhill passing lane, east of Moonshine Road, from RP 0/ (excluding tapers). 71% of the project length has no overtaking (double yellow lines and/or insufficient sight distance). Property and Access o o o 10 local roads that are accessed via the state highway along the project length. The highway is designated as a Limited Access Road (LAR) and the Transport Agency have over the past several years imposed conditions to restrict detrimental development on properties adjoining SH58. In saying this, a number of private properties are accessed 18 off the state highway, increasing in frequency on approach to semi-rural Judgeford and Pauatahanui. Public Transport, Walking and Cycling o o o o o Walking and cycling facilities in this area are limited, with no facility other than the road shoulder (of varying width). SH58 is part of the Greater Wellington s regional cycling network 19, with a number of mainly recreational cyclists using the route. Active modes are discussed in Section 0. Public transport along SH58 consists of limited number of bus services, with the majority of these services covering the Porirua to Pauatahanui section only; a single public service covers the entirety of SH Refer Section 4.7. The study length is also part of a school bus route servicing Pauatahanui School, with a bus stop at the SH58/Moonshine Road intersection. This bus stop has been observed as being very busy at peak times, with a number of buses and cars parked on the highway and Moonshine Road (refer to Rev4 for further details). As part of the Pauatahanui-Judgeford Plan there will also be opportunities for walkway/cycleways along Pauatahanui Stream as the area is subdivided through the provision of Esplanade Reserves and/or Strips. Significant Businesses o o o Brittons House movers, located at the corner of SH58 and Harris Road Griffiths Drilling, located west of Belmont Road Judgeford Golf Club, located between Mulhern Road and Moonshine Road 17 Additional median barrier, around 650m in length, is due to be installed imminently as part of the scour site realignment works which is discussed further in Section Both licensed accessways and physical frequent use accessways are shown on the project drawings, Scheme Drawings are contained in Appendix F. 19 Greater Wellington Regional Cycling Plan (2008), 20 Metlink, #97, Polytech Link route, Project No.: Page 12 Our ref: SH58 Addendum Report_Final Draft
17 Existing Structures o The existing structures are outlined in the table below. o A structural assessment technical note is provided in Rev4 of the SAR. Table 3-1: Existing Structures Existing Structure RP Start Length Width Dry Creek Quarry Culvert 0/ m 10m Stock Subway Culvert 0/ m 8m Pauatahanui Culvert No. 1 0/ m 14.6m Pauth Stream Culvert No. 2 0/ m 7.3m Golf Course Subway 0/ m 10.3m Pauth Stream Culvert No. 3 0/ m 7.25m Murphys Road Culvert 0/ m 10m Pearce Bridge 0/ m 12m Pauth Stream Bridge No. 7 0/ m 9.7m 3.3 Recent and planned works affecting the project length The key planned or expected works affecting the project length are described in Section 3.1. One section of realignment (known as the Scour Site ) has also been accelerated within the project extent and this is described in detail in Section Other works have been undertaken along the SH58 corridor, including installation of guardrail along multiple locations of the route, completed in A speed limit review of SH58 is also in process with the Transport Agency (in conjunction with Porirua City Council 21 ) considering reducing the speed of SH58, between SH2 and Lanes Flat, from 100km/h, to 80km/h. This is discussed further in Section A reduction in posted speed limit has been consulted on jointly by NZ Transport Agency and Porirua City Council. Should the proposal proceed, both SH58 and adjoining local roads would see a reduced posted speed to 80km/h. Project No.: Page 13 Our ref: SH58 Addendum Report_Final Draft
18 3.4 Proposed Realignment Sites Five sites in particular have been identified as being inconsistent with the adjacent speed environment and have been investigated for realignment, these are described below. Refer to the project drawings 22 for the extent of each realignment site, where each site and the extent is labelled. The sites are not contiguous. Table 3-2: Realignment Site Details Site Route Position 1 RP 0/0.574 to RP 0/1.128 to RP 0/2.411 to RP 0/3.376 to * RP 0/1.670 to 2.30 Realignment Length 500m 350m Curve Number(s) Geographic Area 1,2,3 East of Hugh Duncan Street 4,5 Old Haywards Road 600m 9,10 East of Mount Cecil Road 600m 13 Scour Site (between Mount Cecil Road and Harris Road) 650m 7,8 West of Old Haywards Road *Realignment Site 5 was a later addition to proposed works hence it is out of sequence with the other realignment sites These sites were selected because they had been identified in an earlier 2009 PFR 23 (sites 1, 2 & 3), had been subject to recent serious and fatal crashes (site 4) and to provide a consistent horizontal alignment between realigned curves (site 5) Site 1 East of Hugh Duncan Street (RP 0/0.574 to 1.064; 490m) Both approaches to this site consist of high-speed straights and curves. Travelling west, the road is on an uphill grade entering into a tight left hand curve followed by a moderate right hand curve. A westbound passing lane develops immediately after this right hand curve, followed by a moderate left hand curve. The first left hand curve travelling west has a speed advisory sign of 75km/h with poor visibility through the curves due to a bank with high vegetation. The lack of sight distance reduces the driver s ability to read the transition between the tighter curves and increases the risk of a crash occurring. Figure 3-3 below shows the approach to the curve from the east. Out of context curves along this site include: 147 m radius curve with a length of 150 m, left hand curve (RP0/ ); 160 m radius curve with a length of 100 m, right hand curve (RP0/ ); and 233 m radius curve with a length of 100 m, left hand curve (RP0/ ). Other features include: Existing 1.4 km westbound uphill passing lane from RP 0/0.89 to RP 0/2.25 (excluding tapers) ; Approx. 50 m of drop off protection guardrail eastbound from RP 0/ ; Intersection of Hugh Duncan Street and SH58 at RP 0/0.95, 250 ADT, stop controlled with a right turn bay and flush median provided; and 3 licensed accessways. 22 Scheme Drawings are contained in Appendix F 23 MWH (2009) SH58 Curve Realignment Project Feasibility Report Project No.: Page 14 Our ref: SH58 Addendum Report_Final Draft
 Project No.")
19 Figure 3-3: Approach to Site 1 from the east (Increasing RP0/0.62) Project No.: Page 15 Our ref: SH58 Addendum Report_Final Draft

20 3.4.2 Site 2 East of Old Haywards Road (RP 0/1.128 to 1.470; 340m) Both approaches to this site consist of high-speed straights. Travelling west, the road is relatively flat with a westbound passing lane and right turn bay for the Haywards Substation access. The road then steepens into an uphill grade and a medium left hand curve followed by a tight right hand curve. This arrangement could lead to vehicles accelerating at the passing lane to overtake vehicles at the beginning of the series of curves. This could lead to an increased risk of a crash occurring. The downhill approach transitions from a high-speed section with a steep downhill grade onto a tight left hand curve, posted at 65 km/h, which is out of context with the surrounding speed environment. Out of context curves along this site include: 198 m radius curve with a length of 190 m, left hand curve (RP0/ ); and 100 m radius curve with a length of 100 m, right hand curve (RP0/ ). Other site features include: Existing 1.4 km westbound uphill passing lane from RP 0/0.89 to RP 0/2.25 (excluding tapers) Guardrail eastbound from RP 0/ Three Haywards Substation private access intersections with SH58 including: o o o Kaitawa Street (RP 0/1.17), existing RTB; Atiamuri Crescent (RP 0/1.33), flush median; and Adjacent to Old Haywards Road (RP 0/1.44), flush median. Two further licensed accessways Figure 3-4: Approach to the tight, uphill, right hand curve on Site 2 from the east (Increasing RP 0/1.42) Site 3 East of Mount Cecil Road (RP 0/2.411 to 3.000; 590m) The approach to this site, heading west, enters a right hand curve approximately 200m after the termination of the uphill passing lane. It then enters a left hand curve followed by a short straight and a second left hand curve. This alignment is termed a broken back which are hazardous, as drivers expect to have exited the curve when in reality, they are required to negotiate the next curve almost immediately. Project No.: Page 16 Our ref: SH58 Addendum Report_Final Draft

21 This section of road has a reverse curve sign with a concealed exit (Mt. Cecil Road) on approach to the second left hand curve, however there is no supplementary curve speed advisory sign. It is likely that the speed reduction necessary to safely navigate the out of context curves is exacerbated by vehicles exiting the passing lanes at high speeds as the gradient becomes level at the crest of the hill. Out of context curves along this site include: 216 m radius curve with a length of 100 m, left hand curve (Broken back) (RP 0/ ); 270 m radius curve with a length of 160 m, left hand curve (Broken back) (RP 0/ ); and 250 m radius curve with a length of 190 m, right hand curve (RP 0/ ). Other site features include: Intersection of Mt. Cecil Road (no exit) and SH58 at RP 0/2.97, 20 ADT, Give Way controlled with right turn bay provision. Two licensed accessways Figure 3-5: Approach to the short straight between the two left hand curves in the broken back alignment heading west (Increasing RP 0/2.58) Site 4 East of Mount Cecil Road (RP 0/3.376 to 4.00; 620m) The approach to this site from the east enters a medium left hand curve approximately 100 m west of the reverse curve signage (PW-20). It then enters another tighter left hand curve, after an approximately 70 m short straight; as discussed in Site 3 above, this alignment is termed a broken back. Immediately following this broken back curve is a medium right hand bend and vertical crest curve. This section of highway also includes a scoured site / drop off at approx. RP 0/ , located on second left hand curve travelling west. The existing guardrail installation is 80m long and offers limited protection of the drop off and one power pole. The drop off has been undermined by a stream below, and with the slip crest only metres away from the guardrail, reducing the founding of the guardrail posts significantly. As a result, the guardrail is leaning away from the highway and it is likely the guardrail will not operate as intended. Out of context curves along this site include: 297 m radius curve with a length of 140 m, left hand curve (broken back) (RP 0/ ); 156 m radius curve with a length of 70 m, left hand curve (broken back) (RP 0/ ); and 242 m radius curve with a length of 240 m, right hand curve (RP 0/ ). There are two licensed accessways along this section. Project No.: Page 17 Our ref: SH58 Addendum Report_Final Draft


22 Figure 3-6: First curve in the broken back alignment heading west (Increasing) Figure 3-7: Second curve in the broken back alignment heading west (Increasing) Site 5 Section between realignment Site 2 and Site 3 (RP 0/1.670 to 2.30; 630m) This section includes a westbound passing lane and wire rope median barrier for the majority of its length which was installed in This section contains three out of context curves in a reverse curve arrangement, including one 75 km/h posted speed advisory for a 185 m radius curve right hand curve (75km/h advisory travelling westbound, 65km/h advisory eastbound) at RP 0/ This 75 km/h curve is preceded by a medium, 400 m radius, left hand curve and followed by a tight, 250 m radius, left hand curve. This section of realignment was not included in the previous Rev4 of the SAR, but has since been introduced. This is covered in greater detail in Section Figure 3-8: Approach to 185m radius curve heading west (Increasing RP 0/1.84) There are four licensed accessways along this section. Project No.: Page 18 Our ref: SH58 Addendum Report_Final Draft
23 3.5 Services Refer to Rev4 of the SAR for a description of existing services. 4 Data & Evidence Base 4.1 Traffic Volume and Capacity Existing The telemetry traffic count site located on SH58 East of Pauatahanui (RP 0/9.1) has recorded a 2015 AADT of 14,250. Figure 4-1 below shows: An overall traffic growth of 2% per annum for both the SH58 count sites was recorded between 1992 and ; From 2007 onwards, overall traffic volumes at both count sites show negligible growth. This is likely to be associated with the global financial crisis (GFC) 25. Total heavy vehicle growth, although likely affected by the GFC between 2007 and 2009, show strong signs of recovery in From 2010 onwards, the total HCV volumes on SH58 at the West of SH2 (Haywards Hill) show recorded growth of 3% per annum. In contrast, the total HCV volumes on SH58 near Pauatahanui have reduced by approximately 4% per annum (noting that the longer term trends are still positive as shown in the figure below). Annual Average Daily Traffic (vpd) 15,000 14,000 13,000 12,000 11,000 10,000 9,000 8,000 7,000 6,000 5,000 4,000 3,000 TRAFFIC GROWTH SH58 Haywards % +2% West of SH 2 (Haywards Hill) - Total HCV 0% +1% 0% 0% 2,000 Global ~0% p.a. overall traffic 2% p.a. overall traffic growth ( ) Financial growth 1, % p.a. HCV growth ( ) - noting historic data concerns Crisis (NZ) varying HCV growth Calendar Year West of SH 2 (Haywards Hill) PAUAHATANUI EAST - Telemetry Site 73 1% +4% +8% 0% +3% -4% PAUAHATANUI EAST - Telemetry Site 73 - Total HCV Total HCV (vpd) PAUAHATANUI EAST - Telemetry Site 73 West of SH 2 (Haywards Hill) West of SH 2 (Haywards Hill) - Total HCV PAUAHATANUI EAST - Telemetry Site 73 - Total HCV Figure 4-1: Haywards SH58 Traffic Growth Refer Appendix A for further detail, including directional peak hour flow graphs. 24 Unstable volumes were recorded for the West of SH2 (Haywards Hill) count site between 1997 and Total heavy commercial vehicle (HCV) volumes prior to 2007, also appear to be unstable for both count sites. 25 The global financial crisis affected NZ between approximately 2007/08 and 2009/10, based on NZ s annual GDP growth, Project No.: Page 19 Our ref: SH58 Addendum Report_Final Draft
24 Table 4-1 outlines the current traffic volumes of the nearest telemetry count site as well as the local roads located within the project extent. Table 4-1: Current Traffic Volumes 26 Location Type Volume SH58 West of SH2 - Haywards Hill (RP 0/0.10) SH58 Pauatahanui East (RP 0/9.14) Single Loop, continuous ID: Telemetry Site 73 ID: Hebden Crescent (RP 0/0.03) Local road count 450 ADT McDougall Grove (RP 0/0.30) Local road count 100 ADT Hugh Duncan Street (RP 0/0.95) Local road count 250 ADT 13,850 AADT (2015) 14,250 AADT (2015) Kaitawa Street (RP 0/1.17) Private Access N/A Substation Access Atiamuri Crescent (RP 0/1.33) Private Access N/A Substation Access Old Haywards Road (RP 0/1.44) Local road count 100 ADT Mount Cecil Road (RP 0/2.99) Local road count 20 ADT Harris Road (RP 0/4.47) Local road count 40 ADT Moonshine Road (RP 0/6.32) Local road count 600 ADT low count compared to MWH short term pm peak survey (approx. 1,200 vph) Mulhern Road (RP 0/7.31) Local road count 175 ADT Murphys Road /Flightys Road (RP 0/8.01) Local road count Murphys Road: 220 ADT Flightys Road: 410 ADT Belmont Road (RP 0/8.37) Local road count 55 ADT Bradey Road (RP 0/9.32) Local road count 275 ADT 26 Note: SH58 volumes sourced from the Transport Agency s Traffic Monitoring System (TMS) and local road count data sourced from CAS/RCA records. Project No.: Page 20 Our ref: SH58 Addendum Report_Final Draft
25 4.1.2 Future The section below provides a brief summary of the future traffic demands along SH58 based on the Wellington Transport Strategic Model (WTSM). Refer Section 8.1 for further detail on the future traffic volumes and traffic modelling information. Figure 4-2 below shows: Minimal traffic growth is anticipated until the introduction of TG, where traffic volumes are expected increase to over 20,000 vpd on SH58. By 2031, traffic volumes are expected to be over 23,000. With the P2G Link Road in place, traffic volumes return to base levels. By 2031, traffic volumes are expected to be approaching 17,000 vpd. From 2031 onwards, modelled growth is minimal, with or without the P2G Link Road in place. 25,000 SH58 Modelled Traffic Demands (WTSM 2011 Base) Traffic Volume (vpd) 20,000 15,000 10, % Step change increase with TG Step change decrease with P2G 1.6% 1.3% 0.1% 0.1% 5, With P2G in 2023 No P2G Figure 4-2: SH58 Modelled Traffic Demands (WTSM 2011 Base) Due to uncertainty in future traffic volumes, sensitivity testing was undertaken based on +-1% traffic growth applied to the base modelled scenarios outlined above. The resulting traffic volume range is presented in Section 8 and Appendix C.1.1. In summary the modelling and traffic demands show: With TG in place in 2021: o o SH58 is expected to operate near capacity (with a volume to capacity ratio approaching 90%) in the critical AM peak period. By 2031, SH58 is expected to be over capacity. With the P2G Link Road in place, currently estimated to be 2023: o o SH58 is expected to be under 70% capacity in the AM peak period. By 2031 and through to 2041, SH58 is expected to be under 75% capacity. Project No.: Page 21 Our ref: SH58 Addendum Report_Final Draft
26 4.2 Traffic Composition The 2015 traffic composition of the count site within the study area and the nearby telemetry site have been assessed with the results shown in the figures and table below. SH58 Traffic Composition 2015 West of SH2 (Haywards Hill) (RP58/0) SH58 Traffic Composition 2015 Pauatahanui East Telemetry (RP 58/9) LCV, 118 LCV, 426 Cars, Heavy Vehicles, 923 MCV, 606 Cars, Heavy Vehicles, 557 MCV, 426 HCV1, 234 HCV2, 83 HCV1, 70 HCV2, 61 Car LCV MCV HCV1 HCV2 Car LCV MCV HCV1 HCV2 Figure 4-3: West of SH2 Count Site Traffic Composition Figure 4-4: Pauatahanui East Count Site Traffic Composition West of SH 2 (Haywards Hill) Pauatahanui East Telemetry AADT and Cars (vpd) 15,000 14,000 13,000 12,000 11,000 10,000 9,000 8,000 7,000 6,000 5,000 4,000 3,000 2,000 1, Commercial Vehicles (vpd) AADT and Cars (vpd) 15,000 14,000 13,000 12,000 11,000 10,000 9,000 8,000 7,000 6,000 5,000 4,000 3,000 2,000 1, Commercial vehicles(vpd) Car AADT LCV MCV HCV1 HCV2 Total HCV Figure 4-5: West of SH2 Count Site Traffic Composition Growth Car AADT LCV MCV HCV1 HCV2 Total HCV Figure 4-6: Pauatahanui East Count Site Traffic Composition Growth 27 Table 4-2: 2014 Traffic Monitoring Site Traffic Composition Location West of SH2 (Haywards) RP 58/0 SH58 Pauatahanui East RP 58/ The figures and table above highlight: Total AADT Car Light Medium Long V.Long HVs (MCV, LV-I LV-II MCV HCV-I HCV-II HCV) AADT (vpd) 13,858 12, % 100% 92% 1% 4% 2% 1% 7% Growth (5 year) 0% 0% 1% 3% 6% -2% 3% AADT (vpd) 14,254 13, % 100% 93% 3% 3% 0% 0% 4% Growth (5 year) 1% 1% -4% -4% -7% -5% -5% Traffic composition for the two count sites is similar with cars representing 92-93% of the AADT. Heavy vehicles are growing at a higher rate than light vehicles; therefore, the percentage of heavies will increase over time. This could in turn have an impact on overall travel time, capacity and safety. 27 Pauatahanui is a telemetry site and the TMS data splits LCV and MCV exactly evenly, so LCV numbers are in effect sitting exactly behind the MCV AADT line with equal totals. Project No.: Page 22 Our ref: SH58 Addendum Report_Final Draft
27 There are a higher number of heavy vehicles, and higher heavy vehicle growth, at the eastern end of SH58. This indicates that a number of heavy vehicles may not use SH58 as a through route but rather have origins and destinations along SH58, prior to Pauatahanui. 4.3 Travel Speed Travel speed data has been collected using the following sources: TomTom Traffic Stats for ; Dual tube speed survey (NZ Transport Agency/HTS, 2005) east of the Pauatahanui Roundabout (approx. RP 0/9.1 near Telemetry site); Dual tube speed survey (TDG, 2011) near the proposed Winstones Clean Fill site, west of Mt. Cecil Road (approx. RP 0/3.22); Car following travel time surveys 29, July 2013, along the four proposed realignment sections (approx. RP0/0.5 to RP0/4.0); and Design speed estimates for the existing situation using geometric data 30. The purpose of collecting and analysing the travel speed and travel time data is to verify the existing speed environment and validate the economic assumptions relating to travel time savings. The results of the various surveys are outlined in Figure 4-7 and the tables below. Speed (km/h) SH58 Weekday Travel Speed (2013) Westbound 85th percentile Speed [kph] Average Speed [kph] 15th percentile Speed [kph] Figure 4-7: SH58 Weekday Route Travel Speed (TomTom 2013) Westbound Note that more up to date travel time information is available; however, this includes the effects of the temporary speed lim it at the Scour Site. 29 These surveys involved following another vehicle, at approximately the same speed, along each of the four realignment sites and recording the travel time and distance travelled. This was repeated three to four times in each direction. 30 Note: Design speed estimates haves been calculated based on the current geometry (with a number of sites also containing multiple curves). LIDAR data has been used. Therefore, the results are only approximate. Refer Section for the option design speed estimates. 31 Note that Figure 4-7 above shows significant increases in variability during the off-peak period from 12am to 6am, this is due to the reduced traffic volumes, resulting in a correspondingly low TomTom sample size. Project No.: Page 23 Our ref: SH58 Addendum Report_Final Draft
28 Table 4-3: TomTom 2013 Weekday Peak Average Route Travel Speeds AM #1 7:15-7: min 79 km/h 8.5 min 66 km/h AM #2 7:45-8: min 79 km/h 8.4 min 66 km/h AM #3 8:15-8: min 76 km/h 9.1 min 62 km/h Interpeak 10-1: min 77 km/h 9.1 min 61 km/h PM #1 16:15-16: min 79 km/h 8.6 min 65 km/h PM #2 16:45-17: min 81 km/h 8.1 min 69 km/h PM #3 17:15-17: min Eastbound Mean 81 km/h Eastbound 7.9 min 95th %tile 71 km/h Buffer Index 32 20% 19% 23% 26% 22% 17% 15% Westbound 7.3 min 7.8 min 7.4 min 7.2 min 7.2 min 7.0 min 7.2 min Mean 77 km/h 74 km/h 76 km/h 77 km/h 78 km/h 79 km/h 77 km/h Westbound 9.3 min 9.1 min 9.5 min 8.9 min 8.4 min 8.2 min 8.7 min 95th %tile 60 km/h 61 km/h 59 km/h 62 km/h 77 km/h 68 km/h 64 km/h Buffer Index 28% 16% 29% 24% 18% 17% 21% Table 4-4: HTS and TDG Dual Tube Speed Surveys Weekly April HTS Group (RP 0/9.1) 2011 TDG (RP 0/3.1) Increasing Decreasing Increasing Decreasing August 05 April 05 August 05 Oct 11 Oct 11 Volume (vpd) 6,742 6,581 6,549 6, Mean speed (km/h) th %tile (km/h) Table 4-5: Estimated Realignment Travel Speeds Realignment Site TomTom 2013 Weekday Interpeak Average Speed (km/h) Westbound (Inc) Eastbound (Inc) Car-following Speed Survey (km/h) Westbound (Inc) Eastbound (Dec) Both Directions Design Speed Estimates (km/h) Existing * *Realignment site #5 was added since the SH58 SAR and is located between sites 2 and 3 (58/0/ ) 32 Coefficient of variation is the standard Austroads metric for travel time reliability. Buffer index is an alternate measure which has been used to maximise the sample size of the TomTom data set, with research indicating a strong relationship between the two measures, refer Appendix A for further detail. The buffer index represents the extra time (buffer) most travellers add to their average travel time when planning trips. This is the extra time between the average travel time and near-worst case travel time (95th percentile). The buffer index is stated as a percentage of the average travel time. Project No.: Page 24 Our ref: SH58 Addendum Report_Final Draft
29 90 SH58 Haywards Hill Average Speeds by Direction Speed (km/h) Northbound (inc) Both directions Southbound (dec) RP RP RP RP Site 1 Site 2 Site 3 Site 4: "wash out" Existing Design Speed Figure 4-8: SH58 Realignment Site Average Speeds As outlined in Table 4-4 above, both the speed surveys conducted in April/August 2005 and October 2011 show similar results with a mean speed of 90 km/h and an 85th percentile speed of 100 km/h at sites suitable for speed tubes (straight). In comparison, the five realignment sites to the east (refer Table 4-5 and Figure 4-8) show much lower mean speeds. This is likely due to the spot speed surveys being located along relatively straight sections, in contrast to the average speeds surveys which were conducted along the curvilinear alignment of the realignment sites. Table 4-5 and Figure 4-8 also show that Site 1 and Site 2 had the lowest average speeds of the realignment sites from the car-following surveys undertaken; these trends correlate well with the existing design speed estimation (refer Figure 4-8 triangular symbols). The observed travel speeds are similar or higher for three of the four sites when compared to the existing design speed estimates, this is not unsurprising due to the relatively high speed environment. Further Traffic data, including graphs of AADT, peak hourly flows and speed survey data are detailed in Appendix A Summary In summary, the travel speed data shows: The average route travel speed is 80km/h with minimal variation throughout the day or by direction, despite the existing 100 km/h posted speed limit. Additionally the 85 th and 95 th percentile speeds also show minimal variation. Based on Austroads metrics therefore, travel time reliability is not currently an issue along the corridor. This indicates that speeds are not currently constrained by traffic congestion but rather by highway form/road geometry. Existing speeds at the five realignment sites are lower than the route average speed by up to 16km/h. Previous spot speed surveys 33 show higher average speeds of 90km/h; however, due to the nature of dual tube surveys, these were undertaken on relatively long straight sections and the results are therefore not consistent with the overall form of SH58, but rather represent the 85 th percentile speed. 33 Undertaken by TDG in 2011, west of Mount Cecil Road Project No.: Page 25 Our ref: SH58 Addendum Report_Final Draft
 or crashes (reliability)) on the road; and how the road and wider transport network manage")
30 4.4 Resilience and Reliability Resilience and reliability have a number of aspects; Risks how often are trips delayed because of scheduled and unscheduled events (e.g. natural hazards (resilience) or crashes (reliability)) on the road; and how the road and wider transport network manages, and recovers from, the events (e.g. increased travel demand due to events occurring on other parts of the road network) The Wellington Region Road Network Earthquake Resilience Study (2012) identified that SH58, particularly around the Haywards Hill would perform poorly in a large event. This is presented in Figure 4-9 and Figure 4-10 below. In summary, for a major earthquake (e.g. a rupture of the Wellington Fault 34 ): The Haywards Hill section of SH58 would suffer extensive damage, resulting in full closure of the section for three months or more; and The remainder of SH58 project extent is expected to suffer moderate damage, reducin g much of SH58 to a single lane for up to three months. Figure 4-9: Wellington Region Major Earthquake Network Availability (Source: GWRC/WeLG/WREMO Transport Access Report March 2013) 34 It s Our Fault: Re-evaluation of Wellington Fault conditional probability of rupture, 2010, GNS Science and Victoria University s study findings show that the Wellington Fault has an estimated probability of rupture in the next 100 years of ~11% (with sensitivity results ranging from 4% to 15%), Project No.: Page 26 Our ref: SH58 Addendum Report_Final Draft

31 Land slides Figure 4-10: Earthquake Hazard and Slope Failure (Combined Risk, red = high) (Source: GWRC GIS) It is possible that realignment works could mitigate some of the residual earthquake risk on the sections that are proposed for potential realignment - however this would need to be confirmed following detailed investigation and then designed accordingly. This should be considered during the detailed design phase. Project No.: Page 27 Our ref: SH58 Addendum Report_Final Draft
32 4.4.2 SH58 Road Events The Traffic Road Event Information System (TREIS) operated by NZ Transport Agency Traffic Operations Centre (TOC) was queried to determine the number, frequency, and impact of events on SH58. There have been 260 reported events on SH58 between SH2 and Pauatahanui from 2011 to 2015, the number and average delay (if applicable) of events are summarised in Table 4-6 below. Table 4-6: TREIS SH58 Events between SH2 and Pauatahanui 2011 to 2015 Event Type 35 Road Closed Delays Caution Number Avg Duration Number Avg Duration Number Crash (Reliability) 11 (73%) 2.5 hrs 4 (50%) 1.25 hrs 74 (30%) Weather (Resilience) 2 (13%) 3.25 hrs 7 (3%) Roadworks (Reliability) 1 (7%) 5 hrs 1 (13%) 6.5 hrs 4 (2%) Spill (Reliability) 1 (7%) 1 hr 25 (10%) Object on Road (Reliability) 1 (13%) 2.5 hrs 53 (20%) Traffic Congestion (Reliability) 1 (13%) 2.25 hrs 2 (1%) Animal/Stock (Reliability) 42 (16%) Breakdown (Reliability) 11 (4%) Slip (Resilience) 10 (4%) Other 1 (13%) 3.5 hrs 21 (8%) Total hrs hrs 260 Crashes are the most common cause of road closure, delay, and caution events. Crashes have on average caused closures (average closure time of 2.5 hours) or delays (average delay of 1.25 hours) three times a year. Crashes account for 73% of the closures along project extent, followed by weather (13%). Objects on the Road (20%), and Animals on the Road (16%) are most common caution events to be reported in TRIES. Objects and animals on the road are a hazard to motorists, particularly when there is reduced sight distance through horizontal and vertical curves. Traffic congestion does not at this stage represent a significant factor in delays Alternative Routes SH58 is the key route between the Hutt Valley and Porirua, Kapiti Coast, and further north. SH1/SH2 is the alternative route for closures or incidents on SH58. During off-peak times the alternative detour takes an additional 20 minutes to complete, during peak times this can be drastically longer SH58 As An Alternative Route SH58 is the alternative route between Wellington and Hutt Valley when incidents or closures occur on SH2 between Ngauranga and Petone. Increased travel demand along SH58 was investigated by examining TMS daily flow graphs for the telemetry count site. These graphs revealed that there have been three occasions between 2011 and 2015 where daily flow above was 18,000 vpd (approximately 3,000-4,000 vpd above typical flow). Further analysis into the effects of these high flow events was not completed as they are infrequent. 35 Note that while TREIS road closure data is considered reliable, Caution and Delay events are assigned by traffic operations centre staff (at times with guidance from network contractors and consultants). Based on correspondence with WTOC staff, there is currently no official guidance or definition to distinguish between a delay and a caution event. Project No.: Page 28 Our ref: SH58 Addendum Report_Final Draft
33 4.5 Crash Data Crash History A review of NZ Transport Agency s CAS database over the five-year period 2010 to 2014, summarised in Table 4-7 below, revealed a total of 118 crashes (12 high severity crashes resulting in 13 DSI 36 ) along the approximately 9 km project length, from the proposed SH2/SH58 interchange 37 (RP 0/0.5) to Lanes Flat (RP 0/9.3). Table 4-7: Annual Distribution of Crashes Year Fatal Serious Minor Non-Injury Total DSI Five Year Total Examining the 10 year crash history, presented in Figure 4-11 below, reveals an increasing trend in both deaths and serious injuries and the overall number of crashes up until Since 2012, there has been a reduction in the total number of crashes; however, there have also been two fatal crashes 39. The crash history therefore reflects the random nature of crashes, especially those of high severity. 35 SH58 Crash History SH2 to Lanes Flat Number of Crashes Non-Injury Minor Serious Fatal DSI Year Figure 4-11: SH58 10 year Crash History 36 Noting that DSI is a measure of the total deaths and serious casualties rather than crashes. For example, a single recorded fatal crash could have had multiple fatalities, depending on the number of other vehicles and passengers involved. 37 Crashes occurring at, and on approach to, the intersection of State Highway 2 and State Highway 58 have been excluded from the analysis as this is the study area and will be addressed in the SH2/SH58 Haywards Interchange Project under construction. There have been 30 crashes on the SH58 approach or turning onto SH58 at the existing signalised intersection between 2010 and This included one serious injury crash and three minor injury crashes is incomplete as CAS data was retrieved in Feb 2016, noting there is lag of approximately three months between a crash occurring and being loaded on to the CAS database. 39 It should be noted that Realignment Site 4 was operating under a temporary speed limit of 70km/h in 2013 and 2014 which will have influenced the observed crash numbers during this period. Project No.: Page 29 Our ref: SH58 Addendum Report_Final Draft


34 Figure 4-12 below provides an outline of the crash distribution and out of context curves along SH58 with the following tables providing a summary of the CAS output data for the study area. Additional outputs from the CAS database are contained in Appendix B. Western Project Extent (Lanes Flat) Clusters indicate the total number of crashes Out of Context Curves Red sections indicate that the curve approach speed is 20 km/h higher than the curve negotiation speed. Eastern Project Extent (SH2/58) Figure 4-12: Crash Distribution and Out of Context Curves (Source: NZ Transport Agency SafetyNET) Table 4-8: CAS Crash Type Crash Type Number of Reported Crashes % of Reported Crashes % of Reported High Severity Crashes Bend Lost Control/Head On 71 60% 33% Rear End / Obstruction 15 13% 17% Straight Road Lost Control/ Head On 14 12% 33% Overtaking Crashes 9 8% 17% Crossing / Turning 6 5% 0% Miscellaneous Crashes 3 3% 0% Pedestrian Crashes 0 0% 0% Total % 100% Table 4-8 shows that the majority of reported crashes have been Bend Lost Control/Head On. In terms of high severity crashes, bend and straight loss of control crashes contribute to two thirds of these crashes. The CAS crash type data therefore reflects the high speed environment, out of context curves and highway form. Project No.: Page 30 Our ref: SH58 Addendum Report_Final Draft
35 Table 4-9: High Risk Rural Roads Guide (HRRRG) Crash Type Crash Type Number of Reported Crashes DSI % of Reported Crashes % of Reported High Severity Crashes Run off Road % 50% Head On % 33% Intersection Crashes 12-10% -% Other % 17% Total % 100% Table 4-9 shows run off road and head on crashes contributed to 75% of the reported crashes and 83% of the high severity crashes. Compared to national figures, this section of highway is over-represented in high severity run off road crashes. Comparing the High Risk Rural Road Guide (HRRRG) crash types on SH58 with the Wellington Network shows: There are more run off road and head on deaths and serious injuries reported; and There are fewer Intersection and other crash types. Table 4-10: Environment Factors Crash Summary Road Surface Fatal Serious Minor Noninjury Total % Injury % of Total Injury Severity Ratio % of Total F+S crashes Dry % 49% % Wet % 51% % Day % 21% % Night % 79% % Weekday % 70% % Weekend* % 30% % * Weekend between 6pm Friday and 6am Monday Table 4-10 above shows that: 63 crashes (53% of all crashes) occurred in wet conditions which is very high compared to the Wellington State Highway network average of approximately 32%. 35% of crashes which occurred under wet conditions resulted in injury; of which 23% were high severity (causing fatal or serious injury). 42% of the total fatal and serious crashes occurred in wet conditions, higher than the regional average of 28% % of the total fatal and serious crashes occurred in dark conditions, significantly higher than the regional average of 36% HRRRG, Appendix B, proportion of rural state highways severe crashes occurring in the wet for the South-west North Island region. 41 Ibid. Project No.: Page 31 Our ref: SH58 Addendum Report_Final Draft
36 Table 4-11: Hit Object Crashes Object Hit* Number of Reported Crashes % of All Reported Crashes Number of Reported Injury Crashes % Of Which Resulted in Injury Number of Reported High Severity Crashes % Of Which Resulted in High Severity Fence 30 25% 10 33% 1 10% Upright Cliff/Bank 20 17% 7 35% 1 14% Utility post/pole 12 10% 4 33% 0 0% Tree 10 8% 4 40% 0 0% Guard/guide rail & median barrier 10 8% 1 10% 0 0% Overbank/Cliff 7 6% 1 14% 0 0% Ditch 5 4% 1 20% 0 0% Bridge or River 3 3% 3 100% 1 33% All Other 4 3% 1 25% - -% Total Objects Hit 73 62% 21 29% 2 10% No Objects Hit 45 38% 22 49% 10 45% Table 4-11 shows that 73 crashes have involved at least one object being hit (equating to over 60% of total crashes), with hit object injury crashes contributing to approximately 49% of all reported injury crashes. The most frequently hit objects include; fences, banks/cliffs, poles, trees. Note that some crashes could have involved more than one object hit; 49% of the total number of injury crashes involved one or more objects hit (21% of the total number of injury crashes involved multiple hit objects). Table 4-12: Crash Causation Factors of Reported Injury Crashes Causation Reported Crashes with Causation Factor Reported Injury Crashes with Causation Factor % High Severity Poor Handling % Too Fast % Road Factors % Poor Observation % Poor Judgement % Incorrect Lane/position % Alcohol/Drugs % Vehicle Factors % Fatigue 7 1 0% Weather % Failed to Giveway/Stop 5 2 0% Failed to Keep Left % Overtaking 4 1 0% Disabled/Old/Ill % Other (all remaining) % Table 4-12 shows that, of the Road factors crashes: Project No.: Page 32 Our ref: SH58 Addendum Report_Final Draft
37 94% (29 crashes) were due to Slippery conditions; 69% of due to rain or ice, 16% due to oil/fuel and 13% due to other reasons. The remaining two crashes were due to visibility limitations Realignment Site Crash Summary A summary of the crashes on each of five realignment sites and the remaining midblock sections is outlined in Figure 4-13 below Realignment Site Crash Summary Number of Crashes Site 1 Site 2 Site 3 Site 4 Site 5 Remaining Midblock Fatal Serious Minor Non-Injury DSI Injury crashes/km Figure 4-13: Realignment Site Crash Summary Figure 4-13 above shows that all the realignment sites have a higher injury crash rate than the midblock sections. Of the realignment sites, Site 4 has the largest number of overall crashes, deaths and serious injuries as well as the highest injury crash rate. Table 4-13 below provides further detail on the crashes which have occurred at each site. Project No.: Page 33 Our ref: SH58 Addendum Report_Final Draft
38 Table 4-13: Crash Summary Realignment Site Location Fatal Crashes Serious Minor Non- Injury DSI Comments The serious injury crash involved a motorcyclist travelling westbound losing control and colliding with the rear of a car that was travelling very slowly on a left hand curve. Site 1 RP 58/0/ The minor injury crashes involved: Two crashes were a single eastbound car travelling too fast when entering a corner, losing control when turning right and hitting a bank and or tree; A westbound SUV travelling too fast when entering a corner, swinging wide, and colliding head on with another vehicle; and An Eastbound SUV colliding with the rear end of another eastbound car. o The non-injury crashes were all bend or straight loss of control/head on crashes with the exception of one rear end crash. o 61% of the crashes occurred in dark (night/twilight) conditions, including two minor injury crashes and six non-injury crashes. o 61% of the crashes occurred in wet or icy conditions, including three minor injury crashes and five non -injury crashes. Site 2 RP 58/0/ The minor injury crash involved a westbound van travelling too fast when entering a corner, losing control when turning left and hitting guardrail/barrier. The non-injury crashes were single vehicle loss of control. 66% (2) of the crashes occurred in wet or icy conditions, including the minor injury crash. One non-injury crash occurred in dark (night/twilight) conditions. Site 3 RP 58/0/ Both minor injury crashes occurred in wet conditions, with the driver entering the corner to o fast; resulting in one loss of control while overtaking and one rear end crash. The non-injury crashes involved three bend loss of control crashes, one loss of control head-on crash and one hit object. 57% (4) of the reported crashes occurred in wet or icy conditions including both minor injury crashes. o 43% (2) of the reported crashes occurred in dark conditions (non-injury). Project No.: Page 34 Our ref: SH58 Addendum Report_Final Draft
39 Realignment Site Location Fatal Crashes Serious Minor Non- Injury DSI Comments The two fatal crashes occurred approximately 3 months apart, both were eastbound loss of control head -on in wet conditions on the departure of the scour site curve. Both crashes occurred while a temporary speed limit was in place at the site. Site 4 RP 58/0/ The serious injury crashes involved: An eastbound car entering a corner too fast, losing control when turning and colliding with another car head on, similar to the two fatal crashes. An eastbound van losing control turning right colliding with a fence, flipping down a bank and coming to rest in a small stream. The minor injury crashes involved: Four eastbound and one westbound bend loss of control followed by hit object (cliff/bank, poles, and fence). One eastbound bend loss of control head on crash. The non-injury crashes involved 16 bend or straight loss of control /head on crashes and one rear end crash. o 74% of reported crashes occurred in wet conditions including all fatal and serious injury crashes, and five of the minor crashes. o 29% of crashes occurred in dark conditions, these were all non-injury crashes. The fatal crash occurred when a westbound van lost control while overtaking on a wet surface with worn tyres. Site 5 RP 58/0/ The minor injury crashes included A westbound car travelling too fast and losing control on a bend hitting the embankment. An eastbound cyclist lost control hitting an object on the road. A westbound motorcyclist losing control on a bend. The 12 non-injury crashes included; nine bend lost control crashes seven of which hit guardrail/barrier, and three crash occurred while overtaking (two lost control while overtaking). o 56% of the crashes occurred in wet or icy conditions including the fatal crash, two minor injur y crashes and six non-injury crashes. o 25% of the crashes occurred in dark (night/twilight) conditions including two minor injury crashes. Project No.: Page 35 Our ref: SH58 Addendum Report_Final Draft
40 Realignment Site Location Fatal Crashes Serious Minor Non- Injury DSI Comments Remaining Midblock Sections The remaining approx. 6km section of the SH58 project extents The serious crashes included: Four loss of control crashes, one occurred while overtaking another vehicle. One head-on on bend crash, One rear-end crash were an eastbound vehicle hit a cyclist. 55% of crashes were loss of control, 17% crossing/turning, 11% Rear end/obstruction, 11% overtaking, and 6% head-on. When considering the three high risk rural roads guide (HRRRG) high severity crash types, run off road crashes account for 66% (54% nationally42), head on 17% (21% nationally) and intersection -% (13% nationally). Compared to national figures, this section of highway is overrepresented in high severity run off road crashes. 43% of the crashes occurred in wet/icy conditions, seven minor and 21 non-injury crashes. Project No.: Page 36 Our ref: SH58 Addendum Report_Final Draft

41 4.5.3 Crash Risk The project area has been assessed using both the High Risk Rural Roads Guide 43 (HRRRG) and the draft High Risk Intersections Guide 44 (HRIG). Refer Appendix B for crash risk calculations. Based on published 2012 KiwiRAP risk maps SH 58 from Porirua to SH 2 Upper Hutt has: High collective risk (annual average fatal and serious injury crashes per km); and Low-medium personal risk (annual average fatal and serious injury crashes per 100 million vehicle km). Due to the high collective risk (ranked 12 th nationally), the entire rural length of SH58 is classified as a high-risk rural road. The calculated KiwiRAP star rating for this section of SH58 is 2.7, resulting in a published 2 star KiwiRAP rating. This is below SH58 s One Network Road Classification (ONRC) Safety Customer Level of Service aim of Mostly KiwiRAP 3-star equivalent or better for a Regional Road. The crash risk for the project length is as follows: High collective risk (0.27 high severity crashes per km per year). Medium personal risk (5.2 high severity crashes per 100 million veh km). Therefore this section is classified as a high-risk rural road with predominately a Safer Corridors treatment strategy. In addition, due to the high volume of the route, there is justification for medium to high cost improvements under a Safe System Transformation treatment strategy. Potential treatment strategies could include providing corridor roadside hazard treatment, intersection improvements, corridor shoulder widening, curve easing and median treatments 45. Moonshine Rd Bradey Road DSI Eq: minor crash DSI Eq: serious 2 minor crashes Belmont Road DSI Eq: serious and 1 minor crash Flightys Rd/ Murphys Rd DSI Eq: minor crashes Figure 4-14: SH58 Collective Risk and Intersection Risk (Source: NZTA SafetyNET) 43 High Risk Rural Roads Guide (HRRRG), NZ Transport Agency, September High Risk Intersection Guide (HRIG), NZ Transport Agency, August As outlined in Section 2, research has shown that as traffic volumes exceed 6,000 AADT, the head on high severity crash rate exceeds the run off road crash rate. Project No.: Page 37 Our ref: SH58 Addendum Report_Final Draft
42 Figure 4-14 above also identifies a number of medium risk intersections, these are further detailed in Table 4-14 below. Two intersections in the study area were identified as having three or more injury crashes, in the five year period These include; Moonshine Road and Flightys/Murphys Road. Both intersections were analysed further according to the HRIG with the treatment philosophy detailed in the table below. The treatment philosophies for both intersections indicate there is justification for a change in intersection form. Refer Appendix B.2 for the full HRIG analysis. Table 4-14: Intersection Risk Summary Intersection Collective Risk DSI Equivalent Crash comments HRIG Treatment Philosophy Hugh Duncan St Low 0 - N/A Mt Cecil Road Low 0 - N/A Harris Road Low 0 - N/A Moonshine Road Medium Serious and 1 Minor Safety Management or Safe System Transformation Works Flightys Rd/Murphys Rd Medium 1.10 Belmont Rd Medium Minor crashes 1 Serious and 1 Minor Safe System Transformation Works Bradey Rd Low Medium Minor crash N/A Crash Rate The site specific crash rate for each site has been compared to what would be expected as typical. The typical crash rate was found for each of the curves using the crash prediction model for mid-block crashes in the New Zealand Transport Agency s Economic Evaluation Manual (EEM) Midblock An analysis of the 2010 to 2014 crash data shows that 31 injury crashes occurred in the latest five year period (6.2 injury crashes per year). The typical crash rate was found to be 5.7 injury crashes per year based on 2015 traffic flows at the telemetry site; indicating that the project extent is performing approximately 10% worse than expected, after taking into account the traffic volume and highway form Realignment Sites An analysis of the 2010 to 2014 crash data for the five realignment sites shows that 22 injury crashes occurred in the latest five year period (4.4 injury crashes per year). The typical crash rate was found to be 3.4 injury crashes per year based on 2015 traffic flows at the telemetry site. This indicates that the crash rate along these realignment sites is approximately 30% higher than expected. The curve context table within the RAMM database identifies curves considered to be out of context with the surrounding road environment. Part of this table includes a predicted collective crash risk for each curve included, based on New Zealand curves. The predicted crash rate for the five realignment curves was calculated as 3.6 injury crashes per year; higher than the typical EEM model but still over 20% lower than the actual realignment crash rate. Table 4-15: Realignment Crash Rate N/A Parameter Injury Crashes per Year Site Specific (Actual) Realignment Crash Rate 4.4 Typical Crash Rate (EEM) 3.4 Predicted Crash Rate (Curve Context RAMM) 3.6 Project No.: Page 38 Our ref: SH58 Addendum Report_Final Draft
43 4.5.5 Overall Crash Summary The crash analysis highlights: Crash history and trends o o o Crash risk o o o o There have been a 12 high severity crashes, resulting in 13 DSI, in the five year period from This includes three fatal crashes. Run off road and head on crashes contributed to 75% of the reported crashes and over 80% of the high severity crashes. Compared to national figures, this section of highway is over represented in both high severity run off road crashes and high severity crashes which occur in wet conditions. Of the five realignment sites, site 4 (the Scour Site) has the largest number of overall crashes, injury crash rate and DSI. Due to the high collective risk (ranked 12 th nationally), the entire rural length of SH58 is classified as a high-risk rural road. The calculated KiwiRAP star rating for this section is 2.7, below the One Network Road Classification (ONRC) Safety Customer Level aim of Mostly KiwiRAP 3-star equivalent or better for a Regional state highway. Three intersections were identified as being Medium collective risk including; Moonshine Road, Flights/Murphys Road and Belmont Road. Crash rate analysis shows that SH58 has experienced more crashes than expected, when assessed against either the corridor or specific realignment sections. Overall, the high speed environment, poor horizontal alignment (out of context curves), roadside hazards and narrow cross section all contribute to the high severity crashes experienced and the ongoing high injury crash risk. 4.6 Active Modes Data The section of SH58 between SH2 and Pauatahanui provides a popular recreational cycle route. In order to quantify the typical level of cyclist usage over this section, a manual cyclist count was undertaken via footage recorded by a mounted NZ Transport Agency camera located as shown in Figure 4-8 below. Counts were completed during a weekday morning and afternoon period (i.e. Friday 7:30am 9:30am and 2:30pm 4:30pm) and a full weekend day (i.e. Saturday 7am - 6pm) in February The manual counts were then converted via the Cycle Network and Route Planning Guide (CNRPG) method to provide an equivalent AADT for the section. The following table provides a summary of the count data and calculated AADT values: Table 4-16: Summary of Cyclist Activity SH58 Period Manual Cyclist Count Friday Morning Period 7:30am 8:30am 1 8:30am 9:30am 0 Total 1 AADT (Fri AM) 2.6 Project No.: Page 39 Our ref: SH58 Addendum Report_Final Draft
44 Period Manual Cyclist Count Friday Afternoon Period 46 2:30pm 3:30pm 0 3:30pm 4:30pm 0 Total 0 AADT (weekday average) 1.3 Saturday 7:00am 8:00am 5 8:00am 9:00am 7 9:00am 10:00am 40 10:00am 11:00am 33 11:00am 12:00pm 8 12:00pm 01:00pm 2 01:00pm 02:00pm 2 02:00pm 03:00pm 2 03:00pm 04:00pm 3 04:00pm 05:00pm 0 05:00pm 06:00pm 1 Total 103 AADT (Sat) 156 AADT (weekend average) 156 It can be noted from the resulting data, that the weekend morning peak period (9:00am 11:00am) accounts for a heavy majority of the cyclist activity for the route, which indicates this route is largely used by weekend recreational cyclists, rather than commuters. In addition, the 2015 Strava Labs 47 heat map shown in Figure 4-8 indicates comparative levels of tracked cyclist activity on SH58 (red=high, yellow=low). As depicted below, the largest mid-route source of cyclist trips stem from Moonshine Road, with higher volumes of cyclists between Moonshine Road and Pauatahanui than from SH2 to Moonshine Road. 46 The video data captured during the assessment ended at 4.30pm, the PM peak for cycling was therefore not recorded during this short assessment period. 47 It is noted that Strava data has a selection bias; however, it provides one data source in lieu of more detailed actual counts or estimates. Project No.: Page 40 Our ref: SH58 Addendum Report_Final Draft

45 Pauatahanui Moonshine Rd NZTA Traffic Camera AADT (weekday) = 1.3 AADT (weekend) = 156 SH 58 SH 2 Figure 4-15: Strava Labs Heatmap for cyclist activity for Public Transport Data One bus service and three school bus service routes operate through SH58 between SH2 and Pauatahanui. These Routes are: 97H; 2 services daily (purely commercial), westbound AM, eastbound PM; 970; 2 services daily (term times only), westbound PM, eastbound AM; 971; 2 services daily (term times only), westbound PM, eastbound AM; and 973; 2 services daily (term times only), westbound PM, eastbound AM. There are seven locations on the route where there are stops. These are: Hillside (near McDougall Grove); Substation Hail to Ride (eastbound only); (near Judd s Farm) Hail to Ride; At Moonshine Road; At Mulherns Road; At Flightys Road / Murphy Road; and At Mill (between Bradey and Belmont Road). Project No.: Page 41 Our ref: SH58 Addendum Report_Final Draft
46 5 Consultation & Stakeholders 5.1 Pre-existing information SH58 Strategy Study Consultation (2009) During the production of the 2009 Strategy Study, meetings were undertaken with Porirua City Council, Upper Hutt City Council and Greater Wellington Regional Council. These meetings were used to provide an understanding of the content and proposed works broadly detailed within the developing strategy, and to seek input from these stakeholders. There are no specific issues or details in the minutes of these meetings that warrant particular discussion or repeat here. One aspect that was raised by local authorities was a desire to understand timing of strategy study recommended works and allowance for future growth Petone to Grenada Engagement Feedback (mid-2014) As part of the engagement process for the P2G Link Road project, the Transport Agency encouraged feedback and received a large number of submitters on SH58 (although this was not a topic specifically consulted on). At the time of the above consultation, a number of members of the public were concerned about project options for the P2G Link Road which involved the creation of a Takapu Link Road to TG or widening of SH1 between Tawa and Linden to mitigate future capacity concerns. These proposals were perceived by members of the public as being an unnecessary addition to the P2G Link Road, and as an alternative to these proposals, a number of members of the public proposed the four-laning of the SH58 route in order to avoid providing additional capacity on either a Takapu Link or in the widening of SH1. Subsequently, a detailed MCA process was followed which resulted in a proposal to futur e proof for further capacity requirements through a managed motorway proposal on SH1 rather than widening or a Takapu Link. The P2G Link Road Engagement Report can be located at: pdf A common response centred on a preference to see SH58 being a priority for investment (over P2G), with the following overarching themes: Being the better use for state highway investment. SH58 improvements going ahead as an alternative. Upgrading to a motorway standard. Widening SH58 to 4 lanes and providing a full interchange at Haywards/SH2 intersection. The main points made by submitters in relation to SH58 are provided below. Many submitters outlined that they thought SH58 should be the main route of resilience. Comments relating to the resilience of SH58 in the context of this project related to: Volume of SH58 increasing on completion of TG; and SH58 being more resilient to earthquakes and further from fault lines in comparison to P2G. Many submitters also commented on SH58 being a more direct route. Common responses related to: SH58 being more direct westbound route for much of the Hutt Valley; That SH58 is a more appropriate route from Porirua to the Hutt; SH58 provides better access to Upper Hutt as well as Lower Hutt; and Everywhere north of Petone will use SH58 over P2G. Of particular interest for the SH58 Safety Improvements project, many submissions also highlighted the unsafe nature of SH58 at present. It was outlined that improvements needed to occur before the opening of TG when traffic on the route will greatly increase. Other responses related to: Project No.: Page 42 Our ref: SH58 Addendum Report_Final Draft
47 Not improving SH58 will result in more deaths and serious injuries; It is a known blackspot; For safety alone, upgrading SH58 should be a priority; and Not widening SH1 North of Grenada might cause delays due to an increase in future traffic volume in a few decades time. Several submitters commented on the need for improving the intersection between SH2 and SH58. Several submissions commented on the comparative cost of the P2G Link Road with upgrading SH58 and that this is likely to be far less. Many submitters also commented on comparative gradients and distances between the P2G route and SH2/SH58 route with many outlining that a SH2/SH58 route west has a less steep gradient than that of P2G/TG. 5.2 Consultation Process The SAR stage consultation was undertaken in late 2014 to obtain feedback from landowners, stakeholders and the general public on the proposed safety upgrades of Option 4, while design for the improvements were at an early stage. The following actions were undertaken: Letters were sent to the interested parties to outline progress and options and seeking feedback and arranging a meeting with the Transport Agency representatives to discuss the proposed improvements. Individual meetings were held for directly affected landowners and stakeholders. Open Day sessions were held for the general public. The following groups to be consulted were identified as follows: Directly Affected Landowners: Landowners whose land would likely to be required for the proposed safety improvements. Landowners Affected by Access: Landowners adjacent to the project area whose access to SH58 from their properties is likely affected by the proposed safety improvements (including the proposed median barrier). Hugh Duncan Street/McDougall Grove residents: Residents and/or the property owners of Hugh Duncan and McDougall Streets while not directly affected by the upgrades, had been previously involved with proposed upgrades to SH58 by the Transport Agency and were included for this reason. Interested Stakeholders: The stakeholders included groups such as Cycle Aware, the NZ Police and Iwi. The consultation activities comprised: Open days at Pauatahanui and Upper Hutt; A mail out; and One on one meetings with landowners. 5.3 Stakeholders In addition to the directly affected residents and businesses along the corridor, the wider local community and road users, stakeholders for the project were identified as: Hutt City Council; Upper Hutt City Council; Porirua City Council; Project No.: Page 43 Our ref: SH58 Addendum Report_Final Draft
48 Greater Wellington Regional Council; Hugh Duncan Community; Fletcher Concrete and Infrastructure Ltd (Winstones Aggregates); Transpower New Zealand Ltd; Police Safety and Security; NZ Automobile Association; Cycle interest group; Heavy Haulage Association; Road Transport Forum NZR; Road Transport Association New Zealand; Iwi; and Britton House Movers (located at intersection of SH2 and Harris Road) 5.4 Consultation Outcomes The main themes and issues that arose from the consultation are summarised below. These themes and issues have been sourced from the consultation records Landowners Feedback from directly affected landowners and landowners whose access would be affected, identified that they acknowledged the high number of crashes that occur on SH58 and were generally supportive of the project. Most of the landowners, while being supportive of the proposed speed reductions and realignment of SH58, were concerned about the loss of land, changes to private access to SH58 and the left-in, left-out access that would result from the median barrier Submissions Submissions made using the feedback forms provided at the Open Days and electronically on the project website were compiled and analysed. Seventy one submission forms were filled out from the Pauatahanui Open Day. There were 68 submissions lodged on the project website. Submitters generally supported the proposed safety upgrades (80% of submissions were in support). Sixty percent of submissions supported the median barrier. Seventy five percent of submitters supported the reduction of speed propos ed. Sixty five percent of respondents supported the proposal to install a wire rope barrier along SH58. Public opinion on the project was gauged via the open days held at the Pauatahanui School and the Upper Hutt library. Over 200 people attended the Open Days. The following themes were identified through conversations and break-out meetings with attendees: General support for lowering the speed limit. General support for fixing the scour site corner and installing the median barrier. Concern was expressed by the residents of Flightys and Murphys Roads regarding the long wait and confusion at these intersections, particularly when cars are waiting to exit both intersections. Safety at Flightys and Murphys Roads are exacerbated at school pick up and drop off time due to the bus stops at the intersection. Provision for children crossing the road to get to the bus stop was requested. The difficult entrance/exit arrangements on/off SH58 at Flightys Road creates an increased probability of crashes The following themes were identified from the website submissions: Project No.: Page 44 Our ref: SH58 Addendum Report_Final Draft
49 The median barrier will reduce space for cyclists and motorcyclists and will be dangerous. General support for the reduction in speed. Those opposed to the reduction in speed generally feel that it would not reduce the amount of crashes on SH58. General concern about the change in access proposed at intersections, particularly at the intersection of Harris Road and SH58. General concern that the design does not cater enough for cyclists who use the road Consultation Summary The consultation undertaken to date on the proposed SH58 safety improvements concept design was intended to provide information to, and seek feedback from, affected persons and stakeholders and the general public. The information gathered will inform the next stage of design prior to more detailed consultation with those who are directly affected by the upgrades as part of the preparation of the NoR and any resource consent applications that may be required under the RMA. Relationships have been initiated with landowner, stakeholder and the general public by the exchanging of information at an early stage of the design. The feedback sought from the consultation has been recorded. The consultation process has been successful in yielding information that will be used in the next stage of design. The top five issues identified during the consultation by the public, landowners and stakeholders are: The land purchase proposed; The inconvenience of altered private access to SH58; Safety of turning arrangements at intersections due to the proposed median barrier restricting right turns; The safety upgrades do not cater for cyclists and motorcyclists; and The upgrades will increase noise and stormwater run-off. The changes made to the project as a direct result of the December 2014 consultation process are described in Section It is noteworthy that very few comments were received during the public consultation in relation to a desire from the community for four-laning of SH58. Project No.: Page 45 Our ref: SH58 Addendum Report_Final Draft
50 6 Option Description Refer to Rev4 of the SAR for a full detailed description of the originally investigated project options, the change and subsequent refinement of the scope, and selection process for the recommended option. Detailed below in Section 6.1 is a brief summary of the recommended options during various milestone stages of the SAR, and a description of how these were arrived at, and then refined. Section 6.2 describes the changes made to the preferred option proposed by this SAR Addendum (i.e. changes made since Rev4 of the SAR). 6.1 Option Development & Refinement Option 3 Of the initial three cross section options considered for the corridor improvements, Option 3 was selected as the recommended option at that time 48. Option 3 consisted of carriageway widening to achieve 1.5 m shoulders, 3.5 m traffic lanes and a 2.0 m wide median with median wire rope barrier provision, as shown on the typical section below: Figure 6-1: Original Option 3 Cross Section Typical Detail In addition, Option 3 also included the four horizontal curve realignment sites (Sites 1-4) described in Section Option 4 Prior to stakeholder and public consultation, Option 3 was further refined to create Option 4. Option 4 was created on the basis of identifying any areas within the project extent that could be amended to improve the efficiency of the overall scheme design. This optimisation had dual purposes; firstly to ensure the project fits within a likely envelope of affordability, and secondly, to ensure a suitable level of economic efficiency and value for money. The changes made to Option 3, to create Option 4 are detailed below: Removal of Site 1 Realignment: Due to the challenging topography through this section, the earthworks quantities were calculated as being extremely significant in terms of cut material volumes which had a consequential effect on the scheme estimate. Realignment of this section was therefore omitted in Option 4, with only an improved cross section proposed. The suitability and implications of this approach are described in detail in Rev4. Project Western Extent (Bradey Road): Originally the western extent was proposed to extend to just east of the Pauatahanui Roundabout. Given the extent of the proposals for TG, the section of SH58 improvements between Bradey Road and Pauatahanui Roundabout were removed. Accordingly, 48 Refer Rev4 of the SAR for further detail. Project No.: Page 46 Our ref: SH58 Addendum Report_Final Draft
51 610m of the project was removed with the revised project extent consequently ending immediately east of Bradey Road. Do-minimum speed: The do-minimum option speed for the project length was reduced from the current 100km/h posted speed limit, to 80km/h. This reduction was on the basis of the NZ Transport Agency staff advising that they are already planning to reduce the speed limit given the high risk nature of this section of SH58 and the poor crash history 49. Option 4 was the corridor option consulted on with stakeholders, affected landowners and the wider community in late Scour Site Realignment Acceleration (Realignment Site 4) Early in the SAR investigations during 2013, it became apparent that there was a clear network maintenance issue at one particular location on the SH58 Corridor being investigated. This location, at approximately RP0/3.75 had been a known issue for a number of years and subject to various investigations (since at least 2010). The site has become known generally as the Scour Site - a steep north-east facing slope at a pinch point on SH58 where Pauatahanui Stream was eroding the toe of the slope and which consequentially is causing the highway shoulder to fail (with the shoulder being approximately 0.5 m wide at this point). The general focus of potential remediation has shifted throughout the intervening period. Initially, the emphasis being on protecting the road from the stream scour. This subsequently developed into realignment of the stream itself, to provide an increased offset from the stream to the scoured slope face. When progress with the stream realignment was stalled due to consenting issues with Greater Wellington Regional Council (GWRC), further options were then considered relating to the road realignment. Multiple options were then considered for realignment, including minor, mid-range and full realignment as per the proposals in the developing SAR (i.e. Realignment Site 4). The need for realignment was further brought into focus due to two separate fatal crashes occurring at the Scour Site curves during late 2013 and early As a result of the extremely poor crash history at this location, in combination with the maintenance issues and road undermining, the Transport Agency made the decision to expedite the scour site realignment. The decision was made to provide the full SH58 SAR realignment as opposed to providing a less significant realignment in the first instance, which would subsequently be realigned again with the wider SH58 SAR improvements. Figure 6-2: Typical Cross Section Detail of Scour Site Realignment Works The Scour Site realignment physical works were commenced in late 2014 and are substantially complete. The works have provided cross-sectional upgrades for 860m of length (RP0/3.00 to RP0/3.86), together with realignment of a horizontal curve within the upgrade extents (Site 4 realignment of horizontal curve No. 16). The curve realignment has removed the broken back alignment of two same direction curves (of 290m and 160m radii with varying and excessive superelevation) to a 49 Refer Section 7 for further information on legal speed limit. Project No.: Page 47 Our ref: SH58 Addendum Report_Final Draft

52 single horizontal curve with radius of 425m. The improved section has removed a short substandard westbound passing lane, and also has median barrier throughout together with extensive edge barrier protection. Figure 6-3: Photograph of Scour Site Realignment works during construction For the purposes of this SAR Update, the improvement works at the Scour Site form part of the overall corridor improvements. This is on the basis that the improvement works are part of a corridor strategy that requires a consistent and continuous level of upgrade throughout the corridor length. The costs and benefits of works along the corridor should be considered holistically so that the suitability of the overall corridor treatment can be assessed. There is also a risk that by removing the costs and benefits of the Scour Site improvements from the wider corridor, that the overall economic efficiency reduces because one particular high risk site has been treated. This approach is not advocated because the risk along the entire corridor remains significant and the historic crash data only provides a snapshot in time of where actual crashes have taken place, rather than considering risk along the entire corridor, where the KiwiRAP star rating system provides a better forward looking predictor of safety performance. 6.2 Option 5 Development Following the development of Option 4, it was determined that a further option should be co nsidered that provided a more comprehensive and robust whole-of-corridor improvement, and is therefore presented in this SAR Addendum. The general basis of Option 5 retains those cross section and realignment improvements from Option 4; the additions to the corridor improvements are described below Interface with SH2/SH58 Interchange When the SH58 Corridor SAR work was commenced in 2013, the proposed improvements at the intersection of SH2/SH58 intersection were well established and a proposed design was in an advanced state of development. However, it was envisioned that the new interchange would be constructed here within the next 10 years (i.e. by 2023). In recognition of this, and to ensure that works proposed within the SH58 Corridor SAR (and any subsequent design phase or physical construction), the project extent for the SAR was set 300 m back from the existing intersection, recognising that the interchange works would extend back a considerable distance from the existing traffic signals. With the accelerated delivery of the SH2/SH58 interchange, there is now certainty as to the design, and extent, of the interchange works. This means that the SH58 SAR Corridor works can be tied into the Project No.: Page 48 Our ref: SH58 Addendum Report_Final Draft
53 extent of the interchange construction with confidence that there will not be unnecessary sacrificial works. Option 5 of the improvement works in the SAR therefore seeks to connect in closely to the extent of works proposed in the SH2/SH58 interchange construction, which is a point on SH58 to the immediate west of the McDougall Grove / Annabell Grove intersection. This effectively shortens the SH58 Corridor SAR works and ties in closely to the interchange works given the interchange design work is complete. Therefore the Option 5 scheme stage design seeks to tie into the latest version of the proposed works for SH2/SH58 interchange works on SH58, recognising that this project is in the early stages of construction via a Design & Construct procurement method Reintroduction of Site 1 Realignment During the initial SAR development, it was intended to realign two of the easternmost horizontal curves on SH58 west of Hugh Duncan Street, to 280mR and 400mR respectively. This section of realignment, was termed Site 1 Realignment. Realignment of these curves was therefore proposed as part of Option 3. Due to the topography through this section, the size of the cut faces and volume of material resulting from realignment through this section is extremely significant, with cut faces up to 40 m in height. The cost of the earthworks alone for realignment of these two curves, to the radii described, was estimated to be $2M+. At that time, and in order to achieve an affordable scheme design that would demonstrate an acceptable level of economic efficiency, a number of options were considered to reduce the estimated costs. This cost reduction and optimisation process involved a number of changes to reduce overall project works, with the optimised option renamed from Option 3 to Option 4. In Option 4 Realignment Site 1 was omitted from the project, but with an improved cross section and median wire rope barrier still proposed. Whilst this reduced the volume of earthworks significantly, substantial cuts would still have been required to accommodate the wider cross section given the proximity of the bluff faces to the road edge and the constrained highway width at this location. It was recognised that the removal of this section of realignment would result in some loss of the overall safety benefits that the scheme expected to achieve; however, given the improved cross section, the median wire rope barrier (and probable edge barrier), potential for a posted speed reduction on the entire corridor (from 100km/h to 80km/h) plus the proximity to the SH2/SH58 interchange works, then removal was considered acceptable. Since the project has been effectively on hold since the end of 2014, the approach to the treatment of this realignment has been reconsidered. In considering the overall expenditure on the corridor itself, together with the expenditure at both extents (SH2/SH58 interchange and SH58/TG interchange), it is no longer considered suitable to retain a short section of the highway that is substandard without being realigned as part of the overall works, as this would be out-of-context and would, at some future point, require further improvements which would not represent a cost-effective approach. Realignment Site 1 is now reintroduced into the project works as part of the Option 5 proposals Post Consultation Modifications Following the late 2014 stakeholder and community consultation process and compilation of feedback, it was apparent that there was considerable public support for introducing a new roundabout on SH58 at the intersection of Flightys Road and Murphys Road. A roundabout at this location had been considered as part of the initial scheme design, as well as being a recommendation of the 2009 SH58 Strategy Study. It was ultimately omitted from the projects proposals that were consulted on the basis that it would create significant delay to state highway through traffic, and in relatively close proximity to the new roundabout already proposed in the SAR at Moonshine Road. Furthermore, the crash statistics at this intersection did not necessitate a wholesale intersection control change. The feedback from stakeholder and community consultation again highlighted the support for a roundabout at this location to assist with turning movements at this intersection, as well as vehicle turnarounds necessitated by the proposed median barrier and has therefore been introduced to the proposed corridor works as part of Option 5. Project No.: Page 49 Our ref: SH58 Addendum Report_Final Draft
54 To facilitate a roundabout at this location, it is necessary to realign both Flightys Road and Murphys Road, which also involves a new bridge on Flightys Road. A separate technical note on the new roundabout and bridge is provided as an Appendix to Rev4 (Appendix T). With a new roundabout proposed at this location, to complement the roundabout proposed at Moonshine Road, it is also possible to alter the intersection at Mulhern Road to permit left-in/left-out movements only. This is highly desirable given the tight nature of this intersection and large numbers of heavy vehicles that access this road. The two new roundabouts provide excellent turning facilities in close proximity, whilst only requiring a fairly minimal detour. Following feedback from Transpower representatives, the proposed access to the Transpower site has been changed. Instead of allowing all movements, except right turns out at Old Haywards Road 50 as was initially proposed, they have expressed a desire to maintain right turns in at Kaitawa Street. The proposals have therefore been updated to allow for this. Given the proximity to Hugh Duncan Street (to Kaitawa Street) and presence of the uphill passing lane, this change has necessitated also making Hugh Duncan Street left-in, left-out and right-in only 51. This is not expected to be problematic given the diversion length for right turns out of both locations is less than 2km, using the SH2/58 interchange. From a Safe System perspective, this is also preferable. No other project changes have been proposed following community consultation Bridges & Structures For Rev4 of the SAR, a high level structural assessment was undertaken of the nine existing structures identified along the corridor extent. This high level assessment comprised a desk top study and walkover based assessment that considered whether the existing structures would be suitably compatible with the wider corridor improvements being proposed within Option 4. The key aspects being considered to formulate a recommendation for improvement works were: Expected remaining life Width and therefore suitability for cyclists Suitability for installation of median wire rope barrier These factors were selected on the basis of ensuring route consistency, together with addressing a theme from the public consultation where cyclists raised a number of locations where the available width was constrained and therefore made cycling over these structures uncomfortable. The structural works recommended in the Rev4 Assessment are detailed below: 50 Right turn in would be permitted but right turns out would be prevented to avoid a merge on a passing lane on an uphill 9% grade, by providing overlapped guardrail. 51 To be achieved by staggering / overlapping guardrail. Project No.: Page 50 Our ref: SH58 Addendum Report_Final Draft
55 Table 6-1: Initial High Level Structural Assessment Summary Structure Dry Creek Quarry Culvert (RP 0/0.33) BSN 38 Culvert (RP 0/3.84) Pauatahanui Culvert No.1 (RP 0/5.99) Pauatahanui Stream Bridge No.2 (RP 0/6.87) Golf Course Subway (RP 0/6.92) Remaining Life (Years) Wideni ng Req. WRSB* Possible Weight Restriction Recommendation Estimated Cost($NZD) 50 No yes no do nothing 0 50 No yes no do nothing 0 50 No yes no do nothing 0 20 Yes yes no 90 Yes yes no widen one side widen one side 200,000 90,000 Pauatahanui Stream Bridge No.3 (RP 0/7.45) 20 Yes yes (if widened) no widen one side, separate cycle bridge other side 270,000 Murphy s Road Culvert (RP 0/8.16) Pearce Bridge (RP 0/8.36) Pauatahanui Stream Bridge No.7 (RP 0/8.97) Replacement recommended by Network Consultant No yes no do nothing 0 80 No yes no do nothing 0 80 Yes yes no widen one side 340,000 New Flightys Road Bridge NA NA NA NA New bridge 420,000 *WRSB: Wire Rope Safety Barrier The cost of these structural works is now included in the cost estimate for Option 5 (as well as the economic evaluation undertaken). Whilst these costs have now been included in the project expected estimate, it is important to note the high level nature of this assessment and that no level of concept design has been undertaken. On this basis, the project cost estimate has allowed a 50% contingency for all structural works noted above. The proposed new bridge at Flightys Road (which has also not been subject to any level of design work), has been estimated to have a physical works cost in the region of $420, Realignment of Site 5 A further change being incorporated into Option 5 is the realignment of three additional horizontal curves. Previously, these horizontal curves, located m from the SH2 intersection (and situated between the proposed realignment Site 2 and Site 3), had not been proposed for realignment. The two curves necessitating this section of realignment have fairly tight horizontal radii, or 185 m and 250 m (Stn and 2140 respectively). The environment through this section of SH58 is also an extremely constrained section of the road characterised by large vegetated bluff faces (of up to 40 m in height) on the western side and steep gullies on the east of the existing road alignment. Greater Wellington Regional Council also operates large capacity water infrastructure in close proximity to the existing road on the western side of the highway with a number of large sized water tanks and a pump station in existence along this section. These two curves were previously excluded from the Rev4 SAR due to them not having being investigated in the 2009 PFR for realignment, and it is envisaged they were omitted during the previous Project No.: Page 51 Our ref: SH58 Addendum Report_Final Draft
56 PFR due to the complexity and cost factors that create difficulties in attempting to rectify the horizontal geometry through this section. With the creation of Option 5, and the wholesale improvements being considered for the corridor, not realigning at these two curves would result in a situation where they would become out of context to the rest of the corridor and subject to greater crash risk with potential crash migration. These two curves are therefore proposed for horizontal realignment as part of the Option 5 update. It is proposed to realign both of these curves to 350 mr. Whilst this does result in a very significant volume of earthworks and cut material, it does maintain a good level of horizontal curve consistency along the corridor. 6.3 Median Barrier Provision During the option development, significant emphasis and analysis was undertaken as to where to continue the median barrier through a side road intersection (creating a left in/ left out arrangement) or where the barrier should be broken. This has significant implications for users of SH58. The proposed intersection treatments are summarised below: Table 6-2: Option 5 Intersection Access Arrangements Location RP Proposed Treatment Right Turn Alternatives Comments Hugh Duncan Street 0/0.95 WRB broken to allow right turn in only, right turn bay provided Right turn entry provided for. For exit, turnaround at SH2/58 Right turn out not possible to provide with proximity of Kaitawa Street right turn bay. Kaitawa Street 0/1.17 WRB broken to allow right turn in only, right turn bay provided Right turn entry provided for. For exit, turnaround at SH2/58 Substation Access. Transpower have requested right turn in availability. Right turn out not feasible. Atiamuri Crescent 0/1.33 WRB through intersection left in and out only U turn at Old Haywards Road for entry. For exit, turnaround at SH2/58 Substation Access Transpower currently operate with LILO access. Old Haywards Road / Substation access 0/1.44 WRB through intersection left in and out only Right turn entry provided for at Kaitawa Street. For exit, turnaround at SH2/58 Right turn out prevented to avoid a merge on a passing lane on an uphill 9% grade. Right turn in provided at Kaitawa Street following feedback. Mount Cecil Road 0/2.99 WRB broken to allow all movements, right turn bay provided None required Very low volumes 20 ADT and on apex of crest but zero crashes and difficult to provide alternatives Harris Road 0/4.47 WRB broken to allow all movements, right turn bay provided None required Low vehicle flows (32 ADT ) however right turns allowed to cater for business. Preventing right turns out was considered but rejected. Passing lane reduced in length to allow right turn bay. Project No.: Page 52 Our ref: SH58 Addendum Report_Final Draft
57 Location RP Proposed Treatment Right Turn Alternatives Comments Moonshine Road 0/6.32 Roundabout proposed to provide full access and turnaround facilities None required 576 ADT (2010) low count compared to MWH short term pm peak survey (approx. 1,200 vph) Mulhern Road 0/7.31 WRB through intersection left in and out only Roundabout at Murphys / Flightys and roundabout at Moonshine Road More appropriate turning facilities in close proximity. Murphys Road /Flightys Road 0/8.01 Roundabout proposed to provide full access and turnaround facilities None required High vehicle numbers and a number of intersection crashes here. Roundabout provides good turning provision for other intersections and accessways. Belmont Road 0/8.37 WRB through intersection left in and out only Right turn entry turnaround at Moonshine Road. Right turn exit, turnaround at Pauatahanui roundabout Due to presence of horizontal curves, allowing right turn in and out is not appropriate A thorough assessment has been undertaken as to where the proposed wire rope barrier could be broken and the effect this would have directly on access. In addition, a key component of any proposal to prevent direct access is a consideration of alternative turning locations in terms of the location, diversion length and safety (both in terms of actual crashes and also crash potential). Whilst the proposals submitted are considered a good solution in terms of balancing access provision, safety and reasonable turnaround alternatives, it is accepted that there are other options that exist that may also offer suitable levels of access and could indeed be preferable to some of those affected. It is recognised that the provision of median barrier with the effect of limiting access and forcing vehicles to divert is a highly contentious and emotive issue for those affected. 6.4 Project Access Plan A schematic of the proposed project works is provided below. This plan details the project extents, the realignment site locations, the proposed new roundabout locations and the movements available at each intersection (as a result of the proposed breaks in the median barrier). For more detail please refer to the Scheme Drawings Scheme Drawings are contained in Appendix F Project No.: Page 53 Our ref: SH58 Addendum Report_Final Draft

58 Figure 6-4: Proposed project works Project No.: Page 54 Our ref: SH58 Addendum Report_Final Draft
59 7 Legal Speed 7.1 Background The NZ Transport Agency has been considering whether to reduce the legal speed along SH58, between SH2 and Lanes Flat, since Whilst the speed reduction was not specifically part of the physical works investigation, it needs to be considered alongside the physical works proposals. A Speed Limit Review Report 53 undertaken in 2013 included a speed limit warrant (between SH2 and Lanes Flat) in accordance with Speed Limits New Zealand and determined that the recommended speed limit from the warrant is 100km/h. Irrespective of the warrant, the report went on to recommend that a 80km/h speed reduction should be considered for the majority of this section of highway, noting the very high collective risk rating. The 2013 Speed Limit Review Report suggested retaining the 100km/h speed between SH2 and RP0/2.3 (i.e. the end of the westbound uphill passing lane). It is expected that this recommendation is on the basis of being able to retain this passing lane which would be unusual in an 80km/h environment. The two other passing lanes were proposed for either removal or conversion to a slow vehicle bay. During the public consultation for the proposed (physical works) safety improvements along this corridor in December 2014, the NZ Transport Agency consulted on the possibility of reducing the posted legal speed between SH2 and Lanes Flat from 100km/h to 80km/h. There was general support for lowering the speed limit from this consultation. 7.2 Speed Limit Change Economic Assessment An economic assessment of reducing the posted speed limit on SH58 from 100km/h to 80km/h was carried out in accordance with simplified procedures (SP3) of the Economic Evaluation Manual with the expected change in mean speed, and the resulting impact on crashes, assessed according to HRRRG methodology 54. Refer Appendix C.2 for further detail. It is noted that an economic evaluation of a change in posted speed limit is not required under current legislation. The purpose of this evaluation is therefore to provide a summary of the economic case for a speed limit reduction. The key inputs and assumptions of the evaluation are outlined below: Based on TomTom 2013 data 55, the average route travel speed is 80km/h with minimal variation throughout the day or by direction, despite the existing 100 km/h posted speed limit. A dditionally the 85 th percentile speed is 90km/h with minimal variation. 53 Spiire (2013) State Highway Speed Limit Review 54 NZTA, High Risk Rural Roads Guide, Figure D-1 and Figure Note that more up to date travel time information is available from TomTom; however, this includes the effects of the temporary speed limit at the Scour Site. Project No.: Page 55 Our ref: SH58 Addendum Report_Final Draft
![Speed (km/h) 100 90 80 70 60 50 40 30 20 10 0 SH58 Weekday Travel Speed (2013) Westbound 85th percentile Speed [kph] Average Speed [kph] 15th percentile Speed [kph] Figure 7-1: SH58 Weekday Route](/docs-images/76/73768571/images/60-0.jpg "Travel Speed (TomTom 2013) Westbound The predicted average speed, following the posted speed limit reduction, was assessed against the research 56 on the relationship between a change in speed limit")
60 Speed (km/h) SH58 Weekday Travel Speed (2013) Westbound 85th percentile Speed [kph] Average Speed [kph] 15th percentile Speed [kph] Figure 7-1: SH58 Weekday Route Travel Speed (TomTom 2013) Westbound The predicted average speed, following the posted speed limit reduction, was assessed against the research 56 on the relationship between a change in speed limit and the resulting change in mean speed. o o Figure D-1 from the HRRRG, reproduced below, shows that for a 20km/h reduction in posted speed limit there is typical mean speed reduction of -6% (ranging from 0% to - 20%, in approximately three data groups). It is expected that the effect of speed limit change on the mean speed of SH58 would be on the lower end of the range, at approximately -2.5%, based on the existing 80km/h mean speed. This equates to a predicted average speed of 78km/h following the speed limit reduction. 20km/h Reduction in Speed Limit Low Typical Expected - 2.5% Typical - 6.3% High Figure 7-2: Speed limit change and mean speed relationship (Source: NZTA HRRRG) 56 Austroads, AP-T141/10: Infrastructure /Speed Limit Relationship in Relation to Road Safety Outcomes, and Elvik et al. (2004) Project No.: Page 56 Our ref: SH58 Addendum Report_Final Draft
61 The following types of benefits/dis-benefits were assessed, resulting from the decrease in mean speed: Travel time and vehicle operating costs; o o Travel time and vehicle operating costs were assessed according to SP3 methodology based on the 80km/h existing and 78km/h predicted mean speed. Crash benefits o o o An AADT of 14,250 vpd and a project length of 8.8 km were adopted. Method A, crash by crash analysis, was adopted to determine the crash benefits from the speed limit reduction. The crash reductions were assessed based on the relationship between a change in mean speed and casualties on rural roads 57, presented in, and reproduced below. The following crash reductions 58 are expected, based on a 2.5% reduction in mean speed: 9% reduction in fatal crashes; 7% reduction in serious crashes; and a 4% reduction in minor and non-injury crashes. The economic case for the change in speed limit is summarised in the table below. The annual benefits have also been presented as it is expected that the speed limit reduction will be progressed 2-3 years prior to the implementation of the physical works. Table 7-1: Speed Limit Change: Economic Summary Period Travel Time Benefits VOC and CO2 Benefits Safety Benefits Net PV Benefits 40 year -$8.6M $1.7M $7.4M $0.5M Annual -$0.49M $0.09M $0.48M $0.08M The results of the economic assessment show that the travel time disbenefits are balanced out by combined safety, vehicle operating and CO2 benefits. In real terms, this shows that the proposed speed limit reduction will have a neutral. A BCR has not been presented due to the negligible signage costs of the speed limit change. Sensitivity testing was also undertaken using the typical mean speed reduction from a 20km/h reduction in posted speed limit, equating to an estimated mean speed of 75km/h. This 5km/h reduction, while having the effect of increasing the safety and vehicle operating and CO2 benefits, results in the overall annual benefits reducing from $0.5M in the base case to marginally greater than zero. 7.3 Speed Limit Summary Discussion Since the Spiire (2013) State Highway Speed Limit Review, TomTom data is now available which has recorded vehicle speeds (between SH2 and Lanes Flat) as being around 80km/h mean speed (which does not fluctuate by direction or time of day) and 90km/h 85th percentile speed, despite the 100km/h limit. Previous spot speed surveys show higher average speeds of 90km/h; however, due to the nature of dual tube surveys, these were undertaken on relatively straight sections and the results are therefore not consistent with the overall form of SH NZTA, HRRRG, Figure 2-3, Relationship between change of mean speed and causalities on rural roads 58 Note the percentage change in casualties from Figure 2-3 of the HRRRG was adjusted based on the weighted DSI/crashes ratio for key crash types from the crash history of SH58, calculated a 1.16, refer Appendix C.2 for further detail. Project No.: Page 57 Our ref: SH58 Addendum Report_Final Draft

62 Nevertheless, SH58 between SH2 and the Pauatahanui Roundabout meets the warrant for a 100km/h highway. It is however noted that, the existing mean speed and 85th percentile along SH58 do align to the guidance for an 80km/h posted speed limit as noted in the Land Transport Rule: Setting of Speed Limits The Speed Limit Rule does however outline that speed limits can be set that differ from the calculated limit if the following clauses are met: Clause 3.2(5): Speed limits that differ from the calculated speed limit o A road controlling authority may propose to set a speed limit that differs from the calculated speed limit, but may set the proposed speed limit, in accordance with section 7, only if: a) a speed limit different from the calculated speed limit is the safe and appropriate speed limit for a road with regard to the function, nature and use of the road, its environment, land use patterns and whether the road is in an urban traffic area or a rural area; or b) the proposed speed limit is less than 50 km/h and 3.2(6) applies. Clause 7.1(6): Consultation additional information o If a proposed speed limit is 50 km/h or more, and the proposed speed limit is not the calculated speed limit, the road controlling authority must provide the [Agency] with written evidence that the proposed speed limit complies with 3.2(5) unless section 4 applies. For the speed limit change on SH58, only Clause 3.2(5) is relevant. Therefore, based on the high crash risk, existing mean operating speeds at 80km/h and an overall neutral economic case, that an 80km/h posted speed limit on SH58 between SH2 and Pauatahanui Roundabout is safe and appropriate. Further, an 80km/h speed limit is also supported based on assessment of SH58 against the draft Speed Management Guide 59, due to the high collective risk and medium personal risk. This is outlined in Figure 7-3 below. Figure 7-3: Draft speed management guide - safe and appropriate speeds As a Regional Highway (Class 2) with a high collective risk and medium personal risk the safe and appropriate speed is 80km/h rather than 100km/h 59 NZTA, The Draft Speed Management Guide aims to give effect to the significant new direction and framework for speed management in NZ. It is currently in draft form while a demonstration project is carried out in the Waikato region. Project No.: Page 58 Our ref: SH58 Addendum Report_Final Draft
63 7.3.2 Recommendation Based on the previous speed limit assessment undertaken and the neutral economic case, it is recommended that the NZ Transport Agency progresses the 100km/h to 80km/h legal speed reduction between SH2 and Lanes Flat immediately 60. Reducing the speed limit before delivering the physical works will allow realisation of the speed reduction safety benefits much earlier than the safety benefits could be achieved from the physical works, which would be at least 2-3 years 61 later than when a legal speed reduction could be achieved. 60 Our recommendation is for the full section length to be reduced to 80km/h. Whilst retaining the passing lanes would be unusual in an 80km/h environment, this is not considered a major issue. There are very limited safe passing opportunities along the corridor and the uphill passing lane at Haywards would continue to allow passing of slower vehicles at this point. The remaining eastbound passing lane, east of Moonshine Road is also on a large uphill grade which would be a positive place for passing, and the benefits here are further enhanced following the physical works when this passing opportunity would allow vehicles to pass immediately after the new roundabout at Moonshine Road. 61 Due to the timeframes required for design, consenting and construction. Project No.: Page 59 Our ref: SH58 Addendum Report_Final Draft
64 8 Option Evaluation 8.1 Assessment Against Objectives A matrix-type assessment of the five project options has been undertaken, considering alignment of each option to the project objectives. This includes the four main project objectives, together with the two other sub-objectives (relating to a cost-effective solution and consistency with the One Network Road Classification) to ensure all aspects are adequately considered. A rating score is applied to each objective listed in Table 8-1 below, which compares each option generally against the other options. The rating system uses a five point scale -2, -1, 0, +1 & +2, with -2 the most negative, zero as neutral and +2 most positive. Despite using a five point scale no option was scored below a zero as this was considered to be little to no alignment with project objective and negatives beyond this were not necessary. The six objectives considered were: To enhance safety of travel on the Wellington State Highway network, and specifically SH58: a subjective assessment as to the relative safety of each option, but including the predicted crash savings. To maintain or improve journey times and journey time reliability between SH2 in the Hutt Valley, and Transmission Gully: Considering overall journey time and journey time reliability relative to the current situation and against the other options. For example, the impact of crashes causing delays or closures of the road is considered. To enhance resilience of the Wellington State highway network: high level consideration of whether aspects of the options would improve or worsen likely route resilience. To appropriately balance the needs of local and state highway traffic: considers whether a reasonable level of balance for both sets of users is achieved, or whether one is favoured to the detriment of the other. By developing and constructing a cost effective roading solution: considers the BCR achieved by the project. consistent with a standard expected for a Regional state highway under the One Network Road Classification: whether the option most closely aligns with the levels of service for a regional highway in terms of mobility, safety, amenity and accessibility. The assessment was carried out by the project team and includes a mix of quantitative and qualitative aspects. Further detail of MCA scoring is provided in Appendix D. Project No.: Page 60 Our ref: SH58 Addendum Report_Final Draft
65 Table 8-1: Summary of MCA Scoring Option Enhance safety on State Highway Network, Specifically SH58 Maintain or improve journey times & Reliability Enhanced Resilience Appropriately balance the needs of local & state highway traffic Total score MAIN OBJECTIVES Cost effective roading solution Consistent with a regional highway ONRC standard Total Score ALL OBJECTIVES Option 1: 1.5m shoulders, 4 curve realignments Option 2: As per Option 1 with 2m flush median Option 3: As per Option 2 with median barrier included Option 4: As per Option 3 with removal of Site 1 realignment and 80km/h do-min Option 5: As per Option 3, plus 80km/h do-min, roundabout at Flightys/Murphys, addition of realignment Site 5 & bridge improvements Project No.: Page 61 Our ref: SH58 Addendum Report_Final Draft
66 8.2 Preferred Option On the basis of alignment to the project objectives, the recommended option is therefore considered to be Option 5, as this scores highest against both the four main objectives and the total six criteria. This remainder of this section provides an overview of the evaluation undertaken on Option 5, including discussion on; Traffic performance; Cost estimation; Crash risk; Economic efficiency; and Construction staging. Evaluation of the option provided in this SAR Addendum can be considered in isolation however for further details of earlier evaluation of previous Options, refer to Rev Traffic Volumes and Capacity Introduction Traffic modelling was undertaken to identify the future traffic demands along SH58 for scenarios involving TG and P2G Link Road. Traffic modelling was undertaken by Greater Wellington Regional Council (GWRC) using the Wellington Transport Strategy Model (WTSM), with a 2011 base year 62, for the scenarios outlined below: Do Minimum with existing number of lanes on SH58 between TG and the Haywards Interchange referred to as Do Min ; Do Minimum with the P2G Link Road in place and existing number of lanes on SH58 between TG and the Haywards Interchange referred to as Do Min with P2G ; SH58 four laning Option between TG and Haywards interchange referred to as 4L Option ; SH58 four laning Option between TG and Haywards interchange with the P2G Link Road in place referred to as 4L Option with P2G ; The SH58 four laning options, with and without the P2G Link Road, were undertaken as sensitivity scenarios to determine the likely unconstrained demand along SH The four scenarios presented above are detailed in the SH58 Four Lane WTSM Testing report by GWRC and contained in Appendix C.1.1. The proposed safety improvement scheme was not modelled in WTSM, as the relatively small scale of improvements would likely not make a difference in the regional nature of the model. However, a number of scenarios with and without the scheme were undertaken using Highway Capacity Manual (HCM 2010) analysis based on WTSM modelled unconstrained flows, refer Section and Appendix C.1.2 for further detail. In addition to WTSM and HCM analysis, traffic modelling was also undertaken by Jacobs using the Northern Wellington SATURN Model (NWSM) for scenarios with and without the P2G Link Road, including the impact of the proposed safety improvement scheme. The purpose of the NWSM assessment was to investigate intersection performance and likely efficiency improvements as a result of the scheme. 62 The 2011 base of the WTSM model was used by GWRC rather than the 2013 base to be consistent with the P2G Link Road analysis to date. 63 Although it is noted that the modelling showed minimal increases in demand flows as a result of four laning, in the order of 2% (i.e. capacity is not constraining demand) Project No.: Page 62 Our ref: SH58 Addendum Report_Final Draft
67 8.3.2 Traffic Volumes As presented in Section above and Figure 8-1 below: Minimal traffic growth is anticipated until the introduction of TG, where traffic volumes are expected increase to over 20,000 vpd on SH58. By 2031, traffic volumes are expected to be over 23,000 vpd. With the P2G Link Road in place, traffic volumes return to base levels. By 2031, traffic volumes are expected to be approaching 17,000 vpd. From 2031 onwards, modelled growth is minimal, with or without the P2G Link Road in place. 25,000 SH58 Modelled Traffic Demands (WTSM 2011 Base) Traffic Volume (vpd) 20,000 15,000 10, % Step change increase with TG Step change decrease with P2G 1.6% 1.3% 0.1% 0.1% 5, With P2G in 2023 No P2G Figure 8-1: SH58 Modelled Traffic Demands (WTSM 2011 Base) Due to uncertainty in future traffic volumes, sensitivity testing was undertaken based on +-1% traffic growth applied to the base modelled scenario outlined above. The resulting traffic volume range is presented in Table 8-4 below and Appendix C.1.1. Project No.: Page 63 Our ref: SH58 Addendum Report_Final Draft
68 8.3.3 Levels of Service The WTSM levels of service, reported in terms of volume to capacity ratios, adopt a modelled capacity of 1,400 PCU / lane/ hour for SH Volume to capacity ratios for key scenarios are outlined in Table 8-2 below for the AM 2 hour peak period. Table 8-2: WTSM 2011 AM Peak Volume to Capacity Ratios (Eastbound) Scenario (with TG) No P2G 92% With P2G (2023) 55% (43% to 55%) 89% (69% to 89%) (72%-92%) 66% (52%-66%) 107% (83% - 107%) 74% (57% - 74%) 107% (83%-107%) 74% (57% - 74%) In summary, the WTSM modelling shows that SH58 in the AM peak with P2G Link Road in place, performs at under 75% capacity through to However, in the period between TG opening and P2G Link Road opening, SH58 is likely to be near capacity, with volume to capacity ratios of over 90%. Note that the above volume to capacity ratios assume that the proposed scheme will have no impact. Refer Appendix C.1.1 further detail on the WTSM modelling outputs. The HCM analysis in general shows similar trends to the WTSM modelling, as outlined in the Table 8-2 below, with predominately LoS E 65 predicted once TG is implemented, with LoS improving once P2G Link Road is in place. Without P2G Link Road, SH58 will be over capacity by The HCM assessment shows that LoS is not noticeably improved with the safety scheme in place as the minor increase in shoulder width and improved curve geometry is negated by the loss of the small residual passing opportunity (due to new median barrier) 66. Table 8-3: HCM AM peak (Decreasing - Eastbound) LoS Scenario (with TG) No P2G No P2G (with scheme) With P2G (2023) With P2G (2023) (with Scheme) LoS D/E 67 LoS E (LoS F 68 one section) LoS F (E some sections) LoS E (one section at C) Refer Appendix C.1.2 for further detail on the HCM procedure and LoS outputs. Not Assessed Similarly, the NWSM modelling also shows similar trends, with SH58 near capacity for both m idblock and intersections with TG in 2021 and easing once P2G is in place. Without P2G, SH58 will be over capacity by 2031.The modelling also showed the scheme improving LoS for both midblock and 64 It is noted that capacities of 1,400 PCU/lane/hr are likely to be conservative along SH58, with capacities likely to range from 1,400 to 1,700-1,800. However, the WTSM adopted capacities are conservative and therefore provide an indication of a worstcase scenario. The values provided in Table 8 2 above show a V/C range based on a capacity range from 1,700 to 1, HCM 2010, At LOS E, demand is approaching capacity. Passing on Class I and II highways is virtually impossible, and PTSF is more than 80%. Speeds are seriously curtailed. On Class III highways, speed is less than two-thirds the FFS. The lower limit of this LOS represents capacity. 66 This is considered to be conservative as the methodology does not consider the impact of the removal of right turns and the likely increase in speed as a result of median barrier separation of the traffic lanes. Since there is no difference in grades, or traffic profiles between existing and the scheme, the LoS profiles are very similar. 67 Note that HCM guidance indicates that passing capacity decreases as passing demand increases. Therefore, operating qual ity often decreases rapidly as demand flow increases, even at relatively low V/C ratios. This is currently the case for SH58, whe re the base scenarios shows LoS D/E at V/C ratio below 60%. 68 HCM 2010, LOS F exists whenever arrival flow in one or both directions exceeds the capacity of the segment. Operating conditions are unstable, and heavy congestion exists on all classes of two-lane highway. Project No.: Page 64 Our ref: SH58 Addendum Report_Final Draft
69 intersections, on the basis that the improved cross section and geometry would result in an increase in capacity; however, this is not supported by the HCM analysis. Refer Appendix C.1.3 for further NWSM modelling outputs Modelling Outcomes The overall modelling outcomes are summarised in the Table 8-4 below, key outcomes are: The opening of TG in 2020 is expected to result in a step change in traffic volumes along SH58 to over 20,000vpd, resulting in SH58 operating near capacity (LoS E) in the peak periods. In addition, the crash risk on the KiwiRAP 2 star SH58 is expected to further deteriorate with the additional traffic following the opening of TG. The proposed SH58 safety improvements are expected to significantly reduce the crash risk along SH58 and it is recommended that the scheme is implemented prior to TG opening. It is noted that the safety improvements will not address the capacity issues as a result of TG. o At least an additional six DSI (or two DSI/year) are estimated to occur on SH58 in the time between TG opening (est. 2020) and the P2G Link Road opening (est. 2023) as a result of the increased volumes on a KiwiRAP 2 star road. The additional 2 DSI 69 per year is in addition to the 2.6 DSI/year, which is already occurring. With the P2G Link Road in place, traffic volumes on SH58 are expected to return to approximately existing levels and no capacity concerns are predicted in the longer term 70. Should the P2G Link Road not progress, then it would be necessary to provide significant extra capacity on SH58 when volumes increase after the opening of TG, with four laning being required. In the interim period between TG and the P2G Link Road opening, a period currently estimated to be at least three years, a management plan including the following should be considered; Travel demand management (TDM) measures, promotion of alternate modes, provision of improved driver information systems and consideration of localised capacity improvements. Table 8-4: Summary of Modelling Outcomes Scenario 2011 Base Post TG before P2G Immediately after P2G P2G plus 10 years P2G plus 20 years Timeframe ~2031 ~2041 Modelled Traffic Volume 71 15,000 vpd 20,200 vpd (19,500 21,500 vpd) 15,100 vpd (14,200 16,700 vpd) 16,700 vpd (14,600 19,800 vpd) 16,800 vpd (14,600 22,000 vpd) AM Peak V/C Ratio (EBD) 72 55% 89% (69% 89%) 66% (52% 66%) 74% (57% 74%) High Very High 7.3 DSI/year Low (with Scheme) 69 Due to the 40% increase in traffic volumes on a 2 star KiwiRAP highway post TG/pre P2G, the predicted DSI/year increases from 5.2 to 7.3 DSI/year (~ 2 DSI/year). 70 This is supported by the modelling undertaken for the P2G Link Road: 71 Range presented in brackets indicates a +- 1% traffic growth applied to the base modelled scenario. Noting that growth was restricted to a minimum of 0%. 72 Range based on a capacity between 1400PCU/lane/hr to 1700PCU/lane/hr. Project No.: Page 65 Our ref: SH58 Addendum Report_Final Draft
70 Scenario 2011 Base Post TG before P2G Immediately after P2G P2G plus 10 years P2G plus 20 years Timeframe ~2031 ~2041 Crash Risk (Predicted DSI/year 73 ) 5.2 DSI/year (Predicted) (Actual 2.6 DSI/year) Medium (with Scheme) 2-4 DSI/year Up to 2-3 DSI/year Costs The expected and 95 th percentile estimates for this project are detailed in the table below. Table 8-5: Scheme Estimates Option Description Expected Estimate ($M) 95th Percentile Estimate ($M) Option The cost estimate for Option 5 has been compiled using the elemental breakdown method. The project has been split into 7 regions (Region A G) to allow economic analysis of staged construction. Region C (SH58 Scour Site Realignment) has been constructed to practical completion. The forecasted cost at completion is $2.7M. As such no elemental breakdown of work items has been included for Region C. Refer Appendix C.3 for the Project Estimate forms for the regions outlined below. Table 8-6: Summary of Costs Region* Base Estimate Expected Estimate 95 th %tile Estimate Region A $2,395,000 $2,850,000 $3,606,000 Region B $13,959,000 $16,860,000 $21,693,000 Region C 75 $2,255,000 $2,700,000 $3,378,000 Region D $3,069,000 $3,593,000 $4,467,000 Region E $4,808,000 $5,635,000 $7,012,000 Region F $2,674,000 $3,182,000 $4,028,000 Region G $10,872,000 $13,127,000 $16,114,000 TOTAL $40,032,000 $47,947, $60,298,000 *Regions are explained in Section No specific design has been undertaken for environmental compliance. An allowance of approximately 7.50% of construction costs has been used. This is consistent with the previous estimate. Earthworks form a large portion of the works for Region A, B and F. Earthworks cut batters and fill embankments profiles have been based on expected ground conditions from desktop only geotechnical studies. Likewise, the percentage of type R1 and R2 rock is based on desktop work rather than specific ground investigations. There is a risk that actual ground conditions could vary markedly from those expected. Region F has a large allowance for importing bulk fill, while Region B has a large volume of 73 Calculated based on the change in volume and the changes in KiwiRAP star rating, Refer Section 8.5 for further detail. 74 Note that based on the current correlation between predicted and actual DSI, this could be as low as 1 DSI/year. 75 Note that Region C has now been fully constructed 76 A full parallel estimate has since been completed and the expected estimate has been increased to $53.9M. A separate parallel estimate report is available which details the background to this. Project No.: Page 66 Our ref: SH58 Addendum Report_Final Draft
71 cut to waste. It may be possible to stage the work such that the excavated material from Region B could be used as bulk fill for Region F. This would reduce the cost of construction. Widening for sight distance around barriers has not been allowed for and will likely increase the volume of bulk earthworks required. This has been allowed for in the contingency. No specific drainage design has been undertaken for the works. An allowance for constructing drainage works has been prorated from the recently tendered and constructed SH58 Scour Site Realignment (Region C). Where the existing highway is being retained, a 150 mm overlay has been allowed for to provide shape correction and pavement rehabilitation. On areas of realignment, full depth pavement construction has been allowed for. Pavement depths are based on previous testing undertaken for the SH58 Scour Site Realignment. As noted in the earthworks section, widening for sight distance around barriers has not been allowed for and will likely increase the volume of pavement metal required. This has been allowed for in the contingency. Costs for widening existing bridges have been taken from a July 2015 report prepared by MWH for the NZ Transport Agency. Costs in the report are based on a $/m 2 rate which is consistent with scheme level investigation. A relatively large contingency (50%) has been allowed for the expected cost estimates. Traffic services such as barriers and road marking have been measured off the design plans. There is a risk more side protection barriers will be required as design standards and philosophies change, however the traffic services is considered fairly low risk compared to other sections of the estimates. An allowance for a single trench with multiple service ducts has been allowed for along the length of the project. Specific allowance has been made for protection of the existing Greater Wellington Regional Council bulk water main where the project works are in close proximity to the water main. A lump sum allowance for general landscaping (such as flax and tree planting) has been allowed for in lieu of any specific landscaping deign. This is consistent with a scheme level estimate. Separate allowance for top soiling and seeding exposed earthworks slopes has also been allowed for. Traffic management has been allowed for on a lump sum basis. The sums have been formulated from typical daily costs for traffic control and expected duration of the works. The preliminary and general lump sum is typically 12.5% of the physical works costs. This is consistent with other similar projects tendered and constructed around the region. No allowance has been made for extraordinary construction costs (such as archaeological finds). Project No.: Page 67 Our ref: SH58 Addendum Report_Final Draft
72 8.5 Option Crash Risk Option 5 was assessed using the KiwiRAP Assessment Tool (KAT) to determine the effect of the options on KiwiRAP star rating, and subsequently the estimated number of injury crashes and DSI. Table 8-7: KiwiRAP Option Assessment Option Extent Average Star Rating Published Star Rating High severity crashes/ year Predicted 78 Do Min DSI / year % Reduction Predicted DSI Saved /10 years 77 Option (Low) % (Calculated*) % (High) % 17 *Note: the analysis did not account for the breaks in the median barrier. As the curve easing considered in the options is relatively minor we have adopted a conservative approach and not included it in the KAT modelling at this stage. Table 8-7 shows the scheme is expected to deliver: A high 3-4 Star KiwiRAP rating, achieving the ONRC Safety LoS targets for a Regional Route; A 45-66% reduction in high severity crashes/year; and An estimated DSI saved over 10 years (Based on a KiwiRAP rating of between 3.5 and 4 stars). The consequences of not investing include: Continued and increasing numbers of deaths and serious injuries: o o Based on the previous five year calendar period, there have been 2.6 DSI/year; this is significantly less than that predicted by the 2.7 star rating based on current SH58 volumes. This indicates that there is the potential for the number of deaths and serious injuries along the route to increase, even if there is no change in traffic volume. An additional six DSI (or an additional two DSI/year) are estimated to occur in the time between TG opening (est. 2020) and P2G Link Road opening (est. 2023) as a result of the increased volumes on a KiwiRAP 2 star road. 77 Note that the DSI Saved/10years has been calculated using the actual DSI from (2.6 DSI/year) and the percent reduction determined from the Do-min KiwiRAP star rating to the Option star rating (e.g. 2.7 star to 3.5 star results in a 45% reduction in DSI/year). This reduction is then applied to the actual DSI/year to determine the DSI Saved/10 years, this is a conservative approach as the actual DSI has been less than the KiwiRAP predicted DSI for the route. In addition, it is noted that KiwiRAP focuses on state highway links that have speed limits of 80km/h or more. It does not differentiate between an 80km/h and 100km/h route. Nevertheless, based on travel speed data presented in Section 4.3 and discussions on legal speed in Section 7, the posted speed limit reduction on SH58 to 80km/h, although likely to reduce speed variability, is unlikely to have a drastic impact on overall crash risk. This is due to the mean speed of SH58 already operat ing at 80km/h along the route. 78 The calculated KiwiRAP star rating for Option 5 according to Figure C-2, Appendix C of the HRRRG. A range is presented due to the uncertainty around the specific star rating. Project No.: Page 68 Our ref: SH58 Addendum Report_Final Draft
73 8.6 Economic Evaluation The economic evaluation of Option 5 was carried out in accordance with modified full procedures of the Economic Evaluation Manual Volume 1 (EEM, Nov 2013), with a 40 year analysis period, 6% discount rate and latest update factors applied 79. The key inputs and assumptions of the Option 5 evaluation are outlined below: Refer Section 1.3 for further detail on the updated project scope. Do-Minimum was assessed as being; 80km/h posted speed limit and continued maintenance. This reduction from the 100km/h posted speed limit was on the basis the NZ Transport Agency staff advising that they are already planning to reduce the speed limit given the high risk nature of this section of SH58 and the poor crash history (see also Section 7 above). Time zero of 2016, an indicative scheme opening year of 2021 and a three year construction duration. WTSM modelling outputs were used for both traffic volumes and traffic growth (WTSM 2011 base was used for consistency with the P2G Link Road). The types of benefits/dis-benefits assessed included: o o Safety Benefits ( crash history): Curves: realignment of five sites and median barrier works. Midblock: widening and median barrier works. Intersection: upgrade of the Moonshine Road T junction and Murphys Road/ Flightys Road X junction to a 3 and 4 leg roundabout respectively. Travel Time, Vehicle Operating Costs and CO2: Curve Realignment: travel time costs and vehicle operating costs arising from the length of highway undergoing curve realignment were assessed, based on TomTom 2013 data, where applicable. Moonshine Road and Murphys/ Flightys Road intersection: travel time and vehicle operating costs relating to the delays incurred from the existing Moonshine Road T junction and proposed roundabout have been assessed using SIDRA. The Murphys/ Flightys assessment was based on Moonshine Road 80. Wire Rope Barrier effects: Travel time and vehicle operating dis-benefits relating to the wire rope barrier have been assessed based on the additional delays introduced from turning restrictions. No wider economic benefits were considered in the analysis. An external Economic Peer Review was undertaken in February 2014 by Opus International Consultants. Although there have been a number of changes made to the project scope with the introduction of Option 5, the economic evaluation approach which was agreed with the Peer Reviewer has not been fundamentally changed. 79 It is noted that the January 2016 EEM has recently been released; however, as the original economic evaluation was completed and peer reviewed prior to November 2013, this high level update of costs and benefits has used the latest guidance and update factors where feasible. 80 Noting that this was undertaken at a high level, including the conservative assumption that the travel time and vehicle operating costs would be the same as those of the 3-leg Moonshine Road roundabout. In terms of crash analysis, full procedures were undertaken. Project No.: Page 69 Our ref: SH58 Addendum Report_Final Draft
74 Economic Case The calculated BCR for Option 5 is provided in the table below. Table 8-8: Option 5 Benefit Cost Ratio Option Expected Cost Estimate PV Cost Travel Time, VOC and CO2 Benefits Safety Benefits Total PV Benefits BCR Option 5 $48.0M $42.0M -$3.3M $56.5M $53.2M A range of sensitivity tests were carried out with the results summarised in the table below. Table 8-9: Option 5 Sensitivity Testing Type Benefits (Safety) Costs Discount Rate Traffic Growth Variable/Comment Crash Reduction: Pessimistic 1.2 Crash Reduction: Median 1.3 Crash Reduction: Optimistic 1.4 Base Project Estimate 1.5 Expected Estimate th Percentile Project Estimate 1.0 4% Discount Rate 1.7 6% Discount Rate 1.3 8% Discount Rate 1.0 As below 1% % growth to 2021, 2021 onwards as per WTSM ( : 1.3%, 2031+:>0.1%) With P2G 1.3 As above + 1% 1.5 The sensitivity testing shows the BCR is robust in the 1-3 band under a range of likely scenarios, with the BCR being most sensitive to changes in the cost estimate and discount rate. The BCR without the P2G Link Road has been assessed as 1.5; however, the scheme under this scenario will not deliver an appropriate LoS for a Regional Highway (refer Section 8 above) so it is not recommended to pursue this scenario. In summary, the assessment profile for Option 5 is HML (Priority 4) with a High Strategic Fit (as SH58 is a High Risk Rural Road, with high collective risk) and Medium Effectiveness rating (as the project delivers significant safety outcomes, is correctly scoped, with appropriate timing and forms part of a wider network approach). Comparison to Previous Stage Overall, the Option 5 BCR is 1.3, a 15% decrease from Option 4 with an incremental BCR of However, as presented in Section 8.1, Option 5 was preferred based on assessment against all the project objectives. BCR 81 Following the parallel estimate process, the expected estimate was increased to $53.9M, which results in a BCR of Key changes between Option 4 and Option 5 include the following; A $17M increase in costs due to additional realignment sites, changes due to updated project timing and the effect of discount and the TT/VOC benefits being very similar to Option 4 as the addition of the dis-benefits from the Flightys/Murphys roundabout is balanced out by the increased travel time benefits from the realignment sites. Project No.: Page 70 Our ref: SH58 Addendum Report_Final Draft
75 8.7 Construction Staging Staging Description Staging the construction of these improvements could have significant benefits in terms of road user experience and funding demands. It is recognised that a number of factors will influence how to best stage construction including funding availability, customer impact and delay, achieving safety (and other project) outcomes, provision for turnarounds (given the median barrier effects), progression of adjacent projects, corridor development and land acquisition. A separate staging strategy note, refer Appendix E, to this SAR Addendum is provided which details some of the staging options that should be considered. Three separate staging strategies have been proposed. These are not by any means exhaustive and will need to be reviewed as further works commence on the project and in conjunction with the likely procurement strategy. For the development of the staging programmes, the entire route has been segmented into geographical sections ( Regions ). This has resulted in seven regions of varying lengths and cost. The regions have been selected as being able to be completed as a single project phase, with cognisance of the construction implications and effects on side road and property access (i.e. there is an element of judgement / realism applied, rather than just a theoretical approach that could not be delivered in practice). However, it is noted that this segmentation is subjective and could be changed at a later date. The 100km/h to 80km/h legal speed reduction is not considered to be part of the staging as this is expected to be implemented much earlier and as an isolated and standalone project i.e. it does not influence, and is not influenced by, the timing of the physical safety improvement works. The staging assessment and staging BCR calculations have been undertaken on the basis that the 80km/h legal speed has been implemented prior to the physical works. Services relocations and protections are assumed to be undertaken during the main works (i.e. as part of that stage of works), rather than as an enabling works programme for the full corridor. The regions used do not change between the staging programmes i.e. Region A is always the same geographical extent regardless of the staging programme. This method has been employed to make the cost estimation process more manageable. Geographical staging extents (i.e. Regions) are: A. Hugh Duncan Street East comprising the 300m section from the project eastern extent to Hugh Duncan Street; B. Hugh Duncan Street West comprising the 2000m section west from Hugh Duncan Street to Mount Cecil Road; C. Scour Site comprising the 800m section west from Mount Cecil Road to the western extent of the Scour Site works; D. Harris East comprising the 900m section from the Scour Site to Harris Road; E. Harris West comprising the 1300m section west from of Harris Road to east of Moonshine Road; F. Moonshine comprising the 500m section centred on Moonshine Road intersection and including the proposed roundabout; and G. Western extents comprising the 2600m section from west of Moonshine Road to Bradey Road (Lanes Flat). This is shown in the figure below: Project No.: Page 71 Our ref: SH58 Addendum Report_Final Draft

76 N F G E D C 4 3 B 5 1 A Project Extent Realignment Sites Staging Regions 1 A 2 Figure 8-2: Staging Regions The three strategies considered are described below: A. Safety Programme: staging is prioritised based upon observed injury crashes per kilometre. This does not take into account KiwiRAP, non-injury crashes or crash severity. This is a relatively coarse measure of prioritising safety, which can be refined as the project progresses. B. Economic Efficiency Programme: This programme prioritises the sections based on the calculated BCR for that section of works. This is a relatively simplified process that uses the expected estimate for that section and the various costs and benefits (i.e. VOC, Travel Time, Crash Benefits, median barrier delays) to obtain a BCR for each region. These are then combined for the proposed regions in each stage to create a Stage BCR. Whilst this approach has been calculated with a good degree of accuracy for the economics, as well as some judgement around practicalities, ultimately this is a theoretical approach to staging and not o ne that should be considered. Project No.: Page 72 Our ref: SH58 Addendum Report_Final Draft
77 C. Community Acceptability Programme: Staging is prioritised based upon the expected level of community acceptance of the works on that particular section. The level of acceptance is a subjective measure, but generally based on the expected level of disruption to adjacent residents, businesses and side roads, anticipated duration of the physical works in that geographical region, and convenient turning facilities. Other strategies exist but at this stage of the project development, it is considered these three are the most feasible. A strategy around construction efficiency was also considered, particularly in respect of balancing cuts and fills given the quantity of earthworks on this project; however this was discounted as the entire project and the various sections have almost entirely an excess of cut material, so balancing of materials is not realistic. As the project develops, the staging will need to be reconsidered, particularly with respect to intended delivery timeframes, procurement methods, land acquisition, Transport Agency priorities and relationship to adjacent project works (SH2/58 interchange, TG and P2G Link Road) Staging Recommendations From the staging assessment work completed, a number of recommendations are provided; however it is imperative that the staging options are refined and updated as the next stage of design progresses because this will influence the proposed staging. The project can be staged, and indeed will need to be, given the length of the corridor and scale of works to be undertaken. Nonetheless, it is important to note that the project should be delivered as a single package with a fairly condensed programme over a maximum of 3-4 years. Delivering the project in smaller discrete packages over an extended period of time, or omitting certain sections, should be avoided. This is because the route is a single uniform corridor with generally consistent characteristics 83 that apply throughout. This is evidenced by the observed crash history, and also the KiwiRAP rating along the corridor which remains fairly stable (of mostly 2-star but with a small number of 1-star and 3-star sections). Treating only certain sections in isolation without the ultimate intent of creating a continually connected corridor of upgraded highway will not provide the Safe System transformation required to achieve the desired project safety outcomes. Further, only treating discrete sections is expected to result in significant crash migration which would be entirely unacceptable. The recommended staging option is the Safety Programme. Whilst the three programmes considered have merit, this programme best meets the project objectives of improved safety with the outcome being reduced fatal and serious injury crashes on this corridor. The Safety Programme Detail is provided in Table 8-10 below. Details of each staging option is provided in Appendix D along with the expected estimate for each section length and associated BCR. A more detailed assessment of the delivery risks and considerations for the safety staging programme of work is provided in Table 8-11 below. As previously stated, whilst some form of staging is inevitable, the full corridor should be prioritised for the upgrades over the shortest time period possible. This is because the corridor falls between the higher standard SH2 (and SH2/58 interchange) and TG. Works at either end of the SH58 corridor extent are expected to be completed in advance of the full corridor improvements being finished. With staged construction there is an inevitability that drivers will pass from a very high standard on the adjacent networks, to a much lower standard on SH58 with corresponding risks of crash migration to curvilinear alignment with no median protection, narrow shoulders, limited edge protection and high side friction. With the staging of works, careful consideration will need to be given to the driver experience of transitioning between the higher and lower standards, and potential fluctuating standards on SH58 as works are progressed temporary measures during construction may be warranted to reduce these risks as sections are progressively upgraded. 83 With the exception of topography which is more mountainous and rolling in the eastern half of the project. Project No.: Page 73 Our ref: SH58 Addendum Report_Final Draft
78 Table 8-10: Safety Staging Programme Detail Stage Zero Stage 1 Staging: Safety Programme Regions Works Description & Staging Justification Risks Expected Cost Scour Site Realignment (C) 12.5 injury crashes per Km East of Hugh Duncan Street to SH2/58 extent (A) 20.0 Moonshine Roundabout (F) 0.5 Realignment of scour site section between Mount Cecil Road and scour site at RP, due to high density of crashes at this location plus need to mitigate undermining of road from stream Short section of improvement but very high cost due to significant cuts for realignment. Works to connect into 2/58 interchange works. This section is very high cost but extremely high injury crash proliferation here. Addressed early due to higher standard improvements from 2/58 leading immediately into very poor alignment with extremely high injury crash rate. The roundabout at Moonshine is provided in Stage 1 to cater for some turning movements in later stages. This also recognises the need for the roundabout early should the Winstones cleanfill site proposals eventuate. Large amount of corridor benefits are realised in short section of works, reducing economic efficiency of wider corridor Crash migration Major delays to customers in close proximity to the 2/58 works that will have already caused traveller disruption. All service relocations / protections undertaken but then parts of scheme may be omitted from project in future (for reasons unknown at this stage) meaning unnecessary cost outlay Indicative BCR $2.7M 8.6 $6.0M 2.5 Stage 2 West of Scour Site to Harris (D) 7.8 TG to Moonshine Road (G) 3.5 Stage 3 West of Hugh Duncan to Mount Cecil (B) 3.5 West of Harris to Moonshine Roundabout (E) 3.1 West of scour site to Harris Road completed in Stage 2 due to large number of injury crashes on this section, providing a completed length from west of Hugh Duncan Street to Harris Road. Informal turnarounds will take place at Harris and Mount Cecil intersections (despite challenging grades), with formal facilities at Moonshine Road and 2/58. TG extent (or Pauatahanui Roundabout if TG interchange not complete) also undertaken due to high injury crash numbers. This section includes a new roundabout at Flightys/Murphys. Turning is well catered for with this new roundabout, plus Moonshine and TG at either end of this section. The section west of Hugh Duncan to Mount Cecil Road is targeted last despite the high number of loss of control crashes, as the injury crash rate per Km is low. This section is very high cost due to the three realignment sections with large scale earthworks. Median barrier provision along this section has little to no effect on access as Hugh Duncan Street and Mount Cecil Road are fully accessible and right turns in to Transpower are accommodated, with right turns out using 2/58 interchange. Remaining 1.3km length between Harris and Moonshine to be undertaken as final stage due to low numbers of injury crashes. Major delays to customers Crash migration Unsafe turning manoeuvres at intersections when not suitable to do so (such as with large vehicles), or U-turning around barrier itself on SH58 which is even less desirable Major delays to customers Crash migration to these two untreated sections is a probable outcome and will need to be proactively addressed. $16.7M 0.0 $22.5M 0.9 Note: It has been assumed for the purposes of Staging that all service relocations and protections are carried out during the phase / extent of work they are associated, rather than in a single package as early works contract. Project No.: Page 74 Our ref: SH58 Addendum Report_Final Draft
79 Table 8-11: Safety Staging Programme Delivery Risks Stage Zero Safety Programme Staging Delivery Considerations Risks to Delivery Stage Region(s) Services Property Consenting Construction Other Recommendation Total Stage Cost: $2.7M Scour Site Realignment (c) N/A (Complete) N/A (Complete) N/A (Complete) N/A (Complete) N/A (Complete) N/A (Complete) Stage 1 Total Stage Cost: $6.0M Stage 2 Total Stage Cost: $16.7M Stage 3 Total Stage Cost: $22.5M East of Hugh Duncan Street to SH2/58 extent (a) Moonshine Roundabout (f) West of Scour Site to Harris (d) TG to Moonshine Road (g) West of Hugh Duncan to Mount Cecil (b) West of Harris to Moonshine Roundabout (e) Moonshine Roundabout conflict with service relocations (GWRC water main here) Unknown services costs and difficulty over control of their programme Service conflicts on TG to Moonshine section GWRC water main is problematic Major realignment sections will necessitate significant (cost and time) service relocations Land acquisition for Moonshine Roundabout may prove difficult TG to Moonshine section relies on large number of properties for land acquisition (timing) Large amount of land required for new roundabout at Flightys/Murphys Most land for both sections is already in NZTA ownership but some land required from Belmont Regional Park & others Need to agree final access treatments with Transpower Challenging consents, particularly for large earthworks in (A) Numerous waterways along section likely to necessitate consents with long lead time Numerous bridges along the TG to Moonshine length which adds complexity / time Major earthworks consents required for (B) Sacrificial work cost for SH2/58 interchange tie-in Material disposal need to identify suitable site for large quantity of cut to waste material With Harris complete, long section of continuous median barrier (1.7km) with inappropriate intersections either side that will be used for turning Tie-into TG works needs careful planning likely to have some sacrificial works Large numbers of heavy plant and haulage vehicles will be required on site due to material volumes By not progressing TG to Moonshine Road first, potential criticism that main problem is not being addressed (due to traffic increases post TG) TG to Moonshine could need eventual 4-laning in event of no P2G Link Road, so could need redesign of works and more significant land acquisition TG to Moonshine section is the most under threat from additional TG volumes for crashes and delay TG section has potential to cause major traffic delays TTM for this section will create major delays even if well managed. Crash migration to untreated sections worsened given the poor alignment section west of Hugh Duncan Street is not upgraded until final stage Commence full scale geotech testing and design of large cuts as early as possible investigate potential to accelerate this realignment with physical works forming part of 2/58 contract Similarly, embark on property strategy with property agent early, prioritising these sites Engagement with service providers, to influence design, especially GWRC water main Consider implications of splitting utility works into each stage. Clearly communicate staging strategy and reasoning Advance designs to allow consents to be sought earlier. Advancement of designs allows service relocations to be firmed up earlier. Property strategy and acceleration of acquisition Provide sufficient informal turning area in bell-mouth of local roads to allow standard car to turn around. Educate residents along this section that intersections not suitable for larger vehicle turning Proceed with project on basis that P2G Link Road is delivered, but keep informed and if there is risk to this, proposed SH58 safety works will need to consider longer term 4-laning Commence design works for realignment sections early to allow acceleration of service relocations (which would be better undertaken in advance of physical works contract to condense programme on this section). Early engagement with consent authorities Develop a traffic management plan for road users and construction traffic and seek to divert traffic off SH58 during major works Develop a plan for interim works such as improved road markings, signage and safe hit posts in anticipation of crash migration Project No.: Page 75 Our ref: SH58 Addendum Report_Final Draft

80 9 Planning & RMA This section (Section 9) has been provided by NZ Transport Agency. 9.1 Background Planning context SH58 between the intersection with SH2 and the Pauatahanui roundabout traverses both Hutt City and Porirua City districts. A small section of the highway is also located within the Upper Hutt City boundary. The boundaries are indicated in Figure 9-1 below. SH58 is located entirely within the Greater Wellington Region. Figure 9-1: District Boundaries Existing designations The existing designations associated with SH58 are outlined in the table below. Project No.: Page 76 Our ref: SH58 Addendum Report_Final Draft
81 Table 9-1: Existing Designations Council Designated reference and purpose Conditions? Comments Hutt City TNZ3 State Highway Purposes Yes Includes the SH2/58 intersection and extends a short way up SH58 Hutt City TNZ4 'State Highway Purposes' Yes Includes the SH58 Upgrade Project (the four laning) consented around Council have agreed that the designation conditions only apply to the four laning project and not to other works. Porirua City K0404 Limited Road Highway) Access (State Yes There are a significant number of conditions attached to the designation that relate specifically to the proposed four laning project which was subject to a designation around The designation envelope was also significantly widened as part of the SH58 four laning designation process. Upper City Hutt Not shown in the district plan Yes as per K0404 The Upper Hutt City Council have not put the designation in the plan due what is assumed to be an administrative error. 9.2 Required Environmental approvals Territorial Authority Approvals Outline plans and designation alterations will be required from Hutt City, Porirua City and Upper Hutt City Councils. Hutt City Council Approvals The Designation Alteration and Outline Plan requirements from Hutt City are anticipated to be relatively straight forward. Council have agreed that the myriad conditions on the TNZ4 designation only apply to the SH58 four laning project and not too any other works. The designations in Hutt City extend a considerable distance beyond the carriageway in a number of areas. However, based on the conceptual plans, the designation will still need to be extended in several areas to include sufficient land for the project. There is a potential issue with the current designation boundary (as indicated on SAR plan C022) as the current road appears to be outside the designated area. However this may be an administrative error with Council s spatial data. Porirua City Council Approvals The SH58 designation in Porirua has some complicating factors which are likely to require additional time to resolve to enable the appropriate environmental approvals to be obtained. The reference to the original underlying SH58 designation was accidentally removed from the Porirua District plan sometime in the last 10 years. Somehow, the existing SH58 has all the conditions relating specifically to the now defunct four laning project attached to designation K the only designation that applies to SH58 in Porirua. The four laning conditions should apply to the section of road from Mt Cecil road to 750m past Harris Road and should only apply to the four laning project. However neither of these matters are clear as currently presented in the Porirua District Plan. Project No.: Page 77 Our ref: SH58 Addendum Report_Final Draft
82 Obviously the four laning conditions are not applicable to the safety project so these will need to be altered to reflect the safety project works. Furthermore, a significant amount of additional land was added to the K0404 designation as part of the four laning designation process. It will not be possible to undertake any safety project related works on land that was originally designated for the four laning project without assessing the effects of the safety project works and ensuring that they are adequately mana ged through appropriate (revised) conditions. A designation alteration process will be used to revise all the conditions to make them relevant to the Safety Project as well as enable the longer term operation and maintenance of SH58. This will require extensive consultation with Porirua City Council and probably landowners and other stakeholders (incl iwi). The designation alteration is very likely to be at least limited notified. Helpfully, Porirua City Council planner officers have confirmed that they understand the K0404 designation is for the Construction, operation, realignment, maintenance and repair of that section of SH 58 subject to the four laning designation. Despite the four laning not being carried out, they also understand the purpose of the designation was to improve the safety of that section of SH 58. Given works has been carried out in that regard (the Scour works) they consider that designation K0404 has been given effect to. The conceptual plans indicate that a significant amount of additional land will need to be designated (as part of the alteration process) to enable road widening (largely cut) and in particular the construction of the proposed roundabouts. Upper Hutt City Council Approvals A 400m long section of the west bound lane of SH58 (east from Mt Cecil Road) is located within the Upper Hutt District. This section of road was designated by the Transport Agency as part of the proposed SH58 four laning upgrade. It is unknown whether there was also an underlying designation. However, there is no designation for SH58 shown in the Upper Hutt District Plan. The Upper Hutt City Council have been contacted in April 2016 with a request to update their District Plan to include the designation. Assuming this matter can be resolved, the planning requirements are likely to be similar to those for Hutt City Regional Consents Regional consents will be required for the safety project. Additional civil engineering detail will be required to assess the exact nature of consents required, including detailed design data on earthworks volumes, location, works methodology, and proposed drainage and stream works details. However, likely consenting triggers include: 1. Earthworks associated with cut and fill 2. Stormwater discharges during construction works 3. Works in beds of streams and stream diversions during construction 4. Modifications and/or new bridges and structures (eg culverts) 5. Fill disposal (cut to waste) Other approvals Approval may be required from Heritage New Zealand for earth disturbance. Additional civil design work will be required to determine the need for an Authority to Modify (based on location). An assessment will need to be made to determine whether there are any potential contaminated sites within the project area. If any sites are identified, these will need managed, and potentially consented, in accordance with the National Environmental Standard for Assessing and Managing Contaminants in Soil to Protect Human Health (NESCS). 9.3 Timeframes A table outlining indicative planning requirements and associated timeframes is provided below. Project No.: Page 78 Our ref: SH58 Addendum Report_Final Draft
83 Table 9-2: Timeframes for consents Action Assessment of effects and consultation with affected parties (including provision of feedback to stakeholders on confirmed design Prepare and lodge Designation Alterations (from HCC, PCC and UHCC) Process Designation alterations (HCC, PCC) Prepare and lodge Outline Plans (from HCC, PCC and UHCC) Process Outline plan (from HCC, PCC and UHCC) Draft and lodge regional consent applications (Greater Wellington). Assuming some stakeholder consultation will be required as part of this process). Time required (indicative) 3-4 months Prepare Alteration/NOR 2 3 months 4-5 months+ (Assumption that limited notified required) 2 months (can be prepared in parallel to Alterations) 20 working days 2-3 months (can be prepared in parallel to Alterations and Outline plans) Process regional consents (statutory process) Draft and lodge Authority to modify (if required) and consent under NESCS (if required). Process Authority to modify and consent under NESCS (statutory process) 3 months+. Assuming limited notified. Can be processed in parallel with designation alterations and/or outline plans 2 months (can be prepared in parallel to Alterations and Outline plans, regional consent ) 2 months. Can be processed in parallel with designation alterations and/or outline plans The total likely time required for this process is therefore approximately months. The designation option could be appealed, and if so this would add approximately months to the timeframe. Project No.: Page 79 Our ref: SH58 Addendum Report_Final Draft
84 10 Risk The project risk register for this project has been updated as part of this SAR Addendum. An entirely new risk register has not been created, but the previous version has been updated to incorporate new risks and to revise previous risks where the status has changed since Rev4 of the SAR. The risk register is contained in Appendix G and provides greater detail than below. The key risks are summarised below: Phase Risk Description Score Category Treatment Project Property Land Acquisition Difficulty in acquiring land. Caused by obstructive landowner or excessive cost demands. 210 Cost - Minor Delay - Substantial Consultation Project objectives not achieved Investigations indicate that constraints or conditions will not allow full achievement of project intentions and objectives (e.g. inadequate width for median barrier). 200 Cost - Major H&S - Medium Design Change in scope of works Updated project scope (Opt 5) deemed unaffordable and project delayed / abandoned 200 Cost Medium Delay Major Reputation - Medium Design & NLTP Funding Allocation Investigation and Reporting Project Economics Early delivery of scour site realignment has realised many of the corridor crash cost savings - so project loses prioritisation of regional importance, but fatal and serious crashes persist 140 Cost Medium Delay Major Reputation - Medium Economic Evaluation Construction cost changes significantly different from I&R Scope is for a 'light' SAR. With no geotechnical testing, stormwater design or bridge design, there is the chance that basic construction costs will be significantly underestimated. LiDAR data may also lead to inaccurate quantities estimates 120 Cost - Major Cost Estimation Limited consultation Stakeholders respond that they are not adequately consulted & project has since changed 120 Delay - Minor Further consultation Design and Project Documentation Appeals to Environment Court Consents not achieved Onerous consent conditions Project taken to Environment Court 120 Consent not granted 80 Consent conditions impose substantial changes to project 80 Delay - Major Cost - Minor Delay - Medium Cost - Minor Delay - Medium Cost - Minor Statutory Planning & Consultation Statutory Planning - Early and prelodgement engagement Project No.: Page 80 Our ref: SH58 Addendum Report_Final Draft
85 Phase Risk Description Score Category Treatment with Council(s). 11 Conclusion & Recommendation 11.1 Assessment Findings The key findings are: Safety The high speed environment, poor horizontal alignment (out of context curves), roadside hazards and narrow cross section all contribute to the high severity crashes experienced and the on-going high injury crash risk (as evidenced by the high collective crash risk and 2 star KiwiRAP star rating for this section of highway). With the opening of TG in 2020, significantly greater traffic volumes are forecast to use SH58 with a consequential worsening of the crash record. At least an additional six DSI (or two DSI/year) are estimated to occur on SH58 in the time between TG opening (est. 2020) and P2G Link Road opening (est. 2023) as a result of the increased volumes on a KiwiRAP 2 star road. The additional 2 DSi per year is in addition to the 2.6 DSI/year, which is already occurring. The recommended safety improvement works are forecast to provide an increased KiwiRAP star rating from 2.7 to stars, with a 45-66% reduction in Injury crashes per 100M VKT, which results in an estimated DSI saved over 10 years Capacity From the modelling undertaken, it is expected that there will be a capacity problem on SH58 following the opening of TG and prior to the opening of the P2G Link Road. The predicted traffic volumes using SH58 means that, for the most part, SH58 would be operating at around LOS E in the peak periods (and possibly worse on particular sections). Once P2G Link Road opens, traffic levels on SH58 return to approximately current levels and no capacity concerns are predicted within the modelling horizon which ends in For the period between TG and P2G Link Road, a management plan will need to be introduced. This should include: Travel demand management (TDM) measures o o o Traveller information, publicity and media releases (for example to travel outside of peaks) Promotion of alternative modes including Park & Ride facilities (at Porirua and Tawa) ITS measures, to allow informed route choice at key decision points (for example to stay on SH1 or SH2) Small scale capacity improvements: if the TDM measures are not effective and additional capacity is required. For example, the modelling has shown a particular problem eastbound in the AM peak approaching SH2/58 interchange at this location there would be value in testing whether the dual lane approach to the interchange should be extended back further and then this included into the detailed design works for the safety improvements on the corridor. Should the P2G Link Road not progress, then it would be necessary to provide significant extra capacity on SH58 when volumes increase after the opening of TG, with four laning being required. Further, if the lag time between TG and P2G Link Road increases beyond a few years, more significant measures to address capacity issues may be needed. Project No.: Page 81 Our ref: SH58 Addendum Report_Final Draft
86 Travel Time Reliability This is linked to both safety and capacity but presented separately for clarity. Travel time reliability is, at the present, only affected by safety with delays and closures caused by crashes. With the reduction in serious and fatal crashes that the improvements are predicted to deliver, there is an associated travel time reliability benefit through reducing the number of occasions when delays and closures occur due to serious crashes. Travel time reliability due to capacity is not currently an issue. The average route travel speed is 80km/h with minimal variation throughout the day or by direction, despite the existing 100 km/h posted speed limit, suggesting speeds are constrained more so by geometry than congestion. Based on Austroads metrics (described in Section 2.2) travel time reliability is not currently an issue along the corridor. With significant increases in traffic in the period after TG but prior to P2G Link Road, it is expected that travel time reliability will worsen (based on using reduced LoS increased V/C ratios as a proxy for reliability). With the P2G Link Road in place, traffic levels and LoS returns to current levels and it is therefore predicted that travel time reliability based on capacity will return to the current state (i.e. no capacity related reliability issues) P2G Link Road The assessments undertaken clearly demonstrate how essential the P2G Link Road provision is to the future operation of SH58, once TG opens. Should P2G Link Road not occur, or be delayed for an extended period beyond the three year lag currently expected between TG opening, then TDM measures or minor capacity improvements are expected to gradually become less effective. The SH58 safety improvements will provide a step change in terms of safety outcomes, however major capacity issues will eventuate without the P2G Link Road. If the safety improvements are implemented, and then a decision is made later to four lane SH58 (because the P2G Link Road project had been abandoned), then the majority of the cost of the SH58 safety improvements is expected to be a sunk cost. This is because the current alignment is not conducive to four laning and a new offline route is likely to be needed Next Steps Internal NZ Transport Agency SAR Approval The general process to be followed by for the Transport Agency for the SAR / SAR Addendum approval, and the subsequent project stages, is summarised below: Transport Agency review of SAR. Feedback and revision by Consultant. Final SAR. Transport Agency internally socialise findings of SAR. Transport Agency write paper recommending the approval of the SAR and prioritisation of sub - projects. RMT approval (approx. 1 month after SAR finalised). CHLT approval (approx. 6 weeks after SAR finalised). VAC approval (approx. 2 months after SAR finalised). P&I approval (approx. 2 months after SAR finalised). Request funding for consenting/design (depends on prioritisation and business case) with VAC/P&I approvals. Public communication of strategy. Consenting/design commences approx Lodge consents (if required) end Commence construction (depends on whether consents required and what the prioritisation is) in approximately Project No.: Page 82 Our ref: SH58 Addendum Report_Final Draft
87 For Consenting The work undertaken to date is not sufficiently advanced to allow consent applications to be developed and submitted for either a Notice of Requirement for an alteration to the designation, or for resourcing consenting. Additional work will need to be undertaken prior to consent applications. It is recommended that these additional works are undertaken urgently and prior to the detailed design phase of works. These works can be accelerated and be commenced immediately, whereas to package with detailed design would delay commencement due for the need to produce RFT documents and undertake a tendering process. The works will help inform the detailed design, thereby de-risking some aspects, but will also allow the consenting process to start earlier which is considered to be a critical path item for delivery. The works detailed below should be commenced as early as possible: Geotechnical testing and interpretation: An initial PGAR was undertaken for this SAR but that did not include any on site invasive testing or lab work. Given the topography and expected size and nature of the earthworks, more geotechnical assessment is required along the corridor. Additional geotechnical testing recommendations are contained within the PGAR. In addition to volumes of earthworks and cut slope profiles, the construction of the realignment of the Scour Site improvements highlighted the considerable subgrade variability in pavement construction additional testing and analysis should be undertaken to better define pavement design requirements. Stormwater management: No hydrology or stormwater design has been undertaken for the project. The management of stormwater and discharge requirements, will need to be advanced prior to lodging consents. Stormwater management and the need for drainage swales, detention ponds, attenuation and culvert sizing will need to be defined for the consenting processes. This issue was highlighted during the consenting process for the Scour Site works where in effect the regional council required an understanding of the completed detailed design for stormwater management before issuing consents. Bridge design: The bridge / structural works to be undertaken as part of the corridor improvements have only been subject to a brief and very high level overview. A hydrology assessment will be required in advance of any concept level bridge design work that will be needed for the consenting process. The additional work noted above could be undertaken prior to, or as part of, the detailed design works for the project. During the detailed design, this would allow any additional work to be accurately targeted and could limit the need to incorporate an unnecessary level of conservatism in testing or evaluation. If the additional work is undertaken prior to detailed design, sufficient flexibility and conservatism will need to be built into any work noting the detailed design will not have commenced, however, this will allow programme acceleration (i.e. consents could be lodged earlier than if grouped with the detailed design phase) For Land Acquisition In Rev4 of the SAR, indicative land requirement plans were developed and these plans were used in the landowner consultation process undertaken in These plans are indicative and used to commence the initial discussions with landowners in terms of the general project proposals, however they are not sufficiently developed to allow land acquisition to commence. Principally, this is because there are aspects of the design that require further work (as detailed above) prior to being able to confirm land requirements with a level of confidence. Therefore, it is not recommended that the land acquisition process is advanced until the additional design work necessary for consenting is either completed, or at least well advanced. When this design work is completed, the indicative land requirement plans can be updated to take account of the more advanced design work undertaken, as well as any changes to the project works since late 2014, and then used for further landowner engagement and land acquisition Recommendations The following recommendations are made from this SAR Addendum: Project No.: Page 83 Our ref: SH58 Addendum Report_Final Draft
88 A. Progress the implementation of the P2G Link Road which is critical to the medium to longer term operation of SH58. B. Seek internal NZ Transport Agency approval of the SAR (and Addendum), and seek approval to move to the next stage of design. C. Provide formal feedback to the public and landowners as to the results (and project updates) following the public consultation in late 2014 and the NZ Transport Agency s current timelines. D. Progress implementation of the 80km/h speed reduction. E. Progress the SH58 safety improvements to the next phase of design and subsequently to construction, as follows: Accelerate the works needed for consenting and accurate definition of land requirement in advance of undertaking detailed design to facilitate a more condensed detailed design programme. Given the proposed opening of TG in 2020, any methods that support accelerated delivery of the SH58 improvements should be progressed. Engage a property consultant to validate and update property costs / estimates (to help refine the project estimate). In addition, a property consultant can provide a first contact point for landowners seeking an update on project progress and timeframes. Commence land acquisition process when design work is sufficiently advanced. Similarly, submit for Notice of Requirement and resource consents when the design is ready to do so, given these processes are expected to be protracted. Develop a procurement strategy and timeline for design (pre-implementation) and construction (implementation), noting the alternative staging strategies and phasing options. For example, if a staged approach over a number of years is favoured, then a D&C type arrangement may be less suitable. In conjunction with the procurement strategy for design and construction, develop a detailed management plan for the period after TG, but prior to the P2G Link Road opening. Project No.: Page 84 Our ref: SH58 Addendum Report_Final Draft
89 Project No.: Page 85 Our ref: SH58 Addendum Report_Final Draft
90 Appendix A Traffic Data A.1 Traffic Volume Data Project No.: Page 86 Our ref: SH58 Addendum Report_Final Draft
91
92
93 SH58 East of Pauatahanui (Telemetry), 1 Hour Rolling Average Flow, Monday to Thursday and Weekend Combined (15 March March 2015) SH 58 RS 0 RP Vehilces Per Hour :00:00 a.m. 3:00:00 a.m. 6:00:00 a.m. 9:00:00 a.m. 12:00:00 p.m. 3:00:00 p.m. 6:00:00 p.m. 9:00:00 p.m. 12:00:00 a.m. Increasing Decreasing Weekend Combined 1200 SH58 West of SH2 (Haywards), 1 Hour Rolling Average Flow, Monday to Thursday and Weekend Combined (15 March March 2015) SH 58 RS 0 RP Vehilces Per Hour :00:00 a.m. 3:00:00 a.m. 6:00:00 a.m. 9:00:00 a.m. 12:00:00 p.m. 3:00:00 p.m. 6:00:00 p.m. 9:00:00 p.m. 12:00:00 a.m. Increasing Decreasing Weekend Combined
94 A.2 Traffic Growth Data Project No.: Page 87 Our ref: SH58 Addendum Report_Final Draft
95 Site West of SH 2 (Haywards Hill) Short Light Medium Long V.Long Site Short Light Medium Long V.Long West of SH 2 (Haywards Hill) PAUAHATANUI EAST Telemetry Site 73 Opposite Timber Mill Car LCV MCV HCV1 HCV2 Total HCV AADT Car LCV MCV HCV1 HCV2 Total HCV AADT Year % 1% 4% 2% 1% 7% 93% 3% 3% 0% 0% 4% Year Composition 92% 1% 4% 2% 1% 7% 100% 2015 Composition 93% 3% 3% 0% 0% 4% SH58 Traffic Composition 2015 West of SH2 (Haywards Hill) (RP58/0) LCV, LCV, Short Light Medium Long V.Long Short Light Medium Long V.Long MCV, 606 Heavy MCV, 426 Heavy Site Year Cars, Car LCV Total HCV MCV HCV1 HCV2 Site Car LCV Vehicles, Vehicles, 923 Cars, Total HCV MCV HCV1 HCV2 West of SH PAUAHATANUI EAST % 1% HCV1, 4% 234 2% 1% 93% 3% 3% 0% 0% HCV1, 70 HCV2, 83 PAUAHATANUI EAST Telemetry Site 73 Opposite Timber Mill SH58 Traffic Composition 2015 Pauatahanui East Telemetry (RP 58/9) HCV2, 61 Car LCV MCV HCV1 HCV2 Car LCV MCV HCV1 HCV2 AADT and Cars (vpd) 15,000 14,000 13,000 12,000 11,000 10,000 9,000 8,000 7,000 6,000 5,000 4,000 3,000 2,000 1,000 0 West of SH 2 (Haywards Hill) Car AADT LCV MCV HCV1 HCV2 Total HCV Commercial Vehicles (vpd) AADT and Cars (vpd) Pauatahanui East Telemetry 15, ,000 13, , ,000 10, , ,000 7, , ,000 4, , ,000 West of ,000 SH2 Continuou Wellingto (Hayward s n s) Car AADT LCV MCV HCV1 HCV2 Total HCV Commercial vehicles(vpd)
96 A.3 Speed Data Project No.: Page 88 Our ref: SH58 Addendum Report_Final Draft
97 Date Range Time Set Covered Route Length [metres] Sample size [avg per segment] Average Travel Time [hh:mm:ss] Median Travel Time [hh:mm:ss] Average Speed [kph] 15th percentile Speed [kph] 85th percentile Speed [kph] Average Travel Time ratios 5th percentile travel time [hh:mm:ss] 10th percentile travel time [hh:mm:ss] Buffer Index Route SH58, SH2 to TG v2 All am 8, :08:50 00:06: :05:05 00:05:17 118% 0.59 SH58, SH2 to TG v2 All am 8, :10:05 00:07: :05:31 00:05:40 216% 1.08 SH58, SH2 to TG v2 All am 8, :06:56 00:06: :05:14 00:05:23 31% 0.15 SH58, SH2 to TG v2 All am 8, :06:47 00:06: :05:34 00:05:42 25% 0.12 SH58, SH2 to TG v2 All am 8, :06:42 00:06: :05:48 00:05:57 19% 0.10 SH58, SH2 to TG v2 All am 8, , :06:51 00:06: :05:55 00:06:02 22% 0.11 SH58, SH2 to TG v2 All am 8, , :06:58 00:06: :05:51 00:06:00 24% 0.12 SH58, SH2 to TG v2 All pm 8, , :06:47 00:06: :05:45 00:05:56 26% 0.13 SH58, SH2 to TG v2 All pm 8, , :06:41 00:06: :05:45 00:05:55 23% 0.11 SH58, SH2 to TG v2 All pm 8, :06:38 00:06: :05:50 00:05:59 18% 0.09 SH58, SH2 to TG v2 All pm 8, :06:30 00:06: :05:48 00:05:56 15% 0.07 SH58, SH2 to TG v2 All pm 8, :06:23 00:06: :05:35 00:05:42 16% 0.08 SH58, SH2 to TG v2 All pm 8, :06:32 00:06: :05:32 00:05:40 19% 0.09 SH58, SH2 to TG v2 All am 8, :07:41 00:06: :05:21 00:05:32 19% 0.10 SH58, East of TG to SH2 All am 8, :08:22 00:06: :05:33 00:05:42 164% 0.82 SH58, East of TG to SH2 All am 8, :07:52 00:06: :05:55 00:06:03 57% 0.29 SH58, East of TG to SH2 All am 8, :06:56 00:06: :05:38 00:05:49 24% 0.12 SH58, East of TG to SH2 All am 8, :06:35 00:06: :05:37 00:05:45 23% 0.11 SH58, East of TG to SH2 All am 8, :06:53 00:06: :05:57 00:06:06 20% 0.10 SH58, East of TG to SH2 All am 8, :06:55 00:06: :05:55 00:06:02 30% 0.15 SH58, East of TG to SH2 All am 8, , :06:51 00:06: :05:49 00:05:58 21% 0.10 SH58, East of TG to SH2 All pm 8, , :06:52 00:06: :05:53 00:06:01 24% 0.12 SH58, East of TG to SH2 All pm 8, , :06:52 00:06: :05:58 00:06:04 21% 0.10 SH58, East of TG to SH2 All pm 8, :06:44 00:06: :05:56 00:06:04 17% 0.09 SH58, East of TG to SH2 All pm 8, :06:41 00:06: :05:49 00:05:58 20% 0.10 SH58, East of TG to SH2 All pm 8, :06:29 00:06: :05:43 00:05:51 17% 0.08 SH58, East of TG to SH2 All pm 8, :06:30 00:06: :05:32 00:05:40 20% 0.10 SH58, East of TG to SH2 All am 8, :07:32 00:06: :05:33 00:05:40 23% 0.12 Speed (km/h) SH58 Weekday Travel Speed (2013) Westbound 85th percentile Speed [kph] Average Speed [kph] 15th percentile Speed [kph] Speed (km/h) SH58 Weekday Travel Speed (2013) Eastbound 85th percentile Speed [kph] 15th percentile Speed [kph] Average Speed [kph] CoV
98 Route Date Range March 2015 Time Set Flow (Veh/hr - Rolling avg) M-F 07:15- SH2 to TG - Full Traversal All M-F 07:45- SH2 to TG - Full Traversal All M-F 08:15- SH2 to TG - Full Traversal All M-F 10:00- SH2 to TG - Full Traversal All M-F 16:15- SH2 to TG - Full Traversal All M-F 16:45- SH2 to TG - Full Traversal All M-F 17:15- SH2 to TG - Full Traversal All SH58 TG to SH2 - Full M-F 07:15- Traversal All ,007 SH58 TG to SH2 - Full M-F 07:45- Traversal All SH58 TG to SH2 - Full M-F 08:15- Traversal All SH58 TG to SH2 - Full M-F 10:00- Traversal All SH58 TG to SH2 - Full M-F 16:15- Traversal All SH58 TG to SH2 - Full M-F 16:45- Traversal All SH58 TG to SH2 - Full M-F 17:15- Traversal All CoV 0.18 Coefficient of 0.16 Variation bands Covered Route Length [metres] Sample size [avg per segment] Average Median Average 15th 85th 85th Travel Time Travel Time Speed [kph] percentile percentile percentile [hh:mm:ss] [hh:mm:ss] Speed [kph] Speed [kph] travel time [hh:mm:ss] 90th percentile travel time [hh:mm:ss] 95th percentile travel time [hh:mm:ss] Total Route Length [metres] Standard Deviation (of traveltime, only full traversals) [hh:mm:ss] 07:45 07:15-07:45 8, :06:36 00:06: :07:19 00:07:37 00:08:15 8, :00:38 08:15 07:45-08:15 8, :06:36 00:06: :07:18 00:07:36 00:08:13 8, :00:36 08:45 08:15-08:45 8, :06:51 00:06: :07:33 00:07:54 00:08:41 8, :00:50 13:30 10:00-13:30 8, , :06:42 00:06: :07:25 00:07:44 00:08:22 8, :00:49 16:45 16:15-16:45 8, :06:41 00:06: :07:18 00:07:35 00:08:09 8, :00:55 17:15 16:45-17:15 8, :06:29 00:06: :07:03 00:07:17 00:07:39 8, :00:40 17:45 17:15-17:45 8, :06:31 00:06: :07:08 00:07:22 00:07:48 8, :00:34 07:45 07:15-07:45 8, :06:42 00:06: :07:19 00:07:38 00:08:17 8, :00:51 08:15 07:45-08:15 8, :06:56 00:06: :07:43 00:08:05 00:08:48 8, :00:45 08:45 08:15-08:45 8, :06:46 00:06: :07:33 00:07:57 00:08:38 8, :00:45 13:30 10:00-13:30 8, , :06:43 00:06: :07:26 00:07:46 00:08:25 8, :00:46 16:45 16:15-16:45 8, :06:38 00:06: :07:20 00:07:35 00:08:00 8, :00:29 17:15 16:45-17:15 8, :06:31 00:06: :07:14 00:07:30 00:08:01 8, :00:30 17:45 17:15-17:45 8, :06:41 00:06: :07:24 00:07:47 00:08:23 8, :00:41 SH58 (SH2 to TG Westbound) Weekday Travel Time Variability vs Volume LOW MEDIUM LOW 1,200 1, Hourly Volume CoV TomTom Actual CoV Estimated CoV 2 SD Estimated CoV (85th) Actual CoV - 15% 85% 115% Actual CoV +15% % % % % % % % % % % % % % % % % % % % % % % % % % % % % SH58 (SH2 to TG Westbound) Weekday Travel Time Variability Estimated CoV % 128% 105% 97% 76% 83% 108% 89% 119% 119% 106% 135% 143% 118% LOW MEDIUM Buffer Index (95th - avg)/avg LOW Est CoV (0.5 BI) Buffer Index :15 07:45 07:45 08:15 08:15 08:45 10:00 13:30 16:15 16:45 16:45 17:15 17:15 17:45 Time March 2015 Flow (Veh/hr Rolling avg) TomTom Actual CoV Estimated CoV Est CoV (0.5 BI) Actual CoV 15% Actual CoV +15% :15 07:45 07:45 08:15 08:15 08:45 10:00 13:30 16:15 16:45 16:45 17:15 17:15 17:45 Time TomTom Actual CoV Estimated CoV (85th) Estimated CoV Est CoV (0.5 BI) Actual CoV 15% Actual CoV +15% Buffer Index (95th avg)/avg 0.00 CoV SH58 (TG to SH2 Eastbound) Weekday Travel Time Variability vs Volume LOW MEDIUM LOW 1,200 1, Hourly Volume CoV SH58 (TG to SH2 Eastbound) Weekday Travel Time Variability LOW MEDIUM LOW Buffer Index :15 07:45 07:45 08:15 08:15 08:45 10:00 13:30 16:15 16:45 16:45 17:15 17:15 17:45 Time March 2015 Flow (Veh/hr Rolling avg) TomTom Actual CoV Estimated CoV :15 07:45 07:45 08:15 08:15 08:45 10:00 13:30 16:15 16:45 16:45 17:15 17:15 17:45 Time TomTom Actual CoV Estimated CoV (85th) Estimated CoV Est CoV (0.5 BI) 0.00 Est CoV (0.5 BI) Actual CoV 15% Actual CoV +15% Actual CoV 15% Actual CoV +15% Buffer Index (95th avg)/avg Coefficient of Variation bands based on Austroads % 102% % Low Low medium Medium High Very High less than more than 0.30
99 Appendix B B.1 Crash Data Crash Data Project No.: Page 89 Our ref: SH58 Addendum Report_Final Draft
100 Crash List: SH Combined Crash List Detail report - Run on: 25 Feb 2016 Injury and non-injury crashes Page 1 of 2 Overall Crash Statistics Crash Severity Fatal Serious Minor Injury Non-injury Crash Type All crashes % All crashes Overtaking Crashes Straight Road Lost Control/Head On Bend - Lost Control/Head On Rear End/Obstruction Crossing/Turning Pedestrian Crashes Miscellaneous Crashes TOTAL Crash factors (*) Alcohol Too fast Failed Givew ay/stop Failed Keep Left Overtaking Incorrect Lane/posn Poor handling Poor Observation Poor judgement Fatigue Disabled/old/ill Vehicle factors Road factors Weather Other Number Social cost ($m) TOTAL Crashes w ith a: Driver factor Environmental factor (*) factors are counted once against a crash - ie tw o fatigued drivers count as one fatigue crash factor. Note: Driver/vehicle factors are not available for non-injury crashes for Northland, Auckland, Waikato and Bay of Plenty before This w ill influence numbers and percentages. % Crash Numbers Year Fatal Serious Minor Non-inj TOTAL Percent Note: Last 5 years of crashes show n Crash Type and Cause Statistics All crashes % All crashes Note: % represents the % of crashes in w hich the cause factor appears Num ber of parties in crash All crashes % All crashes Overall Casualty Statistics Injury Severity Number % all casualties Death Serious Injury Minor Injury Drivers at fault or part fault in injury crashes Age Male % Female % Total % TOTAL Drivers at fault or part fault in injury crashes Licence Male Female Total Full Learner Restricted Never licensed Disqualified Overseas Expired Other/Unknow n TOTAL Casualty Numbers Year Fatal Serious Minor TOTAL Percent Note: Last 5 years of casualties show n Driver and Vehicle Statistics Note: Driver information is not computerised for non-injury crashes Vehicles involved in injury crashes No.of vehicles SUV Car/Stn Wagon Motor Cycle Bicycle Truck Van Or Utility % % Injury crashes TOTAL Note: % represents the % of injury crashes in w hich the vehicle appears
101 Crash List: SH Combined Crash List Detail report - Run on: 25 Feb 2016 Injury and non-injury crashes Page 2 of 2 Road Environment Statistics Time Period Statistics Road Type Local % State % Total % road highw ay Urban Open Road TOTAL Day/Period Weekday Weekend TOTAL All crashes % All crashes Conditions Injury Non-injury Light/overcast Dark/tw ilight TOTAL Conditions Dry Wet Ice/snow TOTAL Total % 100 Injury Non-injury Total % Day/ Period Total Weekday Weekend TOTAL Note: Weekend runs from 6 pm on Friday to 6 am on Monday 138 Intersection/m id-block All crashes % All crashes Intersection Midblock TOTAL Objects Struck Injury % Non-injury crashes crashes Crashes w /obj.struck Object Struck Cliff Bank Debris Over Bank Fence Guard Rail Post Or Pole Traffic Sign Tree Ditch Stray Animal Other Water/River Injury crashes TOTAL Note: % represents the % of crashes in w hich the object is struck % Non-injury crashes % 69 % Day/ Period Total Mon Tue Wed Thu Fri Sat Sun TOTAL Month Injury % Non-injury % Total % Jan Feb Mar Apr May Jun Jul Aug Sep Oct Nov Dec TOTAL
102 N Km 6Km SH58 Injury Crash Collision Diagram
103 Coded Crash report, run on , Page 1 First Street D Second street Crash Date Day Time Factors and Roles O C W L W J C M S Total P C I or landmark Number B U E I E U O A P Inj E Y R Distance M D A is for vehicle 1 V R B is for veh 2 etc M VN VVV DD/MM/YYYY DDD HHMM T J E C T R V E T N E S G H T T H E R N C T N T R L R K S D L M T F S M A E I T R N D a g e C a g e 58/0/0.1 40N HEBDEN CRESCENT 58/0/ W SH 2 58/0/ N HEBDEN CRESCENT 58/0/ W SH 2 58/0/0.359 I MCDOUGALL GROVE 58/0/0.359 I MCDOUGALL GROVE 58/0/0.359 I MCDOUGALL GROVE 58/0/0.359 I MCDOUGALL GROVE 58/0/0.629 HAYWARDS HILL ROAD 270N MCDOUGALL GROVE 58/0/ N MCDOUGALL GROVE 58/0/ N MCDOUGALL GROVE 58/0/ N SH 2 58/0/ S HUGH DUNCAN ST 58/0/0.7 HAYWARDS HILL ROAD 700N WESTERN HUTT ROAD 58/0/ S HUGH DUNCAN ST 58/0/ S HUGH DUNCAN ST 58/0/ S HUGH DUNCAN ST 58/0/0.746 HAYWARDS HILL ROAD 190S HUGH DUNCAN ST 58/0/0.816 HAYWARDS HILL ROAD 120S HUGH DUNCAN ST 58/0/1 1000N WESTERN HUTT ROAD 58/0/ N HUGH DUNCAN ST 58/0/ N WESTERN HUTT ROAD 58/0/ N HUGH DUNCAN ST 58/0/ N HUGH DUNCAN ST 58/0/1.393 HAYWARDS HILL ROAD 100N ATIAMURI CRESCENT 58/0/1.396 I OLD HAYWARDS ROAD 58/0/ N HUGH DUNCAN ST 58/0/ N OLD HAYWARDS ROAD 58/0/ N OLD HAYWARDS ROAD 58/0/1.636 HAYWARDS HILL ROAD 700N HUGH DUNCAN ST 58/0/ N OLD HAYWARDS ROAD 58/0/ N OLD HAYWARDS ROAD 58/0/ N HUGH DUNCAN ST 58/0/ N HUGH DUNCAN ST 58/0/ N HUGH DUNCAN ST 58/0/ S MOUNT CECIL ROAD 58/0/ W SH /04/2011 Tue 1659 DB 4N1 111A 131A 402A 801 C M W O L N R /10/2010 Mon 1145 DA 4N1 135A C M W O H N P /01/2011 Sun 1345 DA CW1 135A 806 C M W O L N R /06/2010 Tue 1646 DA VW1 133A C M W O L N R /01/2015 Fri 0659 GDCN1C 181A 331A E D B F T G L /04/2010 Mon 1240 GDCN1C 331A E D O F T G C /11/2010 Fri 1341 MCCN1C 372B E D B F T G L /12/2011 Sun 1920 GBCN1C 158A 175B 372B 402B E D B F T G C /07/2013 Sun 1054 FA 4S1C 111A 131A S D O F N C /04/2011 Mon 1928 DA CS1 101A 111A 131A ET E W DN F N L /06/2010 Fri 2118 DA CS1 111A 632A 801 C S W DO M N C /10/2014 Mon 2100 DA CS1 110A 131A T M W DN H N L /11/2011 Fri 1046 DB CN1 102A 135A 402A 801 CET M W O F N C /09/2012 Thu 2300 DB CN1 111A 517A C E D DO F N C /11/2011 Sat 0720 BC 4N1CCV 111A 197A 378A M W O L N L /02/2014 Sun 0920 DA CS1 131A 400A C M W ON L N C /10/2012 Sun 1019 FA MN1C 130A 181A 182B M D B F N L /05/2013 Mon 1831 DA CS1 130A 410A E D DN F N C /06/2013 Mon 0645 DA CS1 111A 135A 801 PT M W DN F N C /05/2015 Fri 0707 DA VN1 111A 131A G M W OF L C /05/2010 Sat 1724 CC CN1 110A G R W DN L N C /05/2015 Wed 1930 DA CN1C 111A 130A DG M W DO L N C /01/2010 Sat 1215 DB VN1M 111A 135A 801 G E W O L N C /05/2010 Mon 1625 CA MN1 135A 806 E W TF L N R /09/2012 Sat 1720 DA VS1 136A 662A F E D O F N C /02/2015 Tue 0435 DBVS1 101A 410A G M D DN F T N C /04/2010 Fri 1624 DA VN1 111A 135A 801 C E W O H N C /04/2011 Fri 1920 DB CN1 131A 804 G E W DN L N R /05/2015 Fri 1315 DB 4N1 129A 330A C E D B F N N /05/2013 Sat 1640 DA CW1 135A 402A 403A 801 C E W O F N C /03/2015 Sat 1447 AD CN1 130A 151A C R W O H C /02/2012 Sat 1018 CA SS1 330A 341A X R D B F N C /01/2012 Sun 1512 DB CS1 131A 350A 800 G E W O L N C /08/2010 Tue 1736 QG TS1C 682A D M D TO F N C /04/2015 Thu 0715 DA CN1 111A 131A C E W OF F N P /07/2015 Tue 0650 AD CN1T 135A 802 G E I DO F P /06/2012 Sat 1059 DA CS1 134A E D B F N C 100
104 Coded Crash report, run on , Page 2 First Street D Second street Crash Date Day Time Factors and Roles O C W L W J C M S Total P C I or landmark Number B U E I E U O A P Inj E Y R Distance M D A is for vehicle 1 V R B is for veh 2 etc M VN VVV DD/MM/YYYY DDD HHMM T J E C T R V E T N E S G H T T H E R N C T N T R L R K S D L M T F S M A E I T R N D a g e C a g e 58/0/ N OLD HAYWARDS ROAD 58/0/ N SH 2 58/0/ N HUGH DUNCAN ST 58/0/ W SH 2 58/0/2 HAYWARDS HILL 2000N WESTERN HUTT ROAD 58/0/2.053 HAYWARDS HILL ROAD 900S MOUNT CECIL ROAD 58/0/ N HUGH DUNCAN ST 58/0/ S MOUNT CECIL ROAD 58/0/ S MOUNT CECIL ROAD 58/0/2.216 HAYWARDS HILL 820N OLD HAYWARDS ROAD 58/0/ N OLD HAYWARDS ROAD 58/0/2.313 HAYWARDS HILL ROAD 640S MOUNT CECIL ROAD 58/0/2.436 HAYWARDS HILL ROAD 1500N HUGH DUNCAN ST 58/0/2.553 HAYWARDS HILL ROAD 400S MOUNT CECIL ROAD 58/0/ S MOUNT CECIL ROAD 58/0/ S MOUNT CECIL ROAD 58/0/ S MOUNT CECIL ROAD 58/0/ S MOUNT CECIL ROAD 58/0/2.853 HAYWARDS HILL ROAD 100S MOUNT CECIL ROAD 58/0/3.153 HAYWARDS HILL ROAD 200N MOUNT CECIL ROAD 58/0/3.153 HAYWARDS HILL ROAD 200N MOUNT CECIL ROAD 58/0/ N MOUNT CECIL ROAD 58/0/ S HARRIS ROAD 58/0/ N MOUNT CECIL ROAD 58/0/3.533 HAYWARDS HILL ROAD 580N MOUNT CECIL ROAD 58/0/ W MOUNT CECIL ROAD 58/0/3.553 HAYWARDS HILL 600N MOUNT CECIL ROAD 58/0/3.553 HAYWARDS HILL ROAD 600N MOUNT CECIL ROAD 58/0/3.553 HAYWARDS HILL ROAD 600N MOUNT CECIL ROAD 58/0/ E MOONSHINE ROAD 58/0/ N MOUNT CECIL ROAD 58/0/ N MOUNT CECIL ROAD 58/0/ N MOUNT CECIL ROAD 58/0/ N MOUNT CECIL ROAD 58/0/3.653 HAYWARDS HILL ROAD 700N MOUNT CECIL ROAD 58/0/ N MOUNT CECIL ROAD 58/0/3.728 HAYWARDS HILL 1020E HARRIS ROAD /07/2014 Tue 0604 DA CN1 110A 131A 801 G M W DN L R /06/2010 Mon 0628 DA CN1 111A 135A 802 C M I DN F N C /08/2011 Wed 1720 AC CS1C 159A 330A E D O F C /03/2010 Wed 1231 AD VW1C 136A 359A 632A 801 C M W O H N R /06/2012 Tue 1535 DA CS1 111A 332A 801 G E W O F N R /10/2012 Fri 1415 DA CS1 134A 139A GT E D O F N C /07/2010 Wed 0716 DA VW1 135A 802 G M I O F N C /07/2011 Fri 0755 DB CN1 131A CG E D B F N R /07/2011 Tue 1535 DA CS1 103A 134A G E D O F N R /06/2010 Thu 1145 DA CS1 135A 806 T E W O F N C /02/2010 Fri 1530 AD CN1 131A F E W O H N C /05/2013 Wed 0134 DA MN1 108A 110A 131A 402A E W DO L N C /07/2013 Wed 2235 DA CS1 131A 402A E D DN F N C /12/2012 Thu 1847 DA CS1 129A 131A T E W O F N R /05/2012 Mon 0907 FA CS1C 111A 181A 402A 191B 901 S W O H N L /07/2014 Sat 1545 BF CN1C 131A 414A S D OF F N L /01/2010 Sun 2129 DA 4S1 129A 130A 402A FPV E W DN H N C /07/2015 Thu 1140 CB CS1 135A CG R I B S C /11/2012 Mon 0818 AD CS1 111A 135A 402A PTV E W O L N L /04/2013 Sat 0550 DA CN1 195A E D DN F N C /04/2013 Sat 0548 EC CN1 912 W E D DN F N C /12/2014 Mon 0644 CB CS1 410A FP R D BF F N C /05/2011 Thu 1429 DA CS1 102A 110A 403A FP E W B H N L /06/2014 Wed 1800 CB VN1 132A R D DN F L /03/2013 Mon 1720 DA CS1 111A 135A 801 EFZ M W O F N L /02/2010 Wed 1546 DA CS1 130A F E W O L N L /06/2011 Sat 1240 DA 4S1 131A 134A FP M W O F N C /08/2012 Tue 1046 DB VS1 110A 134A C M D B F N C /12/2012 Wed 1804 BB VS14 111A 123A C M W O F N L /03/2012 Sun 1120 DA CE1 111A 135A 801 F E W O L N L /10/2013 Thu 1642 BFCS1CC 110A 116A M W O H N C /01/2012 Sun 1633 DA CS1 111A 131A 330A C M D B F N N /04/2011 Fri 1528 DA 4S1 111A 135A 801 EF M W O F N L /04/2010 Fri 1732 DA CS1 111A 337A F M W DN F N L /07/2012 Sun 2105 DA CS1 110A 131A FV M W DN L N L /02/2014 Wed 0654 BE TN1VV 129A 130A 106B 181C R W ON L L /12/2012 Wed 0752 DA TS1 135A 806 C M W O L N L 100
105 Coded Crash report, run on , Page 3 First Street D Second street Crash Date Day Time Factors and Roles O C W L W J C M S Total P C I or landmark Number B U E I E U O A P Inj E Y R Distance M D A is for vehicle 1 V R B is for veh 2 etc M VN VVV DD/MM/YYYY DDD HHMM T J E C T R V E T N E S G H T T H E R N C T N T R L R K S D L M T F S M A E I T R N D a g e C a g e 58/0/ N MOUNT CECIL ROAD 58/0/ E HARRIS ROAD 58/0/ N MOUNT CECIL ROAD 58/0/ N MOUNT CECIL ROAD 58/0/ N MOUNT CECIL ROAD 58/0/ N MOUNT CECIL ROAD 58/0/ W MOUNT CECIL ROAD 58/0/ W MOUNT CECIL ROAD 58/0/3.813 HAYWARDS HILL ROAD 860N MOUNT CECIL ROAD 58/0/ S HARRIS ROAD 58/0/ W MOUNT CECIL ROAD 58/0/3.953 HAYWARDS HILL 1000W MOUNT CECIL ROAD 58/0/3.953 HAYWARDS HILL ROAD 1000N MOUNT CECIL ROAD 58/0/ S MOONSHINE ROAD 58/0/ N MOUNT CECIL ROAD 58/0/ S MOONSHINE ROAD 58/0/4.188 HAYWARDS HILL ROAD 560S HARRIS ROAD 58/0/4.268 HAYWARDS HILL 480E HARRIS ROAD 58/0/4.348 HAYWARDS HILL ROAD 400S HARRIS ROAD 58/0/ N MOUNT CECIL ROAD 58/0/4.548 HAYWARDS HILL 200E HARRIS ROAD 58/0/4.723 HAYWARDS HILL ROAD 25S HARRIS ROAD 58/0/ W HARRIS ROAD 58/0/ N HARRIS ROAD 58/0/ E MOONSHINE ROAD 58/0/5.623 PAREMATA-HAYWARDS 670E MOONSHINE ROAD 58/0/ E MOONSHINE ROAD 58/0/5.853 HAYWARDS HILL ROAD 440E MOONSHINE ROAD 58/0/ E MOONSHINE ROAD 58/0/ E MOONSHINE ROAD 58/0/ E MOONSHINE ROAD 58/0/ E MOONSHINE ROAD 58/0/ E MOONSHINE ROAD 58/0/6.293 I MOONSHINE ROAD 58/0/6.293 I MOONSHINE ROAD 58/0/6.303 HAYWARDS HILL ROAD 10W MOONSHINE ROAD 58/0/ W MOONSHINE ROAD /01/2014 Sun 0843 DA CS1 110A 131A E E W O F N C /11/2014 Thu 1600 BE CE1C 110A 135A 802 R I O H N C /07/2010 Wed 1305 FD CN1C 331A 378A 831 E D O F N C /04/2011 Sat 1415 BFCS1CVC 111A 131A 407A E W O H N L /05/2012 Wed 1448 DA VS1 131A 403A 800 FZ E W O F N C /03/2015 Mon 0943 CB TN1 116A 129A 817 G R D B F N C /04/2011 Sat 1216 BF VS1CC 132A 135A 801 C M W O H N L /09/2013 Wed 1411 DA MS1 110A 131A 901 M W O H N C /06/2013 Thu 1400 DB CN1 111A 134A 197A 402A 912 F M D O L N C /06/2014 Sat 0145 DB CS1 103A 410A F E D DN F N C /02/2012 Tue 1945 DA 4N1 111A 131A C M W O L N C /12/2011 Sat 2040 BF CE1C 111A 131A 414A 132B C M W TN F N L /12/2012 Sun 1137 DB CE1 103A 131A 358A EFP E D B F N L /02/2010 Thu 2330 CB MN1 501A R D DN F N L /12/2013 Tue 1340 DA CS1 111A 131A F E W ON L N L /12/2010 Thu 1445 BC CN1C 121A FC E D B F N C /08/2012 Tue 1734 DA CS1C 111A 135A 801 C M W TF F N L /05/2012 Mon 0009 CC CN1CC 103A 125A R D DN F N C /09/2012 Sat 0735 DA CS1 111A 131A CF E W O L N L /12/2010 Fri 0850 DA 4S1 111A 131A 801 F E W O H N C /05/2012 Wed 1515 CB CE1 130A 501A FP R D B F N L /10/2012 Fri 1400 AC VN1T 159A 357A 132B 357B R D B F N N /03/2011 Wed 0700 CB CE1 137A 402A FP R W O L N L /11/2014 Mon 0800 DB CS1 131A 135A 806 PS E W O F N L /04/2012 Sun QG TS1 131A 330A 687A E D B F N C /09/2011 Thu 1610 MC CE1C 197A 330B 372B M D O F N C /05/2015 Thu 1930 FD CE1V 181A 330A R D B F N C /02/2013 Mon 1801 BB VE1C 110A 123A 402A M W O F N L /06/2010 Wed 0700 DA CE1 111A 135A 358A 801 F E W O L N L /03/2012 Mon 1625 DA CE1 111A 135A 402A 801 FT E W O L N L /07/2015 Tue 0525 EC CW1 137A 191A 802 DV E I DN F C /07/2011 Sun 1630 DB CN1 135A 801 C E W O H N L /02/2011 Tue 0752 FA 4E1S 129A 330A E D B F N C /12/2011 Sat 0450 DBCW1 103A 111A 131A F E W DO L T G P /09/2010 Sat 1558 DBCW14 137A 302B 382B F M D O F T G P /09/2012 Sat 1254 BFCE1V 130A 504A 505A E D B F T G C /09/2013 Wed 1335 DA CE1 350A 402A F E W O F N C 070
106 Coded Crash report, run on , Page 4 First Street D Second street Crash Date Day Time Factors and Roles O C W L W J C M S Total P C I or landmark Number B U E I E U O A P Inj E Y R Distance M D A is for vehicle 1 V R B is for veh 2 etc M VN VVV DD/MM/YYYY DDD HHMM T J E C T R V E T N E S G H T T H E R N C T N T R L R K S D L M T F S M A E I T R N D a g e C a g e 58/0/ W MOONSHINE ROAD 58/0/ E MULHERN ROAD 58/0/6.915 HAYWARDS HILL ROAD 370E MULHERN ROAD 58/0/ E MULHERN ROAD 58/0/6.946 HAYWARDS HILL ROAD A JUDGEFORD GOLF CLUB 58/0/ W MOONSHINE ROAD 58/0/ E MULHERN ROAD 58/0/ W MOONSHINE ROAD 58/0/ E MULHERN ROAD 58/0/7.116 PAREMATA-HAYWARDS 170E MULHERN ROAD 58/0/ W MULHERN ROAD 58/0/ W MULHERN ROAD 58/0/ E FLIGHTYS ROAD 58/0/ E FLIGHTYS ROAD 58/0/ E PAEKAKARIKI HILL ROAD 58/0/ E FLIGHTYS ROAD 58/0/8.023 I FLIGHTYS ROAD 58/0/8.023 I FLIGHTYS ROAD 58/0/8.023 I MURPHYS ROAD 58/0/8.023 I MURPHYS ROAD 58/0/8.023 HAYWARDS HILL I MURPHYS ROAD 58/0/8.384 I BELMONT ROAD 58/0/ W BELMONT ROAD 58/0/ S BRADEY ROAD 58/0/ W BELMONT ROAD 58/0/ S PAUATAHANUI NO7 BR 58/0/9.131 HAYWARDS HILL ROAD 200S BRADEY ROAD 58/0/9.331 HAYWARDS HILL I BRADEY ROAD /10/2013 Sat 1211 AA CW1C 372A E D BF F N L /03/2014 Wed 2230 DA CW1 111A 131A E S D DN F L /08/2012 Thu 1540 JACW14 102B 308B 930 R D B F D N C /11/2010 Mon 1747 JACW14 308B 378B R D B F D N C /06/2013 Fri 0720 GDVE1C 181A 930 R W O F D N C /01/2011 Wed 1735 GDCE14 331A 402A 632A 927 R D B F D N C /11/2010 Tue 0745 BA CW14 129A 150A R D O F N N /10/2012 Thu 0715 QG TW1C 680A R D O F N C /10/2013 Sat 0930 AO VE1S 129A 352A R D B F N C /05/2011 Sun 1424 AD MW1 104A 133A R D B F N L /10/2015 Wed 1745 MC CE1C 330B 372B R W O L C /10/2010 Wed 1750 MD TE1V 181A 331A 927 R D B F N C /07/2015 Thu 1817 AB CW1CV 101A 152A 402A 197B GV R D DN F N C /01/2010 Thu 0730 FD CE1C 331A 358A 363A 191B 902 V R D B F N C /02/2011 Wed 1430 DB VE1 412A TZ E D O F N C /08/2014 Thu 1420 MA4W1C 373B R D O F X S C /05/2011 Wed 0832 GDCE1V 331A 370A R W O L X S C /10/2014 Thu 1740 JACE1C 301B 375B R W O L X S C /01/2012 Sun 1530 GDCE1C 197A 331A 352A R D B F X S C /12/2010 Sat 1134 DA VE1 501A FP R D B F X S C /03/2012 Mon 0958 GECE1T 160A 197A 353A F R D B F X S C /09/2014 Fri 1652 GCCE1C 372B 381B R D TN F T G C /01/2012 Tue 1610 CA MW1 130A 198A R D B F N C /04/2011 Fri 0700 GCCE1C 174B 372B 920 M W O F D N C /09/2010 Mon 1721 JACW1C 308B 375B 927 E D B F D N C /10/2015 Thu 1559 CA CN1 130A 427A CGP R D B F C /06/2012 Thu 1033 CB VN1 406A 687A V R W O L N C /05/2011 Sun 1827 ECCN1 912 W R W DF F T G C 100
107 Plain English report, run on 25-Feb-2016 Page 1 First Street D Second street I or landmark Distance R Crash Number Date DD/MM/YYYY Day Time DDD HHMM Description of Events Crash Factors (ENV = Environmental factors) Road Natural Light Weather Junction Cntrl Tot Inj F S M A E I T R N 58/0/0.1 40N HEBDEN CRESCENT 58/0/ W SH 2 58/0/ N HEBDEN CRESCENT 58/0/ W SH 2 58/0/0.359 I MCDOUGALL GROVE 58/0/0.359 I MCDOUGALL GROVE 58/0/0.359 I MCDOUGALL GROVE 58/0/0.359 I MCDOUGALL GROVE 58/0/0.629 HAYWARDS HILL ROAD 270N MCDOUGALL GROVE 58/0/ N MCDOUGALL GROVE 58/0/ N MCDOUGALL GROVE 58/0/ N SH 2 58/0/ S HUGH DUNCAN ST 58/0/0.7 HAYWARDS HILL ROAD 700N WESTERN HUTT ROAD 58/0/ S HUGH DUNCAN ST 58/0/ S HUGH DUNCAN ST 58/0/ S HUGH DUNCAN ST 58/0/0.746 HAYWARDS HILL ROAD 190S HUGH DUNCAN ST /04/2011 Tue 1659 SUV1 NBD on SH 58 lost control SUV1 too fast entering corner, lost Wet Overcast turning left, SUV1 hit Cliff Bank control when turning, new driver showed inexperience ENV: road slippery (rain) /10/2010 Mon 1145 SUV1 NBD on SH 58 lost control SUV1 lost control due to road Wet Overcast turning right, SUV1 hit Cliff Bank conditions ENV: road slippery on right hand bend (rain), heavy rain /01/2011 Sun 1345 CAR1 WBD on SH 58 lost control CAR1 lost control due to road Wet Overcast turning right, CAR1 hit Cliff Bank conditions ENV: road slippery on right hand bend (oil/diesel/fuel) /06/2010 Tue 1646 VAN1 WBD on SH 58 lost control VAN1 lost control under heavy Wet Overcast Light Unknown Nil 1 turning right, VAN1 hit Cliff Bank acceleration Rain on right hand bend /04/2010 Mon 1240 CAR1 NBD on SH 58 hit rear of CAR2 CAR1 failed to notice car slowing Dry Overcast Fine T Type turning right from centre line Junction /01/2015 Fri 0659 CAR1 NBD on SH 58 hit rear of CAR2 CAR1 following too closely, failed Dry Bright Fine T Type turning right from centre line to notice car slowing Junction /12/2011 Sun 1920 CAR1 NBD on SH 58 sideswiped by CAR1 overtaking on left CAR2 Dry Bright Fine T Type CAR2 turning left turned left from near centre line, didnt see/look behind when changing lanes, position or direction, new driver showed inexperience Junction /11/2010 Fri 1341 CAR1 NBD on SH 58 hit CAR2 U- CAR2 didnt see/look behind when Dry Bright Fine T Type turning from same direction of changing lanes, position or Junction travel direction /07/2013 Sun 1054 SUV1 SBD on SH 58 HAYWARDS HILL SUV1 too fast entering corner, lost Dry Overcast Fine Unknown Nil 1 ROAD hit rear end of CAR2 control when turning stopped/moving slowly /04/2011 Mon 1928 CAR1 SBD on SH 58 lost control CAR1 alcohol suspected, too fast Wet Dark Fine Unknown Nil turning right, CAR1 went Over Bank, entering corner, lost control when Tree on right hand bend turning /06/2010 Fri 2118 CAR1 SBD on SH 58 lost control CAR1 too fast entering corner, worn Wet Dark Mist Unknown Nil 1 turning right, CAR1 hit Cliff Bank tread on tyre ENV: road slippery on right hand bend (rain) /10/2014 Mon 2100 CAR1 SBD on SH 58 lost control CAR1 too fast for conditions, lost Wet Dark Heavy Unknown Nil 1 turning right, CAR1 hit Tree on control when turning Rain right hand bend /11/2011 Fri 1046 CAR1 NBD on SH 58 lost control CAR1 alcohol test below limit, lost Wet Overcast Fine Unknown Nil turning left, CAR1 hit Cliff Bank, Over Bank, Tree control due to road conditions, new driver showed inexperience ENV: road slippery (rain) /09/2012 Thu 2300 CAR1 NBD on SH 58 HAYWARDS HILL CAR1 too fast entering corner, Dry Dark Fine Unknown Nil ROAD lost control turning left, stolen vehicle CAR1 hit Cliff Bank /11/2011 Sat 0720 SUV1 NBD on SH 58 swinging wide hit SUV1 too fast entering corner, Wet Overcast Light Unknown Nil 1 CAR2 head on suddenly swerved to avoid vehicle, didnt see/look when visibility limited by roadside features Rain /02/2014 Sun 0920 CAR1 SBD on SH 58 lost control CAR1 lost control when turning, Wet Overcast turning right, CAR1 hit Cliff Bank inexperience on right hand bend /10/2012 Sun 1019 MOTOR CYCLE1 NBD on SH 58 hit rear MOTOR CYCLE1 lost control, Dry Bright Fine Unknown Nil 1 end of CAR2 stopped/moving slowly following too closely CAR2 travelling unreasonably slowly /05/2013 Mon 1831 CAR1 SBD on SH 58 HAYWARDS HILL CAR1 lost control, fatigue (drowsy, Dry Dark Fine Unknown Nil ROAD lost control turning right on tired, fell asleep) right hand bend Light Rain Heavy Rain Light Rain Light Rain Unknown Unknown Unknown Unknown Nil Nil Nil Give Way Sign Give Way Sign Give Way Sign Give Way Sign Nil
108 Plain English report, run on 25-Feb-2016 Page 2 First Street D Second street I or landmark Distance R Crash Number Date DD/MM/YYYY Day Time DDD HHMM Description of Events Crash Factors (ENV = Environmental factors) Road Natural Light Weather Junction Cntrl Tot Inj F S M A E I T R N 58/0/0.816 HAYWARDS HILL ROAD 120S HUGH DUNCAN ST 58/0/1 1000N WESTERN HUTT ROAD 58/0/ N HUGH DUNCAN ST 58/0/ N WESTERN HUTT ROAD 58/0/ N HUGH DUNCAN ST 58/0/ N HUGH DUNCAN ST 58/0/1.393 HAYWARDS HILL ROAD 100N ATIAMURI CRESCENT 58/0/1.396 I OLD HAYWARDS ROAD 58/0/ N HUGH DUNCAN ST 58/0/ N OLD HAYWARDS ROAD 58/0/ N OLD HAYWARDS ROAD 58/0/1.636 HAYWARDS HILL ROAD 700N HUGH DUNCAN ST 58/0/ N OLD HAYWARDS ROAD 58/0/ N OLD HAYWARDS ROAD 58/0/ N HUGH DUNCAN ST 58/0/ N HUGH DUNCAN ST 58/0/ N HUGH DUNCAN ST 58/0/ S MOUNT CECIL ROAD 58/0/ W SH 2 58/0/ N OLD HAYWARDS ROAD /06/2013 Mon 0645 CAR1 SBD on SH 58 HAYWARDS HILL CAR1 too fast entering corner, lost Wet Dark Fine Unknown Nil ROAD lost control turning right, CAR1 hit Post Or Pole, Tree on right hand bend control due to road conditions ENV: road slippery (rain) /05/2015 Fri 0707 VAN1 NBD on SH 58 lost control VAN1 too fast entering corner, lost Wet Overcast turning right, VAN1 hit Guard Rail control when turning on right hand bend /05/2010 Sat 1724 CAR1 NBD on SH 58 lost control; CAR1 too fast for conditions Wet Dark Light went off road to right, CAR1 hit Rain Guard Rail /05/2015 Wed 1930 CAR1 NBD on SH 58 lost control CAR1 too fast entering corner, lost Wet Dark turning right, CAR1 hit Debris, control Guard Rail on right hand bend /01/2010 Sat 1215 VAN1 NBD on SH 58 lost control VAN1 too fast entering corner, lost Wet Overcast Light Unknown Nil 1 turning left, VAN1 hit Guard Rail control due to road conditions Rain ENV: road slippery (rain) /05/2010 Mon 1625 MOTOR CYCLE1 NBD on SH 58 lost MOTOR CYCLE1 lost control due to Wet Twilight control but did not leave the road road conditions ENV: road slippery (oil/diesel/fuel) /09/2012 Sat 1720 VAN1 SBD on SH 58 HAYWARDS HILL VAN1 lost control due to vehicle Dry Overcast Fine Unknown Nil ROAD lost control turning right, fault, suspension failure VAN1 hit Fence on right hand bend /02/2015 Tue 0435 VAN1 SBD on SH 58 lost control VAN1 alcohol suspected, fatigue Dry Dark Fine T Type turning left, VAN1 hit Guard Rail (drowsy, tired, fell asleep) Junction /04/2010 Fri 1624 VAN1 NBD on SH 58 lost control VAN1 too fast entering corner, lost Wet Overcast turning right, VAN1 hit Cliff Bank control due to road conditions on right hand bend ENV: road slippery (rain) /05/2015 Fri 1315 SUV1 NBD on SH 58 lost control SUV1 too far left/right, inattentive Dry Bright Fine Unknown Nil 1 turning left, SUV1 hit Cliff Bank /04/2011 Fri 1920 CAR1 NBD on SH 58 lost control CAR1 lost control when turning Wet Dark turning left, CAR1 hit Guard Rail ENV: road slippery (loose material on seal) /05/2013 Sat 1640 CAR1 WBD on SH 58 HAYWARDS HILL CAR1 lost control due to road Wet Overcast Fine Unknown Nil ROAD lost control turning right, CAR1 hit Cliff Bank on right hand bend conditions, new driver showed inexperience, driving unfamiliar vehicle ENV: road slippery (rain) /03/2015 Sat 1447 CAR1 NBD on SH 58 lost control CAR1 lost control, overtaking line Wet Overcast while overtaking, CAR1 hit Cliff of traffic or queue ENV: heavy Bank rain, strong wind /02/2012 Sat 1018 CYCLIST1 (Age 53) SBD on SH 58 lost CYCLIST1 inattentive, obstruction Dry Bright Fine Unknown Nil 1 control but did not leave the road, on roadway CYCLIST1 hit Other /08/2010 Tue 1736 load or trailer from TRUCK1 SBD on TRUCK1 load not well secured or Dry Twilight Fine Unknown Nil SH 58 hit CAR2 CAR2 hit Debris moved /01/2012 Sun 1512 CAR1 SBD on SH 58 lost control CAR1 lost control when turning, Wet Overcast turning left, CAR1 hit Guard Rail attention diverted ENV: slippery /04/2015 Thu 0715 CAR1 NBD on SH 58 lost control CAR1 too fast entering corner, lost Wet Overcast Fine Unknown Nil turning right, CAR1 hit Cliff Bank control when turning on right hand bend /07/2015 Tue 0650 CAR1 NBD on SH 58 lost control CAR1 lost control due to road Ice/ Dark while overtaking, CAR1 hit Guard conditions ENV: road slippery Snow Rail (frost or ice) Light Rain Light Rain Light Rain Heavy Rain Light Rain Heavy Rain Light Rain Unknown Unknown Unknown Unknown Unknown Unknown Unknown Unknown N/A Nil Nil Nil Nil Nil Nil N/A Nil Fine Unknown N/A /06/2012 Sat 1059 CAR1 SBD on SH 58 lost control CAR1 lost control while returning Dry Bright Fine Unknown Nil turning right on right hand bend to seal from unsealed shoulder /07/2014 Tue 0604 CAR1 NBD on SH 58 lost control CAR1 too fast for conditions, lost Wet Dark turning right, CAR1 hit Guard Rail control when turning ENV: road on right hand bend slippery (rain) Light Rain Unknown N/A
109 Plain English report, run on 25-Feb-2016 Page 3 First Street D Second street I or landmark Distance R Crash Number Date DD/MM/YYYY Day Time DDD HHMM Description of Events Crash Factors (ENV = Environmental factors) Road Natural Light Weather Junction Cntrl Tot Inj F S M A E I T R N 58/0/ N SH 2 58/0/ N HUGH DUNCAN ST 58/0/ W SH 2 58/0/2 HAYWARDS HILL 2000N WESTERN HUTT ROAD 58/0/2.053 HAYWARDS HILL ROAD 900S MOUNT CECIL ROAD 58/0/ N HUGH DUNCAN ST 58/0/ S MOUNT CECIL ROAD 58/0/ S MOUNT CECIL ROAD 58/0/2.216 HAYWARDS HILL 820N OLD HAYWARDS ROAD 58/0/ N OLD HAYWARDS ROAD 58/0/2.313 HAYWARDS HILL ROAD 58/0/2.436 HAYWARDS HILL ROAD 58/0/2.553 HAYWARDS HILL ROAD 640S MOUNT CECIL ROAD 1500N HUGH DUNCAN ST 400S MOUNT CECIL ROAD 58/0/ S MOUNT CECIL ROAD 58/0/ S MOUNT CECIL ROAD 58/0/ S MOUNT CECIL ROAD 58/0/ S MOUNT CECIL ROAD 58/0/2.853 HAYWARDS HILL ROAD 100S MOUNT CECIL ROAD /06/2010 Mon 0628 CAR1 NBD on SH 58 lost control CAR1 too fast entering corner, lost Ice/ Dark Fine Unknown Nil 1 turning right, CAR1 hit Cliff Bank on right hand bend control due to road conditions ENV: road slippery (frost or ice) Snow /08/2011 Wed 1720 CAR1 SBD on SH 58 changing lanes to CAR1 cut in after overtaking, Dry Overcast Fine Unknown N/A left hit CAR2 inattentive /03/2010 Wed 1231 VAN1 WBD on SH 58 lost control VAN1 lost control due to vehicle Wet Overcast Heavy Unknown Nil 1 2 while overtaking, CAR2 hit Cliff Bank fault, attention diverted by cell phone, worn tread on tyre ENV: road slippery (rain) Rain /06/2012 Tue 1535 CAR1 SBD on SH 58 HAYWARDS HILL CAR1 too fast entering corner, Wet Overcast Fine Unknown Nil lost control turning right, CAR1 failed to notice bend in road ENV: hit Guard Rail on right hand bend road slippery (rain) /10/2012 Fri 1415 CAR1 SBD on SH 58 HAYWARDS HILL CAR1 lost control while returning Dry Overcast Fine Unknown Nil ROAD lost control turning right, CAR1 hit Guard Rail, Tree on right hand bend to seal from unsealed shoulder, lost control end of seal /07/2010 Wed 0716 VAN1 WBD on SH 58 lost control VAN1 lost control due to road Ice/ Overcast turning right, VAN1 hit Guard Rail conditions ENV: road slippery Snow on right hand bend (frost or ice) Fine Unknown Nil /07/2011 Fri 0755 CAR1 NBD on SH 58 lost control CAR1 lost control when turning Dry Bright Fine Unknown Nil turning left, CAR1 hit Cliff Bank, Guard Rail /07/2011 Tue 1535 CAR1 SBD on SH 58 lost control CAR1 alcohol test above limit or Dry Overcast Fine Unknown Nil turning right, CAR1 hit Guard Rail on right hand bend test refused, lost control while returning to seal from unsealed shoulder /06/2010 Thu 1145 CAR1 SBD on SH 58 HAYWARDS HILL CAR1 lost control due to road Wet Overcast Fine Unknown Nil lost control turning right, CAR1 conditions ENV: road slippery hit Tree on right hand bend (oil/diesel/fuel) /02/2010 Fri 1530 CAR1 NBD on SH 58 lost control CAR1 lost control when turning Wet Overcast Heavy while overtaking, CAR1 hit Fence Rain /05/2013 Wed 0134 MOTOR CYCLE1 NBD on SH 58 HAYWARDS MOTOR CYCLE1 drugs suspected, too Wet Dark Light Unknown Nil 1 HILL ROAD lost control turning right on right hand bend fast for conditions, lost control when turning, new driver showed inexperience Rain /07/2013 Wed 2235 CAR1 SBD on SH 58 HAYWARDS HILL CAR1 lost control when turning, new Dry Dark Fine Unknown Nil ROAD lost control turning right on driver showed inexperience right hand bend /12/2012 Thu 1847 CAR1 SBD on SH 58 HAYWARDS HILL CAR1 too far left/right, lost Wet Overcast Fine Unknown Nil ROAD lost control turning right, control when turning CAR1 hit Tree on right hand bend /05/2012 Mon 0907 CAR1 SBD on SH 58 hit rear end of CAR1 too fast entering corner, Wet Overcast Heavy Unknown Nil 1 CAR2 stopped/moving slowly following too closely, new driver showed inexperience CAR2 suddenly braked ENV: heavy rain Rain /07/2014 Sat 1545 CAR1 NBD on SH 58 lost control on CAR1 lost control when turning, Dry Overcast Fine Unknown Nil curve and hit CAR2 head on fatigue due to working long hours before driving /01/2010 Sun 2129 SUV1 SBD on SH 58 lost control SUV1 too far left/right, lost Wet Dark turning right, SUV1 hit Fence, Post control, new driver showed Or Pole, Ditch on right hand bend inexperience /07/2015 Thu 1140 CAR1 SBD on SH 58 lost control; CAR1 lost control due to road Ice/ Bright went off road to left, CAR1 hit Cliff Bank, Guard Rail conditions ENV: road slippery (frost or ice), road slippery (snow or hail) Snow Heavy Rain Unknown Unknown Nil Nil Snow Unknown N/A /11/2012 Mon 0818 CAR1 SBD on SH 58 HAYWARDS HILL CAR1 too fast entering corner, lost Wet Overcast Light Unknown Nil 1 ROAD lost control while overtaking, control due to road conditions, new Rain CAR1 hit Post Or Pole, Tree, Ditch driver showed inexperience
110 Plain English report, run on 25-Feb-2016 Page 4 First Street D Second street I or landmark Distance R Crash Number Date DD/MM/YYYY Day Time DDD HHMM Description of Events Crash Factors (ENV = Environmental factors) Road Natural Light Weather Junction Cntrl Tot Inj F S M A E I T R N 58/0/3.153 HAYWARDS HILL ROAD 58/0/3.153 HAYWARDS HILL ROAD 200N MOUNT CECIL ROAD 200N MOUNT CECIL ROAD 58/0/ N MOUNT CECIL ROAD 58/0/ S HARRIS ROAD 58/0/ N MOUNT CECIL ROAD 58/0/3.533 HAYWARDS HILL ROAD 580N MOUNT CECIL ROAD 58/0/ W MOUNT CECIL ROAD 58/0/3.553 HAYWARDS HILL 58/0/3.553 HAYWARDS HILL ROAD 58/0/3.553 HAYWARDS HILL ROAD 600N MOUNT CECIL ROAD 600N MOUNT CECIL ROAD 600N MOUNT CECIL ROAD 58/0/ E MOONSHINE ROAD 58/0/ N MOUNT CECIL ROAD 58/0/ N MOUNT CECIL ROAD 58/0/ N MOUNT CECIL ROAD 58/0/ N MOUNT CECIL ROAD 58/0/3.653 HAYWARDS HILL ROAD 700N MOUNT CECIL ROAD 58/0/ N MOUNT CECIL ROAD 58/0/3.728 HAYWARDS HILL 1020E HARRIS ROAD /04/2013 Sat 0550 CAR1 NBD on SH 58 HAYWARDS HILL CAR1 suddenly swerved to avoid Dry Dark Fine Unknown Nil 1 ROAD lost control turning right on animal right hand bend /04/2013 Sat 0548 CAR1 NBD on SH 58 HAYWARDS HILL ENV: farm animal straying Dry Dark Fine Unknown Nil ROAD hit obstruction, CAR1 hit Stray Animal /12/2014 Mon 0644 CAR1 SBD on SH 58 lost control; CAR1 fatigue (drowsy, tired, fell Dry Bright Fine Unknown Nil went off road to left, CAR1 hit asleep) Fence, Post Or Pole /05/2011 Thu 1429 CAR1 SBD on SH 58 lost control CAR1 alcohol test below limit, too Wet Bright Heavy Unknown Nil 1 turning right, CAR1 hit Fence, Post fast for conditions, driving Rain Or Pole on right hand bend unfamiliar vehicle /06/2014 Wed 1800 VAN1 NBD on SH 58 lost control; VAN1 lost control under heavy Dry Dark Fine Unknown N/A went off road to left braking /03/2013 Mon 1720 CAR1 SBD on SH 58 HAYWARDS HILL CAR1 too fast entering corner, lost Wet Overcast Fine Unknown Nil 1 ROAD lost control turning right, CAR1 went Over Bank, Fence, Water/River on right hand bend control due to road conditions ENV: road slippery (rain) /02/2010 Wed 1546 CAR1 SBD on SH 58 lost control CAR1 lost control Wet Overcast Light Unknown Nil 1 turning right, CAR1 hit Fence on Rain right hand bend /06/2011 Sat 1240 SUV1 SBD on SH 58 HAYWARDS HILL SUV1 lost control when turning, Wet Overcast Fine Unknown Nil lost control turning right, SUV1 hit Fence, Post Or Pole on right hand bend lost control while returning to seal from unsealed shoulder /08/2012 Tue 1046 VAN1 SBD on SH 58 HAYWARDS HILL VAN1 too fast for conditions, lost Dry Bright Fine Unknown Nil 1 ROAD lost control turning left, control while returning to seal VAN1 hit Cliff Bank from unsealed shoulder /12/2012 Wed 1804 VAN1 SBD on SH 58 HAYWARDS HILL VAN1 too fast entering corner, Wet Overcast Fine Unknown Nil ROAD cutting corner hit SUV2 head cutting corner on bend on, VAN1 hit Cliff Bank /03/2012 Sun 1120 CAR1 EBD on SH 58 lost control CAR1 too fast entering corner, lost Wet Overcast turning right, CAR1 hit Fence on control due to road conditions right hand bend ENV: road slippery (rain) /10/2013 Thu 1642 CAR1 SBD on SH 58 lost control on CAR1 too fast for conditions, too Wet Overcast Heavy Unknown Nil 1 1 curve and hit CAR2 head on fast at temporary speed limit Rain /04/2010 Fri 1732 CAR1 SBD on SH 58 lost control CAR1 too fast entering corner, Wet Dark Fine Unknown Nil turning right, CAR1 hit Fence on failed to notice warning sign right hand bend /04/2011 Fri 1528 SUV1 SBD on SH 58 lost control SUV1 too fast entering corner, lost Wet Overcast Fine Unknown Nil turning right, SUV1 went Over Bank, control due to road conditions Fence on right hand bend ENV: road slippery (rain) /01/2012 Sun 1633 CAR1 SBD on SH 58 lost control CAR1 too fast entering corner, lost Dry Bright Fine Unknown Nil turning right, CAR1 hit Cliff Bank control when turning, inattentive on right hand bend /07/2012 Sun 2105 CAR1 SBD on SH 58 HAYWARDS HILL CAR1 too fast for conditions, lost Wet Dark ROAD lost control turning right, CAR1 hit Fence, Ditch on right hand bend control when turning /02/2014 Wed 0654 TRUCK1 NBD on SH 58 lost control on TRUCK1 too far left/right, lost Wet Overcast Light Unknown N/A 1 2 straight and hit VAN2 head on control VAN2 alcohol not suspected, tested and -ve (MoT use only) VAN3 following too closely Rain /12/2012 Wed 0752 TRUCK1 SBD on SH 58 HAYWARDS HILL TRUCK1 lost control due to road Wet Overcast lost control turning right, TRUCK1 conditions ENV: road slippery hit Cliff Bank on right hand bend (oil/diesel/fuel) Light Rain Light Rain Light Rain Unknown Unknown Unknown Nil Nil Nil
111 Plain English report, run on 25-Feb-2016 Page 5 First Street D Second street I or landmark Distance R Crash Number Date DD/MM/YYYY Day Time DDD HHMM Description of Events Crash Factors (ENV = Environmental factors) Road Natural Light Weather Junction Cntrl Tot Inj F S M A E I T R N 58/0/ N MOUNT CECIL ROAD 58/0/ E HARRIS ROAD 58/0/ N MOUNT CECIL ROAD 58/0/ N MOUNT CECIL ROAD 58/0/ N MOUNT CECIL ROAD 58/0/ N MOUNT CECIL ROAD 58/0/ W MOUNT CECIL ROAD 58/0/ W MOUNT CECIL ROAD 58/0/3.813 HAYWARDS HILL ROAD 860N MOUNT CECIL ROAD 58/0/ S HARRIS ROAD 58/0/ W MOUNT CECIL ROAD 58/0/3.953 HAYWARDS HILL 58/0/3.953 HAYWARDS HILL ROAD 1000W MOUNT CECIL ROAD 1000N MOUNT CECIL ROAD 58/0/ S MOONSHINE ROAD 58/0/ N MOUNT CECIL ROAD 58/0/ S MOONSHINE ROAD /01/2014 Sun 0843 CAR1 SBD on SH 58 lost control CAR1 too fast for conditions, lost Wet Overcast Fine Unknown Nil turning right, CAR1 went Over Bank control when turning on right hand bend /11/2014 Thu 1600 CAR1 EBD on SH 58 lost control on CAR1 too fast for conditions, lost Ice/ Overcast Heavy Unknown Nil 2 straight and hit CAR2 head on control due to road conditions Snow Rain ENV: road slippery (frost or ice) /03/2015 Mon 0943 TRUCK1 NBD on SH 58 lost control; TRUCK1 too fast at temporary speed Dry Bright Fine Unknown Nil went off road to left, TRUCK1 hit Guard Rail limit, too far left/right ENV: road surface under construction or maintenance /05/2012 Wed 1448 VAN1 SBD on SH 58 lost control VAN1 lost control when turning, Wet Overcast Fine Unknown Nil 1 turning right, VAN1 hit Fence, driving unfamiliar vehicle ENV: Water/River on right hand bend slippery /07/2010 Wed 1305 CAR1 NBD on SH 58 hit rear end of CAR1 failed to notice car slowing, Dry Overcast Fine Unknown Nil CAR2 stop/slow for queue didnt see/look when visibility limited by roadside features ENV: visibility limited by curve /04/2011 Sat 1415 CAR1 SBD on SH 58 lost control on CAR1 too fast entering corner, lost Wet Overcast Heavy Unknown Nil 1 curve and hit CAR2 head on control when turning, driver overreacted ENV: road slippery (surface bleeding / defective), heavy rain Rain /04/2011 Sat 1216 VAN1 SBD on SH 58 lost control on VAN1 lost control under heavy Wet Overcast curve and hit CAR2 head on, CAR3 hit Cliff Bank braking, lost control due to road conditions ENV: road slippery (rain) /09/2013 Wed 1411 MOTOR CYCLE1 SBD on SH 58 lost MOTOR CYCLE1 too fast for Wet Overcast control turning right on right hand conditions, lost control when bend turning ENV: heavy rain /06/2013 Thu 1400 CAR1 NBD on SH 58 HAYWARDS HILL CAR1 too fast entering corner, lost Dry Overcast ROAD lost control turning left, CAR1 hit Fence control while returning to seal from unsealed shoulder, suddenly swerved to avoid vehicle, new driver showed inexperience ENV: farm animal straying /06/2014 Sat 0145 CAR1 SBD on SH 58 lost control CAR1 alcohol test above limit or Dry Dark Fine Unknown Nil turning left, CAR1 hit Fence test refused, fatigue (drowsy, tired, fell asleep) /02/2012 Tue 1945 SUV1 NBD on SH 58 lost control SUV1 too fast entering corner, lost Wet Overcast Light Unknown Nil 1 turning right, SUV1 hit Cliff Bank control when turning Rain on right hand bend /12/2011 Sat 2040 CAR1 EBD on SH 58 HAYWARDS HILL CAR1 too fast entering corner, lost Wet Twilight Fine Unknown Nil lost control on curve and hit CAR2 head on, CAR1 hit Cliff Bank control when turning, fatigue due to working long hours before driving CAR2 lost control under heavy braking /12/2012 Sun 1137 CAR1 EBD on SH 58 HAYWARDS HILL CAR1 alcohol test above limit or Dry Bright Fine Unknown Nil ROAD lost control turning left, test refused, lost control when CAR1 went Over Bank, Fence, Post Or turning, attention diverted by Pole cigarette etc /02/2010 Thu 2330 MOTOR CYCLE1 NBD on SH 58 lost MOTOR CYCLE1 illness with no Dry Dark Fine Unknown Nil 1 control; went off road to left warning (eg heart attack) /12/2013 Tue 1340 CAR1 SBD on SH 58 lost control CAR1 too fast entering corner, lost Wet Overcast Light Unknown Nil 1 turning right, CAR1 hit Fence on control when turning Rain right hand bend /12/2010 Thu 1445 CAR1 NBD on SH 58 swinging wide hit CAR1 swung wide on bend Dry Bright Fine Unknown Nil 1 CAR2 head on, CAR1 hit Fence, CAR2 hit Cliff Bank Heavy Rain Heavy Rain Light Rain Unknown Unknown Unknown Nil Nil Nil
112 Plain English report, run on 25-Feb-2016 Page 6 First Street D Second street I or landmark Distance R Crash Number Date DD/MM/YYYY Day Time DDD HHMM Description of Events Crash Factors (ENV = Environmental factors) Road Natural Light Weather Junction Cntrl Tot Inj F S M A E I T R N 58/0/4.188 HAYWARDS HILL ROAD 58/0/4.268 HAYWARDS HILL 58/0/4.348 HAYWARDS HILL ROAD 560S HARRIS ROAD 480E HARRIS ROAD 400S HARRIS ROAD 58/0/ N MOUNT CECIL ROAD 58/0/4.548 HAYWARDS HILL 58/0/4.723 HAYWARDS HILL ROAD 200E HARRIS ROAD 25S HARRIS ROAD 58/0/ W HARRIS ROAD 58/0/ N HARRIS ROAD 58/0/ E MOONSHINE ROAD 58/0/5.623 PAREMATA- HAYWARDS 670E MOONSHINE ROAD 58/0/ E MOONSHINE ROAD 58/0/5.853 HAYWARDS HILL ROAD 440E MOONSHINE ROAD 58/0/ E MOONSHINE ROAD 58/0/ E MOONSHINE ROAD 58/0/ E MOONSHINE ROAD 58/0/ E MOONSHINE ROAD 58/0/ E MOONSHINE ROAD /08/2012 Tue 1734 CAR1 SBD on SH 58 HAYWARDS HILL CAR1 too fast entering corner, lost Wet Twilight Fine Unknown Nil 1 ROAD lost control turning right, CAR1 hit Cliff Bank on right hand bend control due to road conditions ENV: road slippery (rain) /05/2012 Mon 0009 CAR1 NBD on SH 58 HAYWARDS HILL CAR1 alcohol test above limit or Dry Dark Fine Unknown Nil 1 2 lost control; went off road to right test refused, failed to keep left on straight /09/2012 Sat 0735 CAR1 SBD on SH 58 HAYWARDS HILL CAR1 too fast entering corner, lost Wet Overcast ROAD lost control turning right, CAR1 hit Cliff Bank, Fence on right hand bend control when turning /12/2010 Fri 0850 SUV1 SBD on SH 58 lost control SUV1 too fast entering corner, lost Wet Overcast turning right, SUV1 hit Fence on control when turning ENV: road right hand bend slippery (rain) /05/2012 Wed 1515 CAR1 EBD on SH 58 HAYWARDS HILL CAR1 lost control, illness with no Dry Bright Fine Unknown Nil 1 lost control; went off road to warning (eg heart attack) left, CAR1 hit Fence, Post Or Pole /10/2012 Fri 1400 VAN1 NBD on SH 58 HAYWARDS HILL VAN1 cut in after overtaking, Dry Bright Fine Unknown Nil ROAD changing lanes to left hit TRUCK2 emotionally upset/road rage TRUCK2 lost control under heavy braking, emotionally upset/road rage /03/2011 Wed 0700 CAR1 EBD on SH 58 lost control; CAR1 lost control avoiding another Wet Overcast went off road to left, CAR1 hit vehicle, new driver showed Fence, Post Or Pole inexperience /11/2014 Mon 0800 CAR1 SBD on SH 58 lost control CAR1 lost control when turning, Wet Overcast Fine Unknown Nil turning left, CAR1 hit Post Or Pole, Traffic Sign lost control due to road conditions ENV: road slippery (oil/diesel/fuel) /04/2012 Sun load or trailer from TRUCK1 SBD on TRUCK1 lost control when turning, Dry Bright Fine Unknown Nil SH 58 inattentive, load too heavy /09/2011 Thu 1610 CAR1 EBD on SH 58 PAREMATA-HAYWARDS CAR1 suddenly swerved to avoid Dry Overcast Fine Unknown Nil 2 hit CAR2 U-turning from same direction of travel vehicle CAR2 inattentive, didnt see/look behind when changing lanes, position or direction /05/2015 Thu 1930 CAR1 EBD on SH 58 hit rear end of CAR1 following too closely, Dry Bright Fine Unknown Nil VAN2 stop/slow for queue inattentive /02/2013 Mon 1801 VAN1 EBD on SH 58 HAYWARDS HILL VAN1 too fast for conditions, Wet Overcast Fine Unknown Nil ROAD cutting corner hit CAR2 head on cutting corner on bend, new driver showed inexperience /03/2012 Mon 1625 CAR1 EBD on SH 58 lost control CAR1 too fast entering corner, lost Wet Overcast Light Unknown Nil 1 turning right, CAR1 hit Fence, Tree control due to road conditions, new Rain on right hand bend driver showed inexperience ENV: road slippery (rain) /06/2010 Wed 0700 CAR1 EBD on SH 58 lost control CAR1 too fast entering corner, lost Wet Overcast turning right, CAR1 hit Fence on right hand bend control due to road conditions, attention diverted by cigarette etc ENV: road slippery (rain) /07/2015 Tue 0525 CAR1 WBD on SH 58 hit obstruction, CAR1 lost control avoiding another Ice/ Dark Fine Unknown N/A 1 CAR1 hit Debris, Ditch vehicle, suddenly braked ENV: road Snow slippery (frost or ice) /07/2011 Sun 1630 CAR1 NBD on SH 58 lost control CAR1 lost control due to road Wet Overcast turning left, CAR1 hit Cliff Bank conditions ENV: road slippery (rain) /02/2011 Tue 0752 SUV1 EBD on SH 58 hit rear end of SUV1 too far left/right, inattentive Dry Bright Fine Unknown Nil 1 CYCLIST2 (Age 37) stopped/moving slowly Light Rain Heavy Rain Light Rain Light Rain Heavy Rain Unknown Unknown Unknown Unknown Unknown Nil Nil Nil Nil Nil
113 Plain English report, run on 25-Feb-2016 Page 7 First Street D Second street I or landmark Distance R Crash Number Date DD/MM/YYYY Day Time DDD HHMM Description of Events Crash Factors (ENV = Environmental factors) Road Natural Light Weather Junction Cntrl Tot Inj F S M A E I T R N 58/0/6.293 I MOONSHINE ROAD 58/0/6.293 I MOONSHINE ROAD 58/0/6.303 HAYWARDS HILL ROAD 10W MOONSHINE ROAD 58/0/ W MOONSHINE ROAD 58/0/ W MOONSHINE ROAD 58/0/ E MULHERN ROAD 58/0/6.915 HAYWARDS HILL ROAD 370E MULHERN ROAD 58/0/ E MULHERN ROAD 58/0/6.946 HAYWARDS HILL ROAD A JUDGEFORD GOLF CLUB 58/0/ W MOONSHINE ROAD 58/0/ E MULHERN ROAD 58/0/ W MOONSHINE ROAD 58/0/ E MULHERN ROAD 58/0/7.116 PAREMATA- HAYWARDS 170E MULHERN ROAD 58/0/ W MULHERN ROAD 58/0/ W MULHERN ROAD 58/0/ E FLIGHTYS ROAD /09/2010 Sat 1558 CAR1 WBD on SH 58 lost control CAR1 lost control avoiding another Dry Overcast Fine T Type turning left, CAR1 hit Fence vehicle SUV2 failed to give way at give way sign, misjudged speed etc of vehicle coming from another dirn with right of way Junction /12/2011 Sat 0450 CAR1 WBD on SH 58 lost control CAR1 alcohol test above limit or Wet Dark turning left, CAR1 hit Fence test refused, too fast entering corner, lost control when turning Light Rain T Type Junction /09/2012 Sat 1254 CAR1 EBD on SH 58 HAYWARDS HILL CAR1 lost control, medical illness Dry Bright Fine T Type Give 1 2 ROAD lost control on curve and hit (not sudden eg flu), mental illness Junction Way VAN2 head on (eg depression) Sign /09/2013 Wed 1335 CAR1 EBD on SH 58 lost control CAR1 attention diverted, new driver Wet Overcast Fine Unknown Nil turning right, CAR1 hit Fence on showed inexperience right hand bend /10/2013 Sat 1211 CAR1 WBD on SH 58 changing CAR1 didnt see/look behind when Dry Bright Fine Unknown Nil lanes/overtaking to right hit CAR2 changing lanes, position or direction /03/2014 Wed 2230 CAR1 WBD on SH 58 lost control CAR1 too fast entering corner, lost Dry Dark Fine Unknown N/A turning right, CAR1 went Over Bank control when turning on right hand bend /08/2012 Thu 1540 CAR1 WBD on SH 58 HAYWARDS HILL SUV2 alcohol test below limit, Dry Bright Fine Driveway Nil ROAD hit SUV2 turning right onto SH failed to give way at driveway 58 HAYWARDS HILL ROAD from the left ENV: entering or leaving other noncommercial /11/2010 Mon 1747 CAR1 WBD on SH 58 hit SUV2 turning SUV2 failed to give way at Dry Bright Fine Driveway Nil 1 right onto SH 58 from the left driveway, didnt see/look when visibility limited by roadside features ENV: visibility limited, entering or leaving other commercial /06/2013 Fri 0720 VAN1 EBD on SH 58 HAYWARDS HILL VAN1 following too closely ENV: Wet Overcast Fine Driveway Nil ROAD hit rear of CAR2 turning right entering or leaving other noncommercial from centre line /01/2011 Wed 1735 CAR1 EBD on SH 58 hit rear of SUV2 CAR1 failed to notice car slowing, Dry Bright Fine Driveway Nil turning right from centre line new driver showed inexperience, worn tread on tyre ENV: entering or leaving other commercial /11/2010 Tue 0745 CAR1 WBD on SH 58 hit SUV2 headon CAR1 too far left/right, overtaking Dry Overcast Fine Unknown Nil on straight /10/2012 Thu 0715 load or trailer from TRUCK1 WBD on TRUCK1 load Dry Overcast Fine Unknown Nil SH 58 hit CAR /10/2013 Sat 0930 VAN1 EBD on SH 58 overtaking VAN1 too far left/right, attention Dry Bright Fine Unknown Nil 1 CYCLIST2 diverted by scenery or persons outside vehicle /05/2011 Sun 1424 MOTOR CYCLE1 WBD on SH 58 PAREMATA- MOTOR CYCLE1 alcohol test result Dry Bright Fine Unknown Nil 1 HAYWARDS lost control while unknown, lost control under heavy overtaking acceleration /10/2015 Wed 1745 CAR1 EBD on SH 58 hit CAR2 U- CAR2 inattentive, didnt see/look Wet Overcast Light Unknown N/A 2 turning from same direction of behind when changing lanes, Rain travel position or direction /10/2010 Wed 1750 TRUCK1 EBD on SH 58 hit VAN2 doing TRUCK1 following too closely, Dry Bright Fine Unknown Nil driveway manoeuvre failed to notice car slowing ENV: entering or leaving other commercial /07/2015 Thu 1817 CAR1 WBD on SH 58 overtaking hit CAR1 alcohol suspected, overtaking Dry Dark Fine Unknown Nil 1 2 CAR2 head on, CAR1 hit Guard Rail, CAR2 hit Ditch deliberately in the face of oncoming traffic, new driver showed inexperience CAR2 suddenly swerved to avoid vehicle Give Way Sign Give Way Sign
114 Plain English report, run on 25-Feb-2016 Page 8 First Street D Second street I or landmark Distance R Crash Number Date DD/MM/YYYY Day Time DDD HHMM Description of Events Crash Factors (ENV = Environmental factors) Road Natural Light Weather Junction Cntrl Tot Inj F S M A E I T R N 58/0/ E FLIGHTYS ROAD 58/0/ E PAEKAKARIKI HILL ROAD 58/0/ E FLIGHTYS ROAD 58/0/8.023 I FLIGHTYS ROAD 58/0/8.023 I FLIGHTYS ROAD 58/0/8.023 I MURPHYS ROAD 58/0/8.023 I MURPHYS ROAD 58/0/8.023 HAYWARDS HILL I MURPHYS ROAD 58/0/8.384 I BELMONT ROAD 58/0/ W BELMONT ROAD 58/0/ S BRADEY ROAD 58/0/ W BELMONT ROAD 58/0/ S PAUATAHANUI NO7 BR 58/0/9.131 HAYWARDS HILL ROAD 58/0/9.331 HAYWARDS HILL 200S BRADEY ROAD I BRADEY ROAD /01/2010 Thu 0730 CAR1 EBD on SH 58 hit rear end of CAR1 failed to notice car slowing, Dry Bright Fine Unknown Nil CAR2 stop/slow for queue, CAR1 hit Ditch attention diverted by cigarette etc, attention diverted by driver dazzled by sun/lights CAR2 suddenly braked ENV: dazzling sun /02/2011 Wed 1430 VAN1 EBD on SH 58 lost control VAN1 fatigue due to lack of sleep Dry Overcast Fine Unknown Nil 1 turning left, VAN1 hit Tree, Water/River /08/2014 Thu 1420 SUV1 WBD on SH 58 hit CAR2 CAR2 didnt see/look behind when Dry Overcast Fine X Type parking/unparking pulling out from parked position Junction /10/2014 Thu 1740 CAR1 EBD on SH 58 hit CAR2 turning CAR2 failed to give way at stop Wet Overcast right onto SH 58 from the left sign, didnt see/look when required to give way to traffic from another direction Light Rain X Type Junction /05/2011 Wed 0832 CAR1 EBD on SH 58 hit rear of VAN2 CAR1 failed to notice car slowing, Wet Overcast Light X Type Stop 1 turning right from centre line did not see or look for other party until too late Rain Junction Sign /01/2012 Sun 1530 CAR1 EBD on SH 58 hit rear of CAR2 CAR1 suddenly swerved to avoid Dry Bright Fine X Type turning right from centre line vehicle, failed to notice car slowing, attention diverted by scenery or persons outside vehicle Junction /12/2010 Sat 1134 VAN1 EBD on SH 58 lost control VAN1 illness with no warning (eg Dry Bright Fine X Type Stop 1 turning right, VAN1 hit Fence, Post heart attack) Or Pole on right hand bend Junction Sign /03/2012 Mon 0958 CAR1 EBD on SH 58 HAYWARDS HILL CAR1 overtaking vehicle signaling Dry Bright Fine X Type Stop 1 overtaking hit TRUCK2 turning right, CAR1 hit Fence right turn, suddenly swerved to avoid vehicle, attention diverted by other traffic Junction Sign /09/2014 Fri 1652 CAR1 EBD on SH 58 hit rear of CAR2 CAR2 didnt see/look behind when Dry Twilight Fine T Type Give 2 turning right from left side changing lanes, position or direction, misjudged speed, etc of vehicle coming from behind or alongside Junction Way Sign /01/2012 Tue 1610 MOTOR CYCLE1 WBD on SH 58 lost MOTOR CYCLE1 lost control, suddenly Dry Bright Fine Unknown Nil 1 control but did not leave the road swerved to avoid object or for unknown reason /04/2011 Fri 0700 CAR1 EBD on SH 58 hit rear of CAR2 CAR2 turned right from left side of Wet Overcast Fine Driveway Nil turning right from left side road, didnt see/look behind when changing lanes, position or direction ENV: entering or leaving land use /09/2010 Mon 1721 CAR1 WBD on SH 58 hit CAR2 turning CAR2 failed to give way at Dry Bright Fine Driveway Nil 2 right onto SH 58 from the left driveway, didnt see/look when required to give way to traffic from another direction ENV: entering or leaving other commercial /10/2015 Thu 1559 CAR1 NBD on SH 58 lost control but CAR1 lost control, foot slipped or Dry Bright Fine Unknown N/A did not leave the road, CAR1 hit got caught under pedal Cliff Bank, Guard Rail, Post Or Pole /06/2012 Thu 1033 VAN1 NBD on SH 58 HAYWARDS HILL VAN1 inexperienced at towing Wet Overcast ROAD lost control; went off road to trailer / other vehicle, load too left, VAN1 hit Ditch heavy /05/2011 Sun 1827 CAR1 NBD on SH 58 HAYWARDS HILL hit ENV: farm animal straying Wet Dark Fine T Type obstruction, CAR1 hit Stray Animal Junction Light Rain Unknown Stop Sign Stop Sign Stop Sign Nil Give Way Sign
115 B.2 Crash Risk Intersection B.2.1 Crash Risk: SH58/Moonshine Road Intersection In terms of collective crash risk for the T intersection of SH58/Moonshine Road intersection, there are two methods of calculation: Reported F&S Crashes: Over the five year assessment period: there have been two F&S crashes reported within 50 m of the intersection, with two DSI. Estimated DSI Equivalents: The second method involves the estimation of the death and serious injury equivalents (DSIEQ) that have occurred at an intersection using all injury crashes that have occurred during the crash period. This method takes into account the crash movement type, intersection form and control, and collision speed on crash severity outcomes. The estimated collective crash risk is calculated at 1.05 DSIEQ for a 5-year period. This is presented in the table below: Table B-1: Estimation of DSIEQ Collective Risk Using Severity Index SH58/Moonshine Road Intersection Crash Type Number of Reported Injury Crashes Adjusted DSI EQ / All injury crashes 84 Estimated Number of DSI EQ Head-on (B Type) Cornering (D Type) Rear End (F Type) Total Therefore, according to HRIG 85 this intersection is considered Medium risk when quantifying collective risk. When considering personal risk; a calculation is performed which considers the major and minor road traffic volumes to determine the product of flow to standardise the number of potential conflicts that could occur at an intersection. The SH58 / Moonshine intersection is calculated as having a personal risk value of 75. According to HRIG 86, this results in a High personal risk level. The Level of Safety Service (LoSS) 87 for this intersection is on the cusp of the category III 88 and category IV boundary and demonstrates an worse than average safety performance on a five point scale, when compared to other intersections with similar characteristics. As this intersection does not have a collective risk of more than three fatal or serious crashes in the five year period, or have more than 1.1 DSIEQ this intersection is not considered to be high risk. Therefore although this intersection has not resulted in high-risk classification (based on collective and personal risk), the HRIG recommended safety improvement strategy is between Safety Management or Project No.: Page 90 Our ref: SH58 Addendum Report_Final Draft
116 Safe System Transformation Works. However, due to the worse than average LoSS, further investigation and/or larger cost treatments may be justifiable on safety grounds. B.2.2 Crash Risk: SH58 and Flightys/Murphys Road Intersection In terms of collective crash risk for the crossroads intersection of SH58 and Flightys/Murphys Road, there are two methods of calculation: For Collective Crash Risk: Reported F&S Crashes: Over the 5 year assessment period, there have been no F&S crashes. Estimated DSI Equivalents: The estimated collective crash risk is calculated at 1.1 DSI EQ for a 5- year period. This is presented in the table below: Table B-2: Estimation of F&S Collective Risk Using Severity Index SH58 and Flightys/Murphys Road Intersection Crash Type Number of Reported Injury Crashes Adjusted DSI EQ / All injury crashes Estimated Number of DSI EQ Cornering (D Type) Loss Control Bend (G Type) Total Therefore, according to HRIG, using Estimated DSI Equivalents method the intersection is Medium High risk. The SH58 and Flightys/Murphys Road Intersection is calculated as having a personal risk value of 77 DSIEQ per 100M vkt, according to HRIG, this results in a High personal risk level. The Level of Safety Service (LoSS) for this intersection is category IV and demonstrates a worse than average safety performance on a five point scale, when compared to other intersections with similar characteristics. As this intersection has a collective risk of more than 1.1 DSI EQ, and this intersection has a personal risk greater than 16 it is considered to be high risk. The HRIG recommended safety improvement strategy is Safe System Transformation Works. Project No.: Page 91 Our ref: SH58 Addendum Report_Final Draft
117 APPENDIX B: Crash Risk ROUTE: SH58 (Haywards Hill) to Lanes Flat (TG) (SH58 0/ ) KiwiRAP extent Star Rating current 2.7 Injury crashes/yr DSI/yr (assume 1.2 Length 8.80 km DSI per F&S) Inj/5yr DSi/5y AADT length weighted average Injury crash rate per 100M VKT Length of Crash History 5 years per year High severity crash rate per 100M VKT Number of F+S 12 Section is High Risk Road 2.4 Future 4.0 star Total Injury Injury crash rate per 100M VKT DSI High severity crash rate per 100M VKT Per year 5 year period Collective Risk = (Fatal crashes + serious crashes) / number of years of data Reduction (injury crashes) Length of road section Reduction (high severity crashes) DSI Collective Risk = 0.27 = Use Figure 4-1 from the HRRRG to determine the collective risk band Value from Figure 4-1 = HIGH Personal Risk = Fatal crashes + serious crashes (length of road in km x number of years of data x 365 days x AADT) / 10^8 Personal Risk = 5.24 = Value from Figure 4-2 = Use Figure 4-2 from the HRRRG to determine the personal risk band MEDIUM Injury Crash Rate per 100m VKT 18.8 HRRRG Treatment Philosophy Safer Corridors / SSTW (see HRRRG fig 4-6) Note: 3 year 5 year 10 Year To be classified as a HRRR Collective Risk & Personal Risk 2 or more high severity crashes 3 or more high severity crashes 5 or more high severity crashes
118 Appendix C Option Evaluation C.1 Modelling Outputs C.1.1 WTSM Project No.: Page 92 Our ref: SH58 Addendum Report_Final Draft
119 FILE NOTE DATE 8 June 2016 AUTHOR SUBJECT John Pell, Christoph Gerds SH58 Four Lane WTSM Testing 1. Introduction This note summarises the following tests undertaken using WTSM 2011: Do Minimum with existing number of lanes on SH58 between Transmission Gully (TG) and the Haywards Interchange referred to as Do Min Do Minimum with the Petone to Grenada Link Road (P2G) in place and existing number of lanes on SH58 between Transmission Gully (TG) and the Haywards Interchange) referred to as Do Min with P2G SH58 four laning Option between TG and Haywards interchange referred to as Option SH58 four laning Option between TG and Haywards interchange with the P2G in place referred to as Option with P2G This study is understood to be undertaken in parallel and as a potential alternative to the P2G scheme. Due to this, the 2011 version of the WTSM model has been used rather than the 2013 version to be consistent with the P2G analysis to date. Traffic volumes and levels of service are provided for 2031 within this note with other forecast year results attached as appendices. Commentary is also provided relating to modal shift and potential trip re-distribution. SH58 4 LANING NOTE PAGE 1 OF 8
120 2. Traffic volumes Traffic volumes are shown in Table 1 and Table 2 for the AM and PM hour peak periods respectively. These tables show that the four laning of SH58 has minimal effect on the volume of traffic on SH58 and the adjacent roads. The P2G link road however does have a significant effect, reducing volumes by around a third (from ~3,000 to 2,000 vehicles) in the peak direction in Table 1: 2031 AM Volumes Scenario SH 58 TG, North of SH58 TG, South of SH58 SH2, North of SH58 SH2, South of SH58 WB EB NB SB NB SB NB SB NB SB Do Min Do Min with P2G Option Option with P2G Table 2: 2031 PM Volumes Scenario SH 58 TG, North of SH58 TG, South of SH58 SH2, North of SH58 SH2, South of SH58 WB EB NB SB NB SB NB SB NB SB Do Min Do Min with P2G Option Option with P2G Volumes for 2011, 2021, 2031 and 2041 are included in Appendix A SH58 4 LANING NOTE PAGE 2 OF 8
121 3. Levels of service Volume to Capacity ratio results from 2031 are shown for the AM in Table 3 and in Table 4 for the PM 2 hour peak period. The Do Min scenario exceeds capacity in the eastbound direction for the AM and the westbound direction for the PM period. With P2G in place SH58, under the do min scenario, is at around 70% capacity for the peak direction. Under the option SH58 is at around 40% and 30% capacity with and without P2G respectively. Table 3: 2031 AM Volume/Capacity Scenario SH 58 TG, North of SH58 TG, South of SH58 SH2, North of SH58 SH2, South of SH58 WB EB NB SB NB SB NB SB NB SB Do Min 66% 104% 20% 36% 23% 33% 44% 51% 34% 55% Do Min with P2G 47% 70% 20% 36% 17% 30% 44% 51% 33% 48% Option 26% 42% 20% 37% 23% 33% 44% 51% 35% 56% Option with P2G 18% 29% 20% 36% 18% 30% 44% 51% 32% 49% Table 4: 2031 PM Volume/Capacity Scenario SH 58 TG, North of SH58 TG, South of SH58 SH2, North of SH58 SH2, South of SH58 WB EB NB SB NB WB EB NB SB NB Do Min 107% 67% 33% 18% 31% 26% 51% 48% 55% 37% Do Min with P2G 71% 45% 34% 18% 28% 19% 52% 48% 49% 35% Option 42% 27% 33% 18% 32% 26% 51% 48% 55% 37% Option with P2G 28% 18% 34% 18% 28% 20% 52% 48% 49% 35% Level of Service comparisons for 2011, 2021, 2031 and 2041 are included in Appendix B. SH58 4 LANING NOTE PAGE 3 OF 8
122 4. Modal shift and trip re-distribution This section compares the car and PT demand matrices to give an idea of the modal shift to or from public transit as well as any trip redistribution as a result of the SH58 four laning option. For the tables in this section, where the absolute difference is more than 30 vehicles, the value is highlighted orange and where the absolute difference is more than 50 vehicles, the value is highlighted red. 4.1 Car Demands Table 5 and Table 6 compare the Do Min and Option demands without P2G for the AM and PM peaks respectively. Trips internal to the Wellington City area show the highest change in both the AM and PM periods, however this is insignificant as it represents a percentage change of around 0.1%. Similarly the AM peak Porirua to Lower Hutt movement, which shows an increase of 27 trips, represents a percentage difference change of 1%. Table 5: Option vs Do Min Demands Comparison without P2G AM Peak Car Demand Destinations Origins Wellington Porirua Kapiti Lower Hutt Upper Hutt Wairarapa Wellington Porirua Kapiti Lower Hutt Upper Hutt Wairarapa Table 6: Option vs Do Min Demands Comparison without P2G PM Peak Car Demand Destinations Origins Wellington Porirua Kapiti Lower Hutt Upper Hutt Wairarapa Wellington Porirua Kapiti Lower Hutt Upper Hutt Wairarapa SH58 4 LANING NOTE PAGE 4 OF 8
123 The same comparison is made for demands with P2G in Table 7 for the AM period and Table 8 for the PM period. A high difference is seen again for the internal Wellington City trips, which again is insignificant as this only equates to a change of around 0.1%. Table 7: Option vs Do Min Demands Comparison with P2G AM Peak Car Demand Destinations Origins Wellington Porirua Kapiti Lower Hutt Upper Hutt Wairarapa Wellington Porirua Kapiti Lower Hutt Upper Hutt Wairarapa Table 8: Option vs Do Min Demands Comparison with P2G PM Peak Car Demand Destinations Origins Wellington Porirua Kapiti Lower Hutt Upper Hutt Wairarapa Wellington Porirua Kapiti Lower Hutt Upper Hutt Wairarapa Car Demand Comparisons for 2021, 2031 and 2041 are included in Appendix C SH58 4 LANING NOTE PAGE 5 OF 8
124 4.2 PT Demands The PT demands are compared between the Option and Do Min scenarios without P2G in Table 9 for the AM and Table 10 for the PM peak periods. The same comparison is made with P2G in Table 11 and Table 12 for the AM and PM peak periods respectively. In all of these comparisons, the largest change is for internal Wellington City trips and, as with the car demands, this difference is insignificant as it equates to a percentage difference of less than 1% in all instances. It should be noted that only a single bus service operates over SH58 and this service is in the peak direction only. Table 9: Option vs Do Min Demands Comparison without P2G AM Peak PT Demand Destinations Origins Wellington Porirua Kapiti Lower Hutt Upper Hutt Wairarapa Wellington Porirua Kapiti Lower Hutt Upper Hutt Wairarapa Table 10: Option vs Do Min Demands Comparison without P2G PM Peak PT Demand Destinations Origins Wellington Porirua Kapiti Lower Hutt Upper Hutt Wairarapa Wellington Porirua Kapiti Lower Hutt Upper Hutt Wairarapa SH58 4 LANING NOTE PAGE 6 OF 8
125 Table 11: Option vs Do Min Demands Comparison with P2G AM Peak PT Demand Destinations Origins Wellington Porirua Kapiti Lower Hutt Upper Hutt Wairarapa Wellington Porirua Kapiti Lower Hutt Upper Hutt Wairarapa Table 12: Option vs Do Min Demands Comparison with P2G PM Peak PT Demand Destinations Origins Wellington Porirua Kapiti Lower Hutt Upper Hutt Wairarapa Wellington Porirua Kapiti Lower Hutt Upper Hutt Wairarapa PT Demand Comparisons for 2021, 2031 and 2041 are included in Appendix C. SH58 4 LANING NOTE PAGE 7 OF 8
126 5. Summary This analysis has shown that volumes do not significantly differ as a result of widening the SH58 corridor to four lanes. SH58 does come under pressure if P2G is not constructed, the peak direction indicating capacity being exceeded in 2031 and beyond. The four laning of SH58 would provide sufficient capacity if P2G was not constructed. Trip redistribution has been looked at and found to not occur as a result of four laning SH58. There is also no indication of modal shift occurring under the scenarios tested. It is recommended, if not already done so, that these scenarios be assessed in the NWSM Saturn model. This will provide a better understanding of how traffic may react to the proposed schemes. SH58 4 LANING NOTE PAGE 8 OF 8
127 APPENDIX A AM VOLUMES 2011 AM Volumes Scenario SH 58 TG, North of SH58 TG, South of SH58 WB EB NB SB NB SB DoMin (nop2g), SH58 as is Option (with P2G), SH58 as is DoMin (nop2g), SH58 4 Laning Option (with P2G), SH58 4 Laning 2021 AM Volumes Scenario SH 58 TG, North of SH58 TG, South of SH58 WB EB NB SB NB SB DoMin (nop2g), SH58 as is Option (with P2G), SH58 as is DoMin (nop2g), SH58 4 Laning Option (with P2G), SH58 4 Laning AM Volumes Scenario SH 58 TG, North of SH58 TG, South of SH58 WB EB NB SB NB SB DoMin (nop2g), SH58 as is Option (with P2G), SH58 as is DoMin (nop2g), SH58 4 Laning Option (with P2G), SH58 4 Laning AM Volumes Scenario SH 58 TG, North of SH58 TG, South of SH58 WB EB NB SB NB SB DoMin (nop2g), SH58 as is Option (with P2G), SH58 as is DoMin (nop2g), SH58 4 Laning Option (with P2G), SH58 4 Laning
128 SH2, North of SH58 SH2, South of SH58 NB SB NB SB SH2, North of SH58 SH2, South of SH58 NB SB NB SB SH2, North of SH58 SH2, South of SH58 NB SB NB SB SH2, North of SH58 SH2, South of SH58 NB SB NB SB
129 APPENDIX B _ VOLUME TO CAPACITY RATIOS Capacities in the WTSM model are as follows: Existing SH58 has a capacity of 1,400 veh / lane / hour For the Option we have assumed improved geometry (plus to ensure model is unconstrained) so have a capacity of 1,800 veh/lane/hour 2011 AM Volume/Capacity Scenario SH 58 TG, North of SH58 TG, South of SH58 SH2, North of SH58 SH2, South of SH58 WB EB NB SB NB SB NB SB NB SB DoMin (nop2g), SH58 as is 54% 55% 30% 52% 27% 49% Option (with P2G), SH58 as is DoMin (nop2g), SH58 4 Laning Option (with P2G), SH58 4 Laning 2021 AM Volume/Capacity Scenario SH 58 TG, North of SH58 TG, South of SH58 SH2, North of SH58 SH2, South of SH58 WB EB NB SB NB SB NB SB NB SB DoMin (nop2g), SH58 as is 63% 86% 19% 33% 19% 30% 37% 50% 31% 52% Option (with P2G), SH58 as is 45% 61% 19% 32% 15% 28% 38% 51% 28% 47% DoMin (nop2g), SH58 4 Laning 25% 35% 19% 33% 19% 30% 38% 51% 31% 53% Option (with P2G), SH58 4 Laning 18% 25% 19% 33% 15% 27% 38% 51% 28% 47% 2031 AM Volume/Capacity Scenario SH 58 TG, North of SH58 TG, South of SH58 SH2, North of SH58 SH2, South of SH58 WB EB NB SB NB SB NB SB NB SB DoMin (nop2g), SH58 as is 66% 104% 20% 36% 23% 33% 44% 51% 34% 55% Option (with P2G), SH58 as is 47% 70% 20% 36% 17% 30% 44% 51% 33% 48% DoMin (nop2g), SH58 4 Laning 26% 42% 20% 37% 23% 33% 44% 51% 35% 56% Option (with P2G), SH58 4 Laning 18% 29% 20% 36% 18% 30% 44% 51% 32% 49% 2041 AM Volume/Capacity Scenario SH 58 TG, North of SH58 TG, South of SH58 SH2, North of SH58 SH2, South of SH58 WB EB NB SB NB SB NB SB NB SB DoMin (nop2g), SH58 as is 65% 107% 22% 36% 25% 33% 44% 50% 34% 55% Option (with P2G), SH58 as is 46% 70% 22% 36% 19% 31% 44% 50% 33% 47% DoMin (nop2g), SH58 4 Laning 25% 42% 22% 37% 25% 33% 44% 50% 34% 56% Option (with P2G), SH58 4 Laning 18% 28% 22% 36% 19% 30% 44% 50% 33% 48%
130 APPENDIX C CAR & PT DEMANDS Option vs Do Min Comparison No P2G Option vs Do Min Comparison With P2G Car AM Demand Destinations Car AM Demand Destinations Origins Wellington Porirua Kapiti Lower Hutt Upper Hutt Wairarapa Wellington Wellington Porirua Porirua Kapiti Kapiti Origins Lower Hutt Lower Hutt Upper Hutt Upper Hutt Wairarapa Wairarapa Wellington Porirua Kapiti Lower Hutt Upper Hutt Wairarapa Car IP Demand Destinations Car IP Demand Destinations Origins Wellington Porirua Kapiti Lower Hutt Upper Hutt Wairarapa Wellington Wellington Porirua Porirua Kapiti Kapiti Origins Lower Hutt Lower Hutt Upper Hutt Upper Hutt Wairarapa Wairarapa Wellington Porirua Kapiti Lower Hutt Upper Hutt Wairarapa Car PM Demand Destinations Car PM Demand Destinations Origins Wellington Porirua Kapiti Lower Hutt Upper Hutt Wairarapa Wellington Wellington Porirua Porirua Kapiti Kapiti Origins Lower Hutt Lower Hutt Upper Hutt Upper Hutt Wairarapa Wairarapa Wellington Porirua Kapiti Lower Hutt Upper Hutt Wairarapa PT AM Demand Destinations PT AM Demand Destinations Origins Wellington Porirua Kapiti Lower Hutt Upper Hutt Wairarapa Wellington Wellington Porirua Porirua Kapiti Kapiti Origins Lower Hutt Lower Hutt Upper Hutt Upper Hutt Wairarapa Wairarapa Wellington Porirua Kapiti Lower Hutt Upper Hutt Wairarapa PT IP Demand Wellington Porirua Destinations Kapiti Lower Hutt Upper Hutt Wairarapa Destination PT IP Demand Origin Wellington Wellington Porirua Porirua Origins Kapiti Kapiti Origins Lower Hutt Lower Hutt Upper Hutt Upper Hutt Wairarapa Wairarapa Wellington Porirua Destinations Kapiti Lower Hutt Upper Hutt Wairarapa PT PM Demand Destinations PT PM Demand Destinations Origins Wellington Porirua Kapiti Lower Hutt Upper Hutt Wairarapa Wellington Wellington Porirua Porirua Kapiti Kapiti Origins Lower Hutt Lower Hutt Upper Hutt Upper Hutt Wairarapa Wairarapa Wellington Porirua Kapiti Lower Hutt Upper Hutt Wairarapa
131 C.1.2 HCM 2010 Project No.: Page 93 Our ref: SH58 Addendum Report_Final Draft
132 Federal Highways Authority (FHA) Highway Capacity Manual 2010 (HCM2010) LOS analysis using a metric spreadsheet conversion tool based on HCM 2010 chapter 15. The Analysis considers: AM peak Only, Both IRP and DRP directions, Traffic volumes for 5 years: 2011,2021, %, 2031 without P2G, and 2031 with P2G (Transmission Gully). The existing route, and option 5. OUTPUT SH58 Decreasing RP LOS Existing Route - Eastbound (DRP) LOS Option 5 - Eastbound (DRP) Categories Section Section A B 2011 E E D D C E D C 2021 with TG F E E E D E E F E E E D E E D SENSITIVITY % with TG F F E F F E E F F E F F E E E 2031 No P2G F F E F E E E F 2031+P2G E E E E C E E OUTPUT SH58 Increasing RP LOS Existing Route - Westbound LOS Option 5 - Westbound Categories Section Section A B 2011 E D D D D D D C 2021 E E E E E E E E E E E E E E D SENSITIVITY % E E E E E E E E E E E E E E E 2031 E E E E E E E F 2031+P2G E D D D E E E
133 C.1.3 NWSM Project No.: Page 94 Our ref: SH58 Addendum Report_Final Draft
134 NWSM modelling outputs provided by JACOBS KEY LOS Average Delay A <10 B 10 to 20 C 20 to 35 D 35 to 55 E 55 to 80 F > BASE With P2G, TG, 80k BASE With P2G, TG, 100k WORST CASE (NO P2G, high growth) AM Peak PM Peak SH58 LoS and AADT AM Peak SH58 LoS and AADT PM Peak East of Moonshine Road East of Moonshine Road SB NB AADT SB NB AADT No Scheme Avg Delay (s) B1a LoS C B A B With Scheme 10sec RAB Avg Delay (s) S1a LoS C B A B sec RAB Avg Delay (s) S1b LoS C C A C No Scheme Avg Delay (s) B4a LoS D B A B With Scheme 10sec RAB Avg Delay (s) S3a LoS C B A B sec RAB Avg Delay (s) S3b LoS C C A C No Scheme Avg Delay (s) B6a LoS F D D E With Scheme 10sec RAB Avg Delay (s) S2a LoS F D C E sec RAB Avg Delay (s) S2b LoS F D C E BASE With P2G, TG, 80k BASE With P2G, TG, 100k WORST CASE (NO P2G, high growth) BASE With P2G, TG, 80k BASE With P2G, TG, 100k WORST CASE (NO P2G, high growth) Avg Delay (s) No Scheme B1a LoS E B B C Avg Delay (s) sec RAB S1a LoS C B A C With Scheme Avg Delay (s) sec RAB S1b LoS C C A D Avg Delay (s) No Scheme B4a LoS E B A D Avg Delay (s) sec RAB S3a LoS D B A C With Scheme Avg Delay (s) sec RAB S3b LoS D C A D Avg Delay (s) No Scheme B6a LoS F D E F Avg Delay (s) sec RAB S2a LoS F D D F With Scheme Avg Delay (s) sec RAB S2b LoS F D D F Avg Delay (s) No Scheme B1a LoS E B B D Avg Delay (s) sec RAB S1a LoS D B A D With Scheme Avg Delay (s) sec RAB S1b LoS D C A D Avg Delay (s) No Scheme B4a LoS E B B D Avg Delay (s) sec RAB S3a LoS D B A D With Scheme Avg Delay (s) sec RAB S3b LoS D C A D Avg Delay (s) No Scheme B6a LoS F D E F Avg Delay (s) sec RAB S2a LoS F D D F With Scheme Avg Delay (s) sec RAB S2b LoS F D D F
 B6a Colour V/C 2021 AM Green <=30% Cyan <=70% Red <=90% Purple <=100% Brown >100% Base 1 (with P2G) B1A Scheme Base 6 (no P2G, high growth) 20sec RAB")
135 NWSM Intersection Performance The following bands for the V/C jpgs were applied, In addition, the greater the circle the higher the number AM Base 6 (no P2G, high growth) B6a Colour V/C 2021 AM Green <=30% Cyan <=70% Red <=90% Purple <=100% Brown >100% Base 1 (with P2G) B1A Scheme Base 6 (no P2G, high growth) 20sec RAB (S2b) Scheme Base 1 (with P2G) S1b (20sec RAB)
136 2031 AM Base 1 (with P2G) b1a 2031 AM Base 6 (no P2G, high growth) B6a Scheme Base 1 (with P2G) S1b (20sec RAB) Scheme Base 6 (no P2G, high growth) 20sec RAB (S2b)
 S1b (20sec RAB) Scheme Base 6 (no P2G, high growth) 20sec RAB")
137 2041 AM Base 1 (with P2G) b1a 2041 AM Base 6 (no P2G, high growth) B6a Scheme Base 1 (with P2G) S1b (20sec RAB) Scheme Base 6 (no P2G, high growth) 20sec RAB (S2b)
138 2041 AM Base 2 (no P2G) B2a
139 C.2 Speed Limit Change Project No.: Page 95 Our ref: SH58 Addendum Report_Final Draft

 based on 2.50% Base Sensitivity (6.")
 1.1 19% 14% weighted factor 1.16 DSI per F&S crash % Change in crashes (using weighting factor of 1.")
140 SH58 Crash Reduction due to reducing the posted speed limit from 100km/h to 80km/h Based on the High Risk Rural Road Guide methodology (Figures D 1 and 2 3) Existing speeds Source Existing posted speed limit 100 km/h Existing PSL Existing mean speed 80 km/h TomTom 2013 data note 2013 data was used as Existing 85th %tile speed 90 km/h temporary speed limits were put in place due to the fatal crashes in 13/14. Proposed posted speed limit 80 km/h Proposed Do Minimum PSL % Change in mean speed Change in mean speed from 20km/h reduction in PSL 2.50 % using the equation from Figure D 1, HRRRG Predicted option mean speed 78 km/h % Change in casualties (Figure 2 3) based on 2.50% Base Sensitivity (6.3% red = 75km/h) Deaths 11% 25% Serious injuries 8% 18% Minor injuries 5% 9% DSI/Crashes HRRRG ratio HRRRG Typical SH58 % of Crashes (08'12) SH58 % of Crashes (10'14) Run off Road % 64% Head On 1.6 8% 11% Intersection % 10% Other (assumed as 1.1) % 14% weighted factor 1.16 DSI per F&S crash % Change in crashes (using weighting factor of 1.16) Base Sensitivity (75km/h) Deaths 9.5% input in economics worksheets(s) 21.5% Serious injuries 6.9% input in economics worksheets(s) 15.5% Minor injuries 4.3% input in economics worksheets(s) 7.7% Assume non injuries reduction = minor injury red. 4.3% input in economics worksheets(s) 7.7% These reductions will apply to the 5 year crash history at 100 km/h. 20km/h Reduction in Low Typical Expected 2.5% Typical 6.3% High
141 SP3_SH58 Speed Limit Change SP3 1 SP3 General road improvements Spreadsheet v3 (27-March-2014) Worksheet 1 - Evaluation summary Worksheet 1 provides a summary of the general data used for the evaluation as well as the results of the analysis. The information required is a subset of the information entered into Transport Investment Online. Spreadsheet problems? eem@nzta.govt.nz 1 Evaluator(s) Reviewer(s) Dhimantha Ranatunga (MWH) Phil Peet (MWH) 2 Activity/package details Approved organisation name Activity/package name Your reference NZ Transport Agency SH58 Safety Improvements: Phase / Activity description Posted Speed Limit Reduction from 100km/h to 80km/h Describe the issues to be addressed Reduce the severity and the number of crashes 3 Location Brief description of location SH58 Haywards Hill to Bradey Road (TG) (RP 0.5 to 9.3) 4 Alternatives and options Describe the do-minimum Retain existing 100km/h Posted Speed Limit Summarise the options assessed Reduce Posted Speed Limit to 80km/h with associated signage 5 Timing Time zero (assumed construction start date) 1 July 2016 Expected duration of construction (months) 1 6 Economic efficiency Date economic evaluation completed (mm/yyyy) Base date for costs and benefits 1 July Jun AADT at time zero Traffic growth rate at time zero (%) 14, Existing roughness IRI or NAASRA Length of road before works 8.80 km Predicted roughness IRI or NAASRA Length of road after works 8.80 km Existing traffic speed 80 km/h Option PV Costs (B) Predicted traffic speed 78 km/h SP3-3 (1) Speed Limit Reduction to 28,440 7 PV cost of do-minimum $ 0 A SP3-3 (2) PV cost of the preferred option $ 28,440 B SP3-3 (3) Benefit values from worksheet 4, 5, 6 $79, $0.08 PV travel time cost savings $ -5,969,602 C x Update factor TTC 1.44 = $ -8,596,226 W PV VOC and CO 2 savings $ 1,666,251 D x Update factor VOC 1.00 = $ 1,666,251 Y Annual Costs 40 year PV crash cost savings $ 7,438,146 E x Update factor AC 1.00 = $ 7,438,146 Z Not Updated Updated Annual Updated Updated ($M) ($M) PV net benefits W + Y + Z 508,170 -$341,082 -$491,158 -$0.49 -$8,596, BCR N = = = = 17.9 PV net costs B - A 28,440 $91,542 $91,542 $0.09 $1,666,251 PV 1 st year benefits [(W + Y) / DF VOC + ( Z / DF AC )] x 0.94 $479,409 $479,409 $0.48 $7,438, FYRR = = = 276 % PV net costs B - A Net Total $229,869 $79,793 $0.08 $508,170 NZ Transport Agency s Economic evaluation manual Effective from Jul 2013
142 SP3_SH58 Speed Limit Change SP3 1 SP3 General road improvements Spreadsheet v3 (27-March-2014) Worksheet 1 - Evaluation summary Worksheet 1 provides a summary of the general data used for the evaluation as well as the results of the analysis. The information required is a subset of the information entered into Transport Investment Online. Spreadsheet problems? eem@nzta.govt.nz 1 Evaluator(s) Reviewer(s) Dhimantha Ranatunga (MWH) Phil Peet (MWH) 2 Activity/package details Approved organisation name Activity/package name Your reference NZ Transport Agency SH58 Safety Improvements: Phase / Activity description Posted Speed Limit Reduction from 100km/h to 80km/h Describe the issues to be addressed Reduce the severity and the number of crashes 3 Location Brief description of location SH58 Haywards Hill to Bradey Road (TG) (RP 0.5 to 9.3) 4 Alternatives and options Describe the do-minimum Retain existing 100km/h Posted Speed Limit Summarise the options assessed ereduce Posted Speed Limit to 80km/h with associated signage (ASSUME 75km/h - SENSITIVITY ONLY) 5 Timing Time zero (assumed construction start date) 1 July 2016 Expected duration of construction (months) 1 6 Economic efficiency Date economic evaluation completed (mm/yyyy) Base date for costs and benefits 1 July Jun AADT at time zero Traffic growth rate at time zero (%) 14, Existing roughness IRI or NAASRA Length of road before works 8.80 km Predicted roughness IRI or NAASRA Length of road after works 8.80 km Existing traffic speed 80 km/h Option PV Costs (B) Predicted traffic speed 75 km/h SP3-3 (1) Speed Limit Reduction to 28,440 7 PV cost of do-minimum $ 0 A SP3-3 (2) PV cost of the preferred option $ 28,440 B SP3-3 (3) Benefit values from worksheet 4, 5, 6 $1, $0.00 PV travel time cost savings $ -15,520,964 C x Update factor TTC 1.44 = $ -22,350,188 W PV VOC and CO 2 savings $ 4,165,627 D x Update factor VOC 1.00 = $ 4,165,627 Y Annual Costs 40 year PV crash cost savings $ 16,287,248 E x Update factor AC 1.00 = $ 16,287,248 Z Not Updated Updated Annual Updated Updated ($M) ($M) PV net benefits W + Y + Z -1,897,314 -$886,813 -$1,277,011 -$1.28 -$22,350, BCR N = = = = PV net costs B - A 28,440 $228,855 $228,855 $0.23 $4,165,627 PV 1 st year benefits [(W + Y) / DF VOC + ( Z / DF AC )] x 0.94 $1,049,758 $1,049,758 $1.05 $16,287, FYRR = = = 36 % PV net costs B - A Net Total $391,800 $1,602 $0.00 -$1,897,314 NZ Transport Agency s Economic evaluation manual Effective from Jul 2013
143 C.3 Costs Project No.: Page 96 Our ref: SH58 Addendum Report_Final Draft
144 Project Estimate - Form C Project Name: SH58 Haywards Substation Curves Option 5 Region A SE Scheme Estimate Item Description Base Estimate Contingency Funding Risk A Nett Project Property Cost 18,400 2,800 4,600 Investigation and Reporting - Consultancy Fees Nil Nil Nil - NZTA-Managed Costs Nil Nil Nil B Total Investigation and Reporting Nil Nil Nil Design and Project Documentation - Consultancy Fees 113,341 17,000 28,300 - NZTA-Managed Costs C Total Design and Project Documentation 113,341 17,000 28,300 Construction MSQA - Consultancy Fees 121,054 18,160 30,300 - NZTA-Managed Costs Consent Monitoring Fees Sub Total Base MSQA 121,054 18,160 30,300 Physical Works D1 Environmental Compliance 156,000 23,400 39,000 D2 Earthworks 631, , ,600 D3 Ground Improvements D4 Drainage 24,200 3,600 6,100 D5 Pavement and Surfacing 281,775 42,300 70,400 D6 Bridges / Structures D7 Retaining Walls 45,000 6,800 11,300 D8 Traffic Services 170,150 25,500 42,500 D9 Service Relocations 80,500 12,100 20,100 D10 Landscaping 135,700 20,400 33,900 D11 Traffic Management and Temporary Works 350,000 52,500 87,500 D12 Preliminary and General 268,000 40,200 67,000 D13 Extraordinary Construction Costs Sub Total Base Physical Works 2,142, , ,400 D Total Construction & MSQA 2,263, , ,700 E Project Base Estimate (A+B+C+D) 2,395,345 F Contingency (Assessed / Analysed) (A+B+C+D) 454,160 G Project Expected Estimate (E+F) 2,849,505 Project Property Cost Expected Estimate 21,200 Investigation and Reporting Expected Estimate Nil Design and Project Documentation Expected Estimate 130,341 Construction Expected Estimate 2,697,964 H Funding Risk (Assessed / Analysed) (A+B+C+D) 756,600 I 95 th Percentile Project Estimate (G+H) 3,606,105 Project Property Cost 95th Percentile Estimate 25,800 Investigation and Reporting 95th Percentile Estimate Nil Design and Project Documentation 95th Percentile Estimate 158,641 Construction 95th Percentile Estimate 3,421,664 Base Date of Estimate Estimate prepared by: Estimate internal peer review by: 8 Mar 2016 Cost Index Graeme Corin Signed Jamie Povall Signed Estimate external peer review by: Signed Estimate approved by NZTA Project Manager: Signed Note: (1) These estimates are exclusive of escalation and GST. (2) I&R Project Phase Estimates are set to Nil as these are now sunk costs. Transport Agency's Cost Estimation Manual (SM014) st Edition, Amendment 0 ective from November /1 Printed 20/06/2016
145 Project Estimate - Form C Project Name: SH58 Haywards Substation Curves Option 5 Region B SE Scheme Estimate Item Description Base Estimate Contingency Funding Risk A Nett Project Property Cost 80,800 12,100 20,200 Investigation and Reporting - Consultancy Fees Nil Nil Nil - NZTA-Managed Costs Nil Nil Nil B Total Investigation and Reporting Nil Nil Nil Design and Project Documentation - Consultancy Fees 661,779 99, ,400 - NZTA-Managed Costs C Total Design and Project Documentation 661,779 99, ,400 Construction MSQA Sub Total Base MSQA Physical Works - Consultancy Fees 706, , ,700 - NZTA-Managed Costs Consent Monitoring Fees , , ,700 D1 Environmental Compliance 948, , ,000 D2 Earthworks 5,375,000 1,612,500 2,687,500 D3 Ground Improvements D4 Drainage 1,026, , ,500 D5 Pavement and Surfacing 1,529, , ,500 D6 Bridges / Structures D7 Retaining Walls 11,250 1,700 2,800 D8 Traffic Services 819, , ,900 D9 Service Relocations 350,750 52,600 87,700 D10 Landscaping 250,500 37,600 62,600 D11 Traffic Management and Temporary Works 660,000 99, ,000 D12 Preliminary and General 1,539, , ,800 D13 Extraordinary Construction Costs Sub Total Base Physical Works 12,510,000 2,682,800 4,471,300 D Total Construction & MSQA 13,216,815 2,788,820 4,648,000 E Project Base Estimate (A+B+C+D) 13,959,394 F Contingency (Assessed / Analysed) (A+B+C+D) 2,900,190 G Project Expected Estimate (E+F) 16,859,584 Project Property Cost Expected Estimate 92,900 Investigation and Reporting Expected Estimate Nil Design and Project Documentation Expected Estimate 761,049 Construction Expected Estimate 16,005,635 H Funding Risk (Assessed / Analysed) (A+B+C+D) 4,833,600 I 95 th Percentile Project Estimate (G+H) 21,693,184 Project Property Cost 95th Percentile Estimate 113,100 Investigation and Reporting 95th Percentile Estimate Nil Design and Project Documentation 95th Percentile Estimate 926,449 Construction 95th Percentile Estimate 20,653,635 Base Date of Estimate Estimate prepared by: Estimate internal peer review by: 8 Mar 2016 Cost Index Graeme Corin Signed Jamie Povall Signed Estimate external peer review by: Signed Estimate approved by NZTA Project Manager: Signed Note: (1) These estimates are exclusive of escalation and GST. (2) I&R Project Phase Estimates are set to Nil as these are now sunk costs. NZ Transport Agency's Cost Estimation Manual (SM014) First Edition, Amendment 0 Effective from November /1 Printed 20/06/2016
146 Region C - Scour Site Region C (SH58 Scour Site Realignment) has been constructed to practical completion. The forecasted cost at completion is $2.7M. As such no elemental breakdown of work items has been included for Region C
147 Project Estimate - Form C Project Name: SH58 Haywards Substation Curves Option 5 Region D SE Scheme Estimate Item Description Base Estimate Contingency Funding Risk A Nett Project Property Cost 38,400 5,800 9,600 Investigation and Reporting - Consultancy Fees Nil Nil Nil - NZTA-Managed Costs Nil Nil Nil B Total Investigation and Reporting Nil Nil Nil Design and Project Documentation - Consultancy Fees 144,496 21,670 36,100 - NZTA-Managed Costs C Total Design and Project Documentation 144,496 21,670 36,100 Construction MSQA Sub Total Base MSQA Physical Works - Consultancy Fees 154,330 23,150 38,600 - NZTA-Managed Costs Consent Monitoring Fees ,330 23,150 38,600 D1 Environmental Compliance 204,000 30,600 51,000 D2 Earthworks 426, , ,200 D3 Ground Improvements D4 Drainage 491,100 73, ,800 D5 Pavement and Surfacing 474,850 71, ,700 D6 Bridges / Structures D7 Retaining Walls D8 Traffic Services 227,550 34,100 56,900 D9 Service Relocations 160,425 24,100 40,100 D10 Landscaping 61,200 9,200 15,300 D11 Traffic Management and Temporary Works 350,000 52,500 87,500 D12 Preliminary and General 336,000 50,400 84,000 D13 Extraordinary Construction Costs Sub Total Base Physical Works 2,731, , ,500 D Total Construction & MSQA 2,885, , ,100 E Project Base Estimate (A+B+C+D) 3,068,726 F Contingency (Assessed / Analysed) (A+B+C+D) 524,320 G Project Expected Estimate (E+F) 3,593,046 Project Property Cost Expected Estimate 44,200 Investigation and Reporting Expected Estimate Nil Design and Project Documentation Expected Estimate 166,166 Construction Expected Estimate 3,382,680 H Funding Risk (Assessed / Analysed) (A+B+C+D) 873,800 I 95 th Percentile Project Estimate (G+H) 4,466,846 Project Property Cost 95th Percentile Estimate 53,800 Investigation and Reporting 95th Percentile Estimate Nil Design and Project Documentation 95th Percentile Estimate 202,266 Construction 95th Percentile Estimate 4,210,780 Base Date of Estimate Estimate prepared by: Estimate internal peer review by: 8 Mar 2016 Cost Index Graeme Corin Signed Jamie Povall Signed Estimate external peer review by: Signed Estimate approved by NZTA Project Manager: Signed Note: (1) These estimates are exclusive of escalation and GST. (2) I&R Project Phase Estimates are set to Nil as these are now sunk costs. NZ Transport Agency's Cost Estimation Manual (SM014) First Edition, Amendment 0 Effective from November /1 Printed 20/06/2016
148 Project Estimate - Form C Project Name: SH58 Haywards Substation Curves Option 5 Region E SE Scheme Estimate Item Description Base Estimate Contingency Funding Risk A Nett Project Property Cost 52,800 7,900 13,200 Investigation and Reporting - Consultancy Fees Nil Nil Nil - NZTA-Managed Costs Nil Nil Nil B Total Investigation and Reporting Nil Nil Nil Design and Project Documentation - Consultancy Fees 226,749 34,010 56,700 - NZTA-Managed Costs C Total Design and Project Documentation 226,749 34,010 56,700 Construction MSQA - Consultancy Fees 242,179 36,330 60,500 - NZTA-Managed Costs Consent Monitoring Fees Sub Total Base MSQA 242,179 36,330 60,500 Physical Works D1 Environmental Compliance 338,000 50,700 84,500 D2 Earthworks 701, , ,700 D3 Ground Improvements D4 Drainage 650,113 97, ,500 D5 Pavement and Surfacing 861, , ,300 D6 Bridges / Structures D7 Retaining Walls D8 Traffic Services 348,500 52,300 87,100 D9 Service Relocations 230,000 34,500 57,500 D10 Landscaping 86,400 13,000 21,600 D11 Traffic Management and Temporary Works 540,000 81, ,000 D12 Preliminary and General 531,000 79, ,800 D13 Extraordinary Construction Costs Sub Total Base Physical Works 4,286, ,300 1,247,000 D Total Construction & MSQA 4,528, ,630 1,307,500 E Project Base Estimate (A+B+C+D) 4,808,091 F Contingency (Assessed / Analysed) (A+B+C+D) 826,540 G Project Expected Estimate (E+F) 5,634,631 Project Property Cost Expected Estimate 60,700 Investigation and Reporting Expected Estimate Nil Design and Project Documentation Expected Estimate 260,759 Construction Expected Estimate 5,313,172 H Funding Risk (Assessed / Analysed) (A+B+C+D) 1,377,400 I 95 th Percentile Project Estimate (G+H) 7,012,031 Project Property Cost 95th Percentile Estimate 73,900 Investigation and Reporting 95th Percentile Estimate Nil Design and Project Documentation 95th Percentile Estimate 317,459 Construction 95th Percentile Estimate 6,620,672 Base Date of Estimate Estimate prepared by: Estimate internal peer review by: 8 Mar 2016 Cost Index Graeme Corin Signed Jamie Povall Signed Estimate external peer review by: Signed Estimate approved by NZTA Project Manager: Signed Note: (1) These estimates are exclusive of escalation and GST. (2) I&R Project Phase Estimates are set to Nil as these are now sunk costs. Transport Agency's Cost Estimation Manual (SM014) st Edition, Amendment 0 ective from November /1 Printed 20/06/2016
149 Project Estimate - Form C Project Name: SH58 Haywards Substation Curves Option 5 Region F SE Scheme Estimate Item Description Base Estimate Contingency Funding Risk A Nett Project Property Cost 19,200 2,900 4,800 Investigation and Reporting - Consultancy Fees Nil Nil Nil - NZTA-Managed Costs Nil Nil Nil B Total Investigation and Reporting Nil Nil Nil Design and Project Documentation - Consultancy Fees 126,579 18,990 31,600 - NZTA-Managed Costs C Total Design and Project Documentation 126,579 18,990 31,600 Construction MSQA - Consultancy Fees 135,193 20,280 33,800 - NZTA-Managed Costs Consent Monitoring Fees Sub Total Base MSQA 135,193 20,280 33,800 Physical Works D1 Environmental Compliance 183,000 27,500 45,800 D2 Earthworks 712, , ,200 D3 Ground Improvements D4 Drainage 108,500 16,300 27,100 D5 Pavement and Surfacing 359,990 54,000 90,000 D6 Bridges / Structures D7 Retaining Walls D8 Traffic Services 193,000 29,000 48,300 D9 Service Relocations 138,000 20,700 34,500 D10 Landscaping 64,000 9,600 16,000 D11 Traffic Management and Temporary Works 350,000 52,500 87,500 D12 Preliminary and General 284,000 42,600 71,000 D13 Extraordinary Construction Costs Sub Total Base Physical Works 2,392, , ,400 D Total Construction & MSQA 2,527, , ,200 E Project Base Estimate (A+B+C+D) 2,673,761 F Contingency (Assessed / Analysed) (A+B+C+D) 508,070 G Project Expected Estimate (E+F) 3,181,831 Project Property Cost Expected Estimate 22,100 Investigation and Reporting Expected Estimate Nil Design and Project Documentation Expected Estimate 145,569 Construction Expected Estimate 3,014,163 H Funding Risk (Assessed / Analysed) (A+B+C+D) 846,600 I 95 th Percentile Project Estimate (G+H) 4,028,431 Project Property Cost 95th Percentile Estimate 26,900 Investigation and Reporting 95th Percentile Estimate Nil Design and Project Documentation 95th Percentile Estimate 177,169 Construction 95th Percentile Estimate 3,824,363 Base Date of Estimate Estimate prepared by: Estimate internal peer review by: 8 Mar 2016 Cost Index Graeme Corin Signed Jamie Povall Signed Estimate external peer review by: Signed Estimate approved by NZTA Project Manager: Signed Note: (1) These estimates are exclusive of escalation and GST. (2) I&R Project Phase Estimates are set to Nil as these are now sunk costs. Transport Agency's Cost Estimation Manual (SM014) st Edition, Amendment 0 ective from November /1 Printed 20/06/2016
150 Project Estimate - Form C Project Name: SH58 Haywards Substation Curves Option 5 Region G SE Scheme Estimate Item Description Base Estimate Contingency Funding Risk A Nett Project Property Cost 108,000 16,200 27,000 Investigation and Reporting - Consultancy Fees Nil Nil Nil - NZTA-Managed Costs Nil Nil Nil B Total Investigation and Reporting Nil Nil Nil Design and Project Documentation - Consultancy Fees 513,265 76, ,300 - NZTA-Managed Costs C Total Design and Project Documentation 513,265 76, ,300 Construction MSQA - Consultancy Fees 548,194 82, ,000 - NZTA-Managed Costs Consent Monitoring Fees Sub Total Base MSQA 548,194 82, ,000 Physical Works D1 Environmental Compliance 718, , ,500 D2 Earthworks 1,078, , ,400 D3 Ground Improvements D4 Drainage 1,350, , ,600 D5 Pavement and Surfacing 1,731, , ,800 D6 Bridges / Structures 1,320, , ,000 D7 Retaining Walls D8 Traffic Services 965, , ,400 D9 Service Relocations 460,000 69, ,000 D10 Landscaping 218,500 32,800 54,600 D11 Traffic Management and Temporary Works 700, , ,000 D12 Preliminary and General 1,160, , ,000 D13 Extraordinary Construction Costs Sub Total Base Physical Works 9,702,553 2,079,300 2,695,300 D Total Construction & MSQA 10,250,747 2,161,530 2,832,300 E Project Base Estimate (A+B+C+D) 10,872,012 F Contingency (Assessed / Analysed) (A+B+C+D) 2,254,720 G Project Expected Estimate (E+F) 13,126,732 Project Property Cost Expected Estimate 124,200 Investigation and Reporting Expected Estimate Nil Design and Project Documentation Expected Estimate 590,255 Construction Expected Estimate 12,412,277 H Funding Risk (Assessed / Analysed) (A+B+C+D) 2,987,600 I 95 th Percentile Project Estimate (G+H) 16,114,332 Project Property Cost 95th Percentile Estimate 151,200 Investigation and Reporting 95th Percentile Estimate Nil Design and Project Documentation 95th Percentile Estimate 718,555 Construction 95th Percentile Estimate 15,244,577 Base Date of Estimate Estimate prepared by: Estimate internal peer review by: 8 Mar 2016 Cost Index Graeme Corin Signed Jamie Povall Signed Estimate external peer review by: Signed Estimate approved by NZTA Project Manager: Signed Note: (1) These estimates are exclusive of escalation and GST. (2) I&R Project Phase Estimates are set to Nil as these are now sunk costs. Transport Agency's Cost Estimation Manual (SM014) st Edition, Amendment 0 ective from November /1 Printed 20/06/2016
151 C.4 Economic Evaluation Project No.: Page 97 Our ref: SH58 Addendum Report_Final Draft

152 SH58 Safety Improvements Economic Evaluation EVALUATION SUMMARY WORKSHEET 1 1 Evaluator(s) Dhimantha Ranatunga Reviewer(s) Phil Peet, David Wanty 2 Project / Package Details Approved Organisation Name Project / Package Name Your Reference Project Description Describe the problem to be addressed NZTA SH58 Safety Improvements: SH2 to Lanes Flat Safety Improvements Reduce high severity crashes 3 Location Brief description of location State Highway 58, from Haywards Hill to Bradey Road RP0/0.5 to RP0/9.3 4 Alternatives and Options Describe the Do Minimum Summarise the options assessed 5 Timing Time Zero Expected duration of construction (years) End construction Continued Maintenance, Tranmission Gully and Petone to Grenada Constructed by Option 5: Curve realignment of 5 sites, 1.5 full extent shoulder widening, central 2.0m median WRB, edge guardrail and ATP (including roundabouts at Moonshine Road and Flightys/Murphys intersection) 1 July December Economic Efficiency Date economic evaluation completed (mm/yyyy) Aug-13 updated Feb 2014 following peer review Base date for costs AADT at Time Zero Traffic Growth Rate at Time Zero (%) 1 July , %-1.5% Based on 2021/2031 Modelling outputs Existing Roughness 3.10 IRI or NAASRA Existing Traffic Speed km/hr (surv) Predicted Roughness 3.10 IRI or NAASRA Predicted Traffic Speed 80 km/hr Length of curves Before Improvements 1.49 km Posted Speed Limit 80 km/hr DM/OPTION Length of curves After Improvements 1.46 km Road Type Rural Strategic Length of new highway 2.80 km Gradient Before Improvements 0-7% Length of existing highway used 2.80 km Gradient After Improvements 0-7% 7 PV Cost of Do Minimum Cost $ $1,320,440 A 8 PV Cost of the Option Cost $ $43,270,811 B 9 Benefit values from Worksheet 4, 5 or 6 PV Travel Time Cost savings: $ $85,899 C x Update Factor TT 1.44 = $ $123,695 W PV VOC & CO2 savings: PV Accident Cost savings: $ -$3,194,450 D x Update Factor VOC 1.07 = $ -$3,418,062 Y $ $45,579,539 E x Update Factor AC 1.24 = $ $56,518,628 Z 10 B/C Ratio = W + Y + Z = BENEFITS = B - A COSTS = 1.3 File SAR Economics Summary_epr_March16_v4, Worksheet WS 1_opt4 20/06/2016 4:25 p.m. Page 1 of 1
153 SH58 Safety Improvements Economic Evaluation Benefit Cost Analysis of the Option 1 ACTIVE variable from input sheet Project Options Do Min Option 5 Option 5 Scenario 3 (Do Min) 0.5% to 2021, TG+P2G Costs Net Costs of the Option Option Speed 80 in 2021 step change in volume, 1.3% Growth Capital Costs 0 40,304,246 40,304,246 1 Crash Sensitivity 67% from 2021, 2031-> Maintenance Costs 1,320,440 2,966,565 1,646,125 Analysis period % Total Costs 41,950,371 Benefits Net Benefits of the Option Travel Time Costs 133,090, ,967,297 $123,695 Vehicle Operating Costs 152,628, ,923,350 -$3,295,324 Carbon Dioxide 6,022,038 6,144,775 -$122,737 Crash Costs 108,502,669 51,984,040 $56,518,628 Tangible Benefits $53,224,262 B/C Ratio include 43,401, $ 43,171,996 WS3_BCR MWH New Zealand SAR Economics Summary_epr_March16_v4 20/06/2016
154 SH58 Safety Improvements Economic Evaluation Capital Costs Option 4 Curve realignment, shoulder widening and wire rope median barrier Component Comment A Project Property Costs 389,000 B Investigation and Reporting (sunk cost) 0 C Design and Project Documentation 2,177,000 D Construction & MSQA 45,379,000 Total SH58 Safety Improvements: SH2 to Lanes Flat 47,945,000
155 Appendix D MCA Option 1: 1.5m sealed shoulders and 4 realignment sites This option widens the sealed shoulders on each side and realigns four horizontal curves. No median barrier is proposed. Table D-1: Summary for Option 1 Criteria Summary Rating Enhanced Safety Safety is improved with wider shoulders, realignments and edge barriers Maintain or improve journey times & reliability No journey time or reliability benefits are likely to be achieved. Roundabout considered to have minimal negative impact on individual vehicles. Enhanced resilience Realignment of Site 1 offers resilience benefits and no median barrier provides greater flexibility in keeping traffic moving after an earthquake or landslide. Balance the needs of local & state highway traffic No median barrier ensures more convenient local access but doesn t not provide a high standard solution for regional traffic. Cost effective roading solution Based on the BCR calculations, option achieves a reasonable level of cost effectiveness. Consistency with ONRC Regional Highway standard Improved level of consistency with the ONRC levels of service Total Score 7 Option 2: 1.5m sealed shoulders, 2m flush median and 4 realignment sites This option widens the sealed shoulders on each side and realigns four horizontal curves. No median barrier is proposed but a 2m flush median is provided. Table D-2: Summary for Option 2 Criteria Summary Rating Enhanced Safety Safety is improved with wider shoulders, flush median realignments and edge barriers Maintain or improve journey times & reliability No journey time or reliability benefits are likely to be achieved. Roundabout considered to have minimal negative impact on individual vehicles. Enhanced resilience Realignment of Site 1 offers resilience benefits and no median barrier provides greater flexibility in keeping traffic moving after an earthquake or landslide. Balance the needs of local & state highway traffic No median barrier ensures more convenient local access but doesn t not provide a high standard solution for regional traffic Project No.: Page 98 Our ref: SH58 Addendum Report_Final Draft
156 Cost effective roading solution Based on the BCR calculations, option achieves a reasonable level of cost effectiveness. Consistency with ONRC Regional Highway standard Improved level of consistency with the ONRC levels of service Total Score 7 Option 3: 1.5m sealed shoulders, 2m flush median with median barrier and 4 realignment sites This option widens the sealed shoulders on each side and realigns four horizontal curves. A 2m median is proposed including median barrier. Table D-3: Summary for Option 3 Criteria Summary Rating Enhanced Safety Safety is improved considerably with the addition of the median barrier, in addition to the other measures from Options 1 and Option 2. Maintain or improve journey times & reliability Reliability expected to be improved as delays and closures from major crashes reduced due to median barrier in conjunction with curve realignments. Roundabout considered to have minimal negative impact on individual vehicles. Enhanced resilience Realignment of Site 1 offers resilience benefits but median barrier could restrict traffic flow following an earthquake or landslide. Balance the needs of local & state highway traffic Median barrier creates inconvenience for local users but delivers a higher standard for regional traffic. Cost effective roading solution Based on the BCR calculations, option achieves a reasonable level of cost effectiveness. Consistency with ONRC Regional Highway standard Good level of consistency with the ONRC levels of service Total Score 8 Option 4: 1.5m sealed shoulders, 2m flush median with median barrier and 3 realignment sites, 80km/h do-min speed This option widens the sealed shoulders on each side and realigns three horizontal curves. Site 1 Realignment has been removed from the project. A 2m median is proposed including median barrier. The do-minimum and option speed for the project is set to 80km/h. Table D-4: Summary for Option 4 Criteria Summary Rating Project No.: Page 99 Our ref: SH58 Addendum Report_Final Draft
157 Enhanced Safety Safety is improved considerably with the addition of the median barrier, in addition to the other measures from Options 1 and Option 2. Safety is still considered high despite the removal of Realignment Site 1. Maintain or improve journey times & reliability Reliability expected to be improved as delays and closures from major crashes reduced due to median barrier in conjunction with curve realignments. Roundabout considered to have minimal negative impact on individual vehicles. Enhanced resilience No realignment of Site 1 removes the opportunity to improve resilience here and median barrier could restrict traffic flow following an earthquake or landslide. Balance the needs of local & state highway traffic Median barrier creates inconvenience for local users but delivers a higher standard for regional traffic. Cost effective roading solution Based on the BCR calculations, option achieves a reasonable level of cost effectiveness. Consistency with ONRC Regional Highway standard Good level of consistency with the ONRC levels of service Total Score 7 Option 5: 1.5m sealed shoulders, 2m flush median with median barrier and 5 realignment sites, 80km/h do-min speed, bridge improvements and an additional roundabout This option widens the sealed shoulders on each side and realigns five horizontal curves. Site 1 Realignment has been re-introduced to the project, and a further realignment site has been added. A 2m median is proposed including median barrier. The do-minimum and option speed for the project is set to 80km/h. Bridge improvements are proposed in a number of locations and an additional roundabout is proposed at the intersection of Murphys Road/Flightys Road with SH58. Table D-5: Summary for Option 5 Criteria Summary Rating Enhanced Safety Safety benefits are considered greatest in this option with 5 realignment sites, in addition to other measures being proposed. Maintain or improve journey times & reliability Reliability expected to be improved as delays and closures from major crashes reduced due to median barrier in conjunction with curve realignments. Roundabouts considered to have minimal negative impact on individual vehicles. Enhanced resilience Realignment of Site 1 offers resilience benefits but median barrier could restrict traffic flow following an earthquake or landslide. Balance the needs of local & state highway traffic Median barrier creates inconvenience for local users but this is reduced with an additional roundabout provided at Flightys / Murphys Road. Median barrier delivers a higher standard for regional traffic Project No.: Page 100 Our ref: SH58 Addendum Report_Final Draft
158 Cost effective roading solution Based on the BCR calculations, option achieves a lesser level of cost effectiveness. Consistency with ONRC Regional Highway standard Excellent level of consistency with the ONRC levels of service. Consistent curve radii and speeds throughout Total Score 9 Project No.: Page 101 Our ref: SH58 Addendum Report_Final Draft
159 Appendix E Staging Assessment Project No.: Page 102 Our ref: SH58 Addendum Report_Final Draft
160 Stage Zero Stage 1 Staging: Safety Programme Regions Works Description & Staging Justification Risks Expected Cost Scour Site Realignment (C) 12.5 injury crashes per Km East of Hugh Duncan Street to SH2/58 extent (A) 20.0 Moonshine Roundabout (F) 0.5 Realignment of scour site section between Mount Cecil Road and scour site at RP, due to high density of crashes at this location plus need to mitigate undermining of road from stream Short section of improvement but very high cost due to significant cuts for realignment. Works to connect into 2/58 interchange works. This section is very high cost but extremely high injury crash proliferation here. Addressed early due to higher standard improvements from 2/58 leading immediately into very poor alignment with extremely high injury crash rate. The roundabout at Moonshine is provided in Stage 1 to cater for some turning movements in later stages. This also recognises the need for the roundabout early should the Winstones cleanfill site proposals eventuate. Large amount of corridor benefits are realised in short section of works, reducing economic efficiency of wider corridor Crash migration Major delays to customers in close proximity to the 2/58 works that will have already caused traveller disruption. All service relocations / protections undertaken but then parts of scheme may be omitted from project in future (for reasons unknown at this stage) meaning unnecessary cost outlay Indicative BCR $2.7M 8.6 $6.0M 2.5 Stage 2 West of Scour Site to Harris (D) 7.8 Stage 3 TG to Moonshine Road (G) 3.5 West of Hugh Duncan to Mount Cecil (B) 3.5 West of Harris to Moonshine Roundabout (E) 3.1 West of scour site to Harris Road completed in Stage 2 due to large number of injury crashes on this section, providing a completed length from west of Hugh Duncan Street to Harris Road. Informal turnarounds will take place at Harris and Mount Cecil intersections (despite challenging grades), with formal facilities at Moonshine Road and 2/58. TG extent (or Pauatahanui Roundabout if TG interchange not complete) also undertaken due to high injury crash numbers. This section includes a new roundabout at Flightys/Murphys. Turning is well catered for with this new roundabout, plus Moonshine and TG at either end of this section. The section west of Hugh Duncan to Mount Cecil Road is targeted last despite the high number of loss of control crashes, as the injury crash rate per Km is low. This section is very high cost due to the three realignment sections with large scale earthworks. Median barrier provision along this section has little to no effect on access as Hugh Duncan Street and Mount Cecil Road are fully accessible and right turns in to Transpower are accommodated, with right turns out using 2/58 interchange. Remaining 1.3km length between Harris and Moonshine to be undertaken as final stage due to low numbers of injury crashes. Major delays to customers Crash migration Unsafe turning manoeuvres at intersections when not suitable to do so (such as with large vehicles), or U-turning around barrier itself on SH58 which is even less desirable Major delays to customers Crash migration to these two untreated sections is a probable outcome and will need to be proactively addressed. $16.7M 0.0 $22.5M 0.9 Project No.: Page 103 Our ref: SH58 Addendum Report_Final Draft
161 Stage Scour Site Zero Realignment (C) Stage 1 Moonshine Roundabout (F) East of Hugh Duncan Street to SH2/58 extent (A) Stage 2 West of Hugh Duncan to Mount Cecil (B) Stage 3 West of Scour Site to Harris (D) Stage 4 West of Staging: Economic Efficiency Programme Regions Works Description & Staging Justification Risks Expected Cost Harris Moonshine Roundabout (E) to TG to Moonshine Road (G) Realignment of scour site section between Mount Cecil Road and scour site at RP, due to high density of high severity crashes at this location plus need to mitigate undermining of road from stream Moonshine Roundabout required to facilitate turning movements for future stages so undertaken early. For F, roundabout creates major delays to state highway traffic so large travel time cost disbenefits, and VOC disbenefits also. For F, significant crash benefits are achieved on this section with new roundabout and mid block improvements (section length is 500m) East of Hugh Duncan is high cost but delivers significant crash cost benefits as well as travel time benefits through the curve. Only minimal VOC disbenefits from speed increases Very high cost section due to multiple high cost realignments and large earthworks. Benefits are derived through significant travel time savings and crash cost savings, but some disbenefits from wire rope barrier (inconvenience for turning in terms of TTC and VOC) No realignment result sin no travel time savings and median barrier has some travel time and VOC disbenefits Benefits are all derived from mid block crash cost savings For E, median barrier creates some disbenefits for both travel time and VOC. Some minor midblock crash savings are offset the costs and so E is marginally into a non-negative BCR. For G, major travel time costs result, due to the presence of the new roundabout at Flightys/Murphys. The roundabout also creates large VOC disbenefits (due to decelerating / accelerating) For G, this is a long section and so median barrier also results in travel time and VOC disbenefits due to detours for access. Benefits of G are all gained through crash cost savings. Overall, total section costs for E and G significantly outweigh the predicted benefits None project complete This approach is purely theoretical and based on indicative BCRs for each region & stage. This should not be considered a viable staging strategy in isolation Indicative BCR $2.7M 8.6 $6.0M 2.5 $16.9M 1.2 $3.6M 1.1 $18.8M -0.2 Project No.: Page 104 Our ref: SH58 Addendum Report_Final Draft
162 Stage Zero Stage 1 Staging: Community Acceptability Programme Regions Works Description & Staging Justification Risks Scour Site Realignment Moonshine Roundabout (F) West of Scour Site to Harris (D) Service relocations and protections Realignment of scour site section between Mount Cecil Road and scour site at RP, due to high profile high severity crashes at this location (so public acceptance of need) and limited direct impact on one adjacent landowner, and limited effect on turning provisions to private accessways. Moonshine intersection upgraded to roundabout to facilitate turnarounds (from both the Stage 1 works and also for following stages). Moonshine intersection has also been subject to serious injury crashes and does not limit turning arrangements into properties. West of scour site to Harris undertaken early in programme given short length of works and limited number of dwellings affected by land purchase and private accessway turning restrictions (due to presence of median barrier). Section length of 1.8km between median barrier breaks. Right turns into and out of property will not be available and expected that smaller vehicles will use break in barrier at Harris and Mount Cecil to turn, with larger vehicles using Moonshine Roundabout and 2/58 as suitable facilities. Works now complete so limited risks to public acceptability Crash migration Risk that with median barrier installed between Mount Cecil Road and Harris Road, larger vehicles choose to turn at the end of the median barrier where it is unlikely to be suitable to do so (instead of using 2/58 or Moonshine Roundabout Crash migration Major disruption to entire corridor if services relocation / protections are undertaking for the entire corridor length during Stage 1 Expected Cost Indicative BCR $2.7M 8.6 $6.8M 1.0 Stage 2 Stage 3 TG to Moonshine Road (G) West of Hugh Duncan to Mount Cecil (B) Service relocations and protections could be undertaken stage-by-stage or for the entire corridor during Stage 1 and this will need to be reviewed during detailed design to determine the best approach (in terms of minimising disruption and maximising cost effectiveness). Longer section length of 2.6km and multiple properties and side roads affected however turnaround facilities at roundabouts are provided very regularly (at Pauatahanui as part of TG, at Flightys/Murphys) and at Moonshine Road Limited land acquisition required, and scale of earthworks is not significant. No realignment should ensure programme for implementation is not prolonged Limited access implications as very few access demands along this section of highway. Right turns into Transpower are still permitted., with only right turns out restricted (which is already encouraged by Transpower), with turning advised to be undertaken using 2/58 interchange. Despite reasonable turning facilities being available with the 3 roundabout facilities, potential for major public and median dissatisfaction due to median barrier inconvenience along this section. Many residents and businesses effected including numerous businesses with heavy plant. Longer section length means duration of effect is prolonged for residents and businesses on this section, as well as other customers Most challenging section of route in terms of physical works and maintaining traffic flow. Expected to require significant night working due to the level of disruption to traffic. $13.1M -0.3 $16.9M 1.2 Stage 4 East of Hugh Duncan Street to SH2/58 extent (A) West of Harris to Moonshine Roundabout (E) Significant physical works required due to major sections of realignment which will impede customers using SH58 for a prolonged period works duration expected to be longest phase and greatest disruption to customers. East of Hugh Duncan Street has very little effect on property access as no accessways situated along this length. However scale of cut is significant with this section having potential to create considerable delays for customers using SH58, and also impact the operation of the SH2/58 interchange. West of Harris Road to Moonshine Road Roundabout serves a fairly large number of properties on a small section length that will be inconvenienced by the median barrier. This section is likely to prove very unpopular with residents not least because the crashes along this section length are low in comparison to the rest of the project length and residents may question the need given the commensurate level of inconvenience it will create for their travel. Also major visual and environmental challenges with undertaking this section of works which may further complicate. Levels of customer satisfaction and frustration will already be heightened following the Stage 3 works west of Hugh Duncan Street. Additional and intrusive works here with extensive temporary traffic management in place will exacerbate any tensions. $8.5M 1.4 Project No.: Page 105 Our ref: SH58 Addendum Report_Final Draft
163 Appendix F Scheme Drawings Project No.: Page 106 Our ref: SH58 Addendum Report_Final Draft


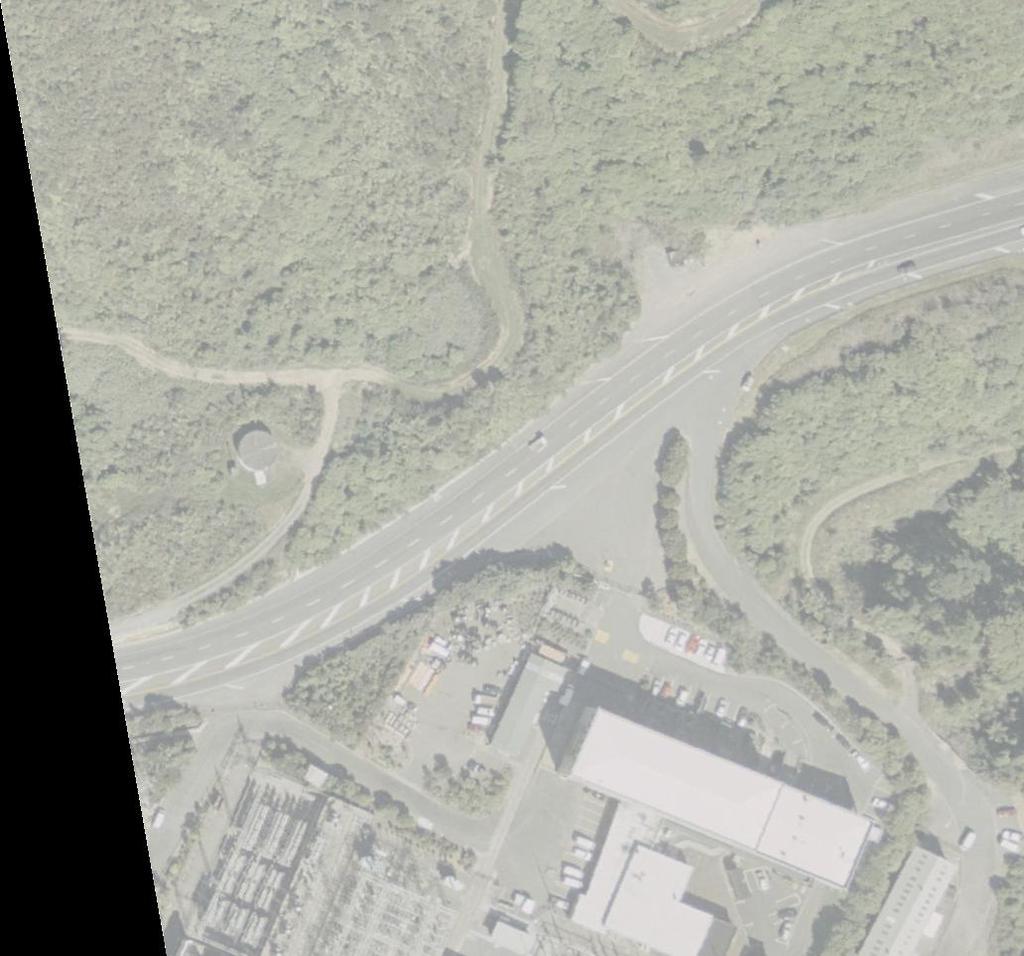
164 A1 NOT FOR CONSTRUCTION WORKING PLOT R NOT APPROVED


165 A1 NOT FOR CONSTRUCTION DRAFT FOR CLIENT NOT APPROVED R


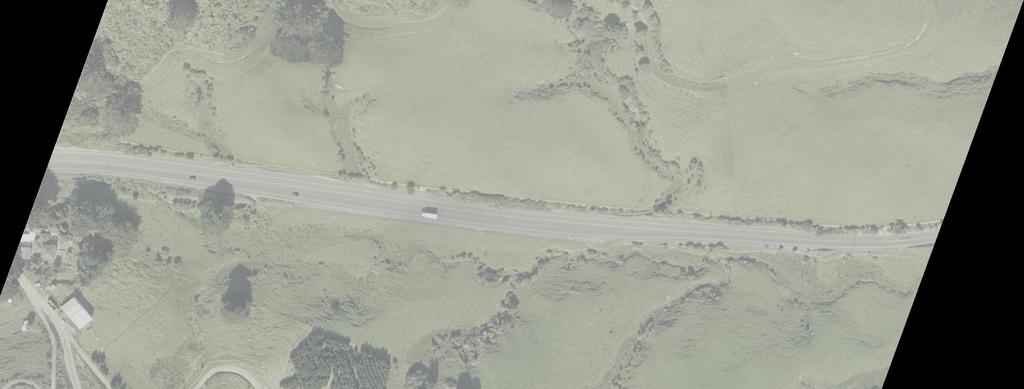


166 A1 NOT FOR CONSTRUCTION DRAFT FOR CLIENT NOT APPROVED R


167 A1 NOT FOR CONSTRUCTION DRAFT FOR CLIENT R NOT APPROVED


168 A1 NOT FOR CONSTRUCTION DRAFT FOR CLIENT NOT APPROVED R


169 A1 NOT FOR CONSTRUCTION DRAFT FOR CLIENT NOT APPROVED R


170 A1 NOT FOR CONSTRUCTION DRAFT FOR CLIENT NOT APPROVED R
SPEED LIMIT CHANGES - RURAL ROADS OFF STATE HIGHWAY 58 AND COROGLEN RISE (OFF AIRLIE ROAD)
") CITY DELIVERY COMMITTEE 1 MARCH 2018 SPEED LIMIT CHANGES - RURAL ROADS OFF STATE HIGHWAY 58 AND COROGLEN RISE (OFF AIRLIE ROAD) PURPOSE The purpose of this report is to seek approval to begin a public
CITY DELIVERY COMMITTEE 1 MARCH 2018 SPEED LIMIT CHANGES - RURAL ROADS OFF STATE HIGHWAY 58 AND COROGLEN RISE (OFF AIRLIE ROAD) PURPOSE The purpose of this report is to seek approval to begin a public
[Insert name] newsletter CALCULATING SAFETY OUTCOMES FOR ROAD PROJECTS. User Manual MONTH YEAR
![[Insert name] newsletter CALCULATING SAFETY OUTCOMES FOR ROAD PROJECTS. User Manual MONTH YEAR](/thumbs/75/72619921.jpg "[Insert name] newsletter CALCULATING SAFETY OUTCOMES FOR ROAD PROJECTS. User Manual MONTH YEAR") [Insert name] newsletter MONTH YEAR CALCULATING SAFETY OUTCOMES FOR ROAD PROJECTS User Manual MAY 2012 Page 2 of 20 Contents 1 Introduction... 4 1.1 Background... 4 1.2 Overview... 4 1.3 When is the Worksheet
[Insert name] newsletter MONTH YEAR CALCULATING SAFETY OUTCOMES FOR ROAD PROJECTS User Manual MAY 2012 Page 2 of 20 Contents 1 Introduction... 4 1.1 Background... 4 1.2 Overview... 4 1.3 When is the Worksheet
The major roadways in the study area are State Route 166 and State Route 33, which are shown on Figure 1-1 and described below:
 3.5 TRAFFIC AND CIRCULATION 3.5.1 Existing Conditions 3.5.1.1 Street Network DRAFT ENVIRONMENTAL IMPACT REPORT The major roadways in the study area are State Route 166 and State Route 33, which are shown
Chairperson and Committee Members REGULATORY MANAGEMENT COMMITTEE 3 SEPTEMBER 2015
 Chairperson and Committee Members REGULATORY MANAGEMENT COMMITTEE 3 SEPTEMBER 2015 SPEED LIMIT CHANGE ON KĀPITI ROAD PURPOSE OF REPORT Meeting Status: Public Purpose of Report: For Decision 1 The purpose
AusRAP assessment of Peak Downs Highway 2013
 AusRAP assessment of Peak Downs Highway 2013 SUMMARY The Royal Automobile Club of Queensland (RACQ) commissioned an AusRAP assessment of Peak Downs Highway based on the irap protocol. The purpose is to
Traffic Counts
 www.trafficcounts.co.nz www.trafficcounts.co.nz Quality Assurance Information Prepared for: Job Number: Prepared by: Reviewed by: Abley Limited 0000 Shane Ingley, Transportation Engineer Courtney Groundwater,
Alberta Infrastructure HIGHWAY GEOMETRIC DESIGN GUIDE AUGUST 1999
 &+$37(5Ã)Ã Alberta Infrastructure HIGHWAY GEOMETRIC DESIGN GUIDE AUGUST 1999 &+$37(5) 52$'6,'()$&,/,7,(6 7$%/(2)&217(176 Section Subject Page Number Page Date F.1 VEHICLE INSPECTION STATIONS... F-3 April
City of Pacific Grove
 Regional Study Utilizing Caltrans Intersection Evaluation Section 7: City of Pacific Grove s: FIRST STREET AT CENTRAL AVENUE Transportation Agency for Monterey County Prepared by Transportation Agency
TRAFFIC IMPACT ANALYSIS
 TRAFFIC IMPACT ANALYSIS Emerald Isle Commercial Development Prepared by SEPI Engineering & Construction Prepared for Ark Consulting Group, PLLC March 2016 I. Executive Summary A. Site Location The Emerald
12 April Leakes Pty Ltd 211 Waverley Road EAST MALVERN VIC Attention: Joseph Nasr. Dear Joe,
 Our Ref: Contact: CG120569:VG Valentine Gnanakone Leakes Pty Ltd 211 Waverley Road EAST MALVERN VIC 3145 Attention: Joseph Nasr Dear Joe, 690 DERRIMUT ROAD PROPOSED RESIDENTIAL SUBDIVISION Further to our
RELEASED UNDER THE OFFICIAL INFORMATION ACT 1982
 Subject MINISTERIAL BRIEFING NOTE Rapid Transit in Auckland Date 1 November 2017 Briefing number BRI-1133 Contact(s) for telephone discussion (if required) Name Position Direct line Cell phone 1 st contact
Safer Journeys and the Safe System Approach
 Safer Journeys and the Safe System Approach Applicability to Low Volume Roads Colin Brodie Lead Advisor: Safety and Environment NZ Transport Agency 2017 Safer Journeys and the Safe System Approach The
Transit City Etobicoke - Finch West LRT
 Delcan Corporation Transit City Etobicoke - Finch West LRT APPENDIX D Microsimulation Traffic Modeling Report March 2010 March 2010 Appendix D CONTENTS 1.0 STUDY CONTEXT... 2 Figure 1 Study Limits... 2
Post Opening Project Evaluation. M6 Toll
 M6 Toll Five Post Years Opening After Study: Project Summary Evaluation Report Post Opening Project Evaluation M6 Toll Five Years After Study Summary Report October 2009 Document History JOB NUMBER: 5081587/905
DEVELOPING A RISK PREDICTION MODEL FOR A SAFE SYSTEM SIGNATURE PROJECT
 DEVELOPING A RISK PREDICTION MODEL FOR A SAFE SYSTEM SIGNATURE PROJECT Authors: Dale Harris (Presenter) BEM, MAppSc, PGDipArt (GIS) Senior GIS Road Safety Analyst Abley Transportation Consultants Ltd Contact:
1 Strategy, Policy & Finance Committee Doc No: RDC November 2017 ROTORUA LAKES COUNCIL
 1 Strategy, Policy & Finance Committee Mayor Chairperson and Members STRATEGY, POLICY & FINANCE COMMITEE ROTORUA LAKES COUNCIL File No: 33-21-030\05 RDC-772522 SPEED LIMIT BYLAW CHANGES TO SPEED LIMITS
SUBMISSION Barton Highway Duplication Planning and Safety Works 15 June 2010
 SUBMISSION Barton Highway Duplication Planning and Safety Works 15 June 2010 Minter Ellison Building, 25 National Circuit, Forrest ACT 2603 P 02 6253 6900 F 02 6253 6999 E ata@atatruck.net.au W www.atatruck.net.au
To: File From: Adrian Soo, P. Eng. Markham, ON File: Date: August 18, 2015
 Memo To: From: Adrian Soo, P. Eng. Markham, ON : 165620021 Date: Reference: E.C. Row Expressway, Dominion Boulevard Interchange, Dougall Avenue Interchange, and Howard 1. Review of Interchange Geometry
committee report General Permitted Development Order SPT response to consultation
 committee report General Permitted Development Order SPT response to consultation Committee Strategy and Programmes Date of meeting 24 June 2011 Date of report 1 June 2011 Report by Assistant Chief Executive
APPENDIX C1 TRAFFIC ANALYSIS DESIGN YEAR TRAFFIC ANALYSIS
 APPENDIX C1 TRAFFIC ANALYSIS DESIGN YEAR TRAFFIC ANALYSIS DESIGN YEAR TRAFFIC ANALYSIS February 2018 Highway & Bridge Project PIN 6754.12 Route 13 Connector Road Chemung County February 2018 Appendix
TRAFFIC IMPACT STUDY VICDOM BROCK ROAD PIT EXPANSION
 TRAFFIC IMPACT STUDY VICDOM BROCK ROAD PIT EXPANSION TOWNSHIP OF UXBRIDGE P/N 05-1993 June 2011 Revised -August 2011 Prepared by: Skelton, Brumwell & Associates Inc. 93 Bell Farm Road, Suite 107 Barrie,
PROPOSED TRAFFIC RESOLUTION
 Reference Number: TR 50-18 Location:, Brooklyn Bus Hub - Brooklyn Proposal: Information: To provide new bus stops to create a Bus hub location on Cleveland Street, Brooklyn, as part of Wellington s new
TRAFFIC ENGINEERING ASSESSMENT MOUNT EDEN ROAD, MOUNT EDEN
 12 September 2017 Iain McManus Civitas Planning Consultants PO Box 47020 Ponsonby AUCKLAND 1144 Dear Iain, TRAFFIC ENGINEERING ASSESSMENT 43-45 45 MOUNT EDEN ROAD, MOUNT EDEN As requested, we have prepared
Locating Ground Mounted Equipment
 Network Asset Technical Document Locating Ground Mounted Equipment Original issue: April 2008 Prepared by: Lee Chan & Robert Rogerson This revision: Original Issue Date for next review: April 2013 Copyright
CITY OF LONDON STRATEGIC MULTI-YEAR BUDGET ADDITIONAL INVESTMENTS BUSINESS CASE # 6
 2016 2019 CITY OF LONDON STRATEGIC MULTI-YEAR BUDGET ADDITIONAL INVESTMENTS BUSINESS CASE # 6 STRATEGIC AREA OF FOCUS: SUB-PRIORITY: STRATEGY: INITIATIVE: INITIATIVE LEAD(S): BUILDING A SUSTAINABLE CITY
RUMBLE STRIPS QUESTIONS AND ANSWERS
 RUMBLE STRIPS QUESTIONS AND ANSWERS Rumble strips are a key safety initiative that help prevent crashes by providing drivers with a wake up call if they stray over the edgeline or centreline. The NZ Transport
RE: A Traffic Impact Statement for a proposed development on Quinpool Road
 James J. Copeland, P.Eng. GRIFFIN transportation group inc. 30 Bonny View Drive Fall River, NS B2T 1R2 May 31, 2018 Ellen O Hara, P.Eng. Project Engineer DesignPoint Engineering & Surveying Ltd. 200 Waterfront
The Engineering Department recommends Council receive this report for information.
 CORPORATE REPORT NO: R161 COUNCIL DATE: July 23, 2018 REGULAR COUNCIL TO: Mayor & Council DATE: July 19, 2018 FROM: General Manager, Engineering FILE: 8740-01 SUBJECT: Surrey Long-Range Rapid Transit Vision
TECHNICAL MEMORANDUM. Part A: Introduction
 TECHNICAL MEMORANDUM To: David J. Decker Decker Properties, Inc. 5950 Seminole Centre Ct. Suite 200 Madison, Wisconsin 53711 608-663-1218 Fax: 608-663-1226 www.klengineering.com From: Mike Scarmon, P.E.,
Project Manager: Neil Beckett. Prepared by: Bernadette Bañez. Reviewed by: Neil Beckett. Approved for issue by: David Darwin
 Annual Weigh-In-Motion (WiM) Report 2010 This report has been prepared for the benefit of the NZ Transport Agency (NZTA). No liability is accepted by this company or any employee or sub-consultant of this
Appendix J Traffic Impact Study
 MRI May 2012 Appendix J Traffic Impact Study Level 2 Traffic Assessment Limited Impact Review Appendix J [This page was left blank intentionally.] www.sgm-inc.com Figure 1. Site Driveway and Trail Crossing
ENVIRONMENTAL IMPACT STATEMENT
 RED HILL MINING LEASE ENVIRONMENTAL IMPACT STATEMENT Section 14 Transport Section 14 Transport 14.1 Description of Environmental Values This section of the Red Hill Mining Lease Environmental Impact Statement
Table of Contents INTRODUCTION... 3 PROJECT STUDY AREA Figure 1 Vicinity Map Study Area... 4 EXISTING CONDITIONS... 5 TRAFFIC OPERATIONS...
 Crosshaven Drive Corridor Study City of Vestavia Hills, Alabama Table of Contents INTRODUCTION... 3 PROJECT STUDY AREA... 3 Figure 1 Vicinity Map Study Area... 4 EXISTING CONDITIONS... 5 TRAFFIC OPERATIONS...
EXECUTIVE SUMMARY. The following is an outline of the traffic analysis performed by Hales Engineering for the traffic conditions of this project.
 EXECUTIVE SUMMARY This study addresses the traffic impacts associated with the proposed Shopko redevelopment located in Sugarhouse, Utah. The Shopko redevelopment project is located between 1300 East and
City of Palo Alto (ID # 6416) City Council Staff Report
 City Council Staff Report") City of Palo Alto (ID # 6416) City Council Staff Report Report Type: Informational Report Meeting Date: 1/25/2016 Summary Title: Update on Second Transmission Line Title: Update on Progress Towards Building
City of Palo Alto (ID # 6416) City Council Staff Report Report Type: Informational Report Meeting Date: 1/25/2016 Summary Title: Update on Second Transmission Line Title: Update on Progress Towards Building
Clean Harbors Canada, Inc.
 Clean Harbors Canada, Inc. Proposed Lambton Landfill Expansion Environmental Assessment Terms of Reference Transportation Assessment St. Clair Township, Ontario September 2009 itrans Consulting Inc. 260
Reducing Speed Limits to Support Lower Skid Resistance Investigatory Levels. Fergus Tate National Traffic and Safety Manager NZTA
 Reducing Speed Limits to Support Lower Skid Resistance Investigatory Levels Fergus Tate National Traffic and Safety Manager NZTA Presentation Outline: Background Research questions Requirements of analysis
LAWRENCE TRANSIT CENTER LOCATION ANALYSIS 9 TH STREET & ROCKLEDGE ROAD / 21 ST STREET & IOWA STREET LAWRENCE, KANSAS
 LAWRENCE TRANSIT CENTER LOCATION ANALYSIS 9 TH STREET & ROCKLEDGE ROAD / 21 ST STREET & IOWA STREET LAWRENCE, KANSAS TRAFFIC IMPACT STUDY FEBRUARY 214 OA Project No. 213-542 TABLE OF CONTENTS 1. INTRODUCTION...
TRAFFIC IMPACT STUDY. USD #497 Warehouse and Bus Site
 TRAFFIC IMPACT STUDY for USD #497 Warehouse and Bus Site Prepared by: Jason Hoskinson, PE, PTOE BG Project No. 16-12L July 8, 216 145 Wakarusa Drive Lawrence, Kansas 6649 T: 785.749.4474 F: 785.749.734
TRANSPORTATION REVIEW
 TRANSPORTATION REVIEW - PROPOSED MIX OF LAND USES IS CONSISTENT WITH THE CITY S UNDER THE GRANVILLE BRIDGE POLICIES THAT AIM TO MEET NEIGHBOURING RESIDENTS SHOPPING NEEDS AND REDUCE RELIANCE ON AUTOMOBILE
BARRHAVEN FELLOWSHIP CRC 3058 JOCKVALE ROAD OTTAWA, ONTARIO TRANSPORTATION BRIEF. Prepared for:
 BARRHAVEN FELLOWSHIP CRC 3058 JOCKVALE ROAD OTTAWA, ONTARIO TRANSPORTATION BRIEF Prepared for: Barrhaven Fellowship CRC 3058 Jockvale Road Ottawa, ON K2J 2W7 December 7, 2016 116-649 Report_1.doc D. J.
Metropolitan Freeway System 2013 Congestion Report
 Metropolitan Freeway System 2013 Congestion Report Metro District Office of Operations and Maintenance Regional Transportation Management Center May 2014 Table of Contents PURPOSE AND NEED... 1 INTRODUCTION...
Executive Summary. Draft Environmental Impact Statement/Environmental Impact Report ES-1
 Executive Summary Introduction The Eastside Transit Corridor Phase 2 Project is a vital public transit infrastructure investment that would provide a transit connection to the existing Metro Gold Line
54 Parkway Drive, Rosedale Proposed Residential / Commercial Development. Transportation Assessment Report. 30 April 2018
 54 Parkway Drive, Rosedale Proposed Residential / Commercial Development Transportation Assessment Report 30 April 2018 Project: Report title: Document reference: 54 Parkway Drive, Rosedale Transportation
Alpine Highway to North County Boulevard Connector Study
 Alpine Highway to North County Boulevard Connector Study prepared by Avenue Consultants March 16, 2017 North County Boulevard Connector Study March 16, 2017 Table of Contents 1 Summary of Findings... 1
SOUTHERN GATEWAY. Transportation and Trinity River Project Committee 11 May 2015
 SOUTHERN GATEWAY Transportation and Trinity River Project Committee 11 May 2015 Southern Gateway Project History Began in 2001 as a Major Investment Study [ MIS ], Schematic, and Environmental Assessment
Location Concept Plan Amendment Recommendation Approved 2011 Concept Plan
 Valley Line West LRT Concept Plan Recommended Amendments Lewis Farms LRT Terminus Site Location Concept Plan Amendment Recommendation Approved 2011 Concept Plan Lewis Farms LRT terminus site, 87 Avenue/West
Powering Sydney s Future
 Powering Sydney s Future Frequently Asked Questions December 2017 Project background Q: Why is this project needed? A: Inner Sydney is one of the most critical parts of the NSW electricity network. However,
FEASIBILITY LAND TRANSPORTATION VENTUS ENERGY. from. covering WIND TURBINE EQUIPMENT PORT OF MOUNT MAUNGANUI TO KAIMAI RANGE SITE. for.
 FEASIBILITY from covering LAND TRANSPORTATION Of WIND TURBINE EQUIPMENT PORT OF MOUNT MAUNGANUI TO KAIMAI RANGE SITE for VENTUS ENERGY September 2018 TABLE OF CONTENTS 1. PURPOSE AND SCOPE... 1 1.1. Purpose...
105 Toronto Street South, Markdale Transportation Impact Study. Paradigm Transportation Solutions Limited
 105 Toronto Street South, Markdale Transportation Impact Study Paradigm Transportation Solutions Limited December 2016 Project Summary Project Number 162060 December 2016 Client Zelinka Priamo Ltd 318
Conventional Approach
 Session 6 Jack Broz, PE, HR Green May 5-7, 2010 Conventional Approach Classification required by Federal law General Categories: Arterial Collector Local 6-1 Functional Classifications Changing Road Classification
Waco Rapid Transit Corridor (RTC) Feasibility Study
 Feasibility Study") Waco Rapid Transit Corridor (RTC) Feasibility Study Chris Evilia, Director of Waco Metropolitan Planning Organization Allen Hunter, General Manager Waco Transit System Jimi Mitchell, Project Manager AECOM
Waco Rapid Transit Corridor (RTC) Feasibility Study Chris Evilia, Director of Waco Metropolitan Planning Organization Allen Hunter, General Manager Waco Transit System Jimi Mitchell, Project Manager AECOM
Submission on the Wellington Town Belt Bill. Local Government and Environment Select Committee Parliament Buildings Wellington
 Wellington Electricity Lines Ltd 2 Submission on the Wellington Town Belt Bill To: Name: Local Government and Environment Select Committee Parliament Buildings Wellington Wellington Electricity Lines Limited
Traffic Impact Study Speedway Gas Station Redevelopment
 Traffic Impact Study Speedway Gas Station Redevelopment Warrenville, Illinois Prepared For: Prepared By: April 11, 2018 Table of Contents 1. Introduction... 1 2. Existing Conditions... 4 Site Location...
Guidelines for Retro-fitting Existing Roads to Optimise Safety Benefits. A Practitioners Experience and Assessment of Options for Improvement.
 Guidelines for Retro-fitting Existing Roads to Optimise Safety Benefits. A Practitioners Experience and Assessment of Options for Improvement. Author: Stephen Levett, Manager, Safer Roads Policy, Standards
2016 Congestion Report
 2016 Congestion Report Metropolitan Freeway System May 2017 2016 Congestion Report 1 Table of Contents Purpose and Need...3 Introduction...3 Methodology...4 2016 Results...5 Explanation of Percentage Miles
PROMOTING THE UPTAKE OF ELECTRIC AND OTHER LOW EMISSION VEHICLES
 Chair Cabinet Economic Growth and Infrastructure Committee Office of the Minister of Transport Office of the Minister of Energy and Resources PROMOTING THE UPTAKE OF ELECTRIC AND OTHER LOW EMISSION VEHICLES
TRAFFIC CALMING PROGRAM
 TRAFFIC CALMING PROGRAM PROGRAM BASICS Mount Pleasant Transportation Department 100 Ann Edwards Lane Mt. Pleasant, SC 29465 Tel: 843-856-3080 www.tompsc.com The Town of Mount Pleasant has adopted a traffic
Designation of a Community Safety Zone in Honey Harbour in the Township of Georgian Bay
 TO: FROM: Chair and Members Engineering and Public Works Committee Mark Misko, C.E.T. Manager, Roads Maintenance and Construction DATE: March 23, 2016 SUBJECT: REPORT NO: Designation of a Community Safety
Re: Addendum No. 4 Transportation Overview 146 Mountshannon Drive Ottawa, Ontario
 April 18 th, 2017 Mr. Kevin Yemm Vice President, Land Development Richraft Group of Companies 2280 St. Laurent Boulevard, Suite 201 Ottawa, Ontario (Tel: 613.739.7111 / e-mail: keviny@richcraft.com) Re:
Downtown One Way Street Conversion Technical Feasibility Report
 Downtown One Way Street Conversion Technical Feasibility Report As part of the City s Transportation Master Plan, this report reviews the technical feasibility of the proposed conversion of the current
TORONTO TRANSIT COMMISSION REPORT NO.
 Form Revised: February 2005 TORONTO TRANSIT COMMISSION REPORT NO. MEETING DATE: October 24, 2012 SUBJECT: DOWNTOWN RAPID TRANSIT EXPANSION STUDY (DRTES) PHASE 1 STRATEGIC PLAN ACTION ITEM RECOMMENDATIONS
Heavy Truck Conflicts at Expressway On-Ramps Part 1
 Heavy Truck Conflicts at Expressway On-Ramps Part 1 Posting Date: 7-Dec-2016; Revised 14-Dec-2016 Figure 1: Every day vast numbers of large and long trucks must enter smoothly into high speed truck traffic
INDUSTRIAL DEVELOPMENT
 INDUSTRIAL DEVELOPMENT Traffic Impact Study Plainfield, Illinois August 2018 Prepared for: Seefried Industrial Properties, Inc. TABLE OF CONTENTS Executive Summary 2 Introduction 3 Existing Conditions
Traffic Engineering Study
 Traffic Engineering Study Bellaire Boulevard Prepared For: International Management District Technical Services, Inc. Texas Registered Engineering Firm F-3580 November 2009 Executive Summary has been requested
Escondido Marriott Hotel and Mixed-Use Condominium Project TRAFFIC IMPACT ANALYSIS REPORT
 Escondido Marriott Hotel and Mixed-Use Condominium Project TRAFFIC IMPACT ANALYSIS REPORT Prepared for Phelps Program Management 420 Sixth Avenue, Greeley, CO 80632 Prepared by 5050 Avenida Encinas, Suite
APPENDIX B Traffic Analysis
 APPENDIX B Traffic Analysis Rim of the World Unified School District Reconfiguration Prepared for: Rim of the World School District 27315 North Bay Road, Blue Jay, CA 92317 Prepared by: 400 Oceangate,
MINERVA PARK SITE TRAFFIC IMPACT STUDY M/I HOMES. September 2, 2015
 5500 New Albany Road Columbus, Ohio 43054 Phone: 614.775.4500 Fax: 614.775.4800 Toll Free: 1-888-775-EMHT emht.com 2015-1008 MINERVA PARK SITE TRAFFIC IMPACT STUDY M/I HOMES September 2, 2015 Engineers
TRAFFIC IMPACT STUDY DERRY GREEN CORPORATE BUSINESS PARK MILTON SECONDARY PLAN MODIFICATION
 TRAFFIC IMPACT STUDY DERRY GREEN CORPORATE BUSINESS PARK MILTON SECONDARY PLAN MODIFICATION TRAFFIC IMPACT STUDY DERRY GREEN CORPORATE BUSINESS PARK MILTON SECONDARY PLAN MODIFICATION DECEMBER 24 UPDATED
COUNTY ROAD SPEED LIMITS. Policy 817 i
 Table of Contents COUNTY ROAD SPEED LIMITS Policy 817.1 PURPOSE... 1.2 APPLICABILITY... 1.3 DEFINITIONS... 1.4 STATE ENABLING LEGISLATION... 2.5 SPEED LIMITS ON COUNTY ROADS (CCC 11.04)... 2.6 ESTABLISHING
COUNTY ROAD SPEED LIMITS. Policy 817 i
 Table of Contents COUNTY ROAD SPEED LIMITS Policy 817.1 PURPOSE... 2.2 APPLICABILITY... 2.3 DEFINITIONS... 2.4 STATE ENABLING LEGISLATION... 3.5 SPEED LIMITS ON COUNTY ROADS (CCC 11.04)... 3.6 ESTABLISHING
EXCEPTION TO STANDARDS REPORT
 EXCEPTION TO STANDARDS REPORT PROJECT DESCRIPTION AND NEED The project is located in Section 6, Township 23 North, Range 9 East and Section 31 Township 24 North, Range 9 East, in the Town of Stockton,
IMPROVEMENT CONCEPTS
 IMPROVEMENT CONCEPTS for the South Novato Transit Hub Study Prepared by: January 11, 2010 DKS Associates With Wilbur Smith Associates IMPROVEMENT CONCEPTS Chapter 1: Introduction 1. INTRODUCTION The strategic
King Soopers #116 Thornton, Colorado
 Traffic Impact Study King Soopers #116 Thornton, Colorado Prepared for: Galloway & Company, Inc. T R A F F I C I M P A C T S T U D Y King Soopers #116 Thornton, Colorado Prepared for Galloway & Company
TORONTO TRANSIT COMMISSION REPORT NO.
 Revised: March/13 TORONTO TRANSIT COMMISSION REPORT NO. MEETING DATE: March 26, 2014 SUBJECT: COMMUNITY BUS SERVICES ACTION ITEM RECOMMENDATION It is recommended that the Board not approve any routing
FLAMBOROUGH QUARRY HAUL ROUTE STUDY HAUL ROUTE VIBRATION REPORT. itrans Consulting Inc 100 York Boulevard Richmond Hill, Ontario L4B 1J8
 FINAL REPORT FLAMBOROUGH QUARRY HAUL ROUTE STUDY HAUL ROUTE VIBRATION REPORT Project Number: #W08-5107A August 28, 2008 SUBMITTED TO: Tara Erwin itrans Consulting Inc 100 York Boulevard Richmond Hill,
This overview accompanies, and sets in context, the public consultation (yellow) draft of
 draft of") : Setting of Speed Limits 2017 Setting of Speed Limits [2017] to the Rule This overview accompanies, and sets in context, the public consultation (yellow) draft of : Setting of Speed Limits [2017]. The
: Setting of Speed Limits 2017 Setting of Speed Limits [2017] to the Rule This overview accompanies, and sets in context, the public consultation (yellow) draft of : Setting of Speed Limits [2017]. The
Road Condition Assessment and Road Contributions Study. 270 Grants Road, Somersby. June 2015 Our Ref: SY140135
 Condition Assessment and Contributions Study 270 June 2015 Our Ref: SY140135 Copyright Barker Ryan Stewart Pty Ltd 2015 All Rights Reserved Project No. SY140135 Author DH Checked PM Approved GB Rev No.
Traffic and Toll Revenue Estimates
 The results of WSA s assessment of traffic and toll revenue characteristics of the proposed LBJ (MLs) are presented in this chapter. As discussed in Chapter 1, Alternatives 2 and 6 were selected as the
CITY OF VANCOUVER ADMINISTRATIVE REPORT
 Supports Item No. 1 T&T Committee Agenda May 13, 2008 CITY OF VANCOUVER ADMINISTRATIVE REPORT Report Date: April 29, 2008 Author: Don Klimchuk Phone No.: 604.873.7345 RTS No.: 07283 VanRIMS No.: 13-1400-10
ANDERSON PROPERTY SITE ANALYSIS
 ANDERSON PROPERTY SITE ANALYSIS Introduction The Montgomery County Department of Transportation (MCDOT) initiated a feasibility study in the fall of 2012 to evaluate the need for transit service expansion
Residential Development Bearna Engineering Services Report
 Residential Development Bearna Engineering Services Report APPENDIX D Job No: B861G TRAFFIC REPORT TRAFFIC IMPACT ASSESSMENT RESIDENTIAL DEVELOPMENT, BEARNA, CO. GALWAY Burkeway Homes Project No. B861
Aging of the light vehicle fleet May 2011
 Aging of the light vehicle fleet May 211 1 The Scope At an average age of 12.7 years in 21, New Zealand has one of the oldest light vehicle fleets in the developed world. This report looks at some of the
DRIVER SPEED COMPLIANCE WITHIN SCHOOL ZONES AND EFFECTS OF 40 PAINTED SPEED LIMIT ON DRIVER SPEED BEHAVIOURS Tony Radalj Main Roads Western Australia
 DRIVER SPEED COMPLIANCE WITHIN SCHOOL ZONES AND EFFECTS OF 4 PAINTED SPEED LIMIT ON DRIVER SPEED BEHAVIOURS Tony Radalj Main Roads Western Australia ABSTRACT Two speed surveys were conducted on nineteen
Date: February 7, 2017 John Doyle, Z-Best Products Robert Del Rio. T.E. Z-Best Traffic Operations and Site Access Analysis
 Memorandum Date: February 7, 07 To: From: Subject: John Doyle, Z-Best Products Robert Del Rio. T.E. Z-Best Traffic Operations and Site Access Analysis Introduction Hexagon Transportation Consultants, Inc.
Draft Marrickville Car Share Policy 2014
 Draft Marrickville Car Share Policy 2014 1. Background 1.1. Marrickville Council has supported car sharing in the LGA since 2007 as part of a holistic approach to encouraging more sustainable modes of
APPENDIX E. Traffic Analysis Report
 APPENDIX E Traffic Analysis Report THIS PAGE INTENTIONALLY BLANK EAGLE RIVER TRAFFIC MITIGATION PHASE I OLD GLENN HIGHWAY/EAGLE RIVER ROAD INTERSECTION IMPROVEMENTS TRAFFIC ANALYSIS Eagle River, Alaska
Craig Scheffler, P.E., PTOE HNTB North Carolina, P.C. HNTB Project File: Subject
 TECHNICAL MEMORANDUM To Kumar Neppalli Traffic Engineering Manager Town of Chapel Hill From Craig Scheffler, P.E., PTOE HNTB North Carolina, P.C. Cc HNTB Project File: 38435 Subject Obey Creek TIS 2022
Craigieburn Employment Precinct North and English Street
 Craigieburn Employment Precinct North and English Street METROPOLITAN PLANNING AUTHORITY Intersection Analyses 7 February 2014 Intersection Analyses Craigieburn Employment Precinct North and English Street
Background. Request for Decision. Pedestrian Lighting Standards for Road Right-of-ways. Recommendation. Presented: Monday, Mar 17, 2014
 Presented To: Operations Committee Request for Decision Pedestrian Lighting Standards for Road Right-of-ways Presented: Monday, Mar 17, 2014 Report Date Thursday, Mar 06, 2014 Type: Presentations Recommendation
US 81 Bypass of Chickasha Environmental Assessment Public Meeting
 US 81 Bypass of Chickasha Environmental Assessment Public Meeting March 14, 2013 Introductions ODOT FHWA SAIC Meeting Purpose Present need for bypass Provide responses to 10/04/11 public meeting comments
WATFORD LOCAL PLAN PART 2. Review of Car Parking Policy and Standards. Evidence Base. February 2012
 WATFORD LOCAL PLAN PART 2 Review of Car Parking Policy and Standards Evidence Base February 2012 1.0 Background 1.1 The Watford District Plan 2000 contains various policies relating to the provision of
Airport Road Improvements
 Airport Road Improvements October 2015 ENVIRONMENTAL STUDY REPORT Airport Road from 1.0 km north of Mayfield to 0.6 km north of King Street Town of Caledon D TRAFFIC STUDY & ROUNDABOUT EVALUATIONS Airport
V. DEVELOPMENT OF CONCEPTS
 Martin Luther King, Jr. Drive Extension FINAL Feasibility Study Page 9 V. DEVELOPMENT OF CONCEPTS Throughout the study process several alternative alignments were developed and eliminated. Initial discussion
I, Tim Macindoe, Associate Minister of Transport, make the following ordinary Rule:
 WELLINGTON, NEW ZEALAND PURSUANT to sections 152, 157(d) and (e), and 160(4) of the Land Transport Act 1998, and after having had regard to the criteria specified in section 164(2) of that Act I, Tim Macindoe,
Corridor Sketch Summary
 Corridor Sketch Summary SR 241: I-82 Jct (Sunnyside) to SR 24 Jct Corridor Highway No. 241 Mileposts: 7.53 to 25.21 Length: 17.65 miles Corridor Description The seventeen and one-half mile corridor begins
Town of Londonderry, New Hampshire NH Route 28 Western Segment Traffic Impact Fee Methodology
 Town of Londonderry, New Hampshire NH Route 28 Western Segment Traffic Impact Fee Methodology Prepared by the Londonderry Community Development Department Planning & Economic Development Division Based
safedirection.com.au Ref: PM 017/02
 DISTRIBUTOR 0 Product Manual Ref: PM 017/02 Table of Contents 1.0 Introduction... 3 2.0 The... 3 3.0 How the Functions... 4 4.0 Crash Test Performance... 4 5.0 Characteristics of Terminals... 5 5.1 Gating
POLICY FOR THE ESTABLISHMENT AND POSTING OF SPEED LIMITS ON COUNTY AND TOWNSHIP HIGHWAYS WITHIN MCHENRY COUNTY, ILLINOIS
 POLICY FOR THE ESTABLISHMENT AND POSTING OF SPEED LIMITS ON COUNTY AND TOWNSHIP HIGHWAYS WITHIN MCHENRY COUNTY, ILLINOIS MCHENRY COUNTY DIVISION OF TRANSPORTATION 16111 NELSON ROAD WOODSTOCK, IL 60098
Proposed location of Camp Parkway Commerce Center. Vicinity map of Camp Parkway Commerce Center Southampton County, VA
 Proposed location of Camp Parkway Commerce Center Vicinity map of Camp Parkway Commerce Center Southampton County, VA Camp Parkway Commerce Center is a proposed distribution and industrial center to be