Tennessee Gas Pipeline Fall Operations Update Webex October 25, 2016
|
|
|
- Wilfrid Douglas
- 5 years ago
- Views:
Transcription

1 1 Tennessee Gas Pipeline 2016 Fall Operations Update Webex October 25, 2016
2 Agenda Sherri Glazebrook Director, Trans and Storage Svc, TGP & SNG, KMI East Region Brian Merchant Director, Engineering Gas Control, KMI East Region Cathy Soape Hutton Manager, Trans and Storage Svc, KMI East Region Welcome TGP System Overview Winter Look Back ( 15/ 16) Summer Look Back ( 16) Scheduled Maintenance Remaining Scheduling Update
3 TGP System Overview


4 Tennessee Gas Pipeline System Overview Proudly providing reliable service for over 70 years 11,900 miles of pipeline 96 Bcf of storage capacity ~9.6 Bcf/d design capacity Abundant & Growing Supply Utica Shale Northeast Marcellus Shale Haynesville Shale Southeast EagleFord Shale 4
5 Changing TGP Operations Line Line 300 Line 300 Line 300 Line 100 Line 800 Line 500 Line 500 Line 100 Line 800 Line 500 Line Designed to deliver TX/LA supply to Northeast markets High utilization of 100/800/500 lines, high seasonal utilization of 200 and 300 lines Consistent imports on the Niagara Spur Shale Supply: Marcellus via 300 Line ~3.2 Bcf/d, Marcellus via Broad Run ~400k, and Utica via 200 Line ~1.3 Bcf/d Serving Markets across system; LDC s, Power Plants, Pipeline Interconnects. System Flows have reversed on much of the System: 317 -> 219 ->100/500/800 lines High System Utilization Year Round Consistent exports on Niagara Spur 5
6 MDth/d TGP Increasing Annual Deliveries 9,000 8, % +6% +1% 7,000 6,000 5,000 4,000 3,000 2,000 Zone 6 Zone 5 Zone 4 Zone 3 Zone 2 Zone 1 Zone L Zone 0 1, YTD *YTD through September 6
7 Winter Look Back Summary Projects Placed In-Service(11/1/15): Horsepower Replacement at Compressor Station 245 Broad Run Flex Project (~590K/d Capacity) Niagara Expansion Project (~158K/d Capacity) Peak Day was ~10.3 Bcfd on Jan 19, Deliveries Peak Day was ~1.3 Bcfd on Jan 22, 2016 Storage (withdrawal) Peak Day was ~1.9 Bcfd on Feb 9, 2016 Power Plant Load Winter OFO count 21 Total OFO s in 2015/16 vs 16 Total OFO s in 2014/ /2016 Zones 5 & 6-15 vs 11 in 2014/ OFO s were directed at power plants (Dec/Jan) vs 5 in 2014/ /2016 All other zones - 6 vs 5 in 2014/2015 Storage Inventories remained at high levels 29% higher than the levels for 2014/15 and 45% higher than 2013/14. System Challenges Short Term Unit/Pipeline Issues Continuous communication between Commercial, Scheduling and Gas Control Groups
8 Winter Summary - System Deliveries % Change LDC 2,046 2,087 1,657-21% Power 1,096 1,258 1,375 +9% Interconnects 4,841 5,014 5,397 +8% Other* % TOTAL 8,192 8,598 8,795 +2% Volumes are MDth/d *Other includes fuel, storage and industrial 8
9 MDth/d Winter Total System Power Deliveries 1,600 1,400 1,200-2% +14% +9% 1, Zone 6 Zone 5 Zone 4 Zone 2 Zone 1 Zone
10 HDDs New England Weather Winter 2015/16 Winter 2014/15 Winter 2013/14 Winter 2012/13 30 Year Average Nov Dec Jan Feb Mar 10
11 Winter Northeast Market Deliveries % Change LDC 1,467 1,511 1,180-22% Power % Interconnects 1, ,485 +9% TOTAL 3,057 3,187 2,992-6% Volumes are MDth/d 11
12 MDth/d Winter North Supply Analysis 6, % 5, % 4,000 3,000 2,000 1, % Wright Utica Shelton Rex Marcellus Distrigas Dracut Broad Run Winter Period (Nov-Mar) Average MDth/d 12
13 Summer Look back Summary System Demand relatively flat to previous year Power Loads Increased / LDC Loads Decreased Northeast Market Demand experienced slight increase Increase in Pipeline Interconnect deliveries Summer OFO count 21 Total OFO s in 2016 vs 15 Total OFO s in Zones 5 & 6-6 vs 8 in OFO s were directed at power plants 2015; 3 in All other zones - 15 through ; vs 7 in 2015 Storage Inventories remained at high levels for % higher going into summer compared to % higher going into summer compared to 2014 System Challenges Maintenance High Storage Inventory in Northern Storage Fields
14 Summer Summary - System Deliveries * % Change LDC % Power 1,296 1,584 1, % Interconnects 4,445 4,680 4,719 +1% Other** % TOTAL 7,110 7,632 7,586-1% Volumes are MDth/d **Other includes fuel, storage and industrial * Through September 14
15 MDth/d Summer Total System Power Deliveries 2,000 1,800 1, % +15% 1,400 1,200 1, Zone 6 Zone 5 Zone 4 Zone 2 Zone 1 Zone * * Through September 15

16 Power Generation Peak Days
17 Summer Northeast Market Deliveries * % Change LDC % Power % Interconnects 1,249 1,245 1, % TOTAL 2,313 2,326 2,462 6% Volumes are MDth/d * Through September 17
18 MDth/d Summer North Supply Analysis 5, % 4, % +16% 4,000 3,500 3,000 2, % +41% +17% Cobb Cornwell Distrigas Dracut Marcellus 2,000 1,500 Rex Shelton Utica 1,000 Wright * Summer Period (Apr-Oct) Average MDth/d * Through September 18
19 Remaining Scheduled Maintenance 19

20 EBB Website 20

21 Impact Report Next Week Outages Segment Design Capacity Available Capacity & Amount reduced by 21

22 Impact Report Monthly Report 22
 MLV 821-1 (8/29/2016 11/5/2016)")
23 Zone 0 & L November/December Pipe Replacement/ Pipe Painting (M) MLV (8/29/ /5/2016) 23
 Capacity of 2,363k reduced to 1,800k (seg.")
24 Zone 1 November/December ESD Test Sta. 87 (11/16/2016) Capacity of 2,363k reduced to 1,800k (seg. 187 BH) ILI/ Cleaning Pig MLV to (11/2/2016, 11/7/2016 & 11/9/2016) 24
 Hydrotest MLV 96-2 to MLV 102-2 (6/8/2016 11/5/2016) Capacity of 2,363k reduced to 2,100k (seg. 187 BH) Unit Maintenance Sta.")
25 Zone 2 & 3 November/December ILI/Cleaning Pig MLV 200-1S to MLV (11/9/2016) Capacity of 2,363k reduced to 1,850k (seg. 187 BH) Hydrotest MLV 96-2 to MLV (6/8/ /5/2016) Capacity of 2,363k reduced to 2,100k (seg. 187 BH) Unit Maintenance Sta.96-2D (10/24/ /7/2016) Capacity of 2,363k reduced to 2,100k (seg. 187 BH) ILI/Cleaning Pig MLV 121-2A to MLV Day TBD (10/31/ /8/2016) Capacity of 714k reduced to 350k (seg. 114 BH) 25
 Capacity of 1,846 reduced to 1,820 (seg. 204 BH) Station Outage Sta.")
26 Zone 4 November/December Station Outage Sta. 317 (12/10/ /12/2016) Capacity of 1,774 reduced to 1,700 (seg. 315 BH) Foundation Repair Sta A (10/10/ /2/2016) Capacity of 1,846 reduced to 1,820 (seg. 204 BH) Station Outage Sta. 204 (11/15/ /18/2016) Capacity of 1,846 reduced to 1,420 (seg. 204 BH) 26
27 WINTER READINESS 27
28 Winter Readiness - Operations Scheduled Maintenance All routine compressor station maintenance shall be completed by early November. Examples include: Station/Unit Protective Devices Compressor maintenance Boroscope Inspections Device Calibration/Testing Test run units (as applicable) All routine pipeline and meter station maintenance shall be completed by early November. Examples include: Annual Valve Maintenance Auto Closure Checks Boiler Maintenance Device Calibration/Meter Tests (Ongoing) Winter Event Preparation Check/Test run emergency equipment (i.e. generators, heaters, etc) Field Operations will be on site at key compressor stations during significant winter events.
29 SCHEDULING 29
30 Winter Days % Restricted Nov - Mar

31 Winter Overview Storage Percent Full 31
32 OFO Winter Count Nov - Mar OFO Types 2013/ / /16 Monthly Action CD CD Balancing Hourly Total


33 DISTRIGAS SCHEDULED FLOWS 2013/14 vs 2014/15 vs 2015/16 (DTH) 33


34 MARITIMES DRACUT SCHEDULED FLOWS 2013/14 vs 2014/15 vs 2015/16 (DTH) 34

35 Summer Days % Restricted Apr - Oct

36 Summer Overview Storage Percent Full 36
37 OFO Summer Count Apr Oct* OFO Types Monthly Action CD CD Balancing Hourly Total * 37
38 Possible Scheduling Processes Implemented during Winter No delivery nominations allowed at Receipt Meters No receipt nominations allowed at Delivery Meters No meter bounces allowed at Power Plants Meters held to EPSQ Restriction locations adjusted as capacity utilization changes Limitations of Storage Services/Linepack Services Imbalance Warnings Monthly OFOs Daily OFOs Meter Specific OFOs Hourly OFOs 38
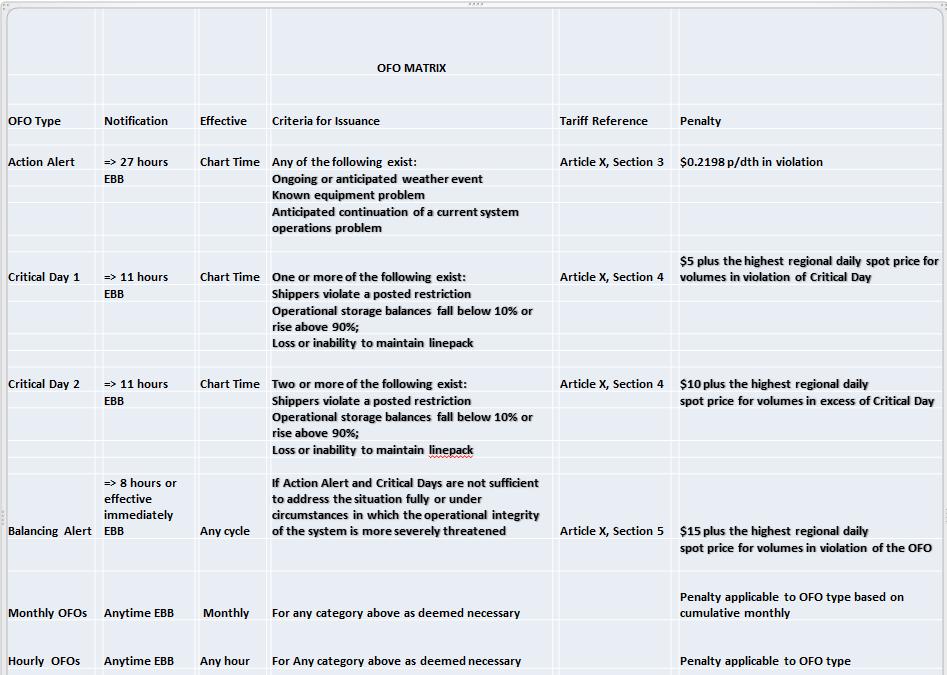
39 Operational Flow Orders 39
40
41 CURRENT TGP SEGMENT MAP NORTH OF STA 87
42 TGP SEGMENT MAP WITH NEW SEGMENTS EFF Segment 345 Segment IROQUOIS/Shelton CONNNG/Milford CT YANK/Derby CT YANK/Wallingford CT CONN/New Britain CT CONN/Farmington CT CONNNG/Bloomfield CT CONNNG/N Bloomfield CT YANK/East Granby Pool 300 L Z6 Segment 110 Segment 111 Segment Col Gas/TGP Greenup OLIVHILL/Olive KY Col Gas/Mavity Pool 100 L Z LVILBrik/Grahn Brickyard MPC/UDP Naples Grayson/Grayson KY BigSandy/Glancy Riverside/Lawrence
43 Questions? 43
Tennessee Gas Pipeline. Enfield Customer Meeting October 19, 2016
 1 Tennessee Gas Pipeline Enfield Customer Meeting October 19, 2016 Agenda Brian Merchant Director, Engineering Gas Control, KMI East Region Ron Besette Director, OPS, Division 10 Office, KMI East Region
Pre-Winter Operations Meeting October 2017
 Pre-Winter Operations Meeting October 2017 1 Agenda Brian Merchant Director, Engineering Gas Control, KMI East Region Tom Burgett Director, OPS, Division 10 Office, KMI East Region Don Perkins Manager,
Association of Energy Engineers January 9, Michael Dirrane Director, Northeast Marketing
 Association of Energy Engineers January 9, 2013 Michael Dirrane Director, Northeast Marketing Spectra Energy U.S. Transmission Map Miles of Pipe 13,297 Number of Compressor Stations 129 Total Horsepower
NGA Pre Winter Meeting
 NGA Pre Winter Meeting Mike Dirrane Director of Marketing November 6, 2014 Westboro, MA Spectra Energy U.S. Transmission Map Miles of Pipe 13,297 Number of Compressor Stations 129 Total Horsepower 2,147,488
Algonquin Gas Transmission Pre-Winter Operations Discussion
 AGT PRE-WINTER OPERATIONS MEETING OCTOBER 22, 2013 Algonquin Gas Transmission Pre-Winter Operations Discussion October 22, 2013 Agenda Welcome & Opening Comments Operational Update Northeast Projects Update
Spectra Energy s Perspective on Natural Gas Service to Electric Generation during the Winter. Rich Paglia Vice President Northeast Marketing
 Spectra Energy s Perspective on Natural Gas Service to Electric Generation during the Winter Rich Paglia Vice President Northeast Marketing Presentation Overview Spectra Energy Transmission and Power Plant
Regional Market Trends Forum April 21, 2016 Hartford, CT. Mike Dirrane Director, Northeast Marketing
 Regional Market Trends Forum April 21, 2016 Hartford, CT Mike Dirrane Director, Northeast Marketing Spectra Energy s Portfolio of Assets Based in Houston, TX with operations in 30 states Transports 15%
PLANNED ENHANCEMENTS, NORTHEAST NATURAL GAS PIPELINE SYSTEMS (as of )
") PIPELINE SYSTEMS (as of 8-27-14) The Northeast Gas Association (NGA) has prepared this summary based on publicly-available information. NGA will strive to keep the information as updated as possible and
PIPELINE SYSTEMS (as of 8-27-14) The Northeast Gas Association (NGA) has prepared this summary based on publicly-available information. NGA will strive to keep the information as updated as possible and
East Tennessee Natural Gas Shipper Meeting. Knoxville, Tennessee April 23, 2015
 EAST TENNESSEE NATURAL GAS SHIPPER MEETING APRIL 23, 2015 East Tennessee Natural Gas Shipper Meeting Knoxville, Tennessee April 23, 2015 Agenda Introduction Winter Operations Maintenance Update LINK -
Infrastructure Disruptions: What if?
 Infrastructure Disruptions: What if? NGA Executive Conference R.L.Levitan, rll@levitan.com September 12, 2016 Agenda Recap of TETCO Incident on 4/29/16 What if? Potential Impacts on Winter and Summer Peak
ENERGY SLIDESHOW. Federal Reserve Bank of Dallas
 ENERGY SLIDESHOW Updated: January 16, 2019 ENERGY PRICES www.dallasfed.org/research/energy Brent & WTI & Crude Brent Oil Crude Oil Dollars per barrel 140 120 100 Brent (Jan 11 = $58.64) WTI (Jan 11 = $50.78)
NEW HAMPSHIRE GAS CORPORATION WINTER PERIOD ORIGINAL FILING CONTENTS 3. CONVERSION OF GAS COSTS - GALLONS TO THERMS SCHEDULE A
 NEW HAMPSHIRE GAS CORPORATION COST OF GAS RATE FILING - DG 13- WINTER PERIOD 2013-2014 ORIGINAL FILING CONTENTS 1. TARIFF PAGE - COST OF GAS RATE 2. MARKED TARIFF PAGE - COST OF GAS RATE 3. CONVERSION
ENERGY SLIDESHOW. Federal Reserve Bank of Dallas
 ENERGY SLIDESHOW Updated: March 13, 2018 ENERGY PRICES www.dallasfed.org/research/energy Brent & WTI & Crude Brent Oil Crude Oil Dollars per barrel 140 Brent (Mar 9 = $65.12) WTI (Mar 9 = $61.65) 120 100
MARKET RATES UPDATE Paula Gold-Williams Cory Kuchinsky
 MARKET RATES UPDATE I N T R O D U C T I O N BY: Paula Gold-Williams President & Chief Executive Officer (CEO) P R E S E N T E D BY: Cory Kuchinsky Interim Vice President, Financial Services September 24,
TABLE C-43. Manufacturers' new and unfilled orders, {Amounts in millions of dollars] Nondurable. Capital goods. Total. goods.
![TABLE C-43. Manufacturers' new and unfilled orders, {Amounts in millions of dollars] Nondurable. Capital goods. Total. goods.](/thumbs/93/112603708.jpg "TABLE C-43. Manufacturers' new and unfilled orders, {Amounts in millions of dollars] Nondurable. Capital goods. Total. goods.") TABLE C-43. Manufacturers' new and unfilled orders, -74 {Amounts in millions of dollars] New orders t, I960. 27, 559 26, 903 30,672 30,115 31,086 33,005 35,322 37,952 41, 803 45, 944 46,763 50, 243 53,
TABLE C-43. Manufacturers' new and unfilled orders, -74 {Amounts in millions of dollars] New orders t, I960. 27, 559 26, 903 30,672 30,115 31,086 33,005 35,322 37,952 41, 803 45, 944 46,763 50, 243 53,
NEU Electric and Natural Gas Price Update
 $ / MWH Jan-11 May-11 Sep-11 Sep-12 Jan-13 Electric: Short-Term Outlook The NYMEX Northern Illinois Hub 12-month forward price at the end of August 2016 for the September 2016 to August 2017 period was
Commercial-in-Confidence Ashton Old Baths Financial Model - Detailed Cashflow
 Year 0 1 2 3 4 5 6 7 8 9 10 11 12 13 Oct-16 Nov-16 Dec-16 Jan-17 Feb-17 Mar-17 Apr-17 May-17 Jun-17 Jul-17 Aug-17 Sep-17 Oct-17 2,038 2,922 4,089 4,349 6,256 7,124 8,885 8,885 8,885 8,885 8,885 8,885 9,107
Wheat Marketing Situation
 Wheat Marketing Situation Prepared by: Darrell L. Hanavan Executive Director Colorado Wheat Administrative Committee If you would like to receive an email when this report is updated, email gmostek@coloradowheat.org
Southern Natural Gas Company 2016 Outage Review Meeting. Customer con call and Webex June 15, 2016
 Southern Natural Gas Company 2016 Outage Review Meeting Customer con call and Webex June 15, 2016 1 Welcome 2 Agenda Review of current and upcoming notable Outages- June/July/August Unscheduled outages
Commuter Rail Update. October 25, 2018
 Commuter Rail Update October 25, 2018 2 page page 3 State of Commuter Rail Network, July 2014 The 2014 Commuter Rail network had multiple issues and a history of neglect & under-investment FIRST UP? UPGRADES
NJ Solar Market Update As of 10/31/15
 NJ Solar Market Update As of 10/31/15 Prepared by Charlie Garrison Renewable Energy Committee Meeting November 10, 2015 SOLAR INSTALLED CAPACITY DATA The preliminary installed solar capacity as of 10/31/15
TRAFFIC VOLUME TRENDS
 Page 1 U. S. Department Transportation Federal Highway Administration Office Highway Policy Information TRAFFIC VOLUME TRENDS September Travel on all roads and streets changed by +2.5 (5.8 billion vehicle
THE PARTNERSHIP OF RAIL & COAL MOVING AHEAD 2014 RMCMI ANNUAL MEETING SEPTEMBER 19, 2014
 THE PARTNERSHIP OF RAIL & COAL MOVING AHEAD 2014 RMCMI ANNUAL MEETING SEPTEMBER 19, 2014 1 BNSF is a Leading U.S. Railroad A Berkshire Hathaway company 32,500 route miles in 28 states and two Canadian
Southern Natural Gas Company 2016 Outage Review Meeting. Customer con call and Webex May 18, 2016
 Southern Natural Gas Company 2016 Outage Review Meeting Customer con call and Webex May 18, 2016 1 Welcome 2 Agenda Review of current and upcoming notable Outages- May/June/July Unscheduled outages North
NEU Electric and Natural Gas Price Update
 Exelon s $24 Billion Energy Bill Senate Bill 2814 Short-Term Energy Price Outlook On November 15, 2016, Exelon, through its legislative supporters, introduced Senate Bill 2814, a massive 446 page document
TABLE C-42. Sales and inventories in manufacturing and trade, [Amounts in millions of dollars] Manufacturing. Inventories Ratio 3.
![TABLE C-42. Sales and inventories in manufacturing and trade, [Amounts in millions of dollars] Manufacturing. Inventories Ratio 3.](/thumbs/80/81413912.jpg "TABLE C-42. Sales and inventories in manufacturing and trade, [Amounts in millions of dollars] Manufacturing. Inventories Ratio 3.") 1970 TABLE C-4. and inventories in manufacturing, 1947-69 Inyentories i 1947 1948 1949 1950 1951 195 1953 1954 1955 1956 1957 1958 1959 35,60 54,33 5,507 59,8 70,4 7,377,1 89,05 86,9 1.4 16,16 1,714,59
1970 TABLE C-4. and inventories in manufacturing, 1947-69 Inyentories i 1947 1948 1949 1950 1951 195 1953 1954 1955 1956 1957 1958 1959 35,60 54,33 5,507 59,8 70,4 7,377,1 89,05 86,9 1.4 16,16 1,714,59
TRAFFIC VOLUME TRENDS July 2002
 TRAFFIC VOLUME TRENDS July 2002 Travel on all roads and streets changed by +2.3 percent for July 2002 as compared to July 2001. Estimated Vehicle-Miles of Travel by Region - July 2002 - (in Billions) West
Economics of Integrating Renewables DAN HARMS MANAGER OF RATE, TECHNOLOGY & ENERGY POLICY SEPTEMBER 2017
 Economics of Integrating Renewables DAN HARMS MANAGER OF RATE, TECHNOLOGY & ENERGY POLICY SEPTEMBER 2017 Presentation Outline Understanding LPEA s expenses and what drives them Economics of net metering
University of Michigan Eco-Driving Index (EDI) Latest data: October 2017
 Latest data: October 2017") University of Michigan Eco-Driving Index () http://www.ecodrivingindex.org Latest data: October 2017 Developed and issued monthly by Michael Sivak and Brandon Schoettle Sustainable Worldwide Transportation
University of Michigan Eco-Driving Index () http://www.ecodrivingindex.org Latest data: October 2017 Developed and issued monthly by Michael Sivak and Brandon Schoettle Sustainable Worldwide Transportation
Regulation Update. Operating Committee September 12, PJM 2017
 Regulation Update Operating Committee September 12, 2017 Regulation Market Clearing Price *Data up to Aug 22 2 Mileage Ratio Mileage Ratio has increased since the new signal implementation Larger Utilization
Dawn Storage Pricing Summary last updated April 1, 2018
 Dawn Storage Pricing Summary last updated April 1, 2018 The table below illustrates how Union Gas enters into market priced storage services (park, loans, off peak, short & long term peak) and provides
May ATR Monthly Report
 May ATR Monthly Report Minnesota Department of Transportation Office of Transportation Data and Analysis May 2011 Introduction The purpose of this report is to examine monthly traffic trends on Minnesota
COMPARISON OF FIXED & VARIABLE RATES (25 YEARS) CHARTERED BANK ADMINISTERED INTEREST RATES - PRIME BUSINESS*
 CHARTERED BANK ADMINISTERED INTEREST RATES - PRIME BUSINESS*") COMPARISON OF FIXED & VARIABLE RATES (25 YEARS) 2 Fixed Rates Variable Rates For Internal Use Only. FIXED RATES OF THE PAST 25 YEARS AVERAGE RESIDENTIAL MORTGAGE LENDING RATE - 5 YEAR* (Per cent) Year
COMPARISON OF FIXED & VARIABLE RATES (25 YEARS) 2 Fixed Rates Variable Rates For Internal Use Only. FIXED RATES OF THE PAST 25 YEARS AVERAGE RESIDENTIAL MORTGAGE LENDING RATE - 5 YEAR* (Per cent) Year
COMPARISON OF FIXED & VARIABLE RATES (25 YEARS) CHARTERED BANK ADMINISTERED INTEREST RATES - PRIME BUSINESS*
 CHARTERED BANK ADMINISTERED INTEREST RATES - PRIME BUSINESS*") COMPARISON OF FIXED & VARIABLE RATES (25 YEARS) 2 Fixed Rates Variable Rates FIXED RATES OF THE PAST 25 YEARS AVERAGE RESIDENTIAL MORTGAGE LENDING RATE - 5 YEAR* (Per cent) Year Jan Feb Mar Apr May Jun
COMPARISON OF FIXED & VARIABLE RATES (25 YEARS) 2 Fixed Rates Variable Rates FIXED RATES OF THE PAST 25 YEARS AVERAGE RESIDENTIAL MORTGAGE LENDING RATE - 5 YEAR* (Per cent) Year Jan Feb Mar Apr May Jun
WIM #37 was operational for the entire month of September Volume was computed using all monthly data.
 SEPTEMBER 2016 WIM Site Location WIM #37 is located on I-94 near Otsego in Wright county. The WIM is located only on the westbound (WB) side of I-94, meaning that all data mentioned in this report pertains
Spring 2016 Gas/Electric Forum. March 1, 2016 Waltham, MA
 Spring 2016 Gas/Electric Forum March 1, 2016 Waltham, MA Agenda Welcome Gas/Electric Harmonization Update Operations Update Rich Paglia President, Maritimes & Northeast Pipeline Vice President, Marketing
2017 Adjusted Count Report February 12, 2018
 A statewide multi-use trail user study and volunteer data collection program 2017 Adjusted Count Report February 12, 2018 The following report includes the final adjusted infrared (IR) counter data at
NPCC Natural Gas Disruption Risk Assessment Background. Summer 2017
 Background Reliance on natural gas to produce electricity in Northeast Power Coordinating Council (NPCC) Region has been increasing since 2000. The disruption of natural gas pipeline transportation capability
September 2016 Water Production & Consumption Data
 September 2016 Water Production & Consumption Data September 2016 monthly water production (288.48 AF) was lowest in at least 17 years. Monthly water production has increased slightly each month since
August ATR Monthly Report
 August ATR Monthly Report Minnesota Department of Transportation Office of Transportation Data and Analysis August 2011 Introduction The purpose of this report is to examine monthly traffic trends on
LOCAL CLIMATOLOGICAL DATA
 ILLINOIS STATE WATER SURVEY DIVISION URBANA, ILLINOIS ISWS MP-21 Archive SWS0964 Illinois State Water Survey LOCAL CLIMATOLOGICAL DATA FDR HILLSBORO, IL. 1901-1962 LOCAL CLIMATOLOGICAL DATA 1901-1962 HILLSBORO
Developing Infrastructure: Getting the Gas to Market. Doreen Wrick Director, Northeast Marketing, Spectra Energy
 Northeast Gas Association Annual Sales & Marketing Seminar August 20, 2013 Developing Infrastructure: Getting the Gas to Market Doreen Wrick Director, Northeast Marketing, Spectra Energy Safe Harbor Statement
Diesel prices finally ease Winter weather and international events could determine your fuel bill for 2018 By Bryce Knorr, senior grain market analyst
 Diesel prices finally ease Winter weather and international events could determine your fuel bill for 2018 By Bryce Knorr, senior grain market analyst After rallying to their highest level in nearly three
2019 Western North Carolina Weather Calendar. Department of Atmospheric Sciences The University of North Carolina at Asheville
 209 Western North Carolina Weather Calendar Department of Atmospheric Sciences The University of North Carolina at Asheville www.atms.unca.edu 209 Western North Carolina Weather Calendar Climatological
2017/18 Cotton Outlook
 217/1 Cotton Outlook 217 Ag Econ In service Training Dr. S. Aaron Smith, Assistant Professor, Department of Agricultural and Resource Economics, University of Tennessee https://ag.tennessee.edu/arec/pages/cropeconomics.aspx
Mark Westhoff Director, Facility and Capacity Planning El Paso Western Pipelines
 El Paso Corporation Mark Westhoff Director, Facility and Capacity Planning El Paso Western Pipelines Capacity Reservation Factors October 22, 2008 Defining Our Purpose El Paso Corporation provides natural
Total Production by Month (Acre Feet)
") Production by Month (acre-feet) 2008 2009 2010 2011 2012 2013 2014 2015 2016 January 25 339.10 228.90 249.50 297.99 243.06 327.14 247.66 212.37 February 234.00 218.80 212.10 241.52 245.82 279.08 234.16
Production by Month (acre-feet) 2008 2009 2010 2011 2012 2013 2014 2015 2016 January 25 339.10 228.90 249.50 297.99 243.06 327.14 247.66 212.37 February 234.00 218.80 212.10 241.52 245.82 279.08 234.16
Industry Overview. Powersports Market Update
 2017 Q1 Industry Overview Powersports Market Update Sport side-by-sides continue to lead led the powersports industry, with that segment s pricing once again averaging higher than any of the previous three
Design Criteria Data
 OKLAHOMA CITY OK Latitude = 35.4 N WMO No. 72353 Longitude = 97.6 W Elevation = 133 feet Period of Record = 1973 to 1996 Average Pressure = 28.62 inches Hg Design Criteria Data Mean Coincident (Average)
Design Criteria Data
 MEDFORD/JACKSON CO. OR Latitude = 42.37 N WMO No. 72597 Longitude =122.8 W Elevation = 1329 feet Period of Record = 1973 to 1996 Average Pressure = 28.61 inches Hg Design Criteria Data Mean Coincident
Design Criteria Data
 DES MOINES IA Latitude = 41.53 N WMO No. 72546 Longitude = 93.65 W Elevation = 965 feet Period of Record = 1973 to 1996 Average Pressure = 28.96 inches Hg Design Criteria Data Mean Coincident (Average)
Petroleum and Natural Gas Situation
 Petroleum and Natural Gas Situation John C. Felmy Chief Economist and Director Statistics Department American Petroleum Institute Felmyj@api.org www.api.org www.gasolineandyou.org www.naturalgasfacts.org
CLIMATOLOGICAL SUMMARY
 DEPARTMENT OF REGISTRATION AND EDUCATION CTATP OF ILLINOIS ILLINOIS STATE WATER SURVEY DIVISION URBANA, ILLINOIS ISWS MP-19 Archive ISWS Illinois State Water Survey )CAL CLIMATOLOGICAL DATA MP-19 LOCAL
VEHICLE / PEDESTRIAN COLLISIONS
 Info item No. 1 Crosswalk Safety Advisory Committee March 31, 2016 VEHICLE / PEDESTRIAN COLLISIONS HRM: January December 20 DISCLAIMER: All figures presented in this report reflect the information held
System Management Principles Statement
 System Management Principles Statement Compliance report for September 214 and October 214 Summary of balancing actions and breaches for September 214 October 214 Performance compared to last year Summary
Design Criteria Data
 LAS VEGAS/MCCARRAN NV Latitude = 36.8 N WMO No. 72386 Longitude =115.1 W Elevation = 2179 feet Period of Record = 1973 to 1996 Average Pressure = 27.67 inches Hg Design Criteria Data Mean Coincident (Average)
Inventory Levels - All Prices. Inventory Levels - By Price Range
 Inventory Levels - All Prices Idaho Falls Bonneville Total 7-Apr-17 154 111 265 6-Apr-18 113 91 204-23% Inventory Levels - By Price Range 7-Apr-17 6-Apr-18 0-100,000 36 10 100,001-125,000 13 9 125,001-150,000
Design Criteria Data
 PHOENIX/SKY HARBOR AZ Latitude = 33.43 N WMO No. 72278 Longitude =112. W Elevation = 116 feet Period of Record = 1973 to 1996 Average Pressure = 28.72 inches Hg Design Criteria Data Mean Coincident (Average)
Inventory Levels - All Prices. Inventory Levels - By Price Range
 Inventory Levels - All Prices Idaho Falls Bonneville Total 3-Mar-17 152 108 260 2-Mar-18 109 78 187-28% Inventory Levels - By Price Range 3-Mar-17 2-Mar-18 0-100,000 41 6 100,001-125,000 19 8 125,001-150,000
Operational Overview. Operational Forum, 24 th March 2010
 Operational Overview Operational Forum, 24 th March 21 Weather Weather February 21 The cold weather continued throughout February with all but one day being colder than the 17-year seasonal normal CWV.
ELECTRICITY GENERATION AND DISTRIBUTION. Electricity Generation & Distribution Q2,
 Contact Statistician: Otsile Chelenyane Industry Statistics Unit Email: ochelenyane@statsbots.org.bw Tel: (+267) 367 1300; Ext. 333 ELECTRICITY GENERATION AND DISTRIBUTION Stats Brief, Quarter 2, 2018
NJ Solar Market Update As of 2/29/16
 NJ Solar Market Update As of 2/29/16 Prepared by Charlie Garrison March 24, 2016 SOLAR INSTALLED CAPACITY DATA The installed solar capacity as of 2/29/16 is approximately 1,644.3 MW. Approximately 20.3
GAZIFÈRE INC. AJUSTEMENT DU COÛT DU GAZ RATE 200 MODIFICATIONS WITH COMMENTS
 RATE 200 MODIFICATIONS WITH COMMENTS Gazifère s January 1, 2008 Rates On November 29, 2007, Gazifère filed its Rates reflecting the impact on distribution, load balancing and commodity resulting from its
STATISTICS BOTSWANA ELECTRICITY GENERATION & DISTRIBUTION 2016/2 STATS BRIEF, FIRST QUARTER Copyrights Statistics Botswana 2016
 2016/2 ELECTRICITY GENERATION & DISTRIBUTION STATS BRIEF, FIRST QUARTER 2016 Copyrights Statistics Botswana 2016 Statistics Botswana. Private Bag 0024 Botswana Tel: (267) 367 1300. Fax: (267) 395 2201.
Operational Opportunities to Minimize Renewables Curtailments
 Operational Opportunities to Minimize Renewables Curtailments Clyde Loutan Principal, Renewable Energy Integration July 24, 2017 2017 CAISO - Public Page 1 Agenda Background Real-time control performance
NEWS Release. U.S. Manufacturing Technology Orders. Year-to-date U.S. manufacturing technology orders up 4.1% over 2011
 U.S. Manufacturing Technology Orders A statistical program of AMT NEWS Release FOR RELEASE: October 8, 2012 Contact: Pat McGibbon, AMT, 703-827-5255 Year-to-date U.S. manufacturing technology orders up
Monthly Hog Market Update United States Hog Production
 This information is provided as a resource by Saskatchewan Agriculture staff All prices are in Canadian dollars unless otherwise noted. Please use this information at your own risk. Monthly Hog Market
Sasha Weintraub Duke Energy
 Fueling Up within the Game Changer Sasha Weintraub Duke Energy The Game Changer is Happening Definition of game changer Completely changing the way something is done, thought about, or made Time Magazine
Design Criteria Data
 LOUISVILLE/STANDIFORD KY Latitude = 38.18 N WMO No. 72423 Longitude = 85.73 W Elevation = 489 feet Period of Record = 1973 to 1996 Average Pressure = 29.49 inches Hg Design Criteria Data Mean Coincident
System Management Principles Statement
 System Management Principles Statement Compliance report for June 214 to August 214 Summary of balancing actions and breaches for June 214 to Aug 214 Performance compared to last year Summary Report Jun-14
[Amounts in millions of dollars] Nondurable. Total. goods. equipment 34,415 30,717 24,506 8,868 9,566 8,981
![[Amounts in millions of dollars] Nondurable. Total. goods. equipment 34,415 30,717 24,506 8,868 9,566 8,981](/thumbs/92/109418289.jpg "[Amounts in millions of dollars] Nondurable. Total. goods. equipment 34,415 30,717 24,506 8,868 9,566 8,981") 1970 TABLE C-44. Manufacturers 1 new and unfilled orders, 1947-69 Unfilled orders2 Unfilled orders-shipments Machinery and equipment 1947.. 1948.. 1949.. 23,53.3 3 3 4 3 1961 * 31,085 15,698 17,026 18,522
1970 TABLE C-44. Manufacturers 1 new and unfilled orders, 1947-69 Unfilled orders2 Unfilled orders-shipments Machinery and equipment 1947.. 1948.. 1949.. 23,53.3 3 3 4 3 1961 * 31,085 15,698 17,026 18,522
D G A G R I D A S H B O A R D : A P P L E S
 75 79 60 56 49 74 65 59 54 42 76 63 58 53 78 55 42 43 79 44 81 63 47 83 64 59 53 48 Sources: Eurostat, MSs notifications, DG Agri, Comext, Comtrade, GTA, ITC, AMI, Expert groups, Freshfel, Wapa. 89 68
Inventory Levels - All Prices. Inventory Levels - By Price Range
 Inventory Levels - All Prices Idaho Falls Bonneville Total 3-Nov-17 198 128 326 2-Nov-18 155 134 289-11% Inventory Levels - By Price Range 3-Nov-17 2-Nov-18 0-100,000 17 11 100,001-125,000 15 9 125,001-150,000
Virginia Tech Research Center Arlington, Virginia, USA. PPT slides will be available at
 SMART BUILDINGS & A SMART CITY CONNECTED COMMUNITY Guest Professor Inaugural Lecture at Tsinghua University Professor Saifur Rahman Director, Virginia Tech Advanced Research Inst., USA President-elect,
Market Shifts: Infrastructure in the Northeast
 Market Shifts: Infrastructure in the Northeast Colette Breshears, Natural Gas & Infrastructure Intelligence October 19, 2017 info@genscape.com US: +1 502 583 3435 EU: +31 20 524 4089 Agenda Genscape who
NJ Solar Market Update
 NJ Solar Market Update April 16, 20 Renewable Energy Committee Meeting Trenton, NJ Prepared by Charlie Garrison Solar Installed Capacity Data The preliminary installed solar capacity as of 3/31/ is approximately
Factory activity accelerated further in our region this month, posting its highest composite reading since 2011, said Wilkerson.
 FOR RELEASE Thursday, October 26, 17 EMBARGOED FOR A.M. CENTRAL TIME CONTACT: Pam Campbell 45-27-8617 Pam.Campbell@kc.frb.org TENTH DISTRICT MANUFACTURING ACTIVITY POSTS STRONG GROWTH Federal Reserve Bank
Units of Instruction MISD Pacing Guide Days Date Range Test Date
 MISD Pacing Guide Date Range Test Date Introduction: Processes of Investigations (1 day) Aug. 21 Unit 01: Matter (12 days) Aug. 22-Sept. 7 Sep. 10 Unit 02: Atomic Structure and the Periodic Table (15 days)
Reviewing a volatile year for PET What does the future hold?
 Reviewing a volatile year for PET What does the future hold? Matt Tudball Head of European Markets www.icis.com 1 Agenda PET price and sentiment drivers in 2017: Europe, Americas, Asia & feedstocks Predictions
Revising the Historic Monthly Mean Niagara River Flow at Buffalo to Reflect Better Estimates of Maid-of-the-Mist Pool Outflows
 Revising the Historic Monthly Mean Niagara River Flow at Buffalo to Reflect Better Estimates of Maid-of-the-Mist Pool Outflows 1961-2007 Background The Niagara River flow at Buffalo is currently computed
System Status Briefing
 System Status Briefing Phakamani Hadebe Interim Group Chief Executive 3 May 2018 Contents 1 Performance summary 2 Operational highlights 3 Generation performance 4 Distribution overview 5 Transmission
Performance Measures Second Quarter 2012
 Performance Measures Second Quarter 2012 2Q2011 Earn & Retain Community Trust 6 Performance Measures: Ridership Cost Effectiveness (Cost per Passenger) Cost Efficiency (Cost per Revenue Hour) Service Effectiveness
Algebra II Pacing Guide
 Unit 13: Exploring a Business Venture (10 days) 8 May 13 - May 24 n/a MISD Pacing Guide Date Range Unit 01: Introduction to Functions in 15 Aug. 21 - Sept. 11 Sept. 12 Unit 02: Absolute Value Functions,,
NJ Solar Market Update As of 6/30/15
 NJ Solar Market Update As of 6/30/ Prepared by Charlie Garrison July 17, 20 SOLAR INSTALLED CAPACITY DATA The preliminary installed solar capacity as of 6/30/ is approximately 1,500.7 MW. Approximately
TENTH DISTRICT MANUFACTURING SURVEY REBOUNDED MODERATELY Federal Reserve Bank of Kansas City Releases January Manufacturing Survey
 FOR RELEASE Thursday, January 23, 2014 EMBARGOED FOR 10 A.M. CENTRAL TIME CONTACT: Bill Medley 816-881-2556 Bill.Medley@kc.frb.org TENTH DISTRICT MANUFACTURING SURVEY REBOUNDED MODERATELY Federal Reserve
M onthly arket. Jan Table of Contents. Monthly Highlights
 Table of Contents Market Inventory...2 www.gaar.com Monthly Highlights January 2014 had a 12.29% increase in the number of homes sales when compared to same time last year. The average sale price of single-family
D G A G R I D A S H B O A R D : A P P L E S
 Sources: Eurostat, MSs notifications, DG Agri, Comext, Comtrade, GTA, ITC, AMI, Expert groups, Freshfel, Wapa. 000 tonnes 39 41 31 22 29 22 32 27 17 18 9 27 15 12 6 6 6 4 5 6 5 4 11 25 15 9 9 93 62 51
COMPILED BY GLASS S. Auction Report - LCV November 2013
 GLASS S Auction Report - LCV November 2013 Contents Market Commentary Page 3 Whole Market Summary Page 8 Average Sales Price Year on Year Page 9 Sales Price Compared to Number of Entries (all ages) Page
WIM #29 was operational for the entire month of October Volume was computed using all monthly data.
 OCTOBER 2015 WIM Site Location WIM #29 is located on US 53 near Cotton in St Louis county. System Operation WIM #29 was operational for the entire month of October 2015. Volume was computed using all monthly
Design Criteria Data
 BURLINGTON VT Latitude = 44.47 N WMO No. 72617 Longitude = 73.15 W Elevation = 341 feet Period of Record = 1973 to 1996 Average Pressure = 29.61 inches Hg Design Criteria Data Mean Coincident (Average)
Design Criteria Data
 RAPID CITY SD Latitude = 44.5 N WMO No. 72662 Longitude =3. W Elevation = 3169 feet Period of Record = 1973 to 1996 Average Pressure = 26.67 inches Hg Design Criteria Data Mean Coincident (Average) Values
Design Criteria Data
 COLUMBIA SC Latitude = 33.95 N WMO No. 7231 Longitude = 81.12 W Elevation = 226 feet Period of Record = 1973 to 1996 Average Pressure = 29.8 inches Hg Design Criteria Data Mean Coincident (Average) Values
Design Criteria Data
 PHILADELPHIA PA Latitude = 39.88 N WMO No. 7248 Longitude = 75.25 W Elevation = 3 feet Period of Record = 1973 to 1996 Average Pressure = 29.98 inches Hg Design Criteria Data Mean Coincident (Average)
US Lodging Industry Overview. Amanda W. Hite President STR
 US Lodging Industry Overview Amanda W. Hite President STR Agenda Total US Review Scales Segmentation Pipeline 2012 / 2013 Forecast Total US Review Supply / Demand Drive Results. Pricing Power Is Back (?)
Design Criteria Data
 HONOLULU/OAHU HI Latitude = 21.35 N WMO No. 91182 Longitude =157.9 W Elevation = 16 feet Period of Record = 1967 to 1996 Average Pressure = 29.96 inches Hg Design Criteria Data Mean Coincident (Average)
Design Criteria Data
 MACON/LEWIS WILSON GA Latitude = 32.7 N WMO No. 72217 Longitude = 83.65 W Elevation = 361 feet Period of Record = 1973 to 1996 Average Pressure = 29.66 inches Hg Design Criteria Data Mean Coincident (Average)
Design Criteria Data
 PIERRE SD Latitude = 44.38 N WMO No. 726686 Longitude =1.2 W Elevation = 1742 feet Period of Record = 1973 to 1996 Average Pressure = 28.1 inches Hg Design Criteria Data Mean Coincident (Average) Values
Why U.S. Natural Gas Prices Should Double
 http://blogs.forbes.com/arthurberman/?p=243 DOW to Drop 80% in 2016 80% Stock Market Crash to Strike in 2016, Economist Warns. Art Berman Contributor I write about plays and trends in the oil and gas business.
Design Criteria Data
 INDIANAPOLIS IN Latitude = 39.73 N WMO No. 72438 Longitude = 86.27 W Elevation = 87 feet Period of Record = 1973 to 1996 Average Pressure = 29.15 inches Hg Design Criteria Data Mean Coincident (Average)
Design Criteria Data
 ANCHORAGE AK Latitude = 61.17 N WMO No. 7273 Longitude =15. W Elevation = 131 feet Period of Record = 1973 to 1996 Average Pressure = 29.6 inches Hg Design Criteria Data Mean Coincident (Average) Values