MBTA RAILROAD OPERATIONS Commuter Rail. MBTA/MassDOT
|
|
|
- Edith Newton
- 5 years ago
- Views:
Transcription


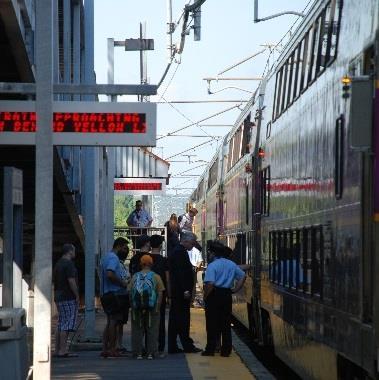


1 MBTA RAILROAD OPERATIONS Commuter Rail New England Railroad Club November 1, 2018 Ryan D. Coholan Chief Railroad Officer MBTA/MassDOT 1

2 Topics for Discussion State of the System Existing Conditions Ridership Fleet Operations Costs Challenges Opportunities Round the Room Discussion 2

3 Commuter Rail at a Glance Commuter Rail Routes 14 5 North Side 9 South Side Route Miles 388 Stations 138 Parking Spaces 39,246 12,174 North Side 27,072 South Side Weekday Boardings 129,075 Annual Ridership 35 million Revenue Fleet 90 Locomotives 420 Coaches Maintenance Facilities 3 Layover/Storage Facilities 14 Source: MBTA Ridership and Service Statistics, MBTA parking data based on 3 Revenue Fleet info based on Draft FY Commuter Rail Fleet Management Plan.

4 Overview of the System Comparison to Other Services Source: MBTA Ridership and Service Statistics, National Transit Database: 2013 Transit Profiles. 4

5 Overview of the System Ownership and Agreements MBTA owns the right of way used for existing passenger service within Massachusetts Amtrak is the primary owner of the Northeast Corridor outside of Massachusetts The extension of service to Wachusett Station operates over a segment of Pan Am track Proposed extension of service beyond Forge Park would operate over CSX track 5

6 Overview of the System Dispatching North Side MBTA controls dispatching on much, but not all, of the commuter rail network Pan Am controls dispatching on segments of the Haverhill, Lowell, and Fitchburg Lines 6

7 Overview of the System Dispatching South Side Amtrak controls dispatching along the entire Northeast Corridor, at South Station, and over a small segment of the Dorchester Branch Mass Coastal controls dispatching along the Framingham Secondary, Middleborough Secondary, and Cape Main Line 7
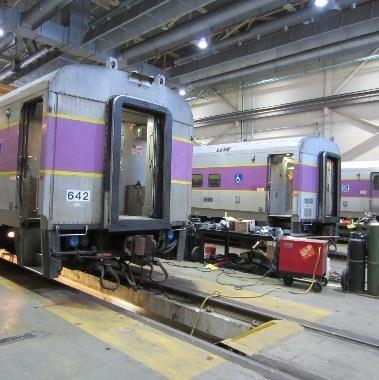
8 Maintenance and Layover Facilities Maintenance Facilities Existing MBTA Maintenance Facilities Commuter Rail Maintenance Facility (CRMF) South Side Service & Inspection Readville Interim Repair Facility 8
 Commuter Rail Maintenance Facility (CRMF) 5 (6) 6 12 1 (spare) Subtotal 29 (30) 25 MIDDAY LAYOVER FACILITIES Commuter Rail")
9 Maintenance and Layover Facilities Overnight and Midday Layover Facilities North Side Location Consist Capacity Sets Needed for Service OVERNIGHT LAYOVER FACILITIES Rockport 4 4 Newburyport 4 4 Bradford 4 5 Lowell 0 5 Fitchburg (Wachusett replaced Fitchburg in 2016) Commuter Rail Maintenance Facility (CRMF) 5 (6) (spare) Subtotal 29 (30) 25 MIDDAY LAYOVER FACILITIES Commuter Rail Maintenance Facility (CRMF) 12 Subtotal 12 9
 12 N/A Middleborough 5 4 Kingston 5 4 Greenbush 5 4 Boston (Amtrak SHSY) Boston (Amtrak Front Yard) 8 2 (Fairmount) 2 1 (spare) Subtotal 53 40")
10 Maintenance and Layover Facilities Overnight and Midday Layover Facilities South Side Location Consist Capacity Sets Needed for Service OVERNIGHT LAYOVER FACILITIES Worcester 4 8 Needham 3 3 Franklin 3 5 Pawtucket 6 7 Stoughton 0 2 Boston (Readville) 12 N/A Middleborough 5 4 Kingston 5 4 Greenbush 5 4 Boston (Amtrak SHSY) Boston (Amtrak Front Yard) 8 2 (Fairmount) 2 1 (spare) Subtotal MIDDAY LAYOVER FACILITIES Boston (Readville) Boston (Amtrak SHSY) 12 8 Subtotal 20 10
11 Assets Systemwide Summary ASSET CATEGORY NORTH SIDE SOUTH SIDE TOTAL Total Track Miles Revenue Track Miles Layover Track Miles Non-Revenue Track Miles Single Track Miles Grade Crossings Culverts Undergrade Bridges Interlockings Switches Hand Throw Switches Power Switches Source: MBTA 2016 Engineering Track Charts 11

12 Ridership Passenger Volume Flow Line Riders NORTH SIDE TYPICAL WEEKDAY RIDERSHIP Newburyport/Rockport 16,254 Haverhill 8,843 Lowell 11,965 Fitchburg 9,556 North Side Typical Weekday Ridership 46,618 SOUTH SIDE TYPICAL WEEKDAY RIDERSHIP Framingham/Worcester 16,293 Needham 6,972 Franklin 12,480 Providence/Stoughton 26,465 Fairmount 1,038 Middleborough/Lakeville 7,182 Kingston/Plymouth 6,560 Greenbush 5,411 South Side Typical Weekday Ridership TOTAL TYPICAL WEEKDAY COMMUTER RAIL RIDERSHIP 82, ,019 Source: MBTA, Ridership and Service Statistics, CTPS MBTA Commuter Rail Passenger Count Results, 2012
13 Commuter Rail Stations Station Accessibility 143 total stations (includes Foxboro, seasonal stations, and stations under construction) 51 fully accessible stations, including 2 stations under construction 57 partially accessible stations with mini-high platforms 34 stations not accessible Back Bay is fully accessible, except for Worcester Line platform with mini-high Draft for Discussion & Policy Purposes Only 13
14 Commuter Rail Stations Parking Supply and Utilization Parking is provided at 114 of the total 138 Commuter Rail stations Of the 39,246 total commuter rail spaces, 25,977 are owned by the MBTA 4,639 North Side 21,338 South Side Parking is a revenue generator Daily rates between $4-$7 per day Source: CTPS Park-and-Ride Capacity and Utilization (commuter rail only), MBTA Parking Facilities Utilization, FY
 in Zone 9 and one (Wickford Junction) in Zone 10 1 Including North Station and South Station Source: www.")
15 Fares Zone Structure and Travel Times There are 11 commuter rail zones (Zone 1a through Zone 10) with one-way fares between $2.10 and $11.50 There are 14 stations 1 in Zone 1a alone The Needham and Fairmount Lines are entirely within Zones 1 and 2 The Providence Line is the only one extending beyond Zone 8, with one station (T.F. Green) in Zone 9 and one (Wickford Junction) in Zone 10 1 Including North Station and South Station Source: 15


16 Ridership Performance facts Reliability Almost 2/3 of the commuter rail lines operated at 92% ontime performance or greater over the last 12 months Coverage Area More than 60% (86) of all commuter rail stations are greater than a 30 minute travel time from North or South Station. Train Frequency Each weekday, commuter rail operates over 500 trains, of one-way distances between 10 and 63 miles 16

17 Ridership Availability Factors Train Seating Capacity Over the last year, MBTA operated over 140,000 trains. Less than 2,500 of them, or only 1.67%, were over capacity. That means that 98% of commuter rail trains had a seat for every passenger. 17
.")
18 Ridership Characteristics of High Ridership Stations Source: MBTA Ridership Counts, April 2016 (select stations). MBTA Ridership and Service Statistics,


19 Ridership Counts CURRENT Manual Ridership Reports Ridership as reported by conductors On-board only, no station-level breakdown Conductors must multi-task; focus is on safety No incentive to improve accuracy Bi-Annual Peak Passenger Counts Platform counts at Boston terminals Peak period only On-board only, no station-level breakdown Primary purpose is to determine equipment and staffing needs not to collect accurate ridership Comprehensive Count Audits Focused on capturing ridership at all stations Expensive and time consuming Last done in 2012 Conducted again by CTPS in 2018 POTENTIAL Automated Passenger Counters On-board for each commuter rail coach Pilot car is being tested now successful Wider rollout possible Automated Fare Collection 2.0 Pay with phone (no app), contactless credit card, Charlie2 issued card No cash on-board vehicle Readers added at all rail stations and on platforms at South Station North Station / Back Bay Automatically captures ridership from the tap made at each station (on, off) 19

20 Automated Passenger Counters (APC) Device detects and counts passengers moving in 4 different directions Uses a camera and captures movement entering and exiting coaches Can determine if a passenger is between coaches or left the train Counts passengers in each coach and then totals up the entire train. Other features include: APCs currently installed on 38 commuter rail coaches Keolis and MBTA now installing APCs on the entire coach fleet Ambient temperature sensing Onboard PA system recording, quality control Real time GPS tracking Accelerometer and vibration sensors measure ride quality and passenger comfort Door sensors record number of doors open at stations


21 RailSales Onboard Mobile Point of Sales Keolis developed a new hand-held ticketing device for conductors to accept credit cards onboard trains, a frequent passenger request. CR historically had cash-only sales on board trains. Easy to use device with a card reader attached to the conductors existing iphones combined with a small belt printer. Conductors started using the device in Feb. 2018, with full implementation completed in September ~14% of sales are being made by card with steady increase month on month. 21

22 On-Time Performance The Importance of Residual Delays Within the Last 12 Months Residual delays comprised 30% of the number of incidents causing delay, compared to all other causes combined Residual Delays One initial incident can create a ripple effect of delay, as several commuter rail trains are impacted downstream, and sometimes on multiple lines All Other Causes COMBINED Residual Delays Alone 22
 OTP (within 10 minutes) Passenger")
23 On Time Performance 100% On Time Performance (OTP) by Week 90% 80% 70% 60% 50% 6/25/2018 7/2/2018 7/9/2018 7/16/2018 7/23/2018 7/30/2018 8/6/2018 8/13/2018 8/20/2018 8/27/2018 9/3/2018 9/10/2018 D a t e OTP (within 5 minutes) OTP (within 10 minutes) Passenger OTP 23
24 OTP to 5 minutes September 2017 October 2017 November 2017 December 2017 January 2018 February 2018 March 2018 April 2018 May 2018 June 2018 July 2018 August 2018 September 2018 Trailing Year Average Fairmount 97.5% 98.0% 96.6% 97.9% 92.9% 96.8% 96.4% 97.9% 97.9% 95.3% 96.8% 95.2% 94.1% 96.4% Fitchburg 91.3% 79.9% 70.8% 84.6% 76.0% 91.7% 87.5% 86.7% 84.9% 87.0% 85.5% 88.0% 88.1% 84.7% Franklin 88.6% 82.5% 85.4% 87.3% 82.5% 91.8% 88.6% 89.2% 82.5% 84.9% 77.8% 80.2% 84.8% 85.0% Greenbush 95.6% 85.3% 95.2% 95.3% 90.7% 94.5% 85.7% 98.0% 94.6% 95.4% 93.5% 93.7% 94.7% 93.2% Haverhill 81.3% 74.7% 78.3% 86.9% 82.7% 88.9% 82.4% 90.6% 93.9% 93.0% 92.3% 92.6% 92.5% 87.1% Kingston/Plymouth 95.3% 84.2% 91.8% 95.0% 88.7% 93.8% 84.8% 94.0% 93.0% 90.1% 90.2% 91.6% 92.7% 91.1% Lowell 89.1% 88.1% 85.7% 89.9% 80.1% 91.4% 84.9% 90.9% 89.2% 92.7% 91.8% 93.0% 90.6% 88.9% Middleboro 90.8% 83.2% 88.9% 91.9% 91.3% 89.7% 85.6% 95.7% 90.3% 89.4% 88.1% 88.5% 91.8% 89.6% Needham 92.0% 90.0% 91.0% 91.4% 87.6% 95.3% 90.0% 91.4% 90.2% 92.0% 88.8% 91.6% 94.6% 91.2% Newburyport 89.1% 88.5% 89.3% 88.7% 76.1% 93.1% 85.8% 92.2% 92.7% 92.7% 91.9% 89.8% 92.6% 89.4% Providence 89.2% 86.6% 87.7% 88.9% 83.0% 92.2% 88.1% 86.5% 87.8% 87.1% 81.4% 86.6% 84.0% 86.8% Rockport 83.6% 86.7% 88.5% 87.5% 76.6% 92.4% 85.5% 92.7% 93.8% 92.2% 93.4% 90.1% 93.4% 88.9% Stoughton 89.8% 84.8% 85.9% 86.9% 83.0% 89.7% 86.5% 86.9% 87.1% 88.7% 81.1% 82.7% 84.3% 85.9% Worcester 74.4% 79.5% 89.5% 93.9% 86.7% 92.0% 89.6% 90.8% 88.0% 83.0% 78.9% 88.5% 93.3% 86.8% Grand Total 88.4% 85.1% 87.3% 90.4% 83.9% 92.4% 87.5% 91.4% 90.3% 90.0% 87.8% 89.4% 90.8% 88.8% 24
25 OTP to 10 minutes September 2017 October 2017 November 2017 December 2017 January 2018 February 2018 March 2018 April 2018 May 2018 June 2018 July 2018 August 2018 September 2018 Trailing Year Average Fairmount 99.0% 98.8% 98.6% 99.3% 95.1% 98.8% 98.4% 99.3% 99.5% 97.8% 98.8% 97.2% 97.2% 98.3% Fitchburg 96.4% 90.7% 85.7% 91.9% 84.2% 96.2% 93.1% 93.1% 93.2% 92.9% 93.0% 94.4% 93.7% 92.1% Franklin 95.5% 91.4% 92.4% 94.8% 89.6% 96.2% 94.4% 95.5% 91.9% 93.1% 87.5% 89.2% 92.2% 92.5% Greenbush 98.1% 95.4% 97.5% 97.6% 93.8% 97.3% 89.5% 98.9% 97.3% 97.8% 95.8% 96.8% 96.5% 96.3% Haverhill 90.0% 87.1% 88.4% 92.7% 89.1% 95.3% 89.8% 96.2% 96.5% 97.0% 96.5% 96.0% 96.5% 93.2% Kingston/Plymouth 98.8% 95.4% 96.5% 98.8% 92.5% 97.8% 89.3% 98.0% 96.6% 96.0% 95.8% 96.0% 96.2% 95.9% Lowell 97.5% 95.3% 95.4% 95.4% 90.0% 97.4% 92.1% 96.9% 96.7% 97.4% 97.0% 97.4% 96.5% 95.7% Middleboro 95.0% 96.3% 96.0% 95.4% 94.3% 95.3% 91.1% 98.3% 95.4% 95.2% 94.0% 92.2% 95.1% 94.9% Needham 96.6% 96.4% 94.6% 96.8% 93.5% 98.9% 96.2% 96.8% 95.1% 96.7% 94.9% 96.6% 98.7% 96.2% Newburyport 95.0% 95.0% 96.3% 96.2% 82.6% 97.3% 91.2% 97.1% 97.2% 96.2% 98.2% 96.1% 97.6% 95.1% Providence 95.1% 93.4% 94.5% 93.7% 89.4% 96.9% 92.9% 94.0% 94.1% 94.3% 90.8% 93.9% 92.5% 93.5% Rockport 92.4% 92.6% 94.4% 94.3% 81.5% 96.1% 90.6% 96.4% 97.2% 97.4% 97.0% 94.6% 98.1% 94.0% Stoughton 95.3% 92.9% 95.9% 94.3% 90.9% 94.9% 94.0% 94.7% 94.4% 94.2% 89.9% 90.3% 92.8% 93.4% Worcester 87.6% 90.8% 95.3% 97.3% 91.8% 96.1% 93.9% 96.2% 94.7% 90.2% 88.1% 93.7% 96.5% 93.3% Grand Total 94.8% 93.5% 94.3% 95.5% 89.8% 96.8% 92.8% 96.4% 95.7% 95.3% 94.0% 94.6% 95.7% 94.5% 25


26 Costs to Operate Commuter Rail FIXED PRICE $320M OTHER COSTS: $77M SERVICES $47M FUEL $30M * Costs rounded to nearest Million $ TOTAL ANNUAL COST TO OPERATE COMMUTER RAIL= $397M NTD-Reported Farebox Recovery 50% Farebox Recovery Considering Non- Operating Revenues 72% 26


 $12M UTILITIES &")


27 Revenues from Commuter Rail NON-OPERATING REVENUES: $70M OPERATING REVENUES $215M PARKING $17M ADVERTISING $6M RETAIL SPACE + OTHER LEASES $3M REVENUE ASSESSMENTS (10% TOWNS WITH SUBWAY AND BUS) $14M REAL ESTATE $12M REVENUE ASSESSMENTS (TOWNS WITH CR ONLY) $12M UTILITIES & TELECOMM $6M TOTAL ANNUAL REVENUE GENERATED BY COMMUTER RAIL= $285M * Rounded to nearest million/annual Revenue Generated Source: CTPS MBTA Revenue Report, Fiscal Year MBTA Ridership and Service Statistics,


28 Systemwide Challenges Single track constraints and limited right-of-way Newburyport Line, between North Beverly and Newburyport Haverhill Line, between Reading and Andover Old Colony Main Line, between Boston and Braintree Worcester Line, adjacent to the Massachusetts Turnpike Drawbridge rehabilitation/ replacement Gloucester Draw- Ongoing Beverly Draw- Completed in 2017 Saugus Draw- In design Draw 1 (North Station)- In design Parking constraints 25 commuter rail stations are at or over parking capacity 28
")

29 Systemwide Challenges Station accessibility 34 stations are not accessible Challenges with upgrading to fully accessible stations in corridors that require special freight clearances Maintenance/layover facility capacity Overnight layover constraints on the North Side (Rockport, Bradford, Lowell, Fitchburg) Overnight layover constraints on the South Side (Worcester, Needham, Franklin, Stoughton) Midday layover constraint on the South Side Coach capacity Of 420 coaches in the active fleet, 203 or approximately 50% are single-level PTC construction Source: FY MBTA Commuter Rail Fleet Management Plan - DRAFT. 29


30 Systemwide Challenges (Continued) Drawbridges Drawbridge Condition Replacement Cost Year Built Gloucester Structurally Deficient Replacement Underway $60M 1911 Beverly Structurally Deficient Replaced 2017 $56M 1885 Saugus Structurally Deficient In Design $60M 1911 Manchester Structurally Adequate N/A 1944 Tower A Structurally Deficient To Be Replaced $121M


31 Commuter Rail Vehicle Fleet Statistics about the Vehicle Fleet 92 switching, MOW, and wreck response vehicles in support fleet 500 active locomotives and coaches in revenue fleet Minimum target service life is 25 years 240 revenue vehicles at/beyond 25- year service life 37 locomotives are beyond their 25- year service life, with another 13 approaching their 25-year service life within the next six years Active At/Beyond 25-Year Service Life Source: Support fleet data from MBTA Commuter Rail Operating Agreement, dated February 5, 2014, and MBTA Commuter Rail Operations. Revenue fleet data from FY MBTA Commuter Rail Fleet Management Plan - DRAFT. Coaches Locomotives

32 Fleet Investments Locomotives Invest in existing locomotives Replace major components on 10 active locomotives (UTEX) 2 year process Focus on reliability improvements Rehab 10 active locomotives Life extending 10 to 15 years Currently ongoing at Motive Power Industries in Boise, Idaho. First unit expected back end of Possible procurement of new locomotives Will be addressed in Fleet Plan Typical 7 year procurement until final acceptance of fleet 32


33 Fleet Investments Coaches Invest in existing coaches Kawasaki rebuild program 118 coaches undergoing rebuild Life extending 10 to 15 years Possible procurement of new coaches Coach for coach replacement Single levels replaced by bi-levels 33
34 Capital Needs Infrastructure Structures Draw 1/Tower A at North Station East Street Bridge Bacon Street Bridge Stations Blue Hill Avenue Station- Open early Ruggles Station Platform Track 2 Upgrades to Ballardvale and Andover Stations Design and plan for accessibility improvements at Winchester, Auburndale, Natick Center, Mansfield, South Attleboro Stations South Station Expansion South Station is at capacity today Provides ability to grow on South Side Addresses need for midday layover South Coast Rail Expands service to New Bedford/ Fall River region Systemwide Track & Signal Upgrades Replace jointed rail with CWR Restore double track Modernize signal system 34

35 Upcoming Projects in FY 2019 Continuation of PTC installation, programming, and testing Installation of additional switch heaters for winter resiliency Franklin double track Study of third track from Framingham to Auburndale System-wide tie replacement 51,000 ties Continue Worcester Line rail replacement Upgrade signal system between Framingham and Boston Continue station brightening program South Station pit lighting Stations at Natick Center and Wellesley Square in design Bridges at Bacon St in Wellesley and Intervale Rd in Weston being rebuilt Installation of smart coach devices Additional locomotive overhauls 35
36 MBTA RAILROAD OPERATIONS QUESTIONS? Ryan D. Coholan Chief Railroad Officer Massachusetts Bay Transportation Authority One South Station, 2 nd Floor, Boston, MA
Commuter Rail Update. October 25, 2018
 Commuter Rail Update October 25, 2018 2 page page 3 State of Commuter Rail Network, July 2014 The 2014 Commuter Rail network had multiple issues and a history of neglect & under-investment FIRST UP? UPGRADES
Roma McKenzie-Campbell Amtrak, Project Manager. Caroline Ducas VHB, Senior Transit Planner. Boston, Massachusetts
 DMU Implementation on Existing Commuter Rail Corridors: Opportunities, Challenges and Lessons Learned Roma McKenzie-Campbell Amtrak, Project Manager Caroline Ducas VHB, Senior Transit Planner Boston, Massachusetts
GM Remarks. Fiscal and Management Control Board. August 14, 2017
 GM Remarks Fiscal and Management Control Board August 14, 2017 Agenda Warehouse / Money Room / Bus Maintenance Commuter Rail Wi-Fi Update Operations Performance Incidents Capital Projects Major Projects
Commuter Rail Positive Train Control (PTC)
") Commuter Rail Positive Train Control (PTC) Update and Communications Plan for Suspension of Weekend Service March 27, 2017 Commuter Rail PTC Update and Communications Plan for Suspension of Weekend Service
Commuter Rail Positive Train Control (PTC) Update and Communications Plan for Suspension of Weekend Service March 27, 2017 Commuter Rail PTC Update and Communications Plan for Suspension of Weekend Service
Commuter Rail Performance. October
 Commuter Rail Performance October 31 2016 1 Background - overall performance Year To Date: 89.67% YTD 125,629 trains North: 90.79% YTD 48,426 trains South: 89.07% YTD 77,203 trains 2 Background - overall
FFYs Transportation Improvement Program
 For Public Review Table 2: Draft Amendment One Summary: Five-Year MBTA Programming Overall Changes in Funding in TIP Project Proposed Change Explanation Section/Funding Source From To Difference Five Year
Newburyport/Rockport Commuter Rail Line
 Newburyport/Rockport Commuter Rail Line Weekday Service Plan during the Beverly Drawbridge Reconstruction Project July 17 August 13 v.5.25.17 The Newburyport/Rockport Commuter Rail Line Construction Projects
BOSTON REGION METROPOLITAN PLANNING ORGANIZATION
 PLANNING ORGANIZATIO BOSTON REGION MPO NMETROPOLITAN BOSTON REGION METROPOLITAN PLANNING ORGANIZATION Richard A. Davey, MassDOT Secretary and CEO and MPO Chairman Karl H. Quackenbush, Executive Director,
System-Wide Accessibility and The Design Guide to Access. Transportation Agencies Liaison Committee Wednesday, June 20 th, 2018
 System-Wide Accessibility and The Design Guide to Access Transportation Agencies Liaison Committee Wednesday, June 20 th, 2018 System-Wide Accessibility: Who is presenting today? Laura Brelsford Assistant
Electric Multiple Unit Procurement Update
 Electric Multiple Unit Procurement Update Public Meetings September 2014 Caltrain Today 2 1 Key Facts Diesel commuter rail system SF to SJ area 77 mile corridor, 32 stations 92 trains / weekday Ridership:
Capital Needs Assessment Riders Advisory Council July2, 2008
 Capital Needs Assessment 2011-2020 Riders Advisory Council July2, 2008 1 Outline I. Capital Improvement Plan History II. Capital Improvement Plan Update III. Capital Needs Assessment State of Good Repair
October 22, Dear Focus40 Project Team:
 October 22, 2018 Dear Focus40 Project Team: On behalf of our over 130,000 members and supporters across the Commonwealth, the Sierra Club Massachusetts Chapter provides these comments on the Focus40 Plan
Metro-North Report on Metrics and Fare Evasion
 Metro-North Report on Metrics and Fare Evasion Performance Metrics Service Performance Improvement Metrics Service Metric OTP SHORT TRAINS SWITCH/SIGNAL DELAYS Change from 2018 2019 Goal YTD Target YTD
MBTA SCORECARD MESSAGE FROM THE GENERAL MANAGER SEPTEMBER Dear reader,
 MESSAGE FROM THE GENERAL MANAGER Dear reader, Thank you for reading the first edition of the MBTA ScoreCard. This ScoreCard reflects the MBTA s commitment to safe and reliable transportation and its goal
The Boston South Station HSIPR Expansion Project Cost-Benefit Analysis. High Speed Intercity Passenger Rail Technical Appendix
 The Boston South Station HSIPR Expansion Project Cost-Benefit Analysis High Speed Intercity Passenger Rail Technical Appendix Prepared by HDR August 5, 2010 The Boston South Station HSIPR Expansion Project
UCLA Lake Arrowhead Conference. October 18, 2010
 BART Click to Capacity edit Master Overview title style for UCLA Lake Arrowhead Conference October 18, 2010 0 BART Basics 360,000 daily riders 104 miles 43 stations 1.3 billion annual passenger miles 1
North South Rail Link Feasibility Reassessment. June 2018
 North South Rail Link Feasibility Reassessment June 2018 Agenda Update and present key findings on the North South Rail Link Feasibility Reassessment: Project Background / Scope Tunnel Alignments, Portals
Appendix. Statistical Profile
 Appendix Statistical Profile MBTA Service and Infrastructure Profile March 2006 MBTA SERVICE DISTRICT ANNUAL RIDERSHIP (FY 2006) Cities and Towns 75 UNLINKED TRIPS BY MODE Size in Square Miles Population
Appendix. Statistical Profile
 Appendix Statistical Profile MBTA Service and Infrastructure Profile August 200 MBTA SERVICE DISTRICT ANNUAL RIDERSHIP (FY 200) Cities and Towns 75 UNLINKED TRIPS BY MODE Size in Square Miles 3,2 Bus (includes
Georgia Department of Transportation 2006 Fact Sheet Lovejoy to Atlanta Rail Line visit the website at
 Overview Georgia Department of Transportation 2006 Fact Sheet Lovejoy to Atlanta Rail Line visit the website at www.garail.com Commuter rail service between Lovejoy and Atlanta is ready for implementation:
UCLA Lake Arrowhead Conference. October 18, 2010
 BART Click to Capacity edit Master Overview title style for UCLA Lake Arrowhead Conference October 18, 2010 0 BART Basics 360,000 daily riders 104 miles 43 stations 1.3 billion annual passenger miles 1
UCLA Lake Arrowhead Conference. October 18, 2010
 BART Click to Capacity edit Master Overview title style for UCLA Lake Arrowhead Conference October 18, 2010 0 BART Basics 360,000 daily riders 104 miles 43 stations 1.3 billion annual passenger miles 1
Martha s Vineyard Regional Transit Authority
 Martha s Vineyard Regional Transit Authority Annual Report Fiscal Year 2005 Martha s Vineyard Transit Authority Fiscal Year ending June 30, 2005 Annual Report Angela E. Grant, Administrator Advisory Board
A Transit Plan for the Future. Draft Network Plan
 A Transit Plan for the Future Draft Network Plan Project Overview and Status Completed Market Analysis and Service Evaluation. Developed Plan Framework and Guiding Principles. Developed a draft Five Year
Portland Area Mainline Needs Assessment DRAFT. Alternative 4 Public Transportation: New or Improved Interstate Bus Service
 Portland Area Mainline Needs Assessment DRAFT Alternative 4 Public Transportation: New or Improved Interstate Bus Service HNTB Corporation April 2018 Table of Contents 4.1 Overview... 4-1 4.2 Key Assumptions...
New Haven Hartford Springfield Rail
 New Haven Hartford Springfield Rail Opportunities for Economic Growth NHHS Rail Conference, October 25, 2011 NHHSrail.com Tom Maziarz, CT DOT, Bureau of Policy & Planning Thomas.Maziarz@ct.gov New Haven
2019 New Transit Service Plan
 Agenda Item 7.2 2019 New Transit Service Plan Draft Proposal VTA Board of Directors January 2019 Background: Next Network Plan and Today s Plan Early 2016 Transit Choices report and the ridership-coverage
Caltrain Modernization EMU Procurement
 Caltrain Modernization EMU Procurement Boarding Height CAC Meeting May 20, 2015 Context 2 1 Riders (Boardings) Average Weekday Ridership Since 2004 143% increase 60,000 55,000 50,000 45,000 40,000 35,000
UPGRADING THE AMTRAK KEYSTONE CORRIDOR
 UPGRADING THE AMTRAK KEYSTONE CORRIDOR Mark A. Wurpel Director Project Initiation & Development Amtrak 2005 AREMA Conference & Exposition Chicago, Illinois ABSTRACT: Upgrading the Amtrak Keystone Corridor
Transit in Bay Area Blueprint
 Rail~Volution 2010 Click to edit Master title style Transit in Bay Area Blueprint October 21, 2010 0 Bottom Line State-of-Good Repair essential for reliable transit service large funding shortfalls BART
Peninsula Corridor Electrification Project Cost / Schedule Update
 Peninsula Corridor Electrification Project Cost / Schedule Update LPMG Meeting November 20, 2014 Context Caltrain/high-speed rail blended system - Primarily 2 track system - Minimize impacts - Shared system
The $600 Million Rebirth of San Diego Trolley
 The $600 Million Rebirth of San Diego Trolley E. Wayne Terry Chief Operating Officer MTS Rail APTA Rail Conference - 2010 1919 San Diego and Arizona Eastern Railroad The Bones of the Original South and
MBTA SCORECARD MESSAGE FROM THE GENERAL MANAGER NOVEMBER Dear reader,
 MESSAGE FROM THE GENERAL MANAGER Dear reader, Thank you for reading the MBTA ScoreCard. This ScoreCard reflects the MBTA s commitment to safe and reliable transportation and its goal of being transparent
UTA Transportation Equity Study and Staff Analysis. Board Workshop January 6, 2018
 UTA Transportation Equity Study and Staff Analysis Board Workshop January 6, 2018 1 Executive Summary UTA ranks DART 6 th out of top 20 Transit Agencies in the country for ridership. UTA Study confirms
Customer Services, Operations, and Safety Committee Board Information Item III-E May 13, 2010 Bus Fleet Plan
 Customer Services, Operations, and Safety Committee Board Information Item III-E May 13, 2010 Bus Fleet Plan Page 72 of 96 Washington Metropolitan Area Transit Authority Board Action/Information Summary
The Future of Rail in Maryland. Kevin B. Quinn, Jr. Administrator
 The Future of Rail in Maryland Kevin B. Quinn, Jr. Administrator The Future of Rail in Maryland Rolling Stock Metro Railcar Replacement Under the project, MDOT MTA is replacing the metro fleet with 78
Proposal for September 2006 Start of Commuter Rail from Lovejoy on the Macon Line to Atlanta
 Proposal for September 2006 Start of Commuter Rail from Lovejoy on the Macon Line to Atlanta Overview Commuter rail service between Lovejoy and Atlanta is ready for implementation: $87.08 Million is in
5. OPPORTUNITIES AND NEXT STEPS
 5. OPPORTUNITIES AND NEXT STEPS When the METRO Green Line LRT begins operating in mid-2014, a strong emphasis will be placed on providing frequent connecting bus service with Green Line trains. Bus hours
New Haven-Hartford-Springfield Rail Project Gateway to New England. Program Update March 14, 2011 Revised & Updated March 31, 2011
 New Haven-Hartford-Springfield Rail Project Gateway to New England Program Update March 14, 2011 Revised & Updated March 31, 2011 1 New Haven-Hartford-Springfield Rail Corridor Glory Days: 1925-1955 22
Balancing the Transportation Needs of a Growing City
 Balancing the Transportation Needs of a Growing City FY 2019 and FY 2020 Capital Budget SFMTA Board Meeting Ed Reiskin, Director of Transportation April 3, 2018 1 FY 2019-23 Capital Improvement Program
CREATING CONNECTIONS IN WATERLOO REGION
 CREATING CONNECTIONS IN WATERLOO REGION GORD TROUGHTON, DIRECTOR, CORRIDOR INFRASTRUCTURE CHRIS BURKE, DIRECTOR, SERVICE PLANNING ERIN MOROZ, DIRECTOR, COMMUNICATIONS AND COMMUNITY RELATIONS METROLINX
TORONTO TRANSIT COMMISSION REPORT NO.
 Form Revised: February 2005 TORONTO TRANSIT COMMISSION REPORT NO. MEETING DATE: October 24, 2012 SUBJECT: DOWNTOWN RAPID TRANSIT EXPANSION STUDY (DRTES) PHASE 1 STRATEGIC PLAN ACTION ITEM RECOMMENDATIONS
Valley Metro Overview. ITE/IMSA Spring Conference March 6, 2014
 Valley Metro Overview ITE/IMSA Spring Conference March 6, 2014 Valley Metro Who Are We? Operate Regional Transit Services Valley Metro and Phoenix are region s primary service providers Light Rail and
End-of-Year Performance Report FY Community Relations Committee December 5, 2018
 End-of-Year Performance Report FY 2018 Community Relations Committee December 5, 2018 Annual Summary Shuttles Ridership All Modes Performance Statistics Highlights All Modes Initiatives 2 Bus Ridership
Precision Station Stopping Progress Update
 Washington Metropolitan Area Transit Authority Precision Station Stopping Progress Update Presented to: The Board of Directors; Customer Service, Operations and Safety Committee By PlanninghDevelopmenthEngineeringhConstruction
ScoreCard November 2013 [Oct 13 Data] Ridership
![ScoreCard November 2013 [Oct 13 Data] Ridership](/thumbs/95/126521028.jpg "ScoreCard November 2013 [Oct 13 Data] Ridership") ScoreCard November 213 [Oct 13 Data] Ridership Average Weekday Ridership Sep 213: 1.37M Down.2 % from Sep 212 System Maintenance A key measure of system maintenance is the travel time impact of slowdowns
ScoreCard November 213 [Oct 13 Data] Ridership Average Weekday Ridership Sep 213: 1.37M Down.2 % from Sep 212 System Maintenance A key measure of system maintenance is the travel time impact of slowdowns
ScoreCard Jun 2014 [May 14 Data] Ridership
![ScoreCard Jun 2014 [May 14 Data] Ridership](/thumbs/93/113666940.jpg "ScoreCard Jun 2014 [May 14 Data] Ridership") + ScoreCard Jun 214 [May 14 Data] Ridership Average Weekday Ridership May 14: 1.36M Up 2.% from May 213 Year-to-Year Change: May 13 to Present -.6% -1.% -2.3% -1.7%.4% 4.9% -.2% -.3% -3.8%.8%.7% 3.1% 2.%
+ ScoreCard Jun 214 [May 14 Data] Ridership Average Weekday Ridership May 14: 1.36M Up 2.% from May 213 Year-to-Year Change: May 13 to Present -.6% -1.% -2.3% -1.7%.4% 4.9% -.2% -.3% -3.8%.8%.7% 3.1% 2.%
CTfastrak Expansion. Stakeholder Meeting #4 Manchester Town Hall June 3, 2016
 CTfastrak Expansion Stakeholder Meeting #4 Manchester Town Hall June 3, 2016 Today s Agenda Phase I Update 2016 Service Plan Implementation Schedule & Cost Update Phase II Services Timeline Market Analysis
RIDERSHIP TRENDS. April 2018
 RIDERSHIP TRENDS April Prepared by the Division of Strategic Capital Planning June Table of Contents Executive Summary...1 Ridership...3 Estimated Passenger Trips by Line...3 Estimated Passenger Trips
ScoreCard February 2014 [Jan 14 Data] Ridership
![ScoreCard February 2014 [Jan 14 Data] Ridership](/thumbs/93/113666999.jpg "ScoreCard February 2014 [Jan 14 Data] Ridership") + ScoreCard February 214 [Jan 14 Data] Ridership Average Weekday Ridership Jan 214: 1.22M Down 3.8% from Jan 213 System Maintenance A key measure of system maintenance is the travel time impact of slowdowns
+ ScoreCard February 214 [Jan 14 Data] Ridership Average Weekday Ridership Jan 214: 1.22M Down 3.8% from Jan 213 System Maintenance A key measure of system maintenance is the travel time impact of slowdowns
Long Island Rail Road Performance Metrics Report
 Long Island Rail Road Metrics Report On Time and Number of Short Trains are important metrics to customers. The LIRR has shown marked improvement in these two areas through March 2019. Executive Summary
Proposed FY2015 Budget and Fare Increase
 Washington Metropolitan Area Transit Authority Proposed FY2015 Budget and Fare Increase Riders Advisory Council January 8, 2014 1 Washington Metropolitan Area Transit Authority What will riders see from
Metropolitan Council Budget Overview SFY
 Metropolitan Council Budget Overview SFY 2016-2017 H T t ti C itt House Transportation Committee February 4, 2015 Transit connects us to the places that matter Transportation Needs Grow as the Region Grows
The Case for. Business. investment. in Public Transportation
 The Case for Business investment in Public Transportation Introduction Public transportation is an enterprise with expenditure of $55 billion in the United States. There has been a steady growth trend
The Latest on Joint Development Policy Guidance
 Panelists The Latest on Joint Development Policy Guidance Moderator: Jonathan Davis Deputy General Manager and Chief Financial Officer Massachusetts Bay Transportation Authority James Blakesley, Attorney-Advisor,
SamTrans Business Plan Update May 2018
 SamTrans Business Plan Update May 2018 SamTrans Business Plan Core Principles: 1. Sustain and enhance services for the transit-dependent 2. Expand and innovate mobility services 3. Promote programs that
FINAL. Sound Transit Long-Range Plan Update. Issue Paper S.1: Tacoma Link Integration with Central Link. Prepared for: Sound Transit
 Sound Transit Long-Range Plan Update Issue Paper S.1: Tacoma Link Integration with Central Link Prepared for: Sound Transit Prepared by: Quade & Douglas, Inc. FINAL March 2005 Foreword This issue paper
Capital Metro Plans & Projects Update NASWC July 27, capmetro.org
 Capital Metro Plans & Projects Update NASWC July 27, 2017 1 Capital Metro at a Glance Established in 1985 535 square mile service area 1,079,995 population 7 Member Cities Austin Leander Manor Lago Vista
Madison BRT Transit Corridor Study Proposed BRT Operations Plans
 Madison BRT Transit Corridor Study Proposed BRT Operations Plans This paper presents a description of the proposed BRT operations plan for use in the Madison BRT Transit Corridor Study. The objective is
Troost Corridor Transit Study
 Troost Corridor Transit Study May 23, 2007 Kansas City Area Transportation Authority Agenda Welcome Troost Corridor Planning Study Public participation What is MAX? Survey of Troost Riders Proposed Transit
Electric Multiple Unit Procurement Update
 Electric Multiple Unit Procurement Update Board of Directors August 7, 2014 Context* * The proposed project is not yet approved pending environmental clearance. 2 1 Status April 2014 - JPB update on EMU
Proposed FY Capital Improvement Program (CIP) March 5, 2018 Capital Planning Committee 1
 March 5, 2018 Capital Planning Committee 1") Proposed FY 2019-2023 Capital Improvement Program (CIP) March 5, 2018 Capital Planning Committee 1 The Capital Improvement Program is: A fiscally constrained, 5-year program of capital projects An implementation
Proposed FY 2019-2023 Capital Improvement Program (CIP) March 5, 2018 Capital Planning Committee 1 The Capital Improvement Program is: A fiscally constrained, 5-year program of capital projects An implementation
Customer Services, Operations, and Safety Committee Board Information Item III-D May 13, 2010 Rail Fleet Plan
 Customer Services, Operations, and Safety Committee Board Information Item III-D May 13, 2010 Rail Fleet Plan Page 54 of 96 Washington Metropolitan Area Transit Authority Board Action/Information Summary
The City of Toronto s Transportation Strategy July 2007
 The City of Toronto s Transportation Strategy July 2007 Presentation Outline Transportation Statistics Transportation Building Blocks Toronto s Official Plan Transportation and City Building Vision Projects
The Northeast Corridor Master Plan Amtrak s Next Generation High-Speed Rail and Northeastern Maryland
 The Northeast Corridor Master Plan Amtrak s Next Generation High-Speed Rail and Northeastern Maryland Chesapeake Science & Security Corridor Regional Rail Committee Meeting October 20, 2010 Drew Galloway
REPORT CARD FOR CALIFORNIA S INFRASTRUCTURE WHAT YOU SHOULD KNOW ABOUT CALIFORNIA S TRANSIT FACILITIES
 TRANSIT GRADE: C- WHAT YOU SHOULD KNOW ABOUT TRANSIT FACILITIES California needs robust, flexible and reliable transit systems to reduce peak congestion on our highways, provide options for citizens who
High Quality Service through Continuous Improvement st Quarter Performance Report
 High Quality Service through Continuous Improvement 6 st Quarter Performance Report TriMet Board Meeting May 5, 6 Quality is a never ending quest and continuous improvement is a never ending way to discover
DART Priorities Overview
 City of Dallas Transportation and Trinity River Project Committee DART Priorities Overview Gary C. Thomas President/Executive Director August 10, 2015 City of Dallas Transportation & Trinity River Committee
Expansion Projects Description
 Expansion Projects Description The Turnpike expansion program was authorized by the Florida Legislature in 1990 to meet the State s backlog of needed highway facilities. The Legislature set environmental
Waco Rapid Transit Corridor (RTC) Feasibility Study
 Feasibility Study") Waco Rapid Transit Corridor (RTC) Feasibility Study Chris Evilia, Director of Waco Metropolitan Planning Organization Allen Hunter, General Manager Waco Transit System Jimi Mitchell, Project Manager AECOM
Waco Rapid Transit Corridor (RTC) Feasibility Study Chris Evilia, Director of Waco Metropolitan Planning Organization Allen Hunter, General Manager Waco Transit System Jimi Mitchell, Project Manager AECOM
TENTH EDITION - CONTENTS
 Ridership and Service Statistics Tenth Edition, 2004-2005 Massachusetts Bay Transportation Authority Daniel A. Grabauskas, General Manager Chapter 1 - Introduction TENTH EDITION - CONTENTS About This Book
MTA Long Island Rail Road (LIRR) and MTA Metro-North Railroad (MNR) System-wide Service Standards
 and MTA Metro-North Railroad (MNR) System-wide Service Standards") MTA Long Island Rail Road (LIRR) and MTA (MNR) System-wide Service Standards The following system-wide service standards apply to LIRR and MNR operations. 1. Service Availability Service Availability is
MTA Long Island Rail Road (LIRR) and MTA (MNR) System-wide Service Standards The following system-wide service standards apply to LIRR and MNR operations. 1. Service Availability Service Availability is
2012 MULTIMODAL OPERATIONS WORKSHOP
 New Haven-Hartford-Springfield Rail Program Gateway to New England Jeffrey T. Schultz, PMP Senior Principal Technical Specialist Parsons Brinckerhoff Glastonbury, CT July 31, 2012 2012 MULTIMODAL OPERATIONS
RIDERSHIP TRENDS. March 2017
 RIDERSHIP TRENDS March 2017 Prepared by the Division of Strategic Capital Planning May 2017 Table of Contents Executive Summary...1 Ridership...3 Estimated Passenger Trips by Line...3 Estimated Passenger
ACT Canada Sustainable Mobility Summit Planning Innovations in Practice Session 6B Tuesday November 23, 2010
 ACT Canada Sustainable Mobility Summit Planning Innovations in Practice Session 6B Tuesday November 23, 2010 Presentation Outline Context t of Mississauga i City Centre Implementing Paid Parking and TDM
HOUSING VOUCHERS FUNDED IN MASSACHUSETTS UNDER PENDING PROPOSALS
 820 First Street NE, Suite 510 Washington, DC 20002 Tel: 202-408-1080 Fax: 202-408-1056 center@cbpp.org www.cbpp.org November 1, HOUSING VOUCHERS FUNDED IN MASSACHUSETTS UNDER PENDING PROPOSALS For 2007,
Mass Transit in Charlotte and San Antonio. Keith T. Parker, AICP
 Mass Transit in Charlotte and San Antonio Keith T. Parker, AICP President/CEO Presentation Overview Charlotte Agency and Customer Profile San Antonio Agency and Customer Profile Attracting New Customers
State Avenue Corridor Bus Rapid Transit (BRT)
") State Avenue Corridor Bus Rapid Transit (BRT) Moving Forward Incrementally April 2010 State Ave. BRT Update Bus Rapid Transit Overview State Ave. Alternatives Analysis Results What s Coming Up Right Away!
State Avenue Corridor Bus Rapid Transit (BRT) Moving Forward Incrementally April 2010 State Ave. BRT Update Bus Rapid Transit Overview State Ave. Alternatives Analysis Results What s Coming Up Right Away!
RIDERSHIP TRENDS. July 2018
 RIDERSHIP TRENDS July Prepared by the Division of Strategic Capital Planning September Table of Contents Executive Summary...1 Ridership...3 Estimated Passenger Trips by Line...3 Estimated Passenger Trips
CHAPTER 5 CAPITAL ASSETS
 CHAPTER 5 CAPITAL ASSETS This chapter describes the capital assets of GCTD, including revenue and nonrevenue vehicles, operations facilities, passenger facilities and other assets. VEHICLE REVENUE FLEET
Keeping Seattle Moving Seattle City Council February 2013
 Keeping Seattle Moving Seattle City Council February 2013 Seattle City Council February 2013 1 Mobility Challenges Ahead Viaduct mitigation expires June 2014 Potential system-wide service cuts begin in
ACT 89: THE FOUNDATION TO REBUILD SEPTA FOR THE FUTURE JOSEPH M. CASEY GENERAL MANAGER
 ACT 89: THE FOUNDATION TO REBUILD SEPTA FOR THE FUTURE JOSEPH M. CASEY GENERAL MANAGER MARCH 12, 2015 CAPITAL BUDGET TREND HISTORIC FUNDING SHORTFALLS $350 $300 PA ACT 26 (1991) $312 PA ACT 44 (2007) $293
Link LRT: Maintenance Bases, Vehicles and Operations for ST2 Expansion
 Project Number SYS-LRT Subareas All Primary Mode Impacted Link Facility Type Link Service Version Number 4.0 Date Last Modified 7/24/2008 Project Locator Map Short Project Description Construct new light
FOR IMMEDIATE RELEASE January 17, CONTACT: Mayor s Press Office
 FOR IMMEDIATE RELEASE January 17, 2012 CONTACT: Mayor s Press Office 312.744.3334 press@cityofchicago.org MAYOR EMANUEL OPENS NEWLY-RENOVATED GRAND AVENUE RED LINE STATION Announces New Green Line Station
Mobility Management: Caltrain
 Mobility Management: Caltrain Community Relations Committee October 4, 2017 Agenda Item 7 Presentation Outline Operating Statistics Ridership On-time Performance Fleet Reliability Capital Program Review
Overview of Transit Funding and Planning in the PACTS Region
 Overview of Transit Funding and Planning in the PACTS Region Presentation to PACTS Transit Committee and Federal Transit Administration Representatives February 8, 2018 Transit Agencies Agency Communities
Mississauga Transit 2009 Budget
 Mississauga Transit 2009 Budget Budget Committee Presentation December 2, 2008 Revenue Ridership Forecasted 2008 Total Rides Including transfers 11% growth in the last 24 months Transit Service Area Business
Click to edit Master title style
 P3s Come In All Shapes And Sizes Mr. Greg Slater, Administrator 7/26/2018 1 1 Customer-Driven Customer First TODAY S DISCUSSION Introduction to MDOT MDOT P3 Experience Full Delivery Stream Restoration
Ohio Passenger Rail Development. Northwest Ohio Passenger Rail Association
 Ohio Passenger Rail Development Northwest Ohio Passenger Rail Association Ohio Rail Development Commission June 11, 2010 Ohio Strategy Establish the Market Grow the Market Capture the Value of the Market
Positive Train Control (PTC)
") Positive Train Control (PTC) PTC at a glance FasTracks systems have Positive Train Control (PTC) technology called I-ETMS. This is a complex GPS-and-communications-based system that reduces the risk of
Positive Train Control (PTC) PTC at a glance FasTracks systems have Positive Train Control (PTC) technology called I-ETMS. This is a complex GPS-and-communications-based system that reduces the risk of
CREATING CONNECTIONS IN THE CITY OF WATERLOO
 CREATING CONNECTIONS IN THE CITY OF WATERLOO GORD TROUGHTON, DIRECTOR, CORRIDOR INFRASTRUCTURE METROLINX ERIN MOROZ, DIRECTOR, COMMUNICATIONS AND COMMUNITY RELATIONS METROLINX METROLINX PRESENTATION TO
Late Starter. Tuesday, November 6, 2018
 Late Starter Tuesday, Please note the following item(s) was not included with your agenda as this item(s) was received after the agenda package was printed. Planning and Works Committee Report TES-RTS-18-09,
Sound Transit Operations July 2016 Service Performance Report. Ridership
 Ridership Total Boardings by Mode Mode Jul-15 Jul-16 % YTD-15 YTD-16 % ST Express 1,618,779 1,545,852-4.5% 10,803,486 10,774,063-0.3% Sounder 333,000 323,233-2.9% 2,176,914 2,423,058 11.3% Tacoma Link
Form Revised: February 2005 TORONTO TRANSIT COMMISSION REPORT NO. MEETING DATE: August 30, SUBJECT: Scarborough Rt Strategic Plan
 Form Revised: February 2005 TORONTO TRANSIT COMMISSION REPORT NO. MEETING DATE: August 30, 2006 SUBJECT: Scarborough Rt Strategic Plan RECOMMENDATIONS It is recommended that the Commission: 1. Endorse
METRO SERVICE CHANGE LINE 577 EXPRESS: A TALE OF TWO BUS LINES
 METRO SERVICE CHANGE LINE 577 EXPRESS: A TALE OF TWO BUS LINES METRO SERVICE TO RIO HONDO COLLEGE LINE 270 LINE 577 El Monte Rio Hondo College 2 BACKGROUND Overcrowding problems identified on Line 270
Chicago Milwaukee Intercity Passenger Rail Corridor
 Chicago Milwaukee Intercity Passenger Rail Corridor Past, Present, and Future Arun Rao, Passenger Rail Manager Wisconsin Department of Transportation Elliot Ramos, Passenger Rail Engineer Illinois Department
Time (secs) Distance (feet) Accel (mphps) , , , , ,388 0.
 Distance (feet) Accel (mphps) , , , , ,388 0.") EQUIPMENT Locomotive Hauled vs. Diesel Multiple Units Ohio Rail Development Commission November 19, 2009 Presentation Outline Typical Characteristics Locomotive-hauled equipment DMU Performance Performance
EQUIPMENT Locomotive Hauled vs. Diesel Multiple Units Ohio Rail Development Commission November 19, 2009 Presentation Outline Typical Characteristics Locomotive-hauled equipment DMU Performance Performance
Southeastern Pennsylvania Transportation Authority
 Southeastern Pennsylvania Transportation Authority Overview of Transit Services, Capital Improvement Plans and Challenges in Chester County April 10, 2013 Public Transportation Provides mobility for work,
Future of FrontRunner Final Report
 Future of FrontRunner Final Report Prepared for UTA by LTK Engineering Services In association with Fehr & Peers Jacobs Engineering Document Number: LTK.C5016.02 September 2018 Table of Contents Future
HDR Engineering. HART North / South. Tampa Bay Applications Group Meeting May 14, 2009
 HDR Engineering HART North / South BRT Corridor PD&E Tampa Bay Applications Group Meeting May 14, 2009 1 Agenda Update on Project Development and Environment (PD&E) Study Project Overview System Branding