BOSTON REGION METROPOLITAN PLANNING ORGANIZATION
|
|
|
- Francis Bryant
- 5 years ago
- Views:
Transcription
1 PLANNING ORGANIZATIO BOSTON REGION MPO NMETROPOLITAN BOSTON REGION METROPOLITAN PLANNING ORGANIZATION Richard A. Davey, MassDOT Secretary and CEO and MPO Chairman Karl H. Quackenbush, Executive Director, MPO Staff DATE May 1, 2014 TO MEMORANDUM Congestion Management Process Committee Boston Region MPO FROM Ryan Hicks and Hiral Gandhi MPO Staff RE Inventory of Park-and-Ride Lots at MBTA Facilities 1 INTRODUCTON The primary purpose of this memorandum is to present the results from the inventory of park-and-ride lots serving Massachusetts Bay Transportation Authority (MBTA) facilities. Comparisons to previous inventories are also included in this memorandum. Between October 2012 and June 2013, Boston Region MPO staff inventoried MBTA, private, and town-operated parking facilities at 149 locations comprising 116 commuter rail stations, 28 rapid transit stations, three ferry terminals, and two express bus origin locations. Appendix A contains tables of parking utilization rates for all of the parking lots that were surveyed. Appendix E consists of detailed comparisons of the inventory with previous inventories by transit mode. Information about parking fees, and several maps that display inventoried data, are in Appendices B, C, D, and F. This memorandum has five main sections and six appendices. The main sections are: 1. Introduction 2. Background 3. Inventory results: parking utilization 4. Major Regional Park-and-Ride Lots and Park-and-Ride Lots at Terminal s 5. Inventory Results: Amenities 6. Conclusion State Transportation Building Ten Park Plaza, Suite 2150 Boston, MA Tel. (617) Fax (617) TTY (617)
2 Congestion Management Committee 2 May 1, BACKGROUND The Congestion Management Process (CMP) is an ongoing Boston Region MPO program. One of the CMP s objectives is to monitor congestion-related performance measures for the region s transportation system. The monitored CMP facilities include arterial roadways, freeways, commuter rail, rapid transit, buses, park-and-ride, and bicycle/pedestrian facilities. As part of the CMP, data are collected, gathered, and analyzed on a periodic basis. Planners and decision makers can refer to these data to identify needs, and to prioritize transportation projects and program funds. This memorandum uses primarily parking utilization rates to assess the surplus or deficiencies of parking capacity at park-and-ride lots that serve MBTA stations. Parking utilization is defined in this report as the percentage of non spaces that do not require a permit that are used by the end of the MBTA-defined AM peak period, which ends after the last inbound peakperiod train, bus, or ferry leaves its respective station, as indicated by the MBTA s online schedule. 1,2 Parking utilization rates can indicate how commuters are impacted by changes such as the addition of spaces, construction of a park-and ride lot, addition of a new station, or change in the cost of an MBTA transit pass. Data posted on the web can be used by the public to make decisions about travel plans, based on information about the capacity and utilization of a parking lot on a typical day. Prior to the inventory, park-and-ride data for MBTA stations were last collected between January 2009 and August Previous inventories were done in 2000, 2002, and The 2002 inventory included only park-andride lots that were located in the Boston Region MPO area, and used data from the 2000 inventory for lots that were located outside of the Boston Region MPO area. 2.1 Data Collection Park-and-ride lots were inventoried by performing a one-time observation during the morning peak period of a typical weekday between October Accessible parking spaces are defined in this memorandum as parking spaces that are specifically designated to provide persons with disabilities better access to MBTA facilities by automobile. Refer to Section 5.2 for more information. The last peak-period commuter rail train typically begins its inbound trip before 9:00 AM and arrives at either North or South by 9:50 AM. The last peak-period rapid transit, bus, or ferry vehicle typically begins its inbound trip before 9:00 AM. Boston Region Metropolitan Planning Organization, memorandum titled Inventory of Parkand-Ride Lots at MBTA Facilities, April 27, 2011
3 Congestion Management Committee 3 May 1, 2014 and June A typical weekday is defined as a Tuesday, Wednesday, Thursday, or Friday that is not a holiday. 4,5 For the purpose of this survey, MPO staff developed a survey form (Appendix C). When completed, the form contains information about each parking lot, including the parking lot ownership, parking cost and restrictions, number of parking spaces, and number of parked vehicles. All of this information is summarized in Appendix A. The surveyors were instructed to survey each lot immediately after the last inbound peak-period trip. The time of the last inbound train, express bus, or ferry varies by station. After the last AM peak-period train, ferry, or express bus departed the station, the surveyor inventoried every parking lot that was used for a given station or express bus origin location. A separate survey form was filled out for each parking lot, as many stations have several nearby parking lots. All park-and-ride lots that are known to serve MBTA commuters were surveyed. (Lots serving only commuters who use non-mbta transportation were not surveyed. 6 ) The lots surveyed included all MBTA-owned, privately owned, and town lots at all commuter rail, rapid transit, and commuter ferry stations, and at all express bus origin locations. The locations of these lots were ascertained from past inventories, information provided on the MBTA s website ( and field visits performed by MPO staff. All of the parking spaces referred to in this memorandum, unless otherwise indicated, are non, non-permit parking spaces, and the total capacity and utilization rates were calculated for each station. Section 5.2 gives data on the availability of parking along each transit line. Many stations have permit-only lots in addition to public lots. Most permit-parking lots are either municipally or privately owned, and their use is restricted to permit owners. In many cases, a local residency is required in order to obtain a permit. Because the focus of this memorandum is on the availability of parking to the general public at MBTA park-and-ride lots, the permit-only and resident-only parking spaces are excluded from totals and utilization percentages for all modes of transit. However, permit-only and resident-only parking spaces were included in If unusual circumstances occurred during the day of observation such as delays in MBTA service, inclement weather, construction, major events, holidays, and traffic incidents, the survey of that parking lot was conducted again, on a different day. All public and private lots near MBTA stations are included in the analysis of this memorandum, the parking capacities of the MBTA stations that are listed in this memorandum may differ from the capacities that are displayed on the MBTA s website. Some MBTA stations also serve independent transportation entities, such as Logan Express or Amtrak. These stations sometimes have designated overnight parking lots for those services. These lots are excluded from the inventories reflected in this memorandum.
4 Congestion Management Committee 4 May 1, 2014 the survey, and this memorandum includes the discussion of the availability and utilization of these spaces in section Factors Impacting MBTA Parking Lot Utilization over Time Since the earlier inventories were conducted, there have been many changes that could have affected parking lot utilization by MBTA customers: changes in the economy, MBTA fares, and the number of available parking spaces. Some of these changes are recent, while others are periodically recurring, regardless of the time period. Although it is not possible to estimate the degree of contribution of each of these factors to the utilization of parking spaces, the factors are summarized here so that the reader can take them into account while reviewing the inventory results. Changes in Parking Capacity: and Inventories There have been changes in parking capacity since the inventory was completed. One of the changes is a net increase of 1,846 public, non-permit parking spaces near MBTA stations since the inventory. 7 This resulted from the removal of 2,848 spaces at certain stations and the addition of 2,832 spaces at other stations. In addition, a total of 1,668 spaces were added at the T. F. Green Airport and Wickford Junction stations, both of which opened since the previous inventory was conducted). There are 194 parking spaces at the Watertown Yard parking lot that are not included in this comparison because the station was not surveyed for in inventory. The new T.F. Green Airport and Wickford Junction stations parking capacity and utilization are included in the inventory analysis. The additional parking spaces associated with the new stations contribute to the perception that the overall utilization of a portion of the MBTA system has decreased. There have also been locations within the MBTA system where parking lots near stations have closed; the result is that nearby parking lots have experienced increases in utilization. This could imply that nearby stations have added new commuters, whereas these new commuters had been displaced from the closed parking lots. An example of a parking lot that was closed is the parking facility near the Quincy Center MBTA station, which provided 863 parking spaces; it was closed after the inventory. 8 Due in large part to 7 8 This figure includes the addition of 1,668 parking spaces at T. F. Green Airport and Wickford Junction, inclusion of the 194 parking spaces at Watertown Yard, and the addition or removal of spaces at various stations since the inventory. The Quincy Center Garage was closed because of structural problems in July The reopening or redesign of the Quincy Center Garage is uncertain when the analysis for this memorandum was being conducted.
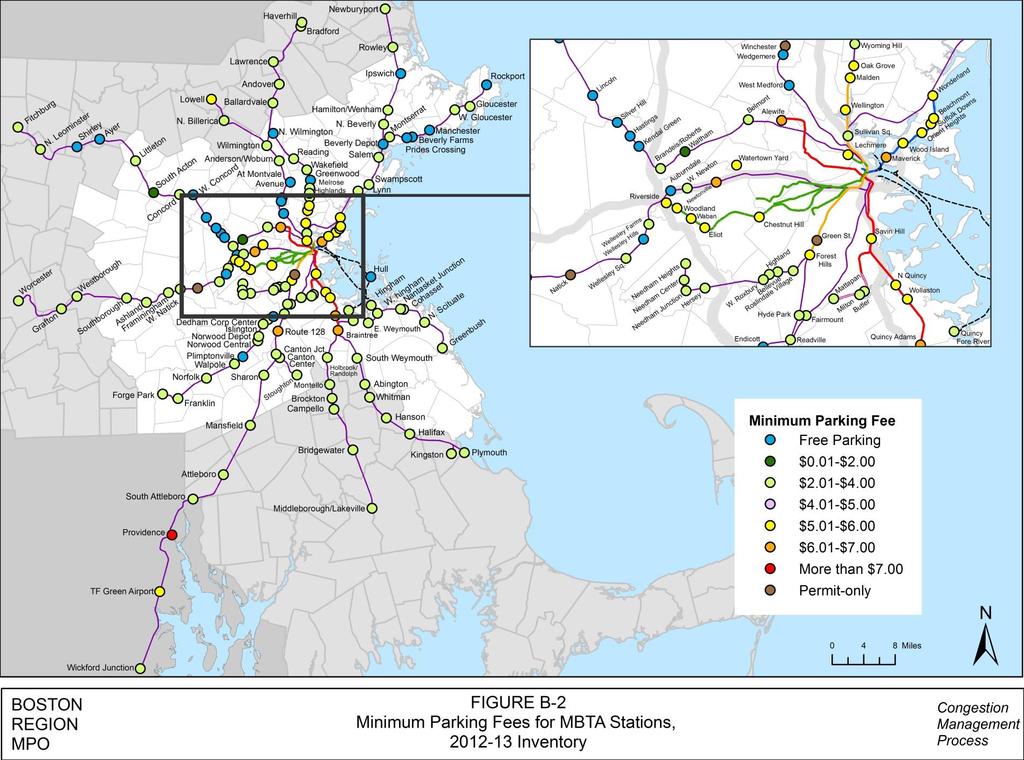
5 Congestion Management Committee 5 May 1, 2014 parking facility closures, the total public non-permit parking spaces near MBTA stations that were surveyed in both and has decreased by 16 spaces between those two inventories. Table 1 lists the stations where the total number of parking spaces (not including permit only or spaces) had changed by either 150 or more spaces, or by more than 50 percent, since the inventory. MBTA Parking Fare Changes Since the inventory was conducted, daily parking fees have changed at 33 MBTA stations. At the time of the survey, most commuter rail stations charged $3.00 to $4.00 per day. At most of the rapid transit stations, parking fees ranged from $5.00 to $7.00. The stations that experienced changes in parking fees are listed in Table 2. Previous parking rate increases took place on November 15, 2008, when the rates for most MBTA stations increased by $2.00, and on July 1, 2005, when the prices of rapid transit parking increased by 50 cents. There was also an increase on January 6, 2003, when prices increased by 50 cents at rapid transit stations and by $1.00 at commuter rail stations. In January 2011, the MBTA announced the availability of monthly parking permits for selected MBTA stations. At the time of the inventory, there were 77 MBTA stations that had monthly parking available. The rate for most of the lots was $70.00, saving regular commuters approximately $10.00 a month compared to the cost of paying daily. Figure B-2, in Appendix B, is a map showing the minimum parking fee at each station.
6 Congestion Management Committee 6 May 1, 2014 TABLE 1 s with Significant Changes in the Number of Parking Spaces between the and Inventories Total Public Parking Spaces: Total Public Parking Spaces: Change in Total Spaces Name Transit Line Mode North Leominster Fitchburg/South Acton Commuter rail Worcester Framingham/Worcester Commuter rail Greenbush Greenbush Commuter rail Reading Haverhill Commuter rail Wedgemere Lowell Commuter rail Winchester Lowell Commuter rail Needham Heights Needham Commuter rail Providence Providence/Stoughton Commuter rail South Attleboro Providence/Stoughton Commuter rail 1, T. F. Green Providence/Stoughton Commuter rail Wickford Junction Providence/Stoughton Commuter rail 0 1,077 1,077 Maverick Blue Line Rapid transit Wonderland Blue Line Rapid transit 2,643 2, Green Street Orange Line Rapid transit Malden Orange Line Rapid transit Braintree Red Line Rapid transit 981 1, Quincy Center Red Line Rapid transit
7 Congestion Management Committee 7 May 1, 2014 Name TABLE 2 s with Parking Fare Changes between the and Inventories Transit Line Minimum Parking Fee Minimum Parking Fee Change in Parking Fee Littleton Fitchburg/South Acton $0.00 $4.00 $4.00 Auburndale Framingham/Worcester $0.00 $4.00 $4.00 Wellesley Square Framingham/Worcester $2.50 $4.50 $2.00 West Newton Framingham/Worcester $0.00 $4.00 $4.00 Lawrence Haverhill $3.00 $3.50 $0.50 Melrose Cedar Park Haverhill $2.00 $3.00 $1.00 Melrose Highlands Haverhill $2.00 $3.00 $1.00 Wyoming Hill Haverhill $2.00 $3.00 $1.00 Attleboro Providence/Stoughton $4.00 $3.00 -$1.00 Providence Providence/Stoughton $8.55 $9.00 $0.45 Route 128 Providence/Stoughton $5.00 $7.00 $2.00 South Attleboro Providence/Stoughton $4.00 $3.00 -$1.00 T. F. Green a Providence/Stoughton N/A $6.75 N/A Wickford Junction a Providence/Stoughton N/A $4.00 N/A Wonderland Blue Line $4.00 $5.00 $1.00 Wood Island Blue Line $3.00 $5.00 $2.00 Chestnut Hill Green Line $5.50 $6.00 $0.50 Eliot Green Line $5.50 $6.00 $0.50 Lechmere Green Line $5.50 $6.00 $0.50 Riverside Green Line $5.75 $6.00 $0.25 Waban Green Line $5.50 $6.00 $0.50 Green Street Orange Line $5.00 Permit-only N/A Malden Orange Line $5.50 $6.00 $0.50 Oak Grove Orange Line $5.50 $6.00 $0.50 Sullivan Square Orange Line $5.00 $4.00 -$1.00 Butler Red Line $0.00 $4.00 $4.00 Milton Red Line $5.00 $4.00 -$1.00 Quincy Center Red Line $7.00 Facility closed N/A Savin Hill Red Line $0.00 $5.00 $5.00 Watertown Yard Bus Not surveyed $5.00 N/A Quincy/Fore River Ferry $3.00 $4.00 $1.00 Hingham Ferry $3.00 $4.00 $1.00 a New station N/A = not applicable
8 Congestion Management Committee 8 May 1, 2014 State Fiscal Year 2013 Changes in MBTA Boarding Fares On July 1, 2012, the MBTA implemented changes in its service fare structure. These are shown in Appendix F. The notable fare changes are: Rapid transit fees increased from $1.70 to $2.00 per ride ($2.50 if paying by CharlieTicket or cash). The outer express buses that serve bus Route 354, which stops at the Montvale Avenue park-and-ride lot, in Woburn, increased from $4.00 to $5.00 per ride ($6.50 if paying by CharlieTicket or cash). Commuter rail monthly passes experienced increases of $11.00 to $64.00 per month, depending on the zone of travel. (Single rides increased by $.30 to $2.25, depending on the zone of travel.) Commuter ferry monthly passes increased from $ to $ per month. (Single rides experiences increases of $1.30 to $4.00 per trip, depending on the route). MBTA Service Changes In the period between the and inventories, there were several MBTA service changes. Although many of those changes seem minor, they may have had significant impacts on the park-and-ride utilization at certain MBTA stations. For example, if a feeder bus service is reduced, more commuters may instead drive to MBTA stations, causing parking utilization to increase at those stations. State Fiscal Year 2013 MBTA Service Changes 9 In July 2012, the MBTA implemented significant service changes in an effort to balance its budget. The service changes that potentially affected the peakperiod commute at the MBTA stations that were surveyed for the park-and-ride inventory are listed below: MBTA bus Routes 355 and 500 were eliminated. Bus Routes 52, 217, 351, 354, 439, 441, 442, 451, 455, and 555 all experienced schedule or route changes. 9 MBTA Service Changes, %20Changes_v3.pdf (accessed March 3, 2014).
9 Congestion Management Committee 9 May 1, 2014 Other MBTA Service Changes, In addition to the FFY 2012 MBTA service changes, there were other notable alterations to the MBTA system that may have had an impact on the park-andride utilization at stations. The changes are listed below. Additional AM and PM peak-period trips were added to bus Route 62 in September 2010, and all express trips along this bus route were replaced with local trips. T. F. Green Airport and Wickford Junction MBTA stations opened along the Providence/Stoughton Line in December 2010 and April 2012, respectively. Some trains began operating as three-car trains along the Green Line Riverside Branch during the AM and PM peak period in October Before the service change, one- and two-car trains operated along the Riverside Branch. The use of three-car trains was implemented on the Heath Street branch from Brigham Circle to Lechmere during the AM peak period in March A new station opened on the Fairmont Line, at Talbot Avenue, in November of New stations at Four Corners/Geneva Avenue and Newmarket opened in July of Six daily round-trips were added to the Fairmount Line in July The Commonwealth of Massachusetts announced the completion of the purchase of the trackage between Framingham and Worcester from CSX Railroad in October The Economy Beginning in December 2007, the United States economy underwent a severe recession; its effects were still being felt at the time of the inventory. Even though the Boston region was not one of the hardest hit US regions, the impact of the recession was evident. An economic recession generally results in an increase in the unemployment rate. Therefore, fewer people commute to work, resulting in a drop in utilization of all transportation facilities. Many MBTA commuters work either in the central business district in Boston or at various commercial activity centers located throughout the Boston region. When these centers experience increases in unemployment, there is a decrease in daily commuting to those centers. 10 Jonathan Belcher, Central Transportation Planning Staff, Changes to Transit Service in the MBTA District: , (accessed on March 3, 2014).
10 Congestion Management Committee 10 May 1, 2014 Since the parking inventory was completed, the economy has continued to improve, which led to more people commuting to work. 11, Commuting has increased since then, reflecting the economic turnaround. Increased Popularity of Public Transportation Over the last few years, public transportation has been increasing in popularity nationwide despite service cuts and fare increases. Some of the contributing factors are: The increases in the cost, and decreasing convenience, of commuting by automobile Technical improvements such as smartphones are improving the ease of use of public transportation. Demographic shifts, as the millennial generation often values the convenience of public transportation and technology over automobile ownership. Baby boomers who are approaching retirement are also embracing the convenience of public transportation. The improving economy is enabling more commuters to return to work, which results in an increase in the usage of all transportation modes. Population increases nationwide and in the Boston region mean that there are more commuters, who will need to use some mode or modes of the transportation system, including public transportation. Gasoline prices increased 44 percent between the and inventories. 12, 13 When gasoline prices increase, commuters tend to take public transportation to cut commuting costs. This can indirectly result in an increase in systemwide parking utilization. 11 US Bureau of Labor Statistics, BLS Spotlight on Statistics The Recession of , February 1, Available online at (accessed January 15, 2014). 12 Consumer Reports, Average gas prices--august 23, 2010, available online at (accessed January 15, 2014). 13 Consumer Reports, Average gas prices--september 17, 2012, available online at (accessed January 15, 2014).
11 Congestion Management Committee 11 May 1, 2014 Parking Lot Construction Certain MBTA stations and nearby parking lots were under construction at the time of observation (see Appendix A for information about specific stations that were under construction at the time of the survey). Several MBTA station platforms, elevators, ramps, and other access points were under construction at the time of observation. Construction at MBTA stations may prompt commuters to use other MBTA stations to complete their trip, which may have resulted in an increase in parking utilization at nearby stations. This is especially true if the construction temporarily causes a station to cease being ADA-. Construction in the parking lots near MBTA stations may temporarily reduce parking capacity, which can make it seem that parking utilization has increased. Another effect of parking lot construction is the resulting confusion of commuters about where parking is permitted and how much it costs. Conversion of Public Parking to Permit Parking The permitted usage of municipally and privately owned parking lots near some MBTA stations has changed since the inventory for various reasons. Public lots allow any commuter to park in the lot, as long as the parking fee is paid. Permit-only parking lots only allow commuters who have a parking pass from a municipality or other entity to park at the specified location. Green Street, located on the Orange Line, and Winchester, located on the Lowell Line, are now exclusively served by permit-only spaces. Permit parking is generally not included in the analysis performed for this memorandum, as the memorandum focuses on parking availability for the general public. However, the locations of permit-only and resident-only parking near MBTA stations are discussed in section INVENTORY RESULTS: PARKING UTILIZATION An analysis of the inventory results indicated a total net increase of about 1,846parking spaces in the MBTA park-and-ride system between the inventory and the inventory. On a typical weekday morning, 61 percent of all parking spaces for all modes in the MBTA system were utilized. As shown in Figure 1, there was a 3 percent increase in utilization from the survey to the survey, but a 16 percent decrease in the utilization rate from the inventory because there was a net increase in the number of parking spaces. Major changes that may have affected the utilization include the addition of the T. F. Green Airport and Wickford Junction MBTA stations, the removal of the Quincy Center Garage, the conversion of public parking spaces to permit-only spaces, and station construction. T. F.
12 Number of Parking Spaces Congestion Management Committee 12 May 1, 2014 Green Airport and Wickford Junction stations experience low utilization because they are relatively new. The breakdown of parking utilization rates is 55 percent utilization for the commuter rail system, 74 percent utilization for the rapid transit system, 84 percent utilization for express bus, and 49 percent utilization for commuter ferry. 14 Figure 2 graphically shows the parking capacity and utilization for each individual station that was collected for the inventory. For a graphical comparison of the parking utilization difference between the and inventories by individual station, refer to Figure B-1, in Appendix B. FIGURE 1 Utilization at Park-and-Ride Lots near MBTA s: , , and Inventories 70,000 60,000 50,000 55,580 55,591 57,437 40,000 Empty spaces 30,000 20,000 10,000 77% 58% 61% Percentage of spaces utilized Inventory 14 Some stations with parking serve both Commuter Rail and Rapid Transit. To avoid confusion, these stations are all categorized as rapid transit in this inventory
13
14 Boston Region MPO 14 May 1, Commuter Rail Table 3 shows the commuter rail park-and-ride utilization by line. TABLE 3 Commuter Rail Parking Inventory and Percent of Parking Utilization at Park-and-Ride Lots near MBTA s, Commuter Rail Line Number of Parking Spaces Percent Utilization Fitchburg/South Action Line a 1,365 60% Haverhill Line 2,061 57% Lowell Line a 2,924 66% Newburyport/Rockport Line a 3,539 46% North Side total 9,889 56% Fairmount Line % Framingham/Worcester Line 3,558 63% Franklin Line 3,663 56% Greenbush Line 2,931 44% Kingston/Plymouth Line 3,120 44% Middleborough/Lakeville Line 2,833 44% Needham Line a % Providence/Stoughton Line a 8,366 61% South Side total 25,817 54% Grand total 35,706 55% a The parking lots near the North Leominster, Littleton, Wedgemere, Beverly Depot, Needham Center, Needham Heights, Attleboro, and South Attleboro stations were under construction at the time of the survey The parking utilization and capacity may have been temporarily affected as a result. Fitchburg/South Acton Line 15 On the Fitchburg/South Acton Line, 61 percent of all parking spaces were utilized during the AM peak period. At the 15 stations on this line that routinely provide parking, Kendall Green and South Acton filled during the AM peak period. Waltham had a 98 percent parking utilization rate during the AM peak period. In addition to the parking spaces that do not require a permit, there are 452 parking spaces that are resident-only or permit-only; 80 percent of those parking spaces were in use. There are 44 spaces available along the line, 14 percent of which were utilized. 15 North Leominster and Littleton stations were under construction at the time of the survey. North Leominster had an inventory of 0 parking spaces and Littleton had an inventory of 52 parking spaces at the time of observation.
15 Congestion Management Committee 15 May 1, 2014 Haverhill Line During the AM peak period, 57 percent of the 2,061 parking spaces available for public use were filled. At the 12 stations on the Haverhill Line that have parking lots, only North Wilmington filled to capacity during the AM peak period. There are additional 60 additional parking spaces, at Reading, but they are restricted to residents of Reading. Of those parking spaces, 88 percent were in use by the end of the morning peak period. There are also 13 permit-only spaces at Bradford, 9 of which were occupied. There are also 49 parking spaces near stations along the Haverhill Line. Four percent of those spaces were utilized. Lowell Line 16, 17 The parking utilization rate decreased by 17 percent on the Lowell Line between the inventory and the inventory. Of the seven stations on the Lowell Line that have parking, both the Wedgemere and West Medford lots filled up during the AM peak period. The Winchester town lot that is located west of the station also filled up during the morning peak period. The Wilmington lot had 184 spaces in use out of the 191 spaces available. The Lowell Line had 59 parking spaces near its stations and 24 percent were utilized. Newburyport/Rockport Line There are 3,539 parking spaces available for public use on the Newburyport/Rockport Line; 46 percent of those parking spaces were in use during the AM peak period. Of the 16 stations on the line that have parking lots, Beverly Depot was the only station that filled to capacity during the AM peak period. 18 There are 18 parking spaces at Swampscott. There are 125 public parking spaces and 18 resident-only spaces. All of the resident-only parking spaces were utilized during the AM peak period. The Newburyport/Rockport Line has 106 parking spaces. Of these spaces, 10 percent were utilized. 16 There are an additional 857 overnight parking spaces at the Anderson/Woburn MBTA station. These parking spaces are owned by Massport and are provided for users of the Logan Express shuttle bus. That parking lot is not included in the analysis performed for this memorandum. 17 The 17 percent decrease in the parking utilization rate on the Lowell Line is partly due to the fact that the non-overnight lot at Anderson/Woburn, which has 1,297 parking spaces, experienced a 34 percent decrease in parking utilization. 18 Beverly Depot was under construction at the time of the survey, and several nearby lots were blocked off. As a result, there were 40 spaces available at this station at the time of observation.
16 Congestion Management Committee 16 May 1, 2014 Fairmount Line Readville and Fairmount are the only two stations on the Fairmount Line that have public parking. 19 Of the 387 public parking spaces, 35 percent were filled during the AM peak period. There are no permit-only parking spaces on this line. The Fairmont Line has 21 parking spaces, 19 percent of which were utilized. Framingham/Worcester Line Of the 14 stations on the Framingham/Worcester Line that have parking, only the Wellesley Hills lot filled entirely during the AM peak period. The West Natick parking lot was observed to be 99 percent utilized during the AM peak period. Of the 3,558 parking spaces on this line, 63 percent filled during the AM peak period. There are permit-only lots at Framingham and Natick stations that have 119 and 139 spaces, respectively. The Framingham lot had 57 percent utilization and the Natick lot had 80 percent utilization. The West Newton station declined in utilization to 26 percent from 72 percent since the previous inventory. This utilization decline is a result of the implementation of a $4.00 parking fee on nearby lots since the previous inventory. There are 89 parking spaces along the Framingham/Worcester Line, 11 percent of which were utilized. Franklin Line There are a total of 3,663 parking spaces available along the Franklin Line, 56 percent of which were filled. There are two new parking lots along the line. One new parking lot was added as part of the Liberty Lane development project near Norfolk ; it provides 258 spaces. A private lot that provides 25 spaces was constructed near Norwood Central. Of the 11 stations on the Franklin Line, Plimptonville was the only station whose parking lot filled completely during the AM peak period. 20 In addition to the public spaces, there are 60 permit-only spaces at Franklin, 59 of which were filled during the AM peak period. The Franklin Line has 66 spaces, with a utilization rate of 9 percent. Greenbush Line At the seven stations on the Greenbush Line that have parking, no lots filled during the AM peak period. There are 2,931 parking spaces available for public 19 Readville is served by both the Fairmount Line and the Franklin Line. To avoid confusion, Readville data were counted as Fairmount Line data for all of the quantitative analyses for this memorandum. 20 These totals exclude Readville (see the previous footnote).
17 Congestion Management Committee 17 May 1, 2014 use, 44 percent of which filled during the AM peak period. The parking lots along the Greenbush Line provide 76 parking spaces. The utilization rate for the spaces along the line is 1 percent. Kingston/Plymouth Line At the seven stations on the Kingston/Plymouth Line that have parking, no lot filled during the AM peak period. There are 3,120 parking spaces available for public use on this line, 44 percent of which were filled during the AM peak period. There are an additional 175 permit-parking spaces available at Kingston, and an additional 208 permit-parking spaces at Abington, which were at 85 percent and 45 percent utilization, respectively. There is no AMpeak-period train service at Plymouth, and 8 of the 92 available spaces at that station were utilized. There are 72 parking spaces along the Kingston/Plymouth Line, of which 17 percent were utilized. Middleborough/Lakeville Line At the six stations on the Middleborough/Lakeville Line that have parking, no lot filled during the AM peak period. There are 2,833 parking spaces available for public use, and 44 percent filled during the AM peak period. There are no permit-only or resident-only parking spaces on the Middleborough/Lakeville Line. The parking lots along the Middleborough/Lakeville Line provide 65 parking spaces. The utilization for the parking spaces was 12 percent. Needham Line 21 There are 959 parking spaces available for public use, 65 percent of which filled during the AM peak period. Of the 8 stations on the Needham Line, Needham Junction was the closest to being full during the AM peak period, at 99 percent utilization. There are 34 parking spaces along the Needham Line, 12 percent of which were utilized. Providence/Stoughton Line 22 There are a total of 8,366 parking spaces available for public use on the Providence/Stoughton Line, 61 percent of which filled during the AM peak 21 Both Needham Center and Needham Heights stations were under construction at the time of observation. Neither station provided public parking at that time. 22 There are an additional 533 overnight parking spaces provided at the Route 128 MBTA station. These spaces are provided to serve Amtrak riders. The utilization rate of these spaces was 97 percent. These spaces are not included in the analysis for this memorandum.
18 Congestion Management Committee 18 May 1, 2014 period. An additional 1,192 parking spaces on the line are designated for resident-only parking; 81 percent of those were in use during the AM peak period. Since the last inventory, two stations were added to the Providence/Stoughton Line: T. F. Green Airport and Wickford Junction, in Rhode Island. These two stations have public garages that have 591 spaces and 1,077 spaces, respectively. T. F. Green Airport was 12 percent utilized and Wickford Junction was 6 percent utilized during the AM peak period. Of the 12 stations on the Providence/Stoughton Line that have parking, no lot filled completely during the AM peak period. However, the Mansfield, South Attleboro, and Providence stations were 99 percent, 90 percent, and 86 percent utilized during the AM peak period, respectively. There are 151 parking spaces along the line, 30 percent of which were utilized. 3.2 Rapid Transit Table 4 shows the percent of parking utilization by rapid transit line. Blue Line The Blue Line has six stations that provide parking. No lots filled during the AM peak period; only 65 percent of the 3,395 public parking spaces were in use by the end of the peak period. There is no permit-only parking on this line. Green Line The Green Line has 2,043 parking spaces, 56 percent of which were in use during the AM peak period. Six Green Line stations have parking, but only Eliot was observed to be filled during the AM peak period. There are 45 parking spaces near Green Line stations; the utilization rate for those spaces was 11 percent. Orange Line Five stations on the Orange Line have public parking lots, none of which was filled to capacity during the AM peak period. However, public parking at Forest Hills and Oak Grove stations was 99 percent filled. Oak Grove also has 107 permit-only parking spaces, of which 70 spaces were in use. There are 81 permit-only spaces near Green Street, of which 48 spaces were in use. There are 85 parking spaces along the Orange Line; 35 percent of those spaces were utilized.
19 Congestion Management Committee 19 May 1, 2014 Red Line and Mattapan High-Speed Line The Red Line and Mattapan High-Speed Line together have nine stations with parking lots. Of the 8,397 parking spaces available for public use, 83 percent were filled during the AM peak period. Savin Hill was the only station on the Red Line that filled to capacity during the AM peak period. The parking lots near the Red Line and Mattapan High-Speed Line provide 130 parking spaces. The utilization of these spaces was 52 percent. TABLE 4 Rapid Transit Parking Inventory and Percent Utilization at Park-and-Ride Lots near MBTA s, Rapid Transit Line Number of Parking Spaces Percent Utilization Blue Line a 3,395 65% Green Line 2,043 56% Orange Line 5,052 73% Red Line and Mattapan High-Speed Line 8,397 83% Total 18,887 74% a The parking lots near Wonderland were under construction at the time of the survey. Parking utilization and capacity may have been temporarily changed as a result. 3.3 Commuter Ferry Quincy/Fore River, Hingham, and Hull are the three commuter ferry terminals with parking lots. Quincy/Fore River has 370 parking spaces, 21 percent of which were in use during the AM peak period. This parking lot is also available for overnight parking for Logan International Airport and Harbor Island users, and there are different parking rates for day and overnight users. Of the 1,979 parking spaces at the Hingham ferry terminal, 52 percent were in use during the morning peak period. There are 236 parking spaces at the Hull ferry terminal, 69 percent of which were in use during the peak period. The three commuter ferry terminals provide 49 parking spaces, 20 percent were utilized during the AM peak period. 3.4 Express Bus The express bus parking lots in Woburn, at Montvale Avenue, and at Watertown Yard were surveyed. The Montvale Avenue lot has 65 spaces, 100 percent of which filled during the AM peak period. The Watertown Yard parking lot has 194 spaces, 78 percent of which were utilized by the end of the AM peak period. There are a total of 9 spaces at the Woburn and
20 Congestion Management Committee 20 May 1, 2014 Watertown park-and-ride lots, 11 percent of which were utilized by the end of the AM peak period. 4 MAJOR REGIONAL PARK-AND-RIDE LOTS AND PARK-AND-RIDE LOTS AT TERMINAL STATIONS 4.1 Major Regional Park-and-Ride Lots There are several parking garages and lots serving the MBTA system that are located strategically throughout the MBTA service area in order to attract a large number of users from many origin communities. For the purposes of this analysis, all major regional park-and-ride lots each contain at least 500 parking spaces. These facilities are typically located at the end of a commuter rail or transit line or near state or interstate highways or at major roadway interchanges, and generally have greater capacity than most other stations. Some examples are the facilities at Alewife and Quincy Adams stations, which have ramps from Route 2 and Route 3, respectively. Other stations with such facilities are Riverside and Route 128 stations, which are located directly off of Route 128/Interstate 95, and the Anderson Regional Transportation Center (RTC), which is located directly off of I-93. These parking facilities are significant because, due to their convenient location and size, they serve many users, and they supply more than 65 percent of all of the parking spaces available at MBTA transportation facilities, including express bus lots and commuter ferry terminals. Table 5 lists the regional parkand-ride lots serving the MBTA system. Of these lots, the Forge Park and Anderson RTC lots experienced the biggest declines in utilization between the and inventories. South Attleboro, Canton Junction, Wollaston, and North Quincy stations all experienced parking lot utilization increases of more than 20 percent. Table 5 does not include parking. The totals also omit 282 permitonly parking spaces: 107 at Oak Grove and 175 at Kingston. Overall, 78 percent of these permit-only spaces were used during the morning peak period. 4.2 Park-and-Ride Lots at Terminal s There are several terminal stations located throughout the MBTA system. For the purpose of this memorandum, the definition of a terminal station is an MBTA station, ferry terminal, or bus stop that has nearby public or private parking for MBTA commuters and is located on a transit line that terminates onsite. Terminal stations are often the locations where commuters switch their mode of travel from use of an automobile to public transportation; therefore, these stations offer vast amounts of parking. The commuter rail terminal
21 Congestion Management Committee 21 May 1, 2014 stations are typically located in suburban locations or in medium-sized cities. Rapid transit terminal stations are all located in Boston, Cambridge, or innerring suburbs. The three ferry terminals are all located along the South Shore of Massachusetts. The bus terminal station is located in Watertown, which is just west of Boston. Table 6 displays the size and utilization of the terminal station parking lots. The utilization rate of terminal stations tends to vary by transit mode. Commuter rail terminal stations have a 41 percent overall utilization; however, the utilization is typically higher at terminal stations that are located in larger municipalities than at those in suburban areas. This may be due to the fact that the terminal stations that are located in larger municipalities usually have smaller parking lots. The total utilization rate for terminal stations along rapid transit lines is 77 percent. However, the terminal stations along light rail lines (Mattapan and Riverside ) have a significantly lower utilization rate than terminal stations along heavy rail lines, probably due to the lower ridership on light rail lines. The total utilization rate for the ferry terminal stations is 49 percent. The ferry terminal stations consist of one location that has a large park-and-ride lot and two stations that have medium-sized park-and-ride lots. The Watertown yard bus terminal has a 78 percent utilization rate. Some stations are designated as both a terminal station and a major regional park-and-ride lots, depending on the location along the transit line and the number of parking spaces located near the station.
22 Congestion Management Committee 22 May 1, 2014 TABLE 5 Major Regional Parking Garages and Lots near MBTA s: Capacity and Utilization Name Transit Line Number of Parking Spaces Percent Utilization Worcester Framingham/Worcester % Ashland Framingham/Worcester % Forge Park Franklin % Norfolk Franklin % Walpole Franklin % Norwood Central Franklin % Greenbush Greenbush % Lawrence Haverhill % Kingston Kingston/Plymouth 1,083 30% South Weymouth Kingston/Plymouth % Lowell Lowell % North Billerica Lowell % Anderson/Woburn Lowell 1,297 51% Middleborough/Lakeville Middleborough/Lakeville % Campello Middleborough/Lakeville % Lynn Newburyport/Rockport % Wickford Junction Providence/Stoughton 1,077 6% T. F. Green Providence/Stoughton % Providence Providence/Stoughton % South Attleboro a Providence/Stoughton % Attleboro a Providence/Stoughton 1,068 68% Canton Junction Providence/Stoughton % Route 128 Providence/Stoughton 2,008 58% Commuter rail total Blank 19,220 51% Wonderland a Blue Line 2,326 66% Woodland Green Line % Riverside Green Line % Oak Grove Orange Line % Malden Orange Line % Wellington Orange Line 2,409 59% Sullivan Square Orange Line % Alewife Red Line 2,456 83% North Quincy Red Line 1,512 81% Wollaston Red Line % Quincy Adams Red Line 2,352 81% Braintree Red Line 1,244 95% Rapid transit total Blank 16,468 74% Hingham Ferry 1,979 52% Ferry total Blank 1,979 52% All regional stations Grand total 37,667 61% a The station was under construction at the time of the survey.
23 Congestion Management Committee 23 May 1, 2014 TABLE 6 Terminal Garage and Parking Lots: Capacity and Utilization Number of Parking Spaces Percent Utilization Name Transit Line Newburyport Newburyport/Rockport % Rockport Newburyport/Rockport % Haverhill Haverhill % Lowell Lowell % Fitchburg/South Acton Fitchburg/South Acton % Worcester Framingham/Worcester % Needham Heights a Needham 80 60% Forge Park Franklin % Readville Fairmount % Wickford Junction Providence/Stoughton 1,077 6% Stoughton Providence/Stoughton % Middleborough/Lakeville Middleborough/Lakeville % Kingston Kingston/Plymouth 1,258 38% Plymouth Kingston/Plymouth 92 9% Greenbush Greenbush % Commuter rail total Blank 8,466 41% Alewife Red Line 2,456 83% Braintree Red Line 1,244 95% Mattapan Mattapan High-Speed Line 210 9% Wonderland a Blue Line 2,326 66% Forest Hills Orange Line % Oak Grove Orange Line % Lechmere Green Line % Riverside Green Line % Rapid transit total Blank 8,904 77% Hingham F % Hull F2H % Quincy/Fore River F % Ferry total Blank 2,585 49% Watertown Yard 52, 57, 59, 502, 504 Bus % MBTA Bus total Blank % All terminal stations Grand total 20,149 58% a The station was under construction at the time of the survey.
24 Congestion Management Committee 24 May 1, INVENTORY RESULTS: AMENITIES The tables in Appendix D summarize the amenities at MBTA stations that have parking lots. Information pertaining to platforms and ramps, along with the absence or presence of benches, bicycle racks, and shelters, was collected as part of this inventory. 5.1 Accessible Platforms Of the 116 commuter rail stations inventoried, 87 have raised or minihigh, platforms. All of the stations included in this inventory on the Middleborough/Lakeville, Plymouth/Kingston, Fairmount, Greenbush, and Needham lines now have platforms. Of the 28 rapid transit stations inventoried, 25 have platforms, including all of the stations on the Red, Orange, and Blue lines. Three of the inventoried Green Line stations still lack platforms. All three ferry terminals have platforms. All of the express bus lots have sidewalk ramps, and all of the buses are low-level, kneeling buses. Table 7 lists the stations that lack platforms.
25 Congestion Management Committee 25 May 1, 2014 TABLE 7 s without Accessible Platforms: Inventory Name Transit Line Transit Mode Ayer Fitchburg/South Acton Line Commuter Rail Belmont Fitchburg/South Acton Line Commuter Rail Concord Fitchburg/South Acton Line Commuter Rail Hastings Fitchburg/South Acton Line Commuter Rail Kendal Green Fitchburg/South Acton Line Commuter Rail Lincoln Fitchburg/South Acton Line Commuter Rail Shirley Fitchburg/South Acton Line Commuter Rail Silver Hill Fitchburg/South Acton Line Commuter Rail Auburndale Framingham/Worcester Line Commuter Rail Natick Framingham/Worcester Line Commuter Rail Newtonville Framingham/Worcester Line Commuter Rail Wellesley Farms Framingham/Worcester Line Commuter Rail Wellesley Hills Framingham/Worcester Line Commuter Rail Wellesley Square Framingham/Worcester Line Commuter Rail West Newton Framingham/Worcester Line Commuter Rail Endicott Franklin Line Commuter Rail Franklin Franklin Line Commuter Rail Islington Franklin Line Commuter Rail Plimptonville Franklin Line Commuter Rail Walpole Franklin Line Commuter Rail Greenwood Haverhill Line Commuter Rail Melrose Cedar Park Haverhill Line Commuter Rail Wakefield Haverhill Line Commuter Rail Wyoming Hill Haverhill Line Commuter Rail West Medford Lowell Line Commuter Rail Winchester Lowell Line Commuter Rail Prides Crossing Newburyport/Rockport Line Commuter Rail Sharon Providence/Stoughton Line Commuter Rail Chestnut Hill Green Line Rapid Transit Eliot Green Line Rapid Transit Waban Green Line Rapid Transit 5.2 Accessible Parking Accessible parking spaces are defined in this memorandum as parking spaces that are specifically designated to provide persons with disabilities better access to MBTA facilities by automobile. These parking spaces can be
26 Congestion Management Committee 26 May 1, 2014 identified by surveyors from signs, which include the international symbol of accessibility. A special permit needs to be obtained before a commuter can park in an parking space. Of the MBTA stations that were surveyed for the inventory, 88 percent provided at least one public parking space. At the time of the survey, 1,214 parking spaces were located near MBTA stations, with 21 percent of those spaces utilized. The utilization rate for parking spaces has increased 1 percent since the inventory, despite a 6 percent increase in parking capacity. Rapid transit has nearly double the utilization rate of all other modes, at 39 percent in the inventory. Table 8 shows the utilization rates of parking spaces, by transit line. TABLE 8 Accessible Parking near MBTA s by Transit Line: Capacity and Utilization Transit Line Accessible Parking Spaces Accessible Parking Space Utilization Fairmount 21 19% Fitchburg/South Acton a 44 14% Framingham/Worcester 89 11% Franklin 66 9% Greenbush 76 1% Haverhill 49 4% Kingston/Plymouth 72 17% Lowell a 59 24% Middleborough/Lakeville 65 12% Needham a 34 12% Newburyport/Rockport a % Providence/Stoughton a % Commuter rail total % Blue Line a 64 39% Green Line 45 11% Orange Line 85 35% Red Line % Rapid transit total % Commuter Ferry total 49 20% Bus total 9 11% Total spaces 1,214 21% a Parking lots near the North Leominster, Littleton, Wedgemere, Beverly Depot, Needham Center, Needham Heights, Attleboro, South Attleboro and Wonderland stations were under construction at the time of the survey. The parking utilization and parking capacity may have been temporarily affected as a result.
27 Congestion Management Committee 27 May 1, Permit-Only and Resident-Only Parking Some commuter rail and rapid transit stations have permit-only or resident-only parking located nearby. Permit-only and resident-only parking are generally restricted to commuters who either purchase a permit for a certain period of time (for example, yearly or monthly) or commuters who are a residents of the local municipality in which the MBTA station is located. Since the purpose of this memorandum is to show the parking utilization rates for the general public, permit-only and resident-only parking are not included in the analysis, with the exception of this section. Table 9 displays the locations of the permit-only and resident-only parking lots near MBTA stations. In the inventory, there were 3,121 permitted or resident-only parking spaces near MBTA stations; 2,933 parking spaces near commuter rail stations, and 188 parking spaces near rapid transit stations. Permit parking along the Franklin, Haverhill, Lowell, and Newburyport/Rockport commuter rail lines has the highest rates of permit-parking utilization.
28 Congestion Management Committee 28 May 1, 2014 TABLE 9 Permit-Only and Resident-Only Parking Spaces near MBTA s: Capacity and Utilization Permit-Only, Resident-Only Parking Spaces Permit-Only, Resident-Only Parking Space Utilization Name Transit Line Lincoln Fitchburg/South Acton 46 63% South Acton Fitchburg/South Acton % Waltham Fitchburg/South Acton 45 93% West Concord Fitchburg/South Acton % Framingham Framingham/Worcester % Natick Framingham/Worcester % Franklin Franklin 60 98% Bradford Haverhill 13 69% Reading Haverhill % Abington Kingston/Plymouth % Kingston Kingston/Plymouth % Wedgemere a Lowell % West Medford Lowell % Winchester Lowell % Swampscott Newburyport/Rockport % Mansfield Providence/Stoughton % Sharon Providence/Stoughton % Stoughton Providence/Stoughton 69 36% Commuter rail total Blank 2,933 80% Green Street Orange Line 81 59% Oak Grove Orange Line % Rapid transit total Blank % Total permit parking spaces Blank 3,121 79% a Parking lots near the Wedgemere station were under construction at the time of the survey. The parking utilization and parking capacity may have been temporarily affected as a result.
29 Congestion Management Committee 29 May 1, Bicycle Racks and Cages This discussion of bicycle parking is based on the data collected on the bicycle parking facilities' capacity and utilization that were recorded for all MBTA stations in the period July through October 2012, and an earlier inventory, which was conducted in The inventory included 134 rapid transit stations, 122 commuter rail stations, six commuter ferry terminals, and three major bus stops. Of the 265 stations included in the bicycle survey inventory, 86 percent have bicycle racks. This includes 105 of the 134 commuter rail stations, 117 of the 122 rapid transit stations, four of the six ferry terminals, and two of the three major bus stops. Using federal stimulus funds, the MBTA installed 50 bicycle ports near MBTA stations, and by the end of 2014, the MBTA is expected to have installed 15 bicycle cages near MBTA stations. The MBTA stations that either currently have, or will have, bike ports or bicycle cages are listed in Appendix D. The station with the highest bike parking capacity is Alewife, with 387 spaces. Between the previous bicycle parking inventory, which was conducted in , and the 2012 bicycle parking inventory, there was a 48 percent increase in the number of parked bicycles and a 30 percent increase in the number of bicycle parking spaces. Table 10 shows the percentages of bicycle rack utilization by mode and line throughout the system. Figures B-3 and B-4, in Appendix B, are maps of the bicycle parking capacity and utilization by station. 23 Boston Region Metropolitan Planning Organization, memorandum titled 2012 Inventory of Bicycle Parking Spaces and Number of Parked Bicycles at MBTA s, April 3, 2014.
30 Congestion Management Committee 30 May 1, 2014 Table 10 Bicycle Parking Capacity and Utilization at Park-and-Ride s near MBTA s, 2012 Transit Line 5.5 Shelters Bicycle Parking Spaces Percent Utilization Fairmount 84 1% Fitchburg/South Acton % Framingham/Worcester % Franklin % Greenbush % Haverhill Line % Kingston/Plymouth 84 23% Lowell % Middleborough/Lakeville 81 15% Needham % Newburyport/Rockport % Providence/Stoughton % Commuter rail total 2,076 25% Blue Line % Green Line % Orange Line % Red Line 1,553 65% Mattapan High-Speed Line 90 6% Silver Line - Washington Street % Silver Line - Waterfront % Rapid transit total 3,929 47% Ferry total 70 14% Bus total 16 75% Grand total 6,091 39% Note: Bicycles and racks are counted more than once at stations that serve more than one transit line. In those cases, each bicycle and each rack is counted once for each line. However, in each of the totals for that station, these spaces are counted only once. Most of the stations with park-and-ride lots have shelters. In this inventory, a shelter is defined as any structure that provides some protection from the weather. The structure could be just a roof over the platform, a completely enclosed station, or a stand-alone structure with a roof and walls. Lincoln, Hastings, and Plimptonville are the stations on commuter rail lines that do not have a shelter. All rapid transit stations, parking lots for MBTA bus service, and ferry terminals that were surveyed have shelters on the inbound side, and some of them have shelters on the outbound side.
31 Congestion Management Committee 31 May 1, CONCLUSION In summary, the analysis of the park-and-ride inventory suggests the following conclusions. 6.1 General Conclusions Overall, the park-and-ride system capacity has increased by 1,846 spaces since the previous inventory. The breakdown by transit mode is: commuter rail park-and-ride lots increased by 1,860 spaces, rapid transit park-and-ride lots decreased by 207 spaces, and commuter ferry park-and-ride lots increased by 9 spaces. Although more spaces were added since the inventory, more parkand-ride lots at MBTA stations were filled in the inventory than in the inventory. This is consistent with a nationwide trend of more commuters traveling by public transportation. In the inventory, 22 percent of the stations surveyed had parking lots that filled to 85 percent or more of their capacity. Park-and-ride lots at 30 percent of the stations surveyed were less than half utilized at the end of the AM peak period. Of the 33 lots that filled to 85 percent or more of their capacity, 25 were smaller lots (with 250 spaces or fewer); by contrast, larger lots (with 1,000 spaces or more) were 61 percent utilized, on average. 6.2 Commuter Rail Overall, commuter rail utilization remained essentially stable despite the construction of spaces at two new stations. However, the data also showed that utilization declined at certain stations, notably Anderson/Woburn and Forge Park/495. Generally, commuter rail parking utilization was the greatest at MBTA stations inside of I-95/Route 128 and along major expressway corridors. There is at least one station on every MBTA commuter rail line where 45 percent or more of the parking is available on a typical weekday morning. Major commuter garages and facilities, which are located near major highways, provide more than 65 percent of the MBTA system s parking capacity. There are several major regional park-and-ride lots at commuter rail stations that experienced significant increases or decreases in parking utilization between the two most recent inventories. 6.3 Rapid Transit Rapid transit park-and-ride utilization has increased significantly since the inventory, largely due to the removal of parking spaces since then.
32 Congestion Management Committee 32 May 1, 2014 The Red Line currently has the highest parking utilization rate of all of the rapid transit lines, at 83 percent, which is an increase of 19 percent since the inventory. The high utilization of park-and-ride lots along the southern portion of the Red Line was due in part, to the closing of the Quincy Center parking garage. 6.4 Commuter Ferry Commuter ferry park-and-ride utilization decreased significantly between the inventory and the inventory. This decrease was likely caused by a number of factors, including the 2012 fare increase and the fact that the Greenbush Line, which was implemented in 2007, is a viable alternative for commuting to downtown Boston; it continues to attract riders from the South Shore region. 6.5 Express Bus The park-and-ride lot at Montvale Avenue, in Woburn, was found to have 100 percent utilization in the inventory. This is an increase from the 93 percent utilization rate that was recorded in the inventory. 6.6 Major Regional Park-and-Ride Lots The Forge Park and Anderson/Woburn parking lots experienced the biggest declines in utilization from the inventory to the inventory, with decreases of 32 percent and 33 percent, respectively. The South Attleboro and Canton Junction commuter rail stations experienced parking lot utilization increases of more than 20 percent. South Attleboro experienced a large increase in the number of parked vehicles despite a temporary reduction in parking spaces due to construction. The Wollaston and North Quincy rapid transit stations experienced parking lot utilization increases of more than 20 percent. The increase in utilization at these stations may have been caused by the closing of the parking garage at Quincy Center. 6.7 Terminal s The total utilization rate for the commuter rail terminal stations that are located in municipalities that have a population of more than 40,000 people is 52 percent. The total utilization rate for the commuter rail terminal stations that are located in municipalities that have a population of less than 40,000 people is 37 percent. One of the causes of the differences in utilization rates is that the terminal stations in larger municipalities typically have fewer parking spaces.
33 Congestion Management Committee 33 May 1, 2014 The total utilization rate for terminal stations located along heavy rail lines is 82 percent. The total utilization rate for terminal stations located along light rail lines is 50 percent, even though those terminal stations generally have smaller parking lots than heavy rail lines. They probably have lower utilization rates because they have a significantly lower number of daily boardings than do the heavy rail terminal stations. 6.8 Amenities Conclusions The overall utilization of parking spaces has increased since the inventory. The Red Line has the highest utilization rate for parking spaces, at 52 percent. Permit-only and resident-only parking that is located along the Franklin, Haverhill, Lowell, and Newburyport/Rockport lines have the highest parking utilization. All four of these lines have a permit-only and resident-only parking utilization of 85 percent or higher. The number of bicycles parked, parking capacity, and utilization rates at MBTA stations increased between the bicycle parking inventory and the 2012 bicycle parking inventory. Since the inventory, 62 MBTA stations that previously did not provide bicycle parking had bicycle racks installed. RH/rh
34 APPENDIX SECTIONS Appendix Section Appendix A: Appendix B: Section Name Parking Utilization: Comprehensive Results of Inventory Park-and Ride and Bicycle Parking Maps Appendix C: Park-and-Ride Lot Survey Form: Fall 2012/Winter 2013 Appendix D: Appendix E: Amenities: Comprehensive Results of Inventory Comparison of Inventory Results with and Inventory Results, by Mode Appendix F: MBTA Fare Increase State Fiscal Year 2013
35 APPENDIX A PARKING UTILIZATION: COMPREHENSIVE RESULTS OF INVENTORY Table Name North Side Commuter Rail Inventory of MBTA Park-and-Ride Lots, Non Spaces, South Side Commuter Rail Inventory of MBTA Park-and-Ride Lots, Non Spaces, Rapid Transit Inventory of MBTA Park-and-Ride Lots, Non Spaces, Commuter Ferry and Express Bus Inventory of MBTA Park-and-Ride Lots, Non Spaces, Table Number A.1 A.2 A.3 A.4
36 TABLE A.1 North Side Commuter Rail: Inventory of MBTA Park-and-Ride Lots, Non Spaces, Occupied Commuter Rail Line Lot Ownership Parking Spaces Parking Spaces at Time of Last AM-Peak-Period Inbound Train Percent Parking Space Utilization Date of Observation Parking Fee Ayer Fitchburg/South Acton Town % 9/27/2012 $0.00 Belmont Fitchburg/South Acton Town % 11/30/2012 $3.00 Brandeis/Roberts Fitchburg/South Acton MBTA % 11/27/2012 $4.00 Concord Fitchburg/South Acton Private % 4/9/2013 $0.00 Concord Fitchburg/South Acton Town % 4/9/2013 $0.00 Fitchburg Fitchburg/South Acton MART % 11/7/2012 $3.00 Hastings Fitchburg/South Acton Town % 2/26/2013 $0.00 Kendal Green Fitchburg/South Acton Town % 2/26/2013 $0.00 Lincoln Fitchburg/South Acton Private % 3/1/2013 $0.00 Lincoln Fitchburg/South Acton Town % 3/1/2013 $3.00 Littleton a Fitchburg/South Acton MBTA % 11/8/2012 $4.00 North Leominster b Fitchburg/South Acton MART 0 0 0% 11/7/2012 $3.00 Shirley Fitchburg/South Acton Town % 9/27/2012 $0.00 Silver Hill Fitchburg/South Acton Town % 2/26/2013 $0.00 South Acton Fitchburg/South Acton Town % 4/10/2013 $2.50 Waltham Fitchburg/South Acton Town % 11/27/2012 $2.00 West Concord Fitchburg/South Acton Town % 4/9/2013 $4.00 Andover Haverhill MBTA % 4/3/2013 $4.00 Ballardvale Haverhill MBTA % 3/5/2013 $4.00 a Littleton was under construction at the time of the survey. This parking lot is estimated to have 200 spaces upon completion b North Leominster was under construction at the time of survey. Upon completion, this station will have a 350 space parking facility nearby. MART = Montachusett Regional Transit Authority MVRTA = Merrimack Valley Regional Transit Authority LRTA = Lowell Regional Transit Authority (Cont.)
37 TABLE A.1 (CONT.) North-Side Commuter Rail: Inventory of MBTA Park-and-Ride Lots, Non Spaces, Occupied Commuter Rail Line Lot Ownership Parking Spaces Parking Spaces at Time of Last AM-Peak-Period Inbound Train Percent Parking Space Utilization Date of Observation Parking Fee Bradford Haverhill MBTA % 4/2/2013 $4.00 Bradford Haverhill Private % 4/2/2013 $0.00 Greenwood Haverhill Private % 3/6/2013 $0.00 Greenwood Haverhill Town % 3/6/2013 $2.00 Haverhill Haverhill MBTA % 4/2/2013 $4.00 Lawrence Haverhill MVRTA % 4/3/2013 $3.50 Melrose Cedar Park Haverhill Town % 3/12/2013 $3.00 Melrose Highlands Haverhill On-street % 3/12/2013 $3.00 Melrose Highlands Haverhill Town % 3/12/2013 $3.00 North Wilmington Haverhill Town % 2/28/2013 $0.00 Reading Haverhill MBTA % 3/5/2013 $4.00 Reading Haverhill Town % 3/6/2013 $0.00 Wakefield Haverhill MBTA % 3/6/2013 $4.00 Wyoming Hill Haverhill Town % 3/12/2013 $3.00 Anderson/Woburn Lowell MBTA 1, % 4/2/2013 $4.00 Lowell Lowell LRTA % 5/22/2013 $5.00 North Billerica Lowell LRTA % 12/11/2012 $4.00 Wedgemere c Lowell Town % 4/5/2013 $0.00 Wedgemere Lowell On-street % 4/5/2013 $0.00 c Parking Lot near Wedgemere was under construction at the time of survey. The lot has since reopened. (Cont.)
38 TABLE A.1 (CONT.) North Side Commuter Rail: Inventory of MBTA Park-and-Ride Lots, Non Spaces, Occupied Commuter Rail Line Lot Ownership Parking Spaces Parking Spaces at Time of Last AM-Peak-Period Inbound Train Percent Parking Space Utilization Date of Observation Parking Fee West Medford Lowell MBTA % 5/9/2013 $0.00 West Medford Lowell Town % 5/9/2013 $0.00 Wilmington Lowell MBTA % 12/11/2012 $4.00 Winchester Lowell Town % 3/15/2013 $0.00 Beverly Depot d Newburyport/Rockport MBTA % 11/15/2012 $0.00 Beverly Farms Newburyport/Rockport Town % 3/26/2013 $0.00 Gloucester Newburyport/Rockport MBTA % 3/28/2013 $4.00 Hamilton/Wenham Newburyport/Rockport MBTA % 11/15/2012 $4.00 Ipswich Newburyport/Rockport On-street % 11/13/2012 $0.00 Ipswich Newburyport/Rockport Town % 11/13/2012 $0.00 Lynn Newburyport/Rockport MBTA % 4/2/2013 $4.00 Manchester Newburyport/Rockport Town % 3/27/2013 $0.00 Montserrat Newburyport/Rockport MBTA % 3/26/2013 $4.00 Newburyport Newburyport/Rockport MBTA % 11/13/2012 $4.00 North Beverly Newburyport/Rockport MBTA % 11/9/2012 $4.00 Prides Crossing Newburyport/Rockport Town % 3/27/2013 $0.00 Rockport Newburyport/Rockport Town % 11/16/2013 $0.00 Rowley Newburyport/Rockport MBTA % 11/13/2012 $4.00 Salem Newburyport/Rockport MBTA % 4/3/2013 $4.00 d It is estimated that approximately 500 parking spaces will be located near Beverly Depot when construction is complete. (Cont.)
39 TABLE A.1 (CONT.) North Side Commuter Rail: Inventory of MBTA Park-and-Ride Lots, Non Spaces, Occupied Commuter Rail Line Lot Ownership Parking Spaces Parking Spaces at Time of Last AM-Peak-Period Inbound Train Percent Parking Space Utilization Date of Observation Parking Fee Salem Newburyport/Rockport Town % 4/3/2013 $4.00 Swampscott Newburyport/Rockport MBTA % 4/3/2013 $4.00 Swampscott Newburyport/Rockport Town % 4/3/2013 $0.00 West Gloucester Newburyport/Rockport MBTA % 3/28/2013 $4.00
40 TABLE A.2 South Side Commuter Rail: Inventory of MBTA Park-and-Ride Lots, Non Spaces, Occupied Commuter Rail Line Lot Ownership Parking Spaces Parking Spaces at Time of Last AM-Peak-Period Inbound Train Percent Parking Space Utilization Date of Observation Parking Fee Fairmount Fairmount MBTA % 5/22/2013 $4.00 Morton Street Fairmount MBTA 0 0 0% 9/20/2012 $0.00 Readville Fairmount MBTA % 11/27/2012 $4.00 Ashland Framingham/Worcester MBTA % 5/9/2013 $4.00 Auburndale Framingham/Worcester MBTA % 12/5/2012 $4.00 Auburndale Framingham/Worcester On-street % 12/5/2012 $0.00 Framingham Framingham/Worcester MBTA % 5/2/2013 $4.00 Framingham Framingham/Worcester Private % 5/2/2013 $4.00 Framingham Framingham/Worcester Town % 5/2/2013 $0.00 Grafton Framingham/Worcester MBTA % 6/21/2013 $4.00 Natick Framingham/Worcester Town % 2/28/2013 $0.00 Newtonville Framingham/Worcester On-street % 12/6/2012 $5.00 Newtonville Framingham/Worcester Town % 12/6/2012 $5.00 Southborough Framingham/Worcester MBTA % 3/26/2013 $4.00 Wellesley Farms Framingham/Worcester Town % 12/4/2012 $4.50 Wellesley Hills Framingham/Worcester Town % 12/4/2012 $4.50 Wellesley Square Framingham/Worcester Town % 12/4/2012 $4.50 West Natick Framingham/Worcester MBTA % 2/28/2013 $4.00 West Newton Framingham/Worcester MBTA % 12/5/2012 $4.00 BAT = Brockton Area Transit Authority GATRA = Greater Attleboro Taunton Regional Transit Authority (Cont.)
41 TABLE A.2 (CONT.) South Side Commuter Rail: Inventory of MBTA Park-and-Ride Lots, Non Spaces, Occupied Commuter Rail Line Lot Ownership Parking Spaces Parking Spaces at Time of Last AM-Peak-Period Inbound Train Percent Parking Space Utilization Date of Observation Parking Fee Westborough Framingham/Worcester MBTA % 5/2/2013 $4.00 Worcester Framingham/Worcester MBTA % 4/2/2013 $3.00 Worcester Framingham/Worcester Town % 4/2/2013 $8.25 Dedham Corp Center Franklin MBTA % 11/27/2012 $4.00 Endicott Franklin Town % 3/15/2013 $0.00 Forge Park Franklin MBTA % 4/5/2013 $4.00 Franklin Franklin MBTA % 9/20/2012 $4.00 Franklin Franklin Town % 9/20/2012 $0.00 Islington Franklin MBTA % 3/26/2013 $4.00 Norfolk Franklin MBTA % 11/27/2012 $4.00 Norwood Central Franklin MBTA % 11/15/2012 $4.00 Norwood Central Franklin Private % 11/15/2012 $4.00 Norwood Depot Franklin MBTA % 6/21/2013 $4.00 Plimptonville Franklin MBTA % 2/26/2013 $0.00 Walpole Franklin MBTA % 11/15/2012 $4.00 Walpole Franklin Private % 11/15/2012 $4.00 Cohasset Greenbush MBTA % 4/9/2013 $4.00 East Weymouth Greenbush MBTA % 3/27/2013 $4.00 (Cont.)
42 TABLE A.2 (CONT.) South Side Commuter Rail: Inventory of MBTA Park-and-Ride Lots, Non Spaces, Occupied Commuter Rail Line Lot Ownership Parking Spaces Parking Spaces at Time of Last AM-Peak-Period Inbound Train Percent Parking Space Utilization Date of Observation Parking Fee Greenbush Greenbush MBTA % 4/9/2013 $4.00 Nantasket Junction Greenbush MBTA % 3/27/2013 $4.00 North Scituate Greenbush MBTA % 4/9/2013 $4.00 West Hingham Greenbush MBTA % 3/27/2013 $4.00 Weymouth Landing Greenbush MBTA % 3/27/2013 $4.00 Abington Kingston/Plymouth MBTA % 5/7/2013 $4.00 Abington Kingston/Plymouth Private % 5/7/2013 $0.00 Halifax Kingston/Plymouth MBTA % 5/9/2013 $4.00 Hanson Kingston/Plymouth MBTA % 5/9/2013 $4.00 Kingston Kingston/Plymouth MBTA 1, % 5/10/2013 $4.00 Kingston Kingston/Plymouth Private % 5/10/2013 $50.00 Plymouth Kingston/Plymouth MBTA % 5/10/2013 $4.00 South Weymouth Kingston/Plymouth MBTA % 5/7/2013 $4.00 Whitman Kingston/Plymouth MBTA % 5/9/2013 $4.00 Bridgewater Middleborough/Lakeville MBTA % 9/20/2012 $4.00 Brockton Middleborough/Lakeville BAT % 3/28/2013 $3.00 Campello Middleborough/Lakeville MBTA % 4/3/2013 $4.00 Holbrook/Randolph Middleborough/Lakeville MBTA % 3/22/2013 $4.00 (Cont.)
43 TABLE A.2 (CONT.) South Side Commuter Rail: Inventory of MBTA Park-and-Ride Lots, Non Spaces, Occupied Commuter Rail Line Lot Ownership Parking Spaces Parking Spaces at Time of Last AM-Peak-Period Inbound Train Percent Parking Space Utilization Date of Observation Parking Fee Middleborough/Lakeville Middleborough/Lakeville MBTA % 11/9/2012 $4.00 Montello Middleborough/Lakeville MBTA % 4/3/2013 $4.00 Bellevue Needham MBTA % 9/26/2012 $4.00 Hersey Needham MBTA % 3/14/2013 $4.00 Highland Needham MBTA % 9/26/2012 $4.00 Needham Center a Needham Town 0 0 0% 4/30/2014 $4.00 Needham Heights b Needham MBTA % 4/30/2013 $4.00 Needham Junction Needham MBTA % 3/13/2013 $4.00 Roslindale Village Needham MBTA % 9/26/2012 $4.00 West Roxbury Needham MBTA % 9/26/2012 $4.00 Attleboro c Providence/Stoughton GATRA % 5/16/2013 $4.00 Attleboro Providence/Stoughton Private % 5/16/2013 $3.00 Canton Center Providence/Stoughton MBTA % 11/7/2012 $4.00 Canton Junction Providence/Stoughton MBTA % 11/7/2012 $4.00 Canton Junction Providence/Stoughton Private % 11/7/2012 $4.00 Hyde Park Providence/Stoughton MBTA % 3/26/2013 $4.00 Mansfield Providence/Stoughton MBTA % 2/26/2013 $4.00 Mansfield Providence/Stoughton Private % 2/26/2013 $0.00 a The parking lots near Needham Center were under construction at the time of survey. (Cont.) b The parking lots near Needham Heights were under construction at the time of survey c The MBTA parking lot near Attleboro was under construction at the time of survey. The MBTA lot on South Main Street will be restriped in the near future.
44 TABLE A.2 (CONT.) South Side Commuter Rail: Inventory of MBTA Park-and-Ride Lots, Non Spaces, Occupied Commuter Rail Line Lot Ownership Parking Spaces Parking Spaces at Time of Last AM-Peak-Period Inbound Train Percent Parking Space Utilization Date of Observation Parking Fee Mansfield Providence/Stoughton Town % 2/26/2013 $0.00 Providence Providence/Stoughton Private % 3/28/2013 $16.00 Route 128 Providence/Stoughton MBTA 2,008 1,163 58% 6/20/2013 $7.00 Sharon Providence/Stoughton Town % 3/22/2013 $4.00 South Attleboro d Providence/Stoughton MBTA % 4/4/2013 $4.00 South Attleboro d Providence/Stoughton Private % 4/4/2013 $3.00 Stoughton Providence/Stoughton MBTA % 11/7/2012 $4.00 T. F. Green Providence/Stoughton Private % 4/3/2013 $6.75 Wickford Junction Providence/Stoughton Private 1, % 4/4/2013 $4.00 d The private parking lot near South Attleboro was under construction and was completely closed at the time of the survey. (Cont.)
45 TABLE A.3 Rapid Transit: Inventory of MBTA Park-and-Ride Lots, Non Spaces, Rapid Transit Line Lot Ownership Parking Spaces Occupied Parking Spaces at Time of Last AM-Peak-Period Inbound Train Percent Parking Space Utilization Date of Observation Parking Fee Beachmont Blue Line MBTA % 10/5/2012 $5.00 Maverick Blue Line Private % 10/5/2012 $7.00 Orient Heights Blue Line MBTA % 10/5/2012 $5.00 Suffolk Downs Blue Line MBTA % 10/5/2012 $5.00 Wonderland a Blue Line Private 2,326 1,541 66% 10/1/2012 $5.00 Wood Island Blue Line Private % 3/14/2013 $5.00 Chestnut Hill Green Line MBTA % 3/13/2013 $6.00 Eliot Green Line MBTA % 3/13/2013 $6.00 Lechmere Green Line MBTA % 3/12/2013 $6.00 Riverside Green Line MBTA % 3/6/2013 $6.00 Waban Green Line MBTA % 3/6/2013 $6.00 Woodland Green Line MBTA % 2/13/2013 $6.00 Forest Hills Orange Line MBTA % 1/30/2013 $6.00 Forest Hills Orange Line Private % 1/30/2013 $6.00 Green Street Orange Line Private % 3/5/2013 $70.00 Green Street Orange Line Town % 3/5/2013 $0.00 Malden Orange Line MBTA % 2/14/2013 $6.00 Malden Orange Line Private % 2/14/2013 $6.00 Oak Grove Orange Line MBTA % 3/12/2013 $6.00 Oak Grove Orange Line Private % 3/12/2013 $0.00 a The parking lots near Wonderland were under construction at the time of the survey. (Cont.)
46 TABLE A.3 (CONT.) Rapid Transit: Inventory of MBTA Park-and-Ride Lots, Non Spaces, Rapid Transit Line Lot Ownership Parking Spaces Occupied Parking Spaces at Time of Last AM-Peak-Period Inbound Train Percent Parking Space Utilization Date of Observation Parking Fee Sullivan Square Orange Line MBTA % 2/14/2013 $6.00 Sullivan Square Orange Line Private % 2/14/2013 $5.00 Wellington Orange Line MBTA 1,295 1,010 78% 6/12/2013 $6.00 Wellington Orange Line Private 1, % 6/12/2013 $5.00 Alewife Red Line MBTA 2,456 2,037 83% 5/7/2013 $7.00 Braintree Red Line MBTA 1,244 1,185 95% 11/2/2012 $7.00 Butler Red Line MBTA % 9/21/2012 $4.00 Mattapan Red Line MBTA % 9/21/2012 $4.00 Milton Red Line MBTA % 9/21/2012 $4.00 North Quincy Red Line MBTA 1,512 1,224 81% 11/01/2012 $5.00 Quincy Adams Red Line MBTA 2,352 1,911 81% 5/1/2013 $7.00 Quincy Center b Red Line MBTA 0 0 0% 11/1/2012 $0.00 Savin Hill Red Line MBTA % 9/25/2012 $5.00 Wollaston Red Line MBTA % 11/2/2012 $5.00 b The parking garage near Quincy Center was closed at the time of the survey.
47 TABLE A.4 Commuter Ferry and Express Bus: Inventory of MBTA Park-and-Ride Lots, Non Spaces, Transit Mode Lot Ownership Parking Spaces Occupied Parking Spaces at Time of Last AM-Peak-Period Inbound Train Percent Parking Space Utilization Date of Observation Parking Fee Watertown Yard Bus MBTA % 5/1/2013 $5.00 At Montvale Avenue Bus Town % 5/1/2013 $0.00 Hingham Ferry MBTA 1, % 6/20/2013 $4.00 Hingham Ferry Private % 6/20/2013 $4.00 Hull Ferry On-street % 9/18/2012 $0.00 Hull Ferry Private % 9/18/2012 $0.00 Hull Ferry Town % 9/18/2012 $0.00 Quincy/Fore River Ferry MBTA % 6/21/2013 $4.00
48 APPENDIX B MAPS OF PARK-AND-RIDE LOTS AND BICYCLE PARKING Figure Name Change in Park-and-Ride Utilization Rates, Inventory and Inventory Figure Number Minimum Parking Fees for MBTA s, Inventory B.2 Bicycle Parking Capacity and Utilization for Commuter Rail s, 2012 Inventory Bicycle Parking Capacity and Utilization for Rapid Transit s, 2012 Inventory B.1 B.3 B.4
49
50

51

52
System-Wide Accessibility and The Design Guide to Access. Transportation Agencies Liaison Committee Wednesday, June 20 th, 2018
 System-Wide Accessibility and The Design Guide to Access Transportation Agencies Liaison Committee Wednesday, June 20 th, 2018 System-Wide Accessibility: Who is presenting today? Laura Brelsford Assistant
MBTA RAILROAD OPERATIONS Commuter Rail. MBTA/MassDOT
 MBTA RAILROAD OPERATIONS Commuter Rail New England Railroad Club November 1, 2018 Ryan D. Coholan Chief Railroad Officer MBTA/MassDOT 1 Topics for Discussion State of the System Existing Conditions Ridership
HOUSING VOUCHERS FUNDED IN MASSACHUSETTS UNDER PENDING PROPOSALS
 820 First Street NE, Suite 510 Washington, DC 20002 Tel: 202-408-1080 Fax: 202-408-1056 center@cbpp.org www.cbpp.org November 1, HOUSING VOUCHERS FUNDED IN MASSACHUSETTS UNDER PENDING PROPOSALS For 2007,
FFYs Transportation Improvement Program
 For Public Review Table 2: Draft Amendment One Summary: Five-Year MBTA Programming Overall Changes in Funding in TIP Project Proposed Change Explanation Section/Funding Source From To Difference Five Year
C APPENDIX PROJECT EVALUATION INTRODUCTION
 C APPENDIX PROJECT EVALUATION INTRODUCTION The MPO applied its goals and objectives as criteria to qualitatively evaluate the major infrastructure and capacity-adding highway projects that are in the Universe
Appendix. Statistical Profile
 Appendix Statistical Profile MBTA Service and Infrastructure Profile August 200 MBTA SERVICE DISTRICT ANNUAL RIDERSHIP (FY 200) Cities and Towns 75 UNLINKED TRIPS BY MODE Size in Square Miles 3,2 Bus (includes
Appendix B Performance Measures Tables and Graphics (Maps)
") Appendix B Performance Measures Tables and Graphics (Maps) 1. MONITORED CMS ROADWAY NETWORK, LIST OF ROADWAYS (TABLE) 2. TRAVEL SPEED DIAGRAMS, ARTERIAL ROADWAYS (MORNING & 3. SPEED INDEX DIAGRAMS, ARTERIAL
Appendix B Performance Measures Tables and Graphics (Maps) 1. MONITORED CMS ROADWAY NETWORK, LIST OF ROADWAYS (TABLE) 2. TRAVEL SPEED DIAGRAMS, ARTERIAL ROADWAYS (MORNING & 3. SPEED INDEX DIAGRAMS, ARTERIAL
October 22, Dear Focus40 Project Team:
 October 22, 2018 Dear Focus40 Project Team: On behalf of our over 130,000 members and supporters across the Commonwealth, the Sierra Club Massachusetts Chapter provides these comments on the Focus40 Plan
The RIDE MBTA Systemwide Passenger Survey
 The RIDE P SL 2015 17 MBTA Systemwide Passenger Survey MBTA 2015 17 Systemwide Passenger Survey Project Managers Thomas J. Humphrey Katie Pincus Project Principal Annette Demchur Data Analysts Anna Comerford
Regionwide Suburban Transit Opportunities Study Phase II
 Regionwide Suburban Transit Opportunities Study Phase II A report produced by the Central Transportation Planning Staff for the Boston Region Metropolitan Planning Organization Regionwide Suburban Transit
APPENDIX UNIVERSE OF PROJECTS AND PROGRAMS
 APPENDIX UNIVERSE OF PROJECTS AND PROGRAMS INTRODUCTION One of the primary outcomes of the Long-Range Transportation Plan is the development of a list of major capital epansion projects for implementation
Appendix. Statistical Profile
 Appendix Statistical Profile MBTA Service and Infrastructure Profile March 2006 MBTA SERVICE DISTRICT ANNUAL RIDERSHIP (FY 2006) Cities and Towns 75 UNLINKED TRIPS BY MODE Size in Square Miles Population
DOWNTOWN PARKING STUDY AND STRATEGIC PLAN
 INTRODUCTION This report includes a summary of several key components of the Rapid City Downtown Parking Study and Strategic Plan, including: Current Conditions Analysis (Inventory and Occupancy and Length
What s going on? no train service safety control system
 Weekend overview 1. What s going on? 2. Why the entire line, and why now? 3. Bus shuttles available 4. How much do I pay? 5. You can also try 6. Getting the word out 7. Contact us What s going on? From
5. OPPORTUNITIES AND NEXT STEPS
 5. OPPORTUNITIES AND NEXT STEPS When the METRO Green Line LRT begins operating in mid-2014, a strong emphasis will be placed on providing frequent connecting bus service with Green Line trains. Bus hours
2016 Congestion Report
 2016 Congestion Report Metropolitan Freeway System May 2017 2016 Congestion Report 1 Table of Contents Purpose and Need...3 Introduction...3 Methodology...4 2016 Results...5 Explanation of Percentage Miles
MBTA DEPARTMENT OF SYSTEM-WIDE ACCESSIBILITY FIXED ROUTE REPORT December, 2011
 MBTA DEPARTMENT OF SYSTEM-WIDE ACCESSIBILITY FIXED ROUTE REPORT December, 2011 Accessibility Improvements at the 10 Park Plaza Bus Stop At the request of AACT, MBTA Operations is pursuing ways to improve
Right-of-Way Obstruction Permit Fee Structure Minneapolis Department of Public Works May 10, 2001
 Right-of-Way Obstruction Permit Fee Structure Minneapolis Department of Public Works May 10, 2001 Revised April 5, 2005 Revised January 27, 2006 Prepared by: Steve Collin, Engineer 2.5 Revised by Douglas
Metropolitan Freeway System 2013 Congestion Report
 Metropolitan Freeway System 2013 Congestion Report Metro District Office of Operations and Maintenance Regional Transportation Management Center May 2014 Table of Contents PURPOSE AND NEED... 1 INTRODUCTION...
Appendix B CTA Transit Data Supporting Documentation
 RED ED-PURPLE BYPASS PROJECT ENVIRONMENTAL ASSESSMENT AND SECTION 4(F) EVALUATION Appendix B CTA Transit Data Supporting Documentation 4( Memorandum Date: May 14, 2015 Subject: Chicago Transit Authority
Newburyport/Rockport Commuter Rail Line
 Newburyport/Rockport Commuter Rail Line Weekday Service Plan during the Beverly Drawbridge Reconstruction Project July 17 August 13 v.5.25.17 The Newburyport/Rockport Commuter Rail Line Construction Projects
2019 New Transit Service Plan
 Agenda Item 7.2 2019 New Transit Service Plan Draft Proposal VTA Board of Directors January 2019 Background: Next Network Plan and Today s Plan Early 2016 Transit Choices report and the ridership-coverage
WELCOME TO BLUE HILL AVENUE STATION PUBLIC MEETING October 5, 2016
 WELCOME TO BLUE HILL AVENUE STATION PUBLIC MEETING October 5, 2016 MBTA / MATTAPAN COMMUNITY MEETING: 15 September 2014 Public Libra 5:30 PM BLUE HILL AVENUE & CUMMINS HIGHWAY Introduction Project Status
Energy Technical Memorandum
 Southeast Extension Project Lincoln Station to RidgeGate Parkway Prepared for: Federal Transit Administration Prepared by: Denver Regional Transportation District May 2014 Table of Contents Page No. Chapter
GM Remarks. Fiscal and Management Control Board. August 14, 2017
 GM Remarks Fiscal and Management Control Board August 14, 2017 Agenda Warehouse / Money Room / Bus Maintenance Commuter Rail Wi-Fi Update Operations Performance Incidents Capital Projects Major Projects
Expansion Projects Description
 Expansion Projects Description The Turnpike expansion program was authorized by the Florida Legislature in 1990 to meet the State s backlog of needed highway facilities. The Legislature set environmental
EXECUTIVE SUMMARY. Introduction
 EXECUTIVE SUMMARY Introduction The purpose of this study is to ensure that the Village, in cooperation and coordination with the Downtown Management Corporation (DMC), is using best practices as they plan
Introduction and Background Study Purpose
 Introduction and Background The Brent Spence Bridge on I-71/75 across the Ohio River is arguably the single most important piece of transportation infrastructure the Ohio-Kentucky-Indiana (OKI) region.
Paid Parking at Park & Ride Lots: Framing the Issues. Capital Programs Committee May 2014
 Paid Parking at Park & Ride Lots: Framing the Issues Capital Programs Committee May 2014 Outline Current Status Industry Review DART Case Study Issues Alternatives Mechanics 2 Current Status: All Lots
Address Land Use Approximate GSF
 M E M O R A N D U M To: Kara Brewton, From: Nelson\Nygaard Date: March 26, 2014 Subject: Brookline Place Shared Parking Analysis- Final Memo This memorandum presents a comparative analysis of expected
TORONTO TRANSIT COMMISSION REPORT NO.
 Revised: March/13 TORONTO TRANSIT COMMISSION REPORT NO. MEETING DATE: March 26, 2014 SUBJECT: COMMUNITY BUS SERVICES ACTION ITEM RECOMMENDATION It is recommended that the Board not approve any routing
1 On Time Performance
 MEMORANDUM: US 29 Travel Time & OTP To: From: Joana Conklin, Montgomery County DOT James A. Bunch, SWAI Subject: US 29 Travel Time and On Time Performance Analysis Date: This memorandum documents the US
Chapter 2. Existing Conditions
 Chapter 2 Existing Conditions Existing Conditions 2.1 North Shore Overview The North Shore study area includes the City of Boston and 31 other cities and towns situated to the north and northeast of Boston
EUGENE-SPRINGFIELD, OREGON EAST WEST PILOT BRT LANE TRANSIT DISTRICT
 EUGENE-SPRINGFIELD, OREGON EAST WEST PILOT BRT LANE TRANSIT DISTRICT (BRIEF) Table of Contents EUGENE-SPRINGFIELD, OREGON (USA)... 1 COUNTY CONTEXT AND SYSTEM DESCRIPTION... 1 SYSTEM OVERVIEW... 1 PLANNING
Trip Generation Study: Provo Assisted Living Facility Land Use Code: 254
 Trip Generation Study: Provo Assisted Living Facility Land Use Code: 254 Introduction The Brigham Young University Institute of Transportation Engineers (BYU ITE) student chapter completed a trip generation
Evaluation of Renton Ramp Meters on I-405
 Evaluation of Renton Ramp Meters on I-405 From the SE 8 th St. Interchange in Bellevue to the SR 167 Interchange in Renton January 2000 By Hien Trinh Edited by Jason Gibbens Northwest Region Traffic Systems
ANDERSON PROPERTY SITE ANALYSIS
 ANDERSON PROPERTY SITE ANALYSIS Introduction The Montgomery County Department of Transportation (MCDOT) initiated a feasibility study in the fall of 2012 to evaluate the need for transit service expansion
Nightlife Involving College
 Nightlife Involving College Click John Huerth to edit Master subtitle style Transit Systems C. Michael Marcellin Donald Taylor Louise Vendramini History of Boston Transit Subway Line Mass subway public
Michigan/Grand River Avenue Transportation Study TECHNICAL MEMORANDUM #18 PROJECTED CARBON DIOXIDE (CO 2 ) EMISSIONS
 EMISSIONS") TECHNICAL MEMORANDUM #18 PROJECTED CARBON DIOXIDE (CO 2 ) EMISSIONS Michigan / Grand River Avenue TECHNICAL MEMORANDUM #18 From: URS Consultant Team To: CATA Project Staff and Technical Committee Topic:
TECHNICAL MEMORANDUM #18 PROJECTED CARBON DIOXIDE (CO 2 ) EMISSIONS Michigan / Grand River Avenue TECHNICAL MEMORANDUM #18 From: URS Consultant Team To: CATA Project Staff and Technical Committee Topic:
Martha s Vineyard Regional Transit Authority
 Martha s Vineyard Regional Transit Authority Annual Report Fiscal Year 2005 Martha s Vineyard Transit Authority Fiscal Year ending June 30, 2005 Annual Report Angela E. Grant, Administrator Advisory Board
Commuter Rail Update. October 25, 2018
 Commuter Rail Update October 25, 2018 2 page page 3 State of Commuter Rail Network, July 2014 The 2014 Commuter Rail network had multiple issues and a history of neglect & under-investment FIRST UP? UPGRADES
Technical Memorandum Analysis Procedures and Mobility Performance Measures 100 Most Congested Texas Road Sections What s New for 2015
 Technical Memorandum Analysis Procedures and Mobility Performance Measures 100 Most Congested Texas Road Sections Prepared by Texas A&M Transportation Institute August 2015 This memo documents the analysis
Metropolitan Council Budget Overview SFY
 Metropolitan Council Budget Overview SFY 2016-2017 H T t ti C itt House Transportation Committee February 4, 2015 Transit connects us to the places that matter Transportation Needs Grow as the Region Grows
CITY OF LOS ANGELES INTER-DEPARTMENTAL MEMORANDUM
 CITY OF LOS ANGELES INTER-DEPARTMENTAL MEMORANDUM Date: April 11, 2018 To: The Honorable City Council c/o City Clerk, Room 395, City Hall Attention: Honorable Mike Bonin, Chair, Transportation Committee
PARKING OCCUPANCY IN WINDSOR CENTER
 PARKING OCCUPANCY IN WINDSOR CENTER TOWN OF WINDSOR, CONNECTICUT REPORT JUNE 2017 CONTENTS Background... 3 Other Relevant Data... 3 Parking Survey Design... 6 Parking Supply Inventory... 6 Parking Demand
MBTA SCORECARD MESSAGE FROM THE GENERAL MANAGER SEPTEMBER Dear reader,
 MESSAGE FROM THE GENERAL MANAGER Dear reader, Thank you for reading the first edition of the MBTA ScoreCard. This ScoreCard reflects the MBTA s commitment to safe and reliable transportation and its goal
Attachment D Environmental Justice and Outreach
 Attachment D Environmental Justice and Outreach ATTACHMENT D Environmental Justice and Outreach Indicate whether the project will have disproportionately high and adverse impacts on minority or low income
Waco Rapid Transit Corridor (RTC) Feasibility Study
 Feasibility Study") Waco Rapid Transit Corridor (RTC) Feasibility Study Chris Evilia, Director of Waco Metropolitan Planning Organization Allen Hunter, General Manager Waco Transit System Jimi Mitchell, Project Manager AECOM
Waco Rapid Transit Corridor (RTC) Feasibility Study Chris Evilia, Director of Waco Metropolitan Planning Organization Allen Hunter, General Manager Waco Transit System Jimi Mitchell, Project Manager AECOM
2 VALUE PROPOSITION VALUE PROPOSITION DEVELOPMENT
 2 VALUE PROPOSITION The purpose of the Value Proposition is to define a number of metrics or interesting facts that clearly demonstrate the value of the existing Xpress system to external audiences including
National Household Travel Survey Add-On Use in the Des Moines, Iowa, Metropolitan Area
 National Household Travel Survey Add-On Use in the Des Moines, Iowa, Metropolitan Area Presentation to the Transportation Research Board s National Household Travel Survey Conference: Data for Understanding
A Transit Plan for the Future. Draft Network Plan
 A Transit Plan for the Future Draft Network Plan Project Overview and Status Completed Market Analysis and Service Evaluation. Developed Plan Framework and Guiding Principles. Developed a draft Five Year
Sean P. McBride, Executive Director Kalamazoo Metro Transit. Presentation to Michigan Transportation Planning Association July 13, 2016
 Sean P. McBride, Executive Director Kalamazoo Metro Transit Presentation to Michigan Transportation Planning Association July 13, 2016 Metro Transit in Kalamazoo County Square Miles = 132 Urbanized Population:
Opportunities for System Enhancement and Expansion
 CHAPTER 6 Opportunities for System Enhancement and Expansion Chapter 5 discussed many of the projects that would be needed to bring the MBTA infrastructure into a state of good repair. This chapter presents
Travel Time Savings Memorandum
 04-05-2018 TABLE OF CONTENTS 1 Background 3 Methodology 3 Inputs and Calculation 3 Assumptions 4 Light Rail Transit (LRT) Travel Times 5 Auto Travel Times 5 Bus Travel Times 6 Findings 7 Generalized Cost
Click to edit Master title style
 Nelson/Nygaard Consulting Associates SERVICE IMPROVEMENT STRATEGIES September 22, 2015 1 PROJECT OVERVIEW & WORK TO DATE 1. Extensive stakeholder involvement Throughout 2. System and market assessment
Trip Generation and Parking Study New Californian Apartments, Berkeley
 Trip Generation and Parking Study New Californian Apartments, Berkeley Institute of Transportation Engineers University of California, Berkeley Student Chapter Spring 2012 Background The ITE Student Chapter
MBTA SCORECARD MESSAGE FROM THE GENERAL MANAGER NOVEMBER Dear reader,
 MESSAGE FROM THE GENERAL MANAGER Dear reader, Thank you for reading the MBTA ScoreCard. This ScoreCard reflects the MBTA s commitment to safe and reliable transportation and its goal of being transparent
Sound Transit Operations July 2016 Service Performance Report. Ridership
 Ridership Total Boardings by Mode Mode Jul-15 Jul-16 % YTD-15 YTD-16 % ST Express 1,618,779 1,545,852-4.5% 10,803,486 10,774,063-0.3% Sounder 333,000 323,233-2.9% 2,176,914 2,423,058 11.3% Tacoma Link
Memorandum. To: The Arlington County Board Date: June 29, 2018 From: Subject:
 OFFICE OF THE COUNTY MANAGER 2100 Clarendon Boulevard, Suite 302, Arlington, VA 22201 TEL 703.228.3120 FAX 703.228.3218 TTY 703.228.4611 www.arlingtonva.us Memorandum To: The Arlington County Board Date:
KEY BUS ROUTE IMPROVEMENT PROJECT ROUTE 23 AGENDA
 KEY BUS ROUTE IMPROVEMENT PROJECT ROUTE 23 December 9, 2009 Codman Tech 450 Washington Street AGENDA Introduction Key Bus Routes Program Route 23 Challenges Proposed Improvement Plan Next Steps Question
Downtown Lee s Summit Parking Study
 Downtown Lee s Summit Parking Study As part of the Downtown Lee s Summit Master Plan, a downtown parking and traffic study was completed by TranSystems Corporation in November 2003. The parking analysis
THE CORNERSTONE APARTMENTS TRAFFIC IMPACT STUDY R&M PROJECT NO
 THE CORNERSTONE APARTMENTS SITUATED AT N/E/C OF STAUDERMAN AVENUE AND FOREST AVENUE VILLAGE OF LYNBROOK NASSAU COUNTY, NEW YORK TRAFFIC IMPACT STUDY R&M PROJECT NO. 2018-089 September 2018 50 Elm Street,
The Latest on Joint Development Policy Guidance
 Panelists The Latest on Joint Development Policy Guidance Moderator: Jonathan Davis Deputy General Manager and Chief Financial Officer Massachusetts Bay Transportation Authority James Blakesley, Attorney-Advisor,
GO Transit s deliverable: the 2020 Service Plan
 GO Transit s deliverable: the 2020 Service Plan GO Transit s 2020 Service Plan describes GO s commitment to customers, existing and new, to provide a dramatically expanded interregional transit option
Executive Summary October 2013
 Executive Summary October 2013 Table of Contents Introduction... 1 Rider Transit and Regional Connectivity... 1 Plan Overview... 2 Network Overview... 2 Outreach... 3 Rider Performance... 4 Findings...
Michigan. Traffic. Profile
 June 2014 Revised 5/11/15 Michigan 2013 Traffic Crash Profile Reporting Criteria Please pay particular attention to the wording when interpreting the three levels of data gathered for this report. Crash
MONTHLY NEW RESIDENTIAL SALES, APRIL 2017
 FOR RELEASE AT 10:00 AM EDT, TUESDAY, MAY 23, MONTHLY NEW RESIDENTIAL SALES, APRIL Release Number: CB17-80 May 23, - The U.S. Census Bureau and the U.S. Department of Housing and Urban Development jointly
Bus Stop Optimization Study
 Bus Stop Optimization Study Executive Summary February 2015 Prepared by: Passero Associates 242 West Main Street, Suite 100 Rochester, NY 14614 Office: 585 325 1000 Fax: 585 325 1691 In association with:
Chicago Transit Authority Service Standards and Policies
 Chicago Transit Authority Service Standards and Policies Overview and Objectives The Chicago Transit Authority (CTA) has revised its Service Standards and Policies in accordance with Federal Transit Administration
Stakeholders Advisory Working Groups (SAWGs) Traffic and Transit SAWG Meeting #7
 Traffic and Transit SAWG Meeting #7") Presentation Tappan Zee Bridge/I-287 Corridor Environmental Review December 4, 2008 Slide 1 Title Slide Slide 2 This presentation discusses the contents of the Transit Mode Selection Report. Slide 3 The
Presentation Tappan Zee Bridge/I-287 Corridor Environmental Review December 4, 2008 Slide 1 Title Slide Slide 2 This presentation discusses the contents of the Transit Mode Selection Report. Slide 3 The
Service Quality: Higher Ridership: Very Affordable: Image:
 Over the past decade, much attention has been placed on the development of Bus Rapid Transit (BRT) systems. These systems provide rail-like service, but with buses, and are typically less expensive to
Missouri Seat Belt Usage Survey for 2017
 Missouri Seat Belt Usage Survey for 2017 Conducted for the Highway Safety & Traffic Division of the Missouri Department of Transportation by The Missouri Safety Center University of Central Missouri Final
Valley Metro Overview. ITE/IMSA Spring Conference March 6, 2014
 Valley Metro Overview ITE/IMSA Spring Conference March 6, 2014 Valley Metro Who Are We? Operate Regional Transit Services Valley Metro and Phoenix are region s primary service providers Light Rail and
SERVICE IMPROVEMENT GUIDE
 SOUTH COOK COUNTY / WILL COUNTY RESTRUCTURING INITIATIVE SERVICE IMPROVEMENT GUIDE Working to Improve Your Commute Change has arrived for residents of south and southwest Cook County, in the form of improved
Commuter Rail Positive Train Control (PTC)
") Commuter Rail Positive Train Control (PTC) Update and Communications Plan for Suspension of Weekend Service March 27, 2017 Commuter Rail PTC Update and Communications Plan for Suspension of Weekend Service
Commuter Rail Positive Train Control (PTC) Update and Communications Plan for Suspension of Weekend Service March 27, 2017 Commuter Rail PTC Update and Communications Plan for Suspension of Weekend Service
Public Meeting. City of Chicago Department of Transportation & Department of Housing and Economic Development
 Public Meeting City of Chicago Department of Transportation & Department of Housing and Economic Development Funded by Regional Transportation Authority September 12, 2011 In partnership with Presentation
REPORT CARD FOR CALIFORNIA S INFRASTRUCTURE WHAT YOU SHOULD KNOW ABOUT CALIFORNIA S TRANSIT FACILITIES
 TRANSIT GRADE: C- WHAT YOU SHOULD KNOW ABOUT TRANSIT FACILITIES California needs robust, flexible and reliable transit systems to reduce peak congestion on our highways, provide options for citizens who
Indicators. New England Economic. February Federal Reserve Bank of Boston
 Indicators Economic February 2006 Federal Reserve Bank of Boston Labor Market Conditions Income Consumer Prices Consumer Confidence Real Estate Merchandise Exports Electricity Sales State Revenues Economic
GODURHAM PROGRESS REPORT
 GODURHAM PROGRESS REPORT OVERVIEW OPERATIONS & PERFORMANCE With the service enhancements, total revenue hours increased In 2016, GoDurham connected 5.9 million passengers to jobs, education and health
CITY OF ANN ARBOR, MICHIGAN 301 E. Huron St., P.O. Box 8647 Ann Arbor, Michigan
 Date: Wednesday, June 18, 2014 Location: Ann Arbor District Library Attendees: 14 citizen attendees Ann Arbor Station Environmental Review Citizen Working Group Meeting Notes Meeting #3 The third meeting
Point A Point B Point C Point D. Fulton County Board of Commissioners and Mayors Meeting December 14, 2017
 Fulton County Board of Commissioners and Mayors Meeting December 14, 2017 Master Plan Overview Phase 1 Community Vision and Existing Transit Conditions Phase 2 Scenario Development Phase 3 Transit Master
Michigan. Traffic. Profile
 June 2014 Revised 5/11/15 Michigan 2013 Traffic Crash Profile Reporting Criteria Please pay particular attention to the wording when interpreting the three levels of data gathered for this report. Crash
TENTH EDITION - CONTENTS
 Ridership and Service Statistics Tenth Edition, 2004-2005 Massachusetts Bay Transportation Authority Daniel A. Grabauskas, General Manager Chapter 1 - Introduction TENTH EDITION - CONTENTS About This Book
Kent County Traffic Crash Data & Year Trends. Reporting Criteria
 May 2015 Revised 3/16/2016 2014 Reporting Criteria Please pay particular attention to the wording when interpreting the three levels of data gathered for this report. Crash The Crash Level analyzes data
PARTIAL PROGRAM OF PROJECTS FFY
 PARTIAL PROGRAM OF PROJECTS FFY 2016-17 The proposed Partial Program of Projects for FFY 2016-17 is attached. The proposed Partial Program of Projects was introduced at the SCTA Board at its meeting on
Transportation & Traffic Engineering
 Transportation & Traffic Engineering 1) Project Description This report presents a summary of findings for a Traffic Impact Analysis (TIA) performed by A+ Engineering, Inc. for the Hill Country Family
MTA Long Island Rail Road (LIRR) and MTA Metro-North Railroad (MNR) System-wide Service Standards
 and MTA Metro-North Railroad (MNR) System-wide Service Standards") MTA Long Island Rail Road (LIRR) and MTA (MNR) System-wide Service Standards The following system-wide service standards apply to LIRR and MNR operations. 1. Service Availability Service Availability is
MTA Long Island Rail Road (LIRR) and MTA (MNR) System-wide Service Standards The following system-wide service standards apply to LIRR and MNR operations. 1. Service Availability Service Availability is
Trip Generation & Parking Occupancy Data Collection: Grocery Stores Student Chapter of Institute of Transportation Engineers at UCLA Spring 2014
 Trip Generation & Parking Occupancy Data Collection: Grocery Stores Student Chapter of Institute of Transportation Engineers at UCLA Spring 2014 Page 1 Introduction The UCLA Institute of Transportation
BROWARD BOULEVARD CORRIDOR TRANSIT STUDY
 BROWARD BOULEVARD CORRIDOR TRANSIT STUDY FM # 42802411201 EXECUTIVE SUMMARY July 2012 GOBROWARD Broward Boulevard Corridor Transit Study FM # 42802411201 Executive Summary Prepared For: Ms. Khalilah Ffrench,
Clean Harbors Canada, Inc.
 Clean Harbors Canada, Inc. Proposed Lambton Landfill Expansion Environmental Assessment Terms of Reference Transportation Assessment St. Clair Township, Ontario September 2009 itrans Consulting Inc. 260
King County Metro. Columbia Street Transit Priority Improvements Alternative Analysis. Downtown Southend Transit Study. May 2014.
 King County Metro Columbia Street Transit Priority Improvements Alternative Analysis Downtown Southend Transit Study May 2014 Parametrix Table of Contents Introduction... 1 Methodology... 1 Study Area...
Stoughton Center Parking
 Stoughton Center Parking Existing Conditions and Observations October 4, 2017 Agenda Introduction Metropolitan Area Planning Council Project Team Parking Studies Background Scope of Work Study Area Survey
UTA Transportation Equity Study and Staff Analysis. Board Workshop January 6, 2018
 UTA Transportation Equity Study and Staff Analysis Board Workshop January 6, 2018 1 Executive Summary UTA ranks DART 6 th out of top 20 Transit Agencies in the country for ridership. UTA Study confirms
DEVELOPMENT OF RIDERSHIP FORECASTS FOR THE SAN BERNARDINO INFRASTRUCTURE IMPROVEMENT STUDY
 APPENDIX 1 DEVELOPMENT OF RIDERSHIP FORECASTS FOR THE SAN BERNARDINO INFRASTRUCTURE IMPROVEMENT STUDY INTRODUCTION: This Appendix presents a general description of the analysis method used in forecasting
MONTHLY NEW RESIDENTIAL CONSTRUCTION, FEBRUARY 2017
 FOR RELEASE AT 8:30 AM EDT, THURSDAY, MARCH 16, MONTHLY NEW RESIDENTIAL CONSTRUCTION, FEBRUARY Release Number: CB17-38 March 16, - The U.S. Census Bureau and the U.S. Department of Housing and Urban Development
Los Angeles County Metropolitan Transportation Authority. Paid Parking Pilot Program Parking Management
 Los Angeles County Metropolitan Transportation Authority Paid Parking Pilot Program Parking Management Overview Metro currently operates over 22,000 parking spaces at 48 stations. This number will increase
MONTHLY NEW RESIDENTIAL CONSTRUCTION, JULY 2017
 FOR RELEASE AT 8:30 AM EDT, WEDNESDAY, AUGUST 16, MONTHLY NEW RESIDENTIAL CONSTRUCTION, JULY Release Number: CB17-133 August 16, - The U.S. Census Bureau and the U.S. Department of Housing and Urban Development
Appendix D. West Corridor. Mobility Problems and Proposed Solutions. Existing Co n d i t i o n s
 Appendix D Mobility Problems and Proposed Solutions : Background Existing Co n d i t i o n s This corridor extends west from Massachusetts Avenue in Boston to the towns of Leicester and Paxton, west of
MBTA Key Bus Route Improvement Program. Community Meeting Route 66 Allston/Brighton
 MBTA Key Bus Route Improvement Program Community Meeting Route 66 Allston/Brighton January 19, 2011 Honan-Allston Library 300 North Harvard Street Agenda Welcome and introductions Safety briefing/accommodations
MOTION NO. M Preferred Alternative for the Puyallup Station Access Improvement Project
 MOTION NO. M2014 64 Preferred Alternative for the Puyallup Station Access Improvement Project MEETING: DATE: TYPE OF ACTION: STAFF CONTACT: Capital Committee Board PROPOSED ACTION 8/14/14 8/28/14 Recommendation