Chapter 2. Existing Conditions
|
|
|
- Joseph Parrish
- 5 years ago
- Views:
Transcription
1 Chapter 2 Existing Conditions
2 Existing Conditions 2.1 North Shore Overview The North Shore study area includes the City of Boston and 31 other cities and towns situated to the north and northeast of Boston (see Figure 2-1). According to 2000 Census data, the total population of the study area, including the City of Boston, is approximately 1.27 million people. Overall, the study area experienced a population growth of almost five percent between 1990 and 2000, with some towns experiencing stronger growth rates than others. A few communities lost population during the ten-year period. Major highways in the study area include Interstate 95, U.S. Route 1, and Massachusetts Route 128. Transit services on the North Shore include services provided by the Massachusetts Bay Transportation Authority (MBTA) and other local operators. The MBTA provides commuter rail service to the North Shore via the Eastern Route Main Line (ERML) extending to Newburyport and Rockport. Additionally, several communities in the southern portion of the study area are located along the Haverhill commuter rail line. Rapid transit service is provided on the Blue Line between Bowdoin station in downtown Boston and Wonderland station in Revere. The MBTA and other local transit providers operate local bus routes throughout the North Shore and some express routes to downtown Boston. Private motor coach carriers also operate inter-city and express bus routes from the northern study area communities into downtown Boston. The Cape Ann Transit Authority (CATA) provides additional local bus transit service in Gloucester, Rockport, and other Cape Ann communities. In addition, the Massachusetts Port Authority provides direct access from Peabody to Logan Airport via its Logan Express Service. The most recent major expansion of public transportation in the study area was the eight-mile northward extension of the Ipswich commuter rail line to a new terminus at Route 1 in Newburyport. Service on the Newburyport extension began in 1997 and included new stations at Rowley and Newburyport. This extension represented a restoration of passenger service on a route that had been discontinued in The MBTA has also continued to make investments to upgrade and rehabilitate Blue Line rapid transit facilities. In the 1990s, a Blue Line modernization program was initiated. As part of this program, several Blue Line stations were reconstructed to provide improved accessibility, and the MBTA is continuing to work to complete the Blue Line modernization program. In addition, procurement of new Blue Line vehicles will replace the existing fleet began in 2001, and will allow the MBTA to run six car train sets. 2.2 DEMOGRAPHICS With a current population of over 1.2 million, the North Shore Transit Improvements Project-MIS study area incorporates a diverse range of communities including old core cities, inner suburbs of Boston, historic coastal towns, new suburban subdivisions, and rural areas. The region varies greatly in affluence, economic activity, and character. This variation is characterized by: a still substantial but declining commercial and industrial base combined with older housing centered in Lynn and other dense areas nearer Boston; shopping centers and extensive residential development in parts of Peabody, Topsfield, Swampscott, and other areas along Route 128; agriculture, large estates, and historic village centers in Essex, Hamilton and Wenham; and, tourist and recreational development extending along the entire coast, focusing on Newburyport, Salem, and Revere. Page 2-1
3 New Hampshire SALISBURY NEWBURYPORT 495 1A NEWBURY GEORGETOWN ROWLEY 95 BOXFORD IPSWICH 1 TOPSFIELD 1A HAMILTON ESSEX GLOUCESTER ROCKPORT MIDDLETON WENHAM 93 DANVERS BEVERLY 128 MANCHESTER LYNNFIELD PEABODY LYNN SAUGUS MELROSE 1A MALDEN REVERE EVERETT SALEM MARBLEHEAD SWAMPSCOTT NAHANT CHELSEA Miles WINTHROP Legend 9 BOSTON Major Highways State/US Routes Commuter Rail Service DEIS Corridor Municipalities Study Area Municipalities Other Municipalities MASSACHUSETTS BAY TRANSPORTATION AUTHORITY I:\projects\north-shore-MIS\2-1_NS-study-area.mxd Figure 2-1 North Shore Study Area Parsons Brinckerhoff
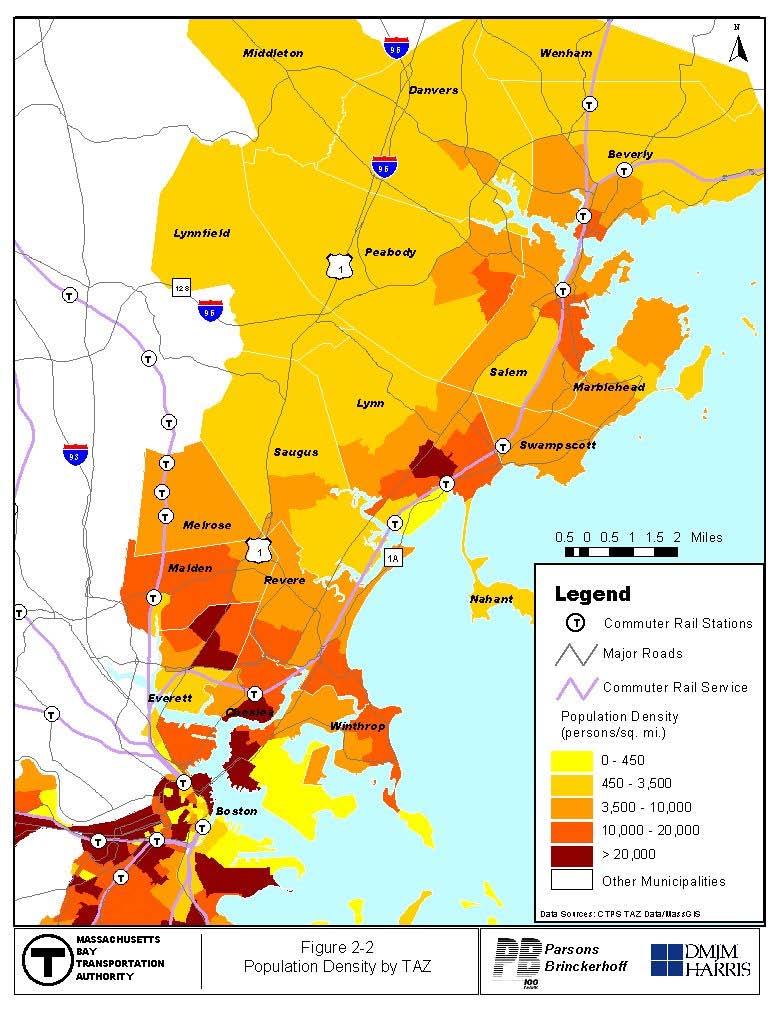
4 Table 2-1 lists population, land area, and population density statistics for all 32 North Shore Study Area communities. Figure 2-2 depicts the population density within each town or city south of Beverly. Density is depicted by traffic analysis zones (TAZs), a geographic unit used for transportation analysis in the Boston region s transportation model. Among the communities that are the focus of the MIS, Malden, Revere, Winthrop and portions of Salem, Beverly, and Peabody experience high population density (see Figure 2-2). The least densely populated communities are Topsfield, Ipswich, Boxford, Rowley, Newbury, and Essex, each with less than 500 people per square mile. Table 2-1 North Shore Communities Population Densities City / Town Population Land Area (Sq. Mi.) Population Density (Pop. / Sq. Mi.) Beverly 39, ,582 Boston 589, ,167 Boxford 7, Chelsea 35, ,018 Danvers 25, ,898 Essex 3, Everett 38, ,254 Georgetown 7, Gloucester 30, ,166 Hamilton 8, Ipswich 12, Lynn 89, ,238 Lynnfield 11, ,137 Malden 56, ,069 Manchester 5, Marblehead 20, ,498 Melrose 27, ,773 Middleton 7, Nahant 3, ,929 Newbury 6, Newburyport 17, ,051 Peabody 48, ,935 Revere 47, ,987 Rockport 7, ,099 Rowley 5, Salem 40, ,989 Salisbury 7, Saugus 26, ,373 Swampscott 14, ,725 Topsfield 6, Wenham 4, Winthrop 18, ,197 Source: U.S. Census, 2000 Note: Bolded text communities are the focus of the MIS report. Unbolded communities are highlighted in the DEIS. Page 2-3
5
6 Boston is the economic hub of the Commonwealth of Massachusetts and the New England region. It is a direct source of employment and income well beyond the City s limits. Boston comprises nearly 21 percent of the state s jobs and 10 percent of the employment opportunities of the six New England states 1. Over the last two decades, Boston s economy has shifted from manufacturing to a service based economy. The metropolitan area primarily specializes in financial, government, business, and professional services, as well as educational and medical institutions. Suburban areas are specialized in the high technology and defense-related industries. Significant employment gains have occurred primarily in financial securities, health, educational, cultural, non-professional business, and professional business sectors in the Boston region. Along with the changes in the regional economy, there has been a change in the labor force composition. The larger economy has increased the labor force participation, of women, minorities, youth, and the elderly. Employment in the North Shore is depicted in Figure 2-3. Employment is measured as the number of jobs estimated by U.S. Census in the 1996 Census for each of the 32 towns in the North Shore study area. Notable on the figure is the concentration of employment at Logan International Airport and at the General Electric Plant in Lynn. Table 2-2 provides a summary of jobs within each of the study area communities. The annual unemployment rate for the State of Massachusetts is 2.6 percent and the annual unemployment rates for the 32 communities range from 1.0 percent in the Town of Wenham to 3.9 percent in the City of Chelsea (See Table 2-3). In general, the higher annual unemployment rates occur in the urban core, while the Route 128 and Interstate 495 communities have lower annual rates. The average annual unemployment rate for the urban core communities is 3.0 percent while the average rates for the Route 128 communities and Interstate 495 communities are 2.0 and 2.2, respectively. The number of commuters 2 to Boston from the North Shore is depicted in Figure 2-4. In general, the number of commuters to Boston decreases as the distance from Boston increases. Notable exceptions are Gloucester and Newburyport, towns which host commuter rail stations. 2.3 Land Use The North Shore Study Area consists of approximately 423 square miles 3 of land area. The major uses are open space (forest, etc.) and residential (30%), followed by wetlands (9%) recreation (6%), commercial (5%), transportation (3%) and water (3%). (See Table 2-4 and Figure 2-5) What is characterized as the Urban Core sub-region by the Metropolitan Area Planning Commission (MAPC) had the largest concentration of commercial and industrial land uses in the study area with 46.1 percent, Route 128 a concentration of residential land use with 38 percent, and I-495 the largest agricultural, forest, and open space land use with 78.5 percent. Boston has the largest concentration of commercial/industrial land uses with 7.5 square miles, followed by Peabody and Danvers with 1.72 and 1.63 square miles, respectively. Boston also has the largest concentration of residential land use with slightly over 20 square miles, followed by Lynnfield and Peabody with approximately 8.5 square miles and 7.2 square miles Boston s Strong Economy-2000 A commuter is a person traveling from their place of residence to their place of employment. Land use composition is derived from MASSGIS land use data. Page 2-5

7
8 Table 2-2 Employment Composition within North Shore Study Area, 2000 Cities Total Employment Basic Retail Service Employees Pct. Employees Pct. Employees Pct. BOSTON 583, ,727 18% 57,813 10% 421,382 72% CHELSEA 13,116 6,338 48% 1,450 11% 5,328 41% EVERETT 10,398 5,141 49% 1,142 11% 4,115 40% MALDEN 17,506 6,240 36% 2,807 16% 8,459 48% REVERE 8,777 2,591 30% 2,751 31% 3,435 39% WINTHROP 2, % % 2,041 83% Total Urban Core 636, ,152 20% 66,277 10% 444,760 70% BEVERLY 19,485 5,117 26% 3,646 19% 10,722 55% DANVERS 23,039 6,873 30% 6,387 28% 9,779 42% LYNN 25,271 8,674 34% 3,167 13% 13,430 53% LYNNFIELD 5,177 1,097 21% 1,154 22% 2,926 57% MARBLEHEAD 4, % 1,058 21% 2,981 60% MELROSE 6,555 1,174 18% % 4,434 68% NAHANT % % % PEABODY 26,897 8,402 31% 7,745 29% 10,750 40% SALEM 18,596 3,353 18% 3,359 18% 11,884 64% SAUGUS 11,049 1,999 18% 6,480 59% 2,570 23% SWAMPSCOTT 3, % 1,252 37% 1,565 47% Total Route ,268 14,328 24% 18,960 31% 26,980 45% BOXFORD % 36 4% % ESSEX 1, % % % GEORGETOWN 2,429 1,197 49% % % GLOUCESTER 11,457 4,637 40% 2,075 18% 4,745 41% HAMILTON 1, % % 1, % IPSWICH 3,848 1,317 34% % 1,835 48% MANCHESTER 1, % % % MIDDLETON 4,874 1,895 39% % 2,097 43% NEWBURY 1, % % % NEWBURYPORT 10,185 3,478 34% 2,180 21% 4,527 44% ROCKPORT 1, % % % ROWLEY 2, % % % SALISBURY 2,731 1,041 38% % % TOPSFIELD 2, % % 1,458 59% WENHAM 1, % 0 0% 1,118 94% Total I ,524 16,921 34% 9,613 19% 22,990 46% Total Study Area 1,576, ,633 21% 206,058 13% 1,033,732 66% Source: Central Transportation Planning Staff (CTPS) Note: Bolded text communities are the focus of the MIS report. Unbolded communities are highlighted in the DEIS. Page 2-7
9 Table 2-3 Unemployment for State and by City City 2002 (not seasonally adjusted) 2003 (not seasonally adjusted) RATE UNEMPLOYMENT RATE UNEMPLOYMENT Massachusetts 5.3% 185, % 198,300 URBAN CORE Boston 5.8% 18, % 18,710 Chelsea 8.1% 1, % 1,228 Everett 6.0% 1, % 1,378 Malden 5.5% 1, % 1,946 Revere 6.5% 1, % 1,730 Winthrop 5.0% % 598 ROUTE 128 Beverly 4.3% % 1,018 Danvers 4.1% % 711 Lynn 6.6% 2, % 3,220 Lynnfield 3.5% % 272 Marblehead 3.9% % 457 Melrose 4.5% % 717 Nahant 4.9% % 105 Peabody 4.5% 1, % 1,404 Salem 5.6% 1, % 1,427 Saugus 4.6% % 873 Swampscott 4.3% % 362 ROUTE 495 Boxford 3.6% % 193 Essex 4.1% % 92 Georgetown 4.4% % 227 Gloucester 6.5% 1, % 1,167 Hamilton 3.6% % 108 Ipswich 3.9% % 369 Manchester 3.7% % 126 Middleton 4.2% % 162 Newbury 4.5% % 181 Newburyport 5.1% % 536 Rockport 5.0% % 240 Rowley 4.6% % 154 Salisbury 7.2% % 316 Topsfield 3.5% % 107 Wenham 3.2% % 78 Source: Massachusetts Division of Employment and Training, 2004 Note: Bolded text communities are the focus of the MIS report. Unbolded communities are highlighted in the DEIS. Page 2-8
10 SALISBURY 495 NEWBURYPORT 1A NEWBURY GEORGETOWN ROWLEY 95 BOXFORD 1 IPSWICH ROCKPORT TOPSFIELD 1A HAMILTON ESSEX GLOUCESTER MIDDLETON WENHAM 93 DANVERS 128 BEVERLY MANCHESTER LYNNFIELD PEABODY LYNN SAUGUS MELROSE 1A MALDEN REVERE EVERETT CHELSEA SALEM MARBLEHEAD SWAMPSCOTT Legend Major Highways State/US Routes Commuter Rail Service Commuters to Boston WINTHROP BOSTON Boston Other Municipalities Data Sources: 1990 US Census, CTPS, MassGIS MASSACHUSETTS BAY TRANSPORTATION AUTHORITY I:\projects\north-shore-MIS\2-4_commuters_to_boston.mxd Figure 2-4 Commuters to Boston Parsons Brinckerhoff
11 Table 2-4 North Shore Land Use Type (Square Miles) City/TOWN Agriculture/Forest/ Open Space Commercial/Industrial Miscellaneous Residential Recreation/Spectator/ Urban Transportation Water Wetlands/Marshlands Total Sq Miles Sq. Miles Pct. Sq. Miles Pct. Sq. Miles Pct. Sq. Miles Pct. Sq. Miles Pct. Sq. Miles Pct. Sq. Miles Pct. Sq. Miles Pct. Beverly % % % % % % % % Boston % % % % % % % % Boxford % % % % % % % % Chelsea % % % % % % % % Danvers % % % % % % % % Essex % % % % % % % % Everett % % % % % % % % Georgetown % % % % % % % % Gloucester % % % % % % % % Hamilton % % % % % % % % Ipswich % % % % % % % % Lynn % % % % % % % % Lynnsfield % % % % % % % % Malden % % % % % % % % Manchester % % % % % % % % Marblehead % % % % % % % % Melrose % % % % % % % % Middleton % % % % % % % % Nahant % % % % % % % % Newbury % % % % % % % % Newburyport % % % % % % % % Peabody % % % % % % % % Revere % % % % % % % % Rockport % % % % % % % % Rowley % % % % % % % % Salem % % % % % % % % Salisbury % % % % % % % % Saugus % % % % % % % % Swampscott % % % % % % % % Topsfield % % % % % % % % Wenham % % % % % % % % Winthrop % % % % % % % % Total Study Area % % % % % % % % Source: MASSGIS Landuse Cover Note: Square miles are derived from a MassGIS data set. Rounding error will be reflected from actual square miles. Percent reflects land use type to city total land use Page 2-10
12 North Shore Major Investment Study Figure 2-5 Land Use TOPSFIELD MIDDLETON 1 HAMILTON 2 3 Miles ESSEX WENHAM MANCHESTER DANVERS BEVERLY LYNNFIELD PEABODY SALEM SAUGUS LYNN MARBLEHEAD SWAMPSCOTT MELROSE MALDEN NAHANT REVERE EVERETT CHELSEA Legend Unpopulated (or Fewer Than 10 Persons) WINTHROP Agriculture/Forest/Open Space Residential Commercial/Industrial Wetlands/Marshlands Recreation/Spectator/Urban Open Space Water Transportation Miscellaneous Outside Study Area
13 INFRASTRUCTURE - RAILROAD AND TRANSIT Historic and Existing Railroad Corridors Present day rail transit lines in the study area can trace their origins primarily to the routes constructed in the mid-1880 s by the Boston & Maine and Eastern railroads. Competition between the two railroads resulted in the creation of many duplicative and marginally performing lines (notably branch lines) throughout the area. Consolidation of the various lines under Boston & Maine ownership resulted in a rationalization of the various routes. However, in many cases the identity of the original owner is perpetuated by the names associated with the various lines and segments. The present-day active rail network includes commuter rail passenger service operated by Amtrak for the MBTA, and freight service provided by Boston & Maine successor, Guilford Transportation. Figure 2-6 depicts the historic and existing railroad rights-of-way in the North Shore Transit Improvements Project-MIS study area. The Federal Railroad Administration (FRA) has developed a track classification system to classify maximum operating speeds for freight and passenger trains given the condition of the track. This measurement is an indicator of the existing quality of the track and supporting structures, and hence the speed and quality of service that can be provided on the track absent any improvements. Table 2-5 below lists these speeds for the various track classifications. The referenced classifications apply to the railroad corridors in the North Shore. Table 2-5 Maximum Speeds per Railroad Track Classifications FRA Track Classification Maximum Freight Train Speed Maximum Passenger Train Speed Excepted Track 10 mph N/A Class I 10 mph 15 mph Class 2 25 mph 30 mph Class 3 40 mph 60 mph Class 4 60 mph 80 mph Class 5 80 mph 90 mph Class 6 NA 110 mph Class 7 NA 125 mph Class 8 NA 160 mph Class 9 NA 200 mph Source: Federal Railroad Administration, FRA standards for Classes 6-9 reflect ongoing development of the so-called high-speed intercity passenger rail services. MBTA commuter rail service typically operates at a maximum train speed of mph. Page 2-12
14 12) Topsfield Secondary Branch SALISBURY Georgetown Branch 495 NEWBURYPORT 1A NEWBURY GEORGETOWN ROWLEY 1) Eastern Route Main Line BOXFORD IPSWICH 12) Topsfield Secondary Branch Salem & Lawrence 95 1 TOPSFIELD HAMILTON ESSEX ROCKPORT GLOUCESTER MIDDLETON 6) South Middleton Branch DANVERS 12) Topsfield Secondary Branch LYNNFIELD PEABODY WENHAM 128 MANCHESTER BEVERLY 2) Rockport Branch 5) Danvers Branch West Route 1 SAUGUS LYNN 11) South Reading Branch SALEM MARBLEHEAD 10) Marblehead Branch SWAMPSCOTT 9) Swampscott Branch MELROSE 1) Eastern Route Main Line MALDEN REVERE EVERETT 1) Eastern Route Main Line CHELSEA WINTHROP BOSTON Blue Line Legend Miles Major Highways Rail Status Abandoned In Use Out of Service Study Area Municipalities Other Municipalities MASSACHUSETTS BAY TRANSPORTATION AUTHORITY I:\projects\north-shore-MIS\2-6_existin_RR_Corridors.mxd Figure 2-6 Railroad Corridors Parsons Brinckerhoff
15 The following sections describe individual railroad rights-of-way Eastern Route Main Line The Eastern Route Main Line (ERML) was constructed as a 57-mile stretch of track from Boston, Massachusetts to Portsmouth, New Hampshire. The MBTA presently owns all of the ERML in Massachusetts to the New Hampshire border. From Boston, the line travels through Somerville, Everett, Chelsea, Revere, Lynn, Swampscott, Salem, Beverly, Wenham, Hamilton, Ipswich, Rowley, Newbury, and Newburyport, ending in Salisbury. Active trackage extends 37 miles between Boston and Newburyport, maintained to Class 3 track standards with an allowable maximum speed of 70 mph for passenger trains. There are two 35 mph grade crossings in Chelsea and Everett. The ERML track serves the Boston to Rockport and Boston to Newburyport commuter services, branching at the Beverly Junction. Commuter service to Newburyport continues on the ERML while commuter service to Rockport is served on the Gloucester Branch (See below). The ERML provides two main line tracks from Boston to the junction at Beverly and a single track with passing sidings from Beverly to Newburyport. Additionally, there is a single track through the 0.8-mile section of the Salem Tunnel. In the early 1900 s, a section of the right-of-way (ROW) through Lynn was reconstructed with sufficient width for four tracks. The existing elevated structure at the Lynn commuter rail station dates to Springfield Terminal Railway (Guilford Rail System) operates freight service between Somerville and Salem on the ERML Rockport Branch The 16.7 miles of Rockport Branch track is owned by the MBTA, extending from Beverly Junction to Rockport. There are two main line tracks from Beverly Junction to Gloucester and a single track from Gloucester to Rockport. The Gloucester Branch is used only for MBTA commuter rail passenger service Danvers Branch The five-mile Danvers Branch is owned by the MBTA. The Danvers Branch runs from the ERML in Salem northwest through Peabody, and toward Danvers. The single existing Class I track line is operated by Guilford Rail System/Springfield Terminal Railway, and narrows to no more than 25 feet in some places. The Waters River Bridge between Peabody and Danvers has been out of service since being damaged by a fire in This has effectively severed the line, which required rail freight customers north of the bridge to be served via Wakefield and Danvers Junction and customers in the south via Salem. The ties, rail, and ballast of the Danvers Branch are in deteriorating condition, and are located in a coastal zone adjacent to the North River South Middleton Branch The South Middleton Branch is an abandoned branch that runs from the Danvers Branch from Peabody Center north toward Lowell. The single track that was the South Middleton Branch has been removed. In the Peabody section, the City has acquired the ROW for a sewer easement Swampscott Branch The 4.5-mile Swampscott Branch served the town of Marblehead from a connection with the ERML. The line was abandoned in Page 2-14
16 2.3.7 Marblehead Branch The 3-mile Marblehead Branch served the town of Marblehead via a connection with the ERML at Castle Hill in Salem. The last remnant of the line was abandoned in South Reading Branch The South Reading Branch extended 8 miles between Wakefield Junction and Peabody (connecting with the Danvers Branch at Peabody). Over the past 70 years most of the line has been abandoned. Two miles at the Peabody end of the branch (accessed via the Danvers Branch from Salem) remain in service for an industrial park Topsfield Branch Originally constructed as a competing route to the ERML, this line extended 30 miles from Wakefield Junction northwards via Danvers, Topsfield and Georgetown to Newburyport. Presently only the tracks between Wakefield Junction and Danvers remain in service for freight operations provided by Guilford. The MBTA owns the active ROW, plus the abandoned five-mile ROW between Danvers and Topsfield. 2.4 MBTA Commuter Rail Operations Commuter Rail service in the Boston metropolitan area has been operated by Amtrak under contract to the MBTA. However, In July 2003 the MBTA entered into a new multi-year contract with a new company, Mass Bay Commuter Rail (MBCR) to operate and maintain the commuter rail system. All commuter rail services provided to the North Shore terminate in Boston s North Station, located adjacent to the Fleet Center on Causeway Street in Boston. The North Shore is served by the Newburyport/Rockport Commuter Rail Line. Trains leaving Boston for Newburyport and Rockport serve all stations on the ERML between North Station and Beverly Depot, at which point they separate and travel onto their respective destinations. The existing commuter rail system in the North Shore Transit Improvements Project-MIS study area is depicted in Figure 2-7. Each commuter rail train set on the North Shore consists of one locomotive and up to seven coaches. Coaches currently used on the North Shore services are primarily single-level coaches capable of seating 125 passengers Haverhill Line The Haverhill commuter rail line operates from North Station in Boston to Haverhill, MA. The line includes 13 station stops over its approximately 33 miles of track. The southern portion of the route, approximately eight miles in length, traverses the western portion of the North Shore Transit Improvements Project-Major Investment Study (MIS) area in the towns of Malden and Melrose. Within these two study area communities there are four commuter rail stations: Malden Center, Wyoming Hill, Melrose/Cedar Park, and Melrose Highlands. The Malden Center station provides service to the commuter rail. Page 2-15
17 495 NEWBURYPORT 1A ROWLEY 95 1 IPSWICH ROCKPORT HAMILTON / WENHAM NORTH BEVERLY MONTSERRAT BEVERLY DEPOT SALEM WEST GLOUCESTER 128 MANCHESTER BEVERLY FARMS PRIDES CROSSING GLOUCESTER 1 SWAMPSCOTT LYNN RIVER WORKS MALDEN CENTER CHELSEA Miles NORTH STATION Legend Major Highways Commuter Rail Service DEIS Corridor Municipalities Study Area Municipalities Other Municipalities MASSACHUSETTS BAY TRANSPORTATION AUTHORITY Figure 2-7 Commuter Rail Stations Parsons Brinckerhoff I:\projects\north-shore-MIS\figure2-7_com_rail_station.mxd
18 2.4.2 Weekday Service There are 23 revenue train trips per day provided on the Haverhill line during weekday inbound and outbound service. 4 Service at the stations varies depending on the station location. In general, the stations between Reading and North Station have more frequent service than outlying stations ( short turned ), because several trains operate only between Reading and North Station. Tables 2-6 and 2-7 provide details on the number of trains providing service to each station on the line. Due to their relative proximity to North Station, the four stations in the North Shore study area are served by a large number of trains in comparison to stations located beyond Reading. The scheduled travel time from Haverhill to North Station ranges between 59 and 70 minutes. Scheduled travel time between Melrose Highlands and North Station varies between 15 and 20 minutes during weekday service. Table 2-6 Haverhill Line Weekday Inbound Train Service by Station Trains Serving Station Arriving/Departing Station: Number of Weekday Trains Inbound to North Station 5AM-9:30 AM 9:30 AM- 4PM 4PM-7 PM After 7 PM Total No. of Trains Haverhill Bradford Lawrence Andover Ballardvale North Wilmington Reading Wakefield Greenwood Melrose Highlands Melrose / Cedar Park Wyoming Hill Malden Center North Station Source: Massachusetts Bay Transportation Authority, Based on January 3, 2004 MBTA operating schedule. Page 2-17
19 Table 2-7 Haverhill Line Outbound Weekday Service Trains Serving Station Number of Weekday Trains Outbound to Haverhill Arriving/Departing Station: 5AM-9:30 9:30 AM- 4PM-7 PM After 7 PM Total No. AM 4PM of Trains North Station Malden Center Wyoming Hill Melrose / Cedar Park Melrose Highlands Greenwood Wakefield Reading North Wilmington Ballardvale Andover Lawrence Bradford Haverhill Source: Massachusetts Bay Transportation Authority, Weekend Service Service on the Haverhill commuter rail line during the weekend consists of six inbound trips and six outbound trips per day (both Saturday and Sunday). Service is provided to every station on the line at a three-hour service frequency. Inbound trains originate in Haverhill at 7:15 AM, 10:15 AM, 1:15 PM, 4:15 PM, 7:15 PM and 10:15 PM. Outbound trains originate at North Station at 8:45 AM, 11:45 AM, 2:45 PM, 5:45 PM, 8:45 PM and 11:30PM. Scheduled travel time from Haverhill to North Station during weekends is 64 minutes. From Melrose Highlands to North Station, the scheduled travel time is approximately 17 minutes Rockport/Newburyport Line The ERML north of Boston extends from North Station to Newburyport, providing commuter rail service to eleven stops (including North Station) 5. The Rockport Branch diverges from the main line north of Beverly station, and provides service to seven additional stations: (Montserrat, Prides Crossing, Beverly Farms, Manchester, West Gloucester, Gloucester, and Rockport). Train sets are stored overnight at layover facilities located at the Newburyport and Rockport termini. Present services require overnight storage of four train sets at each location Weekday Service Service is provided seven days a week. However, the most frequent service is provided during weekday peak periods, with an emphasis on serving commuters traveling to work in downtown Boston. The scheduled travel time between Newburyport and North Station for weekday service varies between 59 minutes and 68 minutes. For weekday service to Rockport, the scheduled travel time varies between 68 and 74 minutes. Tables 2-8 and 2-9 provide details on the number of trains providing service to each station on the line. 5 Not including the River Works (Lynn) stop for General Electric employees. Page 2-18
20 Table 2-8 Newburyport/Rockport Line Weekday Inbound Train Service by Station Trains Serving Station Number of Weekday Trains Inbound to Boston North Station Arriving/Departing Station: 5AM-9:30 9:30 AM- 4PM-7 PM After 7 PM Total No. AM 4PM of Trains Rockport Branch Rockport Gloucester West Gloucester Manchester Beverly Farms Prides Crossing Montserrat Newburyport Branch Newburyport Rowley Ipswich Hamilton / Wenham North Beverly Beverly Depot Salem Swampscott Lynn Riverworks Chelsea North Station Source: Massachusetts Bay Transportation Authority, Page 2-19
21 Table 2-9 Newburyport / Rockport Line: Weekday Outbound Train Service by Station Trains Serving Station Number of Weekday Trains Outbound to Rockport/Newburyport Arriving/Departing 5AM-9:30 AM 9:30 AM-4PM 4PM-7 PM After 7 Total Station: PM North Station Chelsea Riverworks Lynn Swampscott Salem Beverly Depot Newburyport Branch North Beverly Hamilton / Wenham Ipswich Rowley Newburyport Rockport Branch Montserrat Pride s Crossing Beverly Farms Manchester West Gloucester Gloucester Rockport Source: Massachusetts Bay Transportation Authority, Weekend Service Weekend service on the Rockport/Newburyport Commuter Rail line is provided with 26 train trips per day (13 inbound and 13 outbound trips). Fourteen of the trips (seven inbound / seven outbound) are provided on the Rockport Branch. The other 12 trips (six inbound/six outbound) are provided to Newburyport. Outbound trains depart North Station approximately every hour throughout the day with some two hour headways (8:30 AM to 11:30 PM) and alternate between Newburyport and Rockport destinations. Inbound trains depart from Rockport and Newburyport, approximately every two hours throughout the day. Scheduled travel times for the weekend service to and from Rockport varies between 66 and 69 minutes. To and from Newburyport, the scheduled travel times vary between 61 and 62 minutes. 2.5 MBTA Commuter Rail Characteristics Commuter Rail Ridership Commuter rail ridership on the MBTA system has grown significantly in the past decade. This is due to numerous factors including several system expansions (notably the Newburyport, Old Colony, and Worcester service extensions), additional vehicles, and improving employment and economic conditions in downtown Boston. Figures 2-8 and 2-10 depict historic trends in commuter rail ridership. Page 2-20
22 The MBTA conducts counts of inbound passenger boardings by station approximately three times per year. The data for year 2000 has been averaged to determine the approximate number of boardings that occurred on a typical weekday. Tables 2-10 and 2-11 depict this data for the Newburyport/Rockport Line and the Haverhill Line. Figure 2-8 Average Daily Commuter Rail Ridership Average Daily Commuter Rail Ridership 80,000 70,000 60,000 MBTA Total 50,000 South Side 40,000 30,000 20,000 North Side Newburyport / Rockport 10, Source: Central Transportation Planning Staff, Page 2-21
23 Figure 2-9 Average Daily Ridership for Rockport/Newburyport Line 10,000 Newburyport/Rockport Line Average Daily Boardings by Branch 9,000 Average Daily Boardings 8,000 7,000 6,000 5,000 4,000 3,000 2,000 1,000 Newburyport Branch Rockport Branch Beverly to Boston TOTAL 0 May 88 Feb 90 Apr 92 May 94 Mar 96 May 98 Feb 00 Feb 02 Date Source: Central Transportation Planning Staff, Figure 2-10 Monthly Average Ridership for Haverhill Commuter Rail Line 300,000 Haverhill Line Monthly Ridership 250, , , ,000 50,000 0 Jul-89 Jul-90 Jul-91 Jul-92 Jul-93 Jul-94 Jul-95 Jul-96 Jul-97 Jul-98 Jul-99 Jul-00 Source: Massachusetts Bay Transportation Authority, Page 2-22
24 The MBTA conducts counts of inbound passenger boardings by station approximately three times per year. The latest data available are counts conducted in November These counts represent the most current typical weekday ridership. Table 2-10 depicts this data for the Newburyport/Rockport Line. Table 2-10 Newburyport/Rockport Typical Weekday Inbound Boardings Station/Branch Average Weekday Inbound Boardings (2003) Rockport Branch - Rockport 345 Gloucester 471 West Gloucester 93 Manchester 372 Beverly Farms 189 Prides Crossing 30 Montserrat 342 Newburyport Branch - Newburyport 744 Rowley 105 Ipswich 420 Hamilton / Wenham 455 North Beverly 472 Beverly Depot 1,970 Salem 2,398 Swampscott 957 Lynn 773 Riverworks 29 Chelsea 210 Source: Massachusetts Bay Transportation Authority, November Table 2-11: Haverhill Line Average Daily Boardings by Station (2000) Station Average Weekday Inbound Boardings (2000) Haverhill 337 Bradford 433 Lawrence 462 Andover 601 Ballardvale 265 North Wilmington 130 Reading 755 Wakefield 629 Greenwood 131 Melrose Highlands 342 Melrose / Cedar Park 258 Wyoming Hill 176 Malden Center 47 Source: Massachusetts Bay Transportation Authority, Page 2-23
25 2.5.2 Fare Structure The fare structure for commuter rail service is based on a zone system. Fares increase with distance traveled. Table 2-12 summarizes the adult regular one-way fares from North Station to station locations on the North Shore. This table reflects the new fare and zone structure that was instituted on January 3, Table 2-12 One-way Regular Commuter Rail Fares from North Station Station(s) One-Way Adult Regular Fare 6 Chelsea $2.00 Riverside, Lynn $3.50 Salem, Swampscott $3.75 Montserrat, Beverly Depot $4.50 Beverly Farms, Prides Crossing, Hamilton/Wenham, North Beverly $5.00 Ipswich, Manchester $5.25 Gloucester, West Gloucester $5.50 Rockport, Newburyport $6.00 Source: Massachusetts Bay Transportation Authority, Rail Rapid Transit Service One of the MBTA s four rail transit lines, the Blue Line, is located within the North Shore study area (Figure 2-11). The Blue Line is connected in downtown Boston at the State Street Station located in the financial district. Transfers to other rapid transit (Red and Green Lines) are available at other stations such as Downtown Crossing and Government Center Blue Line The Blue Line is approximately six miles long, and operates from Bowdoin Station in Boston to Wonderland Station in Revere. There are twelve stations located along the Blue Line (all within the study area): Bowdoin Government Center State Aquarium Maverick Airport Wood Island Orient Heights Suffolk Downs Beachmont Revere Beach and, Wonderland. 6 A $1.00 surcharge during off-peak period is added to tickets purchased on board when a ticket counter is open at the boarding station. The surcharge is $2.00 during peak-period travel times. Page 2-24


26 60 1 Legend Rapid Transit Stations Commuter Rail Stations Commuter Rail Service Study Area Municipalities Other Municipalities State Routes Major Highways A 99 WONDERLAND REVERE BEACH CHELSEA BEACHMONT SUFFOLK DOWNS 145 1A ORIENT HEIGHTS 1 WOOD ISLAND AIRPORT MAVERICK 145 BOWDOIN AQUARIUM STATE Miles MASSACHUSETTS BAY TRANSPORTATION AUTHORITY I:\projects\north-shore-MIS\figure2-10_rapid_transit_stations.mxd Figure 2-11 Rapid Transit Stations Parsons Brinckerhoff
27 The present day Blue Line emerged as a rapid transit line in the 1920 s, when the streetcar subway route between Bowdoin and Maverick stations was converted to rapid transit rail service. North of Maverick Station, the streetcar service continued to operate to Lynn. The Boston, Revere Beach and Lynn Railroad (BRB&L), was an at-grade narrow gauge railroad line that operated between East Boston and Lynn until In the 1950s, the ROW of the BRB&L line up to Wonderland Revere, was rebuilt for standard rail transit operation. This extension created the Blue Line route and twelve station locations as they exist today. North of Airport Station, all of the stations were rebuilt in the 1990s except for the Orient Heights station. The new stations provide accessibility for disabled patrons. The Blue Line currently operates with four-car trains at all times. This is primarily due to the short platforms at several Blue Line stations. Through the Blue Line Modernization Project, Aquarium Station has been renovated and expanded to accommodate future six-car trains. Work also will be performed at the Orient Heights, Government Center, State, and Maverick stations to accommodate future six-car trains. The current fleet of Blue Line cars consists of 70 vehicles that were built between 1979 and The cars are 48-feet long, significantly shorter than Red Line cars, and accommodate 42 seated passengers. The MBTA has placed an order for 94 new cars to replace the current fleet, and accommodate the future operation of six-car trains on the Blue Line. The operation of six-car trains will increase the line s peak passenger carrying capacity by 50%. Other improvements such as automated in-car station stop announcing and displays are also planned for the new Blue Line vehicles. The Blue Line operates daily with service frequencies as listed in Table Peak period travel time from Government Center to Wonderland (the terminus of the line) is approximately 23 minutes. The average daily boardings for a typical weekday by station are presented in Table Table 2-13 Blue Line Service Frequencies Weekday Peak Hours Weekdays Off Peak Weekday Nights Saturday Sunday 4 minutes 10 minutes 11 minutes 9 to 11 minutes 9 to 14 minutes Source: Massachusetts Bay Transportation Authority, Table 2-14 Blue Line Average Weekday Ridership by Station Station Average Daily Weekday Boardings 7 Bowdoin 1,491 Government Center 12,167 State 12,856 Aquarium 2,793 Maverick 8,409 Airport 4,229 Wood Island 2,144 Orient Heights 3,596 Suffolk Downs 941 Beachmont 2,120 Revere Beach 2,002 Wonderland 5,426 Total 57,388 7 Source: CTPS 1997 Rapid Transit Passenger Counts. Page 2-26
28 Source: Central Transportation Planning Staff, Fare Structure A regular fare on the MBTA rapid transit system is $1.25 per trip, which reflects the new fare and zone structure that was instituted on January 3, Transfers between rapid transit lines (Blue, Orange, Green and Red) are free. Monthly passes are available for $44. Combination passes and visitor passes are also available for subway patrons. 2.7 Bus System MBTA Routes The MBTA bus system provides approximately 376,000 daily bus boardings system-wide, more boardings than any other MBTA rapid transit mode. There are approximately 170 individual bus routes, covering 730 route miles in the MBTA service area. This includes approximately 8,600 bus stops throughout the system. MBTA buses provide significant service to North Shore study area communities. These buses provide local route service, feeder routes to commuter rail and rail rapid transit stations, and express bus routes to Boston. Approximately 45 bus routes serve the study area communities. Table 2-15 identifies each North Shore route and its associated service frequency for peak periods, daytime, nighttime, Saturday, and Sunday service. Table 2-16 identifies the average weekday ridership (boardings) per bus route operated by the MBTA. Vehicles As of 2003, there were 996 buses in operation on MBTA direct service bus routes. MBTA bus service in the study area is based at the Lynn garage on Western Avenue; Fellsway garage on Salem Street in Medford; and the Charlestown garage on Arlington Avenue. As of March 31, 2001, the active bus fleet based at Lynn was 106 buses. Sixty-three buses are based at Fellsway, and 236 buses are based at Charlestown. These vehicles are 40-foot buses with a seated capacity ranging from 36 to 40 passengers. Fare Structure A regular fare for local bus service is 90 cents per trip. Children, students, senior citizens, and persons with disabilities pay a reduced charge or no fare. Monthly passes are available for unlimited use on all MBTA local bus routes and select other routes (such as the Cross Town routes) for the monthly regular fare of $31. Fares for express bus routes serving the North Shore are higher than the local bus routes. Boston-bound express trips from Revere, Saugus and East Boston cost $2.20 per trip. Routes from Lynn are $3.10 per trip. Routes from Salem, Swampscott, Marblehead, Peabody, and Nahant cost $3.45 per trip. Page 2-27
29 Table 2-15 North Shore Bus Routes: Service Frequencies Rte Origin/Destination Service Frequency (Minutes) Peak Day Night Sat Sun 97 Malden Wellington Boston Regional Medical Center Wellington Malden Center Sullivan Malden Station Sullivan Malden Station Sullivan Lebanon St Malden / Wellington Linden Square Wellington Linden Square Sullivan Square Wonderland or Broadway Park/Wellington Woodlawn Haymarket Wellington Station / Wood Island Station Bellingham Sq. Maverick Station Wonderland Maverick Wonderland Maverick Northgate Beachmont Lebanon Street Malden Station Melrose Highlands Malden Station Redstone Shopping Center Malden Station Reading Depot Malden Station Reading Depot Malden Station Malden Station Revere Jack Satter House Eastern Ave. & Essex St.-Haymarket or Wonderland Lynn Saugus Wonderland Station L Lynn & East Saugus Haymarket Express Oaklandvale Haymarket Station L Central Square Lynn Linden Square Appleton Street, Saugus Malden Station Neptune Towers Central Square, Lynn Liberty Tree Mall Central Square, Lynn Centennial Park Central Square, Lynn Central Square, Lynn Nahant 30 L Marblehead Haymarket Marblehead Haymarket Marblehead Downtown Crossing Marblehead Downtown Crossing Salem Haymarket North Beverly Salem Salem Depot Haymarket Salem Deport Central Square, Lynn Salem Downtown Crossing Liberty Tree Mall Salem Depot Salem Depot Danvers Source: Massachusetts Bay Transportation Authority, L indicates Limited Service is provided on this route Page 2-28
30 Table 2-16 North Shore Bus Routes: Average Weekday Ridership Rte Origin/Destination Daily Ridership 9 97 Malden Wellington Boston Regional Medical Center Wellington 1, Malden Center Sullivan 4, Malden Station Sullivan 3, Malden Station Sullivan Lebanon St Malden / Wellington 2, Linden Square Wellington 2, Wonderland or Broadway Park/Wellington 2, Woodlawn Haymarket 8, Wellington Station / Wood Island Station 1, Bellingham Sq. Maverick Station 1, Wonderland Maverick 4, Wonderland Maverick 4, Northgate Beachmont 1, Lebanon Street Malden Station Melrose Highlands Malden Station Redstone Shopping Center Malden Station Reading Depot Malden Station Reading Depot Malden Station Malden Station Revere Jack Satter House Eastern Ave. & Essex St. Haymarket or Wonderland N/A Lynn Saugus Wonderland Station Lynn & East Saugus Haymarket Express 1, Oaklandvale Haymarket Station Central Square Lynn Linden Square Appleton Street, Saugus Malden Station Neptune Towers Central Square, Lynn N/A 435 Liberty Tree Mall Central Square, Lynn Centennial Park Central Square, Lynn Central Square, Lynn Nahant Marblehead Haymarket 1, Marblehead Haymarket 1, Marblehead Downtown Crossing Marblehead Downtown Crossing Salem Haymarket 1, North Beverly Salem Salem Depot Haymarket 1, Salem Deport Central Square, Lynn N/A 459 Salem Downtown Crossing 1, Liberty Tree Mall Salem Deport N/A 468 Salem Depot Danvers 39 Source: Central Transportation Planning Staff, Source: MBTA Comprehensive Ridecheck Program: Counts have not been conducted on the service routes initiated since Page 2-29
31 2.7.2 Non-MBTA North Shore Bus Service In addition to the bus routes paid for and operated by MBTA equipment, other public transportation providers operate some bus routes in the North Shore. Route 712 & 713 Paul Revere Transportation Company operates Bus Routes 712 and 713 (Point Shirley Orient Heights via Winthrop Highlands). The fare for this service is 75 cents. MBTA passes are not accepted on the routes. Cape Ann Transit Authority The Cape Ann Transit Authority (CATA) operates 10 bus routes six days per week in Gloucester and Rockport. Service frequencies vary from 30 minutes on the Gloucester Business Express route to over two hours on other routes. An additional route provides service on Saturdays between downtown Gloucester and two area shopping centers. On Sundays in the summer, a tourist-oriented trolley bus operates on a loop around Gloucester and Rockport. Fares for the system range from $1.00 to $1.25 for local routes. The mall route costs $3.00 one-way or $5.00 round-trip. Beverly Shoppers Shuttle Other local bus service is jointly subsidized by the MBTA and participating towns, the towns contract out for the service. In Beverly, a Shopper Shuttle operates Monday through Saturday as a loop route throughout Beverly. The service is provided by CATA using their vehicles, however the City of Beverly jointly subsidizes the service with the MBTA Lynn East/West Loop Routes In Lynn, Laidlaw Transportation operates a local circulator bus throughout the city. The route operates six days per week (Monday through Saturday) from 9:30 AM to 5:50 PM. Average ridership along the route is passengers per day. The fare is 25 cents. The route is subsidized by both the City of Lynn and the MBTA. Coach Company Express Bus Some express bus service is provided via inter-district subsidies to private transportation companies. The Coach Company operates eleven round trip express bus trips per day, providing service between six study area communities and five downtown Boston stops 11. Two round trips per day are operated on Coach Company s Haverhill service via Georgetown, Boxford, Topsfield, and Lynnfield. Eight morning inbound trips per day are provided on Coach Company s Hampton, NH service from Newburyport into Boston. Additionally, three morning inbound trips provide service from Peabody to Boston (one of these trips originates in Peabody). In the afternoon, six outbound trips provide service to Peabody, and nine outbound trips provide service to Newburyport. Four of the eleven morning inbound trips make stops at Boston s Logan Airport. Table 2-17 depicts the fares charged for Coach Company express bus routes. Table 2-18 depicts recent ridership figures for these routes. Table 2-19 depicts the town of origin of the passengers on these trips. 11 Haymarket Square, Government Center, Park Street, St. James Ave., Copley Square Page 2-30
Newburyport/Rockport Commuter Rail Line
 Newburyport/Rockport Commuter Rail Line Weekday Service Plan during the Beverly Drawbridge Reconstruction Project July 17 August 13 v.5.25.17 The Newburyport/Rockport Commuter Rail Line Construction Projects
The Latest on Joint Development Policy Guidance
 Panelists The Latest on Joint Development Policy Guidance Moderator: Jonathan Davis Deputy General Manager and Chief Financial Officer Massachusetts Bay Transportation Authority James Blakesley, Attorney-Advisor,
Regionwide Suburban Transit Opportunities Study Phase II
 Regionwide Suburban Transit Opportunities Study Phase II A report produced by the Central Transportation Planning Staff for the Boston Region Metropolitan Planning Organization Regionwide Suburban Transit
Appendix. Statistical Profile
 Appendix Statistical Profile MBTA Service and Infrastructure Profile March 2006 MBTA SERVICE DISTRICT ANNUAL RIDERSHIP (FY 2006) Cities and Towns 75 UNLINKED TRIPS BY MODE Size in Square Miles Population
5. OPPORTUNITIES AND NEXT STEPS
 5. OPPORTUNITIES AND NEXT STEPS When the METRO Green Line LRT begins operating in mid-2014, a strong emphasis will be placed on providing frequent connecting bus service with Green Line trains. Bus hours
9. Downtown Transit Plan
 CORRADINO 9. Downtown Transit Plan KAT Transit Development Plan As part of the planning process for the TDP, an examination of downtown transit operations was conducted. The Downtown Transit Plan 1 is
GO Transit s deliverable: the 2020 Service Plan
 GO Transit s deliverable: the 2020 Service Plan GO Transit s 2020 Service Plan describes GO s commitment to customers, existing and new, to provide a dramatically expanded interregional transit option
Roma McKenzie-Campbell Amtrak, Project Manager. Caroline Ducas VHB, Senior Transit Planner. Boston, Massachusetts
 DMU Implementation on Existing Commuter Rail Corridors: Opportunities, Challenges and Lessons Learned Roma McKenzie-Campbell Amtrak, Project Manager Caroline Ducas VHB, Senior Transit Planner Boston, Massachusetts
Appendix. Statistical Profile
 Appendix Statistical Profile MBTA Service and Infrastructure Profile August 200 MBTA SERVICE DISTRICT ANNUAL RIDERSHIP (FY 200) Cities and Towns 75 UNLINKED TRIPS BY MODE Size in Square Miles 3,2 Bus (includes
Madison BRT Transit Corridor Study Proposed BRT Operations Plans
 Madison BRT Transit Corridor Study Proposed BRT Operations Plans This paper presents a description of the proposed BRT operations plan for use in the Madison BRT Transit Corridor Study. The objective is
Chicago Milwaukee Intercity Passenger Rail Corridor
 Chicago Milwaukee Intercity Passenger Rail Corridor Past, Present, and Future Arun Rao, Passenger Rail Manager Wisconsin Department of Transportation Elliot Ramos, Passenger Rail Engineer Illinois Department
TRANSIT FEASIBILITY STUDY Town of Bradford West Gwillimbury
 TRANSIT FEASIBILITY STUDY Town of Bradford West Gwillimbury Open House Presentation January 19, 2012 Study Objectives Quantify the need for transit service in BWG Determine transit service priorities based
Vehicle Miles Traveled in Massachusetts: Who is driving and where are they going?
 Vehicle Miles Traveled in Massachusetts: Who is driving and where are they going? A presentation to the House Committee on Global Warming and Climate Change Representative Frank Smizik, Chair April 13,
PHILADELPHIA SUBURBAN RAIL SUMMARY (COMMUTER RAIL, REGIONAL RAIL)
") PHILADELPHIA SUBURBAN RAIL SUMMARY (COMMUTER RAIL, REGIONAL RAIL) October 2003 The Philadelphia commuter rail service area consists of 5.1 million people, spread over 1,800 square miles at an average population
PHILADELPHIA SUBURBAN RAIL SUMMARY (COMMUTER RAIL, REGIONAL RAIL) October 2003 The Philadelphia commuter rail service area consists of 5.1 million people, spread over 1,800 square miles at an average population
UTA Transportation Equity Study and Staff Analysis. Board Workshop January 6, 2018
 UTA Transportation Equity Study and Staff Analysis Board Workshop January 6, 2018 1 Executive Summary UTA ranks DART 6 th out of top 20 Transit Agencies in the country for ridership. UTA Study confirms
The Case for. Business. investment. in Public Transportation
 The Case for Business investment in Public Transportation Introduction Public transportation is an enterprise with expenditure of $55 billion in the United States. There has been a steady growth trend
2 EXISTING ROUTE STRUCTURE AND SERVICE LEVELS
 2 EXISTING ROUTE STRUCTURE AND SERVICE LEVELS In the Study Area, as in most of the Metro Transit network, there are two distinct route structures. The base service structure operates all day and the peak
Metropolitan Council Budget Overview SFY
 Metropolitan Council Budget Overview SFY 2016-2017 H T t ti C itt House Transportation Committee February 4, 2015 Transit connects us to the places that matter Transportation Needs Grow as the Region Grows
The Preferred Alternative: a Vision for Growth on the Northeast Corridor
 A Long-Term Vision is Needed The Preferred Alternative: a Vision for Growth on the Northeast Corridor The Federal Railroad Administration (FRA) has released the Tier 1 Final Environmental Impact Statement
Bi-County Transitway/ Bethesda Station Access Demand Analysis
 Bi-County Transitway/ Bethesda Station Access Demand Analysis Prepared for: Washington Metropolitan Area Transit Authority Office of Planning and Project Development May 2005 Prepared by: in conjunction
WAKE TRANSIT PLAN Summer 2018
 WAKE TRANSIT PLAN Summer 2018 Planning for growth WAKE COUNTY s population already exceeds ONE MILLION and grows by more than 60 people a day. That s 23,000 people a year or basically another Morrisville.
Attachment D Environmental Justice and Outreach
 Attachment D Environmental Justice and Outreach ATTACHMENT D Environmental Justice and Outreach Indicate whether the project will have disproportionately high and adverse impacts on minority or low income
Maryland Gets to Work
 I-695/Leeds Avenue Interchange Reconstruction Baltimore County Reconstruction of the I-695/Leeds Avenue interchange including replacing the I-695 Inner Loop bridges over Benson Avenue, Amtrak s Northeast
February 2012 Caltrain Annual Passenger Counts Key Findings
 February 2012 Caltrain Annual Passenger Counts Key Findings Key Findings February 2012 Caltrain Annual Passenger Counts The 2012 annual Caltrain passenger counts, which were conducted in February 2012,
CTfastrak Expansion. Stakeholder Meeting #4 Manchester Town Hall June 3, 2016
 CTfastrak Expansion Stakeholder Meeting #4 Manchester Town Hall June 3, 2016 Today s Agenda Phase I Update 2016 Service Plan Implementation Schedule & Cost Update Phase II Services Timeline Market Analysis
Status of Plans March Presented by CAPITOL REGION COUNCIL OF GOVERNMENTS
 Status of Plans March 2011 Presented by CAPITOL REGION COUNCIL OF GOVERNMENTS Transit project update Project rationale The system New Britain Hartford Busway New Haven/Hartford/ Springfield Passenger Rail
Proposed Program of Interrelated Projects
 DALLAS AREA RAPID TRANSIT Proposed Program of Interrelated Projects Federal Transit Administration Capital Investment Program Summer 204 INTRODUCTION The current federal transportation bill, Moving Ahead
Public Meeting. City of Chicago Department of Transportation & Department of Housing and Economic Development
 Public Meeting City of Chicago Department of Transportation & Department of Housing and Economic Development Funded by Regional Transportation Authority September 12, 2011 In partnership with Presentation
A Transit Plan for the Future. Draft Network Plan
 A Transit Plan for the Future Draft Network Plan Project Overview and Status Completed Market Analysis and Service Evaluation. Developed Plan Framework and Guiding Principles. Developed a draft Five Year
MBTA RAILROAD OPERATIONS Commuter Rail. MBTA/MassDOT
 MBTA RAILROAD OPERATIONS Commuter Rail New England Railroad Club November 1, 2018 Ryan D. Coholan Chief Railroad Officer MBTA/MassDOT 1 Topics for Discussion State of the System Existing Conditions Ridership
March Government Center Station
 March 2014 Government Center Station Green Reconstruction Line / Blue Project Line Option for Green Construction Line / Blue Staging Line February 12, 2010 Project Purpose Accessibility Last Key Station
ROCHESTER, MINNESOTA
 ROCHESTER, MINNESOTA Rochester Public Works TRANSIT AND PARKING DIVISION Transit and Parking Manager Tony Knauer tknauer@rochestermn.gov SERVICE ATTITUDE CONSISTENCY - TEAMWORK ROCHESTER TRANSIT & PARKING
Regional Transportation Commission, Washoe County Lee Gibson, Executive Director Roger Hanson, Senior Planner
 Regional Transportation Commission, Washoe County Lee Gibson, Executive Director Roger Hanson, Senior Planner Presentation Outline Transit System Facts Economic Challenges in the Truckee Meadows RTC Transit
PUBLIC TRANSPORTATION
 PUBLIC TRANSPORTATION PROJECT TITLE U-MED DISTRICT MULTI-MODAL IMPROVEMENTS- PHASE II Transit Vehicles and Upgrades MUNICIPALITY OF ANCHORAGE Capital Improvement Program PROJECT LIST BY DEPARTMENT Public
October 22, Dear Focus40 Project Team:
 October 22, 2018 Dear Focus40 Project Team: On behalf of our over 130,000 members and supporters across the Commonwealth, the Sierra Club Massachusetts Chapter provides these comments on the Focus40 Plan
The $600 Million Rebirth of San Diego Trolley
 The $600 Million Rebirth of San Diego Trolley E. Wayne Terry Chief Operating Officer MTS Rail APTA Rail Conference - 2010 1919 San Diego and Arizona Eastern Railroad The Bones of the Original South and
Executive Summary October 2013
 Executive Summary October 2013 Table of Contents Introduction... 1 Rider Transit and Regional Connectivity... 1 Plan Overview... 2 Network Overview... 2 Outreach... 3 Rider Performance... 4 Findings...
RIDERSHIP TRENDS. March 2017
 RIDERSHIP TRENDS March 2017 Prepared by the Division of Strategic Capital Planning May 2017 Table of Contents Executive Summary...1 Ridership...3 Estimated Passenger Trips by Line...3 Estimated Passenger
4 COSTS AND OPERATIONS
 4 COSTS AND OPERATIONS 4.1 INTRODUCTION This chapter summarizes the estimated capital and operations and maintenance (O&M) costs for the Modal and High-Speed Train (HST) Alternatives evaluated in this
TRAVEL DEMAND FORECASTS
 Jiangxi Ji an Sustainable Urban Transport Project (RRP PRC 45022) TRAVEL DEMAND FORECASTS A. Introduction 1. The purpose of the travel demand forecasts is to assess the impact of the project components
The Boston South Station HSIPR Expansion Project Cost-Benefit Analysis. High Speed Intercity Passenger Rail Technical Appendix
 The Boston South Station HSIPR Expansion Project Cost-Benefit Analysis High Speed Intercity Passenger Rail Technical Appendix Prepared by HDR August 5, 2010 The Boston South Station HSIPR Expansion Project
Green Line Long-Term Investments
 Enhancements Short-term improvements to keep Austin moving. Investments Long-term projects to support our future. Mobility Hubs MetroRapid MetroRail MetroExpress Connectors Circulators Project Connect
Troost Corridor Transit Study
 Troost Corridor Transit Study May 23, 2007 Kansas City Area Transportation Authority Agenda Welcome Troost Corridor Planning Study Public participation What is MAX? Survey of Troost Riders Proposed Transit
Energy Technical Memorandum
 Southeast Extension Project Lincoln Station to RidgeGate Parkway Prepared for: Federal Transit Administration Prepared by: Denver Regional Transportation District May 2014 Table of Contents Page No. Chapter
April 2010 April 2010 Presented by Alan Eirls
 April 2010 April 2010 Presented by Alan Eirls A Partnership Between the Coeur d Alene Tribe, the State of Idaho, the KMPO, and Kootenai County. Current System The Citylink system began on the Coeur d Alene
UCLA Lake Arrowhead Conference. October 18, 2010
 BART Click to Capacity edit Master Overview title style for UCLA Lake Arrowhead Conference October 18, 2010 0 BART Basics 360,000 daily riders 104 miles 43 stations 1.3 billion annual passenger miles 1
MTA New York City Transit Service Guidelines Manual
 MTA New York City Transit Service Guidelines Manual Thomas F. Prendergast, President Robert Bergen, Executive Vice President Division of Operations Planning Peter G. Cafiero, Chief August 2010 Table of
Economy. 38% of GDP in 1970; 33% of GDP in 1998 Most significant decline in Manufacturing 47% to 29%
 Economy MCMA as important, but declining, force in national economy 38% of GDP in 1970; 33% of GDP in 1998 Most significant decline in Manufacturing 47% to 29% Relatively constant contribution of Financial
COMMUNITY REPORT FISCAL YEAR We are making progress, are you on board? GOLD COAST TRANSIT DISTRICT
 FISCAL YEAR 178 GOLD COAST TRANSIT DISTRICT COMMUNITY REPORT We are making progress, are you on board? OJAI OXNARD PORT HUENEME VENTURA COUNTY OF VENTURA GENERAL MANAGER S MESSAGE STEVEN P. BROWN DEAR
Valley Metro Overview. ITE/IMSA Spring Conference March 6, 2014
 Valley Metro Overview ITE/IMSA Spring Conference March 6, 2014 Valley Metro Who Are We? Operate Regional Transit Services Valley Metro and Phoenix are region s primary service providers Light Rail and
Motorcoach Census. A Study of the Size and Activity of the Motorcoach Industry in the United States and Canada in 2015
 Motorcoach Census A Study of the Size and Activity of the Motorcoach Industry in the United States and Canada in 2015 Prepared for the American Bus Association Foundation by John Dunham & Associates October
QUALITY OF LIFE EXECUTIVE SUMMARY REPORT I O N S TAT I O N
 QUALITY OF LIFE EXECUTIVE SUMMARY REPORT UN I O N S TAT I O N T R AV E L by TR A I N Published September 2017 2015 PROGRESS MAP This document reports FasTracks progress through 2015 BACKGROUND RTD The
Whither the Dashing Commuter?
 Whither the Dashing Commuter? The MTA in a Changing Region William Wheeler Director of Special Project Development and Planning Travel in the New York Region has changed from the days of the 9 to 5 commute
PEACHTREE CORRIDOR PARTNERSHIP. Current Status & Next Steps
 PEACHTREE CORRIDOR PARTNERSHIP Current Status & Next Steps PEACHTREE CORRIDOR PARTNERSHIP Why Peachtree? Why Now? I. THE CONTEXT High Level View of Phasing Discussion Potential Ridership Segment 3 Ease
TORONTO TRANSIT COMMISSION REPORT NO.
 Form Revised: February 2005 TORONTO TRANSIT COMMISSION REPORT NO. MEETING DATE: October 24, 2012 SUBJECT: DOWNTOWN RAPID TRANSIT EXPANSION STUDY (DRTES) PHASE 1 STRATEGIC PLAN ACTION ITEM RECOMMENDATIONS
BOSTON REGION METROPOLITAN PLANNING ORGANIZATION
 PLANNING ORGANIZATIO BOSTON REGION MPO NMETROPOLITAN BOSTON REGION METROPOLITAN PLANNING ORGANIZATION Richard A. Davey, MassDOT Secretary and CEO and MPO Chairman Karl H. Quackenbush, Executive Director,
The City of Toronto s Transportation Strategy July 2007
 The City of Toronto s Transportation Strategy July 2007 Presentation Outline Transportation Statistics Transportation Building Blocks Toronto s Official Plan Transportation and City Building Vision Projects
Needs and Community Characteristics
 Needs and Community Characteristics Anticipate Population and Job Growth in the City Strongest density of population and jobs in Ann Arbor are within the Study Area Population expected to grow 8.4% by
Executive Summary. Treasure Valley High Capacity Transit Study Priority Corridor Phase 1 Alternatives Analysis October 13, 2009.
 Treasure Valley High Capacity Transit Study Priority Corridor Phase 1 Alternatives Analysis October 13, 2009 Background As the Treasure Valley continues to grow, high-quality transportation connections
Proposal for September 2006 Start of Commuter Rail from Lovejoy on the Macon Line to Atlanta
 Proposal for September 2006 Start of Commuter Rail from Lovejoy on the Macon Line to Atlanta Overview Commuter rail service between Lovejoy and Atlanta is ready for implementation: $87.08 Million is in
February 2011 Caltrain Annual Passenger Counts Key Findings
 February 2011 Caltrain Annual Passenger Counts Key Findings Key Findings February 2011 Caltrain Annual Passenger Counts The 2011 annual Caltrain passenger counts, which were conducted in February 2011,
The Smart Growth Countywide Transit Master Plan
 Choose the Future The Smart Growth Transit Master Plan What is the Transit Master Plan? A robust and integrated plan to establish countywide public transportation priorities over the next thirty years
TRAFFIC IMPACT STUDY. USD #497 Warehouse and Bus Site
 TRAFFIC IMPACT STUDY for USD #497 Warehouse and Bus Site Prepared by: Jason Hoskinson, PE, PTOE BG Project No. 16-12L July 8, 216 145 Wakarusa Drive Lawrence, Kansas 6649 T: 785.749.4474 F: 785.749.734
RIDERSHIP TRENDS. July 2018
 RIDERSHIP TRENDS July Prepared by the Division of Strategic Capital Planning September Table of Contents Executive Summary...1 Ridership...3 Estimated Passenger Trips by Line...3 Estimated Passenger Trips
Central Maryland Transit Development Plan
 Central Maryland Transit Development Plan Planning the Future of Transit in Our Region Anne Arundel County Transportation Commission December 13, 2017 Anne Arundel County Howard County Prince George s
Rail~Volution 2005 Hal Ryan Johnson, AICP, Bus Rapid Transit Project Manager Utah Transit Authority September 7, 2005
 Rail~Volution 2005 Hal Ryan Johnson, AICP, Bus Rapid Transit Project Manager Utah Transit Authority September 7, 2005 Public Transit District Utah Transit Authority Linear Geographic Area - 130 miles by
FFYs Transportation Improvement Program
 For Public Review Table 2: Draft Amendment One Summary: Five-Year MBTA Programming Overall Changes in Funding in TIP Project Proposed Change Explanation Section/Funding Source From To Difference Five Year
The Jack A. Markell Trail Delaware s Bicycle Highway New England Bike- Walk Summit
 The Jack A. Markell Trail Delaware s Bicycle Highway 2018 New England Bike- Walk Summit The Jack A. Markell Trail Sometimes a very difficult project, including significant investment and perseverance,
Background Information about the Metrobus 29 Lines Study
 Background Information about the Metrobus 29 Lines Study Questions Overview of Existing Service Q. Why is the study being conducted? A. The 29 Lines provide an important connection between Annandale and
Tarrant County Projected Population Growth
 Based on the information provided in the preceding chapters, it is apparent that there are a number of issues that must be addressed as The T works to develop an excellent transit system for Fort Worth
West Broadway Transit Study. Community Advisory Committee September 17, 2015
 West Broadway Transit Study Community Advisory Committee September 17, 2015 Introductions Community Engagement Summer Outreach Fall Outreach Technical Analysis Process Update Alternatives Review Economic
CITY OF LONDON STRATEGIC MULTI-YEAR BUDGET ADDITIONAL INVESTMENTS BUSINESS CASE # 6
 2016 2019 CITY OF LONDON STRATEGIC MULTI-YEAR BUDGET ADDITIONAL INVESTMENTS BUSINESS CASE # 6 STRATEGIC AREA OF FOCUS: SUB-PRIORITY: STRATEGY: INITIATIVE: INITIATIVE LEAD(S): BUILDING A SUSTAINABLE CITY
EUGENE-SPRINGFIELD, OREGON EAST WEST PILOT BRT LANE TRANSIT DISTRICT
 EUGENE-SPRINGFIELD, OREGON EAST WEST PILOT BRT LANE TRANSIT DISTRICT (BRIEF) Table of Contents EUGENE-SPRINGFIELD, OREGON (USA)... 1 COUNTY CONTEXT AND SYSTEM DESCRIPTION... 1 SYSTEM OVERVIEW... 1 PLANNING
METRO TRANSIT a n n ua l re p o r t. madison, wisconsin // mymetrobus.com
 METRO TRANSIT 2016 a n n ua l re p o r t madison, wisconsin // mymetrobus.com metro transit In 2016, Metro Transit took steps to address capacity issues both on and off the road. Off the road, Metro began
Expansion Projects Description
 Expansion Projects Description The Turnpike expansion program was authorized by the Florida Legislature in 1990 to meet the State s backlog of needed highway facilities. The Legislature set environmental
Contents. Executive Summary...1 Introduction...2 Operating Plan...4 System Connectivity...5
 Contents Executive Summary...1 Introduction...2 Operating Plan...4 System Connectivity...5 Project Benefits...6 Economic Growth...7 Infrastructure Improvements...9 Quality of Life... 11 Next Steps... 12
CHAPTER 5 CAPITAL ASSETS
 CHAPTER 5 CAPITAL ASSETS This chapter describes the capital assets of GCTD, including revenue and nonrevenue vehicles, operations facilities, passenger facilities and other assets. VEHICLE REVENUE FLEET
New Haven Hartford Springfield Rail
 New Haven Hartford Springfield Rail Opportunities for Economic Growth NHHS Rail Conference, October 25, 2011 NHHSrail.com Tom Maziarz, CT DOT, Bureau of Policy & Planning Thomas.Maziarz@ct.gov New Haven
FINAL. Sound Transit Long-Range Plan Update. Issue Paper S.1: Tacoma Link Integration with Central Link. Prepared for: Sound Transit
 Sound Transit Long-Range Plan Update Issue Paper S.1: Tacoma Link Integration with Central Link Prepared for: Sound Transit Prepared by: Quade & Douglas, Inc. FINAL March 2005 Foreword This issue paper
Commuter Rail Update. October 25, 2018
 Commuter Rail Update October 25, 2018 2 page page 3 State of Commuter Rail Network, July 2014 The 2014 Commuter Rail network had multiple issues and a history of neglect & under-investment FIRST UP? UPGRADES
Dr. K. Gunasekaran Associate Professor Division of Transportation Engineering Anna University Chennai
 Dr. K. Gunasekaran Associate Professor Division of Transportation Engineering Anna University Chennai INTRODUCTION Bus Transport is the most preferred Public Transport System in many Indian cities Recent
HOUSING VOUCHERS FUNDED IN MASSACHUSETTS UNDER PENDING PROPOSALS
 820 First Street NE, Suite 510 Washington, DC 20002 Tel: 202-408-1080 Fax: 202-408-1056 center@cbpp.org www.cbpp.org November 1, HOUSING VOUCHERS FUNDED IN MASSACHUSETTS UNDER PENDING PROPOSALS For 2007,
CEDAR AVENUE TRANSITWAY Implementation Plan Update
 CEDAR AVENUE TRANSITWAY Implementation Plan Update EECUTIVE SUMMARY DECEMBER 2015 Executive Summary In 2013, the Twin Cities metropolitan area s first bus rapid transit (BRT) line, the METRO Red Line,
UCLA Lake Arrowhead Conference. October 18, 2010
 BART Click to Capacity edit Master Overview title style for UCLA Lake Arrowhead Conference October 18, 2010 0 BART Basics 360,000 daily riders 104 miles 43 stations 1.3 billion annual passenger miles 1
UCLA Lake Arrowhead Conference. October 18, 2010
 BART Click to Capacity edit Master Overview title style for UCLA Lake Arrowhead Conference October 18, 2010 0 BART Basics 360,000 daily riders 104 miles 43 stations 1.3 billion annual passenger miles 1
Regional Integration of Public Transit - From the Perspective of a Transit Company. April 2019 Thomas Werner MVG Munich
 Regional Integration of Public Transit - From the Perspective of a Transit Company April 2019 Thomas Werner MVG Munich Facts about Munich Capital of the State of Bavaria Population: City ca. 1.5 million
is being pushed by the locomotive, which reduces the number of seats in that car.
 Commuter rail is passenger rail service that is designed to transport large volumes of passengers over long distances in a fast and comfortable manner. The primary market for commuter rail service is usually
FOR IMMEDIATE RELEASE January 17, CONTACT: Mayor s Press Office
 FOR IMMEDIATE RELEASE January 17, 2012 CONTACT: Mayor s Press Office 312.744.3334 press@cityofchicago.org MAYOR EMANUEL OPENS NEWLY-RENOVATED GRAND AVENUE RED LINE STATION Announces New Green Line Station
APPENDIX I: [FIXED-GUIDEWAY TRANSIT FEASIBILITY]
![APPENDIX I: [FIXED-GUIDEWAY TRANSIT FEASIBILITY]](/thumbs/83/87090921.jpg "APPENDIX I: [FIXED-GUIDEWAY TRANSIT FEASIBILITY]") APPENDIX I: [FIXED-GUIDEWAY TRANSIT FEASIBILITY] Jackson/Teton Integrated Transportation Plan 2015 Appendix I. Fixed-Guideway Transit Feasibility Jackson/Teton County Integrated Transportation Plan v2
APPENDIX I: [FIXED-GUIDEWAY TRANSIT FEASIBILITY] Jackson/Teton Integrated Transportation Plan 2015 Appendix I. Fixed-Guideway Transit Feasibility Jackson/Teton County Integrated Transportation Plan v2
Charlotte-Mecklenburg Region Rapid Transit and Land-Use Integration
 Charlotte-Mecklenburg Region Rapid Transit and Land-Use Integration Legislative Committee on Urban Growth and Infrastructure Carolyn Flowers CEO Charlotte Area Transit System March 23, 2010 Charlotte Region
Kenosha-Racine-Milwaukee (KRM)
") Kenosha-Racine-Milwaukee (KRM) Commuter Rail #147925 November 6, 2009 1 Guidance of KRM Commuter Rail Studies Intergovernmental Partnership Technical Steering Committee Temporary and Limited Authority
Kenosha-Racine-Milwaukee (KRM) Commuter Rail #147925 November 6, 2009 1 Guidance of KRM Commuter Rail Studies Intergovernmental Partnership Technical Steering Committee Temporary and Limited Authority
Bedford/Franklin Regional Rail Initiative (BFRRI) Rationale for a Bedford Amtrak Station June 30, 2015
 Rationale for a Bedford Amtrak Station June 30, 2015") Bedford/Franklin Regional Rail Initiative (BFRRI) Rationale for a Bedford Amtrak Station June 30, 2015 SUBJECT: Bedford Amtrak Station Why an Amtrak station in Bedford makes sense. I. BACKGROUND: In January
Bedford/Franklin Regional Rail Initiative (BFRRI) Rationale for a Bedford Amtrak Station June 30, 2015 SUBJECT: Bedford Amtrak Station Why an Amtrak station in Bedford makes sense. I. BACKGROUND: In January
SOCIO-ECONOMIC and LAND USE DATA
 SOCIO-ECONOMIC and LAND USE DATA FUTURE CONDITIONS January CHATHAM URBAN TRANSPORTATION STUDY - 1 - Table of Contents Introduction 3 TAZ - Municipality - Map Index...8 2005 Socio-economic and Land Use
Indicators. New England Economic. February Federal Reserve Bank of Boston
 Indicators Economic February 2006 Federal Reserve Bank of Boston Labor Market Conditions Income Consumer Prices Consumer Confidence Real Estate Merchandise Exports Electricity Sales State Revenues Economic
Chapter 4 : THEME 2. Transportation
 Chapter 4 : THEME 2 Strengthen connections to keep the Central Area easy to reach and get around 55 Figure 4.2.1 Promote region-wide transit investments. Metra commuter rail provides service to the east,
Vacaville Transit Service Evaluation Study Working Paper Two Route and Network Evaluation
 Vacaville Transit Service Evaluation Study Working Paper Two Route and Network Evaluation Prepared for the City of Vacaville Administrative Services Department Prepared by This page left intentionally
STRATEGIC PRIORITIES AND POLICY COMMITTEE MAY 5, 2016
 STRATEGIC PRIORITIES AND POLICY COMMITTEE MAY 5, 2016 Shift Rapid Transit Initiative Largest infrastructure project in the city s history. Rapid Transit initiative will transform London s public transit
NEW YORK SUBURBAN RAIL SUMMARY (COMMUTER RAIL, REGIONAL RAIL)
") NEW YORK SUBURBAN RAIL SUMMARY (COMMUTER RAIL, REGIONAL RAIL) October 2003 New York: The New York commuter rail service area consists of 20.3 million people, spread over 4,700 square miles at an average
NEW YORK SUBURBAN RAIL SUMMARY (COMMUTER RAIL, REGIONAL RAIL) October 2003 New York: The New York commuter rail service area consists of 20.3 million people, spread over 4,700 square miles at an average
Appendix C: GAPS ANALYSIS
 Appendix C: GAPS ANALYSIS Appendix C Gaps Analysis While portions of Salt Lake City are well served by transit, some portions of the city experience a mismatch in the existing transit supply and current
Operating & Maintenance Cost Results Report
 Operating & Maintenance Cost Results Report Prepared for: Hennepin County Regional Railroad Authority Prepared by: Connetics Transportation Group Under Contract To: Kimley-Horn and Associates FINAL June