H H I at a Glance. Business Performance. Financial Performance
|
|
|
- Madeleine Porter
- 5 years ago
- Views:
Transcription
1 (2015.1) 1
2 Important Notice This presentation of Hyundai Heavy Industries (HHI) contains forward-looking statements relating to HHI s operations that are based on management s current expectations, estimates and projections. Words such as anticipates, expects, intends, plans, projects, schedules, estimates and similar expressions are intended to identify such forward-looking statements. These statements are not guarantees of future performance and are subject to certain risks, uncertainties, and other factors including new order flows, FX rates, steel plate prices and so on, some of which are beyond company s control and are difficult to predict. Therefore, actual outcomes and actual results may differ materially from what is expressed or forecasted in such forward-looking statements. The reader should not place undue reliance on these forward-looking statements. HHI undertakes no obligation to update any forward-looking statements to reflect subsequent events. 2
3 Contents H H I at a Glance Business Performance Financial Performance 3
4 HHI at a Glance 4
5 Summary Date of Establishment : Date of Listing : No. of issued stocks: 76,000,000 stocks Paid-in Capital : KRW 380 bil. Market Value : KRW 8,740 bil. (As of December 31, 2014) Credit Rating : A1 (Commercial Paper), AA (Corporate Bond) Korea s large conglomerate ranking : 7th (Excluding public companies, based on total assets, As of December 31, 2013) No. of employees : 25,663 (Average 18.5 years of continuous service) No. of dry docks : 10 (Shipbuilding), 1 (Offshore & Engineering) Business Division : Shipbuilding, Offshore & Engineering, Industrial Plant & Engineering, Engine & Machinery, Electro Electric Systems, Construction Equipment, Green Energy, Refinery, Financial Services 5
6 History ~ Establishment of Hyundai Shipbuilding & Heavy Industry Co., Ltd. Inauguration of the Shipyard and Simultaneous Naming of First Two Supertankers Change of Company Name to Hyundai Heavy Industries Co., Ltd. Established Special Vessels, Offshore & Engineering, Industrial Plant & Engineering, Engine & Machinery, Electro Electric Systems, Construction Equipment Divisions Listed on the Korean Securities Dealers Automated Quotations, Delivery of Korea s First LNG Carrier Listed on the Korean Stock Exchange Disaffiliated from Hyundai Group and creation of Hyundai Heavy Industries group (Hyundai Heavy Industries Co., Ltd., Asan Foundation and six other companies) Acquired Samho Heavy Industries Co., Ltd. Acquired HI Investment and Securities Co., Ltd. and HI Asset Management Co., Ltd. (Underwriting company : Hyundai Mipo Dockyard Co., Ltd. ) Acquired Hyundai Corporation Acquired Hyundai Oilbank Co., Ltd. (70% of Ownership and management) Became the world s first shipbuilder to deliver 1,700 th ship 6
 Recognized for building the World Best Ship for the 29 th consecutive year (Since 1983) Total 47")
 125,000 m 3 Completion of World s Largest Elf Girassol FPSO (Feb.")
 100 million bhp Delivery of the World s Biggest Jacket (May, 1989) Exxon (U.S.")
7 Business Highlights No.1 in Global shipbuilding Market (Since 1983) HHI, HSHI, HMD : 12.16% (2011 delivery basis) Recognized for building the World Best Ship for the 29 th consecutive year (Since 1983) Total 47 ships, World shipbuilding publications (Maritime Report and Marine Log) First to build LNG Carrier in Korea (Jun. 1994) 125,000 m 3 Completion of World s Largest Elf Girassol FPSO (Feb. 2001) 343,000 Ton Achieved world record production in 2-stroke Markne engines (Sep. 2010) 100 million bhp Delivery of the World s Biggest Jacket (May, 1989) Exxon (U.S.A) 40,000 ton Completed World s largest Saudi Marafiq power plant (Apr. 2011) power generation 2,750 MW + desalination 176 MIGD Achieved domestic record production in Transformers (Feb. 2010) 600,000 MVA 7

 Hyundai Motors 2.88% Asan Foundation 2.53% Treasury Shares 19.")
8 Ownership Structure (As of December 31, 2013) Chung Mong-joon 10.15% Hyundai Mipo Dockyard Co., Ltd. 7.98% Others 45.08% National Pension Service 6.31% KCC 3.12% (Foreign Ownership : 18.23% ) Hyundai Motors 2.88% Asan Foundation 2.53% Treasury Shares 19.36% POSCO 1.94% Asan Nanum Foundation 0.65% 8
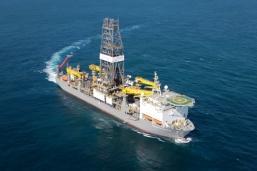
9 Business Structure Division Main Products Major Clients Competitors Capacity Shipbuilding Offshore & Engineering VLCCs, Tankers, Product Carriers, Chemical Tankers Containerships, Bulk Carriers, OBO Carriers Ro-Pax Ships, Ro-Ro Ships, Pure Car Carriers, Tankers/VLCCs LNG Carriers, LPG Carriers Drillships Submarines, Destroyers, Frigates Floating Units: FPSOs, FLNGs, FPUs, TLPs, Semi-Submersible Units Fixed Platforms: Topsides, Jackets & Piles, Jack-ups, Modules & Quarters Pipelines & Subsea Facilities: Subsea Pipelines Offshore Installations: Platforms, Pipelines Land-Based Modules HAPAG-LLOYD (GER) C.P. OFFEN (GER) AP MOLLER (Denmaark) Seaspan (Canada) Diamond Offshore (USA) BP(UK) ExxonMobile(USA) SHELL(USA) TOTAL (FR) CHEVRON (USA) ENI NORGE (NOR) DSME (KOR) SHI (KOR) DSME, SHI (KOR) Technip (FR) Saipem (Italy) McDermott (USA) 8.00 mil. GT Floaters : 1~2 units Fixed Platform : 3~4 units Pipeline laying : 30km Industrial Plant & Engineering Engine & Machinery Power Plants: Combined-Cycle, Cogeneration, Thermal Power Plants Process Plants: Oil and Gas, Refinery, Tank Farm, GTL, and LNG Facilities Plant Equipments: Industrial Boiler, HRSG, CFBF Boiler, Regenerator & Reactor Two-Stroke Diesel Engines, Four-Stroke(HiMSEN)Engines Propellers and Crankshafts Steam Turbines and Turbochargers Diesel and Gas Power Plant Engines Industrial and Marine Pumps, Industrial Robots, Side Thrusters Presses, Conveyor Systems, and Steel Strip Process Lines SHELL (US) MEW (KUWAIT) SEC (SAUDI) HMD(KOR) Shanghai (CHINA) DSME, SHI (KOR) Siemens (GER) Hyundai E&C (KOR) Doosan Heavy (KOR) Samsung C&T Corporation(KOR) Doosan, STX (KOR) Mitsui (JPN) Hudong, Dalian(China) Power plant : 1,000MW (4~5 projects) Large Engines (500 units) :18 mil bhp Medium (1800 Units) : 5 mil bhp Electro Electric Systems Transformers, Gas Insulated Switchgear, Switchgear Low- and Medium-Voltage Circuit Breakers Rotating Machinery Power Electronics and Control Systems State-Owned Power company Utility, IPP company ABB (Sweden) Siemens (GER) Hyosung (KOR) Transformer (620 units) 120,000 MVA Construction Equipment Excavators Wheel Loaders Forklifts Skid Loaders Komatsu (JPN) Caterpillar (USA) Terex (USA) Doosan Infracore (KOR) 29,000 units (Excavators 16,000 units) Green Energy Refinery Financial Services Solar/Wind Power Systems Petroleum: LPG, Gasoline, Kerosene, Jet Fuel Petrochemicals: Propylene, Alkylate, BTX, Naphtha Securities Brokerage Asset Management Futures Corporate Finance Leasing Wagner&Co Solartechnik(GER) MHH Solartechnik (GER) Sun Energy Europe (GER) Albatech (Italy) Suntech, Yingli (CHN) Vestas (DEN), GE (USA) SK Innovation (KOR) GS-Caltex (KOR) S-Oil (KOR) Solar Cell/module : 510 MW Wind Turbine : 600 MW 390,000 B/D 9
 Refinery Shipbuilding (KRW 22,220.8 bil.) (KRW 17,018.3 bil.")
 Construction Equipment Industrial Plant & Engineering (KRW 3,289.6 bil.")
10 Sales Breakdown Financial Services (KRW bil.) Others (KRW bil.) Refinery Shipbuilding (KRW 22,220.8 bil.) (KRW 17,018.3 bil.) Green Energy Offshore & Engineering (KRW bil.) (KRW 4,756.0 bil.) Construction Equipment Industrial Plant & Engineering (KRW 3,289.6 bil.) Electro Electric Systems (KRW 2,761.3 bil.) Engine & Machinery (KRW 1,722.2 bil.) (KRW 1,223,8 bil.) (2013 Consolidated basis) 10

11 Affiliates 27 affiliated companies in Hyundai Heavy Industries Group (HHI included, overseas corporations excluded) Changjuk Wind Power : As of Jan , the date of addition as an affiliate Hyundai Energy & Resources : As of May , the date of addition as an affiliate New Korea Country Club & Hyundai Oil Terminal Co., Ltd.: As of March , the date of addition as an affiliate 11
12 Global Network Established 21 Overseas offices and 26 Incorporated firms, a total of 47 global network. 21 overseas offices - Europe : 7, America : 3, Asia : 4, Middle East / Africa : 7 26 Incorporated firms - Production/sales : 14, Sales : 2, Construction : 3, R&D : 2, Management : 3, Agriculture: 2 London Belgium France Spain Europe Nigeria Oslo Rotterdam Bulgaria Germany Hungary Athens Riyadh Al Khobar (office, incorporated) Moscow Istanbul Kuwait Dubai Jebel Ali Abu Dhabi Tai an Mumbai India Khorol Agro, Mikhailovka Agro, Hyundai Electrosystems Chanzhou Beijing Shandong Yantai Weihai Yangzhong Singapore [HHI] Region Overseas Incorporated office firm Total Europe America Asia Middle East / Africa Total Vladivostok Tokyo Osaka HHI China Investment Co., Ltd. Hyudai Heavy Industries Shanghai R&D Co., Ltd. Hyundai Financial Leasing Co., Ltd. Alabama Houston Hyundai Ideal Electric Co. New Jersey Atlanta (office, incorporated) Production / Sales(14) Sales (2) Construction(3) R&D(2) Management(3) Agriculture(2) Offices (21) Luanda Middle East / Africa Asia America Brazil 12
13 Business Performance 13
14 New Orders Trend (Mil. USD) 35,000 30,000 25,000 20,000 15,000 10,000 5, ,400 5,777 9,817 3,025 16,107 13,405 7,835 4,917 18,706 7,236 11,470 4,357 2,968 8,488 8,272 6,792 27,473 25,020 25,324 13,838 9,290 15,730 13,635 10,735 10,291 2,043 2, ,209 14,419 19, % YoY 29,565 27,363 20,415 17,851 13,424 13,147 10,905 9,512 9,150 6,143 4,061 `01 `02 `03 `04 `05 `06 `07 `08 `09 `10 `11 `12 `13 `14 (Target) Shipbuilding Non-Shipbuilding 14
15 Monthly New Orders in 2013 (Non-Consolidated) Achieving 92.2% of annual target, a 39.8% increase YoY on the back of positive order flow of commercial vessels and offshore production facilities - Shipbuilding : 27 Containerships, 19 LPGs, 11 Bulk Carriers, 11 Tankers, 9 LNGs, 5 Special Vessels, 1 Offshore Construction Vessel, 1 Accommodation Vessel, 1 Semi Submersible Rig - Offshore : 1 FPSO (Rosebank, Chevron), 1 TLP & 1 FPU (Moho Nord, Total), 1 Spar Topside (Aasta Hansteen, Statoil) - Industrial Plant : Shuqaiq Oil fired Conventional Power Plant, Saudi Arabia, Az-Zour North Combined-cycle power plant, Kuwait - Engine & Machinery : Four-stroke marine engine orders increased YoY due to demand increase for special vessels such as drillship in Electro Electric Systems : Orders declined YoY as a result of profit-focused order taking - Construction Equipment : Demand declined YoY esp. in the Middle East, America, Russia, South East Asia - Green Energy : The ongoing oversupply problem and slowing demand continued to unfold Monthly New Orders in 2013 (unit : mil. of USD) Division Full year Target Jan. Feb. Mar. Apr. May Jun. Jul. Aug. Sep. Oct. Nov. Dec. Full year Achievement (%) Shipbuilding 6,143 7, ,049 1, , , Offshore 2,072 6,000 1, ,064 1, , Industrial Plant 4,077 6, , , Engine & Machinery 1,858 3, , Electro Electric 2,318 3, , Construction Equipment 2,773 3, , Green Energy Total 19,567 29,676 2, ,521 3,598 2,553 1,560 1,443 4,756 1,027 1,745 2,151 1,604 27,


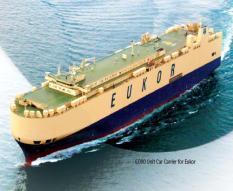
16 Shipbuilding Drillship VLCC Containerships Bulk Carrier LNG LPG Car Carriers Naval Ships Special Vessels 16
17 Market Shipbuilding (Unit: Mil. GT) Global Demand since 2007 Others LPG Carrier LNG Carrier Containers Tankers Bulkers +139% (Unit: Mil. GT) `07 `08 `09 `10 `11 `12 `13 YoY `14.10 Total % 62.5 Bulkers % 28.6 Tankers % 12.3 Containers % 9.0 LNG % 4.0 LPG % '07 '08 '09 '10 '11 '12 '13 * Source : Clarkson others % 5.5 * Others : offshore, cruise vessels, ro-ro ferries, MPP, Reefers, PCC Newbuilding Price Trend since 2007 Capesize K DWT (Left, Mil. USD) VLCC K DWT (Left, Mil. USD) Containership 8,500-9,100 TEU (Left, Mil. USD) LPG Carrier 82,000m³ (Left, Mil. USD) LNG Carrier 160,000m³ (Right, Mil. USD) '07 '08 '09 '10 '11 '12 '13 * Source : Clarkson * Index : 1988=100 (Unit: Mil. USD) `07 `08 `09 `10 `11 `12 `13 YoY `14.10 Price Index % Capesize Bulk(180K) % 54.5 VLCC(320K) % 98.0 Container(8,800teu) % 88.5 LPG(82,000m³) % 79.0 LNG(160,000m³) %

 10,905 9,487 9,766 10,159 9,512 7,849 6,143 4,061 VLCCs, Tankers, Product Carriers, Chemical Tankers Containerships, Bulk Carriers, OBO Carriers Ro-Pax Ships, Ro-Ro Ships, Pure Car")

18 Overview Shipbuilding Sales Contribution(2013) Sales Breakdown by Product (2013) Shipbuilding 42.0% Tanker 4% PCTC 3% Special 7% Semi-sub Rig Bulk 1% 2% P/C 1% Others 1% LPG 7% LNG 21% Containership 23% * Non-Consolidated basis 37% * Non-Consolidated basis Drillship Annual Sales & New Orders Main Products 20,000 15,000 10,000 5,000 15,730 13,635 11,470 9,084 9,003 7,557 6,443 (Unit : sales - bil. KRW, New order mil. USD) 10,905 9,487 9,766 10,159 9,512 7,849 6,143 4,061 VLCCs, Tankers, Product Carriers, Chemical Tankers Containerships, Bulk Carriers, OBO Carriers Ro-Pax Ships, Ro-Ro Ships, Pure Car Carriers Tankers / VLCCs LNG Carriers, LPG Carriers Drillships Submarines, Destroyers, Frigates Operational Highlights Sales New Orders * Non-Consolidated basis, 2005 ~ 2009 sales are based on K-GAAP. Completion of Gunsan Shipyard (Mar. 2010) Investment & Technical Corporation Agreement with OSX (May 2010) 10% of stake in OSX(USD 61.9 mil.) in exchange for technical advise for establishment of a shipyard Delivery of first drillship (Sept. 2010) Delivery of 1,700 th vessel (Jan. 2011) 18

19 Performance Shipbuilding New Orders by Shiptype (2013) Backlog by Shiptype (2013) Semi Others 12% Submersible Rig 7% LPG Carrier 14% LNG Carrier 20% Containership 32% Tanker 9% Bulker 6% Special & Naval 7% Drillship 27% Semi Submersible RIg 6% Bulkers 3% Others 3% LPG Carrier 7% Container ship 22% Tanker 4% LNG Carrier 21% The above data is based on the amount Backlogs as of Dec on a delivery basis : 141 vessels. USD bil. The above data is based on the amount New Orders in Jan. Feb. Mar. Apr. May Jun. Jul. Aug. Sep. Oct. Nov. Dec. Total Target Achievement Details (mil. USD) # of ship Amount (mil. USD) 6, ,049 1, , ,512 7, % -27 Containerships (3,053) -9 LNG Carriers (1,902) -19 LPG Carriers (1,372) -11 Tankers (803) -5 Special Vessel (662) -1 Semi Submersible Rig (629) -11 Bulk Carriers (580) -2 Others (511) 19
 LPG Carrier 32% Others 9% Containership 8% Tanker 26% Drillship 6% Bulkers 3% Special & Naval 11% Semi Submersible RIg 7% Others 2% Container ship 16% Tanker 13% LNG Carrier 21% Bulker 4% LPG")
20 Performance Shipbuilding New Orders by Shiptype ( ) Backlog by Shiptype ( ) LPG Carrier 32% Others 9% Containership 8% Tanker 26% Drillship 6% Bulkers 3% Special & Naval 11% Semi Submersible RIg 7% Others 2% Container ship 16% Tanker 13% LNG Carrier 21% Bulker 4% LPG Carrier 16% LNG Carrier 26% The above data is based on the amount Backlogs as of Dec on a delivery basis : 145 vessels, USD bil. The above data is based on the amount New Orders in Jan Feb Mar Apr May Jun Jul Aug Sep Oct Nov Dec Total Target Achievement Details (mil. USD) # of ship Amount (mil. USD) 9,512 1,549 1, ,192 9, % - 26 LPG Carriers (1,964) - 18 Tankers (1,598) - 5 Containerships (501) - 6 LNG Carriers (1,294) - 3 Bulkers (242) - 2 Special Vessel (529) - Others (64) 20
21 Delivery Shipbuilding Annual Delivery (mil. GT) Gunsan Offshore Ulsan Annual Delivery (number of vessels) Ulsan Offshore (on-ground building) Gunsan Total # of Ship


22 Offshore & Engineering FPSO Drilling Rig Semi-Submersible Unit Subsea Pipeline 22

23 Overview Offshore & Engineering Sales Contribution (2013) Sales Breakdown by Product (2013) Offshore & Engineering 20.0% Shipbuilding 1% Subsea Pipeline 11% Fixed Platforms& Floaters 88% * Non-Consolidated basis * Non-Consolidated basis 7,000 6,000 5,000 4,000 3,000 2,000 1,000 0 Annual Sales & New Orders (Unit : sales - bil. KRW, New order mil. USD) 6,503 4,480 4,373 4,753 3,729 3,423 3,413 3,095 2,978 3,069 2,222 1,997 2,352 2,072 1,935 1, Sales New Orders * Non-Consolidated basis, 2005 ~ 2009 sales are based on K-GAAP. Main Products Floating Units: FPSOs, FLNGs, FPUs, TLPs, Semi Submersible Units Fixed Platforms: Topsides, Jackets & Piles, Jack-ups, Modules & Quarters Pipelines & Subsea Facilities: Subsea Pipelines Offshore Installations: Platforms, Pipelines Land-Based Modules Operational Highlights Received USD 1.1 bil. of Goliat FPSO order (Feb. 2010) Received USD 0.9 bil. of Barzan offshore platform order (Jan. 2011) Received USD 1.2 bil. of BP Q204 FPSO order (Feb. 2011) Received USD 0.6 bil. of BP Clair Ridge platform order (Mar. 2011) Received USD 1.1 bil. of Aasta Hansteen Topside order (Jan. 2013) Received USD 1.9 bil. of Moho Nord TLP & FPU order (Mar. 2013) Received USD 1.9 bil. of Rosebank FPSO order (Apr. 2013) 23
 New Orders by Type ($ mil.) 2008 2009 2010 2011 2012 2013 2014.")

 Fixed Type Total number of projects Platforms 87 Onshore Facilities 10 Jack-up rig 3 Major Projects SHWE Platform (Daewoo Inter, 2013) (1976 ~ present)")
 - Cylindrical Floating Production Storage Offloading unit ($1.1 bil.")
24 Performance Offshore & Engineering Major Projects in 2009/2010 Gorgon LNG (Oct. 2009) - LNG processing modules fabrication ($2.1 bil. from Chevron) New Orders by Type ($ mil.) Dec Fixed 1,113 2,196 1,501 2,121 1, ,406 Floating 1, ,303 1, ,735 1,470 Subsea Pipeline Others Total 2,978 2,351 3,069 4,480 2,072 6,503 6,005 Performance Record Myanmar SHWE Field development project (Feb. 2010) - Installation of gas production & processing platform, pipeline & onshore terminal ($1.4 bil. from Daewoo International Corp.) Fixed Type Total number of projects Platforms 87 Onshore Facilities 10 Jack-up rig 3 Major Projects SHWE Platform (Daewoo Inter, 2013) (1976 ~ present) Sakhalin-1 OPF Onshore Modules Fabrication(ExxonMobil, 2006) Harsh Environment Jack-up Rig 2nd (A.P.Moller, 2004) Semi-submersible Drilling Rig 10 Deepwater Horizon Semi- Submersible Drilling Unit (R & B Falcon, 2000) Goliat FPSO (Feb. 2010) - Cylindrical Floating Production Storage Offloading unit ($1.1 bil. from ENI Norge AS) Floating FPSO 10 Usan FPSO (TOTAL, 2012) TLP 2 West Seno Field Development (Chevron, 2003) FPU 5 Moho Bilondo FPU (TOTAL, 2008) Subsea Pipelines 5,452 km Barzan Offshore Project (RasGas, 2013) 24

 - Date : Feb. 2011 - Price : USD 1.")

25 Performance Offshore & Engineering Major Projects Awarded in 2011 Qatar, Barzan Offshore Project UK, Q204 FPSO UK, Clair Ridge Platform - Date : Jan Price : USD 860 million - Owner : RasGas Company - Completion : Nov Details : Fabrication and Installation of Wellhead Platforms, Living Quarters, Onshore & Offshore pipeline (EPC) - Date : Feb Price : USD 1.2 billion - Owner : BP - Completion : May Details : Construction of FPSO (EPC), Processing 0.32 million bpd, storing 0.8 million bbls - Date : Mar Price : USD 620 million - Owner : BP - Completion : Nov Details : Fabrication and Installation of Drilling and Quarters Platforms (EPC) 25
 FPU (Floating")

 Jun.")
 - Date : Apr. 2013 - Price : USD 1.")
26 Performance Offshore & Engineering Major Projects Awarded in 2013 Norway, Aasta Hansteen Spar Topside Congo, Moho Nord TLP & FPU UK, Rosebank FPSO TLP (Tension Leg Platform) FPU (Floating Production Unit) - Date : Jan Price : USD 1.1 billion - Owner : Statoil - Completion : Feb Details : Fabrication and Installation of Spar Topsides (EPC) - Date : Mar Price : USD 1.9 billion - Owner : Total - Completion : May 2015 (TLP) Jun (FPU) - Details : Fabrication and Installation of Tension Leg Platform and Floating Production Unit (EPC) - Date : Apr Price : USD 1.9 billion - Owner : Chevron - Completion : Nov Details : Construction of FPSO (EPC) Processing 100,000 BOPD (Oil), 190 MMSCFD (Gas), storing 1.05 million bbls 26


 Umm Lulu Nasr Field - Date : Jul. 2014 - Price : USD 1.")
27 Performance Offshore & Engineering Major Projects Awarded in 2014 Indonesia, Jangkrik FPU Malaysia, Bergading Project - Date : Feb Price : USD 250 million - Owner : Eni Muara Bakau B.V. - Completion : Feb Details : Hull/LQ (EPC) - Date : May Price : USD 700 million - Owner : Hess E&P Malaysia - Completion : Nov Details : Central Processing Platform, Wellhead Platform, Bridge (EPCIC) Russia, Odoptu Stage 2 Project Abu Dhabi, NASR Package 2 - Date : Jun Price : USD 270 million - Owner : Exxon Neftegas Limited - Completion : Jun Details : Onshore Modules (EPC) Umm Lulu Nasr Field - Date : Jul Price : USD 1.9 billion - Owner : Abu Dhabi Marine Operating Company - Completion : May Details : Offshore Super Complex Platforms & Power Distribution Platform (EPCI) 27


28 Industrial Plant & Engineering Thermal Power Plant Co-Generation Plant Process Plant Combined Cycle Power Plant 28

 4,396 4,077 2,826 2,645 2,761 2,076 1,898 2,010 1,544 1,374 1,480 1,259 1,017 1,014 846 602 2006 2007 2008 2009 2010 2011 2012 2013 Sales New Orders * Non-Consolidated basis, 2005 ~ 2009 sales")
29 Overview Industrial Plant & Engineering Sales Contribution (2013) Sales Breakdown by Product (2013) Industrial Plant & Engineering 5.0% Plant Equipments 30% Power Plant 52% Oil & Gas 18% * Non-Consolidated basis * Non-Consolidated basis 5,000 4,000 3,000 2,000 1,000 0 Annual Sales & New Orders (Unit : sales - bil. KRW, New order mil. USD) 4,396 4,077 2,826 2,645 2,761 2,076 1,898 2,010 1,544 1,374 1,480 1,259 1,017 1, Sales New Orders * Non-Consolidated basis, 2005 ~ 2009 sales are based on K-GAAP. Main Products Power Plants Combined-Cycle, Cogeneration, and Thermal Power Plants Process Plants Oil and Gas, Refinery, Tank Farm, GTL, and LNG Facilities Plant Equipments Industrial Boiler, HRSG(Heat Recovery Steam Generator), CFBC(Circulating Fluidized Bed Combustor) Boiler, Regenerator & Reactor Operational Highlights Received a USD 1.0 bil. Das Island order (Jul. 2009) Received a USD 2.6 bil. Sabiya order (Sept. 2009) Signed an MOU for supplying ITER vacuum vessel (Jan. 2010) Received a USD 1.6 bil. Riyadh order (Jun. 2010) Received a USD 3.2 bil. Jeddah South order (Oct. 2012) Received a USD 3.3 bil. Shuqaiq order (Aug. 2013) 29

 Clean Fuel Project (Kuwait National Petroleum Company, 2018(E)) Jazan Refinery and Terminal Project, Package 2 (Saudi Aramco, 2016(E)) Refinery & HCP No.")
30 Oil & Gas Power Performance Project Type Oil & Gas Tank Farm Performance Record Industrial Plant & Engineering Major Projects Integrated Gas Development (IGD) Project (ADGAS, UAE, 2013) Escravos Gas Plant Phase Ⅲ (Chevron Nigeria Ltd., Nigeria, 2010) Bonny Terminal Integrated Project (Shell Petroleum Development, Nigeria, 2008) (1976 ~ present) KOC Crude Oil Export Facilities Project (Kuwait Oil Company, 2008) JPR Zarpa Tank Farm Project (Jordan Petroleum Company, 2000) Clean Fuel Project (Kuwait National Petroleum Company, 2018(E)) Jazan Refinery and Terminal Project, Package 2 (Saudi Aramco, 2016(E)) Refinery & HCP No.2 BTX Project Daesan (HC Petrochem, Korea, 2013) Petrochemical Mumbai Diesel Hydro-Desulfurization Project (Hindustan Petroleum Company, India, 2000) HPC 2nd Petrochemical Complex Project (Hyundai Oilbank, 1997) Gas to Liquid Pearl GTL Feed Gas Preparation Project (Qatar Shell, 2011) Riyadh PP 11 Independent Power Project (Dhuruma Electricity Company, Saudi Arabia, 2013) Sabiya Combined Cycle Gas Turbine Project Combined (Ministry of Electricity and Water, Kuwait, 2013) Cycle/ Al Dur Independent Water and Power Project Simple Cycle (Al Dur Power & Water Co., Bahrain, 2012) Power Plant Marafiq Independent Water and Power Project (Jubail Water and Power Company, Saudi Arabia, 2010) Shaybah Power Generation Project (Saudi Aramco, Saudi Arabia, 2008) Tihama Cogeneration Expansion Project Stage II (Tihama Power Company, Saudi Arabia, 2015(E)) Cogeneration Saudi Aramco 3rd party Cogeneration Program (Tihama Power Company, Saudi Arabia, 2006) Jeddah South Power Plant (Saudi Electricity Company, Saudi Arabia, 2017(E)) Shuqaiq Power Plant Thermal (Saudi Electricity Company, Saudi Arabia, 2018(E)) Namjeju #3&4 Thermal Power Plant (KEPCO, Korea, 2007) Makkah-Taif Thermal Power Plant (Saline Water Conversion Corporation, Saudi Arabia, 1989) Desalination Plant Taweelah A1 (ADWEA, UAE, 2002) Taweelah B (ADWEA, UAE, 1995) Umm Al Nar West (ADWEA, UAE, 1982) Al Khobar Phase 2 (SWCC, Saudi Arabia,1981) New Orders by Type (mil. USD) Dec Power Plants 1,727 1,412 1, ,510 4,285 6 Chemical Plants/ Plant equipment 349 1, , ,250 Total 2,076 2,826 2,010 1,014 4,077 4,396 1,256 Major Projects in 2012/2013/2014 Jeddah South (Oct. 2012) Shuqaiq Power Plant (Aug. 2013) Clean Fuel Project (Apr. 2014) bil. USD / Saudi Electricity Company, Saudi Arabia - 2,400MW Oil fired Conventional Power Plant bil. USD / Saudi Electricity Company, Saudi Arabia - 2,640MW Oil fired Conventional Power Plant bil. USD / Kuwait National Petroleum Company, Kuwait - Upgrade and expansion of Refinery 30


31 Engine & Machinery Marine Engine & Equip. Marine & Industrial Turbine Industrial & Marine Pump Industrial Robot & System Marine Propeller 31

32 Overview Engine & Machinery Sales Contribution (2013) Sales Breakdown by Product (2013) Engine & Machinery 9.0% Hydraulic Machinery 7% Power Plant Engine 6% Robotics 9% Marine Engine 78% * Non-Consolidated basis * Non-Consolidated basis Annual Sales & New Orders (Unit : sales - bil. KRW, New order mil. USD) 5,000 4,646 4,000 3,248 3,176 2,772 2,835 3,096 2,967 3,000 2,522 2,283 2,313 2,425 1,880 1,858 2,000 1,646 1,220 1,452 1, Sales New Orders * Non-Consolidated basis, 2005 ~ 2009 sales are based on K-GAAP. Main Products & Capacity Two-Stroke Diesel Engines (500 units, 18 mil. BHP) Four-Stroke(HiMSEN) Engines (1,800 units, 5 mil. BHP) Diesel and Gas Power Plant Engines Propellers and Crankshafts Steam Turbines and Turbochargers Industrial and Marine Pumps, Industrial Robots, Side Thrusters Presses, Conveyor Systems, and Steel Strip Process Lines Operational Highlights Surpassed cumulative four-stroke engine production of 20 mil. bhp (Mar. 2010) Production of eco-friendly marine engine meeting new IMO standards (Mar. 2010) Received a 95MW PPS order from Venezuela (Apr. 2010) Received a 75MW diesel power plant order from Bangladesh (Apr. 2010) Development of high output eco-friendly gas engine (May 2010) - 20% reduction of CO 2 emission and 97% reduction of NO X emission Surpassed cumulative two-stroke engine production of 100 mil. bhp (Sept. 2010) Production of 1,000 th Packaged Power Station (Jul. 2012) 32
33 Performance Engine & Machinery Major Projects in 2010, 2011 Diesel Power Plants order from Bangladesh (Apr. 2010) - USD 70 mil. order for 70 MW diesel power plants from Bangladesh Power Development Board (BPDB) PPS order from Venezuela (Apr. 2010) - USD 160 mil. order for 204 MW, 120 Packaged Power Stations from electricity company Electricidad de Caracas, Venezuela Diesel Power Plants order from Ecuador (May 2011) - USD 74 mil. order for 140 MW diesel power plants from Equitatis, Equador Eco-friendly Engine products Eco-Friendly Diesel Engine -15 % reduction of NOx emission meeting new IMO standards High output Eco-Friendly HiMSEN Gas Engine - 20% reduction of CO2 emission compared to diesel engine - 97% reduction of NOX emission to reach the world s lowest level of 50ppm - 47% improvement in engine performance Market Share in 2013 (%) Large-size Marine Engine Medium-size Marine Engine Propeller Ship Engine New Orders by Region Diesel power plant Domestic Global % 11% 8% 8% 4% 6% 9% 9% 33% 39% 28% 44% 57% 45% 67% 92% 83% 87% 66% Domestic China Others 33

34 Electro Electric Systems Transformers Switchgears High Voltage Circuit Breakers Marine Electrical Equip. 34

 3,793 3,242 2,843 2,625 2,609 2,319 2,318 1,820 2006 2007 2008 2009 2010 2011 2012 2013 Sales New Orders * Non-Consolidated basis, 2005 ~ 2009 sales are based on K-GAAP.")
35 Overview Electro Electric Systems Sales Contribution (2013) Sales Breakdown by Product (2013) Electro Electric Systems 11.0% Rotating Machinery 19% Others 5% Transformer 34% Switchgear 16% Low Voltage Circuit Breaker High Voltage Circuit Breaker 19% * Non-Consolidated basis 7% * Non-Consolidated basis 4,000 3,000 2,000 1,000 0 Annual Sales & New Orders 2,712 2,281 2,556 1,925 1,766 1,453 1,274 1,057 (Unit : sales - bil. KRW, New order mil. USD) 3,793 3,242 2,843 2,625 2,609 2,319 2,318 1, Sales New Orders * Non-Consolidated basis, 2005 ~ 2009 sales are based on K-GAAP. Main Products Transformers (up to 765kV, 1,300MVA), Gas Insulated switchgear(25.8kv~800kv), Low voltage Switchgear Low and Medium Voltage Circuit Breakers Rotating Machinery Power Electronics and Control Systems Operational Highlights Awarded Asia-Pacific Power Transmission Equipment Company of the Year by Frost & Sullivan (Aug. 2009) Received USD 0.25 bil. transformer order from South Africa (Nov. 2009) Received USD 0.6 bil. transformer order from the US (May 2010) Reached the transformer production milestone of 700,000MVA (Dec. 2010) Received 1,000 GIS order from Russia (Jun. 2011) 35
36 Performance Major performance Electro Electric Systems Major Projects US transformer long-term supply contract (May 2010) Project Type Major Projects - USD 600 mil. Order for supplying transformers ranging from 230kV to 500kV to Southern California Edison(SCE) for 10 years from 2010 to Largest transformer order to date Sales by Region Generator Installation Power Transmission & Mutation Installation Iron Manufacture Installation West Generating Project (U.S.A) British Columbia Hydro & Power Authority (Canada) NUEVA VENTANAS 240MW Coal Fired Power Project (Chile) 35% 38% 49% 51% 46% 54% 3% 4% 3% 18% 2% 29% 8% 21% 2% 16% 7% 20% 18% 7% 23% 11% 6% 4% 2% 5% 1% 3% 5% 4% 3% 4% 6% 9% 1% 5% 14% 14% 14% 11% 12% 10% Water Treatment & Cement & Petrochemical Installation Automotive Goods Marine Goods Ocean Installation Marine Steam Turbine KODECO IKC Project (Indonesia) Seoul Metro (South Korea) Royal Nedlloyd Group (Netherlands) Al-Jubail Saline Water Conversion (Saudi Arabia) Hyundai Merchant Marine LNG Carrier 22,000MW Marine Steam Turbine (South Korea) Domestic Others Middle East Europe Africa Asia North America * The sales of Green Energy division is not included in 2011 & 2012 results Know-how Export Gas Insulated Switchgear : TATUNG Company (Taiwan) * 2007 ~ 2009 sales are based on K-GAAP. Fresh Water Installation Shuweihat S2 IWPP Project (U.A.E.) 36
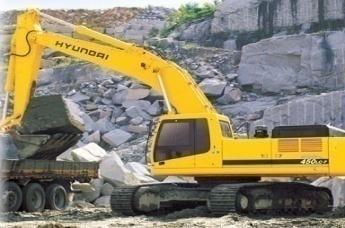

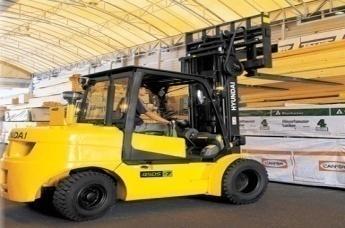
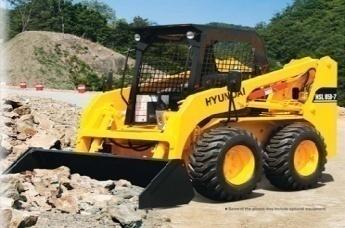


37 Construction Equipment Mini Excavator Crawler Excavator Wheel Excavator Wheel Loader Forklift Truck Skid Steer Loader 37

38 Overview Construction Equipment Sales Contribution (2013) Sales Breakdown by Product (2013) Construction Equipment 11.0% CKD 9% Others 9% Skid Loader 1% Wheel Loader 11% Excavator 54% Folk Lift 16% * Non-Consolidated basis * Non-Consolidated basis Annual Sales (Unit : sales - bil. KRW) Main Products 3,500 3,000 2,500 2,275 3,052 3,120 2,723 Excavators (Local 16,000 units, China 18,874 units, India 1,800 units) Wheel Loaders (2,900 units) Forklifts (9,500 units) Skid Loaders (600 units) 2,000 1,500 1,198 1,512 1,769 1,190 Operational Highlights 1, * Non-Consolidated basis, 2005 ~ 2009 sales are based on K-GAAP. Introduction of Hi-Mate remote management system (May 2009) 9-series excavators recognized at Korea s Pin-up Design Awards (Dec. 2009) Introduction of new 9-series wheel loader (May 2010) Breaking ground for wheel loader factory in China (Jul. 2010) Introduction of 120-ton excavator (Apr. 2011) Production of 350,000 th construction equipment (Oct. 2011) 38
39 Performance Excavators Sales in China Construction Equipment Excavator Sales in China 180, , ,000 90,000 60,000 30, ,500 60,856 Market size(left) HHI(Right) 71,767 9,138 9,495 8,377 93,237 10, , ,908 18,467 17, , ,917 84,573 8,540 7,532 3, Dec Construction Equipment Sales by Region 35,000 30,000 25,000 20,000 15,000 10,000 5,000 0 Dec 2013 Dec 2014 YoY Market 104,925 84, % H H I 7,532 3, % M/S 7.2% 4.4% -2.8%p (Source : China construction machinery association) HHI s Excavator Market Share by Region 39% 49% 39% 38% 48% 54% 45% 14% 6% 25% 27% 11% 5% 19% 5% 20% 4% 18% 17% 16% 28% 22% 17% 9% 21% 17% 8% 3% 6% 7% 3% 4% 6% 10% 15% 6% 6% 2% 3% 3% 3% 2% ~ 2009 sales are based on K-GAAP. Others includes Russia (9%), Middle East (9%), Africa (8%), Southeast Asia (7%), Turkey, Australia and etc. Others Brazil China Domestic Europe North America India (Source : Company data) Domestic 28.0% 32.1% 27.5% 27.9% Global (Exclude Japan) 9.7% 10.0% 9.0% 7.8% China 11.3% 10.2% 8.1% 7.2% India 11.1% 14.4% 17.7% 19.7% 39

40 Green Energy Solar Power Wind Power 40
 Picture Facilities")
 Annual Capacity (2013) 600MW 600MW 100MW 500MW Details - Mono-crystalline, Poly- crystalline solar cells")

 % of total HHI Sales 20 30 70 170 510 560 600 600 50 0.4% 107 0.6% 150 1.3% 591 2.6% 399 1.6% 344 1.4% 312 1.")

41 Solar Power 600MW capacity of solar cell & solar modules and solar inverter to provide total solution Solar cell & solar modules, solar inverter production facility in 2013 Solar Cell Solar Module Thin-film Solar module Solar System (Inverter) Picture Facilities Solar Cell Plant (Eumseong, Korea) Solar Module Plant (Eumseong, Korea) Hyundai Avancis (Ochang, Korea) Electro Electric Systems Division (Ulsan, Korea) Annual Capacity (2013) 600MW 600MW 100MW 500MW Details - Mono-crystalline, Poly- crystalline solar cells produced - 54 cell(6x9), 60 cell(6x10), 72 cell(6x12) modules produced - JVC with Saint-Gobain (50:50) - CIGS (Cu, In, Ga, Se) thin-film solar module produced - Grid-Tied Solar Inverter with/without transformer Capacity and Sales Capacity Cell (MW) Modules (MW) Sales (KRW bil.) % of total HHI Sales % % % % % % % The above capacity expansion and sales plan is subject to change according to the market situation. The above sales is total sales of Green Energy division. Solar Product Certification - UL IEC edition 2, IEC (TUV) - J-PEC - JET Cert - CE Declaration - MCS (UK) - CSTB (France) - Ammonia resistance (IEC 62716) - Salt mist (IEC ed.2) 41
")
 Weihai Hyundai Wind Power Technology")
 - JVC with Datang Shandong Power Generation (80% by")

 Gear Type Installation Type On Market HQ1650")

 Generator (HHI) - HHI s production : Nacelle part")
42 Wind Power Wind Turbine Production facilities Company Name Details Wind Turbine System Structure Wind Turbine plant (HHI) - Located in Gunsan, Korea - Annual Capacity: 600MW Nacelle Part (Installed in Tower) Weihai Hyundai Wind Power Technology - Located in Weihai, China - Annual Capacity: 600MW (2MW X 300 units) - JVC with Datang Shandong Power Generation (80% by HHI) Jahnel-Kestermann (Jake) - Located in Bochum, Germany - Annual Capacity: approx. 500 units of gearbox HHI s Products & Certification Model Rated Power (MW) Gear Type Installation Type On Market HQ Geared Onshore Jun HQ Geared Onshore Jun HQ Geared Offshore Feb * On Market: based on proto-type installation date Gear box (Jake) Generator (HHI) - HHI s production : Nacelle part Power converter (HHI) - Outsourcing : Rotor Part (Blade, Hub), Tower Transformer (HHI) 42
43 Subsidiaries 43


44 Hyundai Oilbank At a Glance Facilities & Products Production Capacity 390,000B/D #1 : 110,000 B/D, #2 : 280,000 B/D Completion of # 2 HOU Plant 34.4% With the completion of # 2 HOU plant in Jan., 2011, Hyundai Oilbank achieved a ratio of 34.4%, the highest upgrading ratio in the industry Domestic Light Oil Market Share 22.1% Crude oil 100% (390,000 b/d) Refining Unit Bunker C 44% LPG, Naphtha, Gasoline 19% Kerosene, Diesel 37% Upgrading Unit Gasoline, LPG 46% Diesel 37% Propylene 9% Others 8% Total CAPEX : KRW2.6 tril. (Jul ~ Feb. 2011) HHI s Management Control 91.1% Acquired by HHI in Aug.,
45 Hyundai Oilbank Income Statement (Unit: KRW billion) Q (Cumulative) 18, , ,295.6 Sales 18, , , ,237.3 Operating Operating Income % Income Sales Net Income % Financial Position (Unit: KRW billion) Q 215.1% 194.6% 181.6% Total Assets 8, , , ,352.1 Total Liabilities 5, , , ,243.5 Total Shareholder s Equity Liabilities-to- Equity Ratio(%) 2, , , ,108.6 * The financial information of 2009 is based on K-GAAP , , , Assets Liabilities-to- Equity Ratio 45


46 Hyundai Samho At a Glance Backlog by Shiptype ( ) Production Capacity - Delivered 42 vessels in # of dry docks : Sales Target 4.3 mil. GT 4,563 bil. KRW FPU 3% LPG Carrier 11% PCTC 9% LNG Carrier 20% Semi Submersible Rig/ HLV / F Dock 9% Containership 20% Bulker 8% Tanker 20% 2014 Order Target 4,000 mil. USD Backlogs as of Dec on a delivery basis : 87 vessels, USD 9.14 bil. The above data is based on the amount New Orders in Jan Feb Mar Apr May Jun Jul Aug Sep Oct Nov Dec Total Target Achievement Details (mil. USD) # of ship % Amount (mil. USD) 5,350 1, ,807 4, % New Orders in Containerships (1,119) -12 Tankers (975) -4 PCTCs (298) -4 Bulk Carriers (246) -1 LPG Carrier (79) -Others (90) New Orders in 2013 (65 vessels) -9 Containerships (1,029) -12 LPG Carriers (907) -6 Tankers (495) -12 PCTCs (841) -11 Bulk Carriers (653) -11 P/Cs (547) -2 LNG Carriers (420) -1 FPU Hull (270) -1 High Lift Vessel (188) 46

47 Hyundai Samho Income Statement (Unit: KRW billion) Q (Cumulative) Sales 4, , , ,961.4 Operating Income , , ,506.2 Operating Income Sales % Net Income % Financial Position Q Total Assets 6, , , ,352.3 Total Liabilities 3, , , ,218.9 Total Shareholder s Equity Liabilities-to- Equity Ratio(%) * The financial information of 2009 is based on K-GAAP. (Unit: KRW billion) 3, , , , % 109.1% 97.8% 6, , , Assets Liabilities-to- Equity Ratio 47
48 Financial Performance 48
49 Financial Summary (Consolidated) Sales Operating Profit Net Income (Bil. of KRW) (Bil. of KRW) (Bil. of KRW) 60, , , ,000.0 OP OP Margin 30% 60,000.0 NI NI Margin 30% 40, , Sales 37, , , % 8.5% 5, , % 2, % % 10% 0% 40, , % % 1.9% 4, , % 1, Q (Cumulative) 37, % 53, % 54, % 54, % 38, % Operating Profit 5, % 4, % 2, % % (3,227.2) -8.3% Shipbuilding 2, % 2, % 1, % % (1,913.0) -16.2% Offshore % % % % (412.6) -13.3% Industrial Plant % % % % (1,051.9) -69.6% Engine & Machinery % % % % (3.3) -0.3% Electro Electric % % (74.3) -2.6% % % Construction % % % % % Green Energy - - (175.0) -46.0% (106.3) -31.5% (103.2) -32.8% (10.4) -4.4% Refinery % % % % % Finance services % % % % % Others (239.2) - (304.3) - (314.6) - (293.2) - (196.4) - Net Income 4, % 2, % 1, % % (2,168.2) -5.6% 20% 10% 0% (Bil. of KRW) 49
50 Financial Summary (Consolidated) Assets Liabilities & Total Debt Shareholder s Equity (Bil. of KRW) (Bil. of KRW) (Bil. of KRW) 60, , , , , , , , , , , , , , , , , , , , , , , , (Bil. of KRW) Q Total Assets 46, , , , ,981.7 Current Assets 22, , , , ,304.7 Cash& Cash Equivalents 1, , , , ,603.9 Non Current Assets 23, , , , ,677.0 Total Liabilities 30, , , , ,132.8 Current Liabilities 26, , , , ,938.5 Non-Current Liabilities 4, , , , ,194.3 Total Shareholder's Equity 16, , , , ,848.9 Liabilties-to Equity Ratio 192.4% 169.6% 162.9% 179.6% 220.4% Debt-to-Equity Ratio 61.4% 60.8% 79.1% 83.3% 92.6% Total Debt 9, , , , ,
51 Financial Summary (Non-Consolidated) Sales Operating Profit Net Income (Bil. of KRW) (Bil. of KRW) (Bil. of KRW) 40, ,000.0 OP OP Margin 20% 40,000.0 NP NP Margin 15.9% 30, , , % 10.5% 15% 22, , , , % 20, , % 20, % 4.4% 10, , % 5% 10, % 3, , , , , , % % 15% 10% 5% 0% (Bil. of KRW) Q (Cumulative) Sales 22, % 25, % 25, % 24, % 16, % Operating Profit Net Income 3, % 2, % 1, % % (1,914.6) -11.5% Shipbuilding 1, % 1, % % % (459.9) -4.4% Offshore % % % % (412.7) -21.1% Industrial Plant % % % % (987.9) -26.3% Engine & % % % % % Electro Electric % % (58.7) -2.1% % % Construction % % % % % Green Energy - - (172.7) -46.0% (103.1) -30.0% (100.8) -32.3% (8.7) -5.3% Others (245.3) - (270.7) - (290.5) - (284.6) - (231.2) - 2, % 1, % 1, % % (1,569.6) -9.4% 51
52 Financial Summary (Non-Consolidated) Assets Liabilities & Total Debt Shareholder s Equity (Bil. of KRW) (Bil. of KRW) (Bil. of KRW) 40, , , , , , , , , , , , , , , , , , , , , , , , , , , , (Bil. of KRW) Q Total Assets 28, , , , ,760.6 Total Liabilities Current Assets 11, , , , ,399.6 Cash& Cash Equivalents Non Current Assets 17, , , , , , , , , ,042.1 Current Liabilities 14, , , , ,014.4 Non-Current Liabilities 1, , , , ,027.7 Total Shareholder's Equity Liabilties-to Equity Ratio 13, , , , , % 103.3% 101.7% 106.2% 131.5% Debt-to-Equity Ratio 26.4% 26.9% 43.1% 47.5% 50.2% Total Debt 3, , , , ,
53 2014 Business Plan (Non-Consolidated) 40, , , , Sales (bil. KRW) +9.4% 26, , (E) (E) Change Shipbuilding 10, , % Offshore & Engineering 4, , % Industrial Plant 1, , % Engine & Machinery 2, , % Electro Electric Systems 2, , % Construction Equipment 2, , % Green Energy % Others % Total 24, , % 40, , , , New Orders (mil. USD) +8.0% 27, , (E) (E) Change Shipbuilding 9, , % Offshore & Engineering 6, , % Industrial Plant 4, , % Engine & Machinery 2, , % Electro Electric Systems 1, , % Construction Equipment 2, , % Green Energy % Total 27, , % 53
54 Sales by Division (Non-Consolidated) Sales (bil. KRW) Target Nov. Achievement Full Year Nov. Achievement Shipbuilding 9,619 8, % 10,159 9, % Offshore & Engineering 5,134 3, % 4,753 4, % Industrial Plant & Engineering 3,130 2, % 1, % Engine & Machinery 2,463 1, % 2,313 1, % Electro Electric Systems 2,638 1, % 2,609 2, % Construction Equipment 3,100 2, % 2,723 2, % Green Energy % % Others % % Total 26,570 20, % 24,283 21, % * The financial information above is based on K-IFRS * The backlog above is on a delivery basis 54
55 New Orders by Division (Non-Consolidated) New Orders and Backlog (Mil. USD) New Orders Backlog 2014 Target Dec. Achievement Target Dec. Achievement Dec. Shipbuilding 9,150 6, % 7,750 9, % 18,550 Offshore & Engineering 6,900 6, % 6,000 6, % 21,704 Industrial Plant & Engineering 5,000 1, % 6,000 4, % 9,983 Engine & Machinery 2,900 1, % 3,100 2, % 3,242 Electro Electric Systems 2,424 2, % 3,160 1, % 2,076 Construction Equipment 2,837 2, % 3,272 2, % - Green Energy % % 141 Total 29,565 19, % 29,676 27, % 55,696 * The financial information above is based on K-IFRS * The backlog above is on a delivery basis 55
56 2014 Business Outlook 2013 Trend 2014 Outlook Shipbuilding Offshore & Engineering Industrial Plant & Engineering Engine & Machinery Electro Electric Systems Construction Equipment Green Energy Improvement in volume - The owners took advantage of low vessel prices and demand for the eco-friendly specification increased significantly. Favorable market demand - Bolstered by strong oil prices, offshore resource development continued to increase in Northern Europe, Australia, Southeast Asia and Africa. Competition intensified - Market continued to grow, driven by infrastructure for the industry in the Middle East and Southeast Asia, but became increasingly competitive. Sluggish demand - The marine engines market experienced a sluggish demand as it lags behind the shipbuilding demand. Oversupply Continued -The global electric market grew but remained oversupplied and highly competitive Sluggish demand - Market continued to shrink due to slowing demand in emerging markets, especially China and India. Gradual recovery - Rapid demand increase in Japan and China, and global market restructuring relieved oversupply and stabilize pricing. Improvement in pricing - Shipbuilding demand is expected to decline slightly. (2013: 99 mil.cgt, 2014(E): 66 mil. CGT, *Source: Clarkson) - Newbuilding prices are expected to recover as major shipyards secured optimal level of backlog. Favorable market demand - Shale gas production, fall in oil prices may raise volatility risks in the market. - Offshore resource development will continue to grow and demand for Offshore facilities in Australia & Southeast Asia and deep sea field development in North America & Brazil are expected to rise. Competition eased - Market continued to grow driven by infrastructure for the industry in the Middle East and Southeast Asia. Also, competition among South Korean E&C companies is forecasted to ease to accelerate profit recovery. Gradual Improvement in market demand - Marine engine market is expected to improve gradually from the second half of 2014 Gradual Improvement in market demand - Replacement demand for an aging equipment in developed countries and demand for power infrastructures in the Middle East and Asia will mitigate supply-demand imbalance. Gradual recovery - Demand recovery in the US, the Middle East and China is expected despite sluggish demand is expected to continue in Southeast Asia and Latin America. Oversupply eased - Government incentives in Japan, China, U.S markets are expected to drive growth. - Supply-demand imbalance will be continuously mitigated due to the demand increase and market restructuring. 56
57 Q & A 57
58 Thank You *For More Information IR Team Tel: , 4546, 7858 Fax: Website: (Company) / (IR) 58
- Shipbuilding Division - Offshore & Engineering and Industrial Plant Division - Engine & Machinery Division
 - Shipbuilding Division - Offshore & Engineering and Industrial Plant Division - Engine & Machinery Division - Financial Summary of HHI - Financial Summary of HMD - 2018 New Order & Sales Target HMD 3.9
- Shipbuilding Division - Offshore & Engineering and Industrial Plant Division - Engine & Machinery Division
 - Shipbuilding Division - Offshore & Engineering and Industrial Plant Division - Engine & Machinery Division - Financial Summary of HHI - Financial Summary of HMD - 2018 New Order HMD 3.9 KCC 6.8 National
KCC 6.8 HMD 3.9. National Pension 9.1. Hyundai Motors 2.9. HHI Holdings Asan Foundation 3.0. Treasury Stock 0.1. Others 46.5
 HMD 3.9 KCC 6.8 National Pension 9.1 Hyundai Motors 2.9 HHI Holdings 27.7 Asan Foundation 3.0 Others 46.5 Treasury Stock 0.1 1973 ~ 2010 2011 ~ 2018 12. 1973 Establishment of Hyundai Shipbuilding & Heavy
H H I at a Glance. Business Performance. Financial Performance
 (2015.4) 1 Important Notice This presentation of Hyundai Heavy Industries (HHI) contains forward-looking statements relating to HHI s operations that are based on management s current expectations, estimates
H H I at a Glance. Business Performance
 1 Important Notice This presentation of Hyundai Heavy Industries (HHI) contains forward-looking statements relating to HHI s operations that are based on management s current expectations, estimates and
HHI at a Glance. Financial Performance. Business Performance
 (9. 2015) 1 Important Notice This presentation of Hyundai Heavy Industries (HHI) contains forward-looking statements relating to HHI s operations that are based on management s current expectations, estimates
HHI at a Glance. Financial Performance. Business Performance
 (9. 2015) 1 Important Notice This presentation of Hyundai Heavy Industries (HHI) contains forward-looking statements relating to HHI s operations that are based on management s current expectations, estimates
HHI at a Glance. Financial Performance. Business Performance
 (11. 2015) 1 Important Notice This presentation of Hyundai Heavy Industries (HHI) contains forward-looking statements relating to HHI s operations that are based on management s current expectations, estimates
HHI at a Glance. Financial Performance. Business Performance. Current Issues
 (2016.02) 1 Important Notice This presentation of Hyundai Heavy Industries (HHI) contains forward-looking statements relating to HHI s operations that are based on management s current expectations, estimates
Hyundai Heavy Industries IR Presentation. (Apr. 2017)
") Hyundai Heavy Industries IR Presentation (Apr. 2017) 1 Important Notice This presentation of Hyundai Heavy Industries (HHI) contains forward-looking statements relating to HHI s operations that are based
Hyundai Heavy Industries IR Presentation (Apr. 2017) 1 Important Notice This presentation of Hyundai Heavy Industries (HHI) contains forward-looking statements relating to HHI s operations that are based
Hyundai Heavy Industries IR Presentation ( )
") Hyundai Heavy Industries IR Presentation (2017. 02) 1 Important Notice This presentation of Hyundai Heavy Industries (HHI) contains forward-looking statements relating to HHI s operations that are based
Hyundai Heavy Industries IR Presentation (2017. 02) 1 Important Notice This presentation of Hyundai Heavy Industries (HHI) contains forward-looking statements relating to HHI s operations that are based
2007 3Q Investor Meeting. November 2007
 2007 3Q Investor Meeting November 2007 Company Overview Cumulative 3Q 2007 Results Result By Division Appendix Company Overview Overview Doosan Infracore is the largest machinery company in Korea and also
Overseas Market Conditions of Construction and Mining Equipment
 1 Overseas Market Conditions of Construction and Mining Equipment December 17, 2012 Hisashi Shinozuka Senior Executive Officer President of Construction and Mining Marketing Division Komatsu Ltd. 2 1.
Capital Markets Day 2007 Kongsberg Maritime 25 September 20O7
 Capital Markets Day 27 Kongsberg Maritime 25 September 2O7 WORLD CLASS through people, technology and dedication 1 Kongsberg Maritime Offshore & Merchant Marine Offshore & Merchant Marine Introduction
2Q06 Results. Investor Relations
 2Q06 Results Investor Relations Content 1. 2Q06 Key Results 2. Summarized Income Statement 3. Balance Sheet as of Jun. 2006 4. Outlook for 2006 5. Result & Outlook By Division Appendix : 2Q06 Results Breakdown
IR Presentation SAMSUNG ENGINEERING 2
 IR Presentation SAMSUNG ENGINEERING 2 0 1 5 1 Introduction CONTENTS 2 Business Update 3 Appendix Introduction Business Portfolio Hydrocarbon Refinery Gas Petrochemical Upstream CDU/VDU HDS Aromatics Alkylation
2010 1Q Investor Meeting. May 2010
 2010 1Q Investor Meeting May 2010 This presentation contains preliminary figures which may be materially different from the final figures. While the statements in this presentation represent our current
2015 Interim Results Announcement
 China Petroleum & Chemical Corporation 2015 Interim Results Announcement August 27, 2015 Hong Kong Cautionary Statement This presentation and the presentation materials distributed herein include forward-looking
Market Report Series: Oil 2018 Analysis & Forecasts to Energy Community 10 th Oil Forum, Belgrade, 25 September 2018
 Market Report Series: Oil 218 Analysis & Forecasts to 223 Energy Community 1 th Oil Forum, Belgrade, 25 September 218 Short term update: crude prices (excl. WTI) up strongly Aug/Sep $/bbl 8 Benchmark Crude
CONFIDENCE DYNA-MAC HOLDINGS LTD.
 Dyna-Mac Holdings Ltd. 3Q 2018 Results 08-November-2018 Photo: SBM Offshore FORWARD WITH CONFIDENCE DYNA-MAC HOLDINGS LTD. 1 Photo: SBM Offshore Business Overview 2 About Dyna-Mac A multi-disciplinary
IR Presentation SAMSUNG ENGINEERING 2
 IR Presentation SAMSUNG ENGINEERING 2 0 1 4 1 Introduction CONTENTS 2 Business Update 3 Appendix Introduction Business Portfolio Hydrocarbon Refinery Gas Petrochemical Upstream CDU/VDU Heavy Oil Upgrading
DAEWOO HEAVY INDUSTRIES & MACHINERY
 www.dhiltd.co.kr DAEWOO HEAVY INDUSTRIES & MACHINERY November 2003 Our projections in this document are based on current economic conditions and DHIM s current management policy. www.dhiltd.co.kr CONTENTS
Global Monthly March 2019
 Global Monthly March 19 Percent of world bonds outstanding 3 5 15 5 Jan-1 Jun-1 Nov-1 Apr-15 Sep-15 Feb-1 Jul-1 Dec-1 May-17 Oct-17 Mar-1 Aug-1 Dec-1 Mar-19 March 19 Percent, year-on-year 7 5 3 1 1Q1 1Q
Q Analyst Teleconference. 9 August 2018
 9 August 218 Disclaimer This presentation contains forward-looking statements that reflect the Company management s current views with respect to certain future events. Although it is believed that the
A summary of national and global energy indicators. FEDERAL RESERVE BANK of KANSAS CITY
 THE U.S. Energy DATABOOK A summary of national and global energy indicators JULY 1, 17 FEDERAL RESERVE BANK of KANSAS CITY SUMMARY OF CURRENT ENERGY CONDITIONS The number of total active drilling rigs
BUSINESS OVERVIEW FEBRUARY
 BUSINESS OVERVIEW FEBRUARY 2018 Except for historical information, the statements made in this presentation constitute forward looking statements. These include statements regarding the intent, belief
Review of Operations in FY2012
 Sales Segment Profit and Ratio Sales by Region for the Fiscal Year ended March 31, 2013 (To Outside Customers) 41 With respect to construction equipment, while demand increased in North America and Japan
World Geographic Shares
 World Geographic Shares North America South America Europe Africa Asia Australia/ Oceania 18% 13% 7% 22% 33% 6% World Population Shares North America South America Europe Africa Asia Australia/ Oceania
About Czarnikow. The Premier Provider of Sugar Market Services. Czarnikow has been in the sugar business since 1861
 About Czarnikow The Premier Provider of Sugar Market Services Czarnikow has been in the sugar business since 1861 Czarnikow is the leading professional services company in the sugar market Czarnikow has
Korean Shipbuilding Industry & Policy
 Korean Shipbuilding Industry & Policy June 6th 2018 MOTIE Ministry of Trade, Industry and Energy Outline 1. Shipbuilding Market (1) 2016 was a year with a historically low level of new-building demand
Asahi World Environmental Forum 14 September Global trends in clean energy investment. Michael Liebreich Chief Executive
 Asahi World Environmental Forum 14 September 2010 Global trends in clean energy investment Michael Liebreich Chief Executive Bloomberg New Energy Finance, 2004-2010 Global total new investment in clean
FY2013 2Q Report (ended on 30 th September, 2013) Reported on 7 November, 2013
 Reported on 7 November, 2013") FY2013 2Q Report (ended on 30 th September, 2013) Reported on 7 November, 2013 Key Point of FY2013 2Q Upward revision of full-term earnings forecast Positive turnaround in market environment - Increase
FY2013 2Q Report (ended on 30 th September, 2013) Reported on 7 November, 2013 Key Point of FY2013 2Q Upward revision of full-term earnings forecast Positive turnaround in market environment - Increase
US Crude Oil Reshaping International Crude Oil Flows. Olivier Jakob,
 US Crude Oil Reshaping International Crude Oil Flows Olivier Jakob, ojakob@petromatrix.com www.petromatrix.com Claimer Petromatrix publishes since 2006 a daily market note on the oil markets Our reports
Downstream & Chemicals
 Downstream & Chemicals Pierre Breber Executive Vice President 017 Chevron Corporation Downstream portfolio Fuels refining & marketing Integrated value chains Lubricants & additives Globally positioned
OILFIELD TECHNICAL INSPECTION SDN BHD
 OILFIELD TECHNICAL INSPECTION SDN BHD GENERAL PRESENTATION FOR OFFSHORE EUROPE ABERDEEN 3 rd 6 th SEPTEMBER 2013 BACKGROUND OTI was established on 30 August 2005 Our primary business focus is pipeline
2010 Interim Results Presentation. August 23, 2010 Hong Kong
 Sinopec Corp. 21 Interim Results Presentation August 23, 21 Hong Kong Disclaimer i This presentation and the presentation materials distributed herein include forwardlooking statements. All statements,
Economic & Steel Market Development in Japan
 1 Economic & Steel Market Development in Japan 68 th OECD Steel Committee Paris May 6-7, 2010 The Japan Iron & Steel Federation 2 Macro-economic overview Steel Supply and Demand v v v Steel Production
FISCAL YEAR MARCH 2018 FIRST HALF FINANCIAL RESULTS
 FISCAL YEAR MARCH 2018 FIRST HALF FINANCIAL RESULTS PRESENTATION OUTLINE Highlights Fiscal Year March 2018 First Half Results Fiscal Year March 2018 Full Year Forecast Progress of Key Initiatives/ Business
Introduction of AVIC International
 Introduction of AVIC International Former China National Aero-Technology Import & Export Corporation (CATIC) reorganized to AVIC International Co. in 2009. CATIC was founded on Jan 21, 1979. State-owned
Global Monthly February 2018
 Global Monthly February 18 3 1-year Treasury yields 1-year breakeven inflation rate 1 1 15 16 17 18 February 18 5 3 Global GDP growth Composite PMI (RHS) Index 56 5 5 1 5 1 13 1 15 16 17 18 3..5. 1.5 1.
Japan s refining environment
 Japan s refining environment Platts Asian Refining Summit 3 March 2016, Singapore Yoshi Kobayashi The Institute of Energy Economics, Japan (IEEJ) Oil in Japan 2 Oil is the largest energy source for Japan
Regional Refining Outlook
 Regional Refining Outlook Implications for Crude Demand Platts Crude Summit 15 May 213 David Wech JBC Energy GmbH 13 th May 213 Research - Energy Studies - Consulting - Training Disclaimer All statements
RESULTS FOR Q ANALYST TELECONFERENCE
 RESULTS FOR Q4 216 ANALYST TELECONFERENCE Market 1 2 Operation Financials 3 Market 1 216 Fourth Quarter Market Conditions Product Market Crude Oil Postponed Maintenances Started to take place High Agricultural
Recent Developments in International Seaborne Trade and Maritime Transport
 Recent Developments in International Seaborne Trade and Maritime Transport IFSPA, Hong Kong, 3-5 June 2013 Dr. Vincent F. Valentine Officer-in-Charge, Transport Section Division on Technology and Logistics
FISCAL YEAR MARCH 2018 FIRST QUARTER FINANCIAL RESULTS
 FISCAL YEAR MARCH 2018 FIRST QUARTER FINANCIAL RESULTS PRESENTATION OUTLINE Highlights Fiscal Year March 2018 First Quarter Results Fiscal Year March 2018 Full Year Forecast Structural Reform Stage 2 Progress
HCM will expand the production capacity and sales support, such as dealer empowerment, etc. in Chinese market.
 1 2 For the market environment in FY 2010, the growth rate of GDP(yearon-year)and fixed asset investment are both doing well. Construction machinery market has been rapidly increasing. In FY2010, demand
Global Overview of Middle Distillates Supply and Demand ICE Market Forum Rotterdam, November 2012
 Global Overview of Middle Distillates Supply and Demand ICE Market Forum Rotterdam, November 2012 About Petromatrix Based in Switzerland (city of Zug) Publishes a daily newsletter on oil markets Mix of
Floating Production What s New In April
 Page 1 of 5 Floating Production What s New In April Jim McCaul IMAstudies Current Inventory 321 oil/gas floating production units are now in service, on order or available for reuse on another field. FPSOs
FISCAL YEAR MARCH 2015 FIRST HALF FINANCIAL RESULTS. New Mazda Demio
 FISCAL YEAR MARCH 2015 FIRST HALF FINANCIAL RESULTS New Mazda Demio Mazda Motor Corporation October 31, 2014 1 PRESENTATION OUTLINE Highlights Fiscal Year March 2015 First Half Results Fiscal Year March
FISCAL YEAR MARCH 2014 FINANCIAL RESULTS
 FISCAL YEAR MARCH 214 FINANCIAL RESULTS Mazda CX-5 Mazda Atenza Mazda Motor Corporation April 25, 214 New Mazda Axela 1 PRESENTATION OUTLINE Highlights Fiscal Year March 214 Results Fiscal Year March 215
Evolving Global Oil Trade Flows. IEA-IEF-OPEC Joint Meeting Vienna, March 2018
 Evolving Global Oil Trade Flows IEA-IEF-OPEC Joint Meeting Vienna, March 2018 SHIFTING FLOWS: WHAT HAS THIS MEANT IN PRACTICE? US/Europe crude imports & exports Saudi crude to Poland Chinese teapots importing
ENEL PUBLISHES 2018 SECOND QUARTER AND FIRST HALF GROUP OPERATING DATA REPORT
 Media Relations Investor Relations T +39 06 8305 5699 T +39 06 8305 7975 F +39 06 8305 3771 F +39 06 8305 7940 ufficiostampa@enel.com investor.relations@enel.com enel.com enel.com ENEL PUBLISHES 2018 SECOND
World Air Conditioner Demand by Region
 World Air Conditioner Demand by Region April 2015 The Japan Refrigeration and Air Conditioning Industry Association 1 World Air Conditioner Demand by Region April 2015 The Japan Refrigeration and Air Conditioning
FY2017 Results. February 26, 2018
 FY2017 Results February 26, 2018 Our background & development Registered capital increased to 12 MB Started International marine transportation ( Myanmar route ) Registered capital increased to 100 MB
Consolidated Financial Results for 1Q FY2016 July 29, 2016 Fuji Electric Co., Ltd.
 Consolidated Financial Results for 1Q FY2016 July 29, 2016 Fuji Electric Co., Ltd. 2016Fuji Electric Co., Ltd. All rights reserved. 1 Summary of Consolidated Financial Results for 1Q FY2016 (YoY Comparison)
Baoshan Iron & Steel Co., Ltd. August 2010
 Baoshan Iron & Steel Co., Ltd. August 2010 1 Disclaimer: The following presentation distributed herewith includes forwardlooking statements. All statements, other than statements of historical facts, that
ANALYST BRIEFING FOR THE THIRD QUARTER ENDED NOV 2016
 ANALYST BRIEFING FOR THE THIRD QUARTER ENDED 2016 21 NOV 2016 MSM Malaysia Holdings Berhad Analyst Briefing Q3 2016 21/11/2016 1 CONTENTS 01 02 03 04 05 Group Financial Highlights Performance Review Sugar
International Economic Outlook Impact on Global Shipping. International Propeller Club Convention Tampa, FL
 International Economic Outlook Impact on Global Shipping International Propeller Club Convention Tampa, FL Captain John W. Murray October 7, 2010 Hapag-Lloyd The Company Headquarters in Hamburg, Germany
9M 2003 Financial Results (US GAAP)
") 9M Financial Results (US GAAP) January 2004 LUKOIL Group Crude Oil Production* mln tonnes 82 80 78 76 74 72 70 68 66 64 Crude oil production 3.2 5.5 3.9 76.8 70.3 71.3 2001 Production by subsidiaries Share
9M Financial Results (US GAAP) January 2004 LUKOIL Group Crude Oil Production* mln tonnes 82 80 78 76 74 72 70 68 66 64 Crude oil production 3.2 5.5 3.9 76.8 70.3 71.3 2001 Production by subsidiaries Share
Midwest Association of Rail Shippers
 January 13, 2016 Midwest Association of Rail Shippers Lance Fritz Chairman and CEO Union Pacific 1 2015 Economic Results Consumer-driven growth 1 Consumer Spending 2 Light Vehicle Sales 3.6% 3.0% 3.0%
Petrobras. Nelson Silva Chief Strategy and Performance Officer April, 2017
 Petrobras Nelson Silva Chief Strategy and Performance Officer April, 2017 Agenda - Petrobras among the peers - Tracking the 2017-2021 Business and Management Plan (BMP) - Zero Base Budget - Risk Management
Global Polybutadiene Rubber (BR) Market Study ( )
 Market Study ( )") Global Polybutadiene Rubber (BR) Market Study (2014 2025) Table of Contents 1. INTRODUCTION 1.1. Introduction to Polybutadiene Rubber Market Product Description Properties Industry Structure Value Chain
Global Polybutadiene Rubber (BR) Market Study (2014 2025) Table of Contents 1. INTRODUCTION 1.1. Introduction to Polybutadiene Rubber Market Product Description Properties Industry Structure Value Chain
Toyota IMV Sales Reach Global 5 Million-unit Mark
 Apr. 06, 2012 Toyota IMV Sales Reach Global 5 Million-unit Mark Toyota City, Japan, April 6, 2012 Toyota Motor Corporation (TMC) announces that worldwide cumulative sales of its Innovative International
ORDERBOOK OBSERVER M A R C H
 ORDERBOOK OBSERVER M A R C H 2 1 7 Tanker Orderbook by Builder Country Rank Country No. Mn Dwt Mn CGT Tanker Orders by Size Segment Share (%) of Total 1 South Korea 18 25.5 5. 38.8% 2 China 159 21.1 4.3
1Q 2015 Business Result. May 2015
 1Q 2015 Business Result May 2015 Disclaimer The financial information in this document are consolidated earnings results based on K-IFRS. The previous earnings results have also been stated in compliance
Coal. 36 Reserves and prices 38 Production and consumption. 67 th edition
 Coal 36 Reserves and prices 38 Production and consumption 67 th edition Total proved reserves at end 217 Million tonnes Anthracite and bituminous Subbituminous and lignite US 228 3116 25916 24.2% 357 Canada
BP Statistical Review of World Energy June 2017
 BP Statistical Review of World Energy June 217 Primary energy 8 Consumption 8 Consumption by fuel 9 66 th edition Primary energy Consumption* Growth rate per annum Million tonnes oil equivalent 26 27 28
Emerging Trends in Petroleum Markets
 Emerging Trends in Petroleum Markets For Defense Logistics Agency, Worldwide Energy Conference Washington, D.C. By T. Mason Hamilton, Petroleum Markets Analyst U.S. Energy Information Administration Independent
Nissan Motor Co., Ltd. February 12 th, 2019
 Nissan Motor Co., Ltd. February 12 th, 2019 NET REVENUE 2,875.5 3,045.7 OPERATING PROFIT *1 NET INCOME 301.6 FREE CASH FLOW (AUTO) NET CASH (AUTO) 1,311.4 1,334.4 US TAX REFORM 207.7 82.4 103.3 93.9 *2
The Outlook for Energy: A View to 2040
 The Outlook for Energy: A View to 24 Dr. David Khemakhem Riyadh, Kingdom of Saudi Arabia March 25, 213 This presentation includes forward-looking statements. Actual future conditions (including economic
Marine Money Japan Ship Finance Forum
 Marine Money Japan Ship Finance Forum Current Situation in Shipbuilding -World and Japan- Masashi Terakado The Shipbuilders Association of Japan May 12th, 2016 Contents 1. Current Situation and Projection
4Q 2018 Review & Outlook
 4Q 2018 Review & Outlook Disclaimer This presentation material is prepared for investors reference, based on data that have not been filed with the financial supervisory commission. Actual business performance
1. Trends in the current fiscal year and previous fiscal year 3. Business overview 2. Secular trends in first quarter financial results
 FY2/19 (March 2018~May 2018) Fact Book 1. Trends in the current fiscal year and previous fiscal year 3. Business overview (1) Performance overview P. 1 (1) No. of students at the end of month P. 6 (2)
Months Investor Presentation
 2018 9 Months Investor Presentation 25.10.2018 Disclaimer Ereğli Demir Çelik Fabrikaları T.A.Ş. (Erdemir) may, when necessary, make written or verbal announcements about forward-looking information, expectations,
A perspective on the refining industry. Platts European Refining Summit Brussels, 29 September2016 Kristine Petrosyan, International Energy Agency
 A perspective on the refining industry Platts European Refining Summit Brussels, 29 September2016 Kristine Petrosyan, International Energy Agency OECD/IEA 2016 mb/d European refiners: busy 2015 OECD Europe
Primary energy. 8 Consumption 9 Consumption by fuel. 67 th edition
 Primary energy 8 Consumption 9 Consumption by fuel 67 th edition Primary energy Consumption* Growth rate per annum Million tonnes oil equivalent 27 28 29 2 211 212 213 214 215 216 217 217 26-16 Share 217
Kongsberg Automotive ASA. Fourth quarter February 28, 2019
 Kongsberg Automotive ASA Fourth quarter - February 28, 2019 Highlights Q4 Sales Revenues grew by 21 (7.3%) YoY to 288 including negative FX effects of 1. We booked new business with 77 in expected annual
WORLD CLASS through people, technology and dedication. KONGSBERG September 20,
 WORLD CLASS through people, technology and dedication KONGSBERG September 20, 2006 1 Kongsberg Maritime Offshore & Merchant Marine Focusing on core technologies building strong application knowledge sales
FY2/18 (March 2017~February 2018)
") FY2/18 (March 2017~February 2018) Fact Book 1. Trends in the current fiscal year and previous fiscal year 3. Business overview (1) Performance overview P. 1 (1) No. of students at the end of month P. 6
FY2/18 (March 2017~February 2018) Fact Book 1. Trends in the current fiscal year and previous fiscal year 3. Business overview (1) Performance overview P. 1 (1) No. of students at the end of month P. 6
Cosmo Oil Co., Ltd. Presentation on Results for First Quarter of Fiscal 2012 August 2, 2012 Director: Satoshi Miyamoto
 Cosmo Oil Co., Ltd. Presentation on Results for First Quarter of Fiscal 2012 August 2, 2012 Director: Satoshi Miyamoto Copyright 2012 COSMO OIL CO.,LTD. All Rights Reserved. Key Points of Financial Results
FISCAL YEAR MARCH 2018 THIRD QUARTER FINANCIAL RESULTS
 FISCAL YEAR MARCH 2018 THIRD QUARTER FINANCIAL RESULTS PRESENTATION OUTLINE Highlights Fiscal Year March 2018 Nine Month Results Fiscal Year March 2018 Full Year Forecast Progress of Key Initiatives 1
Press Release. Alstom s orders remained sound whilst sales are gradually recovering
 Press Release 19 January 2012 During the third quarter of 2011/12, Alstom s orders remained sound whilst sales are gradually recovering Over the third quarter 2011/12 (from 1 October to 31 December 2011),
2015 Annual Results Announcement
 China Petroleum & Chemical Corporation 2015 Annual Results Announcement March 30, 2016 Hong Kong Disclaimer This presentation and the presentation materials distributed herein include forward-looking statements.
Downstream & Chemicals
 Downstream & Chemicals Pierre Breber Executive Vice President Profitable downstream & chemicals portfolio Fuels refining & marketing Focused, regional optimization Petrochemicals Advantaged feed, scale
FISCAL YEAR MARCH 2014 FIRST HALF FINANCIAL RESULTS. New Mazda Axela (Overseas name: New Mazda3)
") FISCAL YEAR MARCH 2014 FIRST HALF FINANCIAL RESULTS New Mazda Axela (Overseas name: New Mazda3) Mazda Motor Corporation October 31, 2013 1 PRESENTATION OUTLINE Highlights Fiscal Year March 2014 First Half
FISCAL YEAR MARCH 2014 FIRST HALF FINANCIAL RESULTS New Mazda Axela (Overseas name: New Mazda3) Mazda Motor Corporation October 31, 2013 1 PRESENTATION OUTLINE Highlights Fiscal Year March 2014 First Half
Sinopec Corp. Q Results Announcement. 29 October 2010
 Sinopec Corp. Q3 2010 Results Announcement 29 October 2010 Disclaimer i As required by the CSRC, financial statements of the third quarter of Sinopec Corp. (the Company ) were prepared under PRC Accounting
Global Olefins Review
 Presented to: Asia Petrochemical Industry Conference Raw Materials Committee Meeting May 2, 24 Kuala Lumpur, Malaysia Mark Eramo Vice President Olefins & Elastomers meramo@cmaiglobal.com Agenda! Ethylene
FISCAL YEAR ENDED MARCH 2011 FINANCIAL RESULTS
 FISCAL YEAR ENDED MARCH 211 FINANCIAL RESULTS Mazda Motor Corporation April 28, 211 Mazda MINAGI 1 PRESENTATION OUTLINE Highlights Fiscal Year Ended March 211 Results In Summary Question & Answer Session
TOFAŞ RESULTS WEBCAST PRESENTATION
 TOFAŞ 31.12.2017 RESULTS WEBCAST PRESENTATION 02.02.2018 AGENDA Highlights Turkish Automotive Industry Production Domestic Market Developments Tofaş Domestic Market Performance Export Markets & Tofaş Performance
Recent Developments in EU Refining and in the Supply and Trade of Petroleum Products
 Recent Developments in EU Refining and in the Supply and Trade of Petroleum Products Second Meeting of the EU Refining Forum Brussels, 27 November 2013 Toril Bosoni, International Energy Agency OECD/IEA
Market Report Series Oil 2018
 Market Report Series Oil 218 Norwegian Ministry of Energy, 17 April 218 Neil Atkinson, Head of Oil Industry and Markets Division Toril Bosoni, Senior Oil Market Analyst, Oil Industry and Markets Division
FISCAL YEAR MARCH 2015 THIRD QUARTER FINANCIAL RESULTS. Updated Mazda CX-5 (Japanese specification model)
") FISCAL YEAR MARCH 2015 THIRD QUARTER FINANCIAL RESULTS Updated Mazda CX-5 (Japanese specification model) Mazda Motor Corporation February 4, 2015 1 PRESENTATION OUTLINE Highlights Fiscal Year March 2015
FISCAL YEAR MARCH 2015 THIRD QUARTER FINANCIAL RESULTS Updated Mazda CX-5 (Japanese specification model) Mazda Motor Corporation February 4, 2015 1 PRESENTATION OUTLINE Highlights Fiscal Year March 2015
2Q 2017 Review & Outlook
 2Q 2017 Review & Outlook Disclaimer This presentation material is prepared for investors reference, based on data that have not been filed with the financial supervisory commission. Actual business performance
Sustained growth Q results
 ABB LTD, ZURICH, SWITZERLAND, OCTOBER 25, 208 Sustained growth Q3 208 results Ulrich Spiesshofer, CEO; Timo Ihamuotila, CFO Important notices This presentation includes forward-looking information and
Formosa Petrochemical Corporation 2006 Q3 Financial Results
 Formosa Petrochemical Corporation 26 Q3 Financial Results November 26 Index Our Company 2 Financials 3 Refinery Division 4 Olefins Division 5 Capital Expansion 2 Our Company: Leading Private Integrated
1 Copyright(C) 2012 Isuzu Motors Limited All rights reserved
 2012 Isuzu Motors Limited All rights reserved") FY2012 Financial Results May 10, 2012 1 Copyright(C) 2012 Isuzu Motors Limited All rights reserved Contents Ⅰ. President and Representative Director : Susumu Hosoi FY2012 Overview Ⅱ. Director Director
FY2012 Financial Results May 10, 2012 1 Copyright(C) 2012 Isuzu Motors Limited All rights reserved Contents Ⅰ. President and Representative Director : Susumu Hosoi FY2012 Overview Ⅱ. Director Director
Downstream Petroleum Sector The Growing Prominence of Asian Refining
 Downstream Petroleum Sector The Growing Prominence of Asian Refining Mr. Fahad Al-Dihani Deputy CEO,MAA Refinery, Kuwait National Petroleum Company-Kuwait Outline.. Global refining trends Kuwait s Position
Supporting Material for Third Quarter Results 2012
 Supporting Material for Third Quarter Results 2012 31 October 2012 1 Notes This document contains forward-looking statements concerning the results of operations and businesses of. Forward-looking statements
OPEC PRIMARY ENERGY CONSUMPTION IN 2005 (1)
") CHAPTER 4 I n 1384, political tensions in the Middle East and some oil-producing countries, sabotage in Iraq s oil industry and speculation in the market raised oil prices incrementally. As of the beginning
CHAPTER 4 I n 1384, political tensions in the Middle East and some oil-producing countries, sabotage in Iraq s oil industry and speculation in the market raised oil prices incrementally. As of the beginning
KINGDOM OF CAMBODIA NATION RELIGION KING 3
 KINGDOM OF CAMBODIA NATION RELIGION KING 3 TOURISM STATISTICS REPORT October 2018 MINISTRY OF TOURISM Statistics and Tourism Information Department No. A3, Street 169, Sangkat Veal Vong, Khan 7 Makara,