HHI at a Glance. Financial Performance. Business Performance. Current Issues
|
|
|
- Christal Thomas
- 5 years ago
- Views:
Transcription
1 ( ) 1
2 Important Notice This presentation of Hyundai Heavy Industries (HHI) contains forward-looking statements relating to HHI s operations that are based on management s current expectations, estimates and projections. Words such as anticipates, expects, intends, plans, projects, schedules, estimates and similar expressions are intended to identify such forward-looking statements. These statements are not guarantees of future performance and are subject to certain risks, uncertainties, and other factors including new order flows, FX rates, steel plate prices and so on, some of which are beyond company s control and are difficult to predict. Therefore, actual outcomes and actual results may differ materially from what is expressed or forecasted in such forward-looking statements. The reader should not place undue reliance on these forwardlooking statements. HHI undertakes no obligation to update any forward-looking statements to reflect subsequent events. The financial information contained in this presentation has not been reviewed by outside auditors, and is subject to change as a result of the review process. 2
3 Contents HHI at a Glance Financial Performance Business Performance Current Issues 3
4 HHI at a Glance 4
5 Summary Date of Establishment : Date of Listing : No. of issued stocks: 76,000,000 stocks Paid-in Capital : KRW 380 bil. Market Value : KRW 6,672 bil. (As of December 30, 2015) Credit Rating : A2+ (Commercial Paper), A+ (Corporate Bond) Korea s large conglomerate ranking : 8th (Excluding public companies, based on total assets) No. of employees : 26,710 (Average 17.6 years of continuous service) No. of dry docks : 10 (Shipbuilding), 1 (Offshore & Engineering) Business Division : Shipbuilding, Offshore & Engineering, Industrial Plant & Engineering, Engine & Machinery, Electro Electric Systems, Construction Equipment, Green Energy, Refinery, Financial Services 5

6 History Establishment of Hyundai Shipbuilding & Heavy Industry Co., Ltd Establishment of Hyundai Mipo Dockyard Separation from Hyundai Group and foundation of HHI Group Acquisition of Samho Heavy Industries Co., Ltd Delivery of the world s first LNG-FSRU Recognition as the World s Significant Ship for 32 consecutive years Delivery of Korea s first LNG Carrier Launch of World s first ship built on the ground (105K DWT Crude Oil Carrier) Completion of the World s largest cylindrical FPSO 1970~ ~ ~ Listed on the Korean Stock Exchange Selected as a main contractor of the next Korean submarine builder Completion of the World s largest deep-sea FPSO (343K Tons) Completion of H-Dock, eligible for 1,000K Ton FPSO construction Acquisition of Hyudai Oilbank Co., Ltd. (70% of ownership and management) Completion of World s largest Saudi MARAFIQ power plant (2,750MW) Breakthrough the production of accumulating 9,000 HiMSEN Engines Delivery of 2,000 ships, for the first in the world Produced Eco-friendly Tier-III engine for the first in the world 6
 Delivery of Korea s first LNG Carrier (Jun.")
 Formation of the world record in production of 2-stroke marine engines (Sep.")
 Exxon (USA) 40,000 ton Completed World s largest Saudi MARAFIQ power plant (Apr.")
7 Business Highlights Delivery of 2,000 ships, for the first in the world (May, 2015) Delievery of World Largest Containership (Nov.2014) Delivery of Korea s first LNG Carrier (Jun. 1994) 125,000 m 3 Completion of World s largest cylindrical FPSO (Feb. 2015) Formation of the world record in production of 2-stroke marine engines (Sep. 2010) 100 million BHP Delivery of World s Biggest Jacket (May.1989) Exxon (USA) 40,000 ton Completed World s largest Saudi MARAFIQ power plant (Apr. 2011) Power generation of 2,750 MW Desalination of 176 MIGD Achievement of domestic record in production of Transformers(Feb. 2010) 600,000 MVA 7


8 Ownership Structure * As of Dec. 31, 2015 Chung Mong-joon 10.15% Others 48.16% Hyundai Mipo Dockyard 7.98% (Foreign Ownership : 9.82%) KCC 7.01% National Pension Service 5.33% Hyundai Motors 2.88% Asan Foundation 2.53% Treasury Shares 13.37% POSCO 1.94% Asan Nanum Foundation 0.65% 8
9 Business Structures Divisions Main Products Main Clients Competitors Capacity Shipbuilding VLCCs, Tankers, Product Carriers, Chemical Tankers Containerships, Bulk Carriers, OBO Carriers Ro-Pax Ships, Ro-Ro Ships, Pure Car and Truck Carriers LPG Carriers, LNG Carriers Drill Ships, Semi-Submersible Rigs Submarines, Destroyers, Frigates Hapag-Lloyd (DEU) C.P. Offen (DEU) CMA CGM (FRA) A.P. Moller (DEN) Seaspan (CAN) Enesel S.A. (GRC) DSME (KOR) SHI (KOR) 10 mil. GT Offshore & Engineering Floating Units : FPSO, FLNG, FPU, TLP, Semi Submersible Unit Fixed Platforms : Topsides Jacket & Pile, Jack-up, : Modules & Quarters Pipelines & Subsea Facilities, Land-based Modules Offshore Installations BP (GBR) Exxon Mobil (USA) Shell (USA) Chevron (USA) Total (FRA) ENI Norge (NOR) DSME (KOR) SHI (KOR) Technip (FRA) Saipem (ITA) Mc Dermott (USA) Floaters : 1~2 units Fixed Platform : 3~4 units Pipeline Laying : 30km Industrial Plant & Engineering Power Plants t : Combined-Cycle, Thermal Power Plants Process Units t : Oil and Gas Refinery, Tank Farm, GTL and LNG Facilities Plant Equipment : Industrial Boiler, HRSG, CFBF, Boiler, Regenerator and Reactor Shell (USA) MEW (KWT) SEC (SAU) Siemens (DEU) Hyundai E&C (KOR) Doosan Heavy (KOR) Samsung C&T Corp. (KOR) Power Plant : 1,000MW (4~5 PJTs) Engine & Machinery Marine Engines : 2-Stroke and 4-Stroke(HiMSEN) Engines, Components, Marine Propulsion & Equipment Industrial Machinery : Pump, Compressor Robot & Automation : Processor, Conveyor System, Robot HMD (KOR) DSME (KOR) SHI (KOR) Shanghai (CHN) Doosan (KOR) STX (KOR) Mitsui (JPN) Hudong Dalian (CHN) Large Engines (500 units) : 18 mil. BHP Medium (1,800 units) : 5 mil. BHP Electro Electric Systems Transformers, Gas Insulated Switchgear, Switchgear Low- and Medium-Voltage Circuit Breakers Rotating Machinery Power Electronics and Control Systems, Wind Power Systems Aramco (SAU) KEOCI (KOR) DSME (KOR) Daelim (KOR) ABB (SWE) Siemens (DEU) Hyosung (KOR) Transformer (620 units) : 121,400 MVA Wind Turbine : 600MW Construction Equipment Excavator Wheel Loader, Skid Loader Forklift Komatsu (JPN) Caterpillar (USA) Doosan Infracore (KOR) 42,900 units (Excavator 26,200 units) Green Energy Solar Power Systems LG, Hanwha (KOR) SolarWorld (GER) Solar Cell/Module : 600MW Refinery Petroleum : LPG, Gasoline, Kerosene, Jet Fuel Petrochemicals : Propylene, Alkylate, BTX, Naphtha SK Innovation (KOR) GS-Caltex (KOR) S-Oil (KOR) 390,000 B/D Financial Services Securities Brokerage Asset Management, Leasing Futures Corporate Finance 9


 0.7% 9.")


 Electro Electric Systems")
10 Sales Breakdown 27.8% Financial Services (KRW 1,039.4 bil) Other (KRW bill) 2.2% 0.4% * 2015 Preliminary results in consolidated basis 36.1% Refinery (KRW 12,831.8 bil.) Shipbuilding (KRW 16,672.6 bil) 0.7% 9.7% Green Energy (KRW 3,303 bil) Offshore & Engineering (KRW 4,466 bill) 5.4% 3.8% 9.1% 4.8% Construction Equipment (KRW 2,225.1 bil) Electro Electric Systems (KRW 2,507.3 bil) Engine & Machinery (KRW 1,776.6 bil) Industrial Plant & Engineering (KRW 4,186.4 bil) 10

11 Affiliates 27 affiliated companies in Hyundai Heavy Industries Group (Including HHI, excluding overseas corporations) 11

12 Global Network Established 15 overseas offices and 28 incorporated firms, a total of 43 global network. As of the end of 2015 [Europe] Oslo London Netherlands Germany Moscow Belgium VGF France Hungary Bulgaria Nigeria Athens Ruwanda Kuwait Riyadh Al Khobar Dubai, Jebel Ali India [Middle East / Africa] Beijing Tai an, Yantai, Weihai Jakarta Singapore M-Agro, K-Agro Tokyo Osaka [Asia] Jiangso, Yangzhong, Shangdong HHI China Investment Co., Ltd. Hyundai Financial Leasing Co., Ltd. HHI Shanghai R&D Co., Ltd. New Jersey Hyundai Ideal Electric Co. Alabama Houston Atlanta Oversea Office (15) Production /Sales [America] (14) Sales (4) Construction (4) Agriculture (2) R&D (2) Management (2) Region Europe America Asia Mid. East / Africa Total Brazil Oversea Office Incorporated Firm Total
13 Financial Performance 13
14 Quarterly Operating Income Margin (Consolidated) Recorded KRW 3.2 til. of operating loss in 2014 reflecting KRW 1.6 tril. of provision mostly for three semi-submersible rigs, two power plant projects and offshore production facilities. Recorded KRW 1.5 tril. of operating loss in 2015 reflecting KRW 396 bil. of loss due to cancellation of two semi-submersible rigs and 1.3 tril. of loss from offshore production facilities % 13.47% 10.00% 7.69% 6.99% 6.05% 7.07% 5.00% 2.64% 4.55% 2.87% 2.21% 1.69% 0.00% 0.41% -0.59% -1.40% -0.16% -1.57% -1.43% -2.51% -5.00% % -8.62% -8.22% % % % 14
15 Financial Summary (Consolidated) Sales (in billion KRW) Operating Profit (in billion KRW) 60,000 50,000 40,000 30,000 20,000 10, , , , , ,231.7 '11 '12 '13 '14 '15 6,000 4,000 2, ,000-4,000 15% 8.5% 10% 3.6% 1.5% 4, % 2,006-3,250-1,540 0% '11 '12 '13 '14 '15-5% -3.3% -6.2% -10% Operating Profit(Left) OP Margin(Right) Liabilities to Equity Ratio Debt to Equity Ratio 40,000 30,000 20,000 10, % 162.9% 30,824 30, % 220.8% 220.9% 34,175 36,746 34, % 200% 150% 100% 50% 20,000 15,000 10,000 5, % 11, % 108.7% 79.1% 83.3% 14,827 15,843 16,543 16, % 100% 50% 0 '11 '12 '13 '14 '15 0% 0 '11 '12 '13 '14 '15 0% Liabilities(Left) Liabilities to Equity(Right) Debt(Left) Debt to Equity Ratio(Right) 15
16 Financial Summary (Consolidated) (Unit: Bil. KRW) Sales Operating Profit 53, % 54, % 54, % 52, % 46, % 4, % 2, % % (3,249.5) -6.2% (1,540.1) -3.3% Shipbuilding 2, % 1, % % (1,895.9) -11.5% (648.3) -3.9% Offshore % % % (230.3) -4.9% (1,294.5) -29.0% Industrial Plant % % % (1,130.8) -46.9% (76.3) -1.8% Engine & Machinery % % % (10.9) -0.7% % Electro Electric Systems % (74.3) -2.6% % % % Construction Equip % % % (33.4) -1.2% (116.2) -5.2% Green Energy (175.0) -46.0% (106.3) -31.5% (103.2) -32.8% (16.5) -5.3% % Refinery % % % % % Finance % % % % % Othres (304.3) - (314.6) - (293.2) - (282.7) - (313.4) - Net Income 2, % 1, % % (2,206.1) -4.2% (1,363.2) -2.9% 16
17 Financial Summary (Consolidated) (Unit: Bil. KRW) Total Assets 49, , , , ,732.8 Current Assets 23, , , , ,174.5 Cash & Cash Equivalents 1, , , , ,105.3 Non-Current Assets 25, , , , ,558.3 Total Liabilities 30, , , , ,233.8 Current Liabilities 25, , , , ,060.6 Non-Current Liabilities 5, , , , ,173.2 Total Shareholder's Equity Liabilities-to-Equity Ratio Debt-to-Equipty Ratio 18, , , , , % 162.9% 179.6% 220.8% 220.9% 60.8% 79.1% 83.3% 99.4% 108.7% Total Debt 11, , , , ,
18 Business Performance 18
19 New Orders Trend 30,000 25,000 20,000 15,000 10,000 5, ,400 5,777 9,817 3,025 16,107 13,405 7,835 4,917 18,706 7,236 11,470 4,357 2,968 8,488 8,272 6,792 9,290 13,838 15,730 13,635 13,147 10,291 4,061 2,043 2, ,473 27,363 25,020 25, % YoY 17,208 10,735 19,567 19,834 19,495 14,419 17,851 13,424 13,642 (Unit: Mil. USD) 14,538 11,027 8,554 10,905 9,512 8,468 6,143 6,192 5,984 '01 '02 '03 '04 '05 '06 '07 '08 '09 '10 '11 '12 '13 '14 '15 '16 (Target) Shipbuilding Non-shipbuilding 19
20 2016 Orders & Backlog by Division (Non-Consolidated) (Unit: Mil USD) New Orders Backlog Target Jan. Achiement Target Annual Jan. Jan. Shipbuilding 8, % 8,350 5, ,566 Offshore & Engineering 3, % 5,300 1, ,325 Industrial Plant & Engineering 1, % 1,650 1, ,950 Engine & Machinery 2, % 2,571 1, ,229 Electro Electric Systems 2, % 2,445 1, ,964 Construction Equipment 1, % 2,298 1, Green Energy % Total 19, % 22,950 14, ,070 (*Backlog above is on delivery basis) 20


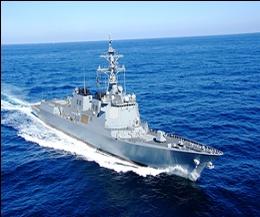
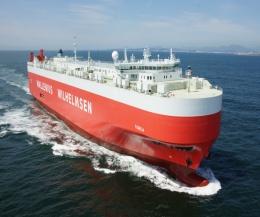

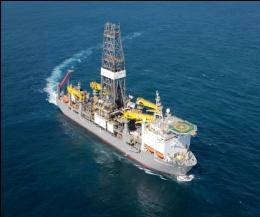


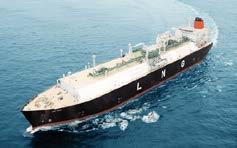
21 Shipbuilding VLCC Containership Bulker LNGC LPGC Car Carrier Naval Ship Drill ship Semi-Rig 21
22 World shipbuilding Market share Shipbuilding <Output in 2015> Rank Shipbuilder Output in 2015 Market Share (No. of Vessels) (1,000 CGT) (%) 1 Hyundai Heavy Industries(KOR) 64 2, % 2 Hyundai Mipo Dockyard(KOR) 81 1, % 3 Samsung Heavy Industries(KOR) 32 1, % 4 Daewoo Shipbuilding & Marine Engineering(KOR) 30 1, % 5 Hyundai Samho Heavy Industries(KOR) 35 1, % 6 Dalian Shipbuilding(CHN) % 7 Jiangsu New YZJ(CHN) % 8 Imabari Shipguilding(JPN) % 9 Shanghai Waigaoqiao(CHN) % 10 Japanese Marine United(JPN) % Rest 1,454 23, % Total 1,842 36, % HHI Group 180 6, % (Source : Clarkson) 22
23 Demand Shipbuilding Global Demand (Unit : Mil. GT) New Orders by ship type (Unit: Mil. GT) '07 '08 '09 '10 '11 '12 '13 '14 '15 Jan. Jan Bulkers Tankers Containers LNGC's LPGC's Others '15 '16 Bulkers Tankers Containers LNGC's LPGC's Others Jan Jan <Global Demand> (Unit: Mil. GT) '07 '08 '09 '10 '11 '12 '13 '14 '15 YoY '15.1 '16.1 YoY Total % % Bulkers % Tankers % % Containers % % LNGC % % LPGC % Others % % * Others : Offshore, Cruise vessels, Ro-Ro ferries, MPP, Reefers, PCC (Source : Clarkson) 23
24 Competition Shipbuilding <Market Share of Global Demand> (Unit: Mil. GT) Region '11 Jan. '12 '13 '14 '15 (%) (%) (%) (%) (%) '16 (%) Korea China Japan Others Total Global Market Share (%) Backlog (Jan. 2016) (Unit: Mil. GT) Korea China Japan Tanker Bulk LNGC LPGC Containership Offshore * Source : Clarkson Korea China Japan 24
25 Price Trend Shipbuilding Capesize180K dwt (Left) VLCC 320K dwt (Left) Containership 13,000 teu(left) LPG carrier 78-84K m3 (Left) 0 '07 '08 '09 '10 '11 '12 '13 '14 '15 '16 0 LNG carrier 160K m3 (Right) <Price Trend> '07 '08 '09 '10 '11 '12 '13 '14 '15 YoY '16.1 (Unit: Mil USD) Since 15/12/31 Clarkson Index % % Bulker(180K) % % Tanker(320K) % % Containership (13,000TEU) % % LPGC(82Km3 ) % % LNGC(160K m3 ) % % * Index=100 in year 1988 (Source: Clarkson) 25

26 Overview Shipbuilding Sales Contribution(2015) Sales Breakdown by Product (2015) Container Shipbuilding 36% 8% 3% 5% 25% 4% 19% 14% 4% Tanker Drillship LNGC LPGC Semi-Rig Bulk Carrier * Non-Consolidated basis 19% Naval Others 20,000 15,000 10,000 5,000 0 Annual Sales & New Orders (Unit : sales - bil. KRW, New order mil. USD) 15,730 13,635 11,470 10,905 9,084 9,003 9,487 9,766 10,159 9,349 9,512 8,736 7,557 7,849 6,443 6,143 6,192 5,984 4, Sales New Orders Non-Consolidated basis, 2005 ~ 2009 sales are based on K-GAAP. Main Products VLCCs, Tankers, Product Carriers, Chemical Tankers Containerships, Bulk Carriers, OBO Carriers Ro-Pax Ships, Ro-Ro Ships, Pure Car and Truck Carriers LNG Carriers, LPG Carriers Drillships, Semi-Submersible Rigs Submarines, Destroyers, Frigates Operational Highlights * Non-Consolidated basis Completion of Gunsan Shipyard (Mar. 2010) Investment & Technical Corporation Agreement with OSX (May 2010) 10% of stake in OSX(USD 61.9 mil.) in exchange for technical advise for establishment of a shipyard Delivery of first drillship (Sept. 2010) Delivery of 1,700 th vessel (Jan. 2011) Recorded delivery of 100 million GT in ships (Mar. 2011) Delivery of the World s first LNG-FSRU (Feb. 2014) 26
27 Performance Shipbuilding New Orders by Shiptype (2015) Backlog by Shiptype (2015) 10.1% 18.2% 9.4% 29.3% 33.0% Tanker Containership LNGC LPGC Others 17.5% 23.4% 3.7% 1.3% 16.4% 12.3% 25.3% Tanker Containership LNGC LPGC Bulk Semi-Rig Naval & Others Backlogs as of Dec. 2015(YTD) : 141 vessels, USD 16.8 bil. Based on the amount Based on the delivery amount New Orders in 2015 (in million USD) # of ships 2014 Jan. Feb. Mar. Apr. May. Jun. Jul. Aug. Sep. Oct. Nov. Dec. Total Target Achievement Amount 6, , , ,984 8, % Details - 25 Tankers (1,973) - 15 Containershps (1,753) - 2 LNGC (564) - 15 LPGC (1,087) - 3 Others (606) 27
28 Performance Shipbuilding New Orders by shiptype (Feb. 2016) Backlog by shiptype (Jan. 2016) LPGC 18.8% 4.0% 1.0% 23.6% Tanker Containership LNGC LPGC 15.8% 12.2% Bulk Semi-Rig 100.0% 24.5% Naval & Others Based on the amount Backlog as of Jan (YTD) : 130 vessels, USD 15.6 bil. Based on the delivery amount New Orders in 2016 (in million USD) 2015 Jan. Feb. Mar. Apr. May. Jun. Jul. Aug. Sep. Oct. Nov. Dec. Total Target Achievement Details # of ships LPGC (76) Amount 5, , % 28
29 Delivery Shipbuilding Annual Delivery (Mil. GT) Annual Delivery (number of vessels) Gunsan Offshore Ulsan Ulsan Offshore (on-ground building) Gunsan '07 '08 '09 '10 '11 '12 '13 '14 '15 Total # of Ship


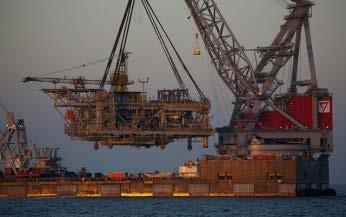
30 Offshore & Engineering FPSO Fixed Platform Modules Installation Subsea Pipelines 30
31 Overview Offshore & Engineering Sales Contribution (2015) Sales Breakdown by Product (2015) Offshore & Engineering 18% Subsea Pipeline 11% Fixed Platforms& Floaters 93% * Non-Consolidated basis * Non-Consolidated basis 7,000 6,000 5,000 4,000 3,000 2,000 1,000 0 Annual Sales & New Orders (Unit : sales - bil. KRW, New order mil. USD) 6,503 6,005 4,480 4,373 4,753 4,653 4,467 3,729 3,423 3,413 3,0952,978 3,069 2,222 1,997 2,352 2,072 1,935 1,572 1, Sales New Orders Non-Consolidated basis, 2005 ~ 2009 sales are based on K-GAAP. Main Products Floating Units: FPSOs, FLNGs, FPUs, TLPs, Semi Submersible Units Fixed Platforms: Topsides, Jackets & Piles, Jack-ups, Modules & Quarters Pipelines & Subsea Facilities: Subsea Pipelines Offshore Installations: Platforms, Pipelines Land-Based Modules Operational Highlights Received USD 1.1 bil. of Goliat FPSO order (Feb. 2010) Received USD 0.9 bil. of Barzan offshore platform order (Jan. 2011) Received USD 1.2 bil. of BP Q204 FPSO order (Feb. 2011) Received USD 0.6 bil. of BP Clair Ridge platform order (Mar. 2011) Received USD 1.1 bil. of Aasta Hansteen Topside order (Jan. 2013) Received USD 1.9 bil. of Moho Nord TLP & FPU order (Mar. 2013) Received USD 1.9 bil. of Rosebank FPSO order (Apr. 2013) 31
 New Orders by Type ($ mil.) 2009 2010 2011 2012 2013 2014 2015 Jan.")
 Myanmar SHWE Field development project (Feb.")
 Fixed Type Total number of projects Platforms 87 Onshore Facilities 11 Jack-up rig 3 Major Projects SHWE Platform (Daewoo Inter, 2013) (1976 ~ present) Sakhalin-1")
 - Cylindrical Floating Production Storage Offloading unit ($1.1 bil.")
32 Performance Offshore & Engineering Major Projects in 2009/2010 (Delivered) Gorgon LNG (Oct. 2009) - LNG processing modules fabrication ($2.1 bil. from Chevron) New Orders by Type ($ mil.) Jan. 16 Fixed 2,188 1,501 2,121 1, , Floating 47 1,303 1, ,735 1, Subsea Pipeline Others Total 2,352 3,069 4,480 2,072 6,503 6,005 1, Performance Record (1976~Present) Myanmar SHWE Field development project (Feb. 2010) - Installation of gas production & processing platform, pipeline & onshore terminal ($1.4 bil. from Daewoo International Corp.) Fixed Type Total number of projects Platforms 87 Onshore Facilities 11 Jack-up rig 3 Major Projects SHWE Platform (Daewoo Inter, 2013) (1976 ~ present) Sakhalin-1 OPF Onshore Modules Fabrication(ExxonMobil, 2006) Harsh Environment Jack-up Rig 2nd (A.P.Moller, 2004) Semi-submersible Drilling Rig 10 Deepwater Horizon Semi- Submersible Drilling Unit (R & B Falcon, 2000) Goliat FPSO (Feb. 2010) - Cylindrical Floating Production Storage Offloading unit ($1.1 bil. from ENI Norge AS) Floating FPSO 12 Usan FPSO (TOTAL, 2012) TLP 2 West Seno Field Development (Chevron, 2003) FPU 5 Moho Bilondo FPU (TOTAL, 2008) Subsea Pipelines 5,452 km Barzan Offshore Project (RasGas, 2013) 32
 UK, Q204 FPSO (Delivered) UK, Clair Ridge Platform - Date : Jan.")
 - Date : Feb. 2011 - Price : USD 1.")

33 Performance Offshore & Engineering Major Projects Awarded in 2011 Qatar, Barzan Offshore Project (Delivered) UK, Q204 FPSO (Delivered) UK, Clair Ridge Platform - Date : Jan Price : USD 860 million - Owner : RasGas Company - Details : Fabrication and Installation of Wellhead Platforms, Living Quarters, Onshore & Offshore pipeline (EPC) - Date : Feb Price : USD 1.2 billion - Owner : BP - Details : Construction of FPSO (EPC), Processing 0.32 million bpd, storing 0.8 million bbls - Date : Mar Price : USD 620 million - Owner : BP - Details : Fabrication and Installation of Drilling and Quarters Platforms (EPC) 33


 Processing")
34 Performance Offshore & Engineering Major Projects Awarded in 2013 Norway, Aasta Hansteen Spar Topside Congo, Moho Nord TLP & FPU UK, Rosebank FPSO TLP (Tension Leg Platform) FPU (Floating Production Unit) - Date : Jan Price : USD 1.1 billion - Owner : Statoil - Details : Fabrication and Installation of Spar Topsides (EPC) - Date : Mar Price : USD 1.9 billion - Owner : Total - Details : Fabrication and Installation of Tension Leg Platform and Floating Production Unit (EPC) - Date : Apr Price : USD 1.9 billion - Owner : Chevron - Details : Construction of FPSO (EPC) Processing 100,000 BOPD (Oil), 190 MMSCFD (Gas), storing 1.05 million bbls 34


 Russia, Odoptu Stage 2 Project Abu Dhabi,")


35 Performance Offshore & Engineering Major Projects Awarded in 2014 Indonesia, Jangkrik FPU Malaysia, Bergading Project - Date : Feb Price : USD 250 million - Owner : Eni Muara Bakau B.V. - Details : Hull/LQ (EPC) - Date : May Price : USD 700 million - Owner : Hess E&P Malaysia - Details : Central Processing Platform, Wellhead Platform, Bridge (EPCIC) Russia, Odoptu Stage 2 Project Abu Dhabi, NASR Package 2 - Date : Jun Price : USD 270 million - Owner : Exxon Neftegas Limited - Details : Onshore Modules (EPC) Umm Lulu Nasr Field - Date : Jul Price : USD 1.9 billion - Owner : Abu Dhabi Marine Operating Company - Details : Offshore Super Complex Platforms & Power Distribution Platform (EPCI) 35


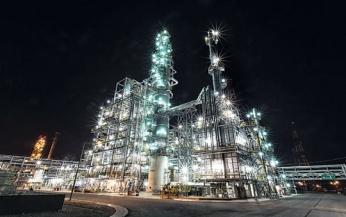
36 Industrial Plant & Engineering Combined Cycle Power Plant Co-generation Power Plant Thermal Power Plant Oil & Gas Process Plant RFCC Plant Equipment 36


37 Overview Industrial Plant & Engineering Sales Contribution (2015) Sales Breakdown by Product (2015) Industrial Plant & Engineering 17% Oil & Gas 8% Plant Equipments 6% Power Plant 87% * Non-Consolidated basis * Non-Consolidated basis 5,000 4,000 3,000 2,000 1,000 0 Annual Sales & New Orders 2,076 1,898 1,544 1,374 1, (Unit : sales - bil. KRW, New order mil. USD) 2,826 2,645 2,761 2,010 1,014 1,480 4,077 1,259 4,396 2,429 4,174 1,256 1, Sales New Orders Non-Consolidated basis, 2005 ~ 2009 sales are based on K-GAAP. Main Products Power Plants Combined-Cycle, Cogeneration, and Thermal Power Plants Process Plants Oil and Gas, Refinery, Tank Farm, GTL, and LNG Facilities Plant Equipments Industrial Boiler, HRSG(Heat Recovery Steam Generator), CFBC(Circulating Fluidized Bed Combustor) Boiler, Regenerator & Reactor Operational Highlights Received a USD 1.0 bil. Das Island order (Jul. 2009) Received a USD 2.6 bil. Sabiya order (Sept. 2009) Signed an MOU for supplying ITER vacuum vessel (Jan. 2010) Received a USD 1.6 bil. Riyadh order (Jun. 2010) Received a USD 3.2 bil. Jeddah South order (Oct. 2012) Received a USD 3.3 bil. Shuqaiq order (Aug. 2013) Received a USD 1.1 bil. NRP order (Oct. 2015) 37
 Project (ADGAS, UAE, 2013) Escravos Gas Plant Phase Ⅲ (Chevron Nigeria Ltd.")
 HCP No.")
38 Performance Industrial Plant & Engineering Performance Record (1976~Present) New Orders by Type Project Type Major Projects (Mil. USD) Jan.16 Oil & Gas Oil & Gas Tank Farm Refinery & Petrochemical Integrated Gas Development (IGD) Project (ADGAS, UAE, 2013) Escravos Gas Plant Phase Ⅲ (Chevron Nigeria Ltd., Nigeria, 2010) Bonny Terminal Integrated Project (Shell Petroleum Development, Nigeria, 2008) KOC Crude Oil Export Facilities Project (Kuwait Oil Company, 2008) JPR Zarpa Tank Farm Project (Jordan Petroleum Company, 2000) HCP No.2 BTX Project Daesan (HC Petrochem, Korea, 2013) Mumbai Diesel Hydro-Desulfurization Project (Hindustan Petroleum Company, India, 2000) HPC 2nd Petrochemical Complex Project (Hyundai Oilbank, 1997) Gas to Liquid Pearl GTL Feed Gas Preparation Project (Qatar Shell, 2011) Combined Cycle/ Simple Cycle Power Plant Power Plant Cogeneration Power Plant Thermal Power Plant Desalination Plant Riyadh PP 11 Independent Power Project (Dhuruma Electricity Company, Saudi Arabia, 2013) Sabiya Combined Cycle Gas Turbine Project (Ministry of Electricity and Water, Kuwait, 2013) Al Dur Independent Water and Power Project (Al Dur Power & Water Co., Bahrain, 2012) Marafiq Independent Water and Power Project (Jubail Water and Power Company, Saudi Arabia, 2010) Shaybah Power Generation Project (Saudi Aramco, Saudi Arabia, 2008) Saudi Aramco 3rd party Cogeneration Program (Tihama Power Company, Saudi Arabia, 2006) Namjeju #3&4 Thermal Power Plant (KEPCO, Korea, 2007) Makkah-Taif Thermal Power Plant (Saline Water Conversion Corporation, Saudi Arabia, 1989) Power Plants 1,412 1, ,510 4, Chemical Plants /Plant Equip. 1, , ,250 1,253 1 Total 2,826 2,010 1,014 4,077 4,396 1,256 1,258 1 Major Projects in 2012/2013/2014 /2015 Jeddah South (Oct. 2012) Shuqaiq Power Plant (Aug. 2013) Clean Fuel Project (Apr. 2014) bil. USD / Saudi Electricity Company, Saudi Arabia - 2,400MW Oil fired Conventional Power Plant bil. USD / Saudi Electricity Company, Saudi Arabia - 2,640MW Oil fired Conventional Power Plant bil. USD / Kuwait National Petroleum Company, Kuwait - Upgrade and expansion of Refinery Taweelah A1 (ADWEA, UAE, 2002) Taweelah B (ADWEA, UAE, 1995) Umm Al Nar West (ADWEA, UAE, 1982) Al Khobar Phase 2 (SWCC, Saudi Arabia,1981) Zor Refinery Project (Oct. 2015) bil. USD / Kuwait National Petroleum Company, Kuwait - Refinery power plant 38 Package 2(Ancillary process), package 3(Utilities & Offsite facilities)


39 Engine & Machinery Marine Engine Marine Propeller Power Plant Engine Industrial Machinery Robotics 39

40 Overview Engine & Machinery Sales Contribution (2015) Sales Breakdown by Product (2015) Engine & Machinery 10% Hydraulic Machinery 7% Power Plant Engine 6% Robotics 9% Marine Engine 78% * Non-Consolidated basis * Non-Consolidated basis 5,000 4,000 3,000 2,000 1,000 0 Annual Sales & New Orders (Unit : sales - bil. KRW, New order mil. USD) 4,646 3,248 3,176 2,772 2,835 3,096 2,967 2,522 2,283 2,313 2,425 2,441 2,110 1,880 1,858 1,646 1,9961,860 1,220 1, Sales New Orders Non-Consolidated basis, 2005 ~ 2009 sales are based on K-GAAP. Main Products & Capacity Two-Stroke Diesel Engines (500 units, 18 mil. BHP) Four-Stroke(HiMSEN) Engines (1,800 units, 5 mil. BHP) Diesel and Gas Power Plant Engines Propellers and Crankshafts Steam Turbines and Turbochargers Industrial and Marine Pumps, Industrial Robots, Side Thrusters Presses, Conveyor Systems, and Steel Strip Process Lines Operational Highlights Surpassed cumulative four-stroke engine production of 20 mil. bhp (Mar. 2010) Production of eco-friendly marine engine meeting new IMO standards (Mar. 2010) Received a 95MW PPS order from Venezuela (Apr. 2010) Received a 75MW diesel power plant order from Bangladesh (Apr. 2010) Development of high output eco-friendly gas engine (May 2010) - 20% reduction of CO 2 emission and 97% reduction of NO X emission Surpassed cumulative two-stroke engine production of 100 mil. bhp (Sept. 2010) Production of 1,000 th Packaged Power Station (Jul. 2012) 40
41 Performance Engine & Machinery Major Projects Diesel Power Plants order from Bangladesh (Apr. 2010) - USD 70 mil. order for 70 MW Diesel Power Plants from Bangladesh Power Development Board (BPDB) PPS order from Venezuela (Apr. 2010) - USD 160 mil. order for 204 MW, 120 Packaged Power Stations from electricity company Electricidad de Caracas, Venezuela Diesel Power Plants order from Ecuador (May 2011) - USD 74 mil. order for 140 MW Diesel Power Plants from Equitatis, Equador PPS order from JINRO, Panama (Jun. 2015) - USD 32 mil., order for 57MW, 34 Packaged Power Station from JINRO, Panama Market Share in 2014 (%) Large-sized Marine Engine Mid-sized Marine Engine Diesel Power Plant Domestic Global New Orders by Region (%) Domestic China Others Eco-friendly Engine Products Eco-friendly Diesel Engine - 15% 3eduction of NOx emission meeting new IMO standards 55.9% 51.2% 55.4% 28.0% 15.3% High output Eco-friendly HiMSEN Gas Engine - 20% reduction of CO2 emission compared to disel engine - 97% reduction of NOx emission to reach the world s lowest level of 50ppm - 47% improvement in engine performance 13.1% 10.9% 7.9% 56.7% 33.2% 35.7% 36.8% '12 '13 '14 '15 41


42 Electro Electric Systems Transformer Circuit Breaker Switchgear Rotating Machinery Wind Power 42

, Gas Insulated switchgear(25.")
43 Overview Electro Electric Systems Sales Contribution (2015) Sales Breakdown by Product (2015) Others 9% Electro Electric Systems 10% Rotating Machinery 20% Transformer 28% Switchgear High Voltage 17% Circuit Low Voltage Breaker Circuit 18% * Non-Consolidated basis Breaker 6% * Non-Consolidated basis 4,000 3,000 2,000 1,000 0 Annual Sales & New Orders (Unit : sales - bil. KRW, New order mil. USD) 3,793 3,242 2,712 2,843 2,625 2,281 2,556 2,609 2,319 2,241 2,354 2,318 1,925 1,766 1,820 2,0061,873 1,453 1,274 1, Sales New Orders Non-Consolidated basis, 2005 ~ 2009 sales are based on K-GAAP. Main Products Transformers (up to 765kV, 1,300MVA), Gas Insulated switchgear(25.8kv~800kv), Low voltage Switchgear Low and Medium Voltage Circuit Breakers Rotating Machinery Power Electronics and Control Systems Operational Highlights Awarded Asia-Pacific Power Transmission Equipment Company of the Year by Frost & Sullivan (Aug. 2009) Received USD 0.25 bil. transformer order from South Africa (Nov. 2009) Received USD 0.6 bil. transformer order from the US (May 2010) Reached the transformer production milestone of 700,000MVA (Dec. 2010) Received 1,000 GIS order from Russia (Jun. 2011) 43
44 Performance Electo Electric Systems Major performance US transformer long-term supply contract (May 2010) - USD 600 mil. Order for supplying transformers ranging from 230kV to 500kV to Southern California Edison(SCE) for 10 years from 2010 to Largest transformer order to date Project Type Generator Installation Power Transmission & Mutation Installation Major Projects West Generating Project (USA) Major Projects British Columbia Hydro & Power Authority (Canada) Sales by Region (%) Domestic America Asia Europe Mid. East Others '09 '10 '11 '12 '13 '14 '15 09 년 sales is based on K-GAAP. The sales of Green Energy division is no included since 11. The sales from wind power sales has been included since 15. Iron Manufacture Installation Water Treatment, Cement & Petrochemical Installation Automotive Goods Marine Goods Ocean Installation Marine Steam Turbine Know-how Export Fresh Water Installation Nueva Ventanas 240MW Coal Fired Power Project (Chile) KODECO IKC Project (Indonesia) Seoul Metro (South Korea) Royal Nedlloyd Group (Netherlands) Al-Jubail Saline Water Conversion (Saudi Arabia) Hyundai Merchant Marine LNGC 22,000MW Marine Steam Turbine (South Korea) Gas Insulated Switchgear : Tatung Company (Taiwan) Shuweihat S2 IWPP Project (UAE) 44
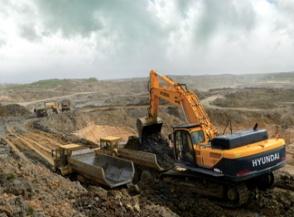
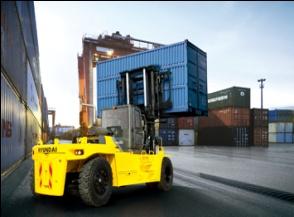


45 Construction Equipment Small Excavator Mid Excavator Electric Excavator Forklift Wheel Loader Skid Loader Roller 45

46 Overview Construction Equipment Sales Contribution (2015) Sales Breakdown by Product (2015) Construction Equipment 8% CKD 6% Others 10% Skid Loader 1% Wheel Loader 9% Excavator 56% Folk Lift * Non-Consolidated basis * Non-Consolidated basis 20% Annual Sales (Unit : sales - bil. KRW) 3,500 3,000 3,052 3,120 2,723 2,500 2,275 2,215 1,769 1,844 2,000 1,512 1,500 1,198 1,190 1, Non-Consolidated basis, 2005 ~ 2009 sales are based on K-GAAP. Main Products Excavators (Local 16,000 units, China 18,874 units, India 1,800 units) Wheel Loaders (2,900 units) Forklifts (9,500 units) Skid Loaders (600 units) Operational Highlights Introduction of Hi-Mate remote management system (May 2009) 9-series excavators recognized at Korea s Pin-up Design Awards (Dec. 2009) Introduction of new 9-series wheel loader (May 2010) Breaking ground for wheel loader factory in China (Jul. 2010) Introduction of 120-ton excavator (Apr. 2011) Production of 350,000 th construction equipment (Oct. 2011) 46

47 Performance Construction Equipment Excavators Sales in China Excavator Sales in China 200, , ,000 80,000 40, ,767 8,377 Market size(left) HHI(Right) 162, ,182 93,237 10,101 18, , ,908 17,294 8,540 7,532 84,573 3,743 49,009 1,889 2, '08 '09 '10 '11 12 '13 '14 '15 Jan. '16 30,000 25,000 20,000 15,000 10,000 5,000 0 Jan Jan YoY Market 3,252 2, % H H I % M/S 7.8% 2.7% -5.1%p (Source: China construction machinery association) Construction Equipment Sales by Region Others Domestic Mid. & South America Mid. East Africa China '08 '09 '10 '11 '12 '13 '14 '15 08 ~ 09 sales are based on K-GAAP. HHI s Excavator Market Share by Region Domestic 27.5% 27.9% 25.1% Global (Excluding Japan) 9.0% 7.8% 6.2% China 8.1% 7.2% 4.4% India 17.7% 19.7% 20.4% (Source: Company data) 47

48 Green Energy Solar Power 48
 Picture Facilities Solar Cell Plant (Eumseong, Korea) Solar Module Plant (Eumseong, Korea) Electro Electric Systems Division (Ulsan, Korea) Annual Capacity (2015) 600MW 600MW")
 30 30 60 370 370 580 600 600 600 600 Modules (MW) Sales (KRW bil.")
 - VDE (IEC 61215, IEC 61730-1/61730-2/International) - CE Declaration (International) - J-PEC (Japan) - JET (IEC 61215, IEC")
49 Solar Power 600MW capacity of solar cell & solar modules and solar inverter to provide total solution Solar cell & solar modules, solar inverter production facility in 2015 Solar Cell Solar Module Solar System (Inverter) Picture Facilities Solar Cell Plant (Eumseong, Korea) Solar Module Plant (Eumseong, Korea) Electro Electric Systems Division (Ulsan, Korea) Annual Capacity (2015) 600MW 600MW 500MW Details - Mono-crystalline, Poly- crystalline solar cells produced - 54 cell(6x9), 60 cell(6x10), 72 cell(6x12) modules produced - Grid-Tied Solar Inverter with/without transformer Capacity and Sales Capacity Cell (MW) Modules (MW) Sales (KRW bil.) % of total HHI Sales % % % % % % % % % Solar Product Certification - UL (UL 1703/USA, Canada) - VDE (IEC 61215, IEC / /International) - CE Declaration (International) - J-PEC (Japan) - JET (IEC 61215, IEC / /Japan) - MCS (IEC 61215, IEC / /UK) - CSTB (France) - Ammonia resistance (IEC 62716) - Salt mist (IEC 61701) - Fire test (UN9177/Italy) 49
50 Subsidiaries Hyundai Oilbank Hyundai Samho 50

 Refining Unit Bunker C 44% LPG, Naphtha, Gasoline 19% Kerosene, Diesel 37%")
51 Hyundai Oilbank At a Glance Facilities & Products Production Capacity #1 : 110,000 B/D, #2 : 280,000 B/D 390,000B/D Completion of #2 HOU Plant 36.7% With the completion of #2 HOU plant in Jan. 2011, Hyundai Oilbank achieved a ratio of 36.7% (the highest upgrading ration in the industry) Domestic Light Oil Market Share 22.0% Competitors : SK Innovation, GS Caltex, and S-Oil Crude oil 100% (390,000 b/d) Refining Unit Bunker C 44% LPG, Naphtha, Gasoline 19% Kerosene, Diesel 37% Upgrading Unit Gasoline, LPG 46% Diesel 37% Propylene 9% Others 8% Total CAPEX : KRW 2.6 tril. HHI s Management Control 91.1% (Jul. 2006~ Feb. 2011) Acquired by HHI in Aug
52 Hyundai Oilbank Income Statement (Unit: Bil. KRW) Sales 21, , , ,106.8 Operating Income Margin 1.4% 2.0% 1.1% 4.8% Net Income Margin 0.7% 0.8% 0.2% 3.6% Financial Position (Unit: Bil. KRW) Total Assets 8, , , ,079.9 Total Liabilities 5, , , ,369.1 Total Shareholder s Equity 2, , , ,710.8 Liabilities-to-Equity Ratio 194.6% 181.6% 151.0% 90.8% * Non Consolidated 52
53 Hyundai Samho Production Capacity At a Glance - Delivered 30 vessels in # of dry docks : Sales Target 2016 Order Target 2.9 mil. GT 4,083 bil. KRW 4.0 bil. USD 7.1% Backlog by Shiptype (2015) 3.1% 19.1% 12.6% 2.6% 16.8% 38.6% Tanker Containership Bulker LNG Carrier LPG Carrier FPU PCTC Backlogs as of Dec on a delivery basis : 91 vessels, USD 8.66 bil. The above data is based on the amount New Orders in Jan Feb Mar Apr May Jun Jul Aug. Sep Oct Nov Dec Total Target Achieve -ment Details (mil. USD) # of ship Amount (mil. USD) 2, ,643 3, % New Orders in Containerships (1,119) -12 Tankers (975) -4 PCTCs (298) -4 Bulk Carriers (246) -1 LPG Carrier (79) -Others (90) New Orders in Tankers (1,676) - 5 Containerships (515) - 2 LNG Carriers (397) - 4 LPG Carriers (307) - 10 PCTCs (718) - Others (30) 53
54 Hyundai Samho Income Statement (Unit: KRW billion) Sales 4, , , ,504.0 Operating Income Margin 6.0% -1.0% -12.0% -7.8% Net Income Margin -0.3% -1.5% -5.2% -6.1% Financial Position (Unit: KRW billion) Total Assets 7, , , ,169.3 Total Liabilities 3, , , ,506.7 Total Shareholder s Equity 3, , , ,662.6 Liabilities-to-Equity Ratio 98.4% 92.3% 136.3% 169.3% * Non Consolidated 54
55 Current Issues 55
56 Semi-Submersible Rigs Status The prolonged weak oil prices delayed or cancelled the E&P investment Two semi-submersible rigs out of three in the backlog were cancelled and KRW 396 bil. of losses from the cancellation incurred in 2015 The last rig in our backlog is scheduled to deliver during 2Q2016 Final delivery of drilling facility will improve margin visibility of Shipbuilding sector HHI HSHI Diamond(U.S.) Fred Olsen Energy(NOR) Seadrill Mira(NOR) Contract date 25-May May Jun-2011 Contract price USD 629 mil. USD 621 mil. USD 568 mil. Advance received USD 189 mil. (30%) USD 186 mil. (30%) USD 170 mil. (30%) Cancellation notice from owner - 27-Oct Sep-2015 Loss incurred on cancellation - KRW bil. KRW bil. Current status under consturction Arbitration submitted Arbitration submitted 56
57 Offshore Orders and Profit Trend Orderbook hit the historic high level in 2014 on the back of high oil prices KRW 1.5 tril. of losses incurred in 2014~2015 due to the cost overruns stemming from i) delayed construction of mega sized projects by frequent specification changes which leads to work overloads ii) delayed cost compensations of owners due to the tight budget (Unit: orders, backlog-mil. USD, Sales, OP-bil. KRW) (E) Orders Backlog (Sales Basis) Sales 2,978 2,352 3,069 4,480 2,072 6,503 6,005 1,572 3,200 9,017 6,792 7,027 8,221 7,045 8,557 10,288 7,830 7,697 3, , , , , , , , ,303.0 Operating Profit , Margin 9.3% 13.5% 21.6% 10.5% 7.3% 5.9% -5.0% -29.0% - 57
58 Offshore Projects in Backlog Major mega projects (Goliat, Gorgon, Q204) are completed and additional nine projects are scheduled to deliver timely in 2016 Normalized level of workload is expected to lead to a production stability Expected Delivery 2015~Jan (4 projects) 2016 (9 projects) 2017 (5 projects) 2018~ (3 projects) Gorgon Chevron (The end of Jan. 2016, Unit: Mil. USD) Delivery Basis Sales Basis Quad 204 BP 7,151 (Delivered) Goliat Clair Ridge DSO Moho Nord TLP Bergading Moho Nord FPU ENI Norge BP Chevron Total Hess E&P Total Baronia Petronas Carigali 2,773 1,458 47% Aasta-Hansteen Spar Hull Aasta-Hansteen Spar Topside Statoil Statoil NASR 2 ADMA-OPCO 5,961 4,725 21% Rosebank Major Project Owner Chevron 5,591 Backlog 1,323 Others 147 Total (17 projects) 14,325 7,653 Completion 76% 58
59 Industrial Plant Projects in Backlog Two non profitable mega projects are in the final process and scheduled to deliver in 2017 Project Owner Contract Date Jeddah South Thermal Power Plant SEC (Saudi) Oct Shuqaiq Steam Power Plant SEC (Saudi) Aug Expected Delivery 2017 (PAC*) 2017 (PAC*) Tihama Stage II Co-Generation TPGC (Saudi) Apr (The end of Jan. 2016, Unit: Mil. USD) Delivery Basis Backlog Sales Basis Completion 6,450 1,831 72% AZ Zour North Phase 1 IWPP MEW (Kuwait) Dec Jazan Refinery & Thermal Project** Aramco (Saudi) Dec ,739 2,183 42% Clean Fuel Project KNPC (Kuwait) Apr ZOR Refinery Project KNPC (Kuwait) Oct Others Total (7 projects) 1, ,277 4,332 * PAC : Preliminary Acceptance Certificate ** Jazan Refinery & Thermal Project : constructed by overseas corp. 59
60 Thank You *For More Information IR Team Tel: , 7508, 4728 Fax: Website: (Company) / (IR) 60
- Shipbuilding Division - Offshore & Engineering and Industrial Plant Division - Engine & Machinery Division
 - Shipbuilding Division - Offshore & Engineering and Industrial Plant Division - Engine & Machinery Division - Financial Summary of HHI - Financial Summary of HMD - 2018 New Order & Sales Target HMD 3.9
- Shipbuilding Division - Offshore & Engineering and Industrial Plant Division - Engine & Machinery Division
 - Shipbuilding Division - Offshore & Engineering and Industrial Plant Division - Engine & Machinery Division - Financial Summary of HHI - Financial Summary of HMD - 2018 New Order HMD 3.9 KCC 6.8 National
KCC 6.8 HMD 3.9. National Pension 9.1. Hyundai Motors 2.9. HHI Holdings Asan Foundation 3.0. Treasury Stock 0.1. Others 46.5
 HMD 3.9 KCC 6.8 National Pension 9.1 Hyundai Motors 2.9 HHI Holdings 27.7 Asan Foundation 3.0 Others 46.5 Treasury Stock 0.1 1973 ~ 2010 2011 ~ 2018 12. 1973 Establishment of Hyundai Shipbuilding & Heavy
HHI at a Glance. Financial Performance. Business Performance
 (11. 2015) 1 Important Notice This presentation of Hyundai Heavy Industries (HHI) contains forward-looking statements relating to HHI s operations that are based on management s current expectations, estimates
HHI at a Glance. Financial Performance. Business Performance
 (9. 2015) 1 Important Notice This presentation of Hyundai Heavy Industries (HHI) contains forward-looking statements relating to HHI s operations that are based on management s current expectations, estimates
HHI at a Glance. Financial Performance. Business Performance
 (9. 2015) 1 Important Notice This presentation of Hyundai Heavy Industries (HHI) contains forward-looking statements relating to HHI s operations that are based on management s current expectations, estimates
Hyundai Heavy Industries IR Presentation. (Apr. 2017)
") Hyundai Heavy Industries IR Presentation (Apr. 2017) 1 Important Notice This presentation of Hyundai Heavy Industries (HHI) contains forward-looking statements relating to HHI s operations that are based
Hyundai Heavy Industries IR Presentation (Apr. 2017) 1 Important Notice This presentation of Hyundai Heavy Industries (HHI) contains forward-looking statements relating to HHI s operations that are based
Hyundai Heavy Industries IR Presentation ( )
") Hyundai Heavy Industries IR Presentation (2017. 02) 1 Important Notice This presentation of Hyundai Heavy Industries (HHI) contains forward-looking statements relating to HHI s operations that are based
Hyundai Heavy Industries IR Presentation (2017. 02) 1 Important Notice This presentation of Hyundai Heavy Industries (HHI) contains forward-looking statements relating to HHI s operations that are based
H H I at a Glance. Business Performance
 1 Important Notice This presentation of Hyundai Heavy Industries (HHI) contains forward-looking statements relating to HHI s operations that are based on management s current expectations, estimates and
H H I at a Glance. Business Performance. Financial Performance
 (2015.1) 1 Important Notice This presentation of Hyundai Heavy Industries (HHI) contains forward-looking statements relating to HHI s operations that are based on management s current expectations, estimates
H H I at a Glance. Business Performance. Financial Performance
 (2015.4) 1 Important Notice This presentation of Hyundai Heavy Industries (HHI) contains forward-looking statements relating to HHI s operations that are based on management s current expectations, estimates
2007 3Q Investor Meeting. November 2007
 2007 3Q Investor Meeting November 2007 Company Overview Cumulative 3Q 2007 Results Result By Division Appendix Company Overview Overview Doosan Infracore is the largest machinery company in Korea and also
IR Presentation SAMSUNG ENGINEERING 2
 IR Presentation SAMSUNG ENGINEERING 2 0 1 5 1 Introduction CONTENTS 2 Business Update 3 Appendix Introduction Business Portfolio Hydrocarbon Refinery Gas Petrochemical Upstream CDU/VDU HDS Aromatics Alkylation
IR Presentation SAMSUNG ENGINEERING 2
 IR Presentation SAMSUNG ENGINEERING 2 0 1 4 1 Introduction CONTENTS 2 Business Update 3 Appendix Introduction Business Portfolio Hydrocarbon Refinery Gas Petrochemical Upstream CDU/VDU Heavy Oil Upgrading
DAEWOO HEAVY INDUSTRIES & MACHINERY
 www.dhiltd.co.kr DAEWOO HEAVY INDUSTRIES & MACHINERY November 2003 Our projections in this document are based on current economic conditions and DHIM s current management policy. www.dhiltd.co.kr CONTENTS
Capital Markets Day 2007 Kongsberg Maritime 25 September 20O7
 Capital Markets Day 27 Kongsberg Maritime 25 September 2O7 WORLD CLASS through people, technology and dedication 1 Kongsberg Maritime Offshore & Merchant Marine Offshore & Merchant Marine Introduction
2015 Interim Results Announcement
 China Petroleum & Chemical Corporation 2015 Interim Results Announcement August 27, 2015 Hong Kong Cautionary Statement This presentation and the presentation materials distributed herein include forward-looking
ORDERBOOK OBSERVER M A R C H
 ORDERBOOK OBSERVER M A R C H 2 1 7 Tanker Orderbook by Builder Country Rank Country No. Mn Dwt Mn CGT Tanker Orders by Size Segment Share (%) of Total 1 South Korea 18 25.5 5. 38.8% 2 China 159 21.1 4.3
Korean Shipbuilding Industry & Policy
 Korean Shipbuilding Industry & Policy June 6th 2018 MOTIE Ministry of Trade, Industry and Energy Outline 1. Shipbuilding Market (1) 2016 was a year with a historically low level of new-building demand
Overseas Market Conditions of Construction and Mining Equipment
 1 Overseas Market Conditions of Construction and Mining Equipment December 17, 2012 Hisashi Shinozuka Senior Executive Officer President of Construction and Mining Marketing Division Komatsu Ltd. 2 1.
OILFIELD TECHNICAL INSPECTION SDN BHD
 OILFIELD TECHNICAL INSPECTION SDN BHD GENERAL PRESENTATION FOR OFFSHORE EUROPE ABERDEEN 3 rd 6 th SEPTEMBER 2013 BACKGROUND OTI was established on 30 August 2005 Our primary business focus is pipeline
2Q06 Results. Investor Relations
 2Q06 Results Investor Relations Content 1. 2Q06 Key Results 2. Summarized Income Statement 3. Balance Sheet as of Jun. 2006 4. Outlook for 2006 5. Result & Outlook By Division Appendix : 2Q06 Results Breakdown
A summary of national and global energy indicators. FEDERAL RESERVE BANK of KANSAS CITY
 THE U.S. Energy DATABOOK A summary of national and global energy indicators JULY 1, 17 FEDERAL RESERVE BANK of KANSAS CITY SUMMARY OF CURRENT ENERGY CONDITIONS The number of total active drilling rigs
BUSINESS OVERVIEW FEBRUARY
 BUSINESS OVERVIEW FEBRUARY 2018 Except for historical information, the statements made in this presentation constitute forward looking statements. These include statements regarding the intent, belief
2010 1Q Investor Meeting. May 2010
 2010 1Q Investor Meeting May 2010 This presentation contains preliminary figures which may be materially different from the final figures. While the statements in this presentation represent our current
Market Report Series: Oil 2018 Analysis & Forecasts to Energy Community 10 th Oil Forum, Belgrade, 25 September 2018
 Market Report Series: Oil 218 Analysis & Forecasts to 223 Energy Community 1 th Oil Forum, Belgrade, 25 September 218 Short term update: crude prices (excl. WTI) up strongly Aug/Sep $/bbl 8 Benchmark Crude
CONFIDENCE DYNA-MAC HOLDINGS LTD.
 Dyna-Mac Holdings Ltd. 3Q 2018 Results 08-November-2018 Photo: SBM Offshore FORWARD WITH CONFIDENCE DYNA-MAC HOLDINGS LTD. 1 Photo: SBM Offshore Business Overview 2 About Dyna-Mac A multi-disciplinary
Downstream & Chemicals
 Downstream & Chemicals Pierre Breber Executive Vice President 017 Chevron Corporation Downstream portfolio Fuels refining & marketing Integrated value chains Lubricants & additives Globally positioned
Floating Production What s New In April
 Page 1 of 5 Floating Production What s New In April Jim McCaul IMAstudies Current Inventory 321 oil/gas floating production units are now in service, on order or available for reuse on another field. FPSOs
Economic & Steel Market Development in Japan
 1 Economic & Steel Market Development in Japan 68 th OECD Steel Committee Paris May 6-7, 2010 The Japan Iron & Steel Federation 2 Macro-economic overview Steel Supply and Demand v v v Steel Production
RESULTS FOR Q ANALYST TELECONFERENCE
 RESULTS FOR Q4 216 ANALYST TELECONFERENCE Market 1 2 Operation Financials 3 Market 1 216 Fourth Quarter Market Conditions Product Market Crude Oil Postponed Maintenances Started to take place High Agricultural
2010 Interim Results Presentation. August 23, 2010 Hong Kong
 Sinopec Corp. 21 Interim Results Presentation August 23, 21 Hong Kong Disclaimer i This presentation and the presentation materials distributed herein include forwardlooking statements. All statements,
Q Analyst Teleconference. 9 August 2018
 9 August 218 Disclaimer This presentation contains forward-looking statements that reflect the Company management s current views with respect to certain future events. Although it is believed that the
Downstream Petroleum Sector The Growing Prominence of Asian Refining
 Downstream Petroleum Sector The Growing Prominence of Asian Refining Mr. Fahad Al-Dihani Deputy CEO,MAA Refinery, Kuwait National Petroleum Company-Kuwait Outline.. Global refining trends Kuwait s Position
ANALYST BRIEFING FOR THE THIRD QUARTER ENDED NOV 2016
 ANALYST BRIEFING FOR THE THIRD QUARTER ENDED 2016 21 NOV 2016 MSM Malaysia Holdings Berhad Analyst Briefing Q3 2016 21/11/2016 1 CONTENTS 01 02 03 04 05 Group Financial Highlights Performance Review Sugar
Months Investor Presentation
 2018 9 Months Investor Presentation 25.10.2018 Disclaimer Ereğli Demir Çelik Fabrikaları T.A.Ş. (Erdemir) may, when necessary, make written or verbal announcements about forward-looking information, expectations,
9M 2003 Financial Results (US GAAP)
") 9M Financial Results (US GAAP) January 2004 LUKOIL Group Crude Oil Production* mln tonnes 82 80 78 76 74 72 70 68 66 64 Crude oil production 3.2 5.5 3.9 76.8 70.3 71.3 2001 Production by subsidiaries Share
9M Financial Results (US GAAP) January 2004 LUKOIL Group Crude Oil Production* mln tonnes 82 80 78 76 74 72 70 68 66 64 Crude oil production 3.2 5.5 3.9 76.8 70.3 71.3 2001 Production by subsidiaries Share
Global and China FPSO Industry Report, Dec. 2011
 Global and China FPSO Industry Report, 2011 Dec. 2011 STUDY GOAL AND OBJECTIVES This report provides the industry executives with strategically significant competitor information, analysis, and insight
FISCAL YEAR MARCH 2018 FIRST QUARTER FINANCIAL RESULTS
 FISCAL YEAR MARCH 2018 FIRST QUARTER FINANCIAL RESULTS PRESENTATION OUTLINE Highlights Fiscal Year March 2018 First Quarter Results Fiscal Year March 2018 Full Year Forecast Structural Reform Stage 2 Progress
World Geographic Shares
 World Geographic Shares North America South America Europe Africa Asia Australia/ Oceania 18% 13% 7% 22% 33% 6% World Population Shares North America South America Europe Africa Asia Australia/ Oceania
Sinopec Corp. Q Results Announcement. 29 October 2010
 Sinopec Corp. Q3 2010 Results Announcement 29 October 2010 Disclaimer i As required by the CSRC, financial statements of the third quarter of Sinopec Corp. (the Company ) were prepared under PRC Accounting
Cosmo Oil Co., Ltd. Presentation on Results for First Quarter of Fiscal 2012 August 2, 2012 Director: Satoshi Miyamoto
 Cosmo Oil Co., Ltd. Presentation on Results for First Quarter of Fiscal 2012 August 2, 2012 Director: Satoshi Miyamoto Copyright 2012 COSMO OIL CO.,LTD. All Rights Reserved. Key Points of Financial Results
Introduction of AVIC International
 Introduction of AVIC International Former China National Aero-Technology Import & Export Corporation (CATIC) reorganized to AVIC International Co. in 2009. CATIC was founded on Jan 21, 1979. State-owned
ENEL PUBLISHES 2018 SECOND QUARTER AND FIRST HALF GROUP OPERATING DATA REPORT
 Media Relations Investor Relations T +39 06 8305 5699 T +39 06 8305 7975 F +39 06 8305 3771 F +39 06 8305 7940 ufficiostampa@enel.com investor.relations@enel.com enel.com enel.com ENEL PUBLISHES 2018 SECOND
FISCAL YEAR MARCH 2018 FIRST HALF FINANCIAL RESULTS
 FISCAL YEAR MARCH 2018 FIRST HALF FINANCIAL RESULTS PRESENTATION OUTLINE Highlights Fiscal Year March 2018 First Half Results Fiscal Year March 2018 Full Year Forecast Progress of Key Initiatives/ Business
1 Copyright(C) 2012 Isuzu Motors Limited All rights reserved
 2012 Isuzu Motors Limited All rights reserved") FY2012 Financial Results May 10, 2012 1 Copyright(C) 2012 Isuzu Motors Limited All rights reserved Contents Ⅰ. President and Representative Director : Susumu Hosoi FY2012 Overview Ⅱ. Director Director
FY2012 Financial Results May 10, 2012 1 Copyright(C) 2012 Isuzu Motors Limited All rights reserved Contents Ⅰ. President and Representative Director : Susumu Hosoi FY2012 Overview Ⅱ. Director Director
Recent Developments in International Seaborne Trade and Maritime Transport
 Recent Developments in International Seaborne Trade and Maritime Transport IFSPA, Hong Kong, 3-5 June 2013 Dr. Vincent F. Valentine Officer-in-Charge, Transport Section Division on Technology and Logistics
Global Monthly March 2019
 Global Monthly March 19 Percent of world bonds outstanding 3 5 15 5 Jan-1 Jun-1 Nov-1 Apr-15 Sep-15 Feb-1 Jul-1 Dec-1 May-17 Oct-17 Mar-1 Aug-1 Dec-1 Mar-19 March 19 Percent, year-on-year 7 5 3 1 1Q1 1Q
Japan s refining environment
 Japan s refining environment Platts Asian Refining Summit 3 March 2016, Singapore Yoshi Kobayashi The Institute of Energy Economics, Japan (IEEJ) Oil in Japan 2 Oil is the largest energy source for Japan
Regional Refining Outlook
 Regional Refining Outlook Implications for Crude Demand Platts Crude Summit 15 May 213 David Wech JBC Energy GmbH 13 th May 213 Research - Energy Studies - Consulting - Training Disclaimer All statements
FY2013 2Q Report (ended on 30 th September, 2013) Reported on 7 November, 2013
 Reported on 7 November, 2013") FY2013 2Q Report (ended on 30 th September, 2013) Reported on 7 November, 2013 Key Point of FY2013 2Q Upward revision of full-term earnings forecast Positive turnaround in market environment - Increase
FY2013 2Q Report (ended on 30 th September, 2013) Reported on 7 November, 2013 Key Point of FY2013 2Q Upward revision of full-term earnings forecast Positive turnaround in market environment - Increase
2011 Third Quarter Update 17 November 2011
 2011 Third Quarter Update 17 November 2011 Operations Highlights Group (In HK$ millions) 3Q11 3Q10 2011 2010 Sales 1,334 1,125 +19% 3,983 3,262 +22% Gross profit 767 638 +20% 2,348 1,875 +25% Gross margin
Healthier Net Profit under Stronger IDR
 Investor Bulletin, First Half 2002 Healthier Net Profit under Stronger IDR As of June 2002, the consolidated revenue in USD increased by 32% y.o.y. Due to IDR strengthening against USD, in IDR revenue
FY H1 Financial Results
 FY2011 1 H1 Financial Results November 8, 2010 1 Copyright(C) 2010 Isuzu Motors Limited All rights reserved Contents Ⅰ. President and Representative Director : Susumu Hosoi :FY2011 H1 Financial Summary
Asahi World Environmental Forum 14 September Global trends in clean energy investment. Michael Liebreich Chief Executive
 Asahi World Environmental Forum 14 September 2010 Global trends in clean energy investment Michael Liebreich Chief Executive Bloomberg New Energy Finance, 2004-2010 Global total new investment in clean
FY2017 Results. February 26, 2018
 FY2017 Results February 26, 2018 Our background & development Registered capital increased to 12 MB Started International marine transportation ( Myanmar route ) Registered capital increased to 100 MB
World Air Conditioner Demand by Region
 World Air Conditioner Demand by Region April 2015 The Japan Refrigeration and Air Conditioning Industry Association 1 World Air Conditioner Demand by Region April 2015 The Japan Refrigeration and Air Conditioning
Supporting Material for Third Quarter Results 2012
 Supporting Material for Third Quarter Results 2012 31 October 2012 1 Notes This document contains forward-looking statements concerning the results of operations and businesses of. Forward-looking statements
Consolidated Financial Results for 1Q FY2016 July 29, 2016 Fuji Electric Co., Ltd.
 Consolidated Financial Results for 1Q FY2016 July 29, 2016 Fuji Electric Co., Ltd. 2016Fuji Electric Co., Ltd. All rights reserved. 1 Summary of Consolidated Financial Results for 1Q FY2016 (YoY Comparison)
Chemical Feedstocks: Heavy Squeeze, All Light Long JIWON CHUNG DIRECTOR, ASIA BUSINESS DEVELOPMENT & CONTENT
 Chemical Feedstocks: Heavy Squeeze, All Light Long JIWON CHUNG DIRECTOR, ASIA BUSINESS DEVELOPMENT & CONTENT JCHUNG@OPISNET.COM BRENT SEP 2014-OCT 2016 $/barrel 125 100 75 50 25 0 September 2014 February
HHI-EMD NEWS HYUNDAI HEAVY INDUSTRIES ENGINE & MACHINERY DIVISION
 HHI-EMD NEWS HYUNDAI HEAVY INDUSTRIES ENGINE & MACHINERY DIVISION Vol. 38 August 2015 www.hhi.co.kr www.hyundai-engine.com Hyundai Heavy s Record Production Milestone of 150,000,000 bhp in Marine Engines
Nissan Motor Co., Ltd. February 12 th, 2019
 Nissan Motor Co., Ltd. February 12 th, 2019 NET REVENUE 2,875.5 3,045.7 OPERATING PROFIT *1 NET INCOME 301.6 FREE CASH FLOW (AUTO) NET CASH (AUTO) 1,311.4 1,334.4 US TAX REFORM 207.7 82.4 103.3 93.9 *2
US Crude Oil Reshaping International Crude Oil Flows. Olivier Jakob,
 US Crude Oil Reshaping International Crude Oil Flows Olivier Jakob, ojakob@petromatrix.com www.petromatrix.com Claimer Petromatrix publishes since 2006 a daily market note on the oil markets Our reports
4Q 2018 Review & Outlook
 4Q 2018 Review & Outlook Disclaimer This presentation material is prepared for investors reference, based on data that have not been filed with the financial supervisory commission. Actual business performance
Global Polybutadiene Rubber (BR) Market Study ( )
 Market Study ( )") Global Polybutadiene Rubber (BR) Market Study (2014 2025) Table of Contents 1. INTRODUCTION 1.1. Introduction to Polybutadiene Rubber Market Product Description Properties Industry Structure Value Chain
Global Polybutadiene Rubber (BR) Market Study (2014 2025) Table of Contents 1. INTRODUCTION 1.1. Introduction to Polybutadiene Rubber Market Product Description Properties Industry Structure Value Chain
1. Trends in the current fiscal year and previous fiscal year 3. Business overview 2. Secular trends in first quarter financial results
 FY2/19 (March 2018~May 2018) Fact Book 1. Trends in the current fiscal year and previous fiscal year 3. Business overview (1) Performance overview P. 1 (1) No. of students at the end of month P. 6 (2)
Marine & Diesel Division
 Marine & Diesel Division Peter Leifland Executive Vice President Alfa Laval Group Industry mix and growth drivers - Distribution of orders LTM September 2015 Ship building Marine Environ., Gas & Energy
Marine Money Japan Ship Finance Forum
 Marine Money Japan Ship Finance Forum Current Situation in Shipbuilding -World and Japan- Masashi Terakado The Shipbuilders Association of Japan May 12th, 2016 Contents 1. Current Situation and Projection
1Q 2015 Business Result. May 2015
 1Q 2015 Business Result May 2015 Disclaimer The financial information in this document are consolidated earnings results based on K-IFRS. The previous earnings results have also been stated in compliance
Petrobras. Nelson Silva Chief Strategy and Performance Officer April, 2017
 Petrobras Nelson Silva Chief Strategy and Performance Officer April, 2017 Agenda - Petrobras among the peers - Tracking the 2017-2021 Business and Management Plan (BMP) - Zero Base Budget - Risk Management
ANALYST BRIEFING FOR THE FOURTH QUARTER ENDED FEBRUARY 2017
 ANALYST BRIEFING FOR THE FOURTH QUARTER ENDED 2016 22 FEBRUARY 2017 MSM Malaysia Holdings Berhad Analyst Briefing Q4 2016 22/2/2017 1 CONTENTS 01 02 03 04 05 Group Financial Highlights Performance Review
Formosa Petrochemical Corporation 2006 Q3 Financial Results
 Formosa Petrochemical Corporation 26 Q3 Financial Results November 26 Index Our Company 2 Financials 3 Refinery Division 4 Olefins Division 5 Capital Expansion 2 Our Company: Leading Private Integrated
DETAIL OF MAJOR EXPERIENCE LIST OF COMPLETED OIL & GAS CONTRACT FOR THE PAST 12 YEARS
 Certificate : KLR 6003645 Name Duration/ 1. NA Samsung Heavy Industries Co., Ltd. - Management of comm. / May 2001 Dec 2002 Dec 2002 8500 0 0 0 12600 1250 (Carigali-Triton Operating Company) Commissioning
FY2012 third-quarter financial results
 FY2012 third-quarter financial results Nissan Motor Co., LTD. February 8, 2013 Key performance indicators: financial results (billion yen) Net revenue 6,698.4 6,755.2 Operating profit 427.8 Net income
FY2012. H1 Financial Results. November 8, Copyright(C) 2011 Isuzu Motors Limited All rights reserved
 2011 Isuzu Motors Limited All rights reserved") FY2012 H1 Financial Results November 8, 2011 1 Copyright(C) 2011 Isuzu Motors Limited All rights reserved Ⅰ. President and Representative Director : Susumu Hosoi :FY2012 H1 Financial Summary Outline Ⅱ.
FY2012 H1 Financial Results November 8, 2011 1 Copyright(C) 2011 Isuzu Motors Limited All rights reserved Ⅰ. President and Representative Director : Susumu Hosoi :FY2012 H1 Financial Summary Outline Ⅱ.
FY2/18 (March 2017~February 2018)
") FY2/18 (March 2017~February 2018) Fact Book 1. Trends in the current fiscal year and previous fiscal year 3. Business overview (1) Performance overview P. 1 (1) No. of students at the end of month P. 6
FY2/18 (March 2017~February 2018) Fact Book 1. Trends in the current fiscal year and previous fiscal year 3. Business overview (1) Performance overview P. 1 (1) No. of students at the end of month P. 6
About Czarnikow. The Premier Provider of Sugar Market Services. Czarnikow has been in the sugar business since 1861
 About Czarnikow The Premier Provider of Sugar Market Services Czarnikow has been in the sugar business since 1861 Czarnikow is the leading professional services company in the sugar market Czarnikow has
WÄRTSILÄ CORPORATION
 WÄRTSILÄ CORPORATION JP MORGAN EUROPEAN CAPITAL GOODS CEO CONFERENCE 13 JUNE 2014 Björn Rosengren, President & CEO 1 Net sales by business 1-3/2014 Ship Power 38% Services 43% Power Plants 19% 2 Net sales
Press Release. During the third quarter of 2010/11, Alstom s order intake rose to 5.5 billion, lifted by commercial successes in emerging countries
 Press Release 20 January 2011 During the third quarter of 2010/11, Alstom s order intake rose to 5.5 billion, lifted by commercial successes in emerging countries Over the third quarter 2010/11 (from 1
Global Monthly February 2018
 Global Monthly February 18 3 1-year Treasury yields 1-year breakeven inflation rate 1 1 15 16 17 18 February 18 5 3 Global GDP growth Composite PMI (RHS) Index 56 5 5 1 5 1 13 1 15 16 17 18 3..5. 1.5 1.
Financial Results for First Half of FY2014 (April 1- September 30) Investor meeting. October 31, 2014
 Investor meeting. October 31, 2014") Financial Results for First Half of FY2014 (April 1- September 30) Investor meeting October 31, 2014 1 CONTENTS 1. Financial Results for First Half of FY2014 2. Forecast for FY2014 3. Cash Flow and Debt
Financial Results for First Half of FY2014 (April 1- September 30) Investor meeting October 31, 2014 1 CONTENTS 1. Financial Results for First Half of FY2014 2. Forecast for FY2014 3. Cash Flow and Debt
WORLD CLASS through people, technology and dedication. KONGSBERG September 20,
 WORLD CLASS through people, technology and dedication KONGSBERG September 20, 2006 1 Kongsberg Maritime Offshore & Merchant Marine Focusing on core technologies building strong application knowledge sales
FISCAL YEAR MARCH 2015 FIRST HALF FINANCIAL RESULTS. New Mazda Demio
 FISCAL YEAR MARCH 2015 FIRST HALF FINANCIAL RESULTS New Mazda Demio Mazda Motor Corporation October 31, 2014 1 PRESENTATION OUTLINE Highlights Fiscal Year March 2015 First Half Results Fiscal Year March
ECONOMIC BULLETIN - No. 42, MARCH Statistical tables
 ECONOMIC BULLETIN - No. 42, MARCH 2006 APPENDIX Appendix Statistical tables The world economy Table a1 Gross domestic product a2 Industrial production a3 Consumer prices a4 External current account a5
FY2/17 3Q(March 2016~November2016)
") FY2/17 (March 2016~November2016) Fact Book 1. Trends in the current fiscal year and previous fiscal year 3. Business overview (1) Performance overview P. 1 (1) No. of students at the end of month P. 7
FY2/17 (March 2016~November2016) Fact Book 1. Trends in the current fiscal year and previous fiscal year 3. Business overview (1) Performance overview P. 1 (1) No. of students at the end of month P. 7
FISCAL YEAR MARCH 2018 THIRD QUARTER FINANCIAL RESULTS
 FISCAL YEAR MARCH 2018 THIRD QUARTER FINANCIAL RESULTS PRESENTATION OUTLINE Highlights Fiscal Year March 2018 Nine Month Results Fiscal Year March 2018 Full Year Forecast Progress of Key Initiatives 1
FY2/18 2Q(March 2017~August 2018)
") FY2/18 2Q(March 2017~August 2018) Fact Book 1. Trends in the current fiscal year and previous fiscal year 3. Business overview (1) Performance overview P.1 (1) No. of students at the end of month P.7 (2)
FY2/18 2Q(March 2017~August 2018) Fact Book 1. Trends in the current fiscal year and previous fiscal year 3. Business overview (1) Performance overview P.1 (1) No. of students at the end of month P.7 (2)
Downstream & Chemicals
 Downstream & Chemicals Pierre Breber Executive Vice President Profitable downstream & chemicals portfolio Fuels refining & marketing Focused, regional optimization Petrochemicals Advantaged feed, scale
Financial Information Details
 FY2012, Year Ended March 31, 2013 Financial Information Details Financial Results (Consolidated) 1 Cash-Flows (Consolidated) 2 Subsidiaries 3 Financial Results of Major Subsidiaries,Other Financial Data
AOC Holdings, Inc. (TSE:5017)
") AOC Holdings, Inc. (TSE:5017) (TSE:5017) Report on on Performance in infy2008 (April 1, 1, 2008 2008 March 31, 31, 2009) May May 18, 18, 2009 2009 AOC AOC Holdings, Inc. Inc. www.aochd.co.jp 1 Chapter
AOC Holdings, Inc. (TSE:5017) (TSE:5017) Report on on Performance in infy2008 (April 1, 1, 2008 2008 March 31, 31, 2009) May May 18, 18, 2009 2009 AOC AOC Holdings, Inc. Inc. www.aochd.co.jp 1 Chapter
Global Overview of Middle Distillates Supply and Demand ICE Market Forum Rotterdam, November 2012
 Global Overview of Middle Distillates Supply and Demand ICE Market Forum Rotterdam, November 2012 About Petromatrix Based in Switzerland (city of Zug) Publishes a daily newsletter on oil markets Mix of
BUSINESS OVERVIEW 12 February 2019
 BUSINESS OVERVIEW 12 February 2019 Except for historical information, the statements made in this presentation constitute forward looking statements. These include statements regarding the intent, belief
YONGKWANG FLEXIBLE IND. CO., LTD.
 YONGKWANG FLEXIBLE IND. CO., LTD. Content 1. Company Introduction 2. Company History 3. General Information 4. Organization 5. HSE Performance Statistics 6. Quality Assurance 7. Certificates 8. Patents
WELCOME TO 1 ST ANNUAL GENERAL MEETING SERBA DINAMIK HOLDINGS BERHAD S
 WELCOME TO SERBA DINAMIK HOLDINGS BERHAD S 1 ST ANNUAL GENERAL MEETING KUALA LUMPUR 26 MAY 2017 Presented by: DATO DR. IR. MOHD ABDUL KARIM ABDULLAH Group Managing Director, Group CEO & Non-independent
Review of Operations in FY2012
 Sales Segment Profit and Ratio Sales by Region for the Fiscal Year ended March 31, 2013 (To Outside Customers) 41 With respect to construction equipment, while demand increased in North America and Japan
Supplementary Report. -3rd Quarter of F February 2007 Kawasaki Kisen Kaisha, Ltd.
 Supplementary Report -3rd Quarter of F26 - February 27 Kawasaki Kisen Kaisha, Ltd. 1. Shipping Markets 2. Financial Data 3. Historical Data - For 5 years - Supplemental Information-1 - Shipping Markets
The Alliance October 23, 2008
 The Alliance October 23, 2008 Energy Security Erec Isaacson Vice President, Commercial Assets ConocoPhillips Alaska, Inc. Cautionary Statement FOR THE PURPOSES OF THE SAFE HARBOR PROVISIONS OF THE PRIVATE
FY 2008 Second Quarter Results Briefing November 2008
 FY 2008 Second Quarter Results Briefing November 2008 The forecast data presented herein reflects assumed results based on conditions that are subject to change. Nabtesco Corporation does not make representations
A perspective on the refining industry. Platts European Refining Summit Brussels, 29 September2016 Kristine Petrosyan, International Energy Agency
 A perspective on the refining industry Platts European Refining Summit Brussels, 29 September2016 Kristine Petrosyan, International Energy Agency OECD/IEA 2016 mb/d European refiners: busy 2015 OECD Europe
FY2/17 (March 2016~February 2017)
") FY2/17 (March 2016~February 2017) Fact Book 1. Trends in the current fiscal year and previous fiscal year 3. Business overview (1) Performance overview P. 1 (1) No. of students at the end of month P. 7
FY2/17 (March 2016~February 2017) Fact Book 1. Trends in the current fiscal year and previous fiscal year 3. Business overview (1) Performance overview P. 1 (1) No. of students at the end of month P. 7