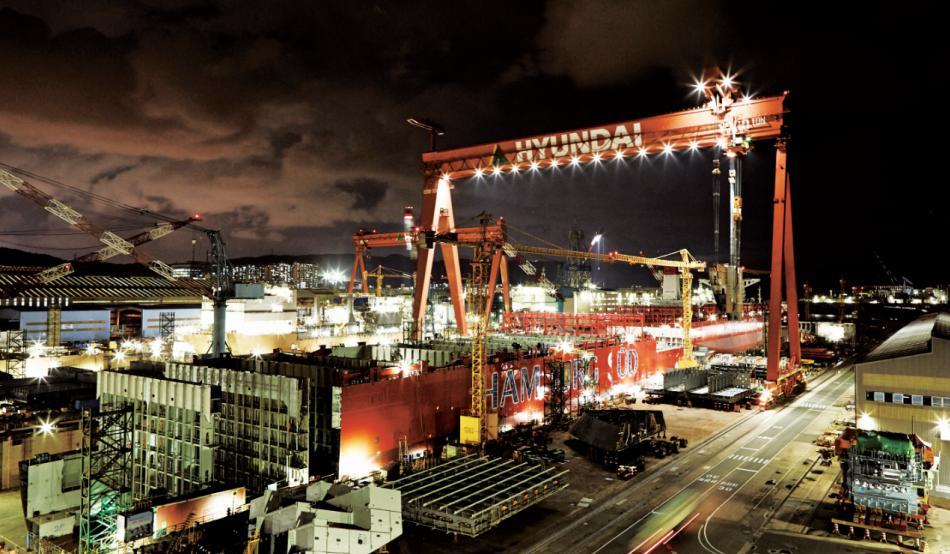
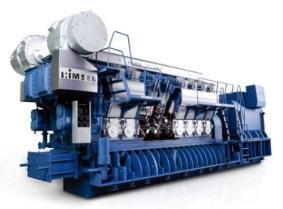
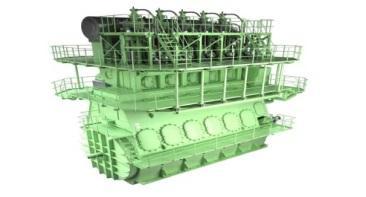
- Shipbuilding Division - Offshore & Engineering and Industrial Plant Division - Engine & Machinery Division
|
|
|
- Gladys Boone
- 5 years ago
- Views:
Transcription
1
2

3 - Shipbuilding Division - Offshore & Engineering and Industrial Plant Division - Engine & Machinery Division - Financial Summary of HHI - Financial Summary of HMD New Order & Sales Target
4


5 HMD 3.9 KCC 6.8 National Pension Fund 9.1 Asan Foundation 3.1 HHIH 27.7 Treasury Stocks
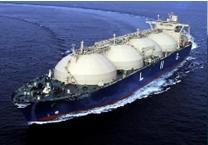
6 1973 ~ ~ Establishment of Hyundai Shipbuilding & Heavy Industries Co. Ltd Establishment of Hyundai Mipo Dockyard Delivery of World`s biggest Jack (Exxon, 40,000 Ton) Delivery of Korea`s first LNG Carrier Listed on Korean Stock Exchange Selected as a main contractor of the next Korean submarine Builder Completion of the World`s largest deep-sea FPSO(343K Ton) Separation from Hyundai Group and foundation of HHI Group Launch of World`s first ship built on the ground (105K DWT Crude Oil Carrier) Completion of H-Dock, eligible for 1,000K Ton FPSO construction Surpassed cumulative 2-stroke engine production of 100 mil. BHP Completion of World`s largest Saudi MARAFIQ power plant (2,750 MW) Delivery of the World`s first LNG-FSRU Recognition as the World`s Significant Ship for 32 consecutive yrs Completion of the World`s largest Cylindrical FPSO Produced Eco-friendly Tier-III engine for the first time in the world Breakthrough the production of accumulating 10,000 HMSEN Engines Delivery of MOS type LNG Carrier Business Spin-off Rights Offering Announcement of Corporate Governance Reform
7 [ Spin-off ] April 2017 HHI Holdings HHI HEE HCE HDO (*) (*)
8 3.9% -
9
10 1. Financial Summary (Consolidated) (Unit : Bil. KRW) (Unit : Bil. KRW) 54,188 52,582 46,232 39,317 15,469 3,043 3,124 3,242 40,000 30,000 20,000 10, % 220.8% 220.9% 34,175 36,746 34,234 31, % 145.8% 131.1% 129.7% 119.0% 18,037 17,728 17,394 16, % 200% 100% '13 '14 '15 '16 '17 '18. 1Q '18. 2Q '18. 3Q 0 '13 '14 '15 '16 '17 '18. 1Q '18. 2Q '18. 3Q 0% 3,600 8% 1, % 1.5% 1, % 0.9% 4% % '13 '14 '15 '16 '17 '18. 1Q '18. 2Q '18. 3Q -3.3% ,800-4% -1, % -6.2% -3, % -3,250-8% 20,000 15,000 10,000 5, % 108.7% 89.8% 83.3% 15,843 16,543 16,852 16, % 1.4% 3.4% 7.0% 2, '13 '14 '15 '16 '17 '18. 1Q '18. 2Q '18. 3Q 150% 100% 50% 0%
11 2. Quarterly Operating Income Margin 16,000 Sales Revenue Operating Margin 10.00% 14,000 12,000 10, % 2.64% 4.55% 0.41% 2.87% 2.21% 1.69% -0.59% -1.40% -0.16% -1.57%-1.43% -2.51% 6.14% 5.65% 3.60% 4.20% 3.30% 3.17% 3.50% 2.00% 0.90% 5.00% 0.00% -4.10% 8, % -5.00% -8.62% 6, % % 4, % 2, % % - 1Q 2Q 3Q 4Q 1Q 2Q 3Q 4Q 1Q 2Q 3Q 4Q 1Q 2Q 3Q 4Q 1Q 2Q 3Q 4Q 1Q 1Q* 2Q 3Q 4Q 1Q 2Q 3Q %
12 3. History of Business Performance before Spin-off (Consolidated) (Unit : Bil. KRW)
13 4. Business Performance after Spin-off (Consolidated) (Unit : Bil. KRW)
14 5. Earnings of Major Affiliates (Non-consolidated) (Unit : Bil. KRW)
15
16 New Order Trend (HHI continue-to-exist Consolidated) 35,000 30,000 25,000 20,000 15,000 10,000 5, , , ,238 14, ,426 2,662 1,295 Shipbuilding Offshore & Industrial Plant Engine Machinery 3,248 2,425 2,646 4,646 10,899 1,880 5,054 3,176 2,843 1,566 5,494 1,858 3,987 29,358 2,283 6,149 5,178 3,798 4, ,079 20,773 20,948 16,795 1,452 1,995 1,860 7,261 2,830 11,871 10,806 12,417 8,545 1,363 1,345 2, , ,17612, ,852 5,914 '01 '02 '03 '04 '05 '06 '07 '08 '09 '10 '11 '12 '13 '14 '15 '16 '17 '18(E) 18.11
17 World Shipbuilding Market Share Rank Shipbuilder Output in 2017 (# of Vessels) (1,000 DWT) Market Share 1 Hyundai Heavy Industries Co., Ltd.(KOR) 53 7, % 2 Daewoo Shipbldg. & Maritime Engineering (KOR) 38 5, % 3 Shanghai Waigaoqiao Shipbuilding (CHN) 28 5, % 4 Hyundai Samho Heavy Industreis. Co., Ltd.(KOR) 33 4, % 5 Samsung Heavy Industries Co., Ltd.(KOR) 37 4, % 6 New Times Shipbuilding (CHN) 26 2, % 7 Oshima Shipbuilding (JPN) 38 2, % 8 Dalian shipbuilding Industry (CHN) 12 2, % 9 Hyundai Mipo Dockyard Co., Ltd.(KOR) 53 2, % 10 GSI Nansha (CHN) 16 1, % Rest Total 1,150 58, % 1,484 99, % HHI Group , % (Source : Clarkson)
18 Global Demand '07 '08 '09 '10 '11 '12 '13 '14 '15 '16 '17 '18.11 Bulkers Tankers Containers LNGC's LPGC's Bulkers Tankers Containers LNGC's LPGC's Nov Nov
19 Newbuilding Price Trend Bulker180K dwt (Left) Tanker 320K dwt (Left) Container 13,000 teu(left) LPGC 78-84K m3 (Left) 30 '07 '08 '09 '10 '11 '12 '13 '14 '15 '16 '17 '18 0 LNGC 160K m3 (Right)
20 Shipbuilding 50% Tanker 26% LNGC 22% LPGC 14% Bulker 2% Tanker 32% LNGC 22% LPGC 6% Bulker 9% Container 28% Naval 6% 2% CNTR 20% Naval 11% 9,003 10,905 9,487 9,766 10,159 9,512 9,349 7,849 6,143 4,061 8,736 7,536 6,192 5,984 6,805 4,833 4,680 3,877 4, (E) Sales New Order

21 2 2 Tanker 61% Container 2% LNGC 8% 10% LPGC 10% PCTC 9% Tanker 77% CNTR 5% LNGC 7% LPGC 9% 2% P/C 55% LPGC 22% Ro-Ro 7% 16% P/C 74% LPGC 6% CNTR 1% Ro-Ro 6% 13%
22 Container 14% Bulker 17% Gas Carrier 37% Tanker 32% Bulker 8% 27% Container 15% Tanker 16% Gas Carrier 34% 2016 Jan. Feb. Mar. Apr. May Jun. Jul. Aug. Sep. Oct. Nov. Dec. Total Target # of Ships Amount 3, ,187 4,702 4,300
23 Gas Carrier 11% Bulker 20% Container 15% 1% Tanker 53% Bulker 11% Gas Carrier 17% Containers 9% 4% Tankers 59% Ro-Ro 10% Gas Carrier 9% 7% P/C 74% Ro-Ro 8% LEGC 8% LPGC 10% 11% P/C 63% 2016 Jan. Feb. Mar. Apr. May Jun. Jul. Aug. Sep. Oct. Nov. Dec. Total Target HMD HSHI # Amount , # Amount 1, ,826 2,300
24 CNTR 30% LPGC 14% Tanker 19% LNGC 35% Bulker 6% CNTR 20% 18% LPGC 8% Tanker 17% LNGC 31% 2017 Jan. Feb. Mar. Apr. May Jun. Jul. Aug. Sep. Oct. Nov. Dec. Total Target # of Ships Amount 4, , , ,232 6,805
25 Bulker 7% LPGC 3% LNGC 47% 6% Tanker 17% CNTR 20% CNTR 17% Bulker 11% LPGC 4% 4% LNGC 36% Tanker 28% CNTR 36% LPGC 8% 4% P/C 52% Bulker Ro-Ro 3% 6% LEGC 5% LPGC 4% CNTR 17% 4% P/C 61% 2017 Jan. Feb. Mar. Apr. May Jun. Jul. Aug. Sep. Oct. Nov. Dec. Total Target HMD HSHI # Amount 2, , # Amount 2, ,562 3,371
26 Offshore & Engineeri ng 17% Fixed Platform 74% Fixed 75% Floaters 26% Floating 25% ,753 4,373 4,653 4,467 3,729 3,423 3,413 3, , , (E) Sales New Orders
27 (Mil. USD) '18.11 (As of Nov. 2018, Unit: Mil. USD) Fixed 1,501 2,121 1, , Floaters 1,303 1, ,735 1, Pipeline Expected Delivery Major Project (Owner) Delivery basis Backlog Sales basis Competion Total 3,069 4,480 2,072 6,503 6,005 1, NASR 2 (ADMA-OPCO) 2, % Fixed Floating Type # of projects Platforms 92 Onshore Facilities & 16 Major Projects SHWE Platform (Daewoo Intl., 2013) Clair Ridge Platform (BP, 2016) Gorgon LNG Plant Modules (Chevron, 2016) Jack-up Rig 2 MSC Jack-up Rig (A. P. Moller 2004) FPSO 12 FPU 5 Goliat FPSO (Eni Norge AS, 2015) Quad 204 FPSO (BP, 2016) Moho Bilondo FPU (Total E&P Congo, 2008) TLP 2 West Seno TLP (Unocal, 2003) King's Quay FPS % 0 63 Total (2 Projects) 2, Semi-Submersible Drilling Rig 3 Deepwater Horizon (R&B Falcon, 2000) Subsea Pipelines 35 Offshore Gas Spur Line (PTT PCL, 2011)
28 Industrial Plant 13% Oil & Gas 43% Plant Equip. 17% Power Plant 45% Oil & Gas 67% Plant Equip. 12% Power Plant 16% 4,077 4,396 4,174 2,826 2,826 2,761 1,898 2,010 1,480 1,014 1,259 2,429 1,256 1,258 2,240 1,360 1, (E) Sales New Orders
 Expected Delivery Delivery basis Backlog Sales basis Completion Oil & Gas 409 1,005 567 111 1,250 1,253 315 34 108 Total 2,010")

29 (As of Nov. 2018, Unit: $mil.) (Mil. USD) '18.11 Power Plant 1, ,510 4, Projects Owner (Country) Expected Delivery Delivery basis Backlog Sales basis Completion Oil & Gas 409 1, ,250 1, Total 2,010 1,014 4,077 4,396 1,256 1, Shuqaiq Steam Power Plant SEC (Saudi) 2018 (PAC*) 3, % Jazan Refinery & Thermal Project** Aramco (Saudi) % Jeddah South (Oct. 2012) bil. USD / Saudi Electricity Co, - 2,400MW Oil fired Conventional Power Plant Clean Fuel Project ZOR Refinery Project KNPC (Kuwait) KNPC (Kuwait) ,096 (16) 102% , % Shuqaiq Power Plant (Aug. 2013) bil. USD / Saudi Electricity Co. - 2,640MW Oil fired Conventional Power Plant Total (4 PJTs) , Clean Fuel Project (Apr. 2014) bil. USD / Kuwait National Petroleum Company, Kuwait - Upgrade and expansion of Refinery * PAC: Provisional Acceptance Certificate ** Jazan Refinery & Thermal Proejct : Constructed by HHI`s overseas Corp.
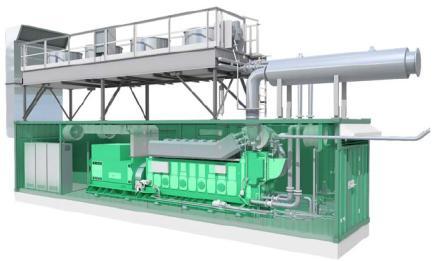
30 Engine & Machinery 12% Large-sized Engine 64% Mid-sized Engine 9% Sternpost 4% 6% Power Plant Engine 12% Environment al Equip. 5% Large-sized Engine 62% Mid-sized Engine 8% 5% Sternpost 6% Power Plant Engine 6% Environment al Equip. 13% ,772 2, ,096 2, ,313 2, , , ,197 1, (E) Sales New Orders
31

32
33 3, % -26.4% 3, , , % -17.8% 3, , % -91.6% Loss Turned Increase Loss-making % -1.5%p -9.1%p -4.1% 3.5% Loss Turned Increase Loss-making
34 % -20.9% % -18.5% % -42.1% % -57.9% % -0.8%p -3.0%p 4.2% 6.4% , , , , , , , , , , , , , , , Turned Turned Loss-making Loss-making , , , ,
35 8,418 83% 24,724 13, ,232 92% 13,574 10, % % 6, ,345 99% 1,962 1, ,880 63% 4,044 2, , % 7,593 5, ,860 90% 36,361 22, ,674 96% 25,211 18,


36
- Shipbuilding Division - Offshore & Engineering and Industrial Plant Division - Engine & Machinery Division
 - Shipbuilding Division - Offshore & Engineering and Industrial Plant Division - Engine & Machinery Division - Financial Summary of HHI - Financial Summary of HMD - 2018 New Order HMD 3.9 KCC 6.8 National
KCC 6.8 HMD 3.9. National Pension 9.1. Hyundai Motors 2.9. HHI Holdings Asan Foundation 3.0. Treasury Stock 0.1. Others 46.5
 HMD 3.9 KCC 6.8 National Pension 9.1 Hyundai Motors 2.9 HHI Holdings 27.7 Asan Foundation 3.0 Others 46.5 Treasury Stock 0.1 1973 ~ 2010 2011 ~ 2018 12. 1973 Establishment of Hyundai Shipbuilding & Heavy
HHI at a Glance. Financial Performance. Business Performance. Current Issues
 (2016.02) 1 Important Notice This presentation of Hyundai Heavy Industries (HHI) contains forward-looking statements relating to HHI s operations that are based on management s current expectations, estimates
Hyundai Heavy Industries IR Presentation. (Apr. 2017)
") Hyundai Heavy Industries IR Presentation (Apr. 2017) 1 Important Notice This presentation of Hyundai Heavy Industries (HHI) contains forward-looking statements relating to HHI s operations that are based
Hyundai Heavy Industries IR Presentation (Apr. 2017) 1 Important Notice This presentation of Hyundai Heavy Industries (HHI) contains forward-looking statements relating to HHI s operations that are based
Hyundai Heavy Industries IR Presentation ( )
") Hyundai Heavy Industries IR Presentation (2017. 02) 1 Important Notice This presentation of Hyundai Heavy Industries (HHI) contains forward-looking statements relating to HHI s operations that are based
Hyundai Heavy Industries IR Presentation (2017. 02) 1 Important Notice This presentation of Hyundai Heavy Industries (HHI) contains forward-looking statements relating to HHI s operations that are based
HHI at a Glance. Financial Performance. Business Performance
 (11. 2015) 1 Important Notice This presentation of Hyundai Heavy Industries (HHI) contains forward-looking statements relating to HHI s operations that are based on management s current expectations, estimates
HHI at a Glance. Financial Performance. Business Performance
 (9. 2015) 1 Important Notice This presentation of Hyundai Heavy Industries (HHI) contains forward-looking statements relating to HHI s operations that are based on management s current expectations, estimates
HHI at a Glance. Financial Performance. Business Performance
 (9. 2015) 1 Important Notice This presentation of Hyundai Heavy Industries (HHI) contains forward-looking statements relating to HHI s operations that are based on management s current expectations, estimates
H H I at a Glance. Business Performance
 1 Important Notice This presentation of Hyundai Heavy Industries (HHI) contains forward-looking statements relating to HHI s operations that are based on management s current expectations, estimates and
H H I at a Glance. Business Performance. Financial Performance
 (2015.1) 1 Important Notice This presentation of Hyundai Heavy Industries (HHI) contains forward-looking statements relating to HHI s operations that are based on management s current expectations, estimates
Commercial-in-Confidence Ashton Old Baths Financial Model - Detailed Cashflow
 Year 0 1 2 3 4 5 6 7 8 9 10 11 12 13 Oct-16 Nov-16 Dec-16 Jan-17 Feb-17 Mar-17 Apr-17 May-17 Jun-17 Jul-17 Aug-17 Sep-17 Oct-17 2,038 2,922 4,089 4,349 6,256 7,124 8,885 8,885 8,885 8,885 8,885 8,885 9,107
H H I at a Glance. Business Performance. Financial Performance
 (2015.4) 1 Important Notice This presentation of Hyundai Heavy Industries (HHI) contains forward-looking statements relating to HHI s operations that are based on management s current expectations, estimates
ORDERBOOK OBSERVER M A R C H
 ORDERBOOK OBSERVER M A R C H 2 1 7 Tanker Orderbook by Builder Country Rank Country No. Mn Dwt Mn CGT Tanker Orders by Size Segment Share (%) of Total 1 South Korea 18 25.5 5. 38.8% 2 China 159 21.1 4.3
COMPARISON OF FIXED & VARIABLE RATES (25 YEARS) CHARTERED BANK ADMINISTERED INTEREST RATES - PRIME BUSINESS*
 CHARTERED BANK ADMINISTERED INTEREST RATES - PRIME BUSINESS*") COMPARISON OF FIXED & VARIABLE RATES (25 YEARS) 2 Fixed Rates Variable Rates For Internal Use Only. FIXED RATES OF THE PAST 25 YEARS AVERAGE RESIDENTIAL MORTGAGE LENDING RATE - 5 YEAR* (Per cent) Year
COMPARISON OF FIXED & VARIABLE RATES (25 YEARS) 2 Fixed Rates Variable Rates For Internal Use Only. FIXED RATES OF THE PAST 25 YEARS AVERAGE RESIDENTIAL MORTGAGE LENDING RATE - 5 YEAR* (Per cent) Year
COMPARISON OF FIXED & VARIABLE RATES (25 YEARS) CHARTERED BANK ADMINISTERED INTEREST RATES - PRIME BUSINESS*
 CHARTERED BANK ADMINISTERED INTEREST RATES - PRIME BUSINESS*") COMPARISON OF FIXED & VARIABLE RATES (25 YEARS) 2 Fixed Rates Variable Rates FIXED RATES OF THE PAST 25 YEARS AVERAGE RESIDENTIAL MORTGAGE LENDING RATE - 5 YEAR* (Per cent) Year Jan Feb Mar Apr May Jun
COMPARISON OF FIXED & VARIABLE RATES (25 YEARS) 2 Fixed Rates Variable Rates FIXED RATES OF THE PAST 25 YEARS AVERAGE RESIDENTIAL MORTGAGE LENDING RATE - 5 YEAR* (Per cent) Year Jan Feb Mar Apr May Jun
Korean Shipbuilding Industry & Policy
 Korean Shipbuilding Industry & Policy June 6th 2018 MOTIE Ministry of Trade, Industry and Energy Outline 1. Shipbuilding Market (1) 2016 was a year with a historically low level of new-building demand
Global and China FPSO Industry Report, Dec. 2011
 Global and China FPSO Industry Report, 2011 Dec. 2011 STUDY GOAL AND OBJECTIVES This report provides the industry executives with strategically significant competitor information, analysis, and insight
Petrobras. Nelson Silva Chief Strategy and Performance Officer April, 2017
 Petrobras Nelson Silva Chief Strategy and Performance Officer April, 2017 Agenda - Petrobras among the peers - Tracking the 2017-2021 Business and Management Plan (BMP) - Zero Base Budget - Risk Management
DETAIL OF MAJOR EXPERIENCE LIST OF COMPLETED OIL & GAS CONTRACT FOR THE PAST 12 YEARS
 Certificate : KLR 6003645 Name Duration/ 1. NA Samsung Heavy Industries Co., Ltd. - Management of comm. / May 2001 Dec 2002 Dec 2002 8500 0 0 0 12600 1250 (Carigali-Triton Operating Company) Commissioning
OILFIELD TECHNICAL INSPECTION SDN BHD
 OILFIELD TECHNICAL INSPECTION SDN BHD GENERAL PRESENTATION FOR OFFSHORE EUROPE ABERDEEN 3 rd 6 th SEPTEMBER 2013 BACKGROUND OTI was established on 30 August 2005 Our primary business focus is pipeline
BUSINESS OVERVIEW FEBRUARY
 BUSINESS OVERVIEW FEBRUARY 2018 Except for historical information, the statements made in this presentation constitute forward looking statements. These include statements regarding the intent, belief
CONFIDENCE DYNA-MAC HOLDINGS LTD.
 Dyna-Mac Holdings Ltd. 3Q 2018 Results 08-November-2018 Photo: SBM Offshore FORWARD WITH CONFIDENCE DYNA-MAC HOLDINGS LTD. 1 Photo: SBM Offshore Business Overview 2 About Dyna-Mac A multi-disciplinary
WOOSUNG INSULATION INDUSTRY
 WS-201712 ISO 9001:2015 WOOSUNG INSULATION INDUSTRY 46028 132, MYEONGNYESANDAN 5-RO, JANGAN-EUP, GIJANG-KUN, BUSAN, KOREA TEL : +82 51 753-2772 FAX : +82 51 753-2771 HAMEPAGE : http://www.wsins.co.kr
Marine & Diesel Division
 Marine & Diesel Division Peter Leifland Executive Vice President Alfa Laval Group Industry mix and growth drivers - Distribution of orders LTM September 2015 Ship building Marine Environ., Gas & Energy
ASTRA AGRO LESTARI PT (AALI IJ) BHINNEKA INVESTMENT GROUP
 BHINNEKA INVESTMENT GROUP") 1-Nov-16 1-Dec-16 1-Jan-17 1-Feb-17 1-Mar-17 1-Apr-17 1-May-17 1-Jun-17 1-Jul-17 1-Aug-17 1-Sep-17 1-Oct-17 ASTRA AGRO LESTARI PT (AALI IJ) BHINNEKA INVESTMENT GROUP PT Astra Agro Lestari Tbk operates
1-Nov-16 1-Dec-16 1-Jan-17 1-Feb-17 1-Mar-17 1-Apr-17 1-May-17 1-Jun-17 1-Jul-17 1-Aug-17 1-Sep-17 1-Oct-17 ASTRA AGRO LESTARI PT (AALI IJ) BHINNEKA INVESTMENT GROUP PT Astra Agro Lestari Tbk operates
1. Trends in the current fiscal year and previous fiscal year 3. Business overview 2. Secular trends in first quarter financial results
 FY2/19 (March 2018~May 2018) Fact Book 1. Trends in the current fiscal year and previous fiscal year 3. Business overview (1) Performance overview P. 1 (1) No. of students at the end of month P. 6 (2)
Marine Money - Odfjell SE. Leveraging an industrial platform to outperform the cycle
 Marine Money - Odfjell SE Leveraging an industrial platform to outperform the cycle Odfjell SE - Key facts Established in 1914 Listed on Oslo Stock Exchange since 1986 One of the worlds largest operator
Global Monthly March 2019
 Global Monthly March 19 Percent of world bonds outstanding 3 5 15 5 Jan-1 Jun-1 Nov-1 Apr-15 Sep-15 Feb-1 Jul-1 Dec-1 May-17 Oct-17 Mar-1 Aug-1 Dec-1 Mar-19 March 19 Percent, year-on-year 7 5 3 1 1Q1 1Q
Floating Production What s New In April
 Page 1 of 5 Floating Production What s New In April Jim McCaul IMAstudies Current Inventory 321 oil/gas floating production units are now in service, on order or available for reuse on another field. FPSOs
Ministério de Minas e Energia. Minister Eduardo Braga. Brazil - Texas Chamber of Commerce - BRATECC May/2015
 1 Minister Eduardo Braga Brazil - Texas Chamber of Commerce - BRATECC May/2015 2 3 World s 7 th largest economy; Investment grade Fiscal adjustment taking place; Inflation being controlled; Large and diversified
Martin Stopford President, Clarkson Research
 9//5 Current and past policies for expanding maintaining or reducing shipbuilding capacity: OECD Working Party No 6 9 th November 5 Martin Stopford President, Clarkson Research Martin Stopford, Clarkson
NJ Solar Market Update As of 6/30/15
 NJ Solar Market Update As of 6/30/ Prepared by Charlie Garrison July 17, 20 SOLAR INSTALLED CAPACITY DATA The preliminary installed solar capacity as of 6/30/ is approximately 1,500.7 MW. Approximately
US Crude Oil Reshaping International Crude Oil Flows. Olivier Jakob,
 US Crude Oil Reshaping International Crude Oil Flows Olivier Jakob, ojakob@petromatrix.com www.petromatrix.com Claimer Petromatrix publishes since 2006 a daily market note on the oil markets Our reports
FY2/18 2Q(March 2017~August 2018)
") FY2/18 2Q(March 2017~August 2018) Fact Book 1. Trends in the current fiscal year and previous fiscal year 3. Business overview (1) Performance overview P.1 (1) No. of students at the end of month P.7 (2)
FY2/18 2Q(March 2017~August 2018) Fact Book 1. Trends in the current fiscal year and previous fiscal year 3. Business overview (1) Performance overview P.1 (1) No. of students at the end of month P.7 (2)
Up and Down Months of the Stock Market
 Up and Down Months of the Stock Market 1926-2017 Positive years (66) in the stock market were not good all year long and losing years (24) were not losers throughout the year. Winning years produce losing
FY2/17 3Q(March 2016~November2016)
") FY2/17 (March 2016~November2016) Fact Book 1. Trends in the current fiscal year and previous fiscal year 3. Business overview (1) Performance overview P. 1 (1) No. of students at the end of month P. 7
FY2/17 (March 2016~November2016) Fact Book 1. Trends in the current fiscal year and previous fiscal year 3. Business overview (1) Performance overview P. 1 (1) No. of students at the end of month P. 7
1 Copyright(C) 2012 Isuzu Motors Limited All rights reserved
 2012 Isuzu Motors Limited All rights reserved") FY2012 Financial Results May 10, 2012 1 Copyright(C) 2012 Isuzu Motors Limited All rights reserved Contents Ⅰ. President and Representative Director : Susumu Hosoi FY2012 Overview Ⅱ. Director Director
FY2012 Financial Results May 10, 2012 1 Copyright(C) 2012 Isuzu Motors Limited All rights reserved Contents Ⅰ. President and Representative Director : Susumu Hosoi FY2012 Overview Ⅱ. Director Director
December 22nd, 2017 / Week 51 THE VIEW FROM THE BRIDGE. Full report can be viewed on the Market Reports tab at the following link:
 December 22nd, 2017 / Week 51 THE VIEW FROM THE BRIDGE Full report can be viewed on the Market Reports tab at the following link: www.compassmar.com Highlight of the week was the announced acquisition
DETAIL OF MAJOR EXPERIENCE ISO 9001:2008 Certificate No.: KLR
 Updated On: September 2017 LIST OF COMPLETED OIL & GAS CONTRACT FOR THE PAST 16 YEARS Page: 1 10 No. Name Client Scope Work Duration / Commence PJ17019-KL-LT Provision Nitrogen/Helium Leak Testing for
/ Preliminary Steel Imports Increase 6% in May Import Market Share at 21%
 News Release FOR IMMEDIATE RELEASE June 21, 2011 CONTACT: NANCY GRAVATT 202.452.7115/ ngravatt@steel.org Preliminary Steel Imports Increase 6% in May Import Market Share at 21% Washington, D.C. Based on
FY H1 Financial Results
 FY2011 1 H1 Financial Results November 8, 2010 1 Copyright(C) 2010 Isuzu Motors Limited All rights reserved Contents Ⅰ. President and Representative Director : Susumu Hosoi :FY2011 H1 Financial Summary
FY2012. H1 Financial Results. November 8, Copyright(C) 2011 Isuzu Motors Limited All rights reserved
 2011 Isuzu Motors Limited All rights reserved") FY2012 H1 Financial Results November 8, 2011 1 Copyright(C) 2011 Isuzu Motors Limited All rights reserved Ⅰ. President and Representative Director : Susumu Hosoi :FY2012 H1 Financial Summary Outline Ⅱ.
FY2012 H1 Financial Results November 8, 2011 1 Copyright(C) 2011 Isuzu Motors Limited All rights reserved Ⅰ. President and Representative Director : Susumu Hosoi :FY2012 H1 Financial Summary Outline Ⅱ.
BUSINESS OVERVIEW 12 February 2019
 BUSINESS OVERVIEW 12 February 2019 Except for historical information, the statements made in this presentation constitute forward looking statements. These include statements regarding the intent, belief
Macroeconomic Outlook. Presented by Dr. Bruce A. Scherr Chairman of the Board Chief Executive Officer Emeritus
 Macroeconomic Outlook Presented by Dr. Bruce A. Scherr Chairman of the Board Chief Executive Officer Emeritus Waterways Symposium Cincinnati, OH November 15-17, 2016 Topics Energy Macro Implications Inflation
Accounting Overview for 2 nd Quarter of FY2014
 1/15 Accounting Overview for 2 nd Quarter of FY2014 October 29, 2013 Yasuhiko Ichihashi President, Member of Board Hino Motors, Ltd. Photos: Vehicles scheduled to be on display at 43rd Tokyo Motor Show
FY2/17 (March 2016~February 2017)
") FY2/17 (March 2016~February 2017) Fact Book 1. Trends in the current fiscal year and previous fiscal year 3. Business overview (1) Performance overview P. 1 (1) No. of students at the end of month P. 7
FY2/17 (March 2016~February 2017) Fact Book 1. Trends in the current fiscal year and previous fiscal year 3. Business overview (1) Performance overview P. 1 (1) No. of students at the end of month P. 7
Leader of Heat Exchangers. Company Introduction. April, 2010 Plant Sales Division. March Homepage : LHE Co., Ltd.
 Leader of Heat Exchangers Company Introduction April, 2010 Plant Sales Division 1 Agenda 1. Who`s LHE 2. What LHE Makes 3. Major Customers 4. References 2 Contents t 1. Who`s LHE - Company Location - Brief
Downstream Petroleum Sector The Growing Prominence of Asian Refining
 Downstream Petroleum Sector The Growing Prominence of Asian Refining Mr. Fahad Al-Dihani Deputy CEO,MAA Refinery, Kuwait National Petroleum Company-Kuwait Outline.. Global refining trends Kuwait s Position
Capital Markets Day 2007 Kongsberg Maritime 25 September 20O7
 Capital Markets Day 27 Kongsberg Maritime 25 September 2O7 WORLD CLASS through people, technology and dedication 1 Kongsberg Maritime Offshore & Merchant Marine Offshore & Merchant Marine Introduction
Dynasty Ceramic. We are making the impossible, POSSIBLE.
 Dynasty Ceramic We are making the impossible, POSSIBLE. Contents Road to Success Sales Reports Cost of Production Performance Competitor Analysis Going Forward Q & A 2 Dynasty Ceramic Road to Success DCC
Marine Money Japan Ship Finance Forum
 Marine Money Japan Ship Finance Forum Current Situation in Shipbuilding -World and Japan- Masashi Terakado The Shipbuilders Association of Japan May 12th, 2016 Contents 1. Current Situation and Projection
GAZIFÈRE INC. Prime Rate Forecasting Process 2017 Rate Case
 Overview A consensus forecast is used to estimate the prime rate charged by commercial banks. As the prime rate is subject to competitive pressures faced by individual lenders and is set on an individual
The Pure Play Tender Drilling Contractor Simplified Overview
 Pareto Conference September 2015 1 The Pure Play Tender Drilling Contractor Simplified Overview Atlantica Tender Drilling Ltd (Bermuda) * 25.26% 100% 99%** BassDrill Alpha Ltd. (Bermuda) Tender barge BassDrill
Baoshan Iron & Steel Co., Ltd. August 2010
 Baoshan Iron & Steel Co., Ltd. August 2010 1 Disclaimer: The following presentation distributed herewith includes forwardlooking statements. All statements, other than statements of historical facts, that
FY2/16(March 2015~February 2016)
") FY2/16(March 2015~February 2016) 1. Trends in the current fiscal year and the previous fiscal year 3. Business overview (1) Peformance overview P.1 (1) No. of students at the end of month P.7 (2) Cost
FY2/16(March 2015~February 2016) 1. Trends in the current fiscal year and the previous fiscal year 3. Business overview (1) Peformance overview P.1 (1) No. of students at the end of month P.7 (2) Cost
GLENPOINTE CENTRE WEST, FIRST FLOOR, 500 FRANK W. BURR BOULEVARD TEANECK, NJ (201) February 8th 2019 / Week 6
 February 8th 2019 / Week 6") GLENPOINTE CENTRE WEST, FIRST FLOOR, 500 FRANK W. BURR BOULEVARD TEANECK, NJ 07666 (201) 907-0009 February 8th 2019 / Week 6 THE VIEW FROM THE BRIDGE Full report can be viewed on the Market Reports tab
GLENPOINTE CENTRE WEST, FIRST FLOOR, 500 FRANK W. BURR BOULEVARD TEANECK, NJ 07666 (201) 907-0009 February 8th 2019 / Week 6 THE VIEW FROM THE BRIDGE Full report can be viewed on the Market Reports tab
FY2/18 (March 2017~February 2018)
") FY2/18 (March 2017~February 2018) Fact Book 1. Trends in the current fiscal year and previous fiscal year 3. Business overview (1) Performance overview P. 1 (1) No. of students at the end of month P. 6
FY2/18 (March 2017~February 2018) Fact Book 1. Trends in the current fiscal year and previous fiscal year 3. Business overview (1) Performance overview P. 1 (1) No. of students at the end of month P. 6
Global Overview of Middle Distillates Supply and Demand ICE Market Forum Rotterdam, November 2012
 Global Overview of Middle Distillates Supply and Demand ICE Market Forum Rotterdam, November 2012 About Petromatrix Based in Switzerland (city of Zug) Publishes a daily newsletter on oil markets Mix of
/ PRELIMINARY STEEL IMPORTS INCREASE 15% IN APRIL Import Market Share 27% in April
 News Release FOR IMMEDIATE RELEASE May 23, 2014 CONTACT Lisa Harrison 202.452.7115/ lharrison@steel.org PRELIMINARY STEEL IMPORTS INCREASE 15% IN APRIL Import Market Share 27% in April Washington, D.C.
Supplementary Report. -3rd Quarter of F February 2007 Kawasaki Kisen Kaisha, Ltd.
 Supplementary Report -3rd Quarter of F26 - February 27 Kawasaki Kisen Kaisha, Ltd. 1. Shipping Markets 2. Financial Data 3. Historical Data - For 5 years - Supplemental Information-1 - Shipping Markets
STEEL IMPORTS DOWN 23% FROM PRIOR MONTH IN MAY Finished Import Market Share YTD at 26%
 News Release FOR IMMEDIATE RELEASE June 25, 2018 CONTACT Lisa Harrison 202.452.7115/lharrison@steel.org STEEL IMPORTS DOWN 23% FROM PRIOR MONTH IN MAY Finished Import Market Share YTD at 26% Washington,
/ PRELIMINARY STEEL IMPORTS INCREASE 2% IN MAY Import Market Share 23% in May
 News Release FOR IMMEDIATE RELEASE June 25, 2013 CONTACT Lisa Harrison 202.452.7115/ lharrison@steel.org PRELIMINARY STEEL IMPORTS INCREASE 2% IN MAY Import Market Share 23% in May Washington, D.C. Based
Energy Outlook. U.S. Energy Information Administration. For EnerCom Dallas February 22, 2018 Dallas, TX
 Energy Outlook For EnerCom Dallas Dallas, TX Jeff Barron Industry Economist, U.S. Energy Information Administration U.S. Energy Information Administration Independent Statistics & Analysis www.eia.gov
The ISM Manufacturing Survey Points to Imminent Economic Recovery, Possibly in 2009 May 1, Chart 1
 Northern Trust Global Economic Research 50 South LaSalle Chicago, Illinois 3 northerntrust.com Asha G. Bangalore agb3@ntrs.com The ISM Manufacturing Survey Points to Imminent Economic Recovery, Possibly
GAIA Energy Co., Ltd. Always with Human, Nature and Happiness
 GAIA Energy Co., Ltd 5 Patents No Patent Name Registration and Application Remark 1 Solar Cell Module (Registration) 10-1405444 2 3 4 Solar Cell Module Base For Supporting Solar Cell Module Photovoltaic
Company Presentation 2018 Pareto Oil & Offshore Conference
 Company Presentation 2018 Pareto Oil & Offshore Conference Atlantica highlights Tender drilling rigs serve as key field infrastructure Atlantica owns and operates two purpose-built semi tender drilling
2Q06 Results. Investor Relations
 2Q06 Results Investor Relations Content 1. 2Q06 Key Results 2. Summarized Income Statement 3. Balance Sheet as of Jun. 2006 4. Outlook for 2006 5. Result & Outlook By Division Appendix : 2Q06 Results Breakdown
HHI-EMD NEWS HYUNDAI HEAVY INDUSTRIES ENGINE & MACHINERY DIVISION
 HHI-EMD NEWS HYUNDAI HEAVY INDUSTRIES ENGINE & MACHINERY DIVISION Vol. 38 August 2015 www.hhi.co.kr www.hyundai-engine.com Hyundai Heavy s Record Production Milestone of 150,000,000 bhp in Marine Engines
Commercial Highlights
 1 3 Fleet Composition Tanker - as at 31 Dec Bulk Post-Panamax (5 vessels) 276,009 DWT Handysize (5 vessels) 435,260 DWT Supramax (5 Product Tanker (3 Carriers vessels) 156,302 DWT 142,129 DWT Grand-total
Recent Developments in International Seaborne Trade and Maritime Transport
 Recent Developments in International Seaborne Trade and Maritime Transport IFSPA, Hong Kong, 3-5 June 2013 Dr. Vincent F. Valentine Officer-in-Charge, Transport Section Division on Technology and Logistics
WORLD CLASS through people, technology and dedication. KONGSBERG September 20,
 WORLD CLASS through people, technology and dedication KONGSBERG September 20, 2006 1 Kongsberg Maritime Offshore & Merchant Marine Focusing on core technologies building strong application knowledge sales
Preliminary Steel Imports, Down 14% in June, Increase 35% in First Half of Year; Import Market Share 21% in Second Quarter 2010
 News Release FOR IMMEDIATE RELEASE July 27, 2010 CONTACT: NANCY GRAVATT 202.452.7115/ ngravatt@steel.org Preliminary Steel Imports, Down 14% in June, Increase 35% in First Half of Year; Import Market Share
July 27, Copyright(C) 2006 Isuzu Motors Ltd. All rights reserved. FORWARD-New Long Term Emission version. ELF-CNG version
 2006 Isuzu Motors Ltd. All rights reserved. FORWARD-New Long Term Emission version. ELF-CNG version") ELF-CNG version FORWARD-New Long Term Emission version 2.5L/3.0L Super Clean & Economy Diesel Isuzu D-MAX GIGA-New Long Term Emission version July 27, 2006 1 Copyright(C) 2006 Isuzu Motors Ltd. All rights
ELF-CNG version FORWARD-New Long Term Emission version 2.5L/3.0L Super Clean & Economy Diesel Isuzu D-MAX GIGA-New Long Term Emission version July 27, 2006 1 Copyright(C) 2006 Isuzu Motors Ltd. All rights
Balance from your previous bill $0.00 Meter # Basic Charge: 17 $ /day 3.23* Energy charge:¹ 2
 11983979 Jun 19, 217 1 124 962 Jul 11, 217 $24.34 Meter Reading Previous Bill. Balance from your previous bill $. Meter # 552711 May 3 19813 Account Account charge 12.4* Charges 17 days 82 Jun 15 19895
Sound Transit Operations July 2016 Service Performance Report. Ridership
 Ridership Total Boardings by Mode Mode Jul-15 Jul-16 % YTD-15 YTD-16 % ST Express 1,618,779 1,545,852-4.5% 10,803,486 10,774,063-0.3% Sounder 333,000 323,233-2.9% 2,176,914 2,423,058 11.3% Tacoma Link
IR Presentation SAMSUNG ENGINEERING 2
 IR Presentation SAMSUNG ENGINEERING 2 0 1 5 1 Introduction CONTENTS 2 Business Update 3 Appendix Introduction Business Portfolio Hydrocarbon Refinery Gas Petrochemical Upstream CDU/VDU HDS Aromatics Alkylation
Petroleum and Natural Gas Situation
 Petroleum and Natural Gas Situation John C. Felmy Chief Economist and Director Statistics Department American Petroleum Institute Felmyj@api.org www.api.org www.gasolineandyou.org www.naturalgasfacts.org
ANCR CRU Statistics February 2007 to December 2007
 ANCR CRU Statistics February 2007 to December 2007 o Jan/07 Feb/07* Mar/07 Apr/07 May/07 Jun/07 Jul/07 Aug/07 Sep/07 Oct/07 Nov/07 Dec/07 Total notes data from Perimeter phone system unavailable prior
STEEL IMPORTS UP 15% IN 2017 Finished Import Market Share Increased to 27%
 News Release FOR IMMEDIATE RELEASE January 26, 2018 CONTACT Lisa Harrison 202.452.7115/lharrison@steel.org STEEL IMPORTS UP 15% IN 2017 Finished Import Market Share Increased to 27% Washington, D.C. Based
North American Storage and Transportation Trends
 North American Storage and Transportation Trends Brian Busch Director, Oil Markets and Business Development www.genscape.com 2016 Genscape Incorporated. All rights reserved. What we do 2 Current State
Methanol as an Alternative Marine Fuel. 6th Chemical & Product Tanker Conference. London 12th March 2014 Ulf T Freudendahl
 Methanol as an Alternative Marine Fuel. 6th Chemical & Product Tanker Conference. London 12th March 2014 Ulf T Freudendahl The Immediate Challenge g NOx/kWh 16 14 IMO NOx Technical code NOx Tier II - 2011
NJ Solar Market Update As of 2/29/16
 NJ Solar Market Update As of 2/29/16 Prepared by Charlie Garrison March 24, 2016 SOLAR INSTALLED CAPACITY DATA The installed solar capacity as of 2/29/16 is approximately 1,644.3 MW. Approximately 20.3
2007 3Q Investor Meeting. November 2007
 2007 3Q Investor Meeting November 2007 Company Overview Cumulative 3Q 2007 Results Result By Division Appendix Company Overview Overview Doosan Infracore is the largest machinery company in Korea and also
FY 2006 Third Quarter Review
 FY 26 Third Quarter Review February 2, 27 Nissan Motor Co., Ltd 1 Agenda Third quarter news update Sales performance Financial results FY6 Outlook Sustainable growth 2 Third quarter news update Oct 1)
Global Leader of Battery Industry
 Global Leader of Battery Industry Global Battery Co., Ltd is the company representing Korean battery industry. Now, Global Battery Co., Ltd is concentrating the efforts in order to jump to the top battery
Thursday, March 6, 2014 Houston, TX. 8:30 9:40 a.m. AN ECONOMIST S-EYE VIEW OF THE ENERGY INDUSTRY: HYDROCARBON HAT TRICK
 Thursday, March 6, 214 Houston, TX 8:3 9:4 a.m. AN ECONOMIST S-EYE VIEW OF THE ENERGY INDUSTRY: HYDROCARBON HAT TRICK Presented by Jesse Thompson Business Economist Federal Reserve Bank of Dallas, Houston
STEEL IMPORTS UP 17% IN JANUARY Finished Import Market Share at 26%
 News Release FOR IMMEDIATE RELEASE February 26, 2018 CONTACT Lisa Harrison 202.452.7115/lharrison@steel.org STEEL IMPORTS UP 17% IN JANUARY Finished Import Market Share at 26% Washington, D.C. Based on
FINISHED STEEL IMPORT MARKET SHARE AT 25% IN JANUARY
 News Release FOR IMMEDIATE RELEASE March 27, 2019 CONTACT Lisa Harrison 202.452.7115/lharrison@steel.org FINISHED STEEL IMPORT MARKET SHARE AT 25% IN JANUARY Washington, D.C. Based on preliminary Census
MCCS INTERNATIONAL DETAIL OF MAJOR EXPERIENCE LIST OF OIL & GAS CONTRACT FOR THE PAST 18 YEARS. - Manpower Supply - Equipment Rental (Offshore)
") Page: 1 14 No. Name Client Scope Work Duration / Commence Schedule Onshore Offshore PJ18091-KL-LT Provision Leak Testing services for Bergading PCHE (Printed Circuit Heat Exchanger) PBJV GROUP SDN BHD
Page: 1 14 No. Name Client Scope Work Duration / Commence Schedule Onshore Offshore PJ18091-KL-LT Provision Leak Testing services for Bergading PCHE (Printed Circuit Heat Exchanger) PBJV GROUP SDN BHD
ANALYST BRIEFING FOR THE THIRD QUARTER ENDED NOV 2016
 ANALYST BRIEFING FOR THE THIRD QUARTER ENDED 2016 21 NOV 2016 MSM Malaysia Holdings Berhad Analyst Briefing Q3 2016 21/11/2016 1 CONTENTS 01 02 03 04 05 Group Financial Highlights Performance Review Sugar
ANALYST BRIEFING FOR THE FOURTH QUARTER ENDED FEBRUARY 2017
 ANALYST BRIEFING FOR THE FOURTH QUARTER ENDED 2016 22 FEBRUARY 2017 MSM Malaysia Holdings Berhad Analyst Briefing Q4 2016 22/2/2017 1 CONTENTS 01 02 03 04 05 Group Financial Highlights Performance Review
3Q 2013 Financial Results (US GAAP) New York, November 2013
 New York, November 2013") 3Q 2013 Financial Results (US GAAP) New York, November 2013 Forward-Looking Statements Certain statements in this presentation are not historical facts and are forward-looking. Examples of such forward-looking
3Q 2013 Financial Results (US GAAP) New York, November 2013 Forward-Looking Statements Certain statements in this presentation are not historical facts and are forward-looking. Examples of such forward-looking
Preliminary Steel Imports Increase 16% in January Highest Total Imports Since January 2009
 News Release FOR IMMEDIATE RELEASE February 23, 2010 CONTACT: NANCY GRAVATT 202.452.7115/ ngravatt@steel.org Preliminary Steel Imports Increase 16% in uary Highest Total Imports Since uary 2009 Washington,
Q Analyst Teleconference. 9 August 2018
 9 August 218 Disclaimer This presentation contains forward-looking statements that reflect the Company management s current views with respect to certain future events. Although it is believed that the
STEEL IMPORTS DOWN 5% YEAR-TO-DATE THROUGH FEBRUARY Finished Import Market Share YTD at 25%
 News Release FOR IMMEDIATE RELEASE March 23, 2018 CONTACT Lisa Harrison 202.452.7115/lharrison@steel.org STEEL IMPORTS DOWN 5% YEAR-TO-DATE THROUGH FEBRUARY Finished Import Market Share YTD at 25% Washington,
Months Investor Presentation
 2018 9 Months Investor Presentation 25.10.2018 Disclaimer Ereğli Demir Çelik Fabrikaları T.A.Ş. (Erdemir) may, when necessary, make written or verbal announcements about forward-looking information, expectations,
CREDIT UNION ESTIMATES
 MONTHLY CREDIT UNION ESTIMATES Prepared June 1, 2018 by Credit Union National Association Economics and Statistics Department cuna.org/mcue Loans Credit union loans outstanding grew 1.1% in, matching the
Monthly Operating Report. September 2016
 Monthly Operating Report September 20 September overview» For the month of September 20 Contact recorded: Electricity, gas and steam sales of 819 GWh (September 2015: 821 GWh) Netback of $79.50/MWh (September
CREDIT UNION ESTIMATES
 MONTHLY CREDIT UNION ESTIMATES Prepared July 2, 2018 by Credit Union National Association Economics and Statistics Department cuna.org/mcue Loans Credit union loans outstanding grew 1.3% in, compared to
STEEL IMPORTS DOWN 10% YEAR-TO-DATE Finished Import Market Share YTD at 25%
 News Release FOR IMMEDIATE RELEASE August 24, 2018 CONTACT Lisa Harrison 202.452.7115/lharrison@steel.org STEEL IMPORTS DOWN 10% YEAR-TO-DATE Finished Import Market Share YTD at 25% Washington, D.C. Based