RCFC & WCD RATIONAL METHOD CALCULATION FORM
|
|
|
- Clarissa Watson
- 6 years ago
- Views:
Transcription
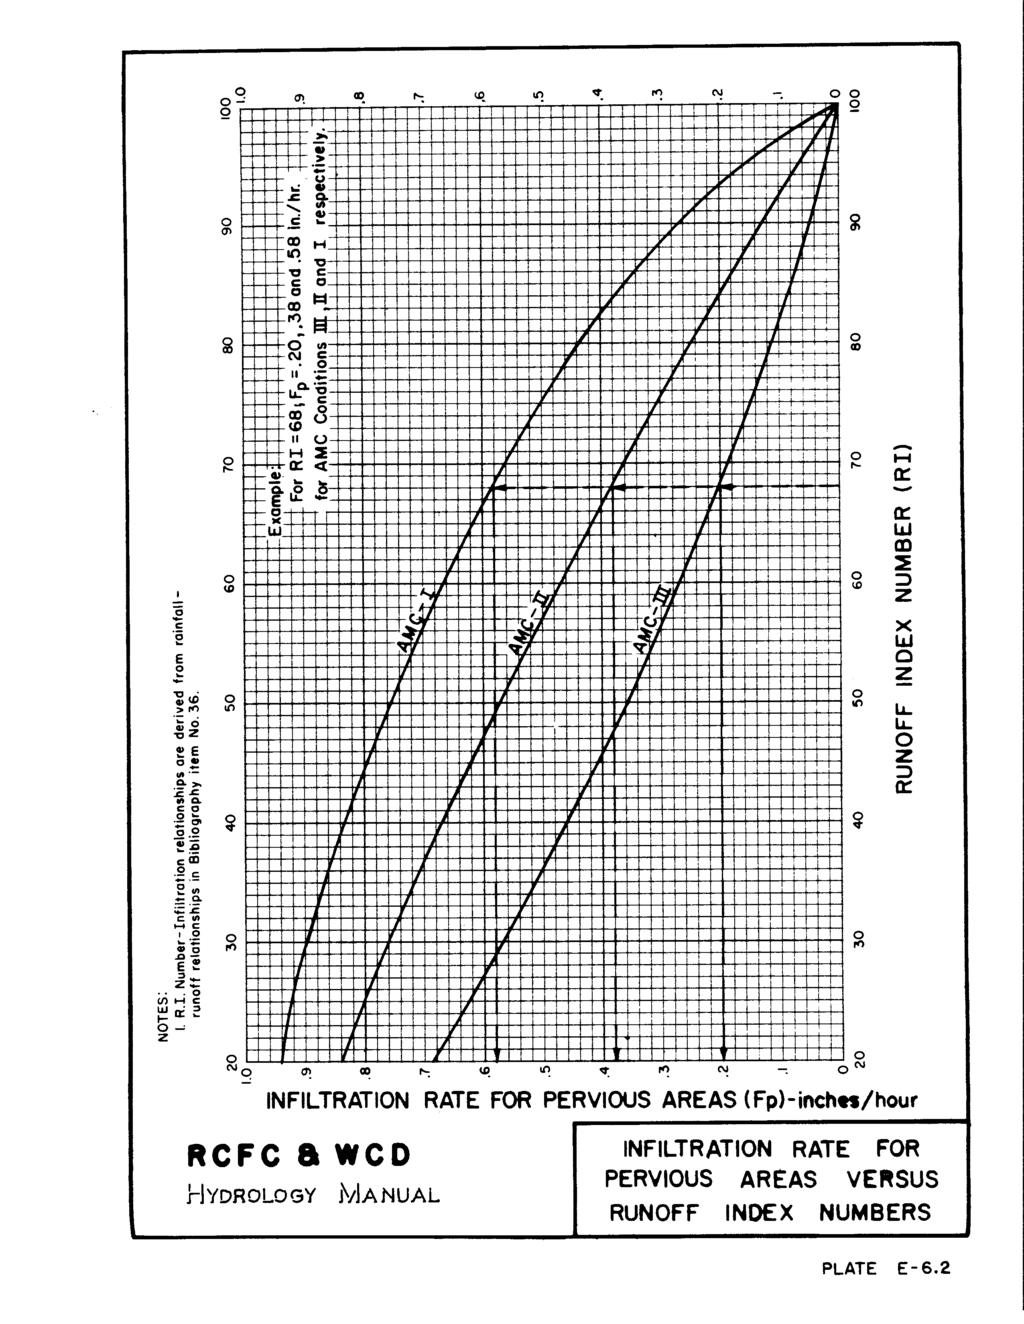
1 RCFC & WCD RATIONAL METHOD CALCULATION FORM HYDROLOGY MANUAL PROJECT: Tentative Tract Map No Calculated by: TL Group Corp. Date: 7/2/2015 FREQUENCY: EXISTING 2 - YR STORM Checked by: Date: Drainage Area Soil & Development A I C Q Sum of Q SLOPE SECTION V L Tn Sum of T Volume Acres in/hr cfs cfs fps ft min min cf A-1 Undeveloped ' Street Initial Area 3, B-1 Undeveloped " RCP Initial Area 6, C-1 Undeveloped ' Street Initial Area 5, D-1 Undeveloped Initial Area 7, E-1 Undeveloped Initial Area 4, F-1 Undeveloped Initial Area 2, TOTAL , Type AMC Soil Group Ai Area RI Fp F Fm Ap decimal percent Plate E-6.1 inches/hr Fp*(1-0.9*Ai) 0.50*F 1-Ai (F-Fm)/54 A-1 II D B-1 II D C-1 II D D-1 II D E-1 II D F-1 II D C [Ai+((I-Fp)/I)*Ap]
2 RCFC & WCD RATIONAL METHOD CALCULATION FORM HYDROLOGY MANUAL PROJECT: Tentative Tract Map No Calculated by: TL Group Corp. Date: 7/2/2015 FREQUENCY: EXISTING 10 - YR STORM Checked by: Date: Drainage Area Soil & Development A I C Q Sum of Q SLOPE SECTION V L Tn Sum of T Volume Acres in/hr cfs cfs fps ft min min cf A-1 Undeveloped ' Street Initial Area 7, B-1 Undeveloped " RCP Initial Area 15, C-1 Undeveloped ' Street Initial Area 12, D-1 Undeveloped Initial Area 19, E-1 Undeveloped Initial Area 10, F-1 Undeveloped Initial Area 5, TOTAL , Type AMC Soil Group Ai Area RI Fp F Fm Ap decimal percent Plate E-6.1 inches/hr Fp*(1-0.9*Ai) 0.50*F 1-Ai (F-Fm)/54 A-1 II D B-1 II D C-1 II D D-1 II D E-1 II D F-1 II D C 0.9[Ai+((I-Fp)/I)*Ap]
3
4
5 RCFC & WCD RATIONAL METHOD CALCULATION FORM HYDROLOGY MANUAL PROJECT: Tentative Tract Map No Calculated by: TL Group Corp. Date: FREQUENCY: PROPOSED 2 - YR STORM Checked by: Date: 7/2/2015 Drainage Area Soil & Development A I C Q Sum of Q SLOPE SECTION V L Tn Sum of T Volume Acres in/hr cfs cfs fps ft min min cf A-1 Single Family Housing ' Street Initial Area 17, A-2 Single Family Housing " RCP " RCP 17, A-3 Single Family Housing ' Street Initial Area 18, B-1 Landscaping Vegetated Swale Initial Area TOTAL , Confluence (Qp) Qa=10.0 cfs, Ta=12, Ia=2.12 in/hr Qb=5.20 cfs, Tb=10.5, Ib=2.27 in/hr Qp = Qa + Qb*(Ia/Ib) Qp = Type AMC Soil Group Ai Area RI Fp F Fm Ap decimal percent Plate E-6.1 inches/hr Fp*(1-0.9*Ai) 0.5*F 1-Ai (F-Fm)/54 A-1 II D A-2 II D A-3 II D B-1 II D C 0.9[Ai+((I-Fp)/I)*Ap]
6 RCFC & WCD RATIONAL METHOD CALCULATION FORM HYDROLOGY MANUAL PROJECT: Tentative Tract Map No Calculated by: TL Group Corp. Date: 7/2/2015 FREQUENCY: PROPOSED 10 - YR STORM Checked by: Date: Drainage Area Soil & Development A I C Q Sum of Q SLOPE SECTION V L Tn Sum of T Volume Acres in/hr cfs cfs fps ft min min cf A-1 Single Family Housing ' Street Initial Area 34, A-2 Single Family Housing " RCP " RCP 34, A-3 Single Family Housing ' Street Initial Area 35, B-1 Landscaping Vegetated Swale Initial Area 1, TOTAL , Confluence (Qp) Qa=10.0 cfs, Ta=12, Ia=2.12 in/hr Qb=5.20 cfs, Tb=10.5, Ib=2.27 in/hr Qp = Qa + Qb*(Ia/Ib) Qp = Type AMC Soil Group Ai Area RI Fp F Fm Ap decimal percent Plate E-6.1 inches/hr Fp*(1-0.9*Ai) 0.5*F 1-Ai (F-Fm)/54 A-1 II D A-2 II D A-3 II D B-1 II D C 0.9[Ai+((I-Fp)/I)*Ap]
7
8
9
10
11
12


13 Precipitation Frequency Data Server Page 1 of 4 NOAA Atlas 14, Volume 6, Version 2 Location name: Wildomar, California, US* Latitude: , Longitude: Elevation: 1290 ft* * source: Google Maps POINT PRECIPITATION FREQUENCY ESTIMATES Sanja Perica, Sarah Dietz, Sarah Heim, Lillian Hiner, Kazungu Maitaria, Deborah Martin, Sandra Pavlovic, Ishani Roy, Carl Trypaluk, Dale Unruh, Fenglin Yan, Michael Yekta, Tan Zhao, Geoffrey Bonnin, Daniel Brewer, Li-Chuan Chen, Tye Parzybok, John Yarchoan NOAA, National Weather Service, Silver Spring, Maryland PF_tabular PF_graphical Maps_&_aerials Duration 5-min 10-min 15-min 30-min 60-min 2-hr 3-hr 6-hr 12-hr 24-hr 2-day 3-day 4-day 7-day 10-day 20-day 30-day 45-day 60-day PF tabular PDS-based point precipitation frequency estimates with 90% confidence intervals (in inches) 1 Average recurrence interval (years) ( ) ( ) ( ) ( ) ( ) ( ) ( ) 1.03 ( ) 1.36 ( ) 1.79 ( ) 2.15 ( ) 2.32 ( ) 2.49 ( ) 2.84 ( ) 3.02 ( ) 3.61 ( ) 4.24 ( ) 4.93 ( ) 5.66 ( ) ( ) ( ) ( ) ( ) ( ) ( ) ( ) 1.35 ( ) 1.80 ( ) 2.44 ( ) 3.02 ( ) 3.31 ( ) 3.60 ( ) 4.13 ( ) 4.39 ( ) 5.30 ( ) 6.24 ( ) 7.22 ( ) 8.22 ( ) ( ) ( ) ( ) ( ) ( ) 1.02 ( ) 1.25 ( ) 1.77 ( ) 2.39 ( ) 3.30 ( ) 4.18 ( ) 4.64 ( ) 5.08 ( ) 5.87 ( ) 6.28 ( ) 7.67 ( ) 9.05 ( ) 10.5 ( ) 11.9 ( ) ( ) ( ) ( ) ( ) ( ) 1.22 ( ) 1.50 ( ) 2.11 ( ) 2.87 ( ) 4.00 ( ) 5.12 ( ) 5.74 ( ) 6.31 ( ) 7.34 ( ) 7.87 ( ) 9.70 ( ) 11.5 ( ) 13.3 ( ) 15.2 ( ) ( ) ( ) ( ) ( ) 1.08 ( ) 1.51 ( ) 1.85 ( ) 2.60 ( ) 3.53 ( ) 4.94 ( ) 6.41 ( ) 7.25 ( ) 8.02 ( ) 9.39 ( ) 10.1 ( ) 12.6 ( ) 15.0 ( ) 17.6 ( ) 19.9 ( ) ( ) ( ) ( ) ( ) 1.25 ( ) 1.75 ( ) 2.12 ( ) 2.98 ( ) 4.05 ( ) 5.67 ( ) 7.41 ( ) 8.43 ( ) 9.36 ( ) 11.0 ( ) 11.9 ( ) 15.0 ( ) 17.9 ( ) 21.0 ( ) 23.9 ( ) ( ) ( ) ( ) ( ) 1.43 ( ) 1.98 ( ) 2.41 ( ) 3.37 ( ) 4.57 ( ) 6.41 ( ) 8.43 ( ) 9.65 ( ) 10.8 ( ) 12.7 ( ) 13.8 ( ) 17.5 ( ) 21.0 ( ) 24.8 ( ) 28.3 ( ) 1 Precipitation frequency (PF) estimates in this table are based on frequency analysis of partial duration series (PDS) ( ) ( ) ( ) 1.05 ( ) 1.61 ( ) 2.24 ( ) 2.71 ( ) 3.79 ( ) 5.11 ( ) 7.16 ( ) 9.49 ( ) 10.9 ( ) 12.2 ( ) 14.5 ( ) 15.9 ( ) 20.3 ( ) 24.4 ( ) 28.8 ( ) 33.0 ( ) ( ) ( ) ( ) 1.22 ( ) 1.87 ( ) 2.58 ( ) 3.13 ( ) 4.35 ( ) 5.85 ( ) 8.19 ( ) 10.9 ( ) 12.7 ( ) 14.3 ( ) 17.1 ( ) 18.7 ( ) 24.1 ( ) 29.3 ( ) 34.7 ( ) 39.8 ( ) ( ) ( ) ( ) 1.36 ( ) 2.07 ( ) 2.86 ( ) 3.45 ( ) 4.80 ( ) 6.42 ( ) 8.98 ( ) 12.1 ( ) 14.1 ( ) 15.9 ( ) 19.2 ( ) 21.0 ( ) 27.3 ( ) 33.2 ( ) 39.5 ( ) 45.4 ( ) Numbers in parenthesis are PF estimates at lower and upper bounds of the 90% confidence interval. The probability that precipitation frequency estimates (for a given duration and average recurrence interval) will be greater than the upper bound (or less than the lower bound) is 5%. Estimates at upper bounds are not checked against probable maximum precipitation (PMP) estimates and may be higher than currently valid PMP values. Please refer to NOAA Atlas 14 document for more information. Back to Top PF graphical 7/11/2015


14 Precipitation Frequency Data Server Page 2 of 4 Back to Top Maps & aerials Small scale terrain Map 50 km data 2015 Google, INEGI 7/11/2015


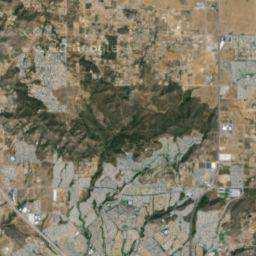

15 Precipitation Frequency Data Server Page 3 of 4 7/11/ km Map data 2015 Google Large scale map 2 km Map data 2015 Google Large scale aerial Back to Top 2 km Imagery 2015 TerraMetrics US Department of Commerce National Oceanic and Atmospheric Administration National Weather Service Office of Hydrologic Development 1325 East West Highway Silver Spring, MD 20910
16 Precipitation Frequency Data Server Page 4 of 4 7/11/2015 Questions?: HDSC.Questions@noaa.gov Disclaimer
 Full-flow area Af = 3.14 sq ft Full-flow wetted perimeter Pf = 6.28 ft Half Central Angle Theta = 3.")
17 Circular Pipe Flow Project: Wildomar Pipe ID: Outlet Design Information (Input) Pipe Invert Slope So = ft/ft Pipe Manning's n-value n = Pipe Diameter D = inches Design discharge Q = 18.9 cfs Full-flow Capacity (Calculated) Full-flow area Af = 3.14 sq ft Full-flow wetted perimeter Pf = 6.28 ft Half Central Angle Theta = 3.14 rad Full-flow capacity Qf = 32.1 cfs Calculation of Normal Flow Condition Half Central Angle (0<Theta<3.14) Theta = 1.68 rad Flow area An = 1.78 sq ft Top width Tn = 1.99 ft Wetted perimeter Pn = 3.35 ft Flow depth Yn = 1.10 ft Flow velocity Vn = fps Discharge Qn = 18.9 cfs Normal Depth Froude Number Fr n = 1.98 Calculation of Critical Flow Condition Half Central Angle (0<Theta-c<3.14) Theta-c = 2.17 rad Critical flow area Ac = 2.64 sq ft Critical top width Tc = 1.65 ft Critical flow depth Yc = 1.56 ft Critical flow velocity Vc = 7.17 fps Critical Depth Froude Number Fr c = 1.00 Outlet-pipe, Pipe 8/3/2015, 9:59 PM
Swale Storage/ Length Between Ditch Blocks
 Swale Storage/ Length Between Ditch Blocks Input: Roadway Grade 1.00 % Front Slope 4 :1 Bottom Width 0 ft Back Slope 3 :1 Swale Depth 1.50 ft Calculations: Cross-Sectional Swale Area = 7.88 ft 2 DITCH
ATTACHMENT D (As referenced in Attachment B ) (Hydrology and Hydraulics Study)
 (Hydrology and Hydraulics Study)") ATTACHMENT D (As referenced in Attachment B ) (Hydrology and Hydraulics Study) Southern California Edison So Cal Gas Sub-transmission Project Hydrology and Hydraulics Study January 2014 2 Hydrology & Hydraulics
ATTACHMENT D (As referenced in Attachment B ) (Hydrology and Hydraulics Study) Southern California Edison So Cal Gas Sub-transmission Project Hydrology and Hydraulics Study January 2014 2 Hydrology & Hydraulics
Hydraulic Report. County Road 595 Bridge over Second River. Prepared By AECOM Brian A. Hintsala, P.E
 Prepared for: Prepared by: Marquette County Road Commission AECOM Ishpeming, MI Marquette, MI 60240279 December 9, 2011 Hydraulic Report County Road 595 Bridge over Second River Prepared By AECOM Brian
PARISH OF ASCENSION OFFICE OF PLANNING AND DEVELOPMENT PLANNING DEPARTMENT
 1. Call To Order 2. Roll Call of Members 3. Introduction of Staff 4. Chairman's Comments PARISH OF ASCENSION OFFICE OF PLANNING AND DEVELOPMENT PLANNING DEPARTMENT Joint Planning and Zoning Meeting March
INFLOW DESIGN FLOOD CONTROL SYSTEM PLAN
 INFLOW DESIGN FLOOD CONTROL SYSTEM PLAN CFR 257.82(c) Bottom Ash Complex Mitchell Power Plant Marshall County, West Virginia October, 2016 Prepared for: Wheeling Power Company & Kentucky Power Company
HYDROLOGIC/HYDRAULIC ANALYSIS REPORT FOR THE TROLLEY BROOK CULVERT ASHLAND, MA
 HYDROLOGIC/HYDRAULIC ANALYSIS REPORT FOR THE TROLLEY BROOK CULVERT ASHLAND, MA Prepared for: THE TOWN OF ASHLAND BOARD OF SELECTMEN AND PLANNING DEPARTMENT Prepared by: June 3, 216 Hydrologic/Hydraulic
Appendix I. Canning River Fan Stream Data
 Appendix I Canning River Fan Stream Data Table 1: Available Stream Width and Bankfull Data Collected on the Canning River Fan Within 5 Miles of the Coast Stream Width (ft) Ordinary Top of Flood- Site
Reliability Animal Detection System US Hwy 191 in Yellowstone NP, MT
 Reliability Animal Detection System US Hwy 191 in Yellowstone NP, MT Marcel Huijser, Whisper Camel & Amanda Hardy Animal detection system and driver response Operational animal detection system Non-operational
Hydraulics Guide. Table 1: Conveyance Factors (English Units)... 7 Table 2: Conveyance Factors (Metric Units)... 8
... 7 Table 2: Conveyance Factors (Metric Units)... 8") Table of Contents 1.1 Index of Tables... 1 1.2 Index of Figures... 1 1.3 Overview of Hydraulic Considerations... 2 1.4 Discharge Curves... 2 1.5 Conveyance Method... 5 1.6 Flow Velocity Considerations...
Table of Contents 1.1 Index of Tables... 1 1.2 Index of Figures... 1 1.3 Overview of Hydraulic Considerations... 2 1.4 Discharge Curves... 2 1.5 Conveyance Method... 5 1.6 Flow Velocity Considerations...
CULVERT DESIGN WITH HY-8
 Back to the Basics CULVERT DESIGN WITH HY-8 Purdue University Road School 2006 Your Presenters... Merril Dougherty INDOT, Hydraulics Unit Supervisor David Finley CTE Engineers, Inc. 1 Part One: Culvert
Solargis Report. Solar Resource Overview. Plataforma Solar de Almeria, Spain. 03 August Solargis s.r.o.
 Solargis Report Solar Resource Overview Site name: Plataforma Solar de Almeria, Spain Date of Issue: 03 August 2017 Type of Data: Daily time series (01/01/1994-31/12/2016) Customer: Solargis s.r.o. Issued
Memorandum October 5, 2017
 614 Magnolia Avenue Ocean Springs, Mississippi 39564 228.818.9626 Memorandum October 5, 2017 To: Gary Miller, U.S. Environmental Protection Agency From: David Keith, John Laplante, Matt Henderson, and
2005 City of Santa Paula Potable Water System Master Plan Amendment
 2005 City of Santa Paula Potable Water System Master Plan Amendment City of Santa Paula Project Engineer Randy Toedter, PE Brian Yanez June, 2012 970 Ventura Street Santa Paula, CA 93060 PURPOSE OF THE
DRAFT REPORT TXDOT SH 183 MASTER DRAINAGE STUDY HYDRAULIC ANALYSIS OF ELM FORK OF TRINITY RIVER CROSSING AT SH 183 WITHIN THE ELM FORK WATERSHED
 DRAFT REPORT TXDOT SH 183 MASTER DRAINAGE STUDY HYDRAULIC ANALYSIS OF ELM FORK OF TRINITY RIVER CROSSING AT SH 183 WITHIN THE ELM FORK WATERSHED FOR TEXAS DEPARTMENT OF TRANSPORTATION DALLAS DISTRICT CONTRACT
CSO/STORMWATER MANAGEMENT. Hydrovex VHV / SVHV Vertical Vortex Flow Regulator
 CSO/STORMWATER MANAGEMENT Hydrovex VHV / SVHV Vertical Vortex Flow Regulator HYDROVEX VHV / SVHV VERTICAL VORTEX FLOW REGULATOR INTRODUCTION One of the major problems of urban wet weather flow management
Bacteria TMDLs for Brays Bayou November 11, 2008
 Bacteria TMDLs for Brays Bayou November 11, 2008 PARSONS Outline Watershed Overview Pollutant Pollutant Source Assessment Technical Approach: Load Duration Curves TMDL TMDL Calculations Brays Bayou Watershed
CCoWS. Central Coast Watershed Studies. Summary of Precipitation and Streamflow for Potrero and San Clemente Creeks in Water-Year 2008
 Central Coast Watershed Studies CCoWS Summary of Precipitation and Streamflow for Potrero and San Clemente Creeks in Water-Year 2008 Santa Lucia Preserve Monterey County, California Publication No. WI-2009-01
CONCEPTUAL UTILITY REPORT FOR THE CANYONS PHASE 1 CITY OF CASTLE PINES, CO
 CONCEPTUAL UTILITY REPORT FOR THE CANYONS PHASE 1 CITY OF CASTLE PINES, CO PREPARED FOR: SHEA HOMES 9380 STATION ST., SUITE 600 LONE TREE, CO 80124 PHONE: 303-791-8180 CONTACT: RYAN MCDERMED PREPARED BY:
DESIGN RAINFALL DATA
 Unit 4: Design Rainfall Data Page 4-1 DESIGN RAINFALL DATA For stormwater management system design purposes, most engineers use point rainfall. Design rainfall data typically is given in terms of accumulated
Solargis Report. Solar Resource Overview. Plataforma Solar de Almeria, Spain. 03 August Solargis s.r.o.
 Solargis Report Solar Resource Overview Site name: Plataforma Solar de Almeria, Spain Date of Issue: 03 August 2017 Type of Data: Hourly time series (01/01/1994-31/12/2016) TMY P50 (01/01/1994-31/12/2016)
Figure 1. Southern Chesapeake 2 & 3 Watershed MDPU Map Southern Chesapeake Watershed MDPU Study Areas 2 & 3 City of Chesapeake, Virginia 17
 Hydraulic Connection with Cooper's Ditch Hydraulic Connection with Cooper's Ditch Homestead Outfall Subcatchments 0,750 3,500 Figure. Southern Chesapeake 2 & 3 Watershed MDPU Map City of Chesapeake, Virginia
Appendix G Aquilla Lake Pool Rise Recreational Resources
 Appendix G Aquilla Lake Pool Rise Recreational Resources 1. INTRODUCTION The purpose of this appendix is to document the impacts of a 2.5 ft (Alternative A), 4.5 ft (Alternative B), and 6.5 ft. (Alternative
Wavin Stormwater Management
 CONNECT T'O BETTER Wavin Stormwater Management Project Details Project Name AquaCell Project Produced By Admin 3 Client Name Wavin Site Address Parsonage Way, Chippenham, SN15 5PN Date Modular Units and
Design Criteria Data
 DES MOINES IA Latitude = 41.53 N WMO No. 72546 Longitude = 93.65 W Elevation = 965 feet Period of Record = 1973 to 1996 Average Pressure = 28.96 inches Hg Design Criteria Data Mean Coincident (Average)
Design Criteria Data
 BURLINGTON VT Latitude = 44.47 N WMO No. 72617 Longitude = 73.15 W Elevation = 341 feet Period of Record = 1973 to 1996 Average Pressure = 29.61 inches Hg Design Criteria Data Mean Coincident (Average)
Design Criteria Data
 RAPID CITY SD Latitude = 44.5 N WMO No. 72662 Longitude =3. W Elevation = 3169 feet Period of Record = 1973 to 1996 Average Pressure = 26.67 inches Hg Design Criteria Data Mean Coincident (Average) Values
Design Criteria Data
 COLUMBIA SC Latitude = 33.95 N WMO No. 7231 Longitude = 81.12 W Elevation = 226 feet Period of Record = 1973 to 1996 Average Pressure = 29.8 inches Hg Design Criteria Data Mean Coincident (Average) Values
Design Criteria Data
 PHILADELPHIA PA Latitude = 39.88 N WMO No. 7248 Longitude = 75.25 W Elevation = 3 feet Period of Record = 1973 to 1996 Average Pressure = 29.98 inches Hg Design Criteria Data Mean Coincident (Average)
Design Criteria Data
 MACON/LEWIS WILSON GA Latitude = 32.7 N WMO No. 72217 Longitude = 83.65 W Elevation = 361 feet Period of Record = 1973 to 1996 Average Pressure = 29.66 inches Hg Design Criteria Data Mean Coincident (Average)
Design Criteria Data
 HONOLULU/OAHU HI Latitude = 21.35 N WMO No. 91182 Longitude =157.9 W Elevation = 16 feet Period of Record = 1967 to 1996 Average Pressure = 29.96 inches Hg Design Criteria Data Mean Coincident (Average)
Design Criteria Data
 PIERRE SD Latitude = 44.38 N WMO No. 726686 Longitude =1.2 W Elevation = 1742 feet Period of Record = 1973 to 1996 Average Pressure = 28.1 inches Hg Design Criteria Data Mean Coincident (Average) Values
Design Criteria Data
 ANCHORAGE AK Latitude = 61.17 N WMO No. 7273 Longitude =15. W Elevation = 131 feet Period of Record = 1973 to 1996 Average Pressure = 29.6 inches Hg Design Criteria Data Mean Coincident (Average) Values
Design Criteria Data
 INDIANAPOLIS IN Latitude = 39.73 N WMO No. 72438 Longitude = 86.27 W Elevation = 87 feet Period of Record = 1973 to 1996 Average Pressure = 29.15 inches Hg Design Criteria Data Mean Coincident (Average)
Design Criteria Data
 DENVER/STAPLETON CO Latitude = 39.75 N WMO No. 72469 Longitude =14.8 W Elevation = 5332 feet Period of Record = 1973 to 1995 Average Pressure = 24.66 inches Hg Design Criteria Data Mean Coincident (Average)
FINAL UTILITY REPORT Eastcreek Farm Thornton, CO
 FINAL UTILITY REPORT Eastcreek Farm Thornton, CO October 14, 2016 JN: 13049 Prepared for: York 80, LLC 12460 1 st Street Eastelake, CO 80614 P: 303.457.2966 Prepared by: Jansen Strawn Consulting Engineers
Design Criteria Data
 JACKSONVILLE FL Latitude = 3.5 N WMO No. 7226 Longitude = 81.7 W Elevation = 3 feet Period of Record = 1973 to 1996 Average Pressure = 3.1 inches Hg Design Criteria Data Mean Coincident (Average) Values
Design Criteria Data
 SPOKANE WA Latitude = 47.63 N WMO No. 72785 Longitude =117.5 W Elevation = 2366 feet Period of Record = 1973 to 1996 Average Pressure = 27.5 inches Hg Design Criteria Data Mean Coincident (Average) Values
A demonstration project for recharge in the Upper San Pedro subwatershed COMMUNITY DEVELOPMENT DEPARTMENT
 A demonstration project for recharge in the Upper San Pedro subwatershed COMMUNITY DEVELOPMENT DEPARTMENT Highway and Floodplain Cochise County Grant Grant amount- up to $1,693,265 over 3 years Components:
Design Criteria Data
 LOUISVILLE/STANDIFORD KY Latitude = 38.18 N WMO No. 72423 Longitude = 85.73 W Elevation = 489 feet Period of Record = 1973 to 1996 Average Pressure = 29.49 inches Hg Design Criteria Data Mean Coincident
Design Criteria Data
 SPRINGFLD MO Latitude = 37.23 N WMO No. 7244 Longitude = 93.38 W Elevation = 127 feet Period of Record = 1973 to 1996 Average Pressure = 28.66 inches Hg Design Criteria Data Mean Coincident (Average) Values
Design Criteria Data
 DAYTON/JAMES M COX OH Latitude = 39.9 N WMO No. 72429 Longitude = 84.2 W Elevation = 14 feet Period of Record = 1973 to 1996 Average Pressure = 28.95 inches Hg Design Criteria Data Mean Coincident (Average)
Design Criteria Data
 BIRMINGHAM AL Latitude = 33.57 N WMO No. 72228 Longitude = 86.75 W Elevation = 63 feet Period of Record = 1973 to 1996 Average Pressure = 29.36 inches Hg Design Criteria Data Mean Coincident (Average)
Design Criteria Data
 MIDLAND TX Latitude = 31.95 N WMO No. 72265 Longitude =2. W Elevation = 2861 feet Period of Record = 1973 to 1996 Average Pressure = 27.3 inches Hg Design Criteria Data Mean Coincident (Average) Values
Design Criteria Data
 BOSTON/LOGAN MA Latitude = 42.37 N WMO No. 7259 Longitude = 71.3 W Elevation = 3 feet Period of Record = 1967 to 1996 Average Pressure = 29.95 inches Hg Design Criteria Data Mean Coincident (Average) Values
Design Criteria Data
 MINNEAPOLIS-ST PAUL MN Latitude = 44.88 N WMO No. 72658 Longitude = 93.22 W Elevation = 837 feet Period of Record = 1973 to 1996 Average Pressure = 29.7 inches Hg Design Criteria Data Mean Coincident (Average)
Design Criteria Data
 WASHINGTON/DULLES VA Latitude = 38.95 N WMO No. 7243 Longitude = 77.45 W Elevation = 322 feet Period of Record = 1973 to 1996 Average Pressure = 29.68 inches Hg Design Criteria Data Mean Coincident (Average)
Design Criteria Data
 NEW YORK/JOHN F KENNEDY NY Latitude = 4.65 N WMO No. 74486 Longitude = 73.78 W Elevation = 23 feet Period of Record = 1973 to 1996 Average Pressure = 29.98 inches Hg Design Criteria Data Mean Coincident
Design Criteria Data
 LANDER/HUNT WY Latitude = 42.82 N WMO No. 72576 Longitude =18.7 W Elevation = 5558 feet Period of Record = 1973 to 1996 Average Pressure = 24.44 inches Hg Design Criteria Data Mean Coincident (Average)
Design Criteria Data
 ALBUQUERQUE NM Latitude = 35.5 N WMO No. 72365 Longitude =16.6 W Elevation = 5315 feet Period of Record = 1967 to 1996 Average Pressure = 24.72 inches Hg Design Criteria Data Mean Coincident (Average)
Design Criteria Data
 DULUTH MN Latitude = 46.83 N WMO No. 72745 Longitude = 92.18 W Elevation = 1417 feet Period of Record = 1973 to 1996 Average Pressure = 28.43 inches Hg Design Criteria Data Mean Coincident (Average) Values
Design Criteria Data
 MINOT AFB ND Latitude = 48.42 N WMO No. 727675 Longitude =11.3 W Elevation = 1667 feet Period of Record = 1967 to 1996 Average Pressure = 28.16 inches Hg Design Criteria Data Mean Coincident (Average)
Design Criteria Data
 CHARLESTON/KANAWHA WV Latitude = 38.37 N WMO No. 72414 Longitude = 81.6 W Elevation = 981 feet Period of Record = 1973 to 1996 Average Pressure = 29. inches Hg Design Criteria Data Mean Coincident (Average)
EAGLE RIVER and COLORADO RIVER
 FLOODPLAIN INFORMATION REPORT EAGLE RIVER and COLORADO RIVER EAGLE COUNTY, COLORADO PREPARED FOR: EAGLE COUNTY, COLORADO and the COLORADO WATER CONSERVATION BOARD This Floodplain Information Report of
Eastcreek Farm Thornton, CO
 FINAL UTILITY REPORT Eastcreek Farm Tornton, CO November 27, 27 JN: 349 Prepared for: York, LLC 246 First Street Eastelake, CO 64 P: 33.457.2966 Prepared by: Ware Malcomb Engineering and Surveying 99 S.
Design Criteria Data
 CHICAGO/O HARE IL Latitude = 41.98 N WMO No. 7253 Longitude = 87.9 W Elevation = 673 feet Period of Record = 1967 to 1996 Average Pressure = 29.27 inches Hg Design Criteria Data Mean Coincident (Average)
Design Criteria Data
 MADISON/DANE CO. RGNL WI Latitude = 43.13 N WMO No. 72641 Longitude = 89.33 W Elevation = 866 feet Period of Record = 1973 to 1996 Average Pressure = 29.5 inches Hg Design Criteria Data Mean Coincident
Design Criteria Data
 RENO/CANNON INTL NV Latitude = 39.5 N WMO No. 72488 Longitude =119.7 W Elevation = 44 feet Period of Record = 1973 to 1996 Average Pressure = 25.57 inches Hg Design Criteria Data Mean Coincident (Average)
Final Technical. Memorandum
 Federal Emergency Management Agency Task Or rder #34 Final Technical Memorandum HYDROLOGIC REVIEW FOR THE VENTURA RIVER WATERSHED AND SEVERAL TRIBUTARY STREAMS FLOOD INSURANCE STUDY Ventu ra County, CA
Bacteria TMDLs for Halls Bayou November 10, 2008
 Bacteria TMDLs for Halls Bayou November 10, 2008 PARSONS Outline Watershed Overview Pollutant Pollutant Source Assessment Technical Approach: Load Duration Curves TMDL TMDL Calculations Halls Bayou Watershed
Design Criteria Data
 OKLAHOMA CITY OK Latitude = 35.4 N WMO No. 72353 Longitude = 97.6 W Elevation = 133 feet Period of Record = 1973 to 1996 Average Pressure = 28.62 inches Hg Design Criteria Data Mean Coincident (Average)
Robert L. Griffin, PE. Mark C. Boland, PE. C. Russell McDaniel, PE. President / Chief Operations Officer Shield Engineering, Inc.
 Robert L. Griffin, PE President / Chief Operations Officer Shield Engineering, Inc. Mark C. Boland, PE Principal Engineer Shield Engineering, Inc. C. Russell McDaniel, PE Director Environmental Engineering,
Design Criteria Data
 MEDFORD/JACKSON CO. OR Latitude = 42.37 N WMO No. 72597 Longitude =122.8 W Elevation = 1329 feet Period of Record = 1973 to 1996 Average Pressure = 28.61 inches Hg Design Criteria Data Mean Coincident
LOCAL CLIMATOLOGICAL DATA Monthly Summary April 2017
 Deg. Days Precip Ty Precip Wind Solar Hu- Adj. to Sea Level mid- ity Avg Res Res Peak 2 Minute 1 fog 2 hvy fog 3 thunder 4 ice plt 5 hail 6 glaze 7 duststm 8 smk, hz 9 blw snw 1 2 3 4A 4B 5 6 7 8 9 11
PRELIMINARY UTILITY REPORT FOR TOPGOLF INTERNATIONAL, INC.
 PRELIMINARY UTILITY REPORT FOR TOPGOLF INTERNATIONAL, INC. THORNTON, COLORADO Prepared for: ARCO Murray Contact: Rachel Bohac Phone: 331.251.2726 Prepared by: 1225 17 th Street, Suite 514 Denver, CO 80202
Design Criteria Data
 LAS VEGAS/MCCARRAN NV Latitude = 36.8 N WMO No. 72386 Longitude =115.1 W Elevation = 2179 feet Period of Record = 1973 to 1996 Average Pressure = 27.67 inches Hg Design Criteria Data Mean Coincident (Average)
LOCAL CLIMATOLOGICAL DATA Monthly Summary April 2015
 Deg. Days Precip Ty Precip Wind Solar Hu- Adj. to Sea Level mid- ity Avg Res Res Peak 2 Minute 1 fog 2 hvy fog 3 thunder 4 ice plt 5 hail 6 glaze 7 duststm 8 smk, hz 9 blw snw 1 2 3 4A 4B 5 6 7 8 9 11
LOCAL CLIMATOLOGICAL DATA Monthly Summary April 2012
 Deg. Days Precip Ty Precip Wind Solar Hu- Adj. to Sea Level mid- ity Avg Res Res Peak Minute 1 fog 2 hvy fog 3 thunder 4 ice plt 5 hail 6 glaze 7 duststm 8 smk, hz 9 blw snw 1 2 3 4A 4B 5 6 7 8 9 11 12
Design Criteria Data
 PHOENIX/SKY HARBOR AZ Latitude = 33.43 N WMO No. 72278 Longitude =112. W Elevation = 116 feet Period of Record = 1973 to 1996 Average Pressure = 28.72 inches Hg Design Criteria Data Mean Coincident (Average)
Big Easy RV & Boat Storage A Green Energy Project Jana Lane Wildomar, California
 Big Easy RV & Boat Storage A Green Energy Project 36215 Jana Lane Wildomar, California 1 PROJECT OVERVIEW Project Description The construction and operation of a solar generation facility consisting of
Figure 1. New Mill Creek 3&4 Watershed Map. Subcatchments. Aerial 2009 Commonwealth of Virginia. See GIS for Complete Details. Legend.
 Legend Subcatchments 0 875 1,750 3,500 Figure 1. Mill Creek 3&4 Watershed Map Aerial Imagery @ 2009 Commonwealth of Virginia. 12 URS Nos. 11657980 37 20 Dragston Tomotley complex, 0 to 2 percent slopes
DESIGN STANDARDS SECTION DS 3 STREETS
 DESIGN STANDARDS SECTION DS 3 STREETS DS 3-01 GENERAL: A. INTENT: The intent of these Design Standards is to provide minimum standards for the design of public streets. These standards are intended to
Evaluation of the suitability to European conditions of the WNTE control zone concept as set out in the OCE GTR
 Evaluation of the suitability to European conditions of the WNTE control zone concept as set out in the OCE GTR Henk Dekker - TNO Stefan Hausberger, Martin Rexeis - TUG Patrik Soltic EMPA Heinz Steven
Arctic Freshwater Flux and Change
 Arctic Freshwater Flux and Change Daqing Yang, Doug Kane, Sveta Berezovskaya Water and Environment Research Center, Univ. of Alaska Fairbanks Main Topics Large Arctic River Streamflow Regime and Change
Appendix E Water Supply Modeling
 Supply Modeling Modesto Irrigation District Treatment Plant Expansion Project Modeling I. Introduction The Modesto Irrigation District (MID) is situated adjacent to and north of the Tuolumne River. Over
USDA Farm Service Agency
 USDA Farm Service Agency McIntosh County, North Dakota 1.57 UHEL RP 4 60.78 NHEL 6 142.32 NHEL 17 7 4.6.1 UHEL NHEL T 138 16 226.68 UHEL 5 4.7 NHEL 8 178.37 HEL ") 11 5.65 HEL 15 0.44 UHEL Farm 744 S21
PARMER RANCH NORTHWEST WILLIAMSON COUNTY MUD #2
 PRELIMINARY ENGINEERING REPORT PARMER RANCH NORTHWEST WILLIAMSON COUNTY MUD #2 October 215 Project No. 22223 Prepared by STEGER BIZZELL Texas Registered Engineering Firm F-181 Consulting Engineers - Georgetown,
JOHNSON RANCH RAPID CITY, SOUTH DAKOTA TRAFFIC IMPACT ANALYSIS
 JOHNSON RANCH RAPID CITY, SOUTH DAKOTA TRAFFIC IMPACT ANALYSIS Prepared for: KTM Design Solutions 528 Kansas City Street, Suite 1 Rapid City, SD 57701 Prepared by: Felsburg Holt & Ullevig 6300 South Syracuse
APPENDIX A Basis of Design and Design Criteria Memorandum
 APPENDIX A Basis of Design and Design Criteria Memorandum Job No: Y01-500 Files are stored in: Engineering / Client / Yolo/Y01500 Buckeye and Rumsey/Rumsey CR 41 over Cache Creek, CAD files stored in:
IDEA for GOES-R ABI. Presented by S. Kondragunta, NESDIS/STAR. Team Members: R. Hoff and H. Zhang, UMBC
 IDEA for GOES-R ABI Presented by S. Kondragunta, NESDIS/STAR Team Members: R. Hoff and H. Zhang, UMBC 1 Project Summary Use operational MODIS, GOES Aerosol Optical Depth (AOD) products, and OMI/GOME-2
DRIVEWAY DESIGN AND CONSTRUCTION GUIDELINES
 DRIVEWAY DESIGN AND CONSTRUCTION GUIDELINES These guidelines are provided to assist you in the construction of your driveway to help you determine: The best location on your property. What you need to
Road Surface characteristics and traffic accident rates on New Zealand s state highway network
 Road Surface characteristics and traffic accident rates on New Zealand s state highway network Robert Davies Statistics Research Associates http://www.statsresearch.co.nz Joint work with Marian Loader,
STRUCTURE 5A PURPOSE
 STRUCTURE 5A This structure is a six unit pumping plant located on the south side of U.S. Highway 441 and Canal 51 (West Palm Beach Canal) between the canal and the borrow canals of Levees 7 and 40 about
advanced FLOW engineering Instruction Manual P/N: TT-2016B/L/R Make: Toyota/Scion/Subaru Model: 86/FR-S/BRZ Year: Engine: H4-2.
 advanced FLOW engineering Instruction Manual P/N: TT-2016B/L/R Make: Toyota/Scion/Subaru Model: 86/FR-S/BRZ Year: 2012-2017 Engine: H4-2.0L Please read the entire instruction manual before proceeding.
FEASIBILITY REPORT. 65 th STREET TRUNK WATER MAIN IMPROVEMENTS INVER GROVE HEIGHTS MINNESOTA DAKOTA COUNTY. October 2, 2017
 FEASIBILITY REPORT 65 th STREET TRUNK WATER MAIN IMPROVEMENTS INVER GROVE HEIGHTS MINNESOTA DAKOTA COUNTY October 2, 2017 Prepared for: City of Inver Grove Heights 8150 Barbara Avenue Inver Grove Heights,
Physical Scaling of Water Mist Protection of 260-m 3 Machinery Enclosure
 Physical Scaling of Water Mist Protection of 260-m 3 Machinery Enclosure Hong-Zeng (Bert) Yu International Water Mist Conference October 28 29, 2015 Amsterdam, The Netherlands Background To reduce the
FDOT Debris Staging Areas (LEASED ST. JOE SITES) BAY COUNTY FRANKLIN COUNTY GULF COUNTY
 BAY COUNTY FRANKLIN COUNTY GULF COUNTY") FDOT Debris Staging Areas (LEASED ST. JOE SITES) BAY COUNTY FRANKLIN COUNTY GULF COUNTY Prepared For: Mr. Tom Bowen Florida Department of Transportation District Three Chipley, Florida Prepared By: Post,
FDOT Debris Staging Areas (LEASED ST. JOE SITES) BAY COUNTY FRANKLIN COUNTY GULF COUNTY Prepared For: Mr. Tom Bowen Florida Department of Transportation District Three Chipley, Florida Prepared By: Post,
 SANITARY SCHEDULE ALIGNMENT CODES: 'ES'= EAU CLAIRE AVENUE SB UTILITY REPLACEMENT WITH STREET RESURFACING - 2015 PROJECT NO. 53W1793 EAU CLAIRE AVE SANITARY SEWER SCHEDULE SHEET NO. U-6 CITY OF MADISON
TYPICAL DRIVEWAY CONSTRUCTION PER DOUGLAS COUNTY REGULATIONS AND POLICIES
 TYPICAL DRIVEWAY CONSTRUCTION PER DOUGLAS COUNTY REGULATIONS AND POLICIES This document is a summary of the Douglas County regulations and policies for constructing residential driveways. It is intended
IPCC 5. Assessment report. The physical science basis
 IPCC 5. Assessment report Working Group 1 The physical science basis table of contents Observed changes Changes in the atmosphere Radiative forcing Changes in the ocean Changes in the cryosphere Future
Traffic Safety Facts 1995
 U.S. Department of Transportation National Highway Traffic Safety Administration Traffic Safety Facts 1995 exceeding the posted speed limit or driving too fast for conditions is one of the most prevalent
GATTIS SCHOOL RD / SH 130 SUBDIVISION
 AMISTAD DR MEADOWILD DR NO. DESCRIPTION INDEX ROYAL BURGESS DR. E NAKOMA SITE SH 130 CITY LIMITS LITTLE LAKE RD KAATZ LN ESTATE DR DANA DR MARJORIE DR 1 COVER 2 PRELIMINARY PLAT 3 EXISTING CONDITIONS 4
Habitat Associations of Seabirds and Marine Debris in the North East Pacific at Multiple Spatial Scales
 Habitat Associations of Seabirds and Marine Debris in the North East Pacific at Multiple Spatial Scales Andrew Titmus David Hyrenbach Hawaii Pacific University, Waimanalo, Hawaii Objectives Introduction
DS Preliminary Hydrology Report EAST CAT CANYON FIELD REDEVELOPMENT PROJECT
 DS-13186-117 Preliminary Hydrology Report For EAST CAT CANYON FIELD REDEVELOPMENT PROJECT Prepared for: Aera Energy LLC 10000 Ming Avenue Bakersfield, CA 93311-1302 661-665-5000 Project Address: Sections
APPENDIX TR-1 PARKING AND QUEUING ASSESSMENT
 APPENDIX TR-1 PARKING AND QUEUING ASSESSMENT Overland Overland Traffic Consultants, Traffic Consultants, Inc. Inc. Overland Traffic Consultants 952 Manhattan Beach Boulevard, Suite #100 Manhattan Beach,
Analysis and assessment of the electrification of urban transport based on real-life mobility data
 Analysis and assessment of the electrification of urban transport based on real-life mobility data Michele De Gennaro, Elena Paffumi, Harald Scholz, Giorgio Martini European Commission DG JRC at a glance
CCoWS. Central Coast Watershed Studies. Summary of Precipitation and Streamflow for Potrero and San Clemente Creeks in Water-Year 2007
 Central Coast Watershed Studies CCoWS Summary of Precipitation and Streamflow for Potrero and San Clemente Creeks in Water-Year 2007 Santa Lucia Preserve Monterey County, California Publication No. WI-2008-01
djangoproject.com skillsapp.com for invite)
") DATA DESIGN MEANING djangoproject.com skillsapp.com (tweet @skillsapp for invite) VISUALIZATION SRSLY, GUISE DATA? PROFIT MEANING! acquire parse filter mine represent refine interact acquire parse filter
DATA DESIGN MEANING djangoproject.com skillsapp.com (tweet @skillsapp for invite) VISUALIZATION SRSLY, GUISE DATA? PROFIT MEANING! acquire parse filter mine represent refine interact acquire parse filter
Pure Lead-Tin Technology
 Pure Lead-Tin Technology Pure Lead-Tin technology offers many advantages which include: High overall efficiency High energy density Excellent high rate performance Excellent low temperature performance
Selecting climate change scenarios using impact-relevant sensitivities
 Geophysical Research Letters Supporting Information for Selecting climate change scenarios using impact-relevant sensitivities Julie A. Vano A* John B. Kim B David E. Rupp A Philip W. Mote A A Oregon Climate
1075 CENTRAL AVE SURFACE WATER MANAGEMENT ENGINEERING REPORT. R&B NAPLES HOLDINGS 2, LLC th Street, S. Naples, FL OCTOBER 2014
 1075 CENTRAL AVE SURFACE WATER MANAGEMENT ENGINEERING REPORT FOR: NEW INDIVIDUAL ERP OCTOBER 2014 PREPARED FOR: R&B NAPLES HOLDINGS 2, LLC 2002 4 th Street, S. Naples, FL 34102 AND SOUTH FLORIDA WATER