Road Surface characteristics and traffic accident rates on New Zealand s state highway network
|
|
|
- Dwain York
- 5 years ago
- Views:
Transcription
1 Road Surface characteristics and traffic accident rates on New Zealand s state highway network Robert Davies Statistics Research Associates Joint work with Marian Loader, Peter Cenek & Opus International Consultants. Funded by Transfund 1
2 Copy of my report There is a copy of my report and some related reports on Look in the section statistical analysis 2
3 Why am I giving this talk It represents a slightly unusual analysis The data may be typical of the kind of data we might expect from automatic measuring devices It gets some interesting and possibly important results There are some open questions I may have time to talk about my approach to the statistical computing 3
4 Overview I want to relate road crash (traffic accident) rates to road characteristics: Curvature Skid resistance Gradient etc 4
5 State highway network Network of major roads maintained by the central government 10,000 kilometres We will be considering 2 lane roads (most of the network) exclude divided roads exclude multi lane roads exclude freeways Map on next page 5
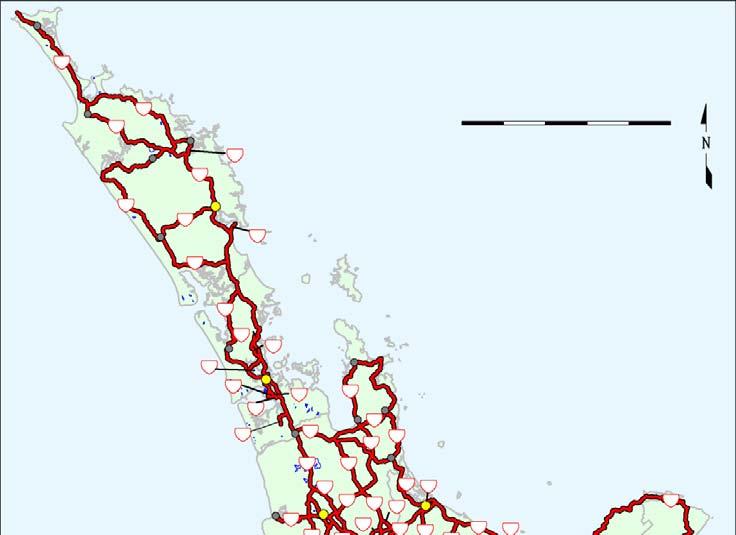


6 6
7 Road crashes (accidents) Consider reported crashes where there is an injury or death Around 3200 per year on the State Highway network Reporting rate 100% for fatal ~50% for serious injury low for minor injury 7
8 Three sets of data SCRIM-plus data for state highway network Land Transport road crash data TransitNZ traffic volume data Six years of data 1997 to
9 First data set SCRIM-plus data curvature (10 metre intervals) gradient (10 metre intervals) crossfall (10 metre intervals) skid resistance (10 metre intervals) roughness (20 metre intervals) texture (10 metre intervals) rut depth (20 metre intervals) skid-site priority for high skid resistance One million data-points on each side of the road for each year. 9
10 First data set - descriptions Crossfall slope across road Texture shows how well water runs off surface Rut depth road surface tends to be lower where car wheels normally go rut depth measures the depth of this Skid site see next page 10
11 skid site Description Notes scrim site investigatory level 4 Normal roads All normal roads. (Undivided carriageways only) Approaches to road junctions Approaches to road junctions. Down gradients 5-10% Curve <250m rad. Gradient>10% Curve <250m radius. Gradient > 10% Highest priority Railway level crossing, approaches to roundabouts, traffic lights, pedestrian crossings and similar hazards Divided carriageway Divided carriageways 0.35
12 Second data set LTSA crash data Reported injury and fatal crashes location movement classification (e.g. overtaking) road condition (e.g. wet) 14,000 crashes over 6 years (number is lower than given previously because we couldn t locate all the crashes) 12
13 Categories for crashes possibly involving skidding A B C D E F G H J K L M N P Q overtaking and lane change head on lost control or off road (straight roads) cornering collision with obstruction rear end turning versus same direction crossing (no turns) crossing (vehicle turning) merging right turn against manoeuvring pedestrians crossing road pedestrians other miscellaneous 13
14 Third data set TransitNZ data Average daily traffic (ADT) Urban or rural Road width Number of lanes 14
15 Preliminary approach to the analysis: two way tables 15
16 Crashrisk crashes per 100 million km of vehicle travel Skid site category Skid resistance range < to to to to 0.7 > (normal) (junctions) (curves, hills) (highest priority)
17 Crashrisk notes about table Yellow shows where we have sufficient data to make inferences Note increase if we go down or left in the table More pronounced for wet crashes Wet rates are lower because we can t allow for the % of time roads are wet 17
18 Number of crashes Skid site category Skid resistance range < to to to to 0.7 > (normal) (junctions) (curves, hills) (highest priority)
19 Crashrisk Wet crash rate Skid site category Skid resistance range < to to to to 0.7 > (normal) (junctions) (curves, hills) (highest priority)
20 Main method of analysis: modified Poisson regression model 20
21 Poisson regression model (with offset) Start with a Poisson regression model: each 10 metre section can generate crashes at a rate a exp(l) where a is the average daily traffic volume L is a linear combination of predictor variables (a also appears in the L term) The actual crash risk is given by exp(l) times some suitable factor to get the units right. 21
22 Two problems: 1: We don t know the location of the crashes very accurately. Therefore average the crash-rates from the model over 100 metres from each side of the site that we want the observed crash-rate for. 2: We don t believe the records for the direction of the vehicle. Therefore sum over the two sides of the road (we aren t doing dual carriageway so there are always two sides). 22
23 Model is no longer standard Poisson regression. But will we can still fit by maximum likelihood 23
24 I tried four different sets of crash data: the complete data; the crashes most likely to have involved skidding; the crashes where the road was wet; the crashes most likely to have involved skidding and where the road was wet. Two analyses on each involving all of the predictors and spline or polynomial functions of the variables; reduced model using simplified functions (no splines) and a smaller number of predictors. 24
25 Predictor DF 1% pt chi sq. year region urban rural skid site category spline(log curvature) poly(log daily traffic) spline(gradient) poly(skid resistance) spline(log roughness)
26 Predictor DF 1% pt chi sq. spline(log roughness) skid site * skid res spline(sqrt rut_depth) cway_width texture lanes_category irr_width crossfall abs(crossfall)
27 Significances Don t believe significance levels Only include effects down to spline(log roughness) Next sheet shows significance levels for the 4 analyses Significant effects are shown in yellow iri = roughness doubtful whether this should be included 27
28 abs_crossfall crossfall irr_width lanes_category texture cway_width spline5(sqrt_rut_depth) skid_site*(scrim ) spline4(log10_iri) poly2_scrim spline6(gradient) poly2_log10_adt spline6(log10_curvature) skid_site urban_rural region year Wet selected Wet Selected All Chi-squared values 1% pt. df Predictor variable
29 Graphs Graphs of estimates of effects Select the most commonly occurring set of X variables Then vary each one in turn and graph the predicted values Don t really believe the confidence bounds Gradient effect probably wrong 29
30 Crash rate versus skid_site 100 Crash rate skid site 30
31 Crash rate versus curvature 100 Crash rate Curvature 31
32 Crash rate versus ADT 100 Crash rate ADT 32
33 Crash rate versus skid resistance 100 Crash rate Scrim coefficient 33
34 Crash rate versus gradient 100 Crash rate Gradient 34
35 Crash rate versus log10 iri 100 Crash rate log10 IRI 35
36 How does this study compare with other studies? Effect of skid resistance
37 Residuals Doesn t make sense to look at residuals in usual sense Divide up roads by highway number intersected by region (8 regions in all) Look at predicted and observed number of crashes Residuals seem to be too large by a factor of 2 37
38 All crashes: observed versus predicted Observed number Predicted number of crashes
39 All crashes: residual versus predicted 8 Normalised residual Predicted number of crashes 39
40 Wet road crashes: residual versus predicted 6 4 Normalised residual Predicted number of crashes 40
41 Does averaging matter? We have been averaging over 210 metres What happens if we vary this? Calculate log likelihood and chi-squared values when we vary averaging length Yellow in following slides shows best values 41
42 Does averaging matter all crashes averaging length log likelihood skid-site chi-sq curvature chi-sq skid res. chi-sq 30-83, , , , ,
43 Does averaging matter wet crashes averaging length log likelihood skid-site chi-sq curvature chi-sq skid res. chi-sq 30-17, , , ,
44 What-if study Upgrade the skid-resistance on all skidsite 2 (curvature < 250m radius or gradient > 10%) How many crashes would we save in 2001? How much road would we have to upgrade? 44
45 What-if study: skid-site 2 locations, 2001 data min. skid resistance fix for traffic fix length predicted crashes saved crashes
46 Case study Karangahake Gorge How do observed and predicted values agree Details on website 46

47 Karangahake Gorge 47
48 Predicted and actual 1.4 Average Yearly Crash Density per 0.5 km Predicted Actual Chainage from SH2 RS73 (m) 48
49 Discussion How credible are the results? How to handle additional error structure Use of 10 metre sections rather than combining into (e.g.) 100 metre sections Danger in taking data beyond its design accuracy How to present confidence intervals on graphs of effects of variables Use C++ as statistical programming language 49
50 How credible are the results (i)? Retrospective study Predictor variables subject to error Road properties not in model Different skid-site 1 (and 3) characteristics Don t know fraction of time road is wet Additional error structure? Choice of averaging length Non-linearity and interactions 50
51 How credible are the results (ii)? The results make sense They are stable in that small changes to the analysis don t make much difference to the results The skid resistance results are similar to those from earlier studies Analysis on & on seem to agree But we need international comparisons 51
52 Additional error structure Can t use residual deviance as scaling factor Divide network into blocks what length does it matter? Use hidden Markov point process model? Could traffic flow data be the problem? 52
53 More discussion How credible are the results? How to handle additional error structure Use of 10 metre sections rather than combining into (e.g.) 100 metre sections Danger in taking data beyond its design accuracy How to present confidence intervals on graphs of effects of variables Use C++ as statistical programming language 53
54 Alternative way of showing confidence intervals This from a previous study Select a particular value of the predictor Then show the confidence intervals for effect of changing to a different value of the predictor 54
55 55
56 Programming details Preliminary processing using SAS at Opus and SQL server on my computer Main model fitting using C++ programs using my matrix package, automatic differentiation package and a new array and model formula package Plots by Gnuplot Fit runs take about 1 hour See 56
57 Array and model formula package C++ package Named array (Array, Name, Missing value indicator) Factor Model Formula Try to get expressiveness of R and Splus Compiled code speed Flexibility of C++ code Not ready for release not on website 57

58 That s all 58
CRASH RISK RELATIONSHIPS FOR IMPROVED SAFETY MANAGEMENT OF ROADS
 CRASH RISK RELATIONSHIPS FOR IMPROVED SAFETY MANAGEMENT OF ROADS Cenek, P.D. 1 & Davies, R.B. 2 1 Opus International Consultants 2 Statistics Research Associates ABSTRACT This paper presents the results
Modelling and Analysis of Crash Densities for Karangahake Gorge, New Zealand
 Modelling and Analysis of Crash Densities for Karangahake Gorge, New Zealand Cenek, P.D. & Davies, R.B. Opus International Consultants; Statistics Research Associates Limited ABSTRACT An 18 km length of
Reducing Speed Limits to Support Lower Skid Resistance Investigatory Levels. Fergus Tate National Traffic and Safety Manager NZTA
 Reducing Speed Limits to Support Lower Skid Resistance Investigatory Levels Fergus Tate National Traffic and Safety Manager NZTA Presentation Outline: Background Research questions Requirements of analysis
SPECIFICATION FOR SKID RESISTANCE INVESTIGATION AND TREATMENT SELECTION
 SPECIFICATION FOR SKID RESISTANCE 1. SCOPE This specification outlines the process for identifying sites where treatment to improve skid resistance may be justified. 2. GLOSSARY AND DEFINITIONS Bleeding:
Disclaimer. Additional information. Crash fact sheets. Travel survey fact sheets
 Trucks 2017 Disclaimer All reasonable endeavours are made to ensure the accuracy of the information in this report. However, the information is provided without warranties of any kind including accuracy,
AusRAP assessment of Peak Downs Highway 2013
 AusRAP assessment of Peak Downs Highway 2013 SUMMARY The Royal Automobile Club of Queensland (RACQ) commissioned an AusRAP assessment of Peak Downs Highway based on the irap protocol. The purpose is to
Traffic Standards and Guidelines 1999 Survey RSS 10. Skid Resistance
 Traffic Standards and Guidelines 1999 Survey RSS 10 Skid Resistance October 1999 ISSN 1174-7161 ISBN 0478 206577 ii Survey of Traffic Standards and Guidelines The Land Transport Safety Authority (LTSA)
SCRIM Friction Testing in the USA. Edgar de León Izeppi, Research Scientist Virginia Tech Transportation Institute Nashville, October 13 th 2,016
 SCRIM Friction Testing in the USA Edgar de León Izeppi, Research Scientist Virginia Tech Transportation Institute Nashville, October 13 th 2,016 Outline Introduction: What is the SCRIM? Background and
Assisted and Automated Driving DEFINITION AND ASSESSMENT: SUMMARY DOCUMENT
 Assisted and Automated Driving DEFINITION AND ASSESSMENT: SUMMARY DOCUMENT Introduction Automated Driving is expected to bring huge societal benefits, including a reduction in road casualties, as well
Excessive speed as a contributory factor to personal injury road accidents
 Excessive speed as a contributory factor to personal injury road accidents Jonathan Mosedale and Andrew Purdy, Transport Statistics: Road Safety, Department for Transport Summary This report analyses contributory
[Insert name] newsletter CALCULATING SAFETY OUTCOMES FOR ROAD PROJECTS. User Manual MONTH YEAR
![[Insert name] newsletter CALCULATING SAFETY OUTCOMES FOR ROAD PROJECTS. User Manual MONTH YEAR](/thumbs/75/72619921.jpg "[Insert name] newsletter CALCULATING SAFETY OUTCOMES FOR ROAD PROJECTS. User Manual MONTH YEAR") [Insert name] newsletter MONTH YEAR CALCULATING SAFETY OUTCOMES FOR ROAD PROJECTS User Manual MAY 2012 Page 2 of 20 Contents 1 Introduction... 4 1.1 Background... 4 1.2 Overview... 4 1.3 When is the Worksheet
[Insert name] newsletter MONTH YEAR CALCULATING SAFETY OUTCOMES FOR ROAD PROJECTS User Manual MAY 2012 Page 2 of 20 Contents 1 Introduction... 4 1.1 Background... 4 1.2 Overview... 4 1.3 When is the Worksheet
the Ministry of Transport is attributed as the source of the material
 Young Drivers 2016 Disclaimer All reasonable endeavours are made to ensure the accuracy of the information in this report. However, the information is provided without warranties of any kind including
The challenges of driving
 Driving is not that easy 32 Some facts about new solo drivers 34 The challenges of driving The challenges of driving 29 The challenges of driving month in Victoria in casualty crashes per (over a 6 year
DOT HS September NHTSA Technical Report
 DOT HS 809 144 September 2000 NHTSA Technical Report Analysis of the Crash Experience of Vehicles Equipped with All Wheel Antilock Braking Systems (ABS)-A Second Update Including Vehicles with Optional
the Ministry of Transport is attributed as the source of the material
 Fatigue 2016 Disclaimer All reasonable endeavours are made to ensure the accuracy of the information in this report. However, the information is provided without warranties of any kind including accuracy,
Pavement Surface Properties Consortium Phase II (TPF-5[345])
![Pavement Surface Properties Consortium Phase II (TPF-5[345])](/thumbs/92/109191131.jpg "Pavement Surface Properties Consortium Phase II (TPF-5[345])") Pavement Surface Properties Consortium Phase II (TPF-5[345]) OBJECTIVES A research program focused on enhancing the level of service provided by the roadway transportation system through optimized pavement
Pavement Surface Properties Consortium Phase II (TPF-5[345]) OBJECTIVES A research program focused on enhancing the level of service provided by the roadway transportation system through optimized pavement
Young drivers. Drivers involved in fatal or injury crashes. Drivers involved in fatal/injury crashes per 100. per licence holders (lines)
") Young drivers CRASH FACTSHEET 2012 CRASH STATISTICS FOR THE YEAR ENDED 31 DECEMBER 2011 Prepared by the Ministry of Transport In 2011 young drivers aged 15 24 were involved in 80 fatal traffic crashes,
Young drivers CRASH FACTSHEET 2012 CRASH STATISTICS FOR THE YEAR ENDED 31 DECEMBER 2011 Prepared by the Ministry of Transport In 2011 young drivers aged 15 24 were involved in 80 fatal traffic crashes,
Analyzing Crash Risk Using Automatic Traffic Recorder Speed Data
 Analyzing Crash Risk Using Automatic Traffic Recorder Speed Data Thomas B. Stout Center for Transportation Research and Education Iowa State University 2901 S. Loop Drive Ames, IA 50010 stouttom@iastate.edu
ASSESSING THE IMPACT OF PAVEMENT SURFACE CONDITION ON THE PERFORMANCE OF SIGNALISED INTERSECTIONS
 1 ASSESSING THE IMPACT OF PAVEMENT SURFACE CONDITION ON THE PERFORMANCE OF SIGNALISED INTERSECTIONS Submission Date: 08/12/2014 Word Count: 4554 Number of Tables: 2 Number of Figures: 4 Authors Names:
Modeling Ignition Delay in a Diesel Engine
 Modeling Ignition Delay in a Diesel Engine Ivonna D. Ploma Introduction The object of this analysis is to develop a model for the ignition delay in a diesel engine as a function of four experimental variables:
R O A D S A F E T Y E D U C A T I O N
 R O A D S A F E T Y E D U C A T I O N Towing Towing the line Whether you re planning to tour with your caravan, transport horses or move a trailer load, towing gives you the freedom to take what you want,
Percentage of crashes with fatigue as a factor ( ) 0% 2% 4% 6% 8% 10% 12% 14% 16% Percentage
 0% 2% 4% 6% 8% 10% 12% 14% 16% Percentage") Fatigue CRASH FACTSHEET November 2013 CRASH STATISTICS FOR THE YEAR ENDED 31 DECEMBER 2012 Prepared by the Ministry of Transport Fatigue is a physiological condition that can occur long before you fall
Fatigue CRASH FACTSHEET November 2013 CRASH STATISTICS FOR THE YEAR ENDED 31 DECEMBER 2012 Prepared by the Ministry of Transport Fatigue is a physiological condition that can occur long before you fall
The final test of a person's defensive driving ability is whether or not he or she can avoid hazardous situations and prevent accident..
 It is important that all drivers know the rules of the road, as contained in California Driver Handbook and the Vehicle Code. However, knowing the rules does not necessarily make one a safe driver. Safe
VOLUNTEER DRIVER TRAINING PRESENTATION
 VOLUNTEER DRIVER TRAINING PRESENTATION NON-EMERGENCY VEHICLE OPERATION Non sworn personnel are not authorized to operate agency vehicles in emergency mode (lights/sirens). Vehicles must be operated in
I-95 high-risk driver analysis using multiple imputation methods
 I-95 high-risk driver analysis using multiple imputation methods Kyla Marcoux Traffic Injury Research Foundation New Orleans, Louisiana July 26, 2010 Acknowledgements Authors: Robertson, R., Wood, K.,
the Ministry of Transport is attributed as the source of the material images contained in the material are not copied
 Speed 2017 Disclaimer All reasonable endeavours are made to ensure the accuracy of the information in this report. However, the information is provided without warranties of any kind including accuracy,
ODOT Transportation Safety. It All Starts With Crash Data
 ODOT Transportation Safety Programs It All Starts With Crash Data Robin Ness, Mgr. Crash Analysis & Reporting Unit Oregon Department of Transportation (ODOT) 17 th Annual Northwest Tribal Symposium Red
GUIDE FOR DETERMINING MOTOR VEHICLE ACCIDENT PREVENTABILITY
 GUIDE FOR DETERMINING MOTOR VEHICLE ACCIDENT PREVENTABILITY Introduction 2 General Questions to Consider 2 Specific Types of Accidents: Intersection Collisions 4 Sideswipes 4 Head-On Collision 5 Skidding
ACCIDENT MODIFICATION FACTORS FOR MEDIAN WIDTH
 APPENDIX G ACCIDENT MODIFICATION FACTORS FOR MEDIAN WIDTH INTRODUCTION Studies on the effect of median width have shown that increasing width reduces crossmedian crashes, but the amount of reduction varies
IDENTIFYING CAUSAL FACTORS OF TRAFFIC ACCIDENTS IN SRI LANKA
 IDENTIFYING CAUSAL FACTORS OF TRAFFIC ACCIDENTS IN SRI LANKA Amal S. Kumarage 1, C.R. Abeygoonawardena 2, and Ravindra Wijesundera 3 ABSTRACT INTRODUCTION The Traffic Police in Sri Lanka has maintained
In-depth analysis of speed-related road crashes
 Summary In-depth analysis of speed-related road crashes TØI Report 1569/2017 Author: Alena Høye Oslo 2017 109 pages Norwegian language The report summarizes detailed results of in-depth investigations
Identification of Contributing Factors for Work Zone Crashes
 Identification of Contributing Factors for Work Zone Crashes Qing Wang Jian John Lu Zhenyu Wang Transportation Group Department of Civil and Environmental Engineering University of South Florida November
Devices to Assist Drivers to Comply with Speed Limits
 Vehicle Design and Research Pty Limited Australian Business No. 63 003 980 809 mpaineattpg.com.au Devices to Assist Drivers to Comply with Speed Limits Prepared by Michael Paine, Manager, Vehilce Design
AN EVALUATION OF THE 50 KM/H DEFAULT SPEED LIMIT IN REGIONAL QUEENSLAND
 AN EVALUATION OF THE 50 KM/H DEFAULT SPEED LIMIT IN REGIONAL QUEENSLAND by Simon Hosking Stuart Newstead Effie Hoareau Amanda Delaney November 2005 Report No: 265 Project Sponsored By ii MONASH UNIVERSITY
Linking Road Traffic Accidents With Skid Resistance Recent UK Developments
 Linking Road Traffic Accidents With Skid Resistance Recent UK Developments Authors: H E Viner 1, R Sinhal 2 and A R Parry 1 1 TRL Limited, UK 2 Highways Agency, UK ABSTRACT When, in 1988, the UK Department
The safety impact of road lighting on roads with speed limits greater than 70 km/h
 The Safety Impact of Lighting Frith, Jackett, Chisnall & Tate Page 0 The safety impact of road lighting on roads with speed limits greater than 70 km/h William Frith, MSc(Hons), MSc (Transport Engineering),
DRIVING PERFORMANCE PROFILES OF DRIVERS WITH PARKINSON S DISEASE
 14th International Conference Mobility and Transport for Elderly and Disabled Persons Lisbon, Portugal, 28-31 July 2015 DRIVING PERFORMANCE PROFILES OF DRIVERS WITH PARKINSON S DISEASE Dimosthenis Pavlou
Traffic Data For Mechanistic Pavement Design
 NCHRP 1-391 Traffic Data For Mechanistic Pavement Design NCHRP 1-391 Required traffic loads are defined by the NCHRP 1-37A project software NCHRP 1-39 supplies a more robust mechanism to enter that data
Guidelines for Retro-fitting Existing Roads to Optimise Safety Benefits. A Practitioners Experience and Assessment of Options for Improvement.
 Guidelines for Retro-fitting Existing Roads to Optimise Safety Benefits. A Practitioners Experience and Assessment of Options for Improvement. Author: Stephen Levett, Manager, Safer Roads Policy, Standards
DEVELOPING A RISK PREDICTION MODEL FOR A SAFE SYSTEM SIGNATURE PROJECT
 DEVELOPING A RISK PREDICTION MODEL FOR A SAFE SYSTEM SIGNATURE PROJECT Authors: Dale Harris (Presenter) BEM, MAppSc, PGDipArt (GIS) Senior GIS Road Safety Analyst Abley Transportation Consultants Ltd Contact:
Follow this and additional works at: https://digitalcommons.usu.edu/mathsci_stures
 Utah State University DigitalCommons@USU Mathematics and Statistics Student Research and Class Projects Mathematics and Statistics Student Works 2016 Car Crash Conundrum Mohammad Sadra Sharifi Utah State
SPATIAL AND TEMPORAL PATTERNS OF FATIGUE RELATED CRASHES IN HAWAII
 SPATIAL AND TEMPORAL PATTERNS OF FATIGUE RELATED CRASHES IN HAWAII By Karl E. Kim Eric Y. Yamashita Hawaii CODES Project Traffic Records Forum July 29 - August 2, 2001 New Orleans, Louisiana Overview Background
Rail safety statistics Six monthly statistics for the period ended 30 June August 2015
 Rail safety statistics Six monthly statistics for the period ended 30 June 2015 August 2015 Disclaimer All reasonable endeavours are made to ensure the accuracy of the information in this report. However,
FANG Shouen Tongji University
 Introduction to Dr. Fang Shou en Communist Party secretary of Tongji University; Doctoral supervisor in Tongji University; Executive director of China Intelligent Transportation Systems Association (CITSA)
Effects of two-way left-turn lane on roadway safety
 University of South Florida Scholar Commons Graduate Theses and Dissertations Graduate School 2004 Effects of two-way left-turn lane on roadway safety Haolei Peng University of South Florida Follow this
NOTAT. Mopeds - Risk of serious injury or death Delnotat III. Transport-, Bygnings- og Boligministeriet. knallert og lille motorcykel.
 NOTAT Til Transport-, Bygnings- og Boligministeriet Vedr. Forskningsprojekt om aldersgrænsen for erhvervelse af kørekort til stor knallert og lille motorcykel. Fra Mette Møller, Kira H. Janstrup, Luca
Percentage of crashes with driving too fast for the conditions cited as a contributing factor ( ) 0% 5% 10% 15% 20% 25% 30% 35% Percentage
 0% 5% 10% 15% 20% 25% 30% 35% Percentage") Speeding CRASH FACTSHEET November 2013 CRASH STATISTICS FOR THE YEAR ENDED 31 DECEMBER 2012 Prepared by the Ministry of Transport In this fact sheet speeding is defined as driving too fast for the conditions.
Speeding CRASH FACTSHEET November 2013 CRASH STATISTICS FOR THE YEAR ENDED 31 DECEMBER 2012 Prepared by the Ministry of Transport In this fact sheet speeding is defined as driving too fast for the conditions.
ACCIDENT REVIEW FORM
 ACCIDENT REVIEW FORM American Trucking Associations, Inc. Safety Management Council 950 N. Glebe Road, Suite 210, Arlington, VA 22203-4181 Fax: 703-838-1965 E-Mail: JPierce@trucking.org Members of the
Sight Distance. A fundamental principle of good design is that
 Session 9 Jack Broz, PE, HR Green May 5-7, 2010 Sight Distance A fundamental principle of good design is that the alignment and cross section should provide adequate sight lines for drivers operating their
Pre-Grant Meeting Township Safety Signs Grant Program
 Pre-Grant Meeting Township Safety Signs Grant Program Administered by the Ohio LTAP Center a part of The ODOT Office of Local Programs Meeting Dates: March 22, 2019 March 29, 2019 April 4, 2019 Why are
Appendix 3. DRAFT Policy on Vehicle Activated Signs
 Appendix 3 DRAFT Policy on Vehicle Activated Signs Ealing Council has been installing vehicle activated signs for around three years and there are now 45 across the borough. These signs help to reduce
Abstract. 1. Introduction. 1.1 object. Road safety data: collection and analysis for target setting and monitoring performances and progress
 Road Traffic Accident Involvement Rate by Accident and Violation Records: New Methodology for Driver Education Based on Integrated Road Traffic Accident Database Yasushi Nishida National Research Institute
An Investigation of impacts VMS
 An Investigation of impacts VMS on safety on Scottish Trunk Roads Wafaa Saleh, Craig Walker and Chih Wei Pai Contents 1. Introduction to VMS 2. Literature 3. Research gaps 4. Main research objectives 5.
Rural Speed and Crash Risk. Kloeden CN, McLean AJ Road Accident Research Unit, Adelaide University 5005 ABSTRACT
 Rural Speed and Crash Risk Kloeden CN, McLean AJ Road Accident Research Unit, Adelaide University 5005 ABSTRACT The relationship between free travelling speed and the risk of involvement in a casualty
Post 50 km/h Implementation Driver Speed Compliance Western Australian Experience in Perth Metropolitan Area
 Post 50 km/h Implementation Driver Speed Compliance Western Australian Experience in Perth Metropolitan Area Brian Kidd 1 (Presenter); Tony Radalj 1 1 Main Roads WA Biography Brian joined Main Roads in
briefing notes road safety issues
 briefing notes road safety briefing notes road safety issues Land Transport New Zealand has prepared this road safety issues report. It is based on reported crash data and trends for the 2002 2006 period.
HVCBA Theory Assessment
 This theory assessment is designed as a supporting document towards one of the following Units of Competency. It should be retained by a Heavy Vehicle Accredited Assessor for inclusion with a Final Competency
UNIT-1 PART:A. 3. (i) What are the requirements of an ideal highway alignment? Discuss briefly.
 What are the requirements of an ideal highway alignment? Discuss briefly.") UNIT-1 PART:A 1. What is meant by TRANSPORTATION. 2. List twenty-year road development plans. 3. Mention any two Recommendation of Jayakar committee. 4. What are the functions of IRC and CRRI. 5. Define
UNIT-1 PART:A 1. What is meant by TRANSPORTATION. 2. List twenty-year road development plans. 3. Mention any two Recommendation of Jayakar committee. 4. What are the functions of IRC and CRRI. 5. Define
Chapter III Geometric design of Highways. Tewodros N.
 Chapter III Geometric design of Highways Tewodros N. www.tnigatu.wordpress.com tedynihe@gmail.com Introduction Appropriate Geometric Standards Design Controls and Criteria Design Class Sight Distance Design
Response to. Department for Transport Consultation Paper. Allowing Learner Drivers To Take Lessons on Motorways
 Response to Department for Transport Consultation Paper Allowing Learner Drivers To Take Lessons on Motorways 6 February 2017 Introduction This is RoSPA s response to the Department for Transport s consultation
Performance Measure Summary - Large Area Sum. Performance Measures and Definition of Terms
 Performance Measure Summary - Large Area Sum There are several inventory and performance measures listed in the pages of this Urban Area Report for the years from 1982 to 2014. There is no single performance
Performance Measure Summary - Medium Area Sum. Performance Measures and Definition of Terms
 Performance Measure Summary - Medium Area Sum There are several inventory and performance measures listed in the pages of this Urban Area Report for the years from 1982 to 2014. There is no single performance
2018 NACE Conference Wisconsin Dells, WI. Joseph Cheung P.E. FHWA Office of Safety
 2018 NACE Conference Wisconsin Dells, WI Joseph Cheung P.E. FHWA Office of Safety Skid related crashes are determined by many factors: Tire issues Weather Conditions Friction Demand Road Geometry Vehicle
Driver Speed Compliance in Western Australia. Tony Radalj and Brian Kidd Main Roads Western Australia
 Driver Speed Compliance in Western Australia Abstract Tony Radalj and Brian Kidd Main Roads Western Australia A state-wide speed survey was conducted over the period March to June 2 to measure driver speed
Performance Measures and Definition of Terms
 Performance Measure Summary - All 471 Areas Sum There are several inventory and performance measures listed in the pages of this Urban Area Report for the years from 1982 to 2014. There is no single performance
Purpose and Need Report
 Purpose and Need Report State Highway (SH) 29 From Southwestern Boulevard to SH 95 Williamson County, Texas (CSJ: 0337-02-045) Prepared by Blanton & Associates, Inc. Date: November, 2015 The environmental
Review of EEM Passing Lane Length Factors
 Report Review of EEM Passing Lane Length Factors Prepared for NZ Transport Agency (NZTA) (Client) By Beca Infrastructure Ltd (Beca) 24 December 2010 Beca 2011 (unless Beca has expressly agreed otherwise
University of Michigan s Work Toward Autonomous Cars
 University of Michigan s Work Toward Autonomous Cars RYAN EUSTICE NAVAL ARCHITECTURE & MARINE ENGINEERING MECHANICAL ENGINEERING, AND COMPUTER SCIENCE AND ENGINEERING Roadmap Why automated driving? Next
Pre-Grant Meeting Township Safety Signs Grant Program
 Pre-Grant Meeting Township Safety Signs Grant Program Administered by the Ohio LTAP Center a part of The ODOT Office of Local Programs March 28, 2018 or April 12, 2018 Why are you here? Why are you here?
Defensive and Safe Driving Accidents. Why must we maintain defensive and safe driving practices?
 Defensive and Safe Driving Accidents Why must we maintain defensive and safe driving practices? 1 Nation Wide Statistics Firefighter deaths #1 cause = Heart attack #2 cause = Traffic accidents Traffic
Alberta Infrastructure HIGHWAY GEOMETRIC DESIGN GUIDE AUGUST 1999
 &+$37(5Ã)Ã Alberta Infrastructure HIGHWAY GEOMETRIC DESIGN GUIDE AUGUST 1999 &+$37(5) 52$'6,'()$&,/,7,(6 7$%/(2)&217(176 Section Subject Page Number Page Date F.1 VEHICLE INSPECTION STATIONS... F-3 April
DETERMINING THE SAFETY OF URBAN ARTERIAL ROADS. Meredith Leigh Campbell. a Thesis. Submitted to the Faculty. of the WORCESTER POLYTECHNIC INSTITUTE
 DETERMINING THE SAFETY OF URBAN ARTERIAL ROADS by Meredith Leigh Campbell a Thesis Submitted to the Faculty of the WORCESTER POLYTECHNIC INSTITUTE in partial fulfillment of the requirements for the Degree
Performance Measure Summary - Austin TX. Performance Measures and Definition of Terms
 Performance Measure Summary - Austin TX There are several inventory and performance measures listed in the pages of this Urban Area Report for the years from 1982 to 2014. There is no single performance
Performance Measure Summary - Pittsburgh PA. Performance Measures and Definition of Terms
 Performance Measure Summary - Pittsburgh PA There are several inventory and performance measures listed in the pages of this Urban Area Report for the years from 1982 to 2014. There is no single performance
Performance Measure Summary - New Orleans LA. Performance Measures and Definition of Terms
 Performance Measure Summary - New Orleans LA There are several inventory and performance measures listed in the pages of this Urban Area Report for the years from 1982 to 2014. There is no single performance
Performance Measure Summary - Portland OR-WA. Performance Measures and Definition of Terms
 Performance Measure Summary - Portland OR-WA There are several inventory and performance measures listed in the pages of this Urban Area Report for the years from 1982 to 2014. There is no single performance
Performance Measure Summary - Oklahoma City OK. Performance Measures and Definition of Terms
 Performance Measure Summary - Oklahoma City OK There are several inventory and performance measures listed in the pages of this Urban Area Report for the years from 1982 to 2014. There is no single performance
Performance Measure Summary - Seattle WA. Performance Measures and Definition of Terms
 Performance Measure Summary - Seattle WA There are several inventory and performance measures listed in the pages of this Urban Area Report for the years from 1982 to 2014. There is no single performance
Performance Measure Summary - Buffalo NY. Performance Measures and Definition of Terms
 Performance Measure Summary - Buffalo NY There are several inventory and performance measures listed in the pages of this Urban Area Report for the years from 1982 to 2014. There is no single performance
INNOVATIVE APPROACH IN ROAD INFRASTRUCTURE SAFETY MANAGEMENT AND ROAD SAFETY IMPACT ASSESSMENT
 INNOVATIVE APPROACH IN ROAD INFRASTRUCTURE SAFETY MANAGEMENT AND ROAD SAFETY IMPACT ASSESSMENT www.ptvgroup.com Timo Hoffmann, PTV Group TSTS Road Safety Seminar, Bangkok, 2014-10-17 CRASH PREDICTION Tomorrow
Performance Measure Summary - Fresno CA. Performance Measures and Definition of Terms
 Performance Measure Summary - Fresno CA There are several inventory and performance measures listed in the pages of this Urban Area Report for the years from 1982 to 2014. There is no single performance
Performance Measure Summary - Hartford CT. Performance Measures and Definition of Terms
 Performance Measure Summary - Hartford CT There are several inventory and performance measures listed in the pages of this Urban Area Report for the years from 1982 to 2014. There is no single performance
Performance Measure Summary - Boise ID. Performance Measures and Definition of Terms
 Performance Measure Summary - Boise ID There are several inventory and performance measures listed in the pages of this Urban Area Report for the years from 1982 to 2014. There is no single performance
Performance Measure Summary - Tucson AZ. Performance Measures and Definition of Terms
 Performance Measure Summary - Tucson AZ There are several inventory and performance measures listed in the pages of this Urban Area Report for the years from 1982 to 2014. There is no single performance
Performance Measure Summary - Wichita KS. Performance Measures and Definition of Terms
 Performance Measure Summary - Wichita KS There are several inventory and performance measures listed in the pages of this Urban Area Report for the years from 1982 to 2014. There is no single performance
Performance Measure Summary - Spokane WA. Performance Measures and Definition of Terms
 Performance Measure Summary - Spokane WA There are several inventory and performance measures listed in the pages of this Urban Area Report for the years from 1982 to 2014. There is no single performance
BACKGROUND AND PRINCIPLES OF THE FINNISH SAFETY EVALUATION TOOL, TARVA
 BACKGROUND AND PRINCIPLES OF THE FINNISH SAFETY EVALUATION TOOL, TARVA Technical Research Centre of Finland, VTT P.O.Box 1902, FIN-02044 VTT, FINLAND Phone +358 9 456 6200 Fax +358 9 464 850 e-mail: Harri.Peltola@vtt.fi
FE Review-Transportation-II. D e p a r t m e n t o f C i v i l E n g i n e e r i n g U n i v e r s i t y O f M e m p h i s
 FE Review-Transportation-II D e p a r t m e n t o f C i v i l E n g i n e e r i n g U n i v e r s i t y O f M e m p h i s Learning Objectives Design, compute, and solve FE problems on Freeway level of
Performance Measure Summary - Grand Rapids MI. Performance Measures and Definition of Terms
 Performance Measure Summary - Grand Rapids MI There are several inventory and performance measures listed in the pages of this Urban Area Report for the years from 1982 to 2014. There is no single performance
Performance Measure Summary - Washington DC-VA-MD. Performance Measures and Definition of Terms
 Performance Measure Summary - Washington DC-VA-MD There are several inventory and performance measures listed in the pages of this Urban Area Report for the years from 1982 to 2014. There is no single
Blue Reflectors: An inexpensive and effective way of managing Fatigue of Drivers of Heavy Vehicles
 Blue Reflectors: An inexpensive and effective way of managing Fatigue of Drivers of Heavy Vehicles Abstract Cleaver, M. A., Simpson, J., de Roos, M. P., Hendry, L. A., Peden, S. M. NSW Roads and Traffic
Motor Vehicle Crashes in New Zealand 2013 Yearly report 2014
 Mor Vehicle Crashes in New Zealand 2013 Yearly report 2014 Statistical statement calendar year 2013 Ensuring our transport system helps New Zealand thrive ISSN: 1176-3949 CONTENTS Reported injury crashes
Performance Measure Summary - Charlotte NC-SC. Performance Measures and Definition of Terms
 Performance Measure Summary - Charlotte NC-SC There are several inventory and performance measures listed in the pages of this Urban Area Report for the years from 1982 to 2014. There is no single performance
Performance Measure Summary - Toledo OH-MI. Performance Measures and Definition of Terms
 Performance Measure Summary - Toledo OH-MI There are several inventory and performance measures listed in the pages of this Urban Area Report for the years from 1982 to 2014. There is no single performance
Performance Measure Summary - Pensacola FL-AL. Performance Measures and Definition of Terms
 Performance Measure Summary - Pensacola FL-AL There are several inventory and performance measures listed in the pages of this Urban Area Report for the years from 1982 to 2014. There is no single performance
Performance Measure Summary - Omaha NE-IA. Performance Measures and Definition of Terms
 Performance Measure Summary - Omaha NE-IA There are several inventory and performance measures listed in the pages of this Urban Area Report for the years from 1982 to 2014. There is no single performance
Performance Measure Summary - Allentown PA-NJ. Performance Measures and Definition of Terms
 Performance Measure Summary - Allentown PA-NJ There are several inventory and performance measures listed in the pages of this Urban Area Report for the years from 1982 to 2014. There is no single performance
SUCCESSFUL PERFORMANCE PAVEMENT PROJECTS 2015 TxAPA Annual Meeting September 23, 2015 Austin District Mike Arellano, P.E. Date
 SUCCESSFUL PERFORMANCE PAVEMENT PROJECTS 2015 TxAPA Annual Meeting September 23, 2015 Austin District Mike Arellano, P.E. Date AUSTIN DISTRICT SAFETY PERFORMANCE OF HIGH- FRICTION MIXTURES Mike Arellano,
Performance Measure Summary - Nashville-Davidson TN. Performance Measures and Definition of Terms
 Performance Measure Summary - Nashville-Davidson TN There are several inventory and performance measures listed in the pages of this Urban Area Report for the years from 1982 to 2014. There is no single
Performance Measure Summary - Corpus Christi TX. Performance Measures and Definition of Terms
 Performance Measure Summary - Corpus Christi TX There are several inventory and performance measures listed in the pages of this Urban Area Report for the years from 1982 to 2014. There is no single performance