CHANGES IN WORLD OLIVE CROP AREA (ha)
|
|
|
- Kelly Wilkinson
- 5 years ago
- Views:
Transcription

1 Madrid, 12 June 2015

2 CHANGES IN WORLD OLIVE CROP AREA (ha) Irrigated 2006 Dryfarmed Dryfarmed 20% 80% Irrigated % 78%
3 SURFACE (ha.) Producer countries 2014/15 Irrigated Rainfed Europe : EU/28 Cyprus (q) 13,100 10,100 3,000 Spain (Q) 2,593, ,511 1,853,012 Italy (q) 1,350, ,556 1,069,444 Greece (Q) 1,120, , ,067 France (q) 55,000 20,900 34,100 Malta (q) Portugal (Q) 352,350 80, Slovenia (Q) 1, ,720 Croatia (Q) , Total EU/27 5,505,283 1,424,885 4,080,398 Non-Europe Albania (Q) ,600 39,400 Montenegro * 10, ,690 Total non-eu/27 Europe 61,200 12,110 49,090 Africa South Africa * 6,000 2,100 3,900 Algeria (Q) 498, ,737 Angola* Egypt (Q) 98,939 79,151 19,788 Libye (Q) ,000 Morocco (Q) 998, , ,740 Tunisia(Q) 1,839,600 73,800 1,765,800 Total Africa 3,646, ,770 2,960,415 Producer countries 2012/13 Irrigated Rainfed Middle East Iran(Q) 84,110 76,262 7,848 Iraq* 4,812 4,812 Israel(Q) ,000 25,000 Jordan(Q) 62,655 25,404 37,251 Lebanon (Q) 53,646 8,159 45,487 Palestine (Q) 96, ,644 Syria (Q) 697,000 35, ,000 Turkey (Q) 831,000 66, ,520 Total Middle East 1,865, ,159 1,638,750 America Argentina(Q) 90,100 63,070 27,030 Brazil (Q) 1,000 1,000 Chile (Q) 25,000 25,000 United States* 18,000 14,400 3,600 Mexico(Q) 8,762 7, Peru (Q) 17,207 13,594 3,613 Uruguay(Q) 10, Total Americas 170, ,140 46,529 Asia Oceania Australia 35,000 24,500 10,500 China (Q) 86, New Zealand (Q) 2, Total Asia Oceania 124,237 63,497 60,740 Other miscellaneous countries 8,900 5,500 3,400 Producer countries 2014/15 Irrigated Rainfed World Total 11,382,383 2,543,061 8,839,323
4 TOTAL CROP AREA DISTRIBUTION (%) 2014/15 Regions % Details EU % Spain, 12% Italy and 10% Greece Africa % Tunisia and 8% Morocco Middle East % Turkey and 6% Syria Rest of the world 3.5 America, rest of Europe and Asia+ Oceania Total ,382,383 ha
5 COMPARATIVE INDEX-BASED TREND OF OLIVE OIL PRODUCTION AND CROP AREA PRODUCTION (tonnes) CROP AREA (ha) 50 0

 Product ion 1453 2206 1812 1825 1846 1736 2595 2466 2403 2375 2566 2826 2496 3174 3013 2573 2767 2713 2670 2974 3075 3321 2401.5 3252 2458 3159.5 2713.")
6 OLIVE OIL PRODUCTION AND CONSUMPTION WORLD TREND 1990/ /17 1,000 tm % change between crop years Production: 4.5% Consumption: 2.4% / / / / / / / / / / / / / / / / / / / / / / / / / / / 16 (est.) Product ion Consumpt ion
7 EVOLUTION OF WORLD CONSUMPTION OVER THE LAST 25 YEARS (10 3 t) 3.500,0 WORLD Total 3.000, ,0 EU Non IOC Members IOC-member countries 2.000, , ,0 500,0 0,0

8
9 PROSPECTS OLIVE OIL BALANCES 2014/ /17 (thousand tonnes) 2014/ / /17 (est.) Starting stocks Production Imports Consumption Exports Ending stocks Stocks / Exports-Imports / / /-20.0
10 WORLD RESOURCES MOVEMENTS IN PRODUCER PRICES Extra virgin olive oil Average prices by crop year /100 kg World resources Bari (Italia) Herakl. Grecia) Jaén (España) Sfax (Tunisia) , , ,5 270, ,2 235,9249,8 202,7 222,1 188,7 192,6 196,4 187, ,6 326, (thousand tonnes) 2000/ / / / / / / / / 17(est.) 297,
11 OLIVE OIL PRODUCTION (10 3 t)
12 EVOLUTION OF PRODUCTION - EUROPEAN PRODUCERS - IOC COUNTRIES MEMBERS (10 3 t 2.000, , , , ,0 Spain Greece Italy Portugal 1.000,0 800,0 600,0 400,0 200,0 0,0

13 OLIVE OIL CONSUMPTION (10 3 t)
14 Back to European Union with some details : (10 3 t) 900,0 800,0 700,0 600,0 Italy Spain Greece 500,0 Other prod. 400,0 Other non prod 300,0 200,0 100,0 0,0
15 14,0 OLIVE OIL CONSUMPTION per CAPITA (kg/cap in 2013/14 & 2014/15) 12,0 12,0 10,6 10,0 8,6 8,0 6,8 6,0 5,4 4,0 2,0 3,0 2,3 1,4 1,3 1,3 Average 2014/15= 2.3kg/ capita 1,1 1,0 1,0 1,0 1,0 1,0 0,9 0,8 0,8 0,6 0,5 0,4 0,3 0,3 0,3 0,2 0,2 0,2 0,0 2013/ /15
16 OLIVE OIL CONSUMPTION per CAPITA (kg/cap in 2013/14 & 2014/15) 5,0 4,5 4,3 4,0 3,5 3,5 3,0 2,5 3,1 2,9 2,7 2,5 2,4 2,0 1,5 1,6 1,6 1,0 0,8 0,5 0,0 0,4 0,2 0,1 0,1 0,0 2013/ /15
17 OLIVE OIL CONSUMPTION per CAPITA (kg/cap in 2013/14 & 2014/15) 8,0 7,0 6,8 6,0 5,0 4,0 3,8 3,0 2,0 1,7 1,6 1,0 0,0 1,0 0,9 0,8 0,8 0,5 0,3 0,3 0,3 0,1 0,1 0,0 2013/ /15

18


19 OLIVE OIL IMPORTS 2015/16 USA 38% China 4% Brazil 6% Russia 2% Australia 3% Japan 7% Canada 5% Others 19% UE/28 16%
20 Source: United States Department of Agriculture Foreign Agricultural Service 1,000 t 350 USA OLIVE OIL IMPORTS* 1990/ / USA / / / / / / / / / / / / / / 17 tonnes Monthly imports 2013/14, 2014/15 and 2015/16 crop years +6% 2014/ / Including olive pomace oil October November December January February March April May June July August September

21 USA OLIVE OIL AND OLIVE POMACE OIL IMPORTS 2015/16 (t)
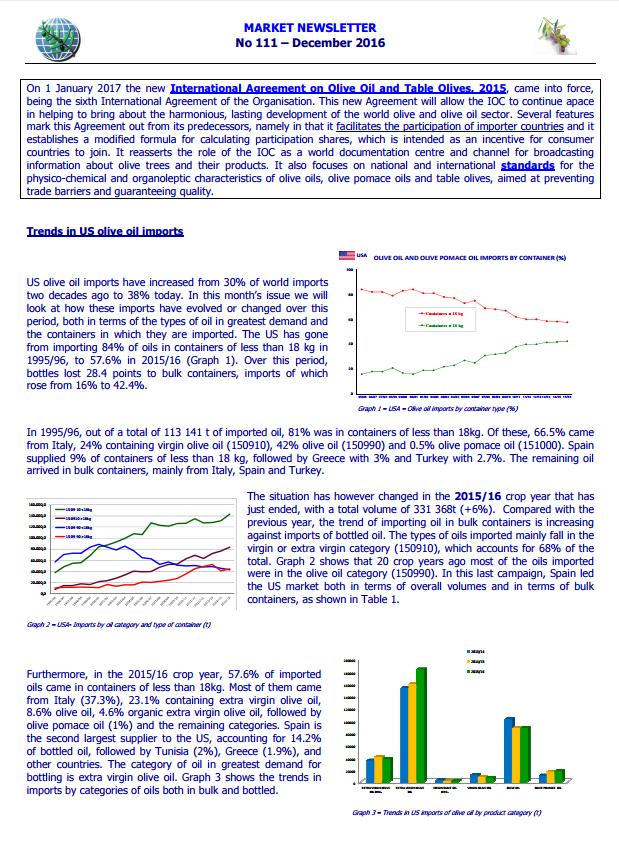
22 100 USA OLIVE OIL AND OLIVE POMACE OIL IMPORTS BY CONTAINER % Containers < 18 kg Containers > 18 kg THIS NEW 20% = BLENDING AND BOTTLING INTO US 20 THIS 20% CORRESPONDS TO FOOD SERVICE & INDUSTRY 0 93/94 94/95 95/96 96/97 97/98 98/99 99/00 00/01 01/02 02/03 03/04 04/05 05/06 06/07 07/08 08/09 09/10 10/11 11/12 12/13 13/14 14/15 15/16

23 USA - OLIVE OIL AND OLIVE POMACE OIL IMPORTS BY CATEGORY (t) 2013/ / / EXTRA VIRGIN OLIVE OIL ORG. EXTRA VIRGIN OLIVE OIL VIRGIN OLIVE OIL ORG. VIRGIN OLIVE OIL OLIVE OIL OLIVE POMACE OIL
24 1,000 t 45 OLIVE OIL IMPORTS * 1990/ / CANADA tonnes 1990/ / / / / / / / / / / / / / Monthly imports 2014/15, and 2016/17 crop years +8% / / Oct ober November December January February March April May June July August Sept ember * Including olive pomace oils Source: Statistics Canada International Trade Division
")
25 CANADA OLIVE OIL and OLIVE POMACE OIL IMPORTS (t) 2015/16
26 % 100 CANADA - OLIVE OIL IMPORTS BY CONTAINER Containers < 18 kg Containers > 18 kg /07 07/08 08/09 09/10 10/11 11/12 12/13 13/14 14/15 15/16
27 1,000 t AUSTRALIA OLIVE OIL AND OLIVE POMACE OIL IMPORTS* 1990/ / tonnes 1991/ / / / / / / / / Monthly imports 2014/15 and 2015/16 crop years 2014/ /16 +18% October November December January February M arch April M ay June July August September * Including olive pomace oils Source: Australian Bureau of Statistics
")
28 AUSTRALIA - OLIVE OIL and OLIVE POMACE OIL IMPORTS (t) 2015/16
29 AUSTRALIA - OLIVE OIL AND OLIVE POMACE OIL IMPORTS BY CONTAINER (%) (%) CONTAINER <18KG CONTAINER >18KG / / / / / / / /16
30 1,000 t OLIVE OIL AND OLIVE POMACE OIL IMPORTS BRAZIL 1990/ / / / / / / / / / / 15 tonnes Monthly imports 2014/15 and 2015/16 crop years -25% / / October November December January February March April May June July August September * Including olive pomace oils Source: Ministerio do Desenvolvimento, Industria e Comercio Exterior, Brasil

31 BRAZIL / OLIVE OIL AND OLIVE POMACE OIL IMPORTS BRAZIL IMPORTS (t)
32 1,000 t 70 OLIVE OIL AND OLIVE POMACE OIL IMPORTS* JAPAN 1990/ / / / / / / / / / / / / / / / 17 tonnes Monthly imports 2014/15 and 2015/16 crop years 2014/ /16-8% October November December January February March April May June July August September * Including olive pomace oils Source: Trade Statistics of Japan Ministry of Finance
33 JAPAN OLIVE OIL and OLIVE POMACE OIL IMPORTS (t) 2015/16
34 1,000 t OLIVE OIL AND OLIVE POMACE OIL IMPORTS* CHINA 1997/ / tonnes / / / / / / / / / / / / / / / / / / / / / /16 Monthly imports 2014/15, and 2015/16 crop years +12% October November December January February M arch April M ay June July August September * Including olive pomace oils Source: Global Trade International
 2015/16")
35 CHINA - OLIVE OIL and OLIVE POMACE OIL IMPORTS (t) 2015/16 CROP YEAR

 % by category 45 40 35 30 10 3 t 2,850.0 82% EVOO 4,980.")
36 Olive growing in CHINA SURFACE - Crop area 2015: > ha; 43% Irrigated Bearing: ha.; 55% irrigated Not yet bearing: ha.; 38% irrigated Planted in the year : ha.; 64% irrigated OLIVE OIL PRODUCTION by CATEGORY Crop year 2014/15 Crop year 2015/16 Production (t) % by category Production (t) % by category t 2, % EVOO 4, % EVOO 19% VOO 15% VOO PRODUCTION CONSUMPTION IMPORTS /9 2009/ / / / / / /16
37 1,000 t 30 RUSIA OLIVE OIL IMPORTS * 2000/ / t / / / / / / / / / / / / / / / / / 17 Monthly imports 2014/15, and 2015/16 crop years 2014/ /16 +3% October November December January February M arch April M ay June July August September * Including olive pomace oils Fuente: Global Trade International
 2015/16 (11")
38 RUSSIA - OLIVE OIL AND OLIVE POMACE OIL IMPORTS BY CATEGORY (t) 2015/16 (11 months)

39 OLIVE OIL EXPORTS 10 3 t

40 EXPORTS 2015/16 Chile 2% Tunez 12% Morocco 2% others 6% Italy 22% Turkey 2% Argentina 4% Greece 1% Portugal 6% Spain 39%

41 MARKET NEWSLETTER

42 For more information visit:
International Olive Council. International Olive Council
 Advisory Committee on Olive Oil and Table Olives 29 June 29 1 115 CHANGES IN WORLD CROP AREA (thousand hectares) Bearing Non-bearing Irrigated Dry-farmed % change between years = 2% 11,52 9,137,867 1,21,39
Spain s exports by oil product group and country of destination. Year Corporación de Reservas Estratégicas de Productos Petrolíferos
 Corporación de Reservas Estratégicas de Productos Petrolíferos Castellana, 79 28046 Madrid T. +34 91 360 09 10 Updated F. +34 91 420 on39 45 www.cores.es July 13 th 2015 Spain s exports by oil product
Spain s exports by oil product group and country of destination
 Corporación de Reservas Estratégicas de Productos Petrolíferos Castellana, 79 28046 Madrid T. +34 91 360 09 10 Updated F. +34 91 420 on39 45 www.cores.es February 13 th 2017 Spain s exports by oil product
Market situation in the Olive oil and Table olives sectors
 Market situation in the Olive oil and Table olives sectors Committee for the Common Organisation of the Agricultural Markets Arable crops and olive oil 26 January 2017 Lucie Zolichová, AGRI G.4 lucie.zolichova@ec.europa.eu
Market situation in the Olive oil and Table olives sectors
 Market situation in the Olive oil and Table olives sectors Committee for the Common Organisation of the Agricultural Markets Arable crops and olive oil 30 May 2017 Lucie Zolichová, AGRI G.4 lucie.zolichova@ec.europa.eu
Spain s imports by oil product group and country of origin
 Corporación de Reservas Estratégicas de Productos Petrolíferos Castellana, 79 28046 Madrid T. +34 91 360 09 10 Updated F. +34 91 420 on39 45 www.cores.es February 12 th 2018 Spain s imports by oil product
Average monthly prices of virgin olive oil in the most representative EU markets. ITALY - BARI SPAIN - JAÉN GREECE - CHANIA Reference threshold
 EU Prices Production EU Trade EU Stocks DG AGRI DASHBOARD: OLIVE OIL Last update: 12.1.217 /1kg /1kg Consumption /1kg EU Balance Sheet Average monthly prices of virgin olive oil in the most representative
Spain s imports by oil product group and country of origin
 Corporación de Reservas Estratégicas de Productos Petrolíferos Castellana, 79 28046 Madrid T. +34 91 360 09 10 Updated F. +34 91 420 on39 45 www.cores.es July 12 th 2018 Spain s imports by oil product
KINGDOM OF CAMBODIA NATION RELIGION KING 3
 KINGDOM OF CAMBODIA NATION RELIGION KING 3 TOURISM STATISTICS REPORT March 2015 MINISTRY OF TOURISM Statistics and Tourism Information Department No. A3, Street 169, Sangkat Veal Vong, Khan 7 Makara, Phnom
KINGDOM OF CAMBODIA NATION RELIGION KING 3
 KINGDOM OF CAMBODIA NATION RELIGION KING 3 TOURISM STATISTICS REPORT December 2015 MINISTRY OF TOURISM Statistics and Tourism Information Department No. A3, Street 169, Sangkat Veal Vong, Khan 7 Makara,
KINGDOM OF CAMBODIA NATION RELIGION KING 3
 KINGDOM OF CAMBODIA NATION RELIGION KING 3 TOURISM STATISTICS REPORT March 2018 MINISTRY OF TOURISM Statistics and Tourism Information Department No. A3, Street 169, Sangkat Veal Vong, Khan 7 Makara, Phnom
KINGDOM OF CAMBODIA NATION RELIGION KING 3
 KINGDOM OF CAMBODIA NATION RELIGION KING 3 TOURISM STATISTICS REPORT February 2017 MINISTRY OF TOURISM Statistics and Tourism Information Department No. A3, Street 169, Sangkat Veal Vong, Khan 7 Makara,
KINGDOM OF CAMBODIA NATION RELIGION KING 3
 KINGDOM OF CAMBODIA NATION RELIGION KING 3 TOURISM STATISTICS REPORT October 2017 MINISTRY OF TOURISM Statistics and Tourism Information Department No. A3, Street 169, Sangkat Veal Vong, Khan 7 Makara,
KINGDOM OF CAMBODIA NATION RELIGION KING 3
 KINGDOM OF CAMBODIA NATION RELIGION KING 3 TOURISM STATISTICS REPORT May 2017 MINISTRY OF TOURISM Statistics and Tourism Information Department No. A3, Street 169, Sangkat Veal Vong, Khan 7 Makara, Phnom
KINGDOM OF CAMBODIA NATION RELIGION KING 3
 KINGDOM OF CAMBODIA NATION RELIGION KING 3 TOURISM STATISTICS REPORT September 2017 MINISTRY OF TOURISM Statistics and Tourism Information Department No. A3, Street 169, Sangkat Veal Vong, Khan 7 Makara,
Spain s imports by oil product group and country of origin
 Corporación de Reservas Estratégicas de Productos Petrolíferos Castellana, 79 28046 Madrid T. +34 91 360 09 10 Updated F. +34 91 420 on39 45 www.cores.es September 12 th 2018 Spain s imports by oil product
The Great Transition: Shifting from Fossil Fuels to Solar and Wind Energy Supporting Data - Hydropower
 The Great Transition: Shifting from Fossil Fuels to Solar and Wind Energy Supporting Data - Hydropower World Installed Hydroelectric Generating Capacity, 1980-2013 GRAPH: World Installed Hydroelectric
World Air Conditioner Demand by Region
 World Air Conditioner Demand by Region April 2015 The Japan Refrigeration and Air Conditioning Industry Association 1 World Air Conditioner Demand by Region April 2015 The Japan Refrigeration and Air Conditioning
I. World trade in Overview
 I. World trade in - Overview Table I.1 Growth in the volume of world merchandise exports and production, 2-5 (Annual percentage change) 2-5 23 24 World merchandise exports 4.5 5. 9.5 6. Agricultural products
Citrus: World Markets and Trade
 United States Department of Agriculture Foreign Agricultural Service January 2017 Citrus: World Markets and Trade Oranges Global orange production for 2016/17 is forecast up 2.4 million metric tons from
Production of heat by type Terajoules
 Production of heat by type Table Notes geo represents heat used directly for district heating, agriculture etc. without a commercial transaction taking place. Please refer to the Definitions Section on
35,000 52,000 87,000 1,600 8, ,400 76,600. Mean Crop. Monthly YTD Min ,671 8,211 Max. 2017
 YTD Inventory / Shipment Report In Shell Basis Crop: 2018 Monthly Market Prices FCA Hamburg Iranian Dried In Shell 28/30 Fandoghi Pistachios Total Consumption Ending Inventory 2nd Marketing Month YTD Carry
M O T O R V E H I C L E S T A T I S T l C S
 M O T O R V E H I C L E S T A T I S T l C S of Japan 2017 JAPAN AUTOMOBILE MANUFACTURERS ASSOCIATlON, INC. C O N T E N T S Motor Vehicles in Use Cars, Trucks, Buses and Special Purpose Vehicles, 1945-2016
Production of heat by type Terajoules
 Production of heat by type Table Notes geo represents heat used directly for district heating, agriculture etc. without a commercial transaction taking place. represents heat used for the production of
Primary energy. 8 Consumption 9 Consumption by fuel. 67 th edition
 Primary energy 8 Consumption 9 Consumption by fuel 67 th edition Primary energy Consumption* Growth rate per annum Million tonnes oil equivalent 27 28 29 2 211 212 213 214 215 216 217 217 26-16 Share 217
China s Global Peanut Export Share Declines
 United States Department of Agriculture Foreign Agricultural Service Circular Series FOP 07-13 China s Global Peanut Export Share Declines U.S. 10% Others 19% Argentina 17% U.S. 11% Others 16% Argentina
2016/17 Global Olive Oil Production Down But Prices Stabilize
 United States Department of Agriculture Foreign Agricultural Service November 2016 Global Olive Oil Down But Prices Stabilize Global Olive Oil and Stocks 4000 3500 5000 Extra Virgin Olive Oil Prices Stabilizing
Kernel Wt. 533,229,317 1,005,999,479 1,539,228, ,964, ,947, ,911, Crop Year
 Almond Industry Position Report MAY 2015 2014-2015 Crop Year Salable Forecast Million Lbs. 2014-2015 Kernel Wt. 2013-2014 Kernel Wt. % Change 1. Carryin August 1, 2014 2. Crop Receipts to Date 3. [3% Loss
19,000 38,500. Mean Crop. 5, ,827 Max , ,869 Last Year 6, ,
 YTD Inventory / Shipment Report In Shell Basis Crop: 2017 Monthly Market Prices FCA Hamburg Iranian Dried In Shell 28/30 Fandoghi Pistachios 10th Marketing Month YTD Carry in from previous year 3,000 Total
AUSTRIA. Table 1. FDI flows in the host economy, by geographical origin. (Millions of US dollars)
") Table 1. FDI flows in the host economy, by geographical origin World 5 690 138 6 195 3 184 10 784 7 933 31 154 6 858 9 303 840 10 618 5 760 Developed economies 5 740 13 5 341 2 689 10 137 6 291 29 721
Table 1. FDI flows in the host economy, by geographical origin World 5 690 138 6 195 3 184 10 784 7 933 31 154 6 858 9 303 840 10 618 5 760 Developed economies 5 740 13 5 341 2 689 10 137 6 291 29 721
Sharp Decline in Vegetable Oil Stocks Leads to Steeply Higher Prices
 United States Department of Agriculture Foreign Agricultural Service Circular Series FOP 1-11 Sharp Decline in Vegetable Oil Leads to Steeply Higher Prices Commodity prices have been on an upward trend
EU-25 Soybean Crush Forecast to Decline in 2005/06
 United States Department of Agriculture Foreign Agricultural Service Circular Series FOP 3-06 March 2006 EU-25 Soybean Crush Forecast to Decline in 2005/06 EU-25 Soybean Crush 20 19 18 17 Million tons
67 th edition. Renewable energy. Appendices. 44 Other renewables consumption 45 Biofuels production
 Renewable energy 44 Other renewables consumption 45 Biofuels production Appendices A1 Solar Generation A2 Wind Generation A3 Geothermal, biomass and other Generation A4 Geothermal Cumulative installed
1. INTERNATIONAL OVERVIEW. 1.0 Area and population. population (1,000) area
 area") 1.0 Area and population area population (1,000) km 2 2000 2010 2018 1 inhabitants per km 2 Belgium 30,530 10,251 10,920 11,443 375 Germany 357,380 82,212 81,777 82,952 232 Estonia 45,230 1,397 1,331 1,315
1.0 Area and population area population (1,000) km 2 2000 2010 2018 1 inhabitants per km 2 Belgium 30,530 10,251 10,920 11,443 375 Germany 357,380 82,212 81,777 82,952 232 Estonia 45,230 1,397 1,331 1,315
Global Threat Reduction Initiative Foreign Research Reactor Spent Nuclear Fuel Shipments
 FY1996 1. Sept. 22, 1996 280 assemblies in 8 casks to SRS [First East Coast Shipment] FY 1997 Sweden 64 Switzerland 42 Germany 125 Chile 28 Columbia 21 2. Dec. 15, 1996 41 spent fuel assemblies in one
As China s Soybean Oil Imports Fall, Production Expands
 United States Department of Agriculture Foreign Agricultural Service Circular Series FOP 10-10 October 2010 As China s Soybean Oil Fall, Expands 12 10 Million Metric Tons 8 6 4 2 0 2006/07 2007/08 China
Argentine Exporters Switch to Soybean Oil as Biodiesel Exports Fall
 United States Department of Agriculture Foreign Agricultural Service Circular Series FOP 08-13 Argentine Exporters Switch to Soybean Oil as Biodiesel Exports Fall Argentina s soybean oil exports have surged
Steel Statistical Yearbook 2013
 Steel Statistical Yearbook 2013 worldsteel Committee on Economic Studies Brussels, 2013 Table 6 Crude Steel Production by Process * Year: 2011 OBC EF OHF Other Total OBC EF OHF Other Total
Indian Soybean Meal Exports Unlikely to Recover in 2015/16
 United States Department of Agriculture Foreign Agricultural Service November 2015 Indian Soybean Meal Exports Unlikely to Recover in Though once a significant regional exporter of soybean meal, India
China s Rapeseed Meal Imports Rise as Seed Imports Decline
 United States Department of Agriculture Foreign Agricultural Service February 2017 China s Rapeseed Meal Rise as Seed Decline Trend in China Rapeseed 12-Month Moving Totals Trend In China Rapeseed Meal
BP Statistical Review of World Energy June 2017
 BP Statistical Review of World Energy June 217 Primary energy 8 Consumption 8 Consumption by fuel 9 66 th edition Primary energy Consumption* Growth rate per annum Million tonnes oil equivalent 26 27 28
Civil Dialogue Group on WINE Thursday April 19th, 2018
 COMMISSION EUROPÉENNE DIRECTION GÉNÉRALE DE L'AGRICULTURE ET DU DÉVELOPPEMENT RURAL Directorate G. Markets and Observatories G.2. Wine, spirits and horticultural products Bruxelles, le G.2/GD(2017) Civil
Citrus: World Markets and Trade
 United States Department of Agriculture Foreign Agricultural Service uary 2015 Citrus: World Markets and Trade Oranges Global orange production for is forecast to decline 4 percent from the previous year
Cotton This Month. Major Changes in Supply and Demand Estimates and Projections
 1629 K Street NW, Suite 702 Washington, DC 20006, USA Cotton This Month February 1, 2018 Major Changes in Supply and Demand Estimates and Projections India Mexico Pakistan United States 2017/18 production
Soybean Oil Prices Diverge on Different Supply Situations
 United States Department of Agriculture Foreign Agricultural Service Circular Series FOP 10-09 October 2009 Soybean Oil Prices Diverge on Different Supply Situations Soybean Oil Price ($/ton) $900 $850
U.S. Soybean Export Forecast Declines This Month by 1.4 MMT South American Export Forecast Increases
 United States Department of Agriculture Foreign Agricultural Service Circular Series FOP 12-05 December 2005 U.S. Soybean Export Forecast Declines This Month by 1.4 MMT South American Export Forecast Increases
Natural gas. 26 Reserves 28 Production and consumption 33 Prices 34 Trade movements. 67 th edition
 Natural gas 26 Reserves 28 Production and consumption 33 Prices 34 Trade movements 67 th edition Natural gas Total proved reserves At end 1997 At end 2007 At end 2016 At end Trillion Trillion Trillion
Soybean Trade Growth: A Story of Brazil, the United States, and China
 United States Department of Agriculture Foreign Agricultural Service October 2017 Soybean Trade Growth: A Story of Brazil, the United States, and China 12-Month Soybean Export Growth Year Ending September
WORLD MOTOR VEHICLE PRODUCTION BY COUNTRY AND TYPE QUARTERS June 14, 2018
 QUARTERS 2017-2018 June 14, 2018 CONTENTS BASEPROTOTAL BASEPROCARS BASEPROLCV BASEPROHCV BASEPROBC Summation of cars, LCVs, HCVs, heavy buses Cars LCVs HCVs Heavy buses Note: The production of cars and
Growing Fuel Use Limits Exports of Soybean Oil by South America
 United States Department of Agriculture Foreign Agricultural Service Circular Series FOP 11-09 ember 2009 Growing Fuel Use Limits of Soybean Oil by South America 2006/07 Soybean Oil Distribution Soybean
Imports of seed for sowing by country Calendar year 2011 Source: ISF compilation based on official statistics and international seed trade reports
 USA 157,432 15,562 464 173,458 523 318 67 908 Germany 195,159 5,913 520 201,592 595 97 22 714 France 125,701 4,389 277 130,367 522 150 11 683 Netherlands 140,899 12,253 796 153,948 250 330 48 628 Italy
Table 13 Production, trade and supply of conventional crude oil Thousand metric tons; kilograms per capita; reserves production ratio (R/P) in years
 in years") , trade and supply of conventional crude oil Thousand metric tons; kilograms per capita; reserves production ratio (R/P) in years Table Notes The Reserves / ratio refers to crude oil and natural gas liquids.
, trade and supply of conventional crude oil Thousand metric tons; kilograms per capita; reserves production ratio (R/P) in years Table Notes The Reserves / ratio refers to crude oil and natural gas liquids.
Growing Soybean Oil Price Raises Oil s Contribution to Total Soybean Value
 United States Department of Agriculture Foreign Agricultural Service Circular Series FOP 10-07 October 2007 Growing Soybean Oil Price Raises Oil s Contribution to Total Soybean Value Relative Share Value:
China Tariffs Driving U.S. Soybean Exports To the European Union to a 30-Year High
 United States Department of Agriculture Foreign Agricultural Service March 2019 China Tariffs Driving U.S. Soybean Exports To the European Union to a 30-Year High 12-MONTH MOVING TOTAL U.S. SOYBEAN EXPORTS
exports of goods annual change (%)
") 12.0 Austria s foreign trade 2015 by world region imports of goods 2015 exports of goods 2015 region 1 1 share (%) share (%) Europe 106,984 80.4 104,032 79.1 EU 93,686 70.4 90,841 69.1 EFTA 8,020 6.0 8,098
12.0 Austria s foreign trade 2015 by world region imports of goods 2015 exports of goods 2015 region 1 1 share (%) share (%) Europe 106,984 80.4 104,032 79.1 EU 93,686 70.4 90,841 69.1 EFTA 8,020 6.0 8,098
exports of goods annual change (%)
") 12.0 Austria s foreign trade 2016 by world region imports of goods 2016 exports of goods 2016 region 1 1 share (%) share (%) Europe 110,067 81.2 104,271 79.5 EU 96,801 71.4 91,112 69.4 EFTA 7,718 5.7 8,132
12.0 Austria s foreign trade 2016 by world region imports of goods 2016 exports of goods 2016 region 1 1 share (%) share (%) Europe 110,067 81.2 104,271 79.5 EU 96,801 71.4 91,112 69.4 EFTA 7,718 5.7 8,132
Textile Per Capita Consumption
 November 2017 Textile Per Capita Consumption 2005-2022 Part 1: Lower middle income countries CHF300.- Table of Contents Preface... 4 Sources... 5 Definitions... 6 Charts... 7 Executive Summary... 9 Country
KINGDOM OF CAMBODIA NATION RELIGION KING 3
 KINGDOM OF CAMBODIA NATION RELIGION KING 3 TOURISM STATISTICS REPORT October 2018 MINISTRY OF TOURISM Statistics and Tourism Information Department No. A3, Street 169, Sangkat Veal Vong, Khan 7 Makara,
Global Monthly March 2019
 Global Monthly March 19 Percent of world bonds outstanding 3 5 15 5 Jan-1 Jun-1 Nov-1 Apr-15 Sep-15 Feb-1 Jul-1 Dec-1 May-17 Oct-17 Mar-1 Aug-1 Dec-1 Mar-19 March 19 Percent, year-on-year 7 5 3 1 1Q1 1Q
KINGDOM OF CAMBODIA NATION RELIGION KING 3
 KINGDOM OF CAMBODIA NATION RELIGION KING 3 TOURISM STATISTICS REPORT September 2018 MINISTRY OF TOURISM Statistics and Tourism Information Department No. A3, Street 169, Sangkat Veal Vong, Khan 7 Makara,
China Soybean Imports Stagnant Despite Record Consumption as Production Rebounds
 United States Department of Agriculture Foreign Agricultural Service Circular Series FOP 9-08 tember 2008 China Soybean Stagnant Despite Record Consumption as Rebounds Million Tons 60 50 40 30 20 10 0
Citrus: World Markets and Trade
 United States Department of Agriculture Foreign Agricultural Service y 2018 Citrus: World Markets and Trade Oranges Global orange production for is forecast to tumble 6.0 million metric tons (tons) from
Table 13 Production, trade and supply of conventional crude oil Thousand metric tons; kilograms per capita; reserves production ratio (R/P) in years
 in years") Table 13, trade and supply of conventional crude oil Thousand metric tons; kilograms per capita; reserves production ratio (R/P) in years Table Notes The Reserves / ratio refers to crude oil and natural
Table 13, trade and supply of conventional crude oil Thousand metric tons; kilograms per capita; reserves production ratio (R/P) in years Table Notes The Reserves / ratio refers to crude oil and natural
Pakistan Oilseed Processors Seize Opportunity to Crush Soybeans
 United States Department of Agriculture Foreign Agricultural Service December 2015 Pakistan Oilseed Processors Seize Opportunity to Crush Soybeans Pakistan, long an importer of soybean meal, is transitioning
Coconut Oil Prices Spike
 United States Department of Agriculture Foreign Agricultural Service Coconut Oil Prices Spike Coconut oil prices have surged over the past year in contrast to the general downward trend in other vegetable
Grain: World Markets and Trade
 United States Department of Agriculture Foreign Agricultural Service Circular Series FG 6-2 June 22 Grain: World Markets and Trade Corn Competition Continues to Contract 2/1 21/2 22/3 U.S. S. America China
Table 13 Production, trade and supply of conventional crude oil Thousand metric tons; kilograms per capita; reserves production ratio (R/P) in years
 in years") Million metric tons Million metric tons Table 13, trade and supply of conventional crude oil Thousand metric tons; kilograms per capita; reserves production ratio (R/P) in years Table Notes The Reserves
Million metric tons Million metric tons Table 13, trade and supply of conventional crude oil Thousand metric tons; kilograms per capita; reserves production ratio (R/P) in years Table Notes The Reserves
Kernel Wt. 218,700, ,434, ,134, ,161, ,785, ,947, Crop Year
 Almond Industry Position Report 2010-2011 Crop Year Salable Forecast Million Lbs. 2010-2011 8/1-12/31 Kernel Wt. 2009-2010 8/1-12/31 Kernel Wt. December 2010 % Change 1. Carryin August 1, 2010 2. Crop
Next Release: 14 November Next Release: 14 November July
 43282 Next Release: 14 November 2018 Next Release: 14 November 2018 July Date of publication: 12 October 2018 TABLE OF CONTENTS Charts 1 Gross consumption of natural gas by OECD region 3 2 Indigenous production
NZPork Monthly Import Report
 NZPork Monthly Import Report IW Barugh and EJ Neumann December 10, 2017 1 Data summary for October 2017 Data from January 2000 through October 2017 was downloaded from the Statistics NZ website (http://www.stats.govt.
Share of Brazil s Soybean Exports to China Spikes in August
 United States Department of Agriculture Foreign Agricultural Service September 2018 Share of Brazil s Soybean Exports to China Spikes in August Monthly Share of Brazil's Soybean Exports to China 85% 75%
FEDERAL RESERVE statistical release
 FEDERAL RESERVE statistical release FOR IMMEDIATE RELEASE MARCH 16, 1992 E.U C1Z1, GEOGRAPHICAL r DISTRIBUTION n OF e ASSETS AND^LIABILITIES (IN MILLIONS OF DOLLARS) ASSETS COUNTRY OF CUSTOMER 12/31/90
China is Key to Slow Pace of U.S. Soybean Exports
 United States Department of Agriculture Foreign Agricultural Service January 2018 China is Key to Slow Pace of U.S. Soybean Exports U.S. and Brazil Soybean Exports by Destination (Accumulated Exports:
265,796, ,447,255 1,021,243, ,522, ,349, ,871, Crop Year
 Almond Industry Position Report 2011-2012 Crop Year Salable Forecast Million Lbs. 2011-2012 8/1-01/31 Kernel Wt. 2010-2011 8/1-01/31 Kernel Wt. JANUARY 2012 % Change 1. Carryin August 1, 2011 2. Crop Receipts
Kernel Wt. 422,141, ,395,402 1,248,536, ,849, ,298, ,148, Crop Year
 Almond Industry Position Report 2014-2015 Crop Year Salable Forecast Million Lbs. 2014-2015 8/1-3/31 Kernel Wt. 2013-2014 8/1-3/31 Kernel Wt. MARCH 2015 % Change 1. Carryin August 1, 2014 2. Crop Receipts
Fresh Connections: Netherlands
 Fresh Connections: Netherlands SHIFTING TRADE WINDS: GEOPOLITICS, GLOBAL TRADE & YOU JULIEN MARCILLY CHIEF ECONOMIST APRIL 29, 215 Oil prices: Lower for longer 14 Oil price (Brent, source: OPEC) 12 Oil
Kernel Wt. 649,153, ,948, ,710, ,452, ,163, Crop Year 8/1-2/29 342,795,454 -2, ,935
 Almond Industry Position Report 2015-2016 Crop Year Salable Forecast Million Lbs. 2015-2016 8/1-2/29 Kernel Wt. FEBRUARY 2016 2014-2015 8/1-2/28 Kernel Wt. % Change 1. Carryin August 1, 2015 2. Crop Receipts
Brazil s Soybean Oil Exports Squeezed by Rising Biodiesel Demand
 United States Department of Agriculture Foreign Agricultural Service Circular Series FOP 6-09 e 2009 Brazil s Soybean Oil Exports Squeezed by Rising Biodiesel Demand Soybean Oil Exports and Industrial
World Wheat Supply and Demand Situation December 2018
 World Wheat Supply and Demand Situation December 218 Major data source: USDA World Agricultural Supply and Demand Estimates released December 11, 218. Projections will change over the course of the year
Rising Coconut Oil Prices Foreshadow Tight Supplies in 2007
 United States Department of Agriculture Foreign Agricultural Service Circular Series FOP 2-07 ruary 2007 Rising Coconut Oil Prices Foreshadow Tight Supplies in 2007 800 Coconut Oil Price: CIF Rotterdam
U.S. Soybean Prices Fall as Buyers Focus Turns to South America
 United States Department of Agriculture Foreign Agricultural Service Circular Series FOP 2-10 ruary 2010 U.S. Soybean Prices Fall as Buyers Focus Turns to South America $11.00 Daily U.S. Soybean Cash Price
Regional Vegetable Oil Situation: Cut in Sun Oil Production, Imports Leaves North Africa & the Middle East Looking for Soy & Palm Oil to Fill Demand
 United States Department of Agriculture Foreign Agricultural Service Circular Series FOP 09-07 tember 2007 Regional Vegetable Oil Situation: Cut in Sun Oil, Leaves North Africa & the Middle East Looking
EXECUTIVE SUMMARY ATLANTIC SALMON NO 03/06
 MARKET This table shows development in supply/consumption of Atlantic salmon in the main markets per month, in tonnes r.w The table contains preliminary figures and may diverge from same figures in the
Citrus: World Markets and Trade
 United States Department of Agriculture Foreign Agricultural Service July 2015 Citrus: World Markets and Trade Oranges Global orange production for is estimated to decline 7 percent from the previous year
World Wheat Supply and Demand Situation
 World Wheat Supply and Demand Situation November 218 Major data source: USDA World Agricultural Supply and Demand Estimates released November, 218. Projections will change over the course of the year depending
Cotton This Month. Major Changes in Supply and Demand Estimates and Projections
 1629 K Street NW, Suite 702 Washington, DC 20006, USA Cotton This Month March 1, 2018 Major Changes in Supply and Demand Estimates and Projections Brazil China Turkey United States 2017/18: production
World Wheat Supply and Demand Situation October 2018
 World Wheat Supply and Demand Situation October 218 Major data source: USDA World Agricultural Supply and Demand Estimates released October 12, 218. Projections will change over the course of the year
Drought Forecast to Reduce Australian Rapeseed Exports in 2007
 United States Department of Agriculture Foreign Agricultural Service Circular Series FOP 11-06 November 2006 Drought Forecast to Reduce Australian Rapeseed Exports in 2007 1800 1600 1400 1200 1000 800
Drought in South America to Limit Soybean Exports
 United States Department of Agriculture Foreign Agricultural Service Circular Series FOP 2-09 ruary 2009 Drought in South America to Limit Soybean Exports Million Tons 16 14 12 10 8 6 4 2 Annual Change
Production (bbl/day)
") 1 of 5 14/09/2011 22:15 From Wikipedia, the free encyclopedia This is a list of countries by oil production mostly based on CIA World Factbook data. [1] Note that oil production refers to the sum of barrels
1 of 5 14/09/2011 22:15 From Wikipedia, the free encyclopedia This is a list of countries by oil production mostly based on CIA World Factbook data. [1] Note that oil production refers to the sum of barrels
World real merchandise trade grows faster than output
 I. I. world trade developments 8 Merchandise trade and GDP World real merchandise trade grows faster than output In 2006, the volume of world merchandise trade grew by 8 per cent while world gross domestic
Delivery Statistics. Second quarter 2015 EUROPEAN PULP AND PAPER INDUSTRY
 Second quarter EUROPEAN PULP AND PAPER INDUSTRY INTRODUCTION 2 nd Quarter, Paper and board deliveries by CEPI countries were 45.9 million tonnes in the first half of, a small tonnage decrease on the same
Global Monthly February 2018
 Global Monthly February 18 3 1-year Treasury yields 1-year breakeven inflation rate 1 1 15 16 17 18 February 18 5 3 Global GDP growth Composite PMI (RHS) Index 56 5 5 1 5 1 13 1 15 16 17 18 3..5. 1.5 1.
U.S. Soybean Exports Forecast to Reach Record
 United States Department of Agriculture Foreign Agricultural Service July 2017 U.S. Soybean Exports Forecast to Reach Record 60 Accumulated Exports by Week Total Commitments of Soybeans as of End of June
Early-Season U.S. Soybean Meal Sales Surge
 United States Department of Agriculture Foreign Agricultural Service November 2014 Early-Season U.S. Soybean Meal Sales Surge U.S. soybean meal export commitments (accumulated exports plus outstanding
ANNUAL STATISTICAL SUPPLEMENT
 ANNUAL STATISTICAL SUPPLEMENT with 2016 data 2017 Edition This Statistical Supplement has been prepared to provide a longer historical perspective for the oil demand, supply, trade, stocks, prices and
Explosive Growth in Vegetable Oil Demand Exacerbates Chinese Supply Deficit, Reliance on Imports. Imports
 United States Department of Agriculture Foreign Agricultural Service Circular Series FOP 12-07 ember 2007 Million tons 35 Explosive Growth in Vegetable Oil Demand Exacerbates Chinese Supply Deficit, Reliance
Soybean and Oilseed Meal Import Prospects Higher as Severe Weather Damages EU Crops
 Million Tons Million Tons Million Tons United States Department of Agriculture Foreign Agricultural Service August 2018 Soybean and Oilseed Meal Import Prospects Higher as Severe Weather Damages EU Crops
Wheat Marketing Situation
 Wheat Marketing Situation Prepared by: Darrell L. Hanavan Executive Director Colorado Wheat Administrative Committee If you would like to receive an email when this report is updated, email gmostek@coloradowheat.org
Table 5 Production, trade and supply of hard coal Thousand metric tons and kilograms per capita
 Table Notes Production includes production from other sources as defined in the previous table. Data for China include brown coal. Please refer to the Definitions Section on pages ix to xv for the appropriate