1st Quarter Result for Fiscal year ending February 29, 2016
|
|
|
- Damon Adams
- 6 years ago
- Views:
Transcription
1 Last updated: July 13, st Quarter Result for Fiscal year ending February 29, 2016 July 13, 2015 Gulliver International Co., Ltd. (7599)
2 Contents Ⅰ. 1st Quarter Result for FY 2016 Ⅱ. Acquisition of Buick Holdings Pty Ltd (DVG Automotive Group) in Australia Ⅲ. Business Domain Expansion and M&A Ⅳ. Reference 2
3 Ⅰ.1st Quarter Result for FY
4 1Q Summary No. of cars purchased No. of wholesale No. of retail car sales SG&A expenses Operating income FY Q 36,230 cars 30,105 cars 12,840 cars 7.91 billion yen 1.47 billion yen FY Q 48,189 cars 37,652 cars 18,416 cars 9.69 billion yen 2.04 billion yen *Number of cars for direct stores. 4
5 Consolidated Operating Income (unit:million yen) Real-term increase in operating income 2, ,040 the change to estimates for provision for merchandise warranties 1, FY2015 1Q FY2016 1Q 5


6 Car Distribution Flow at Gulliver s Directly Managed Stores General Consumers Inventory time: limited to two weeks (hard-and-fast rule) Luxury foreign cars Foreign cars Low price cars Light car specialist Original Gulliver Stores People movers Mid-sized car show space Auction Sites Approx. 120 sites Eco-cars Light cars Appraisal Older model cars Large-sized car Luxury show space hybrid car specialist Foreign car specialist foreign car specialist USS JU JAA Aucnet Bought by Used-car dealers Purchase(Stock) Retail Sales B to C Wholesale B to B 6


7 Process leading to retail close Original Gulliver stores Display sales stores New car upgrade Used car upgrade Sell only without upgrading Used car upgrade Visiting only to sell current vehicle Visiting to purchase used vehicle Sales talk for cross selling Sales talk for responding to needs Large-sized car show space hybrid car specialist Foreign car specialist Luxury foreign car specialis Low price cars Light car specialist Mid-sized car show space 7
8 Status of display sales stores (existing stores ; sales volume) (unit:car) Ave 36.6 cars/mo Mar Apr May Jun Jul Aug Sep Oct Nov Dec Jan Feb *Average retail car sales for stores that opened before February 2015 and are fully operational in the fiscal year ending February 2016 (excluding Shake! Hamamatsu and VOLVO Matsuyama) 8


9 Display sales stores opened OL R1-Toyohashinishiguchi Aichi, Toyohashi OL R38-Obihiro Hokkaido, Obihiro OL R41-Komaki Aichi, Komaki OL Naritakukodori Chiba, Narita OL Hamamatsuirino Shizuoka, Hamamatsu SN Tsukubakenkyugakuen Ibaraki, Tsukuba SN Shizuokaikeda Shizuoka, Shizuoka SN Hamamatsushinzucho Shizuoka, Hamamatsu SN Nagoyanarumi Aichi, Nagoya LIBERALA Utsunomiya Tochigi, Utsunomiya LIBERALA Takamatsu Kagawa, Takamatsu LIBERALA Hamamatsuwada Shizuoka, Hamamatsu MC Tsukubakenkyugakuen Ibaraki, Tsukuba MC Isesaki Gunma, Isesaki 9
10 Basis for current term development plan Mar-May Net Increase Contracts finalized but not yet opened (As of May 31) Sites currently under negotiation (As of May 31) New projects 13 stores 48 stores 52 stores Plan to open this term 100 stores (First half 35 stores + Second half 65 stores) 10


 Kashiwa")


11 Business Development at Nakamitsu Motors BMW Ichikawa Chiba, Ichikawa Urayasu Chiba, Urayasu Funabashi Chiba, Funabashi Matsudo Chiba, Matsudo Kashiwa Chiba, Kashiwa BMW Premium Selection (used car) Urayasu Chiba, Urayasu Funabashi Chiba, Funabashi Kashiwa Chiba, Kashiwa MINI Ichikawa Chiba, Ichikawa Funabashi Chiba, Funabashi Matsudo Chiba, Matsudo Kashiwa Chiba, Kashiwa *Nakamitsu Motors Co., LTD. is scheduled to be renamed Motoren Glanz Co., LTD. 11
12 Sales performance at Nakamitsu Motors 198 million yen 28 million yen Simple average of Feb-Mar sales for the past six years Feb-Mar for this term *Nakamitsu Motors Co., LTD. is scheduled to be renamed Motoren Glanz Co., LTD. 12
13 Sales performance at Nakamitsu Motors Aim for a 7% operating margin as soon as possible *Nakamitsu Motors Co., LTD. is scheduled to be renamed Motoren Glanz Co., LTD. 13
14 Ⅱ. Acquisition of Buick Holdings Pty Ltd (DVG Automotive Group) in Australia 14
15 1. Why Australia? 2. What kind of company is Buick? 3. What will Buick contribute to results? 4. What will be the post-acquisition management structure? 5. How will you source the acquisition funds? 15
16 1. Why Australia? 2. What kind of company is Buick? 3. What will Buick contribute to results? 4. What will be the post-acquisition management structure? 5. How will you source the acquisition funds? 16
17 Economic Situation in Australia (unit:billion AUD) 2,500 (unit:million people) 30 2,000 Population Nominal GDP Real GDP *Right scale *Left scale *Left scale 25 1, , Stable growth *source: IMF Survey 17


18 New Car Market in Australia (Annual New Car Sales Volume) (unit:car) 1,200,000 1,000, , , , ,000 Stable growth 0 '95/6 '96/6 '97/6 '98/6 '99/6 '00/6 '01/6 '02/6 '03/6 '04/6 '05/6 '06/6 '07/6 '08/6 '09/6 '10/6 '11/6 '12/6 '13/6 '14/6 *source : Australian Bureau of Statistics 18
19 1. Why Australia? 2. What kind of company is Buick? 3. What will Buick contribute to results? 4. What will be the post-acquisition management structure? 5. How will you source the acquisition funds? 19
20 Overview of the Acquired Company Buick Holdings operates 25 multi-brand automotive dealerships at around 10 locations in Western Australia Toyota Nissan Honda Isuzu Mitsubishi Suzuki Hyundai Kia Holden Chrysler Peugeot Volks wagen FIAT Alfa Romeo 20
21 Dealer Breakdown by Brand DVG Wanneroo Mitsubishi January, Isuzu October, DVG Morley Hyundai January, Mitsubishi March, Nissan January, DVG Midland Hyundai January, Mitsubishi January, Nissan January, Kia March, DVG Maddington Chrysler June, Isuzu October, Hyundai June, DVG Melville Hyundai September, Chrysler September, Peugeot February, Volkswagen January,2010- FIAT March, Alfa Romeo March, Prosser Toyota Toyota March, Midland Toyota Toyota March, Isuzu October, Canning Vale Toyota February, Goldy Motors Holden February, Suzuki February, Burswood Honda Honda March,
22 History of Dealership Management DVG Wanneroo Mitsubishi January, DVG Morley Hyundai January, DVG Midland Hyundai January, DVG Morley Mitsubishi March, DVG Midland Mitsubishi January, 2001 DVG Midland Nissan January, DVG Maddington Chrysler June, DVG Morley Nissan January, DVG Melville Hyundai September, DVG Melville Chrysler September, DVG Melville Peugeot February, DVG Midland Kia March, Prosser Toyota Toyota March, Midland Toyota Toyota March, DVG Wanneroo Isuzu October, DVG Maddington Isuzu October, Midland Toyota Isuzu October, DVG Melville Volkswagen January,2010- Canning Vale Toyota February, DVG Maddington Hyundai June, Goldy Motors Holden February, Goldy Motors Suzuki February, DVG Melville FIAT March, DVG Melville Alfa Romeo March, Burswood Honda Honda March,
23 Historical Sales Steady growth through the development of multi-brand dealers, with a sales volume track record of approx. 14,000 vehicles a year (unit:million AUD) /6 02/6 03/6 04/6 05/6 06/6 07/6 08/6 09/6 10/6 11/6 12/6 13/6 14/6 23


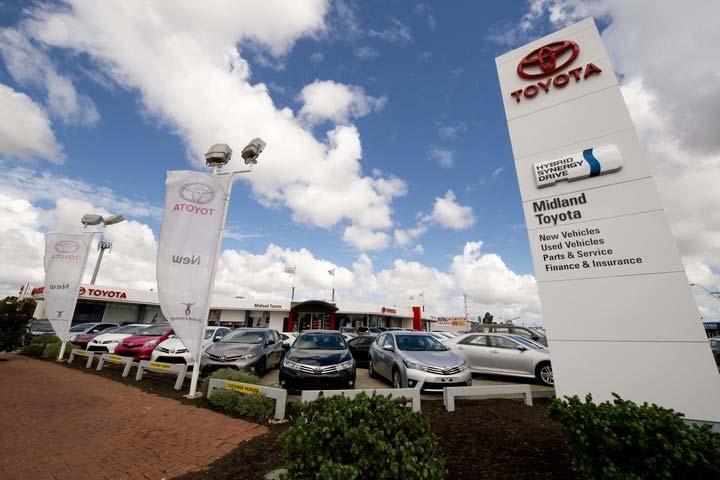

24 Storefront Photos of the Local Dealerships 24


25 Storefront Photos of the Local Dealerships 25


26 Storefront Photos of the Local Dealerships 26


27 Storefront Photos of the Local Dealerships 27
 Dominic")

 Michael DiVirgilio Director General Manager")

28 Current Management and Shareholders Tightly owned and managed by the DiVirgilio family Stephen DiVirgilio Director Regional Manager (Morley & Wanneroo) Dominic DiVirgilio Director Founding member One of the most knowledgeable and experienced in the industry Oversees the group s operation and strategies Dealer Principal Luigi DiVirgilio Managing Director Founding member Top management David DiVirgilio Director Regional Manager (Midland) Michael DiVirgilio Director General Manager (Operation) Dealer Principal Robert DiVirgilio Director Founding member Over 15 years of dealer management experience Dealer Principal John DiVirgilio Director General Manager (Wholesale) 28

29 Career History of Top Management Luigi DiVirgilio Managing Director Luigi DiVirgilio founded Buick Holdings together with his younger brothers after working for financial institutions in Sydney and New York. As the oldest son of the family, he took charge of management to grow Buick Holdings into one of Australia s leading group of automotive dealers with approximately 700 employees. Mr. DiVirgilio has been a board member of the Australian Automotive Dealer Association since 2014 and was the Mitsubishi Australia Subcommittee Dealer Representative in
30 History of Awards and Commendations (Excerpt, Random Order) Midland Toyota Star Guest Experience Dealership- Sales & Service 2014 Number 1 Metro Sales Guest Satisfaction Index 2011, 2012, Bronze Knight Sales Award Bronze Brand & Customer Experience Award 2012, Bronze Customer First Award for Excellence Bronze Business Management Award 2013, 2014, Fleet Specialist Dealer Accredited 2013, Used Cars Excellence Award TSM Foundations Accredited Dealer the last year they changed it to the Nissan Dealer excellence award. In 2014 Midland Nissan was awarded Nissan dealer excellence award. This would be 5th year in a row Midland Nissan has achieved Nissans highest accolades. The Nissan award covers all areas of the business. To achieve the award you need to be above national average in both Sales and service CSi, you also need to achieve all sales and parts targets. Burswood Honda National Awards Honda Dealer of the Year 2009 Honda Customer Service Excellence Award 2009 National Honda Insurance Sales Winner 2009 Honda Dealer of the Year 2007 Honda Excellence Award Winner 2010 Honda Excellence Award Winner 2011 Honda Excellence Award Winner 2012 Honda Excellence Award Winner 2013 Western Australia New Car Sales Excellence 2009 New Car Sales Excellence 2008 New Car Sales Excellence 2006 Overall Excellence 2010 Prosser Toyota - Canning Vale 2013 Silver Service Excellence Award Metro (Number 1 in the State, top 5 in Australia) Bronze Service Excellence Award Metro Bronze Business Management Excellence Award Silver Toyota Access Dealer of the Year TSM Foundations Accredited (Toyota Customer Service Workshop Management) Toyota Sales Silver Knight 2014 Midland Isuzu Silver Service Excellence Award Metro (Number 1 in the State, top Awarded National Dealer Evaluation Program Top 25 Consecutively Award by Auto 5 in Australia) Makers Bronze Service Excellence Award Metro Midland Nissan Bronze Toyota Access Dealer of the Year Nissan has achieved Platinum Dealership award for the last 3 years, in Overall Excellence 2009 TSM Foundations PLUS (Toyota Customer Service Workshop Management) Express Maintenance All 2015 awards will be announced in February next year. We are currently a 5 Star Dealer YTD in 2015 Overall Excellence 2008 Overall Excellence 2007 Overall Excellence 2006 High Customer Overall Excellence 2005 Satisfaction Service Overall Excellence 2009 Service Overall Excellence 2005 Service Overall Excellence 2003 one of Dealers of 200 Nationally. Wanneroo Mitsubishi Have for the last 2 years achieved Millennium Dealer status, being Midland Nissan has also achieved Nissan Global dealership of Service Overall Excellence 2001 the year award in Parts and Accessories Excellence Award 2009 Parts and Accessories Excellence Award 2008 Midland Hyundai and Service Parts and Accessories Excellence Quality Award 2006 Ratings Hyundai has achieved the same awards from We have 30th Anniversary Honda dealership 2008 achieved Best Sales Manager Award for our category and we also acquired the franchise 2008 achieved Best Service Manager for our category. Prosser Toyota - Gosnells We have also achieved Best sales and Best service CSI from Toyota Financial Services Toyota Access Silver Award Midland Hyundai also achieved the Best Service CSI for 2014 in our Toyota Sales Silver Knight award category. Toyota Used Car Excellence award Toyota Business Management Excellence Bronze award Toyota Fleet Specialist Dealer Toyota Fleet Management Dealer of the Year 2014 Toyota Financial Services Toyota Access Bronze award Maddington Hyundai Toyota Fleet Specialist Dealer Cat B Sales person of the year award Toyota Fleet Management Dealer of the Year Toyota Used Car Certified award Toyota Service 5 Star Guest Survey rating Toyota Sales 5 Star Guest Survey rating 2015 Achieved Toyota Service Foundations accreditation (June) Toyota Service 5 Star Guest Survey rating YTD (number 1 in metro area YTD) Toyota Sales 5 Star Guest Survey rating YTD This has earned the Dealership and all expense paid holiday to Japan with the CEO (Oshikiri) Wanneroo Isuzu Still holding Number One status in WA, retaining this title since we Morley Mitsubishi 1 dealer in WA for CSI satisfaction for over 2 years running. Maddington Isuzu DEP recognition 2014 and 2014 Platinum Award for CSI Service CSI: Customer Satisfaction Inventory 30
31 Strengths of Buick Holdings Cohesive management of the DiVirgilio family Highly rated customer satisfaction and service Centralized management structure 31
32 Growth Potential of Buick Holdings Expansion in Western Australia Dealership expansion in Eastern Australia Cost efficiency gains 32
33 1. Why Australia? 2. What kind of company is Buick? 3. What will Buick contribute to results? 4. What will be the post-acquisition management structure? 5. How will you source the acquisition funds? 33
34 Shareholder Composition DiVirgilio 7brothers 100% Buick Holdings Gulliver International Co., Ltd. DiVirgilio 7brothers Consolidated 67% 33% Buick Holdings 34
35 Breakdown of Shareholder Composition and Corporate Structure Gulliver International Co., Ltd. DiVirgilio 7brothers 100% Consolidated Gulliver Australia Holdings 67% 33% Consolidated Buick Holdings Consolidated Prosser Toyota Consolidated Midland Toyota 35
36 Average Operating Performance in the Three Most Recent Years Sales 634 million dollars (Approx billion yen) Operating Income 19 million dollars (Approx. 1.7 billion yen) 36
37 Trend and Average in Sales in the Three Most Recent Years million dollars (57.1 billion yen) '12/6 '13/6 '14/6 The three-year average *The above figures are the results of Buick Holdings Pty Ltd restated in accordance with Japanese GAAP under certain conditions. *The three-year average is a simple average of the fiscal years ended June 2012 through June 2014 *Based on an exchange rate of A$1= 90 37
38 Trend and Average in Operating Income in the Three Most Recent Years Operating Income Adjusted operating income million dollars (1.74 billion yen) '12/6 '13/6 '14/6 The three-year average *Adjusted operating income is the amount of operating income less expenses that will not be incurred after the acquisition (remuneration paid to the current owner company, etc. ). *The above figures are the results of Buick Holdings Pty Ltd restated in accordance with Japanese GAAP under certain conditions. *The three-year average is a simple average of the fiscal years ended June 2012 through June 2014 *Based on an exchange rate of A$1= 90 38
39 Trend and Average in Net Income in the Three Most Recent Years 25 Net income Adjusted net income million dollars (1.14 billion yen) '12/6 '13/6 '14/6 The three-year average *Adjusted net income is the amount of net income less expenses that will not be incurred after the acquisition (remuneration paid to the current owner company, etc. ). *The above figures are the results of Buick Holdings Pty Ltd restated in accordance with Japanese GAAP under certain conditions. *The three-year average is a simple average of the fiscal years ended June 2012 through June 2014 *Based on an exchange rate of A$1= 90 39
40 Expected Posting of Goodwill and Amortization of Goodwill Deemed Acquisition Date (planned) is September 30 / Goodwill (assumed) is 9 billion yen / Amortization Period (assumed) is 20 years B/S September 30 Goodwill 9.0 billion yen (Assumed) P/L P/L P/L Amortization 190 million yen Amortization 450 million yen Amortization 450 million yen FY 2016 Second half FY2017 FY2018 *The deemed acquisition date, amount of goodwill, and amortization period have yet to be confirmed and may differ from the figures presented here. 40
41 1. Why Australia? 2. What kind of company is Buick? 3. What will Buick contribute to results? 4. What will be the post-acquisition management structure? 5. How will you source the acquisition funds? 41


42 Post-Acquisition Management Structure Luigi DiVirgilio Dominic DiVirgilio Robert DiVirgilio Michael DiVirgilio 67% of Board of Directors voting rights Guido Berini Clinton Bradbury Ho Chol Executive Officer Overseas Business Supervision Gulliver International 42


43 Parent Company Control and Support Structure Board of Directors 67% of Board of Directors voting rights Luigi DiVirgilio Dominic DiVirgilio Robert DiVirgilio Michael DiVirgilio Clinton Bradbury Ho Chol Luigi DiVirgilio CEO Buick Holdings IT Business development Accounting and finance Secondment of two employees (planned) Gulliver International Co., Ltd. Personnel management Legal affairs Internal auditing 43
44 1. Why Australia? 2. What kind of company is Buick? 3. What will Buick contribute to results? 4. What will be the post-acquisition management structure? 5. How will you source the acquisition funds? 44
45 Stock Acquisition Price and Funding Stock Acquisition Price 11,772 million yen *11,372 million yen (120.6 million AUD) in ordinary shares + an estimated 400 million yen in advisory fees and other expenses *Based on an exchange rate of 1 AUD=94.3 yen(based on closing price on Jun 30, 2015) Amount of new bank loans(planned) 12,000 million yen 45
46 Financial condition (unit:million yen) February 28, 2015 May 31, 2015 Cash and deposits 4,897 Loan 5,335 Cash and deposits 7,108 Loan 4,039 Net assets 34,629 Net assets 35,113 46
47 Financial condition (unit:million yen) May 31, 2015 Cash and deposits 7,108 Loan 4,039 D/E ratio 0.1 Should rise to around 0.5 after the 12.0 billion yen in loans Net assets 35,113 47
48 Ⅲ. Business Domain Expansion and M&A 48
49 Future Goals for Gulliver Create world's largest vehicle sales infrastructure * Reference : Medium-Term Business Plan & Result for Fiscal year to February 28,
50 Create world's largest vehicle sales infrastructure Expansion of domestic business Expansion of overseas business 50
51 Create world's largest vehicle sales infrastructure Expansion of domestic business Expansion of overseas business 51
52 Car Distribution Flow New car manufacture Used car purchase New car sales Used car wholesale Used car retail After Domestic automakers New Japanese car dealers Consumers Auction Used car dealers Foreign automakers Emerging nation automakers New overseas car dealers Consumers Selling cars Gulliver stores Retail Channel Consumers Maintenance garages EV automakers Automakers Car rental shops /Car sharing shops Consumers Foreign stores Foreign Consumers Maintenance garages 52


53 Expansion to Domestic Business New car manufacture Used car purchase New car sales Used car wholesale Used car retail After Domestic automakers Foreign automakers Emerging nation automakers New Japanese car dealers New overseas car dealers Consumers Consumers Selling cars Gulliver stores Auction Used car dealers Gulliver s core businesses Retail Channel Consumers Maintenance garages EV automakers Automakers Car rental shops /Car sharing shops Consumers Foreign stores Foreign Consumers Maintenance garages 53
54 Expansion to Domestic Business New car manufacture Used car purchase New car sales Used car wholesale Used car retail After Domestic automakers Foreign automakers Emerging nation automakers New Japanese car dealers New overseas car dealers Consumers Consumers Selling cars Gulliver stores Auction Used car dealers Gulliver s core businesses Retail Channel Consumers Maintenance garages EV automakers Automakers Car rental shops /Car sharing shops Consumers Foreign stores Foreign Consumers Maintenance garages 1. Expansion of used vehicle purchases 2. Expansion of sales routes 54


55 Expansion to Domestic Business New car manufacture Used car purchase New car sales Used car wholesale Used car retail After Domestic automakers Foreign automakers Emerging nation automakers New Japanese car dealers New overseas car dealers Consumers Consumers Selling cars Gulliver stores Auction Used car dealers Gulliver s core businesses Retail Channel Consumers Maintenance garages EV automakers Automakers Car rental shops /Car sharing shops Consumers Foreign stores Foreign Consumers Maintenance garages 1. Expansion of used vehicle purchases 2. Expansion of sales routes 55
56 Business Development at Nakamitsu Motors BMW Ichikawa Chiba, Ichikawa Urayasu Chiba, Urayasu Funabashi Chiba, Funabashi Matsudo Chiba, Matsudo Kashiwa Chiba, Kashiwa BMW Premium Selection (used car) Urayasu Chiba, Urayasu Funabashi Chiba, Funabashi Kashiwa Chiba, Kashiwa MINI Ichikawa Chiba, Ichikawa Funabashi Chiba, Funabashi Matsudo Chiba, Matsudo Kashiwa Chiba, Kashiwa *Nakamitsu Motors Co., LTD. is scheduled to be renamed Motoren Glanz Co., LTD. 56
57 Synergy Effects from M&A with New Car Dealers Expand used car purchasing Use trade-ins from new car customers to supply inventory for used car retail sales Expansion of sales routes Create opportunities to propose used vehicle retail sale to new vehicle upgrade customers Expansion of ancillary services Shared use of maintenance workshops 57


58 Expansion to Domestic Business New car manufacture Used car purchase New car sales Used car wholesale Used car retail After Domestic automakers Foreign automakers Emerging nation automakers New Japanese car dealers New overseas car dealers Consumers Consumers Selling cars Gulliver stores Auction Used car dealers Gulliver s core businesses Retail Channel Consumers Maintenance garages EV automakers Automakers Car rental shops /Car sharing shops Consumers Foreign stores Foreign Consumers Maintenance garages 1. Expansion of used vehicle purchases 2. Expansion of sales routes 58


59 Overseas Development for Expanding the Sales Channel New Zealand 59


60 Expansion to New Zealand Direct export model using Dolphinet New Zealand Establish a wholly-owned subsidiary and open the first store on November, Currently preparing to open a second store. 60
61 Create world's largest vehicle sales infrastructure Expansion of domestic business Expansion of overseas business 61


62 Target Areas of Overseas Business Expansion USA ASEAN Australia 62
cars market: Underdeveloped")


63 Expansion of overseas business Growth Market ASEAN Stable Market Australia (New and used)cars market: Underdeveloped (New and used)cars market: Mature Underdeveloped used car market infrastructure Industry reorganization and consolidation Gulliver s policy Develop an infrastructure business in used car distribution Gulliver s policy M&A of new car dealers 63
64 Industry Reorganization and Consolidation Article 64
65 Industry Reorganization and Consolidation Buffett dealers Search results Search results 65
66 Examples in the U.S. New Cars Business AutoNation( Used Cars Business CarMax( Sales 19,108 million dollars Sales 14,268 million dollars Net Income 418 million dollars Net Income 597 million dollars Market Capitalization 7.23 billion dollars Market Capitalization billion dollars Automobile Infrastructure Internet Business Cox Automotive( Manheim(Auction) Autotrader(Internet Media) Kelly Blue Book(Internet Media) V Auto(Software) Make them a group company Group employees number around 24,000 * Sales and Net Income are Computed based on $1= * Market capitalization as of July 2, Computed based on $1=
67 Future goals for Gulliver Create world's largest vehicle sales infrastructure * Reference : Medium-Term Business Plan & Result for Fiscal year to February 28,
68 Ⅳ. Reference 68
69 Income Statement Consolidated FY ended May 31, 2012 Result (million yen) Ratio (%) FY ended May 31, 2013 Result (million yen) Ratio (%) FY ended May 31, 2014 Result (million yen) Ratio (%) Result (million yen) FY ended May 31, 2015 Ratio (%) Change (million yen) Sales 38, , , , , Cost of sales 31, , , , , Gross profit 7, , , , , SG&A Expenses 7, , , , , Operating income , , , Ordinary income , , , Income before income taxes and minority interests , , , Net income , , Y/Y (%) Non-Consolidated FY ended May 31, 2012 Result (million yen) Ratio (%) FY ended May 31, 2013 Result (million yen) Ratio (%) FY ended May 31, 2014 Result (million yen) Ratio (%) Result (million yen) FY ended May 31, 2015 Ratio (%) Change (million yen) Sales 38, , , , , Cost of sales 30, , , , , Gross profit 7, , , , , SG&A Expenses 6, , , , , Operating income , , , Ordinary income , , , Income before income taxes , , , Net income , , Y/Y (%) 69
70 Analysis of change in consolidated operating income (unit: million yen) *Amounts truncated to ten thousand Negative factors (-) Positive factors (+) FY ended May 31, 2014 Consolidated operating income 1,476 Gross profit on vehicles 1,507 Gross profit on equipment Other gross operating profit Gross profit (Non-consolidated) Personnel costs -456 Outsourcing costs (Temp staff fees, etc) -48 Commission paid -94 Depreciation expenses Advertising and PR expenses SG&A Expenses (Non-consolidated) Real estate and property rental Others Difference in consolidated and non-consolidated operating income FY ended May 31, 2015 Consolidated operating income Difference in consolidated and non-consolidated operating income 2,
71 Transaction Volume Number of cars purchased Number of cars by wholesale and Number of cars by retail (unit: car) 50,000 43,537 48,189 (unit: car) 50,000 Number of cars by retail Number of cars by wholesale 40,000 39,072 36,230 40,000 37,652 30,000 30,000 34,525 37,239 30,105 20,000 20,000 10,000 10,000 12,480 14,361 12,840 18, '13/2 1Q '14/2 1Q '15/2 1Q '16/2 1Q '13/2 1Q '14/2 1Q '15/2 1Q '16/2 1Q 71
72 SG&A Expense (Non-Consolidated) FY ended May 31, 2012 Result Ratio (million yen) (%) FY ended May 31, 2013 Result Ratio (million yen) (%) FY ended May 31, 2014 Result Ratio (million yen) (%) Result (million yen) FY ended May 31, 2015 Ratio Change (%) (million yen) Personnel costs 2, % 2, % 3, % 3, % % Outsourcing costs (Temp staff fees,etc) % % % % % Commission paid % % % % % Depreciation expenses % % % % % Advertising and PR expenses 1, % 1, % 1, % 1, % % Real estate and property rental 1, % 1, % 1, % 1, % % Others 1, % 1, % 1, % 1, % % Total 6, % 7, % 7, % 9, % 1, % Y/Y (%) Basic data FY ended May 31, 2012 FY ended May 31, 2013 FY ended May 31, 2014 FY ended May 31, 2015 Employees (Head office) person Employees (Direct stores) person 1,517 1,531 1,725 2,091 Total employees person 2,031 2,033 2,224 2,697 Capital investment(stores) Capital investment(system, etc) Total capital investment million yen million yen million yen , ,095 1,236 Advertising expenses (million yen) 5,740 5,113 5,440 4,924 1,515 1,327 1,089 1,181 1,757 1, ,033 1,739 1,578 1,382 1,040 1,426 '13/2 '14/2 '15/2 '16/2 Dec-Feb Sep-Nov Jun-Aug Mar-May 72
73 Consolidated balance sheets (unit: million yen) As of February 28, 2015 As of May 31, 2015 Assets Current assets Cash and deposits 4,897 7,108 Notes and accounts receivable - trade 4,619 3,689 Merchandise 17,020 13,993 Deferred tax assets Other 2,114 1,789 Allowance for doubtful accounts Total current assets 29,402 27,454 Non-current assets Property, plant and equipment Buildings and structures 20,622 21,755 Accumulated depreciation -6,571-6,859 Buildings and structures, net 14,051 14,896 Vehicles Accumulated depreciation Vehicles, net Tools, furniture and fixtures 3,155 3,344 Accumulated depreciation -2,414-2,550 Tools, furniture and fixtures, net Land Construction in progress Total property, plant and equipment 16,126 16,614 Intangible assets Goodwill 1,997 1,971 Software 1,332 1,442 Other Total intangible assets 3,349 3,434 Investments and other assets Investment securities 0 0 Shares of subsidiaries and associates Long-term loans receivable Lease and guarantee deposits 4,034 4,159 Construction assistance fund receivables 3,472 3,626 Deferred tax assets Other Allowance for doubtful accounts Total investments and other assets 8,274 8,704 Total non-current assets 27,750 28,754 Total assets 57,153 56,208 As of February 28, 2015 As of May 31, 2015 Liabilities Current liabilities Accounts payable - trade 5,100 4,877 Short-term loans payable Current portion of bonds Current portion of long-term loans payable 4,647 4,000 Accounts payable - other 2,203 1,918 Income taxes payable Advances received 2,951 1,898 Deposits received Provision for bonuses Provision for merchandise warranties 1,276 1,015 Other 1,864 3,439 Total current liabilities 19,847 18,368 Non-current liabilities Long-term loans payable Long-term guarantee deposited Provision for directors' retirement benefits Asset retirement obligations 1,435 1,489 Total non-current liabilities 2,676 2,726 Total liabilities 22,523 21,094 Net assets Shareholders' equity Capital stock 4,157 4,157 Capital surplus 4,032 4,032 Retained earnings 30,278 30,763 Treasury shares -3,947-3,947 Total shareholders' equity 34,521 35,005 Accumulated other comprehensive income Foreign currency translation adjustment Total accumulated other comprehensive income Total net assets 34,629 35,113 Total liabilities and net assets 57,153 56,208 73
FY2/17 3Q(March 2016~November2016)
") FY2/17 (March 2016~November2016) Fact Book 1. Trends in the current fiscal year and previous fiscal year 3. Business overview (1) Performance overview P. 1 (1) No. of students at the end of month P. 7
FY2/17 (March 2016~November2016) Fact Book 1. Trends in the current fiscal year and previous fiscal year 3. Business overview (1) Performance overview P. 1 (1) No. of students at the end of month P. 7
1. Trends in the current fiscal year and previous fiscal year 3. Business overview 2. Secular trends in first quarter financial results
 FY2/19 (March 2018~May 2018) Fact Book 1. Trends in the current fiscal year and previous fiscal year 3. Business overview (1) Performance overview P. 1 (1) No. of students at the end of month P. 6 (2)
FY2/18 (March 2017~February 2018)
") FY2/18 (March 2017~February 2018) Fact Book 1. Trends in the current fiscal year and previous fiscal year 3. Business overview (1) Performance overview P. 1 (1) No. of students at the end of month P. 6
FY2/18 (March 2017~February 2018) Fact Book 1. Trends in the current fiscal year and previous fiscal year 3. Business overview (1) Performance overview P. 1 (1) No. of students at the end of month P. 6
Results for the Three Months ended June 30, 2018
 Reference Translation Results for the Three Months ended June 30, 2018 July 31, 2018 AUTOBACS SEVEN CO., LTD. FY March 2019 Consolidated P/L Profit Loss/Gain: Net sales and gross profit decreased, and
FY2/17 (March 2016~February 2017)
") FY2/17 (March 2016~February 2017) Fact Book 1. Trends in the current fiscal year and previous fiscal year 3. Business overview (1) Performance overview P. 1 (1) No. of students at the end of month P. 7
FY2/17 (March 2016~February 2017) Fact Book 1. Trends in the current fiscal year and previous fiscal year 3. Business overview (1) Performance overview P. 1 (1) No. of students at the end of month P. 7
Business model & Business summary
 Last updated: January 12, 2017 Business model & Business summary IDOM Inc. (7599) Ratio of new cars and used cars in Japan and the U.S. Japan s ratio of used cars is less than that of the U.S./Europe,
FY2/18 2Q(March 2017~August 2018)
") FY2/18 2Q(March 2017~August 2018) Fact Book 1. Trends in the current fiscal year and previous fiscal year 3. Business overview (1) Performance overview P.1 (1) No. of students at the end of month P.7 (2)
FY2/18 2Q(March 2017~August 2018) Fact Book 1. Trends in the current fiscal year and previous fiscal year 3. Business overview (1) Performance overview P.1 (1) No. of students at the end of month P.7 (2)
FY2/16(March 2015~February 2016)
") FY2/16(March 2015~February 2016) 1. Trends in the current fiscal year and the previous fiscal year 3. Business overview (1) Peformance overview P.1 (1) No. of students at the end of month P.7 (2) Cost
FY2/16(March 2015~February 2016) 1. Trends in the current fiscal year and the previous fiscal year 3. Business overview (1) Peformance overview P.1 (1) No. of students at the end of month P.7 (2) Cost
TOFAŞ Q ANALYST PRESENTATION
 TOFAŞ Q1 2016 ANALYST PRESENTATION 03.05.2016 1 2016 Q1 AGENDA Highlights Turkish Automotive Industry Production & Capacity Utilization Domestic Market Developments Tofaş Domestic Market Performance Export
FY2/15(March 2014~February 2015)
") FY2/15(March 2014~February 2015) 1. Trends in the current fiscal year and the previous fiscal year 3. Business overview (1) Peformance overview P.1 (1) No. of students at the end of month P.7 (2) Cost
FY2/15(March 2014~February 2015) 1. Trends in the current fiscal year and the previous fiscal year 3. Business overview (1) Peformance overview P.1 (1) No. of students at the end of month P.7 (2) Cost
Lazydays Holdings, Inc. Reports Second Quarter 2018 Financial Results
 News Contact: +1 (813) 204-4099 investors@lazydays.com Lazydays Holdings, Inc. Reports Second Quarter 2018 Financial Results Tampa, FL (August 9, 2018) Lazydays Holdings, Inc. ( Lazydays )(NasdaqCM: LAZY)
Lazydays Holdings, Inc. Reports Third Quarter 2018 Financial Results
 News Contact: +1 (813) 204-4099 investors@lazydays.com Lazydays Holdings, Inc. Reports Third Quarter 2018 Financial Results Tampa, FL (November 8, 2018) Lazydays Holdings, Inc. ( Lazydays ) (NasdaqCM:
FISCAL YEAR MARCH 2018 FIRST QUARTER FINANCIAL RESULTS
 FISCAL YEAR MARCH 2018 FIRST QUARTER FINANCIAL RESULTS PRESENTATION OUTLINE Highlights Fiscal Year March 2018 First Quarter Results Fiscal Year March 2018 Full Year Forecast Structural Reform Stage 2 Progress
Strong performance by the Bolloré Group s operating activities in 2018 Mr Cyrille Bolloré unanimously appointed Chairman and Chief Executive Officer
 PRESS RELEASE 2018 results (1) March 14, 2019 Strong performance by the Bolloré Group s operating activities in 2018 Mr Cyrille Bolloré unanimously appointed Chairman and Chief Executive Officer Revenue:
Martin Laubscher Barloworld Automotive
 Barloworld Limited Investor Day Martin Laubscher Barloworld Automotive 2 February 2009 Business Overview Automotive Division Car Rental Fleet Services Motor Retail Joint Ventures Southern Africa Southern
Monro, Inc. Second Quarter Fiscal 2019 Earnings Call. October 25, 2018
 Monro, Inc. Second Quarter Fiscal 2019 Earnings Call October 25, 2018 Safe Harbor Statement and Non-GAAP Measures Certain statements in this presentation, other than statements of historical fact, including
First half (2014/3/1~2014/8/31)
") FY2/15 (March 2014~November 201 4) 1.Trends in current fiscal year and previouse fiscal year 3.Business overview (1)Peformance overview P.1 (1)No. of students at the end of month P.7 (2)Cost of sales breakdown
FY2/15 (March 2014~November 201 4) 1.Trends in current fiscal year and previouse fiscal year 3.Business overview (1)Peformance overview P.1 (1)No. of students at the end of month P.7 (2)Cost of sales breakdown
FY2012. H1 Financial Results. November 8, Copyright(C) 2011 Isuzu Motors Limited All rights reserved
 2011 Isuzu Motors Limited All rights reserved") FY2012 H1 Financial Results November 8, 2011 1 Copyright(C) 2011 Isuzu Motors Limited All rights reserved Ⅰ. President and Representative Director : Susumu Hosoi :FY2012 H1 Financial Summary Outline Ⅱ.
FY2012 H1 Financial Results November 8, 2011 1 Copyright(C) 2011 Isuzu Motors Limited All rights reserved Ⅰ. President and Representative Director : Susumu Hosoi :FY2012 H1 Financial Summary Outline Ⅱ.
FISCAL YEAR MARCH 2015 FIRST QUARTER FINANCIAL RESULTS. Mazda Roadster 25 th Anniversary Model
 FISCAL YEAR MARCH 2015 FIRST QUARTER FINANCIAL RESULTS Mazda Roadster 25 th Anniversary Model Mazda Motor Corporation July 31, 2014 1 PRESENTATION OUTLINE Highlights Fiscal Year March 2015 First Quarter
Consolidated Financial Results for 1Q FY2016 July 29, 2016 Fuji Electric Co., Ltd.
 Consolidated Financial Results for 1Q FY2016 July 29, 2016 Fuji Electric Co., Ltd. 2016Fuji Electric Co., Ltd. All rights reserved. 1 Summary of Consolidated Financial Results for 1Q FY2016 (YoY Comparison)
MONRO MUFFLER BRAKE, INC. PROVIDES FOURTH QUARTER AND FISCAL 2017 FINANCIAL RESULTS
 CONTACT: John Van Heel Chief Executive Officer (585) 647-6400 Robert Gross Executive Chairman (585) 647-6400 FOR IMMEDIATE RELEASE Brian D Ambrosia Senior Vice President Finance Chief Financial Officer
FISCAL YEAR MARCH 2018 FIRST HALF FINANCIAL RESULTS
 FISCAL YEAR MARCH 2018 FIRST HALF FINANCIAL RESULTS PRESENTATION OUTLINE Highlights Fiscal Year March 2018 First Half Results Fiscal Year March 2018 Full Year Forecast Progress of Key Initiatives/ Business
KCB GROUP PLC INVESTOR PRESENTATION. Q FINANCIAL RESULTS
 KCB GROUP PLC INVESTOR PRESENTATION. Q3 2018 FINANCIAL RESULTS MACRO-ECONOMIC HIGHLIGHTS Macro-Economic Highlights: Kenya KENYA 4.9% 5.3% GDP Growth Rate (%) 5.6% 5.8% 4.9% 6.3% 6.2% KENYA 2013 2014 2015
FISCAL YEAR MARCH 2014 FINANCIAL RESULTS
 FISCAL YEAR MARCH 214 FINANCIAL RESULTS Mazda CX-5 Mazda Atenza Mazda Motor Corporation April 25, 214 New Mazda Axela 1 PRESENTATION OUTLINE Highlights Fiscal Year March 214 Results Fiscal Year March 215
FISCAL YEAR MARCH 2018 THIRD QUARTER FINANCIAL RESULTS
 FISCAL YEAR MARCH 2018 THIRD QUARTER FINANCIAL RESULTS PRESENTATION OUTLINE Highlights Fiscal Year March 2018 Nine Month Results Fiscal Year March 2018 Full Year Forecast Progress of Key Initiatives 1
Wholesale Market Insights Through March J o n a t h a n S m o k e & Zo R a h i m - C o x A u t o m o t i v e
 Wholesale Market Insights Through March 2018 J o n a t h a n S m o k e & Zo R a h i m - C o x A u t o m o t i v e T R A N S F O R M I N G T H E W A Y T H E W O R L D B U Y S, S E L L S & O W N S C A R
Factbook. Tokyo Electric Power Company Holdings, Inc. August Tokyo Electric Power Company Holdings, Inc. All Rights Reserved.
 Factbook Tokyo Electric Power Company Holdings, Inc. August 2018 (Note) Please note that the following to be an accurate and complete translation of the original Japanese version prepared for the convenience
FISCAL YEAR MARCH 2015 THIRD QUARTER FINANCIAL RESULTS. Updated Mazda CX-5 (Japanese specification model)
") FISCAL YEAR MARCH 2015 THIRD QUARTER FINANCIAL RESULTS Updated Mazda CX-5 (Japanese specification model) Mazda Motor Corporation February 4, 2015 1 PRESENTATION OUTLINE Highlights Fiscal Year March 2015
FISCAL YEAR MARCH 2015 THIRD QUARTER FINANCIAL RESULTS Updated Mazda CX-5 (Japanese specification model) Mazda Motor Corporation February 4, 2015 1 PRESENTATION OUTLINE Highlights Fiscal Year March 2015
Company. Jonathan Smoke Remarketing Big Picture 2017 and Beyond
 Company Jonathan Smoke Remarketing Big Picture 2017 and Beyond Economic Expansion Continues 10.00 REAL GROSS DOMESTIC PRODUCT (SAAR) % GROWTH BY QUARTER 8.00 6.00 4.00 3.1 2.00 0.00-2.00-4.00-6.00-8.00-10.00
Wholesale Market Insights Through June J o n a t h a n S m o k e & Zo R a h i m - C o x A u t o m o t i v e
 Wholesale Market Insights Through June 2018 J o n a t h a n S m o k e & Zo R a h i m - C o x A u t o m o t i v e T R A N S F O R M I N G T H E W A Y T H E W O R L D B U Y S, S E L L S & O W N S C A R S
FY H1 Financial Results
 FY2011 1 H1 Financial Results November 8, 2010 1 Copyright(C) 2010 Isuzu Motors Limited All rights reserved Contents Ⅰ. President and Representative Director : Susumu Hosoi :FY2011 H1 Financial Summary
Contents. Automotive Holdings Group Limited
 Automotive Holdings Group Limited Institutional Briefings Year End Results June Contents FY Highlights Corporate Statistics Group Performance Floorplan Financing Automotive Logistics Outlook Appendices
FISCAL YEAR MARCH 2015 FIRST HALF FINANCIAL RESULTS. New Mazda Demio
 FISCAL YEAR MARCH 2015 FIRST HALF FINANCIAL RESULTS New Mazda Demio Mazda Motor Corporation October 31, 2014 1 PRESENTATION OUTLINE Highlights Fiscal Year March 2015 First Half Results Fiscal Year March
INCREASING SALES FOR MINING RELATED BUSINESS
 Investor Relations of PT UNITED TRACTORS Tbk INCREASING SALES FOR MINING RELATED BUSINESS In the first half 2001, the Company managed to record increase in net revenue from IDR 2.32 trillion to IDR 3.54
TOFAŞ RESULTS WEBCAST PRESENTATION
 TOFAŞ 31.12.2016 RESULTS WEBCAST PRESENTATION 02.02.2017 1 WEBCAST AGENDA Highlights Turkish Automotive Industry Production Domestic Market Developments Tofaş Domestic Market Performance Export Markets
Outlook for Franchised New Car Dealers
 1 Outlook for Franchised New Car Dealers Fourteenth Annual Automotive Outlook Symposium June 1, 2007 Paul Taylor, Ph.D., Chief Economist National Automobile Dealers Association, McLean, VA www.nada.org
1 Copyright(C) 2012 Isuzu Motors Limited All rights reserved
 2012 Isuzu Motors Limited All rights reserved") FY2012 Financial Results May 10, 2012 1 Copyright(C) 2012 Isuzu Motors Limited All rights reserved Contents Ⅰ. President and Representative Director : Susumu Hosoi FY2012 Overview Ⅱ. Director Director
FY2012 Financial Results May 10, 2012 1 Copyright(C) 2012 Isuzu Motors Limited All rights reserved Contents Ⅰ. President and Representative Director : Susumu Hosoi FY2012 Overview Ⅱ. Director Director
Federated States of Micronesia
 IMF Country Report No. 13/17 Federated States of Micronesia 2012 ARTICLE IV CONSULTATION 2012 Statistical Appendix January 29, 2001 January 29, 2001 This Statistical Appendix paper for the Federated States
Research Coverage Report by Shared Research Inc.
 esearch eport by Shared esearch Inc. https://sharedresearch.jp This PDF document is an updated note on the company. A comprehensive version of the report on the company, including this latest update, is
FY2015 First Quarter Financial Results. SUZUKI MOTOR CORPORATION 3 August 2015
 First Quarter Financial Results SUZUKI MOTOR CORPORATION 3 August 2015 Consolidated: Financial Summary Page2 Increased net sales and operating income/ordinary income Decreased net income attributable to
Cosmo Oil Co., Ltd. Presentation on Results for First Quarter of Fiscal 2012 August 2, 2012 Director: Satoshi Miyamoto
 Cosmo Oil Co., Ltd. Presentation on Results for First Quarter of Fiscal 2012 August 2, 2012 Director: Satoshi Miyamoto Copyright 2012 COSMO OIL CO.,LTD. All Rights Reserved. Key Points of Financial Results
FISCAL YEAR ENDING MARCH 2012 FIRST HALF FINANCIAL RESULTS
 FISCAL YEAR ENDING MARCH 2012 FIRST HALF FINANCIAL RESULTS Mazda Motor Corporation November 2, 2011 New Mazda CX-5 (European specifications) 1 PRESENTATION OUTLINE Highlights Fiscal Year Ending March 2012
NISSAN REVIVAL PLAN. TOKYO October 18, 1999
 NISSAN REVIVAL PLAN TOKYO October 18, 1999 REVIVAL PLAN OUTLINE I) Diagnosis II) III) Introduction Past Performance: Facts/Figures Past Performance: Analysis + Opportunities Revival Plan Elaboration Key
Analyst Presentation Barloworld Automotive 29 February 2008
 Analyst Presentation Barloworld Automotive 29 February 2008 Automotive Division Automotive Division Overview Business Overview Motor Retail Car Rental Fleet Services Importation & Distribution Joint Ventures
HONDA CANADA FINANCE INC. AUTO FINANCE FORUM February 15, ACCORD
 HONDA CANADA FINANCE INC. AUTO FINANCE FORUM February 15, 2018 2018 ACCORD 1 Caution with Respect to Forward-Looking Statements: These slides contain forward-looking statements within the meaning of the
1 st Half 2018 Results. August 1 st, 2018
 1 st Half 2018 Results August 1 st, 2018 H1 HIGHLIGHTS & CATEGORY SPOTLIGHTS Gonzalve BICH 2 First Half 2018 Key Messages Challenging market and business environment Continued investment in targeted Brand
Automotive Holdings Group Limited. Presentation May 2009
 Automotive Holdings Group Limited Presentation May 2009 Contents About AHG Third Quarter 2009 Performance AHG s strategic response to current economic climate Net Debt Position Automotive Logistics Outlook
Automotive Holdings Group Limited. Euroz Securities Rottnest Island Conference Bronte Howson Managing Director March 2008
 Automotive Holdings Group Limited Euroz Securities Rottnest Island Conference 008 Bronte Howson Managing Director March 008 Group Snapshot Largest Automotive Retailing & Logistics Group in Australia 0
Bernstein Strategic Decisions Conference 2018
 Bernstein Strategic Decisions Conference 2018 Forward-Looking Statements Certain statements in this presentation, other than statements of historical fact, including estimates, projections, statements
TOFAŞ RESULTS WEBCAST PRESENTATION
 TOFAŞ 31.12.2017 RESULTS WEBCAST PRESENTATION 02.02.2018 AGENDA Highlights Turkish Automotive Industry Production Domestic Market Developments Tofaş Domestic Market Performance Export Markets & Tofaş Performance
FISCAL YEAR ENDED MARCH 2011 FINANCIAL RESULTS
 FISCAL YEAR ENDED MARCH 211 FINANCIAL RESULTS Mazda Motor Corporation April 28, 211 Mazda MINAGI 1 PRESENTATION OUTLINE Highlights Fiscal Year Ended March 211 Results In Summary Question & Answer Session
Third Quarter Results (ended December 31, 2013)
") Fiscal Year 213 (ending March 31, 214) Third Quarter Results (ended December 31, 213) Brother Industries, Ltd. February 4, 214 Information on this report, other than historical facts, refers to future
Fiscal Year 213 (ending March 31, 214) Third Quarter Results (ended December 31, 213) Brother Industries, Ltd. February 4, 214 Information on this report, other than historical facts, refers to future
Company Profile Chin Seng Huat Auto Parts Group
 Company Profile 2007 2007 Board of Directors Chin Seng Huat Auto Parts Co., Ltd. Chin Seng Huat Auto Parts Co., Ltd. was established in February 11, 1976. The current registered capital is 75 million baht.
FY2017 Third Quarter consolidated financial result highlights
 FY2017 Third Quarter consolidated financial result highlights pages Ⅰ. Ⅱ. Ⅲ. Overview of Consolidated Financial Results Summary of Consolidated Q3 FY2017 Financial Results Forecast of FY2017 Consolidated
Months Investor Presentation
 2018 9 Months Investor Presentation 25.10.2018 Disclaimer Ereğli Demir Çelik Fabrikaları T.A.Ş. (Erdemir) may, when necessary, make written or verbal announcements about forward-looking information, expectations,
Wholesale Market Insights December J o n a t h a n S m o k e & Zo R a h i m - C o x A u t o m o t i v e
 Wholesale Market Insights December 2017 J o n a t h a n S m o k e & Zo R a h i m - C o x A u t o m o t i v e T R A N S F O R M I N G T H E W A Y T H E W O R L D B U Y S, S E L L S & O W N S C A R S Manheim
MARKET UPDATE & ECONOMIC OUTLOOK
 MARKET UPDATE & ECONOMIC OUTLOOK Economic Expansion Accelerates For the Moment Growth surged in Q2 from average 2.1% pace over prior 14 quarters; best quarter since 2014 10.0 Real Gross Domestic Product
Automotive Holdings Group Limited Macquarie Connections Conference
 Automotive Holdings Group Limited Macquarie Connections Conference Presented by: Bronte Howson Managing Director May 8 Group Snapshot Largest automotive retailing & logistics group in Australia Automotive
Third Quarter Results (ended December 31, 2014)
") Fiscal Year 214 (ending March 31, 215) Third Quarter Results (ended December 31, 214) Brother Industries, Ltd. February 4, 215 Information on this report, other than historical facts, refers to future
Fiscal Year 214 (ending March 31, 215) Third Quarter Results (ended December 31, 214) Brother Industries, Ltd. February 4, 215 Information on this report, other than historical facts, refers to future
FY 2010 Results. Jakarta, 28 February 2011
 FY 2010 Results Jakarta, 28 February 2011 Table of Contents FY 2010 Results Do Good 2010 Company Update Executive Summary Loans grew 48% Customer Deposits grew 38%; Total Funding (incl. Bond) grew 50%
LOCK & LOCK. 2Q 17 Earnings Release. 2 Aug 2017
 LOCK & LOCK 2Q 17 Earnings Release 2 Aug 2017 This document has been prepared by Lock & Lock, Co., Ltd. This document contains forward-looking statements, which are subject to risks, uncertainties, and
AUTO INDUSTRY CHARTBOOK 1Q 2018
 US AUTO INDUSTRY CHARTBOOK 1Q 218 Key Messages 1. Economic fundamentals and financial conditions remain supportive of demand 2. However, increasing off-lease returns will continue to exert downward pressures
Meeting Materials for FY2011
 Meeting Materials for FY2011 (Year ended March 31, 2012) May 17, 2012 Masao Usui Representative Director, President Executive Officer KYB Corporation Meeting Materials for FY2011 May 17, 2012, KYB Corporation
FY16 results. Business updates. FY17 outlook. Nissan Motor Co., Ltd. May 11 th, 2017
 Nissan Motor Co., Ltd. May 11 th, 2017 results Business updates FY17 outlook www.nissan-global.com Copyright NISSAN MOTOR CO., LTD. All rights reserved. 2 (TSE REPORT BASIS CHINA JV EQUITY BASIS) NET REVENUE
Nissan Motor Co., Ltd. February 12 th, 2019
 Nissan Motor Co., Ltd. February 12 th, 2019 NET REVENUE 2,875.5 3,045.7 OPERATING PROFIT *1 NET INCOME 301.6 FREE CASH FLOW (AUTO) NET CASH (AUTO) 1,311.4 1,334.4 US TAX REFORM 207.7 82.4 103.3 93.9 *2
1 st Half Joakim Olsson CEO and President July 17, Innovative Vehicle Technology
 1 st Half 2009 Joakim Olsson CEO and President July 17, 2009 Innovative Vehicle Technology 2009-07-17 Summary 1st half 2009 Sales of SEK 2,971m (4,473) Adjusted for currency exchange rates, sales declined
LOCK & LOCK. 2Q12 Earnings Release. July 30, 2012
 LOCK & LOCK 2Q12 Earnings Release July 30, 2012 Contents 1. 2Q12 Preliminary Earnings 2. Sales Breakdown by Region 3. Sales Breakdown by Channel 4. Sales Breakdown by Product Category 5. Summary Financials
FISCAL YEAR MARCH 2014 FIRST HALF FINANCIAL RESULTS. New Mazda Axela (Overseas name: New Mazda3)
") FISCAL YEAR MARCH 2014 FIRST HALF FINANCIAL RESULTS New Mazda Axela (Overseas name: New Mazda3) Mazda Motor Corporation October 31, 2013 1 PRESENTATION OUTLINE Highlights Fiscal Year March 2014 First Half
FISCAL YEAR MARCH 2014 FIRST HALF FINANCIAL RESULTS New Mazda Axela (Overseas name: New Mazda3) Mazda Motor Corporation October 31, 2013 1 PRESENTATION OUTLINE Highlights Fiscal Year March 2014 First Half
FY17 RESULTS BUSINESS UPDATES FY18 OUTLOOK. Nissan Motor Co., Ltd. May 14 th, 2018
 Nissan Motor Co., Ltd. May 14 th, 2018 RESULTS BUSINESS UPDATES FY18 OUTLOOK www.nissan-global.com Copyright NISSAN MOTOR CO., LTD. All rights reserved. 2 GLOBAL 91.81 5.08 TIV * 1 vs. 93.52 GLOBAL +1.9%
Table 1 ANTIGUA AND BARBUDA: MAIN ECONOMIC INDICATORS
 Antigua Tables 2006 1 Main Indicators 03/11/2006 08:05 AM Table 1 ANTIGUA AND BARBUDA: MAIN ECONOMIC INDICATORS 1996 1997 1998 1999 2000 2001 2002 2003 2004 2005 a/ Annual growth rates b/ Gross domestic
FISCAL YEAR END MARCH 2013 FIRST HALF FINANCIAL RESULTS. New Mazda6 (Atenza)
") FISCAL YEAR END MARCH 2013 FIRST HALF FINANCIAL RESULTS New Mazda6 (Atenza) Mazda Motor Corporation October 31, 2012 1 PRESENTATION OUTLINE Highlights Fiscal Year March 2013 First Half Results Fiscal Year
FISCAL YEAR END MARCH 2013 FIRST HALF FINANCIAL RESULTS New Mazda6 (Atenza) Mazda Motor Corporation October 31, 2012 1 PRESENTATION OUTLINE Highlights Fiscal Year March 2013 First Half Results Fiscal Year
BlueScope Steel Limited Consolidated Financial Headlines
 BlueScope Steel Limited Consolidated Financial Headlines 2003 2004 2005 2006 2007 2008 2009 2010 2011 2012 2013 2013 2013 2014 2014 2014 2015 2015 2015 2016 2016 2016 2017 2017 2017 2018 2018 2018 Total
Russian Automobile Dealers
 Russian Automobile Dealers Convention 2016 Results of the Twelfth Car Dealer Satisfaction Index DSI12 12 April 2016 Andrey Tomyshev Head of the CIS Automotive Group April 2016 Twelfth Car Dealer Satisfaction
Masao Usui, Meeting Materials for First-half of FY2011 and Business Outlook November 15, 2011 KYB Corporation
 Meeting Materials for First-half of and Business Outlook November 15, 2011 KYB Corporation Masao Usui, Representative Director, President Executive Officer Meeting Materials for First-half of and Business
Driving Value in an Inflated Market. June 24, 2015
 Driving Value in an Inflated Market June 24, 2015 Group 1 Automotive Ticker: GPI Stock Price: $82.53 * Group 1 owns and operates auto dealerships Third largest dealership group in the U.S. retailing 275,000
FY2018 H1 Financial Results
 FY2018 H1 Financial Results November 6,2017 1 Copyright(C) 2017 Isuzu Motors Limited All rights reserved Contents Ⅰ. President and Representative Director : Masanori Katayama :FY2018 H1 Financial Summary
Mazda Motor Corporation June 17, 2011
 FY ENDING MARCH 2012 FINANCIAL FORECAST New MAZDA Demio 13-SKYACTIV Mazda Motor Corporation June 17, 2011 1 PRESENTATION OUTLINE FY ending March 2012 Forecast Updates of Framework for Medium- and Long-term
Results Briefing FY2014 1H
 Securities Code: 6770 Results Briefing FY2014 1H Friday, October 31, 2014 COPYRIGHT(C)2014 ALPS ELECTRIC CO.,LTD. ALL RIGHT RESERVED. Contents FY2014 1H Consolidated Financial Results P. 2-9 FY2014 Consolidated
How Old Cars And New Solutions Will Impact Our Industry
 How Old Cars And New Solutions Will Impact Our Industry New Car Market Trends Watch the Used Car Market Tariffs and Other Concerns The Evolution of Mobility 1 2018 MID-YEAR REVIEW TRANSFORMING THE WAY
STATISTICAL TABLES RELATING TO INCOME, EMPLOYMENT, AND PRODUCTION
 A P P E N D I X B STATISTICAL TABLES RELATING TO INCOME, EMPLOYMENT, AND PRODUCTION C O N T E N T S NATIONAL INCOME OR EXPENDITURE Page B 1. Gross domestic product, 1960 2009... 328 B 2. Real gross domestic
Financial Results for the 3rd Quarter Ended Dec. 31, 2005 < U.S. GAAP-based >
 Financial Results for the 3rd Quarter Ended Dec. 31, 25 < U.S. GAAP-based > February 1, 26 NIDEC CORPORATION www.nidec.co.jp/english/index.html Financial Results for the 3 rd Quarter Ended Dec. 31, 25
Joint Venture Agreement ( JVA ) with Nissan in respect of the establishment and operation of NVL ( Proposed Joint Venture ).
 with Nissan in respect of the establishment and operation of NVL ( Proposed Joint Venture ).") TAN CHONG MOTOR HOLDINGS BERHAD Proposed Acquisition of 74% Charter Capital of Nissan Vietnam Co., Ltd. and Proposed Joint Venture with Nissan Motor Co., Ltd. 1.0 INTRODUCTION The Board of Directors of
TAN CHONG MOTOR HOLDINGS BERHAD Proposed Acquisition of 74% Charter Capital of Nissan Vietnam Co., Ltd. and Proposed Joint Venture with Nissan Motor Co., Ltd. 1.0 INTRODUCTION The Board of Directors of
Research Coverage Report by Shared Research Inc.
 esearch eport by Shared esearch Inc. https://sharedresearch.jp This PDF document is an updated note on the company. A comprehensive version of the report on the company, including this latest update, is
FISCAL YEAR END MARCH 2012 FINANCIAL RESULTS. Mazda TAKERI
 FISCAL YEAR END MARCH 212 FINANCIAL RESULTS Mazda TAKERI Mazda Motor Corporation April 27, 212 1 PRESENTATION OUTLINE Highlights FY End March 212 Results FY End March 213 Forecast Summary Progress Toward
A.P Eagers RBS Morgans Business Breakfast
 A.P Eagers RBS Morgans Business Breakfast Wednesday 20 th February January 1913 E.G. Eager & Son Pty Ltd was established in Brisbane s Adelaide Street 1922 E.G. Eager operated the state s first motor car
Business Magazines Cross Platform Profile Circulation Certificate January to December 2014
 Business Magazines Cross Platform Profile Certificate January to December 2014 Setting the standard Fleet News Key information Certificate type Cross Platform % of circulation Audit issue circulation analysis
FISCAL YEAR END MARCH 2013 FIRST QUARTER FINANCIAL RESULTS
 FISCAL YEAR END MARCH 213 FIRST QUARTER FINANCIAL RESULTS New MAZDA CX-5 Mazda Motor Corporation July 31, 212 1 PRESENTATION OUTLINE Highlights Fiscal Year End March 213 Results Update of Structural Reform
Q3 & 9M 2018 Results Presentation. October 24 th, 2018
 Q3 & 9M 2018 Results Presentation October 24 th, 2018 Q3 & 9M HIGHLIGHTS & CATEGORY SPOTLIGHTS Gonzalve BICH 3Q and 9M 2018 Results Presentation 2 9 Months 2018 Key Messages Continued challenging trading
FY2015 Third Quarter Financial Results
 FY2015 Third Quarter Financial Results Mitsubishi Motors Corporation February 3, 2016 FY2015 Third Quarter Financial Results All-new Pajero Sport 1 FY2015 1-3Q Results Summary (vs. FY2014 1-3Q) Increase
Appendix B STATISTICAL TABLES RELATING TO INCOME, EMPLOYMENT, AND PRODUCTION
 Appendix B STATISTICAL TABLES RELATING TO INCOME, EMPLOYMENT, AND PRODUCTION C O N T E N T S Page NATIONAL INCOME OR EXPENDITURE: B. Gross domestic product, 959 005... 80 B. Real gross domestic product,
MONRO MUFFLER BRAKE, INC. ANNOUNCES FOURTH QUARTER AND FISCAL 2015 FINANCIAL RESULTS
 CONTACT: John Van Heel Chief Executive Officer (585) 647-6400 Robert Gross Executive Chairman (585) 647-6400 Catherine D Amico Executive Vice President Finance Chief Financial Officer (585) 647-6400 Investors:
FY2016 Third Quarter consolidated financial highlights
 FY2016 Third Quarter consolidated financial highlights pages Ⅰ. Overview of Consolidated Results Ⅱ. Q3 and YTD FY2016 Consolidated Financial Results Summary Ⅲ. and Net by Product / Sanwa Shutter 1 2 4
DAEWOO HEAVY INDUSTRIES & MACHINERY
 www.dhiltd.co.kr DAEWOO HEAVY INDUSTRIES & MACHINERY November 2003 Our projections in this document are based on current economic conditions and DHIM s current management policy. www.dhiltd.co.kr CONTENTS
Record CY 2016 EPS-diluted-adjusted of $6.12, an increase of $1.10 Y-O-Y. Q EPS-diluted-adjusted of $1.28, a decrease of $0.11 Y-O-Y.
 1 2 3 Q4 2016 global deliveries up 0.1 million units year-over-year (Y-O-Y), a 3.3% increase. Volume gains primarily in North America and China, offset by reductions in International Operations (excluding
Investor Presentation. May 16, 2017
 Investor Presentation May 16, 2017 FORWARD-LOOKING STATEMENTS 2 Certain information contained in this presentation looks forward in time and deals with other than historical or current facts for AutoCanada
BARLOWORLD MOTOR BARLOWORLD MOTOR ANALYSTS VISIT
 BARLOWORLD MOTOR ANALYSTS VISIT 21 st SEPTEMBER 2006 32 Brands Strategy It remains.. To provide a range of motor vehicle usage solutions that address the needs of our Customers. Value Based Management
July 27, Copyright(C) 2006 Isuzu Motors Ltd. All rights reserved. FORWARD-New Long Term Emission version. ELF-CNG version
 2006 Isuzu Motors Ltd. All rights reserved. FORWARD-New Long Term Emission version. ELF-CNG version") ELF-CNG version FORWARD-New Long Term Emission version 2.5L/3.0L Super Clean & Economy Diesel Isuzu D-MAX GIGA-New Long Term Emission version July 27, 2006 1 Copyright(C) 2006 Isuzu Motors Ltd. All rights
ELF-CNG version FORWARD-New Long Term Emission version 2.5L/3.0L Super Clean & Economy Diesel Isuzu D-MAX GIGA-New Long Term Emission version July 27, 2006 1 Copyright(C) 2006 Isuzu Motors Ltd. All rights
Cambodia. East Asia: Testing Times Ahead
 Key Indicators Cambodia 68 East Asia: Testing Times Ahead 2002 2003 2004 2005 2006 2007 /e 2008 /p 2009 /p Year Year Year Year Year Year Year Year Real GDP (% change, previous year) 6.5 8.5 10.0 13.5 10.8
Financial Result for 3 rd Quarter of Fiscal Year 2004
 Financial Result for 3 rd Quarter of Fiscal Year 2004 January 28, 2005 Yokogawa Electric Corporation 1 Revised Budget FY03 Result Budget 2004/5/11 Revised Budget 2004/11/9 (a) 2005/1/28 (b) (b)-(a) 390.5
FOR IMMEDIATE RELEASE
 Article No. 7353 Available on www.roymorgan.com Roy Morgan Unemployment Profile Wednesday, 11 October 2017 2.498 million Australians (18.9%) now unemployed or under-employed In September 1.202 million