FY 2010 Results. Jakarta, 28 February 2011
|
|
|
- Nigel Harris
- 5 years ago
- Views:
Transcription
1 FY 2010 Results Jakarta, 28 February 2011
2 Table of Contents FY 2010 Results Do Good 2010 Company Update
3 Executive Summary Loans grew 48% Customer Deposits grew 38%; Total Funding (incl. Bond) grew 50% LDR at 91%; while Loan to Funding ratio at 81% Net Interest Margin at 14.0% NPL maintained at low level of 1.1% NPAT reached IDR 837 bio or increased 99% CAR (including Operational Risk) at 23.4%
4 Balance Sheet Highlights IDR billion Dec '09 Dec '10 YoY Mar '10 Jun '10 Sep '10 Dec '10 Cash & BI 1,371 2, % 1,538 1,880 2,020 2,949 SBI & Placement 3,967 7,385 86% 3,761 5,154 5,971 7,385 Loans (gross) 15,723 23,328 48% 17,675 20,066 21,824 23,328 - Pension 13,001 18,256 40% 14,114 15,696 17,156 18,256 - Micro 2,298 4, % 3,128 3,926 4,222 4,634 * - Others % Allowance for losses (269) (341) 27% (303) (290) (308) (341) Customer Deposits 18,515 25,526 38% 20,194 22,351 24,484 25,526 Borrowings 789 3, % 820 2,041 2,242 3,359 Total Funding 19,304 28,885 50% 21,014 24,393 26,726 28,885 Equity 2,038 4, % 2,200 2,426 2,648 4,217 Total Assets 22,272 34,523 55% 24,248 28,059 30,760 34,523 * include staff loans (for car & housing) and syariah financing
5 Profit & Loss Highlights IDR billion YoY 1Q '10 2Q '10 3Q '10 4Q '10 Interest income 3,608 5,605 55% 1,178 1,333 1,498 1,595 Interest expense 1,645 2,066 26% Net interest income 1,963 3,539 80% Fee income % Operating income 2,342 3,674 57% ,038 Operating expense 1,675 2,159 29% Net operating income 667 1, % Loan loss provision % NPBT 622 1,127 81% NPAT % Notes: * due to reclassification of loan related fee income to NII (implementation of PSAK 50/55) * ** due to one time adjustment for recognition of un-amortized fee portion of paid-off pension loans; Q4 Normalized NII : IDR 961 bio and NPAT: IDR 238 bio ** **
6 Key Ratios % FY '09 FY '10 1Q '10 2Q '10 3Q '10 4Q '10 NIM Cost to Income LDR (end of period) Loan to Funding Liquid Asset Ratio NPL Cost of Credit/Avg. Loan LLP/NPL ROA (before tax) ROE (after tax) CAR (credit & ops risk) Note: * due to one time adjustment for recognition of un-amortized fee portion of paid-off pension loans; Q4 Normalized NIM: 13.0%, Cost to Income: 55%, ROA: 3.9% and ROE: 29.2% * * * *
 Dec '09 Mar '10 Jun '10 Sep '10 Dec '10 Q4 '09 Q1 '10 Q2 '10 Q3 '10 Q4 '10 Pension Micro Others* Cost of Credit / Avg Loans NPL (gross) * include staff loans (for car & housing) and syariah")
7 Loans Composition & Portfolio Quality LOANS COMPOSITION NPL & COST OF CREDIT IDR tio % % % % % % % 80% 78% 79% 78% (0.2) Dec '09 Mar '10 Jun '10 Sep '10 Dec '10 Q4 '09 Q1 '10 Q2 '10 Q3 '10 Q4 '10 Pension Micro Others* Cost of Credit / Avg Loans NPL (gross) * include staff loans (for car & housing) and syariah financing
8 Strong Liquidity Reserves, Diversified Funding Sources FUNDING COMPOSITION TIME DEPOSIT BY TERMS IDR tio % % % % 92% % 88% Sep '09 Dec '09 Jun '10 Dec '10 Customer Deposits Bonds & Borrowings Others 1 mo 3 mos 6-12 mos Industry* BTPN * Source: Indonesia Financial Statistics (Dec 2010), Bank Indonesia LIQUID ASSETS RATIO (Against Total Customer Deposits) STRUCTURED FUNDING INITIATIVES % Completed: IDR Bonds I IDR 750 bio IDR Bonds II IDR 1,300 bio IDR Bonds III IDR 1,100 bio LT Loan Blue Orchard IDR 135 bio Primary Secondary Tertiary* Standby: LT Facility - IFC US$ 70 mio Joint Financing IDR 900 bio * Standby facilities from IFC
9 Strong Capital & Profitability EQUITY & CAR ROA & ROE IDR tio % 23.4% % 16.7% Dec '09 Jun '10 Dec '10 Dec '09 Jun '10 Dec '10 Equity CAR ROA ROE
10 Cost to Income continue to improve OPEX OPEX COMPOSITION IDR tio % 70% 64% 61% 58% 53% 2, , ,675 14% 32% 55% 6% 34% 60% Q4 '09 Q1 '10 Q2 '10 Q3 '10 Q4 '10 Op. Income Opex Cost to Income FY '09 FY '10 Manpower G&A Insurance
11 Table of Contents FY 2010 Results Do Good 2010 Company Update


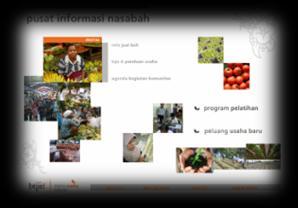


12 Differentiated Business Models Integrated CSR as part of Our UVP Information Center Consultation Program Business Opportunity Training Training Programs Information Sharing Micro Biz Franchise


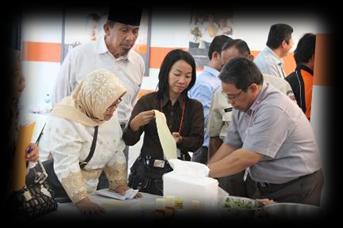
13 Pension Business: Integrate CSR as part of the UVP Pillar III Pillar II Pillar I > 450,000 Pensioners served with CSI = 89% Information Center 25, ,900 Interactive Dialogue 23, ,444 Healthcare Services 55, ,873 Biz Opportunity Training 0 4,297-50, , , ,000 Jun - Dec 2009 Jan - Dec 2010 I. Information Center II. Consultation Program III. Business Opportunity Provide value-added information for pensioners, prepensioners and their families Provide consultation services through interactive dialogues and basic health care services involving healthcare & well-being professionals Provide information on business opportunities and training on how to manage a business

14 Micro Business: Integrate CSR as part of the UVP Training Modules 4 available modules: Practical Financial Management 3,630 classes; ~50,000 customers 96% net promoter score Inventory Management 1,228 classes; 17,907 customers Marketing Management 1,226 classes; 18,823 customers Sales Management 427 classes; 7,254 customers 150 certified trainers Micro Biz Franchise Electronic Voucher Retailer (PULSAMU) 1,587 packages taken; IDR1.2 bio trx volume/month Buy-Sell Information 150,420 product advertisements in the system accessible in all micro branches ~1.5 mio copies of Warta bulletin distributed to customers
15 Table of Contents FY 2010 Results Do Good 2010 Company Update

, raising number of shares from 1.13 bio to 5.")
16 Corporate Update Long-Term Funding Completed the 3 rd issuance of IDR 1.1 tio Senior Unsecured Bonds with 3 and 5 years tenor on Dec 23, Rights Issue To strengthen its capital base, BTPN had conducted Rights Issue in December Number of new shares issued were million (1 new for every 5 existing shares) which raised IDR 1.3 tio of new capital. CAR increased to 23.4% at end of Dec Stock Split Plan BTPN will conduct stock split (ratio: 1 to 5), raising number of shares from 1.13 bio to 5.66 bio, to increase liquidity of shares and trading volume.
17 THANK YOU
DO GOOD DO WELL. 1H 2011 Results. July 2011
 DO GOOD DO WELL 1H 2011 Results July 2011 Table of Contents 1H 2011 Results New CSR Platform Executive Summary Good Growth Momentum: Loans: 15% Funding*: 18% Ample Liquidity to fund Loans growth: LDR:
July Q 2015 Results Update
 July 2015 2Q 2015 Results Update Steady Loans Growth and Strong Liquidity Loans Growth in line with Industry: Loans growth: 11.4% (YoY); 7.1% (YTD) vs Industry: 10.4% (May 15 YoY) Deposits growth: 8.4%
FY2/17 3Q(March 2016~November2016)
") FY2/17 (March 2016~November2016) Fact Book 1. Trends in the current fiscal year and previous fiscal year 3. Business overview (1) Performance overview P. 1 (1) No. of students at the end of month P. 7
FY2/17 (March 2016~November2016) Fact Book 1. Trends in the current fiscal year and previous fiscal year 3. Business overview (1) Performance overview P. 1 (1) No. of students at the end of month P. 7
KCB GROUP PLC INVESTOR PRESENTATION. Q FINANCIAL RESULTS
 KCB GROUP PLC INVESTOR PRESENTATION. Q3 2018 FINANCIAL RESULTS MACRO-ECONOMIC HIGHLIGHTS Macro-Economic Highlights: Kenya KENYA 4.9% 5.3% GDP Growth Rate (%) 5.6% 5.8% 4.9% 6.3% 6.2% KENYA 2013 2014 2015
FY2/17 (March 2016~February 2017)
") FY2/17 (March 2016~February 2017) Fact Book 1. Trends in the current fiscal year and previous fiscal year 3. Business overview (1) Performance overview P. 1 (1) No. of students at the end of month P. 7
FY2/17 (March 2016~February 2017) Fact Book 1. Trends in the current fiscal year and previous fiscal year 3. Business overview (1) Performance overview P. 1 (1) No. of students at the end of month P. 7
1. Trends in the current fiscal year and previous fiscal year 3. Business overview 2. Secular trends in first quarter financial results
 FY2/19 (March 2018~May 2018) Fact Book 1. Trends in the current fiscal year and previous fiscal year 3. Business overview (1) Performance overview P. 1 (1) No. of students at the end of month P. 6 (2)
FY2/16(March 2015~February 2016)
") FY2/16(March 2015~February 2016) 1. Trends in the current fiscal year and the previous fiscal year 3. Business overview (1) Peformance overview P.1 (1) No. of students at the end of month P.7 (2) Cost
FY2/16(March 2015~February 2016) 1. Trends in the current fiscal year and the previous fiscal year 3. Business overview (1) Peformance overview P.1 (1) No. of students at the end of month P.7 (2) Cost
FY2/18 2Q(March 2017~August 2018)
") FY2/18 2Q(March 2017~August 2018) Fact Book 1. Trends in the current fiscal year and previous fiscal year 3. Business overview (1) Performance overview P.1 (1) No. of students at the end of month P.7 (2)
FY2/18 2Q(March 2017~August 2018) Fact Book 1. Trends in the current fiscal year and previous fiscal year 3. Business overview (1) Performance overview P.1 (1) No. of students at the end of month P.7 (2)
FY2/18 (March 2017~February 2018)
") FY2/18 (March 2017~February 2018) Fact Book 1. Trends in the current fiscal year and previous fiscal year 3. Business overview (1) Performance overview P. 1 (1) No. of students at the end of month P. 6
FY2/18 (March 2017~February 2018) Fact Book 1. Trends in the current fiscal year and previous fiscal year 3. Business overview (1) Performance overview P. 1 (1) No. of students at the end of month P. 6
First half (2014/3/1~2014/8/31)
") FY2/15 (March 2014~November 201 4) 1.Trends in current fiscal year and previouse fiscal year 3.Business overview (1)Peformance overview P.1 (1)No. of students at the end of month P.7 (2)Cost of sales breakdown
FY2/15 (March 2014~November 201 4) 1.Trends in current fiscal year and previouse fiscal year 3.Business overview (1)Peformance overview P.1 (1)No. of students at the end of month P.7 (2)Cost of sales breakdown
State Bank of India PRESS RELEASE
 State Bank of India PRESS RELEASE Q2FY18 / H1FY18 RESULTS Note: Historical Data has been arrived at by aggregating the audited numbers of the erstwhile Associate Banks, Bharatiya Mahila Bank and SBI for
Bigger, Stronger, Better bank bjb 3Q13 Analyst Meeting
 Bigger, Stronger, Better bank bjb 3Q13 Analyst Meeting Table of Content Pg. 5 Pg. 10 Pg. 15 Pg. 16 Pg. 19 Pg. 23 Pg. 31 Pg. 37 Result Summary Loans Breakdown Deposit Breakdown Asset Quality Yield Analysis
FY2/15(March 2014~February 2015)
") FY2/15(March 2014~February 2015) 1. Trends in the current fiscal year and the previous fiscal year 3. Business overview (1) Peformance overview P.1 (1) No. of students at the end of month P.7 (2) Cost
FY2/15(March 2014~February 2015) 1. Trends in the current fiscal year and the previous fiscal year 3. Business overview (1) Peformance overview P.1 (1) No. of students at the end of month P.7 (2) Cost
Healthier Net Profit under Stronger IDR
 Investor Bulletin, First Half 2002 Healthier Net Profit under Stronger IDR As of June 2002, the consolidated revenue in USD increased by 32% y.o.y. Due to IDR strengthening against USD, in IDR revenue
Contents. Automotive Holdings Group Limited
 Automotive Holdings Group Limited Institutional Briefings Year End Results June Contents FY Highlights Corporate Statistics Group Performance Floorplan Financing Automotive Logistics Outlook Appendices
CREDIT UNION ESTIMATES
 MONTHLY CREDIT UNION ESTIMATES Prepared May 1, 2018 by Credit Union National Association Economics and Statistics Department cuna.org/mcue Loans Credit union loans outstanding grew 1.1% in, compared to
CREDIT UNION ESTIMATES
 MONTHLY CREDIT UNION ESTIMATES Prepared February 1, 2018 by Credit Union National Association Economics and Statistics Department cuna.org/mcue Loans Credit union loans outstanding grew 1.0% in, compared
ANALYST BRIEFING FOR THE FOURTH QUARTER ENDED FEBRUARY 2017
 ANALYST BRIEFING FOR THE FOURTH QUARTER ENDED 2016 22 FEBRUARY 2017 MSM Malaysia Holdings Berhad Analyst Briefing Q4 2016 22/2/2017 1 CONTENTS 01 02 03 04 05 Group Financial Highlights Performance Review
CREDIT UNION ESTIMATES
 MONTHLY CREDIT UNION ESTIMATES Prepared March 4, 2019 by Credit Union National Association Economics and Statistics Department cuna.org/mcue Loans Credit union loans outstanding grew 0.3% in January, compared
CREDIT UNION ESTIMATES
 MONTHLY CREDIT UNION ESTIMATES Prepared March 2, 2018 by Credit Union National Association Economics and Statistics Department cuna.org/mcue Loans Credit union loans outstanding grew 0.7% in, compared
FY Third Quarter Results. Investor Presentation
 FY 2009-10 Third Quarter Results Investor Presentation Performance Highlights Q3FY10 9MFY10 Net Profit 31% YOY 42% YOY Net Interest Income 45% YOY 34% YOY Fee Income 29% YOY 20% YOY Operating Revenue 41%
Results for the Three Months ended June 30, 2018
 Reference Translation Results for the Three Months ended June 30, 2018 July 31, 2018 AUTOBACS SEVEN CO., LTD. FY March 2019 Consolidated P/L Profit Loss/Gain: Net sales and gross profit decreased, and
CREDIT UNION ESTIMATES
 MONTHLY CREDIT UNION ESTIMATES Prepared June 1, 2018 by Credit Union National Association Economics and Statistics Department cuna.org/mcue Loans Credit union loans outstanding grew 1.1% in, matching the
Stronger Fundamental and Excellent Growth
 Investor Bulletin, First Half 2004 Stronger Fundamental and Excellent Growth For the first six months of 2004, PT United Tractors Tbk (UT/Company) recorded consolidated net revenue of IDR 4.29 trillion,
Nissan Motor Co., Ltd. February 12 th, 2019
 Nissan Motor Co., Ltd. February 12 th, 2019 NET REVENUE 2,875.5 3,045.7 OPERATING PROFIT *1 NET INCOME 301.6 FREE CASH FLOW (AUTO) NET CASH (AUTO) 1,311.4 1,334.4 US TAX REFORM 207.7 82.4 103.3 93.9 *2
BRUNEI DARUSSALAM. Copies of this report are available to the public from
 IMF Country Report No. 16/310 September 2016 BRUNEI DARUSSALAM STATISTICAL APPENDIX This Statistical Appendix on Brunei Darussalam was prepared by a staff team of the International Monetary Fund. It is
INCREASING SALES FOR MINING RELATED BUSINESS
 Investor Relations of PT UNITED TRACTORS Tbk INCREASING SALES FOR MINING RELATED BUSINESS In the first half 2001, the Company managed to record increase in net revenue from IDR 2.32 trillion to IDR 3.54
CREDIT UNION ESTIMATES
 MONTHLY CREDIT UNION ESTIMATES Prepared January 2, 2019 by Credit Union National Association Economics and Statistics Department cuna.org/mcue Loans Credit union loans outstanding grew 0.6% in, compared
PUBLIC EXPOSE TAHUNAN PT INTAN BARUPRANA FINANCE TBK. Auditorium 5 th Floor, INTA HQ Building Jakarta, 27 Oktober 2015
 PUBLIC EXPOSE TAHUNAN PT INTAN BARUPRANA FINANCE TBK Auditorium 5 th Floor, INTA HQ Building Jakarta, 27 Oktober 2015 Key Company Highlights Vision, Mission, Strategy VISION To be Tier 1 Finance Company
1Q17 Highlights. +22%YoY. Officially Launched. PT Maxnitron. Sales Volume 821 Liters 6.1 1,436. Million Members. Stations
 1Q17 Highlights +22%YoY Sales Volume 821 Liters 6.1 Million Members Officially Launched PT Maxnitron 1,436 Stations Agenda Industry Outlook Business Performance Project Update Financial Performance Thailand
CREDIT UNION ESTIMATES
 MONTHLY CREDIT UNION ESTIMATES Prepared November 1, 2017 by Credit Union National Association Economics and Statistics Department cuna.org/mcue Loans Credit union loans outstanding grew 0.7% in, compared
FY17 RESULTS BUSINESS UPDATES FY18 OUTLOOK. Nissan Motor Co., Ltd. May 14 th, 2018
 Nissan Motor Co., Ltd. May 14 th, 2018 RESULTS BUSINESS UPDATES FY18 OUTLOOK www.nissan-global.com Copyright NISSAN MOTOR CO., LTD. All rights reserved. 2 GLOBAL 91.81 5.08 TIV * 1 vs. 93.52 GLOBAL +1.9%
CREDIT UNION ESTIMATES
 MONTHLY CREDIT UNION ESTIMATES Prepared September 28, 2018 by Credit Union National Association Economics and Statistics Department cuna.org/mcue Loans Credit union loans outstanding grew 1.0% in, compared
CREDIT UNION ESTIMATES
 MONTHLY CREDIT UNION ESTIMATES Prepared July 2, 2018 by Credit Union National Association Economics and Statistics Department cuna.org/mcue Loans Credit union loans outstanding grew 1.3% in, compared to
CREDIT UNION ESTIMATES
 MONTHLY CREDIT UNION ESTIMATES Prepared September 4, 2018 by Credit Union National Association Economics and Statistics Department cuna.org/mcue Loans Credit union loans outstanding grew 1.1% in, compared
FY First Half Results. Investor Presentation
 FY 2011-12 First Half Results Investor Presentation Performance Highlights Q2FY12 H1FY12 Net Profit 25% YOY 26% YOY Net Interest Income 24% YOY 19% YOY Fee Income 32% YOY 37% YOY Operating Revenue 22%
CREDIT UNION ESTIMATES
 MONTHLY CREDIT UNION ESTIMATES Prepared August 1, 2018 by Credit Union National Association Economics and Statistics Department cuna.org/mcue Loans Credit union loans outstanding grew 1.3% in, matching
TOFAŞ RESULTS WEBCAST PRESENTATION
 TOFAŞ 31.12.2017 RESULTS WEBCAST PRESENTATION 02.02.2018 AGENDA Highlights Turkish Automotive Industry Production Domestic Market Developments Tofaş Domestic Market Performance Export Markets & Tofaş Performance
On track. Investor and Analyst Presentation On the Occasion of the Release of the Preliminary Figures for 9M 2011 Hanover, 18 October 2011
 On track. Investor and Analyst Presentation On the Occasion of the Release of the Preliminary Figures for 9M 2011 Agenda Delticom at a Glance Business Model Profit & Loss Balance Sheet Outlook 2 Agenda
Statistical tables S 0. Money and banking. Capital market. National financial account. Public finance
 Statistical tables Money and banking Page S South African Reserve Bank: Liabilities... 2 South African Reserve Bank: Assets... 3 Corporation for Public Deposits: Liabilities... 4 Corporation for Public
FY16 results. Business updates. FY17 outlook. Nissan Motor Co., Ltd. May 11 th, 2017
 Nissan Motor Co., Ltd. May 11 th, 2017 results Business updates FY17 outlook www.nissan-global.com Copyright NISSAN MOTOR CO., LTD. All rights reserved. 2 (TSE REPORT BASIS CHINA JV EQUITY BASIS) NET REVENUE
Federated States of Micronesia
 IMF Country Report No. 13/17 Federated States of Micronesia 2012 ARTICLE IV CONSULTATION 2012 Statistical Appendix January 29, 2001 January 29, 2001 This Statistical Appendix paper for the Federated States
On track. Investor and Analyst Presentation On the Occasion of the Release of the Preliminary Figures for FY 2011 Hanover, 19 January 2012
 On track. Investor and Analyst Presentation On the Occasion of the Release of the Preliminary Figures for FY 2011 Agenda Delticom at a Glance Business Model Profit & Loss Balance Sheet Outlook 2 Agenda
2013 Final Results. 19 March 2014
 2013 Final Results 19 March 2014 Important Notice The information contained herein is meant for presentation purposes only and may not be used and relied upon by any other party. It is not to be taken
The Group is expected to continue benefiting from stable coal prices, but in the car market, competitive pressures are likely to intensify.
 PRESS RELEASE 24th April 2018 PT ASTRA INTERNATIONAL TBK 2018 FIRST QUARTER FINANCIAL STATEMENTS Highlights Net earnings per share down 2 at 123 Lower market share for cars and motorcycles Higher coal
Automotive Holdings Group Limited. Euroz Securities Rottnest Island Conference Bronte Howson Managing Director March 2008
 Automotive Holdings Group Limited Euroz Securities Rottnest Island Conference 008 Bronte Howson Managing Director March 008 Group Snapshot Largest Automotive Retailing & Logistics Group in Australia 0
Money and banking. Flow of funds for the third quarter
 Statistical tables Money and banking Page S South African Reserve Bank: Liabilities... 2 South African Reserve Bank: Assets... 3 Corporation for Public Deposits: Liabilities... 4 Corporation for Public
BAYPORT SECURITISATION (RF) LTD INVESTOR REPORT AUGUST 2018
 LTD INVESTOR REPORT AUGUST 2018") BAYPORT SECURITISATION (RF) LTD INVESTOR REPORT AUGUST 2018 0 Note: This report has been prepared in accordance with IFRS 9. Financial statistics for the period ended August 2018 Aug 18 Jul 18 June 18
BAYPORT SECURITISATION (RF) LTD INVESTOR REPORT AUGUST 2018 0 Note: This report has been prepared in accordance with IFRS 9. Financial statistics for the period ended August 2018 Aug 18 Jul 18 June 18
Automotive Holdings Group Limited. Presentation May 2009
 Automotive Holdings Group Limited Presentation May 2009 Contents About AHG Third Quarter 2009 Performance AHG s strategic response to current economic climate Net Debt Position Automotive Logistics Outlook
GDP. Total Domestic demand External balance 1)
") 3.1 GDP and expenditure components (quarterly data seasonally adjusted; annual data unadjusted) GDP Total Domestic demand External balance 1) Total Private Government Gross fixed capital formation Changes
3.1 GDP and expenditure components (quarterly data seasonally adjusted; annual data unadjusted) GDP Total Domestic demand External balance 1) Total Private Government Gross fixed capital formation Changes
Q Analyst Teleconference. 9 August 2018
 9 August 218 Disclaimer This presentation contains forward-looking statements that reflect the Company management s current views with respect to certain future events. Although it is believed that the
1 st Half 2018 Results. August 1 st, 2018
 1 st Half 2018 Results August 1 st, 2018 H1 HIGHLIGHTS & CATEGORY SPOTLIGHTS Gonzalve BICH 2 First Half 2018 Key Messages Challenging market and business environment Continued investment in targeted Brand
FISCAL YEAR END MARCH 2013 FIRST HALF FINANCIAL RESULTS. New Mazda6 (Atenza)
") FISCAL YEAR END MARCH 2013 FIRST HALF FINANCIAL RESULTS New Mazda6 (Atenza) Mazda Motor Corporation October 31, 2012 1 PRESENTATION OUTLINE Highlights Fiscal Year March 2013 First Half Results Fiscal Year
FISCAL YEAR END MARCH 2013 FIRST HALF FINANCIAL RESULTS New Mazda6 (Atenza) Mazda Motor Corporation October 31, 2012 1 PRESENTATION OUTLINE Highlights Fiscal Year March 2013 First Half Results Fiscal Year
PTG ENERGY PUBLIC COMPANY LIMITED. Opportunity Day. 2Q/2017 Performance Results
 PTG ENERGY PUBLIC COMPANY LIMITED Opportunity Day 2Q/2017 Performance Results PTG Businesses Retailing and Wholesaling Fuel Products Non-Fuel Products Logistics Business (Fuel logistics and Depot) Renewable
Financial Data Supplement Q4 2017
 Bank Financial Data Supplement Q4 2017 2 February 2018 Due to rounding, numbers presented throughout this document may not sum precisely to the totals we provide and percentages may not precisely reflect
TOFAŞ RESULTS WEBCAST PRESENTATION
 TOFAŞ 31.12.2016 RESULTS WEBCAST PRESENTATION 02.02.2017 1 WEBCAST AGENDA Highlights Turkish Automotive Industry Production Domestic Market Developments Tofaş Domestic Market Performance Export Markets
Bank of America/Merrill Lynch Insurance Conference Joseph P. Lacher President, Allstate Protection The Allstate Corporation
 Bank of America/Merrill Lynch Insurance Conference Joseph P. Lacher President, Allstate Protection The Allstate Corporation Safe Harbor This presentation contains forward-looking statements and information.
INVESTOR CALL 26 th April, Mahindra Towers
 INVESTOR CALL 26 th April, 2012 Mahindra Towers The opportunity Indian Hotel Industry Rs. 191 Bn Leisure usage Rs. 101 Bn Source : IBEF - India Brand Equity Foundation Business Model Revenue recognition
Fact Sheet for Q April 22, 2016
 Fact Sheet for Q1 2016 April 22, 2016 Contents Daimler Group Stock Market Information 3 Earnings and Financial Situation 4-13 Information for Divisions Mercedes-Benz Cars 14-17 Daimler Trucks 18-22 Mercedes-Benz
TOFAŞ Q ANALYST PRESENTATION
 TOFAŞ Q1 2016 ANALYST PRESENTATION 03.05.2016 1 2016 Q1 AGENDA Highlights Turkish Automotive Industry Production & Capacity Utilization Domestic Market Developments Tofaş Domestic Market Performance Export
FISCAL YEAR MARCH 2018 FIRST HALF FINANCIAL RESULTS
 FISCAL YEAR MARCH 2018 FIRST HALF FINANCIAL RESULTS PRESENTATION OUTLINE Highlights Fiscal Year March 2018 First Half Results Fiscal Year March 2018 Full Year Forecast Progress of Key Initiatives/ Business
BAYPORT SECURITISATION (RF) LTD INVESTOR REPORT JULY 2018
 LTD INVESTOR REPORT JULY 2018") BAYPORT SECURITISATION (RF) LTD INVESTOR REPORT JULY 2018 Note: This report has been prepared in accordance with IFRS 9. Financial statistics for the period ended July 2018 Jul 18 June 18 May 18 Apr 18
BAYPORT SECURITISATION (RF) LTD INVESTOR REPORT JULY 2018 Note: This report has been prepared in accordance with IFRS 9. Financial statistics for the period ended July 2018 Jul 18 June 18 May 18 Apr 18
Volvo Group THIRD QUARTER 2015 JAN GURANDER. Volvo Group Headquarters Third quarter
 Volvo Group THIRD QUARTER 2015 JAN GURANDER 1 VOLVO GROUP Third quarter highlights NET SALES SEK bn 12 months 310 bn IMPROVED PROFITABILITY ON FLAT VOLUMES UNDERLYING OPERATING MARGIN 6.9% 67 73 OPERATING
Performance of Wipro Limited for Quarter and Year ended - March 31, 2013
 Performance of Wipro Limited for Quarter and Year ended - March 31, 2013 Suresh Senapaty Executive Director and Chief Financial Officer April 19, 2013 1 Financial Summary for the Year Ended March 31, 2013
BRUNEI DARUSSALAM STATISTICAL APPENDIX. International Monetary Fund Washington, D.C. IMF Country Report No. 15/146. June 2015
 June 2015 IMF Country Report No. 15/146 BRUNEI DARUSSALAM STATISTICAL APPENDIX This Statistical Appendix on Brunei Darussalam was prepared by a staff team of the International Monetary Fund. It is based
ANALYST BRIEFING FOR THE THIRD QUARTER ENDED NOV 2016
 ANALYST BRIEFING FOR THE THIRD QUARTER ENDED 2016 21 NOV 2016 MSM Malaysia Holdings Berhad Analyst Briefing Q3 2016 21/11/2016 1 CONTENTS 01 02 03 04 05 Group Financial Highlights Performance Review Sugar
FISCAL YEAR MARCH 2014 FINANCIAL RESULTS
 FISCAL YEAR MARCH 214 FINANCIAL RESULTS Mazda CX-5 Mazda Atenza Mazda Motor Corporation April 25, 214 New Mazda Axela 1 PRESENTATION OUTLINE Highlights Fiscal Year March 214 Results Fiscal Year March 215
RESULTS FOR Q ANALYST TELECONFERENCE
 RESULTS FOR Q4 216 ANALYST TELECONFERENCE Market 1 2 Operation Financials 3 Market 1 216 Fourth Quarter Market Conditions Product Market Crude Oil Postponed Maintenances Started to take place High Agricultural
Driving Value in an Inflated Market. June 24, 2015
 Driving Value in an Inflated Market June 24, 2015 Group 1 Automotive Ticker: GPI Stock Price: $82.53 * Group 1 owns and operates auto dealerships Third largest dealership group in the U.S. retailing 275,000
Automotive Holdings Group Limited Macquarie Connections Conference
 Automotive Holdings Group Limited Macquarie Connections Conference Presented by: Bronte Howson Managing Director May 8 Group Snapshot Largest automotive retailing & logistics group in Australia Automotive
PRESS MEET Q3 - FY14. Dr. Reddy s Laboratories Limited February 11, Dr. Reddy's Laboratories Limited. All Rights Reserved.
 Dr. Reddy s Laboratories Limited February 11, 2014 Q3 FY 14 Business Highlights Sales ` 3,534 Cr 23 % Gross Margin 60.5 % 42% R & D 8.4 % 47 % 28.4 % 67 % to sales -- Q3 FY13 at 7.1% to Sales YoYGr% YoYGr%
Factbook. Tokyo Electric Power Company Holdings, Inc. August Tokyo Electric Power Company Holdings, Inc. All Rights Reserved.
 Factbook Tokyo Electric Power Company Holdings, Inc. August 2018 (Note) Please note that the following to be an accurate and complete translation of the original Japanese version prepared for the convenience
third QUARTER 2012 October 26, 2012
 third QUARTER 212 October 26, 212 Helena norrman Senior Vice President Communications third QUARTER 212 October 26, 212 This presentation contains forward-looking statements. Such statements are based
BAYPORT SECURITISATION (RF) LTD INVESTOR REPORT
 LTD INVESTOR REPORT") BAYPORT SECURITISATION (RF) LTD INVESTOR REPORT December 2017 Note: The Company adopted IFRS 9 as at 31 December 2016. All impacted figures have been restated from that date. The adoption of IFRS 9 introduced
BAYPORT SECURITISATION (RF) LTD INVESTOR REPORT December 2017 Note: The Company adopted IFRS 9 as at 31 December 2016. All impacted figures have been restated from that date. The adoption of IFRS 9 introduced
BIMB Holdings Berhad - Strategy, SWOT and Corporate Finance Report
 BIMB Holdings Berhad - Strategy, SWOT and Corporate Finance Report BIMB Holdings Berhad - Strategy, SWOT and Corporate Finance Report The Business Research Store is run by Sector Publishing Intelligence
Monthly Operating Report. December 2017
 Monthly Operating Report December 20 December overview» For the month of December 20 Contact recorded: Electricity and gas sales of 571 GWh (December 2016: 582 GWh) Netback of $79.23/MWh (December 2016:
3QFY2018 Financial Results. Quarter Ended 31 December 2017
 3QFY2018 Financial Results Quarter Ended 31 December 2017 Disclaimer This presentation is not and does not constitute an offer, invitation, solicitation or recommendation to subscribe for, or purchase,
FY 2017 Results. Disclaimer: Jardine Cycle & Carriage accepts no liability whatsoever with respect to the use of this document or its contents.
 FY 2017 Results Disclaimer: Jardine Cycle & Carriage accepts no liability whatsoever with respect to the use of this document or its contents. FINANCIAL HIGHLIGHTS Financial Highlights Underlying earnings
Outlook for Franchised New Car Dealers
 1 Outlook for Franchised New Car Dealers Fourteenth Annual Automotive Outlook Symposium June 1, 2007 Paul Taylor, Ph.D., Chief Economist National Automobile Dealers Association, McLean, VA www.nada.org
FY2017 Results. February 26, 2018
 FY2017 Results February 26, 2018 Our background & development Registered capital increased to 12 MB Started International marine transportation ( Myanmar route ) Registered capital increased to 100 MB
BAYPORT SECURITISATION (RF) LTD INVESTOR REPORT
 LTD INVESTOR REPORT") BAYPORT SECURITISATION (RF) LTD INVESTOR REPORT September 2017 Note: The Company adopted IFRS 9 as at 31 December 2016. All impacted figures have been restated from that date. The adoption of IFRS 9 introduced
BAYPORT SECURITISATION (RF) LTD INVESTOR REPORT September 2017 Note: The Company adopted IFRS 9 as at 31 December 2016. All impacted figures have been restated from that date. The adoption of IFRS 9 introduced
Q3 & 9M 2018 Results Presentation. October 24 th, 2018
 Q3 & 9M 2018 Results Presentation October 24 th, 2018 Q3 & 9M HIGHLIGHTS & CATEGORY SPOTLIGHTS Gonzalve BICH 3Q and 9M 2018 Results Presentation 2 9 Months 2018 Key Messages Continued challenging trading
Months Investor Presentation
 2018 9 Months Investor Presentation 25.10.2018 Disclaimer Ereğli Demir Çelik Fabrikaları T.A.Ş. (Erdemir) may, when necessary, make written or verbal announcements about forward-looking information, expectations,
Financial Highlights Q1 Results of FY 2013 (Fiscal year ending March 2014) August 8, : Avex Group Holdings Inc.
 August 8, : Avex Group Holdings Inc.") Financial Highlights Q1 Results of FY 2013 (Fiscal year ending March 2014) August 8, 2013 7860: Avex Group Holdings Inc. 1 1 Consolidated Results 2 2 Q1 FY 2013 Highlights Record high as a quarterly sales.
Financial Highlights Q1 Results of FY 2013 (Fiscal year ending March 2014) August 8, 2013 7860: Avex Group Holdings Inc. 1 1 Consolidated Results 2 2 Q1 FY 2013 Highlights Record high as a quarterly sales.
Cambodia. East Asia: Testing Times Ahead
 Key Indicators Cambodia 68 East Asia: Testing Times Ahead 2002 2003 2004 2005 2006 2007 /e 2008 /p 2009 /p Year Year Year Year Year Year Year Year Real GDP (% change, previous year) 6.5 8.5 10.0 13.5 10.8
NYSE: CGI
 NYSE: CGI www.celadongroup.com Forward-Looking Statement Disclaimer This presentation, including documents incorporated herein by reference, will contain forward-looking statements within the meaning of
Strong performance by the Bolloré Group s operating activities in 2018 Mr Cyrille Bolloré unanimously appointed Chairman and Chief Executive Officer
 PRESS RELEASE 2018 results (1) March 14, 2019 Strong performance by the Bolloré Group s operating activities in 2018 Mr Cyrille Bolloré unanimously appointed Chairman and Chief Executive Officer Revenue:
Q Briefing 16 November 2016
 Q3 2016 Briefing 16 November 2016 CONSOLIDATED FINANCIAL HIGHLIGHTS In million Php, except ratios Q1 2015 Q2 2015 Q3 2015 YTD 2015 Q1 2016 Q2 2016 Q3 2016 YTD 2016 Variance Revenues 7,245 6,472 5,536 19,252
Jordan Petroleum Refinery Company Equity Report. Jordan Petroleum Refinery Company June June 14, 2009
 Jordan Petroleum Refinery Company Equity Report June 14, 2009 Serene Zawaydeh Head of Research Awraq Investments szawaydeh@awraq.com P a g e 1 Table of Contents Executive Summary... 1 Financial Highlights...
BlueScope Steel Limited Consolidated Financial Headlines
 BlueScope Steel Limited Consolidated Financial Headlines 2003 2004 2005 2006 2007 2008 2009 2010 2011 2012 2013 2013 2013 2014 2014 2014 2015 2015 2015 2016 2016 2016 2017 2017 2017 2018 2018 2018 Total
The Performance of Year 2017
 The Performance of Year 2017 Investor Update Analyst Meeting STRONGER FACING CHALLENGES AGENDA 01 Company overview 02 Financial Performance 03 04 05 Operational Performance Strategy Execution in 2017 Strategy
Disclaimer: Jardine Cycle & Carriage accepts no liability whatsoever with respect to the use of this document or its contents.
 Disclaimer: Jardine Cycle & Carriage accepts no liability whatsoever with respect to the use of this document or its contents. Highlights Underlying profit up 7% Underlying earnings per share up 3%* Dividend
SOLLERS IFRS RESULTS
 SOLLERS IFRS RESULTS 2017 03.05.2018 2 1. 2017 SOLLERS STRATEGIC DEVELOPMENTS 2. RUSSIAN AUTOMOTIVE MARKET OVERVIEW 3. SOLLERS OPERATING AND FINANCIAL PERFORMANCE IN 2017 4. SOLLERS JOINT VENTURES RESULTS
Financial Result for 3 rd Quarter of Fiscal Year 2004
 Financial Result for 3 rd Quarter of Fiscal Year 2004 January 28, 2005 Yokogawa Electric Corporation 1 Revised Budget FY03 Result Budget 2004/5/11 Revised Budget 2004/11/9 (a) 2005/1/28 (b) (b)-(a) 390.5
Yanzhou Coal Mining Company Limited. Annual Results 2009 and First Quarterly Results April 2010
 Annual Results 2009 and First Quarterly Results 2010 April 2010 1 Part I Results Review 2009 Part II Results Review 1Q2010 Part III Part IV Part V Acquisition of Felix Resources Market Analysis Operating
FISCAL YEAR MARCH 2018 THIRD QUARTER FINANCIAL RESULTS
 FISCAL YEAR MARCH 2018 THIRD QUARTER FINANCIAL RESULTS PRESENTATION OUTLINE Highlights Fiscal Year March 2018 Nine Month Results Fiscal Year March 2018 Full Year Forecast Progress of Key Initiatives 1
FISCAL YEAR MARCH 2014 FIRST HALF FINANCIAL RESULTS. New Mazda Axela (Overseas name: New Mazda3)
") FISCAL YEAR MARCH 2014 FIRST HALF FINANCIAL RESULTS New Mazda Axela (Overseas name: New Mazda3) Mazda Motor Corporation October 31, 2013 1 PRESENTATION OUTLINE Highlights Fiscal Year March 2014 First Half
FISCAL YEAR MARCH 2014 FIRST HALF FINANCIAL RESULTS New Mazda Axela (Overseas name: New Mazda3) Mazda Motor Corporation October 31, 2013 1 PRESENTATION OUTLINE Highlights Fiscal Year March 2014 First Half
Annual Report on National Accounts for 2015 (Benchmark Year Revision of 2011) Summary (Flow Accounts)
 Summary (Flow Accounts)") Annual Report on National Accounts for 2015 (Benchmark Year Revision of 2011) Summary (Flow Accounts) I. Overview of Benchmark Year Revision of 2011 P 2 II. Expenditure Series P 3 III. Income Series P
Annual Report on National Accounts for 2015 (Benchmark Year Revision of 2011) Summary (Flow Accounts) I. Overview of Benchmark Year Revision of 2011 P 2 II. Expenditure Series P 3 III. Income Series P
PT Astra International Tbk 2011 Full Year Financial Statements
 To: Business Editor For immediate release PT Astra International Tbk 2011 Full Year Financial Statements The following announcement was issued today by the Company s 71%-owned subsidiary, Jardine Cycle